debt structure, private equity reputation, and performance...
TRANSCRIPT
Debt Structure, Private Equity Reputation, and
Performance in Leveraged Buyouts
Chen Liu
September 20, 2013
Abstract
This paper provides a comprehensive study of deal characteristics and participants’
involvement in leveraged buyouts (LBOs) and their impact on target firms’ performance.
Using a sample of 501 U.S. LBOs completed between 1986 and 2011, I find that higher
industry-adjusted changes in return on assets and return on sales are associated with larger
amount of leverage added during the buyout process, tighter LBO loan covenants, and
equity contribution of target firms’ management. LBOs are more likely to exit through an
IPO or a sale if they use more bank debt with tighter covenants and are sponsored by
private equity firms of high reputation. These relations are robust to credit market
conditions and aggregated LBO activities. The evidence suggests that the main source of
value creation in LBOs is the reduced agency costs through the disciplining effect of debt,
closer monitoring by lenders, and the better aligned management incentives. Private equity
firms’ reputation is also important in ensuring successful deal outcomes. My findings also
suggest that the poor performance observed in recent LBOs is a result of less leverage,
fewer bank loans, and less restrictive covenants used in these deals.
Key Words: leveraged buyout, private equity, debt structure, covenants
Queen’s School of Business, Queen’s University, Kingston, Ontario, Canada. K7L3N6. Email:
[email protected]. I am grateful to my supervisor Lynnette Purda for comments that substantially
improved this paper. I also thank Edwin Neave and Wei Wang for helpful comments. I am responsible for all
remaining errors.
- 1 -
1. Introduction
In a leveraged buyout (LBO),1 a company is acquired using a relatively small portion
of equity and a relatively large portion of outside debt financing. Jensen (1989) argued that
the LBO structure of highly leveraged capital structures, active corporate governance,
concentrated ownership stakes, and well-aligned managerial incentives make the LBO form
superior to widely held public corporations. Early empirical work supported the merits of
this structure with papers by Kaplan (1989a) and Smith (1990) finding improvements in
performance for firms undergoing an LBO in the 1980s. However, more recent studies by
Guo, Hotchkiss, Song (2011) and Cohn, Mills, and Towery (2011) find few performance
improvements to target firms of LBOs completed in the 1990s and first half of the 2000s.
Therefore, I am motivated to examine how recent LBO deals differ from the earlier ones
and whether these differences are responsible for smaller performance enhancements in
these later deals. To do this, I seek to identify the primary drivers of LBO success with a
particular focus on leverage, LBO debt structure and terms, and the changing role of banks
and private equity investors in the resulting firms. I also examine whether performance is
related to different credit market and LBO market conditions or premium paid in the
buyout transaction.
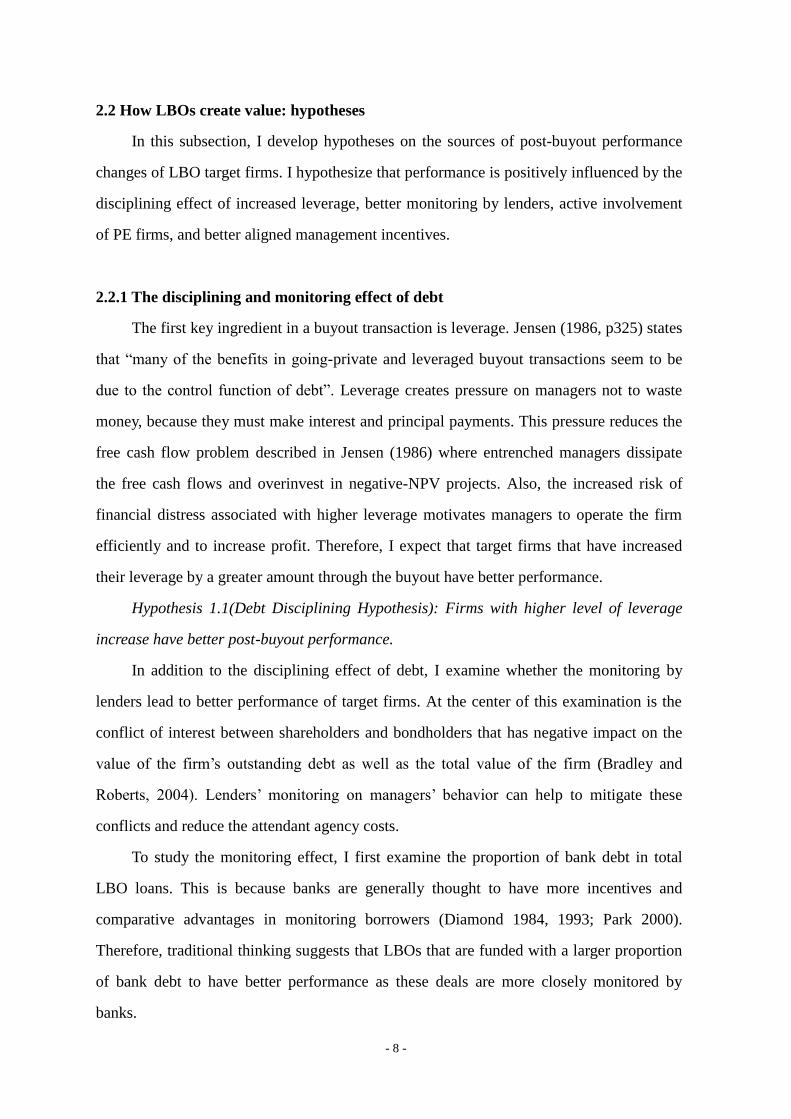
Figure 1 presents the structure of a typical LBO transaction. Equity investors in LBOs
are mainly private equity (PE) firms, management of the target firms, or another
corporation. Financiers of these transactions include banks, institutional investors, and
public debt holders, whereas institutional investors are principally structured investment
vehicles and loan participation mutual funds (Miller 2012). Traditionally, banks were
heavily involved in financing LBO deals. However, the function of banks have changed
significantly as more and more banks move to securitize loans that they previously would
have held (Bord and Santos, 2012). In addition, PE firms have becoming more important in
sponsoring LBO deals and the 2000s has observed an increase in club deal LBOs, where
two or more PE firms conduct a buyout together As a result, I am motivated to begin my
examination of LBO performance drivers by investigating how the structure of these deals 1 A management buyout (MBO) is a form of LBO when incumbent management team takes over the firm. This
paper includes MBOs in the sample and uses the general term “LBO”.
- 2 -
and the participants involved have changed over time.
To undertake this examination, I construct a comprehensive dataset of 501
public-to-private U.S. LBO transactions completed between January 1, 1986 and December
31, 2011 from Capital IQ and the SDC. I require all transactions to have financing details
from LPC’s Dealscan and pre- and post-buyout financial data from Compustat or Capital
IQ, and missing data are filled from SEC filings. This dataset has the following merits. First,
it is to my knowledge the most comprehensive U.S. LBO sample with large number of
deals that have post-buyout data available. As the target firms become private with the
buyout, LBO studies on performance improvement are restricted by data availability. For
example, Kaplan (1989a)’s sample contains 76 management buyouts between 1980 and
1986 and Guo et al. (2011)’s study of LBOs between 1990 and 2006 has 196 observations,
96 of which have post-buyout data available. By hand-collecting financial information of
target firms that have publicly traded debt or subsequently file an IPO, I am able to
construct a larger LBO sample than those used in previous studies. This large sample
allows me to explore the heterogeneity among these LBO deals and generate results with
better statistical properties in the cross-sectional analysis. Second, the sample period covers
the cyclicality of LBOs starting from its first wave of the late 1980s and early 1990s, the
slight recovery and decline in the 1990s, and the most recent boom and bust in the 2000s.
This sample period makes this paper one of the first studies that directly compares how
LBO deal characteristics, performance, and their relation have changed over time.2
Moreover, this paper presents the most up-to-date sample that includes LBOs completed by
December 31st, 2011. This allows me to examine LBOs completed during and after the
2007-08 credit crisis, while most other studies use deals completed before the crisis.
Using this data, I first measure post-buyout operating performance. Following Kaplan
(1989a) and Guo et al. (2011), I calculate the percentage changes in EBITDA and net cash
flows scaled by total assets or sales from the last fiscal year before the LBO to the first
three years after the buyout completion, adjusted by industry medians. I find that
performance change is largely positive for LBOs in the 1980s and 1990s but almost
2 Guo et al. (2011) studies deal characteristics and performance changes by comparing the deal pricing and
financing details calculated in their paper with the results presented in Kaplan and Stein (1993).
- 3 -
insignificant for the deals in the 2000s. For example, during the period of 1986-1993, the
median industry-adjusted percentage increases in net cash flow to sales are significant at
32.7%, 28.2%, and 31.5% in the first three years after the buyout. Between 1994 and 2011,
these increases are still significant, but by a lesser extent at 18.5%, 13.7%, and 29.8%.
However, from 2002 to 2011, only the increase in the first year after the buyout is
significant at 13.3%, while changes in the second and third years become insignificant.
I next examine how LBO deal characteristics have varied over time that may be
responsible for the decreasing performance based on Jensen (1989). I find three important
changes. First, LBOs in the 1990s and 2000s do not borrow as much as the ones in the
1980s. For the deals in the late 1980s, leverage increased by a median of 45% to a
post-buyout debt-to-asset ratio of 74% in the first full year after the buyout completion.
However, the median leverage increase was only 22% and post-buyout leverage was 57%
for deals in the 2000s. Second, there is a structural change in the composition of the LBO
debt. The proportion of bank debt in total LBO debt has decreased from a median of 85%
in the late 1980s to a median of 34% in the 2000s. In the meanwhile, institutional investors
have become more important in the LBO market with institutional loans financing a
median of 63% of total LBO debt in the 2000s. In addition, covenants within the LBO
loans have become less restrictive. Third, PE firms have become more important players in
LBO transactions. The proportion of deals sponsored by PE firms increased from 68% in
the late 1980s to 96% in the second half of the 2000s. In addition, there are more club deals
in recent years, leading to mega LBOs with large transaction values between 2005 and
2007.
Having documented a decline in post-buyout operating performance and a shift in
deal structure and participants, the second part of the paper seeks to identify what aspects
of a deal’s structure and the role of participants are associated with its performance.
Possible drivers of performance that I consider are (1) change in leverage, (2) monitoring
by lenders, (3) involvement of PE firms, and (4) better aligned management incentives. I
control for pre-buyout characteristics of target firms, credit market and LBO market
conditions, LBO loan spread for each deal, and the premium paid for the target firm, and
other deal characteristics in examining these performance drivers.
- 4 -
Regression results show that target firms have better performance when leverage is
increased by a larger amount through the buyout, LBO loan covenants are more restrictive,
and when managers of the target firms contribute equity and participate in the buyout. PE
reputation, however, is not related with changes in operating performance. In addition, I do
not find evidence that links performance to credit market conditions, LBO loan spreads, or
the buyout price. Overall, these results suggest that the main source of value creation is the
reduced agency costs in the post-buyout firms through the discipline effect of debt, closer
monitoring by lenders, and the better aligned management incentives. These results help us
to understand the observed reduced performance enhancement in the more recent LBOs as
they use less leverage and less restrictive loan covenant, which are important drivers for
performance improvement.
Another way to examine LBO success is to look at the outcome of each
deal—whether it goes bankrupt, exits through an IPO or a sale to financial or strategic
buyer. Using an IPO and a sale as indicator of LBO success, I find that LBOs are more
likely to succeed if they use more bank debt and tighter covenants, experience no CEO
change, and are sponsored by highly reputable PE firms. LBOs are more likely to fail if the
buyers are subsidiary of banks that are also financiers of the deals. These results are
consistent with the lenders’ monitoring and PE firms’ reputation as sources of value
creation in LBOs. I also find that LBOs completed during the time when interest rates are
lower than their historical average are less likely to succeed, providing some evidence for
the market timing behavior of LBO buyers that they overinvest in unprofitable deals under
times of favorable credit market conditions.
Contributions of this paper are as follows. First, this is one of the first large sample
LBO studies with a sample period that covers the entire cyclicality of the LBO history.
Second, this paper contributes to the literature on value creation of LBOs by examining the
primary drivers of performance improvement and successful deal outcomes. To the best of
my knowledge, this is the first paper that studies the effects of detailed LBO financing
structure and its contractual features, and PE reputation on post-buyout operation
performance. Results of this paper will further our understanding of when and how an LBO
may be successfully employed to improve firm performance. By doing so, it facilitates our
- 5 -
understanding as to why recent LBOs seem to be less successful than previous transactions.
Third, this paper contributes to the literature of private equity reputation by being one
of the first studies that investigate how PE reputation affects performance. The finding that,
controlling for target and deal characteristics, PE reputation is not related to operating
performance in the first three years after the buyout but is important in ensuring successful
deal outcomes provides some indirect evidence that PE firms create value through later
stage of LBOs. Findings of this paper will motivate future studies in investigating when
and how PE firms create value in LBOs.
Forth, this paper contributes to the literature on debt structure and debt contracting in
the setting of LBOs. This paper finds that loan covenants are important drivers of operating
performance and instrumental to ensure successful outcomes. This result has important
implications for practitioners as well as policy makers that they should focus on covenant
to reduce risks and to improve performance of target firms. The proportion of bank debt is
also important for LBOs to exit through an IPO or a sale, suggesting that composition of
LBO debt needs to be carefully structured.
The rest of the paper proceeds as follows. Section 2 reviews related literature and
develops hypotheses. Section 3 describes the sample and provides evidence on post-buyout
operating performance. Section 4 presents the changing characteristics and participants of
LBO deals over time. Section 5 examines the drivers of post-buyout performance. Section
6 conducts robustness analyses. Section 7 concludes.
2. Literature review and hypotheses
2.1 Measuring value creation in LBOs
Previous studies have examined value creation in LBOs in two ways: returns to
LBO investors and post-buyout performance improvement in LBO target firms. In the first
approach, value creation is measured as the returns to invested debt and equity capital from
the time of buyout to a subsequent IPO, sale of the firm, or bankruptcy. Studies on LBO
deal level returns suggest significant value creation through LBOs as evidenced by positive
returns to investors. For example, Kaplan (1989a) estimates a median market-adjusted
- 6 -
return of 28% (mean 42%) for investors in 25 MBOs in the 1980s that went public after an
average of 2.7 years. Also, Guo et al. (2011) finds a median market- and risk-adjusted
return to pre-buyout capital of 68.7% (mean 94.7%) for a sample of 70 LBOs completed
from 1990 to 2006.
On the LBO fund level, literature provides mixed evidence. Kaplan and Schoar (2005)
investigate returns for 160 LBO funds between 1980 and 2001 and find that the median
fund underperformed stock market index, generating only 80% of the return on the S&P
500. Higson and Stucke (2012) find that the buyout funds in their sample have significantly
outperformed the S&P 500, with funds liquidated in the period 1980-2000 generating
excess returns of on average 4.5% per year. The different results of these two studies are
mainly due to sample selections as both studies find large heterogeneity in returns across
funds. Higson and Stucke (2012) find just over 60% of the funds in their sample
outperform the S&P500 and Kaplan and Schoar (2005) show that for the subset of funds
that have been around for at least five years, the median performance exceeds the S&P500
by 50% (mean 80%). They also show that this performance is persistent and suggest that
different LBO sponsors may have different skills in managing their portfolio companies.
The heterogeneity in fund returns and performance persistence motivate me to examine
characteristics of PE firms to determine whether and how they are associated with the
performance of target firms.
The second way to examine value creation in LBOs is to focus on the post-buyout
operating performance of target firms.3 Kaplan (1989a) studies 48 management buyouts
from 1980 to 1986 and finds that industry-adjusted ratios of EBITDA to sales increased by
21.3%, cash flow to sales increased by 28.3%, and capital expenditure to sales decreased
by 25.6% during a three-year period following the buyout. Smith (1990) reports a
significant increase in operating cash flow per employee and per dollar of operating assets
from the year prior to the buyout to one year post-buyout for 58 MBOs between 1977 and
1986. Lichtenberg and Siegel (1990) study 193 LBOs between 1981 and 1986 with a total
of 1,132 plants and show that plant total factor productivity increases more than the
3 Some studies, for example Guo et al. (2011), use changes in operating perofrmance as an explanation for
returns to investors.
- 7 -
industry average in the years following a buyout. In contrast to the significant performance
enhancement documented in the early studies, using this approach, the evidence of
performance improvement is weaker for more recent LBOs. Guo et al. (2011) find a
median of only 2.25% industry-adjusted increase in operating margins and a 12.54%
decrease in cash flow margins for 94 LBOs completed between 1990 and 2006. Cohn et al.
(2011) also find little evidence of performance enhancement using corporate tax return data
for 317 LBOs from 1995 to 2007.
This paper follows the second approach and examines post-buyout operating
performance for the following reasons. First, this paper defines value creation as the real
effects of buyouts, such as increased efficiency and reduced costs, rather than purely
financial returns.4 For this purpose, operating performance is a cleaner measure of value
creation compared with the returns to investors. This is because returns to investors do not
necessarily reflect the real value creation as they are usually calculated upon the exit of the
deal, therefore depending on market conditions and investors’ market timing ability.
Second, one of the goals of this paper is to construct a comprehensive and up-to-date LBO
database that includes deals completed during and after the 2007-09 credit crunch. Most of
these deals have not reached their outcome yet so no returns to investors are available for
these deals. However, I can still examine the value creation and its drivers through
operating performance change. One problem with measuring performance using cash flow
variables from target firms’ financial statements, as mentioned in Cumming, Siegel, and
Wright (2007), is that they are in general subject to managerial manipulation. However, as
all the performance ratios in the paper are industry-adjusted, and assuming all firms in the
same industry are subject to managerial manipulation in the similar ways, I expect the
effect from manipulation to be small although the incentives for LBOs to show improved
performance are probably greater than the average firms.
4 According to KKR founder Henry Kravis, private equity firms create value in LBOs over the long-term as
managers, not merely as financial engineers. Kravis said that “We only make money because we improve the
operations of the newly acquired company”. Source: “Merger Talk - LBO firms rush to exits with quick flips.”
Reuters News, December 30, 2004.
- 8 -
2.2 How LBOs create value: hypotheses
In this subsection, I develop hypotheses on the sources of post-buyout performance
changes of LBO target firms. I hypothesize that performance is positively influenced by the
disciplining effect of increased leverage, better monitoring by lenders, active involvement
of PE firms, and better aligned management incentives.
2.2.1 The disciplining and monitoring effect of debt
The first key ingredient in a buyout transaction is leverage. Jensen (1986, p325) states
that “many of the benefits in going-private and leveraged buyout transactions seem to be
due to the control function of debt”. Leverage creates pressure on managers not to waste
money, because they must make interest and principal payments. This pressure reduces the
free cash flow problem described in Jensen (1986) where entrenched managers dissipate
the free cash flows and overinvest in negative-NPV projects. Also, the increased risk of
financial distress associated with higher leverage motivates managers to operate the firm
efficiently and to increase profit. Therefore, I expect that target firms that have increased
their leverage by a greater amount through the buyout have better performance.
Hypothesis 1.1(Debt Disciplining Hypothesis): Firms with higher level of leverage
increase have better post-buyout performance.
In addition to the disciplining effect of debt, I examine whether the monitoring by
lenders lead to better performance of target firms. At the center of this examination is the
conflict of interest between shareholders and bondholders that has negative impact on the
value of the firm’s outstanding debt as well as the total value of the firm (Bradley and
Roberts, 2004). Lenders’ monitoring on managers’ behavior can help to mitigate these
conflicts and reduce the attendant agency costs.
To study the monitoring effect, I first examine the proportion of bank debt in total
LBO loans. This is because banks are generally thought to have more incentives and
comparative advantages in monitoring borrowers (Diamond 1984, 1993; Park 2000).
Therefore, traditional thinking suggests that LBOs that are funded with a larger proportion
of bank debt to have better performance as these deals are more closely monitored by
banks.

- 9 -
Another way to examine the monitoring effect is through the investigation of LBO
loan covenants. Chava and Roberts (2008) suggest that covenants increase firm value in
two ways. First, covenants that monitor and control managers’ behavior mitigate the
reduction in firm value from the conflicts of interest between shareholders and debtholders
and managers acting on behalf of shareholders to expropriate bondholders’ wealth.
Specifically, covenants can restrict borrowers’ use of cash flows and require them to repay
with proceeds of excess cash flow, asset sale, or debt and equity issuance. Based on Miller
(2012), in a typical syndicated loan contract, 100% of net proceeds from asset sales and
debt issuance and 50% to 75% of excess cash flow are required to prepay the loans. These
requirements mitigate the free cash flow problems described in Jensen (1986). In addition,
covenants specify the maximum level of different categories of debt to be used by the
borrowing firms, therefore reducing the risk of post-buyout financial distress. Second,
covenants define the circumstances under which creditors are permitted to intervene in
management. This threat of transfer of control rights from borrowers to creditors serves as
a discipline mechanism for managers. In particular, covenants enforce minimum financial
performance measures against the borrowers, therefore motivating managers of the LBO
target firms to increase revenue.
Besides covenants, the maturity structures of LBO loans are also important. When
LBOs are financed with short-term loans, the incentive effects of debt described by Jensen
(1986) tend to be stronger. In particular, a shorter maturity increases required debt service
payments, thus increasing the incentives for mangers to work harder to generate cash and
avoid wasting resources in the earlier stages of the LBOs. In combination, these LBO loan
characteristics form Hypothesis 1.2.
Hypothesis 1.2 (Lenders’ Monitoring Hypothesis): LBOs with more bank loans,
tighter loan covenants, and shorter loan maturity are associated with better post-buyout
performance.
2.2.2 Private equity involvement
Another possible source of value creation in LBOs may be the involvement of PE
firms. As equity investors in LBOs, PE firms are incentivized to actively engage in the

- 10 -
target firms’ management. Also, general partners (GPs) of PE funds are paid a management
fee of 2% on the fund’s capital and receive a carried interest of 20% of the profits above a
certain benchmark realized by the fund. Therefore, GPs have incentives to closely monitor
their portfolio firms. As described by KKR’s founder Henry Kravis, PE firms “generally
aren’t board members who show up once a month... Most of us in the industry live with
these companies on a day-to-day basis”.5
However, it is hard to directly observe PE firms’ involvement in management, as
target firms become private after the buyouts and therefore not required to disclose
corporate governance information.6 As a result, I use PE firms’ reputation as a proxy for
their experience and skills to manage the target firms, where reputation of each PE firm is
calculated as its years of experience or its market share based on all buyout deals it
sponsored in history or in the past 36 months. The idea to use PE firms’ past experience as
a proxy for their current skills is based on Kaplan and Schoar (2005)’s finding of
performance persistence of PE funds. Specifically, they find that performance of PE funds
persists over time and that larger and older funds perform better than the new ones. The
observed performance persistence can be attributed to PE firms’ experience and skills in
selecting, restructuring, and monitoring target firms. Better-performing PE firms gain
experience through their experiential learning from previous deals and PEs with lower
returns cannot get funds from investors and fail to exist. In addition, Axelson, Stromberg,
and Weisbach (2009) argue that highly reputable PE firms are less susceptible to risk
shifting as they have incentives to pursue relatively more conservative investment
strategies in order to maintain their reputation. Therefore, using PE firms’ reputations as an
indicator of their ability and skills, I hypothesize that LBOs sponsored by highly reputable
PE firms perform better.
Hypothesis 2.1 (Private Equity Reputation Hypothesis): LBO deals sponsored by PE
5 Source: “Merger Talk - LBO firms rush to exits with quick flips.” Reuters News, December 30, 2004.
6 Some studies look at the board composition of target firms using the Dash dataset that’s only available for
U.K. firms. For example, Cornelli and Karakas (2011) examine the board structure for 88 U.K. LBOs from
1998 to 2003 and find significant changes in board size and composition when a firm goes private. Board size
generally decreases and the presence of outside directors is drastically reduced, as they are replaced by
individuals employed by the LBO sponsors.

- 11 -
firms of high reputation experience higher performance improvement.
A recent trend in LBOs is club deals, where two or more PE firms pool their assets to
acquire target firms and manage them collectively. Club deals can be beneficial as each PE
firm may bring different expertise to target firms. For example, when KKR teamed up with
Bain Capital and Vornado Realty Trust to acquire Toys "R" Us, the New York Times stated
that “it was clear what each firm brought to the table. Kohlberg Kravis has a good
reputation in the retail business, Bain has a good record doing turnarounds, and Vornado
clearly knows real estate”.7 However, as the number of PE firms in the club gets larger, it
is harder to make timely operational and management decisions. For example, Jeffrey
Walker, a managing partner of CCMP Capital, argued that it was difficult to manage an
LBO that has more than two or three investors.8 Also, based on the experience of the
venture capital industry, which is closely similar to the private equity industry, the ideal
size of the consortium is two PE firms. To sum up, anecdotal evidence suggests that club
deals may improve performance through each PE firm offering valuable management
advice. However, as the size of the club gets larger, this benefit may decrease.
Hypothesis 2.2: Club Deals perform better than LBOs sponsored by a single PE firm.
However, this advantage tends to decrease as the number of PE firms participating in a
deal gets larger.
Recent studies in LBOs have investigated the relationship between banks and PE
firms and how it affects returns to PE investors at the exit of LBOs. Fang, Ivashina, and
Lerner (2012) find that LBOs sponsored by PE firms that are subsidiaries of banks (the
bank-affiliated deals) exhibit worse equity returns if the deal is completed during the peaks
of the credit market. Ivashina and Kovner (2012) find that bank relationship formed
through repeated interactions between banks and PE firms lead to more favorable loan
terms and higher equity return to the PE firms. Empirical results on the effect of banking
relation on returns to PE firms are mixed, depending on the nature of the relation and the
motivation behind it. I follow Fang et al. (2012) and examine bank-affiliated deals, as there
may be some distinct features of these deals. First, as banks are in general less willing to
7 Source: “Do Too Many Cooks Spoil the Takeover Deal”, the New York Times, April 3, 2005 8 Source: “Buyout Veterans Have Questions about Club Deals”, Dow Jones Newswires, January 24, 2007.

- 12 -
take risks than other investors, I expect that bank-affiliated PEs choose to sponsor deals
with lower risks, therefore generating lower returns. Second, bank-affiliated deals provide
parent banks with cross-selling opportunities (such as potential M&A advisory work,
cash-management services, etc.) that increase their fee income. As a result, buyout
decisions may not be based on PE’s expectation on efficiency improvement of target firms,
but only to take advantage of these cross-selling opportunities.
Hypothesis 2.3: Bank-affiliated LBOs perform worse than stand-alone deals.
2.2.3 Management participation
When incumbent managers of target firms participate in a buyout, they become the
equity investors and their incentives are well-aligned with other shareholders. As a result,
agency costs are minimized.
Hypothesis 3.1 (Management Participation Hypothesis): Management-participated
LBOs tend to have better performance due to better-aligned management incentives that
reduce agency costs.
Some studies look at management turnover and consider it as a way to measure PE
firms’ control over target firms. Gong and Wu (2011) find that 51% of incumbent CEOs are
replaced within two years of the LBO announcement. Acharya and Kohoe (2008) find that
for U.K. LBOs, one third of the CEOs are replaced within the first 100 days and two-thirds
are replaced over a four-year period. However, management turnover can be a noisy
measure. First, it may not be clear that the management change is due to PE firms unless it
is explicitly indicated in the proxy statement. Second, even it is confirmed that PE firms
replace the CEO or CFO, management change may not necessarily indicate increased
control from the PE firms. On the one hand, management turnover can be consistent with
replacing bad managers by the good ones. On the other hand, the same managers running
the company before and after the buyout may indicate low pre-buyout agency problem and
therefore there is no need to replace managers. As a result, I expect the effect of
management turnover on performance to be ambiguous.
Hypothesis 3.2 (Management Turnover Hypothesis): The effect of management
change on performance is ambiguous.
- 13 -
3. Data and post-buyout performance
3.1. The Buyout Sample
LBO sample of this paper is constructed from the Standard and Poor’s Capital IQ and
the Securities Data Company’s (SDC) U.S. Mergers and Acquisitions Database. I manually
combine LBO deals from the above two sources and eliminate duplicate observations.
Compared with the SDC dataset, Capital IQ has an advantage as it allows me to link the
LBO transaction details to target firms’ financials and information on LBO buyers (private
equity firms, management teams, or another corporation). However, one possible problem
with Capital IQ is its limited coverage of earlier deals. Stromberg (2008) compares the
1980s’ LBOs from Capital IQ and other data sources and estimates that Capital IQ covers
between 70% and 85% of the LBO sample for this period. As one of the goals of this paper
is to compare deal characteristics of LBOs during the period of 1986 to 2011, I also collect
LBO transactions from SDC which has better coverage of deals in the late 1980s and early
1990s.
Each LBO transaction in my sample meets the following criteria: (1) the transaction
is flagged as an LBO, MBO, or secondary LBO and completed between January 1, 19869
and December 31, 2011; (2) the target is a publicly traded U.S. company; and (3) the
transaction value is $10 million or larger. The minimum deal value of $10 million is lower
than that in some other studies, such as Kaplan (1989a) and Guo et al. (2011). It is chosen
to avoid biasing against earlier time periods when small deals were more common. This
initial screening yields a total of 1,586 LBO transactions. To reconstruct the financial
structure of each deal accurately, I require that all transactions have financing details
available from Reuter’s LPC Dealscan loan database.10 I match the Dealscan data with the
buyout sample by borrower names and time of the transactions. I then reconstruct the
financial structure for each deal using the tranche level data of LBO loans from Dealscan
and the mezzanine debt from Capital IQ. This reduces the sample to 885 observations. In
9 My sample starts from 1986 because the loan information from Dealscan starts from 1986. 10 Restructuring LBO deals across databases requires matching by names of target firms. Target firms mostly
appear under their old names in SDC, Dealscan, and Compustat, while Capital IQ uses only the most recent
names. I keep track of all name changes using a text search in Company Tearsheet of CapitalIQ. I also use the
Wall Street Journal for name changes if the Tearsheet is ambiguous.

- 14 -
addition, I require that all target firms have pre- and post- buyout financial information
from COMPUSTAT or Capital IQ,11 and missing data are filled from SEC filings. This
drops 384 transactions, the majority of which are the buyouts in the 1980s, as Capital IQ
mainly provides financial statement information for the 1990s and the 2000s. My final
sample consists of 501 LBO transactions.
Figure 2 presents the total number of LBO deals (left y-axis, solid line) and the
inflation-adjusted12 total transaction values (right y-axis, bar) by LBO effective year.13
The first LBO boom occurred in the late 1980s, with a total transaction value increasing
from $24 billion in 1987 to a peak of $81 billion in 1989. The largest deal during the time
was KKR’s buyout of RJR Nabisco in 1989 with a transaction value of $39 billion. This
first wave of LBOs ended with the recession in 1990-1991 when the high yield bond
market collapsed. The buyout market started to resume in 1996 but crashed with the
bursting of the tech bubble in 2001. In the mid-2000s, LBOs reappeared in a third buyout
boom. Total transaction value increased sharply from $5.4 billion in 2002 to $65 billion in
2005 and reached a historical high of $273 billion in 2007. The years 2006 and 2007
observed the surge of the mega-buyouts, including the acquisitions of TXU ($42 billion,
later renamed as “Energy Future Holdings Corp”), HCA Holdings, Inc ($33 billion), Kinder
Morgan ($28 billion), and First Data ($27 billion).
Table 1 breaks down the sample by industry grouping based on SIC codes. Target
firms are from eight broad industries but are concentrated in the manufacturing sector with
approximately 44.5% of the sample coming from this sector. Firms in the service industry
and the wholesale and retail industry are the next biggest grouping. In the late 1980s and
early 1990s, almost 50% of the buyout transactions were from the manufacturing sector.
Since the year 1997, relatively more firms come from the service and the wholesale/retail
industries. Overall, the sample shows an increased industry scope for LBOs over time.
11 Capital IQ provides financials for private companies that belong to one of the following categories: (1).
Private companies with publicly traded debt, (2). M.A. targets filing financials in 8-K/A SEC forms; (3). D&B
Financials; (4). U.S. bank subsidiaries filing with various regulatory bodies in the U.S., such as FFIEC, CUA,
OTS. My sample contains samples of cases (1) and (2). 12 In the rest of the paper, unless specified, all values are inflation adjusted with 2005 as the base year. 13 LBO effective year is the year an LBO is complete. This is shown as the deal closed date or effective date in
Capital IQ and SDC.

- 15 -
I next examine how buyout price have varied over time. Following Kaplan and Stein
(1993), I measure the buyout price, referred to as “total capital”, as the sum of the market
value paid for the target firm’s equity, the value of the firm’s outstanding debt, and the fees
paid in the transaction, minus any cash removed from the firm to finance the buyout.
Column (1) of Table 2 presents the sample medians of total capital by LBO effective year.
For the full sample of 501 transactions, the median buyout price is $ 620.97 million. There
is a trend towards larger deals in later years, significant at 1% level based on the
nonparametric trend test. The median capital for LBOs in the 1990s is $382 million. It
increased to $1,956 million in 2007 due to the mega club deals and reached $2,223 million
in 2011 after the LBO markets recovered from the crisis.
I describe the buyout price relative to fundamentals using two primary measures of
cash flows: EBITDA and the net cash flow (NCF) in the last full year prior to the buyout
completion, where NCF is calculated as EBITDA minus capital expenditures. Columns (2)
and (3) present the median ratios of EBITDA and NCF to total capital by LBO effective
year. The nonparametric trend test shows that both ratios have been decreasing significantly
at 5% level, suggesting a trend of increased buyout price over time.
The decline in buyout cash flow to price ratios may not necessarily reflect anything
unique to the buyout market. To control for overall market trends and macroeconomic
factors, I follow Kaplan and Stein (1993) and calculate the market-adjusted measures that
subtract the earnings to price ratio of the S&P 50014 from the buyout ratios of EBITDA
and NCF to total capital for the quarter in which the deal was priced. Columns (4) and (5)
show that market-adjusted measures still exhibit a significant downward trend, indicating
an increase in buyout prices relative to fundamentals over time.
Another way to look at the extent of a buyout-specific trend in prices is to examine
the premium paid in the buyout transactions, calculated as the percentage difference
between the price paid for a firm’s equity and the firm’s stock price 1 month before the first
announcement of buyout.15 Column (7) presents the annual median premiums paid to
14 The S&P 500 earnings data are downloaded from the S&P Index Data Platforms. 15 I also calculate the premium using stock 1 day and 1 week before the buyout announcement, the results are
robust.

- 16 -
shareholders. The median premiums show no significant time trend over the entire sample
periods. The difference between the trend of buyout premium and that of market-adjusted
ratios of buyout price to fundamentals may be due to the missing data in calculating buyout
premium, as some of the stock prices are missing for the sample firms. As a result, the rest
of this paper will use price relative to fundamentals instead of buyout premiums.
3.2. Evidence on post-buyout operating cash flows
In this subsection, I calculate measures of post-buyout operating performance and
examine how they have changed over time.
3.2.1 Methodology
To document the post-buyout operating performance, I use the operating income as
measured by EBITDA and net cash flow (NCF). Operating income measures the cash
generated from buyout firms’ operations before depreciation, interest, or taxes, and the
calculations do not include gains or losses from sales of divisions or assets. NCF is the
primary component of the numerator in a net present value analysis to value a buyout
company. A permanent increase in NCF, therefore, should lead to an increase in value.
EBITDA and NCF are scaled by sales and average assets for each fiscal year. Performance
change is calculated as the percentage changes of these cash flow measures in the first three
full years after the year of LBO completion (year +1, +2, and +3) compared to the last
fiscal year before the buyout completion (year -1).
In order to evaluate the economic and statistical significance of pre- to post-buyout
changes in performance, I follow Kaplan (1989a) and Guo et al. (2011) and calculate the
industry-adjusted performance measures. The industry-adjusted change equals the
percentage change in the cash flow variables for the target firms minus the median
percentage change over the relevant period for all Compustat firms in the same industry.
Firms in the same industry as the target firms are those that have the same four-digit SIC
code. Comparisons are made at the three-digit level and then at the two-digit level if fewer
than five industry matches are found.

- 17 -
3.2.2. Evidence on changes in operating performance
Table 3 summarizes the medians of unadjusted and market-adjusted percentage
changes in operating performance for the last full year prior to completion of the buyout
year (year -2 to year -1) and from year -1 to up to 3 years after the buyout completion.
Panel A shows the median changes over the entire sample period and Panel B presents the
medians in each LBO wave and their time trend. As shown in Panel A, industry-adjusted
percentage increases in EBITDA to sales are significant at 7.0%, 6.9%, and 8.9% in years
+1, +2, and +3 relative to year -1. Changes in NCF to sales adjusted by industry medians
are also positive and significant, with medians of 18.5%, 13.9%, and 19.6% in years +1, +2,
and +3.
In contrast to the increased cash flow variables that are scaled by sales, there are 12.2%
and 9.8% significant decreases in EBITDA over average assets in year +1 and +2 relative
to year -1. The median changes become insignificant in year +3. The significant decrease in
the first year after buyout can be explained by the fact that most LBO firms write up the
book value of their inventories at the time of the buyout (Kaplan, 1989b). According to
Kaplan (1989b), this “paper” inventory write-up is expensed in the first full year after the
buyout. As a result, cost of goods sold is artificially high and the measured change in
operating income as a ratio of average assets during the period underestimates the true
change. Also, as argued by Kaplan (1989b), for most of the buyouts, buyout accounting
leads to a change (usually an increase) in the book value of the assets, representing the
difference between the market value of equity and the book value. This may also lead to an
underestimates of operating improvement or an overestimate of performance declining.
The industry-adjusted changes in the net cash flow as a proportion of average assets
decreased by 5.7% in the first year after the buyout (significant at 10%), the median
changes then become insignificant in year +2 and +3. Overall, the evidence in operating
performance for the whole sample period suggests industry-adjusted performance
improvement after the buyouts.
According to Kaplan (1989a) who finds a significant increase in operating
performance for the management buyout in the 1980s and Guo et al. (2011) that documents
little performance improvement for LBOs in the 1990s and early 2000s, there may be a

- 18 -
fundamental change in the performance of LBOs during the sample periods. Therefore, I
divide the sample period into three sub-periods, 1986-1993, 1994-2001, and 2002-2011,
based on the cyclicality of the LBO market presented by Figure 2. Panel B of Table 3
shows the median changes of performance in each sub-period and the time trend. The
nonparametric trend test results show that there is less performance improvement in the
more recent deals for all four measures. For example, during the period of 1986-1993, the
industry-adjusted percentage increases in NCF to sales are significant at 32.7%, 28.2%, and
31.5% in the first three years after the buyout. The increases between 1994 and 2011 are
still significant, but by a lesser extent at 18.5%, 13.7%, and 29.8%. From 2002 to 2011, only
the increase in the first year after buyout is significant at 13.3% and the changes in years +2
and +3 are insignificant.
To conclude, results in this section show some evidence of performance improvement
after the buyout. However, this is mainly driven by LBOs in the early years, as there is a
significant trend of decreased post-buyout performance improvement in the more recent
deals.
4. LBO deal characteristics and participants involvement
Having documented a decreasing trend of improvements to operating performance,
this section studies factors that are expected to be important drivers for performance based
on the debt disciplining, lenders’ monitoring, private equity reputation, and management
participation hypotheses developed in section 2.2. Specifically, I focus on the pre- and
post-buyout leverage and its change, the composition of LBO debt and its contractual
features, the reputation and bank affiliation of private equity firms, and the trend in club
deals.
4.1. Leverage, debt structure, and contractual features
The debt disciplining hypothesis and the lenders’ monitoring hypothesis state that
firms that have larger amount of leverage added during the LBOs and are more closely
monitored by lenders will experience more improvement to operating performance. Having

- 19 -
documented a decreasing trend of performance improvement, I now examine whether and
how leverage, bank debt proportion, loan covenants and maturity structure have changed
over time.
4.1.1. Leverage
Panel A of Table 4 reports the capital structure change from the buyout. Columns
(1)-(3) show the sample median of the pre- and post-buyout leverage and leverage changes,
calculated using the financial data from Compustat and Capital IQ. Prior to the buyout,
firms have a median leverage ratio of 31.92%. Leverage increased significantly to a sample
median of 64.35% after buyout, with a median percentage increase in leverage of 30.55%.
Column (4) shows the median leverage change of all Compustat firms. Comparing the
LBO sample and the Compustat population, I find that the leverage increase is unique to
LBO firms. Over time, both the leverage change and the post-buyout leverage ratio have
been decreasing. Column (5) shows that equity ratio has a significant increasing trend over
time. The decreasing trend of leverage change, in combination with the declined
post-buyout performance, provides some preliminary evidence for the debt disciplining
hypothesis.
4.1.2. LBO debt structure
I next study the composition of LBO debt and its contractual features, using tranche
(or “facility”) level data constructed from Dealscan and Capital IQ. LBO debt is syndicated
through different tranche. According to Miller (2012), revolving credit facility and
amortizing term loan (term A loan, or TLa) are usually packaged together and syndicated to
banks.16 The term B, C, and D loans are structured specifically for institutional investors,
such as structured investment vehicles, loan participation mutual funds, hedge funds,
pension funds, insurance companies, and other proprietary investors (Miller, 2012).
Therefore, I consider the revolving credit facility and the term A loan tranche in a loan
package as bank debt and term B, C, and D loans as institutional debt. I also consider notes
16 A revolving credit facility allows borrowers to draw down, repay, and re-borrow capital over time. A term
loan is an installment loan that requires a complete withdrawal of funds at inception.
- 20 -
that are sold to institutional investors as institutional debt. The bridge loan tranche from
Dealscan and the mezzanine debt from Capital IQ that are subordinated to bank and
institutional debt are considered the junior debt.17
Panel B of Table 4 presents the structure of LBO debt over the years. For each
category of debt, I calculate the ratio of the amount of debt to total LBO debt and the
percentage of LBO deals that use this type of debt. Columns (1) and (2) demonstrate the
use of revolving credit facilities and term A loans in financing LBO debt. The ratio of
revolving credit facilities to total LBO debt has decreased over time, from 61% in 1986 to
13.7% in 2011. The ratio of term A loans to total LBO debt has also declined, from its peak
of 76.9% in 1993 to 1.2% in 2011. Although most LBOs continue to use revolving credit
facilities, the proportion of LBOs that use A-term loans significantly declined from 47.1%
in 1993 to 5.7% in 2011. As a result, the ratio of bank debt to total LBO debt and the
percentage of LBO deals that use bank debt have decreased significantly, as shown in
Column (3). All of these time trends are consistent with the declining importance of banks
in financing LBO deals. With the decrease of bank debt, there has been an increasing use of
institutional debt, as presented in Column (4). The proportion of institutional debt has
increased from 1.2% in 1989 to 58.4% in 2011 and the nonparametric trend test shows a
significant increase in the proportion at 1% level. Since 1998, the proportion of institutional
debt in total LBO debt has exceeded that of bank debt, suggesting that institutional
investors have become more important in the LBO market.
The last column of Panel A demonstrates the use of junior debt. The use of junior debt
is mainly concentrated in the late 1980s and the 2000s. The large proportion of junior debt
in the total LBO debt in the late 1980s corresponded to the use of high yield junk bond
whereas since 2002 the use of mezzanine debt in LBO financing has increased
dramatically.
In summary, analysis of this subsection shows that the importance of banks as
financiers of LBO transactions has been decreasing and that institution debt has become
17 I follow Shivdasani and Wang (2011) and record bridge loans as high-yield bond/note and mezzanine finance.
Mezzanine debt is a committed financing with individually negotiated terms. All or part of the interest expense
of the mezzanine debt is often in the form of additional securities rather than cash. Investors of the mezzanine
debt are typically insurance companies and the mezzanine funds.
- 21 -
more important in financing LBOs. These trends may provide some explanations for the
decreasing performance of post-buyout firms as bank monitoring has been considered as
instrumental in reducing agency costs of debt and therefore creating value in LBOs
(Diamond 1984, 1993; Park 2000). This relation will be tested in the multivariate analysis
in the next section.
4.1.3. LBO loan spread, maturity, and covenants
I next examine the spread, maturity, and covenants of bank debt verses institutional
debt. Columns (1)-(3) of Table 4 Panel C present medians of the all-in-drawn interest
spread of bank debt, institutional debt, and their differences. All-in-drawn spreads (over
6-month London Interbank Offered Rate (LIBOR) for each tranche are from Dealscan and
include both the interest cost and fees associated with borrowing. Column (1) shows a
significant increasing trend over time for spreads of bank debt. Institutional debt spreads
are higher than bank debt spreads but the institutional-bank difference reported in Column
(3) narrows with the increased usage of institutional debt in LBO financing. This is
consistent with Miller’s (2012) argument that the spread difference between institutional
loans and bank loans narrows when the institutional demand for syndicated loans is high.
I expect that the maturity structure of LBO loans is related to performance as shorter
maturity increase required debt service payment in the earlier stage of the LBOs and
therefore increasing the incentives for managers to work hard to generate cash and to avoid
wasting resources. Columns (4)-(6) show the median maturity (in months). There is no
significant change in the maturity of bank debt. However, the maturity of institutional debt
has decreased throughout the sample period, from 120 months in 1992 to 79 months in
2011, suggesting better monitoring of institutional investors in the more recent LBOs.
I also examine the covenants of LBO debt as they provide specific requirements and
restrictions on management behavior that reduce the agency costs associated with the
conflict of interests between shareholders and debt holders. Covenant information is
obtained from Dealscan. To measure the tightness of covenant restrictions, I use the
covenant intensity index developed by Bradley and Roberts (2004). This index indicates
whether each loan package contains the following six specific covenants—asset sale sweep,
- 22 -
debt issuance sweep, equity issuance sweep, financial covenant, dividend covenant, and
secured debt covenant—and counts the number these covenants in each package. The first
three covenants, also referred to as the “sweeps”, specify the percentage of net proceeds
from an asset sale, debt issuance, or equity issuance that the borrowers must use to pay
down any outstanding debt. Financial covenant enforces minimum financial performance
measures that the borrowers must maintain. Bradley and Roberts (2004) define a binary
variable that is equal to 1 if the loan contract contains more than two restrictions on
financial ratios and zero otherwise. Dividend covenant restricts the ability of the borrowers
to distribute cash to shareholders and secured debt covenant requires the debt to be secured.
The covenant intensity index counts the number of covenants included in each loan
package and the index ranges from 0 through 6. Covenants are unique to packages, so that
every tranche in a package is covered by all of the covenants. If an LBO uses multiple loan
packages, I use the index of the most covenant-heavy package as the covenant index of the
deal. Column (7) presents the median covenant intensity index each year for loans with
non-missing covenant information. The number in the bracket shows the proportion of
LBOs with non-missing loan covenant information of total LBOs each year. As information
on covenants is fairly limited prior to 1994, loans syndicated before 1994 only have
secured debt covenant reported. During the period of 1995-2011, LBO loans have a median
of 5 covenants based on the measure of Bradley and Roberts (2004) and there is a
significant decrease in covenant tightness. In 2002, the median number of covenants was 6;
however, the number dropped to 1 for LBO loans syndicated in the late 2000s.
The Bradley and Roberts (2004)’s index only considers the presence of financial
covenants. It does not take into account the number or different types of financial
covenants used in a debt contract. However, there is large variation in the use of financial
covenants in my sample and the number of financial covenants included in the LBO loan
packages ranges from 0 through 6. Therefore, I modify the index by including the number
of financial covenants used in each package. Specifically, the modified covenant intensity
index is the sum of (1) number of financial covenants (up to 6), (2) number of sweeps
(asset sales sweep, debt issue sweep, equity issue sweep, excess cash flow sweep, insurance
- 23 -
proceeds sweep18), (3) dividend covenant (0/1 variable), and (4) secured debt covenant (0/1
variable).19 The modified index is presented by Column (8). LBO loans constructed
between 1998 and 2002 used more covenants, with a median of 8-10 covenants. The
number of covenants decreased in the second half of the 2000s with only 1 or 2 covenants
for LBO loans in 2010 and 2011.
Column (9) shows the proportion of LBO loans with no financial maintenance
covenants (the covenant-lite loans).20 There is a general trend towards more covenant-lite
loans over time. In summary, results from Columns (7)-(9) show declining tightness of
covenant restrictions of LBO loans, suggesting weaker monitoring by lenders that may lead
to worse post-buyout performance.
4.2. Private Equity in LBOs
4.2.1 Private Equity Involvement
The private equity reputation hypothesis on LBO value creation states that LBOs
sponsored by PE firms of high reputation tend to perform better as these PEs have better
skills to improve performance and to reduce risks of target firms (Kaplan and Schoar, 2005;
Axelson, et al., 2009). Therefore, I examine the changing characteristics of PE firms that
are expected to be instrumental to LBO success. To identify PE firms, I download all
private equity funds (PE funds) from Capital IQ. For each LBO transaction that is collected
from Capital IQ, I merge the buyer Excel Company ID of the LBO to the PE funds Excel
Company ID. For the buyout sample from SDC, I run a text search for the names of PE
firms in the transaction synopses and hand match with the PE funds from Capital IQ. As
18 The excess cash flow sweep and the insurance proceeds sweep specify the percentage amount of net proceeds
a borrower receive from excess cash flows or insurance settlements that must be used to pay down any
outstanding loan balance. Including the two sweeps ensure that all sweep covenants are considered in the
modified intensity index. 19 Covenant intensity measures used in this paper indicate the presence of certain covenants in the loan contract,
not the actual threshold of each covenant. This is because the thresholds for financial covenants and sweeps are
related to many factors, such as the credit market conditions and the borrowers’ specific characteristics.
Therefore, it is hard to compare the threshold directly. 20 According to Bavaria and Lai (2007), S&P define covenant-lite loans as those with no maintenance financial
covenants that have to be maintained quarterly through the term of the loan. Instead, covenant-lite loans have
only incurrence covenants that do not have to be met on an ongoing basis as maintenance covenants do.
Incurrence covenants only restrict the borrower’s ability to issue new debt, make acquisitions, or take other
action that would breach the covenants.
- 24 -
this paper is to look at private equity involvement at firm level, I consolidate PE funds to
PE firm level. So if one PE firm has multiple active PE funds, I use the Excel Company ID
at the PE firm level for the analysis. For example, both Lehman Brothers Mezzanine Fund
and Lehman Brothers Capital Partners IV are identified at the PE firm level as the Lehman
Brothers, Private Equity Division. I also track the name changes of the PE firms. Of the
501 LBO deals in the sample, 448 deals have at least one PE firm involved. The remaining
transactions are either management buyouts or buyouts by another corporations with no PE
firm involved. There are in total 234 PE firms sponsoring the 448 deals. Appendix A
presents the top 25 PE firms of these 234 PE firms by the number of deals and total
transaction values of buyouts they sponsored. The most frequent PE firms are Kohlberg
Kravis Roberts & Co (27 deals), TPG Capital (26 deals), The Blackstone Group, (22 deals),
Goldman Sachs Capital Partners (21 deals), and Bain Capital Private Equity (20 deals).
Panel A of Table 5 presents the PE firms’ involvement in LBOs over the sample
period. Column (1) shows the number of buyouts that have PE firms involved and its
proportion in all LBOs in the year (in the brackets). There is an overall trend of increased
PE involvement. In the late 1980s, the average proportion of LBOs with PE firms involved
is around 73%. In the 1990s, almost all LBOs have PE firms. Following Officer, Ozbas,
and Sensoy (2010), I categorize a PE firm as a prominent PE if it is listed as the 50 largest
PE firms by the Private Equity International (PEI) magazine from the year 2007 to 2013.
Starting 2007, the PEI magazine ranks PE firms based on the capital raised over the
previous five-year period. I add the PE firms that are listed as the top 25 PEs in my sample
from Appendix A to this list of prominent PE firms if they are not already included in the
prominent list. The PE firms added are mainly those that are subsidiaries of banks (the
bank-affiliated PEs), as these firms may not be on the PEI list because they may use
internal capital rather than relying on external fundraising. Following Officer et al. (2010) I
also add Forstmann Little and HM Capital Partners (formerly Hicks, Muse, Tate, and Furst)
because they are historically prominent PE firms that have been less active in recent
fundraising. Column (2) shows that 52% of the LBOs in my sample have prominent PE
firms and there is a trend of more prominent PEs involved in LBOs over time.
Fang et al. (2012) argue that it is important to look at bank-affiliated LBOs where the

- 25 -
PE firms are subsidiaries of major banks as these deals may have different characteristics
than LBOs sponsored by the stand-alone PE firms. First, bank-affiliated PEs may have
better access to funds provided by their parent banks should an LBO opportunity rise and
these PE firms are better able to take advantage of the favorable credit market conditions.
Second, these bank-affiliated deals provide the parent banks with cross-selling
opportunities (such as potential M&A advisory work, cash-management services, etc.) that
increase parent banks’ fee income. As a result, buyout decisions may not be based on PE’s
expectation on efficiency improvement of target firms, but only to take advantage of these
cross-selling opportunities.
To confirm bank affiliation, I check whether a PE firm is a subsidiary of a bank at the
LBO announcement day.21 I further require that the parent bank provides loans for the deal.
There are in total 103 bank-affiliated deals (21% of 501 LBOs) in the sample and the total
transaction value of these deals is 35% of the sum of transaction value of all 501 LBOs.
This is similar to the findings of Fang et al. (2012) that bank-affiliated groups account for
nearly 30% of the overall private equity market, and the findings reported by
Lopez-de-Silanes, Phalippou, and Gottschalg (2011) that roughly one-third of the
investment in the global private equity dataset are done by PE groups that are subsidiaries
of banking and finance companies. Column (3) presents the number of bank-affiliated deals
by year. Bank-affiliated deals exhibits cyclicality corresponding to the LBO market
activities. In the years 1989, 1998, and 2007, when the LBO activities were at the peak of
the cycle, the proportions of bank-affiliated deals in total LBOs was higher. This is
consistent with Fang et al. (2012) that PE firms time the market and bank affiliations allow
these PE firms to take advantage of favorable credit market conditions.
I then look at the club deals, where a consortium of two or more PE firms are
involved in an LBO deal. Column (4) shows the number of club deals and its percentage
over total LBOs each year and Column (5) presents the sum of transaction values of club
deals each year and its ratio over the total transaction values of the 501 LBOs. 30% of the
LBOs in my sample are club deals and the total transaction values of these deals are 50% of
21 Some PE firms started as subsidiaries of major banks but later became independent. I only consider an LBO
as bank-affiliated if it is announced during the time the PE firm is subsidiary of a major bank.

- 26 -
all deals. This is consistent with PE firms pooling their assets to acquire large targets.
Column (6) shows the maximum number of PE firms in a club deal consortium by year.
Club deals are very rare in the late 1980s and early 1990s and they start to become
important in the late 1990s. During 2005-2008, club deals reached their peak—almost 50%
of LBOs were club deals and the total transaction value of these deals was around 80% of
all LBOs during the time. The largest-ever LBO, the buyout of TXU in 2007 with a
transaction value of $44.5 billion was conducted by a consortium including KKR, the TPG
Capital, and Goldman Sachs Capital Partners. As shown by Column (6), there is a general
trend of more PE firms cooperating in a club deal. During the whole sample period, there
are on average 2.6 PE firms in the consortium of the club deals (not tabulated). The deal
that has the largest number of PE firms involved is the buyout of SunGard Data Systems
sponsored by seven PE firms and completed in 2005 with a transaction value of $11.5
billion.22
4.2.2. Private Equity Reputation
Having documented the time trend of PE firms’ involvement in LBOs, I construct
measures for private equity reputation that capture PE firms’ past experience and skills.
Previous empirical studies measure PE fund reputation in a number of different ways that
include fund size, its market share, the number of recent LBO transactions, and the number
of previous fund raisings23. As the PEs in my sample are at the firm level, I use reputation
measures that can be constructed for each PE firm. I follow Demiroglu and James (2010)
and construct reputation measures based on the number of LBOs sponsored by the PE firm
and the total transaction values of these deals in the past 36 months or since 1970.24 In
order to get the LBO transaction history, I use all Capital IQ recorded LBO, MBO, SBO
transactions for U.S. target firms since 1970 plus the buyout sample from SDC—a total of
19,014 deals. In the case of club deals, I consider the buyout as a full deal for each PE firm.
When calculating LBO deal-level PE firm reputation, I use the reputation score of the PE
22 The seven PE firms were Silver Lake, Bain Capital, the Blackstone Group, Goldman Sachs Capital
Partners, KKR, Providence Equity Partners, and the TPG Capital. 23 See Demiroglu and James (2010) for discussions on strengths and weaknesses of each reputation measures. 24 The earliest LBO deal documented by Capital IQ is in 1970.
- 27 -
firm with the highest reputation if the deal has multiple PE firms. The reputation score is
set to zero if there are no PE firms involved in the buyout deal.
Panel B of Table 5 presents the PE reputation measures. The first reputation measure
is based on the number of deals. Columns (1) and (2) show the medians of the reputation
measures calculated as the natural logarithm of the total number of deals completed by a
certain PE firm during the past 36 months and since 1970, respectively. Both reputation
measures have shown an increasing trend, suggesting that PE firms are more involved in
LBO deals now than before.
A second measure for PE firm’s reputation is based on its market share. Market share
of each PE firm at the time of a new LBO deal is calculated as the ratio of the number of
deals completed by the PE firm in the prior 36 months over the total number of deals
(based on the 19014 deals) during the same 36 months. I also calculate PE firm’s market
share as the ratio of the total transaction value of LBOs by the PE firm in the prior 36
months over the total transaction value of all LBOs during the 36 months. Column (3) and
(4) shows the median reputation score based on market share. The median PE firm in my
LBO sample has about 0.25% (mean 0.44%) market share by number of deals and 0.89%
(mean 2.1%) market share by deal value in the LBO market.
Another reputation measure is years of experience, which is calculated as the number
of years based on the first ever LBO deals sponsored by the PE firm and the last LBO deals
in the sample. Overall, the median PE firm in the sample has 24 years (mean: 21 years) of
experience and has invested in 15 LBOs (mean: 22 LBOs) since 1970 (not tabulated).
In summary, analyses of this subsection show that PE firms have become more
involved in LBO deals, as evidenced by the increasing proportion of LBOs sponsored by
PE firms in the more recent years and the increasing importance of club deals.
Bank-affiliated LBOs have shown some cyclicality that corresponds to the credit market
condition, suggesting some market timing of these deals. The reputation score for PE firms
based on their market share has been decreasing. The next section will examine how these
PE reputation and involvement are related to performance.

- 28 -
5. Explanations for post-buyout operating performance
In this section, I examine the relationship between operating performance and the
LBO deal characteristics that are expected to be related to performance change. My goal is
to test the different hypotheses developed in Section 2.2 to determine factors that contribute
to value creation in LBOs. The analysis will also help to understand whether the
documented changing characteristics of LBOs can be used to explain the reduced
performance improvement observed in the more recent LBO deals.
Table 6 reports the multivariate regression results for post-buyout operating
performance and its drivers. The dependent variables are the industry-adjusted percentage
changes in EBITDA/sales from the last full pre-buyout year (year -1) to the second full
year after deal completion (year +2). This allows me to include LBO deals completed by
the end of 2010 to look at the performance of LBOs during and after the 2007-09 financial
crisis. Also, I use EBITDA scaled by sales, instead of total assets, to avoid the inventory
write-up problems related to total assets as described in Kaplan (1989b). To control for
pre-buyout characteristics of target firms, all regressions include leverage ratios at the end
of year -1 and the industry-adjusted change in EBITDA/sales from year -2 to year -1. All
regressions control for year and industry effect.
First, I look at the disciplining effect of leverage. Column (1) shows that the effect of
leverage change on performance is significantly positive. That is, firms with greater amount
of leverage added during the LBOs show more post-buyout performance improvement,
supporting the debt disciplining hypothesis. I next examine whether and how performance
is related to the monitoring by lenders. I include the proportion of LBO debt that is funded
by banks, with the expectations that banks have more incentives and advantages to monitor
the borrowing firms and that the percentage of bank debt is proportional to banks’
monitoring effort. I also include the modified covenant intensity index that measures the
presence of different covenants in LBO loans. The maturity structures of LBO debt are also
used in the regression, with the expectation that shorter maturities indicate better
monitoring by lenders therefore leading to better performance.25
25 For robustness, I replace the maturity of the whole LBO loans with maturity of bank loans and maturity of

- 29 -
Column (2) demonstrates a significantly positive coefficient for covenant intensity,
suggesting that controlling for the leverage effect, tighter covenants further improves the
post-buyout performance. These covenants generally put restrictions on the target firms’
use of cash flow, therefore further reducing the agency costs of the free cash flow problems.
Covenants also require target firms’ to maintain certain financial ratios and restrict them
from using more debt, possibly motivating managers to improve efficiency and to increase
earnings. However, bank debt proportion and maturity are insignificant drivers for
performance.
I then examine the effects of PE firms’ reputation and involvement on performance. I
use different PE reputation measures constructed in the last section as independent
variables in the regression. However, none of these reputation measures is significantly
related to performance (Column (3)). Column (4) shows result for a regression that
includes the club deal dummy that takes the value 1 if an LBO has more than two PE firms
involved and 0 otherwise. It has been argued that in a club deal, different PE firms bring
different expertise to the target firm’s management, therefore providing another source of
value creation.26 However, the result in Column (4) does not support this argument.
Another view on club deal is that as the size of the consortium of PE firms gets bigger, it is
harder to make timely operational and management decisions. Experts of the private equity
industry suggested that the optimal size of the consortium is two or three PE firms.27 I
construct an optimal consortium size dummy variable that takes the value of 1 if there are
two or three PE firms in a club, and 0 other wise. However, regression result presented by
Column (5) shows no evidence that the optimal consortium size is related with performance.
In column (6), I include a dummy variable that indicates whether an LBO is bank-affiliated
deal, where bank affiliation is defined as (1) the PE sponsoring the deal is a subsidiary of a
institutional loans, the results are similar.
26 For example, New York Times commented on KKR, Bain, and Vornado Realty Trust’s buyout of Toys "R"
Us that “it was clear what each firm brought to the table. Kohlberg Kravis has a good reputation in the retail
business, Bain has a good record doing turnarounds and Vornado clearly knows real estate”. Source: “Do Too
Many Cooks Spoil the Takeover Deal”, the New York Times, April 3, 2005. 27 For example, Jeffrey Walker, a managing partner of CCMP Capital, said that “I find it very difficult
managing a deal that has more than two or three investors”. Source: “Buyout Veterans Have Questions about
Club Deals”, Dow Jones Newswires, January 24, 2007.

- 30 -
bank and (2) the parent bank provides loans for the deal. I find that bank affiliation has no
significant effect on performance. In sum, regression results presented in Columns (3)-(6)
provide no evidence that PE firms’ involvement or reputation is related to performance of
target firms.
I test the management participation hypothesis that LBOs tend to perform better when
managers of target firms contribute equity and participate in the buyout as their incentives
are better aligned with other shareholders. I use a dummy variable that indicates management
participation. Specifically, the dummy variable equals 1 if Capital IQ labels a transaction as
“management buyout”, “management participated”, “individual investor participated”
when the individual investor is confirmed to be board member or management of the target
firm, or the firm is bought out through an employee stock ownership plan (ESOP). If a
transaction is from the SDC database, the dummy is equal to 1 if the SDC synopsis
describes the deal as “management led” or “management participated”. Results in column
(7) support the management participation hypothesis
I next examine whether management turnover is related to performance. I go through
Factiva and manually collect news on CEO and CFO change from the time of buyout
announcement until the deal reaches a final outcome (bankruptcy, IPO, or a sale to another
buyer). I supplement the Factiva results with the Key Development on “Corporate Structure
Related” news from Capital IQ. From the announcement date to the final deal outcome day,
212 firms (42%) experienced a change in the CEO and 167 firms (33%) experienced CFO
change. In the regression, I use a CEO change dummy variable that indicates whether there
is CEO change from the buyout announcement to two full years after the buyout
completion.28 This is because the independent variable is the change in EBITDA/sale in
year +2 compared with year -1. Column (8) shows an insignificant coefficient for CEO
change.
To conclude, regressions results of Table 6 support the debt discipline, lenders’
monitoring, and management participation hypotheses of value creation in LBOs, but do
not support the hypotheses of private equity reputation, club deals, or bank affiliations.
28 I also use a dummy for CFO changes, or a dummy for both CEO and CFO changes. The results are the same.

- 31 -
6. Robustness
6.1. Credit Market Conditions
Previous studies have shown that LBO buyers, whether they are PE firms, managers
of target firms, or other corporations, take advantage of favorable credit market conditions.
For example, Kaplan and Stein (1993) present evidence that the 1980s’ LBO boom was
driven by the attractive terms of high yield bonds. This result suggests that more LBOs will
be undertaken when the credit market is more favorable and leverage is cheaper to acquire
and that LBO buyers may overinvest in unprofitable deals during the time. As a result,
LBOs completed during the favorable credit market conditions may perform worse than
other deals. In this section, I test whether the key results from my hypotheses hold when
controlling for the impact of credit market conditions on performance.
Following Barry, Mann, Mihov and Rodriguez (2008), I add to the baseline
regression the Baa yield and the difference between the Baa yield in the month of LBO
completion and its 60-month historical average.29 I also include the term structure,
calculated as the difference between 10-year T-Bond yield and three-month T-Bill yield.
Column (1) of Table 7 presents the regression results. Leverage change, covenant intensity,
and management participation are still significantly and positively related to post-buyout
performance after controlling for interest rates. In addition, there is no evidence of worse
performance for deals announced at the time of favorable credit markets.
Another way to examine market conditions is to look at the hot versus cold LBO
market. Following Colla, Ippolito, and Wagner (2012), I construct a hot market dummy by
taking a 12-month centered moving average of the number of LBOs for each month over
the sample period. Hot months are defined as above the median in the distribution of the
monthly moving average across all months. The hot market dummy takes a value of 1 if a
deal is completed in a hot month, and zero otherwise. Column (2) shows that controlling
for the LBO market condition, leverage, covenants, and management participation are still
important drivers for performance, and that deals announced during hot LBO market do not
generate worse performance than other deals.
29 Regressions with the month of LBO announcement generate the same results.
- 32 -
I also examine whether performance is related to the LBO loan spread. The spread at
the LBO deal level is calculated as the weighted average of all-in-drawn spread across all
tranches. While the Baa yield, its difference from the historical average, term structure, and
the hot market dummy are related to the general credit market and LBO market condition,
the loan spread measures the actual cost of debt for each LBO deal. If LBO buyers
overinvest in unprofitable deals when leverage is cheaper to acquire, I expect to find less
performance improvement when the LBO loan spread is lower. Column (3) shows that
controlling for loan spread, the effects of leverage, lenders’ monitoring, and management
participation in the LBO transaction are still significant. In the meanwhile, LBO loan
spread is not significantly related to performance.
I also look at deal price, calculated as the ratio of EBITDA over the total transaction
value, adjusted by subtracting the S&P 500 market earnings/price ratios for each month of
LBO completion. Column (4) shows that leverage change, covenant intensity, and
management participation are still significant and that deal prices do not affect
performance.
To summarize, robustness analyses of this section show that leverage, covenants, and
management participation are still important drivers for post-buyout performance
enhancement after controlling for credit market conditions, LBO market conditions, loan
spread, and buyout prices. These results again support the debt discipline, lenders’
monitoring, and management participation hypotheses while rejecting the private equity
reputation hypothesis. In addition, I find no evidence that LBOs constructed during
favorable market conditions perform worse than other deals, nor is performance related to
prices paid for LBOs.
6.2. LBO deal outcome
In this section, I conduct additional tests on the effects of LBO deal characteristics on
performance, where performance is now measured by the ultimate outcome of these deals. I
search Factiva for SEC filings and news to identify deal outcomes that include (1)
bankruptcy or distressed exchange, (2) a subsequent IPO, (3) a sale to a strategic buyer (4)
a sale to a financial buyer (also known as the secondary LBO), (5) still privately held by

- 33 -
the same buyer, or (6) unknown. I supplement Factiva information with the Capital IQ
Tearsheet and the company history from its website. Table 8 shows the post-buyout
outcomes as of June 30, 2013 by LBO effective year. Over the entire sample period, 83
deals (16.6%) file for bankruptcy, initiate a financial restructuring, or go through distressed
exchange. 35.3% of the LBOs exit through an IPO, 17% through a sale to a strategic buyer,
and 11.8% through a sale to financial buyer. The majority of the deals in the late 2000s are
still privately held by the same buyers. For all deals that have reached outcome, the median
months to exit is 42 months (mean 47 months, not tabulated).
Exit through an IPO or a sale to a financial or strategic buyer is generally considered
as a successful outcome of an LBO. For example, Holthausen and Larcker (1996) find that
the performance of LBO firms exceeds that of its industry rivals at the time of the IPO,
suggesting that the IPO is related to LBO success. Harford and Kolasinski (2011) find that
when a sponsor sells a firm to a public strategic buyer, the buyer’s stock price reaction is
positive. In order to test whether the key results from my hypotheses still hold when using
deal outcomes to measure LBO success, I run logit regressions. Specifically, for the
dependent variable, I create a success dummy that takes on a value of 1 if an LBO exits
through an IPO or a sale to financial or strategic buyer and zero otherwise.30 As most of
the recent deals have not reached outcomes yet, I only consider LBOs that are completed
by the end of 2008, taking into account that the last day of information collection on deal
outcome is June 30, 2013 and that the median months to bankruptcy is 43 months (Table 8,
Column (1).
Column (1) of Table 9 presents results of the baseline regression using the success
dummy as the dependent variable. Consistent with the lenders’ monitoring hypothesis,
LBOs are more likely to reach successful outcomes if they are financed with higher
proportion of bank debt and have tighter loan covenants. CEO changes during the time
target firms are privately held by PE firms have negative impact on the deal outcome.
Leverage change and the dummy for management participation are not significant.
Column (1) also shows that LBOs sponsored by PEs with higher reputation score
30 Alternatively, I assign the value of 1 if the deal outcome is an IPO or a sale to financial buyer and zero
otherwise, the results are similar.

- 34 -
have better outcomes, supporting the private equity reputation hypothesis. I use different
reputation measures that include PE’s market share based on the number of deals or the
total deal values in the prior 36 months or since 1970, the natural log of the number of
deals in the prior 36 month or since 1970, and natural log of PE’s years of experience. All
measures generate significant and positive estimates on PE reputation. This result provides
a clear picture of the roles of PEs in an LBO—reputation is not directly related to better
operating performance as measured by EBITDA and net cash flows to total assets or sales,
but is important in ensuring successful outcomes of LBOs.
Regression results also show that bank-affiliated LBOs are less likely to exit through
an IPO or a sale, consistent with the bank affiliation hypothesis that deals sponsored by PE
firms that are subsidiaries of banks tend to perform worse. This finding is also consistent
with Wang (2012) and Fang et al. (2012). Wang (2012) uses accounting measures and finds
that bank-affiliated LBOs in the U.K. underperform standalone deals. She argues that this is
because bank-affiliated PE firms do not select good targets as other PEs do. Fang et al.
(2012) find bank-affiliated deals have worse outcomes if they are consummated during the
peaks of the credit market.
Controlling for credit market conditions and deal prices in Columns (2)-(4), the
results of bank debt proportion, CEO change, PE reputation, and bank affiliation still hold.
Moreover, Column (2) shows that the probability of a successful exit strategy is
significantly and positively related to the Baa spread relative to its historical average over
the previous 60 months, after controlling for the absolute level of the spread. This suggests
that LBOs are less likely to succeed if they are completed during the time of favorable
credit market conditions. This result provides some evidence of market timing of LBO
buyers that they tend to overinvest in unprofitable deals that may not exit successfully
during the time when the overall credit markets are favorable and leverage is easier to
acquire, as suggested by Kaplan and Stein (1993) and Axelson et al. (2009).
To summarize, using the exit strategy of IPO or a sale to financial or strategic buyer
as an indicator for LBO success, regression analyses show that an LBO is more likely to
succeed if it uses more bank debt and tighter loan covenants, experiences no CEO change,
and is sponsored by highly reputable PE firms. LBOs are more likely to fail if the buyers
- 35 -
are subsidiary of banks that are also financiers of the deal. These results are in general
robust to credit market conditions and deal prices. Findings of section provide evidence for
the lenders’ monitoring, the private equity reputation, and the bank affiliation hypotheses. I
also find some evidence of the market timing of LBO buyers.
Alternatively, I use a failure dummy that takes the value of 1 if an LBO goes bankrupt,
enters a distressed exchange, or initiates financial restructuring. Logit regressions using
bankruptcy dummy as dependent variables show complementary results that LBOs are
more likely to fail if they are sponsored by PE firms of low reputation, are bank-affiliated,
and experience CEO change.
7. Conclusion
Using a sample of 501 pubic-to-private U.S. LBO transactions completed between
1986 and 2011, I find that better performance is related to larger amount of leverage added
during the buyout process, more restrictive covenants of LBO loans, and management
contributing equity and participating in the buyout. These results suggest that the main
source of value creation in LBOs is the reduced agency costs through the discipline effect
of debt, closer monitoring by lenders, and the better aligned management incentives. These
findings are robust after controlling for the credit market and LBO market conditions, costs
of borrowing of target firms, and buyout prices. Findings of this paper deepens our
understanding on the observed insignificant performance enhancement in more recent
LBOs that use less leverage and relaxed loan covenant, which are important drivers for
performance.
Using deal outcome as alternative measures of performance, I find that LBO are more
likely to exit through a successful strategy (an IPO or a sale to financial or strategic buyers)
if they use more bank debt and tighter covenants, experience no CEO change, and are
sponsored by PE firms with high reputation. These results are consistent with the lender’s
monitoring and the private equity reputation hypothesis in value creation in LBOs.
Results of this paper suggest that controlling for deal and target characteristics and
credit market conditions, private equity reputation is not related to changes in operating

- 36 -
performance in the first three years after the buyout but is important in ensuring successful
deal outcomes. Future research needs to examine the role of private equity firms in each
stage of the buyout process in order to better understand the mechanisms through which
reputable PE firms create value.
- 37 -
References
Acharya, Viral V., and Conor Kehoe, 2008, Corporate governance and value creation:
Evidence from private equity, Working Paper, London Business School.
Axelson, Ulf, Per Stromberg, and Michael S. Weisbach, 2009, Why are buyouts levered? The
financial structure of private equity funds, Journal of Finance 64, 1549-1582.
Barry, Christopher B., Steven C. Mann, Vassil T. Mihov, and Mauricio Rodríguez, 2008,
Corporate debt issues and the historical level of interest rates, Financial Management
37, 412-430.
Bavaria, Steven M., and Ana Lai, 2007, The leveraging of America” Covenant-lite loan
structures diminish recovery prospects, Standard & Poor’s Ratings Direct, July 18.
Bord, Vitaly M., and João A. C. Santos, 2012, The rise of the originate-to-distribute model
and the role of banks in financial intermediation, Economic Policy Review 18, 21-34
Bradley, Michael, and Michael R. Roberts, 2004, The structure and pricing of corporate debt
covenants, Working Paper, Duke University.
Chava, Sudheer, and Michael R. Roberts, 2008, How does financing impact investment? The
role of debt covenants, Journal of Finance 63(5), 2085-2121.
Cohn, Jonathan B., Lillian F. Mills, and Erin M. Towery, 2011, The evolution of capital
structure and operating performance after leveraged buyouts: Evidence from U.S.
corporate tax returns, Working Paper, University of Texas at Austin.
Colla, Paolo, Filippo Ippolito, and Hannes F. Wagner, 2012, Leverage and pricing of debts in
LBOs, Journal of Corporate Finance 18(1), 124-137.
Cumming, Douglas. J., Donald Siegel, and Michael Wright, 2007, Private equity, leveraged
buyouts, and governance, Journal of Corporate Finance 13, 439-460.
Demiroglu, Cem, and Christopher M. James, 2010, The role of private equity group
reputation in LBO financing, Journal of Financial Economics 96, 306-330.
Diamond, Douglas W., 1984, Financial intermediation and delegated monitoring, Review of
Economic Studies 51, 393-414.
Diamond, Douglas W., 1993, Seniority and maturity of bank loan contract, Journal of
Financial Economics 33, 341-368.
Fang, Lily, Victoria Ivashina, and Josh Lerner, 2012, Combining banking with private equity
investing, Working paper.
- 38 -
Gong, James Jianxin, and Steve Yuching Wu, 2011, CEO turnover in private equity
sponsored leveraged buyouts, European Financial Management 16, 805-828.
Guo, Shourun, Edith S. Hotchkiss, and Weihong Song, 2011, Do buyouts (still) create value?,
Journal of Finance 76, 479-517.
Harford, Jarrad, and Adam Kolasinski, 2011, How do private equity sponsors add value?
Evidence from a comprehensive sample of large buyouts and exit outcomes, Working
Paper, University of Washington.
Higson, Chris, and Rudiger Stucke, 2012, The performance of private equity, Working Paper,
London Business School.
Holthausen, Robert W., and David F. Larcker, 1996, The financial performance of reverse
leveraged buyouts, Journal of Financial Economics 42, 293-332.
Ivashina, Victoria, and Anna Kovner, 2009, The private equity advantage: Leveraged buyout
firms and relationship banking, Review of Financial Studies 24, 2462-2498.
Jensen, Michael C., 1986, Agency costs of free cash flow, corporate finance and takeover,
American Economic Review 76, 323-329.
Jensen, Michael C., 1989, Eclipse of the public corporation, Harvard Business Review,
sep-oct, 61-74.
Kaplan, Steven N., 1989a, The effect of managements buyouts on operating performance and
value, Journal of Financial Economics 24, 217-254.
Kaplan, Steven N., 1989b, Management buyouts: evidence on taxes as a source of value,
Journal of Finance 44, 611-632.
Kaplan, Steven N., and Antoinette Schoar, 2005, Private equity performance: returns,
persistence, and capital flows, Journal of Finance 60, 1971-1823.
Kaplan, Steven N., and Jeremy C. Stein, 1993, The evolution of buyout pricing and financial
structure in the 1980s, Quarterly Journal of Economics 108, 313-357.
Lichtenberg, Frank R., and Donald Siegel, 1990, The effects of leveraged buyouts on
productivity and related aspects of firm behavior, Journal of Financial Economics 27,
165-194.
Lopez-de-Silanes, Florencio, Ludovic Phalippou, and Oliver Gottschalg, 2011, Giants at the
gate: On the cross-section of private equity investment returns, Working paper.
Miller, Steven, 2012, A syndicated loan primer: A guide to the U.S. loan markets, Standard &
Poor’s Credit Research, September.
- 39 -
Officer, Micah S., Oguzhan Ozbas, and Berk A. Sensoy, 2010, Club deals in leveraged
buyouts, Journal of Financial Economics 98, 214-240.
Park, Cheol, 2000, Monitoring and structure of debt contracts, Journal of Finance 55,
2157-2195.
Rajan, Raghuram, and Andrew Winton, 1995, Covenants and collateral as incentives to
monitor, Journal of Finance 50, 1113-1144.
Shivdasani, Anil, and Yihui Wang, 2011, Did structured credit fuel the LBO boom?, Journal
of Finance 66, 1291-1328.
Smith, Abbie J., 1990, Corporate ownership structure and performance: The case of
management buyouts, Journal of Financial Economics 27, 143-164.
Stromberg, Per, 2008, The new demography of private equity, Working paper.
Wang, Yingdi, 2012, Bank affiliation in private equity firms: distortions in investment
selection, Working paper.

- 40 -
Appendix A: Top Private Equity Firms
This table ranks private equity firms by the total dollar amount of transactions and the number of transactions they sponsored in my sample. Total transaction
value is inflation-adjusted with the base year of 2005. Percentage in the brackets of Column (1) shows the sum of transaction values of all deals sponsored
by each PE firm as a proportion of total transaction value of all 501 LBOs. Percentage in brackets of Column (2) presents the number of deals sponsored by
each PE firm over the total number of LBOs in the sample. Club deals are LBOs sponsored by two or more PE firms. Parent bank is at the time of deal
announcement. PEI 2013, 2000, and 2007 indicate the ranking of each PE firm by the Private Equity International magazine in the years 2013, 2000, and
2007.
Name of Private Equity Firm
(1)
Total Transaction Value
(2)
Number of Transactions
(3)
Club deals
(4)
Parent Bank
(5)
PEI
2013
(6)
PEI
2000
(7)
PEI
2007 Rank Value % Rank Number %
Kohlberg Kravis Roberts & Co. L.P. 1 $ 228,989 (25.45%) 1 27 (5.4%) 12 4 3 2
TPG Capital, L.P. 2 $ 183,501 (20.40%) 2 26 (5.2%) 20 1 4 5
Goldman Sachs Capital Partners 3 $ 142,897 (15.88%) 5 21 (4.2%) 15 Goldman Sachs 6 1 3
Bain Capital Private Equity 4 $ 100,316 (11.15%) 6 20 (4.0%) 13 9 8 8
The Blackstone Group 5 $ 83,372 (9.27%) 3 22 (4.4%) 13 3 7 4
The Carlyle Group LP 6 $ 78,450 (8.72%) 11 15 (3.0%) 7 2 2 1
Thomas H. Lee Partners, L.P. 7 $ 69,421 (7.72%) 7 19 (3.8%) 9 28 30
Lehman Brothers Private Equity 8 $ 66,788 (7.42%) 24 6 (1.2%) 1 Lehman Brothers 25
Merrill Lynch Global Private Equity 9 $ 64,841 (7.21%) 15 8 (1.6%) 5 Merrill Lynch
Citigroup Private Equity LP 10 $ 55,982 (6.22%) 31 5 (1.0%) 4 34 27
Apollo Global Management, LLC 11 $ 49,629 (5.52%) 8 17 (3.4%) 8 8 5 12
Morgan Stanley Private Equity 12 $ 44,419 (4.94%) 88 2 (0.4%) 1 Morgan Stanley
Providence Equity Partners LLC 13 $ 42,050 (4.67%) 20 7 (1.4%) 6 17 9
Madison Dearborn Partners, LLC 14 $ 37,172 (4.13%) 12 14 (2.8%) 7 24 32
Riverstone Holdings LLC 15 $ 30,017 (3.34%) 52 3 (0.6%) 3 11 29
Silver Lake 16 $ 28,807 (3.20%) 33 5 (1.0%) 4 27 33 19
Clayton, Dubilier & Rice, Inc. 17 $ 25,267 (2.81%) 29 6 (1.2%) 2 33 18 47
DLJ Merchant Banking 18 $ 25,024 (2.78%) 4 22 (4.4%) 11 Credit Suisse

- 41 -
J.P. Morgan Partners, LLC 19 $ 18,848 (2.10%) 10 15 (3.0%) 10 JPMorgan Chase 13
Deutsche Bank AG, Investment Arm 20 $ 13,271 (1.48%) 30 5 (1.0%) 4 Deutsche Bank
Warburg Pincus LLC 21 $ 13,071 (1.45%) 17 8 (1.6%) 2 5 9 14
Credit Suisse Private Equity, LLC 22 $ 12,770 (1.42%) 18 8 (1.6%) 7 Credit Suisse31
Canada Pension Plan Investment Board 23 $ 11,545 (1.28%) 87 2 (0.4%) 2 20
Court Square Capital Partners 24 $ 9,704 (1.08%) 9 16 (3.2%) 4 Citigroup
Leonard Green & Partners, L.P. 25 $ 9,679 (1.08%) 13 12 (2.4%) 5 39 31
31 Both DLJ Merchange Banking and the Credit Suisse Private Equity, LLC are PE firms listed as subsidiary of Credit Suisse. But I confirmed that they are different PE firmks.

- 42 -
Table 1: LBO Year and Industry
The table classifies transactions by LBO effective year and target firm industry. Eight broad industry
classifications are defined according to SIC codes: (1) Agriculture/Fishing/Forestry (SIC 0-999), (2) Mining (SIC
1000-1499), (3) Construction (SIC 1500-1799), (4) Manufacturing (SIC 2000-3999), (5)
Transportation/Communication/Electric/Gas (SIC 4000-4999), (6) Wholesale/Retail (SIC 5000-5999), (7)
Finance/Insurance/Real Estate (SIC 6000-6799), and (8) Services (SIC 7000-8999). The percentage in the
brackets of the last column shows the number of deals in each year as a proportion of total number of deals. The
percentage in the brackets of the last row shows the number of deals in each industry as a proportion of total
number of deals.
(1)
Agr
(2)
Mining
(3)
Constr
(4)
Mftr
(5)
Trans
(6)
Wholesale
/Retail
(7)
Fin
(8)
Services
Total
1986 6 5 1 12 (2.4%)
1987 5 1 5 1 12 (2.4%)
1988 1 18 3 8 1 5 36 (7.2%)
1989 14 3 7 3 27 (5.4%)
1990 3 2 3 8 (1.6%)
1991 1 1 (0.2%)
1992 2 2 (0.4%)
1993 2 1 1 4 (0.8%)
1994 1 1 1 3 (0.6%)
1995 3 2 1 6 (1.2%)
1996 12 1 1 1 15 (3.0%)
1997 1 21 1 4 9 36 (7.2%)
1998 1 19 6 6 9 41 (8.2%)
1999 15 2 1 2 10 30 (6.0%)
2000 1 13 3 7 3 27 (5.4%)
2001 1 5 3 1 1 11 (2.2%)
2002 1 6 1 4 3 15 (3.0%)
2003 1 1 1 17 2 1 1 4 28 (5.6%)
2004 4 16 3 7 2 6 39 (7.8%)
2005 11 4 8 8 31 (6.2%)
2006 1 6 5 2 7 23 (4.6%)
2007 1 1 1 12 6 11 6 12 51 (10.2%)
2008 2 2 4 8 (1.6%)
2009 1 1 1 3 (0.6%)
2010 1 1 7 1 5 1 3 19 (3.8%)
2011 6 1 2 4 13 (2.6%)
Total 6 10 4 223 41 97 16 100 501
(1.2%) (2.0%) (0.8%) (44.5%) (8.2%) (19.4%) (3.2%) (20.0%) 100%

- 43 -
Table 2: Annual Medians for Deal Pricing
This table presents the annual medians of total capital, buyout prices relative to fundamentals,
market-adjusted prices relative to fundamentals, and buyout premiums. Buyouts are listed by year in
which final transaction are completed. Total capital equals the sum of (1) the market value paid for the
firms’ equity; (2) the value of firm’s outstanding debt; and (3) the fees paid in the transaction; less (4)
any cash removed from the firm to finance the buyout. Net cash flow equals EBITDA less capital
expenditures in the last full year before the leveraged buyout announcement. Market E/P ratio is the
ratio of earnings to price for the S&P 500 in the month the buyout deal is effective. Market-adjusted
ratios are calculated by subtracting the market E/P ratio from the EBITDA to capital or NCF to capital.
Premium is the percentage difference between the price paid for a firm’s equity and the price one
month before the first announcement of buyout activity. ***, **, and * denote that the nonparametric
trend test statistics is statistically significant at 1%, 5%, and 10% level, respectively.
year
(1)
Total
Capital
($ millions)
(2)
EBITDA to
Capital (%)
(3)
NCF to
Capital
(%)
(4)
Adjusted
EBITDA to
capital (%)
(5)
Adjusted
NCF to
capital (%)
(6)
Premium
(%)
1986 1,548.52 16.59 7.15 10.68 1.11 54.58
1987 990.22 12.13 3.72 6.81 -1.71 41.38
1988 430.55 13.90 6.42 5.76 -1.32 43.70
1989 858.29 15.42 10.24 7.85 3.06 49.52
1990 226.58 17.96 7.25 11.39 1.14 27.60
1991 222.17 23.21 14.40 17.95 9.15 24.46
1992 414.55 14.68 12.33 9.82 7.47 14.29
1993 154.47 20.08 14.54 15.57 10.03 10.60
1994 376.30 14.39 11.31 8.65 5.58 15.00
1995 821.23 16.22 13.29 9.83 6.90 22.52
1996 237.80 12.23 8.06 6.93 2.66 26.79
1997 386.26 12.87 7.62 8.00 3.33 24.55
1998 421.46 9.85 6.66 6.15 2.54 21.80
1999 485.46 13.20 10.66 10.18 7.26 24.11
2000 485.58 11.75 7.31 8.31 3.67 33.97
2001 408.47 12.53 7.68 9.60 4.98 20.51
2002 185.44 14.85 11.22 12.60 8.03 38.96
2003 727.19 11.60 8.51 7.83 5.19 19.47
2004 697.01 10.83 8.19 6.37 3.93 19.22
2005 738.43 9.72 7.62 4.43 2.30 31.51
2006 1,278.44 10.66 7.17 4.87 1.48 17.29
2007 1,956.71 8.47 5.24 3.01 0.16 21.08
2008 1,863.38 9.31 7.39 4.38 2.56 33.93
2009 531.70 14.12 -1.94 12.92 -5.62 11.78
2010 822.24 12.83 9.00 6.64 2.81 29.22
2011 2,223.02 9.64 8.11 3.44 1.71 26.60
1986-2011 620.97 11.75 7.67 6.84 2.51 27.60
Time Trend (+)*** (-)*** (-)** (-)*** (-)* (-)
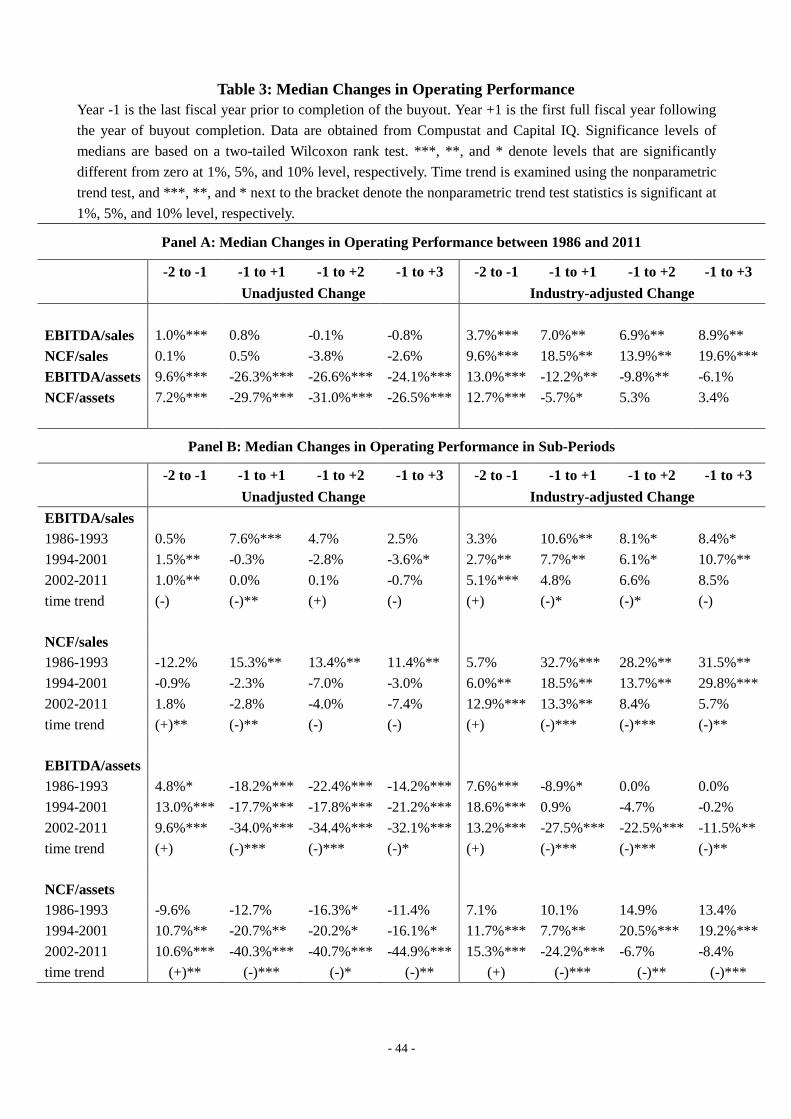
- 44 -
Table 3: Median Changes in Operating Performance
Year -1 is the last fiscal year prior to completion of the buyout. Year +1 is the first full fiscal year following
the year of buyout completion. Data are obtained from Compustat and Capital IQ. Significance levels of
medians are based on a two-tailed Wilcoxon rank test. ***, **, and * denote levels that are significantly
different from zero at 1%, 5%, and 10% level, respectively. Time trend is examined using the nonparametric
trend test, and ***, **, and * next to the bracket denote the nonparametric trend test statistics is significant at
1%, 5%, and 10% level, respectively.
Panel A: Median Changes in Operating Performance between 1986 and 2011
-2 to -1 -1 to +1 -1 to +2 -1 to +3 -2 to -1 -1 to +1 -1 to +2 -1 to +3
Unadjusted Change Industry-adjusted Change
EBITDA/sales 1.0%*** 0.8% -0.1% -0.8% 3.7%*** 7.0%** 6.9%** 8.9%**
NCF/sales 0.1% 0.5% -3.8% -2.6% 9.6%*** 18.5%** 13.9%** 19.6%***
EBITDA/assets 9.6%*** -26.3%*** -26.6%*** -24.1%*** 13.0%*** -12.2%** -9.8%** -6.1%
NCF/assets 7.2%*** -29.7%*** -31.0%*** -26.5%*** 12.7%*** -5.7%* 5.3% 3.4%
Panel B: Median Changes in Operating Performance in Sub-Periods
-2 to -1 -1 to +1 -1 to +2 -1 to +3 -2 to -1 -1 to +1 -1 to +2 -1 to +3
Unadjusted Change Industry-adjusted Change
EBITDA/sales
1986-1993 0.5% 7.6%*** 4.7% 2.5% 3.3% 10.6%** 8.1%* 8.4%*
1994-2001 1.5%** -0.3% -2.8% -3.6%* 2.7%** 7.7%** 6.1%* 10.7%**
2002-2011 1.0%** 0.0% 0.1% -0.7% 5.1%*** 4.8% 6.6% 8.5%
time trend (-) (-)** (+) (-) (+) (-)* (-)* (-)
NCF/sales
1986-1993 -12.2% 15.3%** 13.4%** 11.4%** 5.7% 32.7%*** 28.2%** 31.5%**
1994-2001 -0.9% -2.3% -7.0% -3.0% 6.0%** 18.5%** 13.7%** 29.8%***
2002-2011 1.8% -2.8% -4.0% -7.4% 12.9%*** 13.3%** 8.4% 5.7%
time trend (+)** (-)** (-) (-) (+) (-)*** (-)*** (-)**
EBITDA/assets
1986-1993 4.8%* -18.2%*** -22.4%*** -14.2%*** 7.6%*** -8.9%* 0.0% 0.0%
1994-2001 13.0%*** -17.7%*** -17.8%*** -21.2%*** 18.6%*** 0.9% -4.7% -0.2%
2002-2011 9.6%*** -34.0%*** -34.4%*** -32.1%*** 13.2%*** -27.5%*** -22.5%*** -11.5%**
time trend (+) (-)*** (-)*** (-)* (+) (-)*** (-)*** (-)**
NCF/assets
1986-1993 -9.6% -12.7% -16.3%* -11.4% 7.1% 10.1% 14.9% 13.4%
1994-2001 10.7%** -20.7%** -20.2%* -16.1%* 11.7%*** 7.7%** 20.5%*** 19.2%***
2002-2011 10.6%*** -40.3%*** -40.7%*** -44.9%*** 15.3%*** -24.2%*** -6.7% -8.4%
time trend (+)** (-)*** (-)* (-)** (+) (-)*** (-)** (-)***

- 45 -
Table 4: Leverage, Debt Structure, and Debt Contractual Features
Panel A: Leverage This table presents the annual medians of leverage. Pre- and post-buyout debt, equity, and total assets
are from Compustat and Capital IQ and missing data are filled from SEC filings. Pre-buyout
leverage, post-buyout leverage, and post-buyout equity ratio are calculated using total assets. ***, **,
and * denote that the nonparametric trend test statistics is statistically significant at 1%, 5%, and 10%
level, respectively.
year
(1)
Pre-buyout
Leverage
(%)
(2)
Post-buyout
Leverage
(%)
(3)
Change in
Leverage
(%)
(4)
Compustat
Leverage
Change (%)
(5)
Post-buyout
Equity ratio
(%)
1986 17.07 70.37 48.70 -0.05 6.15
1987 25.74 75.88 51.37 -0.23 2.83
1988 32.03 73.57 37.20 0.20 7.66
1989 29.19 63.80 26.34 0.28 10.65
1990 23.64 44.33 14.45 0.03 23.65
1991 27.72 34.35 6.63 -0.56 39.72
1992 28.34 36.93 8.59 -0.73 35.64
1993 19.89 34.88 14.75 -0.95 49.79
1994 31.90 75.77 39.15 -0.18 8.48
1995 37.53 84.84 27.39 -0.22 16.86
1996 14.00 58.84 44.84 -0.43 26.29
1997 33.66 84.03 52.97 0.09 8.92
1998 33.90 83.18 63.95 0.88 6.57
1999 21.49 82.24 64.86 0.30 5.56
2000 35.77 64.43 28.81 0.22 28.78
2001 54.27 70.90 14.26 0.17 20.40
2002 37.51 57.63 14.06 0.17 29.69
2003 52.40 53.43 11.41 -0.61 27.21
2004 34.32 59.64 30.55 -0.68 19.35
2005 29.03 61.33 34.09 -0.37 18.29
2006 30.54 55.71 25.50 -0.28 17.91
2007 26.74 60.83 34.74 0.15 25.46
2008 41.81 48.73 22.57 1.08 36.63
2009 33.39 26.66 2.50 -1.26 60.17
2010 41.83 54.59 15.40 -0.77 28.29
2011 30.10 53.59 24.92 -0.21 26.22
1986
-2011
31.92 64.35 30.55 -0.15 20.42
Time
Trend
(+) (-)*** (-)** (-) (+)***

- 46 -
Panel B: LBO Debt Structure
This table presents the structure of LBO debt. Data are obtained from Dealscan and Capital IQ at
tranche level. Bank debt includes the revolving credit facilities (revolvers) tranche and the Term
Loan A tranche. Institutional debt includes the Term Loan B, C, and D tranche and the Note tranche.
Junior debt includes the bridge loans and the mezzanine debt. ***, **, and * denote that the
nonparametric trend test statistics is statistically significant at 1%, 5%, and 10% level, respectively.
year
(1)
Revolvers (%)
(2)
Term Loan A (%)
(3)
Bank Debt=(1)+(2)(%)
(4)
Institutional Debt (%)
(5)
Junior Debt (%)
Revolver
to LBO
debt
%with
Revolver
Term A
to LBO
debt
%with
Term A
Bank debt
to LBO
debt
%with
Bank debt
Inst. debt to
LBO debt
%with
Inst. debt
Junior debt
to LBO
debt
%with
Junior debt
1986 60.8 52.2 36.2 34.8 97.0 87.0
1.3 4.3
1987 17.0 36.8 38.8 31.6 55.8 68.4
38.3 23.7
1988 18.6 36.8 20.4 28.5 38.9 65.3
60.5 31.3
1989 10.3 31.9 41.5 30.2 51.8 62.1 1.2 4.3 46.2 27.6
1990 32.1 36.0 19.5 24.0 51.6 60.0
46.4 32.0
1991 39.4 40.0 45.5 40.0 84.8 80.0
15.2 20.0
1992 53.5 50.0 36.6 25.0 90.1 75.0 9.9 25.0
1993 23.1 42.9 76.9 57.1 100.0 100.0
1994 52.2 41.2 36.1 23.5 88.4 64.7 8.3 29.4 3.3 5.9
1995 18.9 27.3 22.5 22.7 41.4 50.0 41.7 40.9
1996 67.6 38.0 15.0 30.0 82.6 68.0 16.5 30.0 0.9 2.0
1997 38.2 38.9 13.3 17.8 51.5 56.7 41.6 35.6 6.4 5.6
1998 26.6 30.6 16.1 21.7 42.7 52.2 48.4 40.8 8.8 5.7
1999 22.9 30.3 21.2 27.0 44.1 57.4 48.3 38.5 7.5 3.3
2000 23.9 37.3 23.6 29.3 47.5 66.7 52.5 32.0
2001 20.7 32.4 29.5 35.3 50.2 67.6 49.8 32.4
2002 21.4 40.6 6.4 25.0 27.8 65.6 37.2 18.8 35.0 16.3
2003 23.4 37.5 12.2 16.7 35.6 54.2 44.3 36.1 20.1 18.3
2004 31.4 44.7 7.5 11.7 39.0 56.4 52.6 36.2 8.5 13.2
2005 20.3 41.9 6.7 13.5 27.0 55.4 37.8 33.8 35.1 15.4
2006 20.4 43.6 13.5 15.4 33.9 59.0 41.2 25.6 24.9 25.4
2007 12.7 33.0 9.7 17.0 22.4 50.0 64.3 35.1 13.3 19.8
2008 12.5 34.1 11.5 20.5 24.0 54.5 52.3 27.3 23.7 28.2
2009 38.6 50.0 61.4 50.0 100.0 100.0
2010 18.1 44.7 2.0 6.4 20.2 51.1 60.5 34.0 19.3 24.9
2011 13.7 34.3 1.2 5.7 14.9 40.0 58.4 37.1 26.8 22.9
1986
-2011 28.4 38.7 24.0 25.4 52.4 64.1 40.3 31.2 20.5 13.3
Time
Trend (-)* (-) (-)** (-)** (-)*** (-)* (+)*** (+) (-) (-)

- 47 -
Panel C: Spread, Maturity, and Loan Covenant
This table presents the median all-in-drawn interest spread over 6-month London Interbank Offered
Rate (LIBOR) in bps, the median maturity (in months) of loans, and the median loan covenants
used in financing the 501 LBOs in my sample. Covenant-lite loans are loans with no financial
maintenance covenants. ***, **, and * denote that the nonparametric trend test statistics is
statistically significant at 1%, 5%, and 10% level, respectively.
Year (1)
Bank
debt
Spread
(2)
Inst.
debt
Spread
(3)
Spread
Diff Inst.
vs Bank
(4)
Bank
debt
Maturity
(months)
(5)
Inst. debt
Maturity
(months)
(6)
Maturity
Diff Inst.
vs Bank
(months)
(7)
Covenant
Intensity
Index
(8)
Modified
Covenant
Intensity
Index
(9)
Cov-lite
Loans
1986 237.5 46 1 (52%) 1
1987 255.7 73 0.5 (34%) 0.5
1988 278.4 69 1 (56%) 1
1989 268.1 450.0 81 98 1 (73%) 1
1990 335.0 75 1 (64%) 1
1991 300.0 56 1 (60%) 1
1992 275.0 36 120 1 (10%) 1
1993 318.8 60 1 (57%) 1
1994 225.0 362.5 87.5 61 101 32 4 (94%) 5
1995 255.0 334.4 75.0 66 104 31 5 (77%) 5 77%
1996 243.7 320.8 66.7 61 98 19 5.5 (86%) 8 26%
1997 246.5 275.0 51.8 74 99 16 5 (74%) 7.5 33%
1998 234.7 276.5 42.1 75 100 16 5 (82%) 9 29%
1999 286.7 353.5 62.9 70 93 18 5 (78%) 10 31%
2000 300.8 353.3 65.5 63 88 21 6 (76%) 8 29%
2001 373.8 356.8 17.5 72 74 12 5 (82%) 8 26%
2002 356.9 333.3 37.5 60 83 18 6 (88%) 9 19%
2003 331.1 373.2 50.0 54 76 7 4 (78%) 6.5 38%
2004 463.6 272.8 -25.0 74 82 -1 5 (95%) 9 22%
2005 402.5 271.0 -50.0 74 80 1 5 (92%) 9 22%
2006 262.3 251.3 0.0 67 81 4 3.5 (80%) 7 40%
2007 366.3 307.6 6.3 74 81 3 3 (89%) 6 39%
2008 302.2 390.0 15.0 76 82 5 1 (64%) 1.5 39%
2009 462.5 48 0 (0%) 0 100%
2010 347.9 441.1 25.0 62 76 9 1 (81%) 1 64%
2011 450.9 473.1 -37.5 75 79 9 1 (77%) 2 54%
1986
-2011
314.6 344.2 28.8 65 88 13 5
(1995-2011)
7
(1995-2011)
34%
Time
Trend
(+)*** (+) (-)** (+) (-)*** (-)** (-)**
(1995-2011)
(-)***
(1995-2011)
(+)*

- 48 -
Table 5: Private Equity Involvement and Reputation
Panel A: Private Equity Involvement
This table presents the involvement of private equity (PE) firms in LBOs over time. Information on PE
firms is from Capital IQ. A firm is a prominent PE if it is listed as the 50 largest PE firms by the Private
Equity International (PEI) magazine from the year 2007 to 2013. I add to the PEI list firms listed in
Appendix A and Forstmann Little and HM Capital Partners that were historically prominent PE firms.
Bank-affiliated PEs are PE firms that are subsidiaries of banks at the time of deal announcement. Club
deals are LBOs with two or more PE firms involved. ***, **, and * denote that the nonparametric trend
test statistics is statistically significant at 1%, 5%, and 10% level, respectively.
Year
(1)
Number of
LBOs
with PE
(2)
Number of
LBOs with
Prominent PE
(3)
Number of LBOs
with Bank-
Affiliated PE
(4)
Number of
Club Deals
(5)
Total Transaction
Value ($million)
of Club Deals
(6)
Max # of
PEs in
the club
1986 10 (83%) 8 (67%) 6 (50%)
1987 9 (75%) 4 (33%) 3 (25%)
1988 21 (58%) 8 (22%) 7 (19%) 1 (3%) 233 (1%) 2
1989 20 (74%) 10 (37%) 10 (37%) 4 (15%) 11,126 (14%) 3
1990 5 (63%) 3 (38%) 1 (13%)
1991 1 (100%)
1992 2 (100%) 1 (50%) 1 (50%) 1 (50%) 723 (87%) 3
1993 1 (25%)
1994 3 (100%) 2 (67%) 1 (33%) 1 (33%) 450 (50%) 2
1995 6 (100%) 5 (83%) 1 (17%)
1996 15 (100%) 6 (40%) 3 (20%) 4 (27%) 3,880 (39%) 3
1997 36 (100%) 16 (44%) 5 (14%) 10 (28%) 5,601 (30%) 3
1998 40 (98%) 21 (51%) 12 (29%) 10 (24%) 7,425 (24%) 4
1999 30 (100%) 16 (53%) 7 (23%) 10 (33%) 5,978 (34%) 3
2000 25 (93%) 9 (33%) 7 (26%) 12 (44%) 8,069 (31%) 4
2001 8 (73%) 3 (27%) 2 (18%) 5 (45%) 2,950 (54%) 3
2002 13 (87%) 6 (40%) 2 (13%) 6 (40%) 2,487 (52%) 4
2003 24 (86%) 18 (64%) 4 (14%) 6 (21%) 5,452 (17%) 3
2004 36 (92%) 24 (62%) 4 (10%) 16 (41%) 17,011 (44%) 4
2005 31 (100%) 20 (65%) 5 (16%) 14 (45%) 47,465 (72%) 7
2006 21 (91%) 15 (65%) 4 (17%) 12 (52%) 72,038 (88%) 4
2007 48 (94%) 35 (69%) 15 (29%) 22 (43%) 179,252 (66%) 5
2008 8 (100%) 7 (88%) 1 (13%) 3 (38%) 49,625 (85%) 3
2009 3 (100%) 1 (33%) 1 (33%) 1 (33%) 6,107 (91%) 4
2010 19 (100%) 12 (63%) 1 (5%) 5 (26%) 5,135 (23%) 3
2011 13 (100%) 11 (85%) 0 (0%) 6 (46%) 18,554 (64%) 3
1986
-2011 448 (89%) 261 (52%) 103 (21%) 149 (30%) 449,562 (50%)
Time
trend (+)*** (+)*** (-) (+)*** (+)*** (+)**
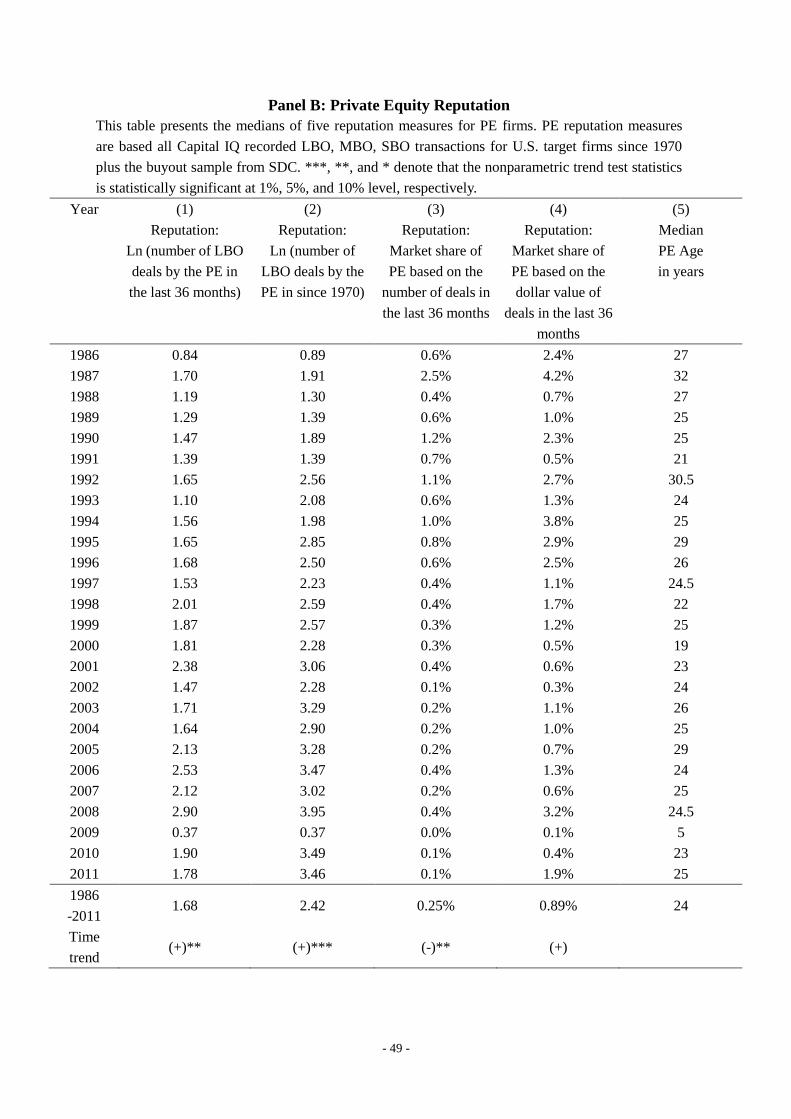
- 49 -
Panel B: Private Equity Reputation
This table presents the medians of five reputation measures for PE firms. PE reputation measures
are based all Capital IQ recorded LBO, MBO, SBO transactions for U.S. target firms since 1970
plus the buyout sample from SDC. ***, **, and * denote that the nonparametric trend test statistics
is statistically significant at 1%, 5%, and 10% level, respectively.
Year (1)
Reputation:
Ln (number of LBO
deals by the PE in
the last 36 months)
(2)
Reputation:
Ln (number of
LBO deals by the
PE in since 1970)
(3)
Reputation:
Market share of
PE based on the
number of deals in
the last 36 months
(4)
Reputation:
Market share of
PE based on the
dollar value of
deals in the last 36
months
(5)
Median
PE Age
in years
1986 0.84 0.89 0.6% 2.4% 27
1987 1.70 1.91 2.5% 4.2% 32
1988 1.19 1.30 0.4% 0.7% 27
1989 1.29 1.39 0.6% 1.0% 25
1990 1.47 1.89 1.2% 2.3% 25
1991 1.39 1.39 0.7% 0.5% 21
1992 1.65 2.56 1.1% 2.7% 30.5
1993 1.10 2.08 0.6% 1.3% 24
1994 1.56 1.98 1.0% 3.8% 25
1995 1.65 2.85 0.8% 2.9% 29
1996 1.68 2.50 0.6% 2.5% 26
1997 1.53 2.23 0.4% 1.1% 24.5
1998 2.01 2.59 0.4% 1.7% 22
1999 1.87 2.57 0.3% 1.2% 25
2000 1.81 2.28 0.3% 0.5% 19
2001 2.38 3.06 0.4% 0.6% 23
2002 1.47 2.28 0.1% 0.3% 24
2003 1.71 3.29 0.2% 1.1% 26
2004 1.64 2.90 0.2% 1.0% 25
2005 2.13 3.28 0.2% 0.7% 29
2006 2.53 3.47 0.4% 1.3% 24
2007 2.12 3.02 0.2% 0.6% 25
2008 2.90 3.95 0.4% 3.2% 24.5
2009 0.37 0.37 0.0% 0.1% 5
2010 1.90 3.49 0.1% 0.4% 23
2011 1.78 3.46 0.1% 1.9% 25
1986
-2011 1.68 2.42 0.25% 0.89% 24
Time
trend (+)** (+)*** (-)** (+)
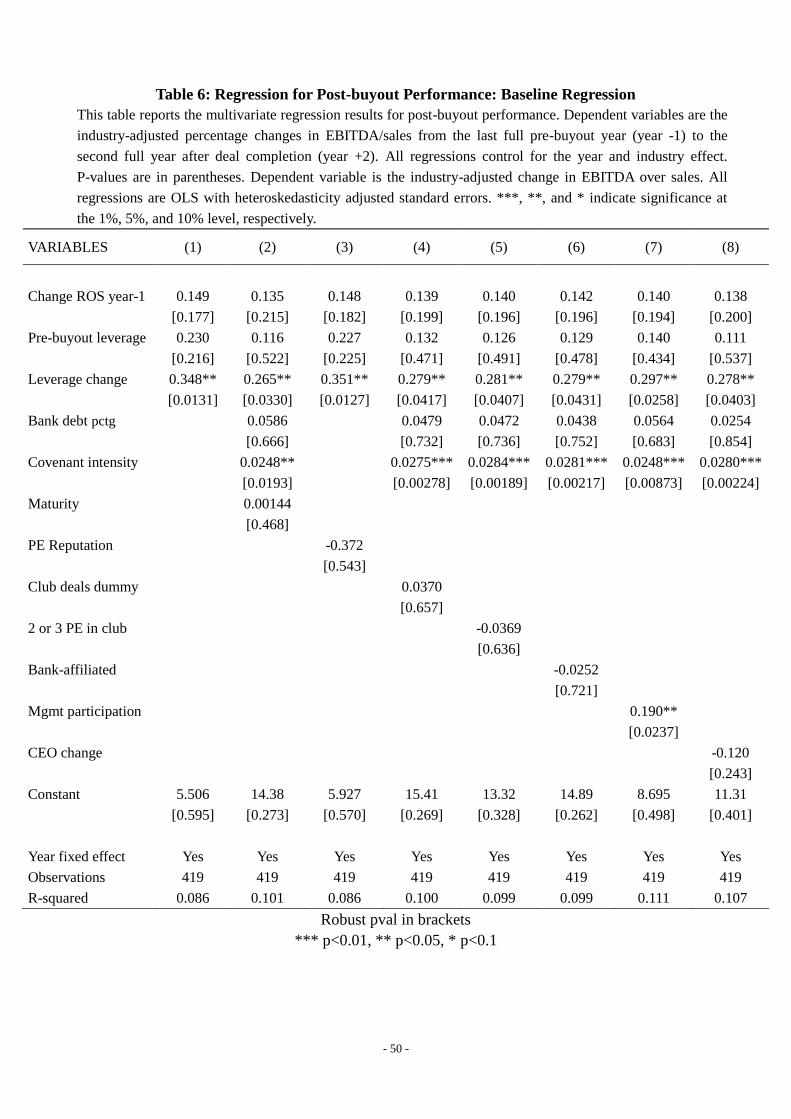
- 50 -
Table 6: Regression for Post-buyout Performance: Baseline Regression
This table reports the multivariate regression results for post-buyout performance. Dependent variables are the
industry-adjusted percentage changes in EBITDA/sales from the last full pre-buyout year (year -1) to the
second full year after deal completion (year +2). All regressions control for the year and industry effect.
P-values are in parentheses. Dependent variable is the industry-adjusted change in EBITDA over sales. All
regressions are OLS with heteroskedasticity adjusted standard errors. ***, **, and * indicate significance at
the 1%, 5%, and 10% level, respectively.
VARIABLES (1) (2) (3) (4) (5) (6) (7) (8)
Change ROS year-1 0.149 0.135 0.148 0.139 0.140 0.142 0.140 0.138
[0.177] [0.215] [0.182] [0.199] [0.196] [0.196] [0.194] [0.200]
Pre-buyout leverage 0.230 0.116 0.227 0.132 0.126 0.129 0.140 0.111
[0.216] [0.522] [0.225] [0.471] [0.491] [0.478] [0.434] [0.537]
Leverage change 0.348** 0.265** 0.351** 0.279** 0.281** 0.279** 0.297** 0.278**
[0.0131] [0.0330] [0.0127] [0.0417] [0.0407] [0.0431] [0.0258] [0.0403]
Bank debt pctg 0.0586 0.0479 0.0472 0.0438 0.0564 0.0254
[0.666] [0.732] [0.736] [0.752] [0.683] [0.854]
Covenant intensity 0.0248** 0.0275*** 0.0284*** 0.0281*** 0.0248*** 0.0280***
[0.0193] [0.00278] [0.00189] [0.00217] [0.00873] [0.00224]
Maturity 0.00144
[0.468]
PE Reputation -0.372
[0.543]
Club deals dummy 0.0370
[0.657]
2 or 3 PE in club -0.0369
[0.636]
Bank-affiliated -0.0252
[0.721]
Mgmt participation 0.190**
[0.0237]
CEO change -0.120
[0.243]
Constant 5.506 14.38 5.927 15.41 13.32 14.89 8.695 11.31
[0.595] [0.273] [0.570] [0.269] [0.328] [0.262] [0.498] [0.401]
Year fixed effect Yes Yes Yes Yes Yes Yes Yes Yes
Observations 419 419 419 419 419 419 419 419
R-squared 0.086 0.101 0.086 0.100 0.099 0.099 0.111 0.107
Robust pval in brackets
*** p<0.01, ** p<0.05, * p<0.1
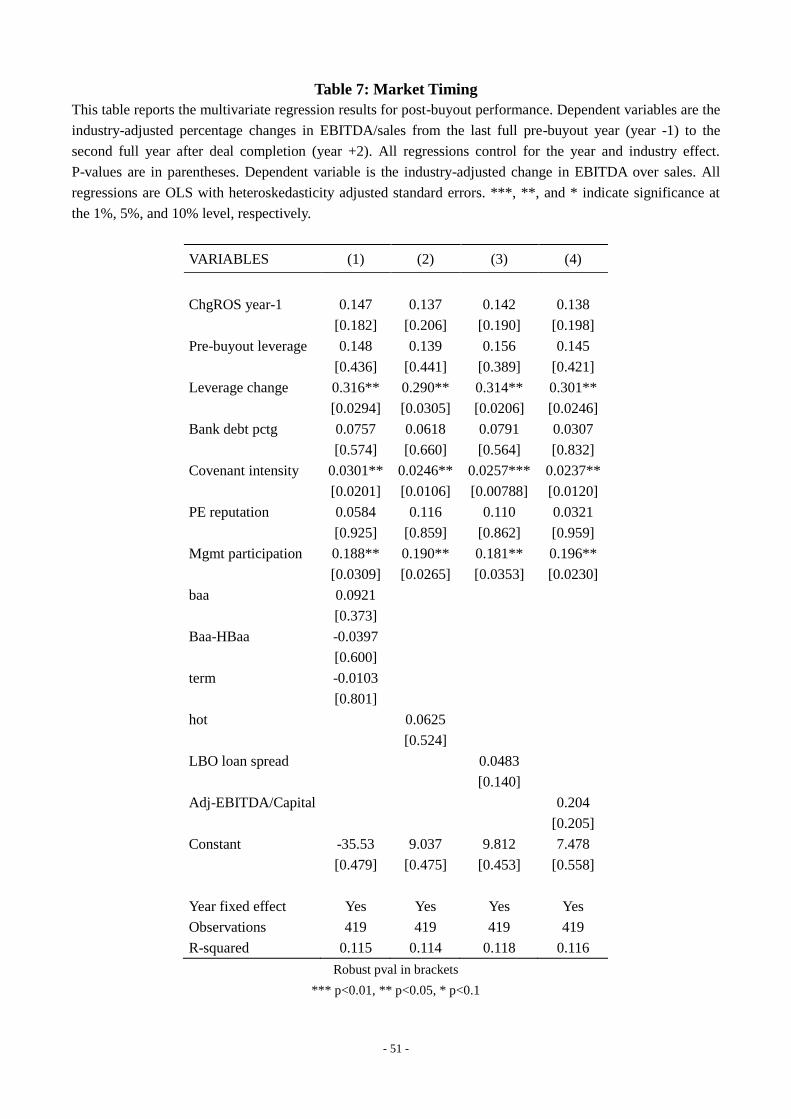
- 51 -
Table 7: Market Timing
This table reports the multivariate regression results for post-buyout performance. Dependent variables are the
industry-adjusted percentage changes in EBITDA/sales from the last full pre-buyout year (year -1) to the
second full year after deal completion (year +2). All regressions control for the year and industry effect.
P-values are in parentheses. Dependent variable is the industry-adjusted change in EBITDA over sales. All
regressions are OLS with heteroskedasticity adjusted standard errors. ***, **, and * indicate significance at
the 1%, 5%, and 10% level, respectively.
VARIABLES (1) (2) (3) (4)
ChgROS year-1 0.147 0.137 0.142 0.138
[0.182] [0.206] [0.190] [0.198]
Pre-buyout leverage 0.148 0.139 0.156 0.145
[0.436] [0.441] [0.389] [0.421]
Leverage change 0.316** 0.290** 0.314** 0.301**
[0.0294] [0.0305] [0.0206] [0.0246]
Bank debt pctg 0.0757 0.0618 0.0791 0.0307
[0.574] [0.660] [0.564] [0.832]
Covenant intensity 0.0301** 0.0246** 0.0257*** 0.0237**
[0.0201] [0.0106] [0.00788] [0.0120]
PE reputation 0.0584 0.116 0.110 0.0321
[0.925] [0.859] [0.862] [0.959]
Mgmt participation 0.188** 0.190** 0.181** 0.196**
[0.0309] [0.0265] [0.0353] [0.0230]
baa 0.0921
[0.373]
Baa-HBaa -0.0397
[0.600]
term -0.0103
[0.801]
hot 0.0625
[0.524]
LBO loan spread 0.0483
[0.140]
Adj-EBITDA/Capital 0.204
[0.205]
Constant -35.53 9.037 9.812 7.478
[0.479] [0.475] [0.453] [0.558]
Year fixed effect Yes Yes Yes Yes
Observations 419 419 419 419
R-squared 0.115 0.114 0.118 0.116
Robust pval in brackets
*** p<0.01, ** p<0.05, * p<0.1

- 52 -
Table 8: LBO Year and Exit Strategy
This table presents the post-buyout outcomes as of June 30, 2013. The number of observations is reported,
followed in parentheses by the proportion of the outcome in all LBOs each year.
LBO
Year
(1)
Bankruptcy
(2)
IPO
(3)
Acquired
by Corp
(4)
Secondary
LBOs
(5)
still private
(6)
Unknown
1986 5 41.7% 3 25.0% 2 16.7% 2 16.7% 0 0.0% 0 0.0%
1987 6 50.0% 4 33.3% 1 8.3% 1 8.3% 0 0.0% 0 0.0%
1988 8 22.2% 19 52.8% 6 16.7% 2 5.6% 0 0.0% 1 2.8%
1989 6 22.2% 6 22.2% 11 40.7% 2 7.4% 1 3.7% 1 3.7%
1990 0 0.0% 3 37.5% 3 37.5% 0 0.0% 0 0.0% 2 25.0%
1991 1 100.0% 0 0.0% 0 0.0% 0 0.0% 0 0.0% 0 0.0%
1992 0 0.0% 0 0.0% 1 50.0% 1 50.0% 0 0.0% 0 0.0%
1993 0 0.0% 1 25.0% 1 25.0% 1 25.0% 0 0.0% 1 25.0%
1994 0 0.0% 2 66.7% 1 33.3% 0 0.0% 0 0.0% 0 0.0%
1995 0 0.0% 3 50.0% 2 33.3% 1 16.7% 0 0.0% 0 0.0%
1996 6 40.0% 6 40.0% 1 6.7% 2 13.3% 0 0.0% 0 0.0%
1997 7 19.4% 15 41.7% 7 19.4% 5 13.9% 1 2.8% 1 2.8%
1998 10 24.4% 11 26.8% 11 26.8% 7 17.1% 2 4.9% 0 0.0%
1999 6 20.0% 15 50.0% 5 16.7% 3 10.0% 1 3.3% 0 0.0%
2000 2 7.4% 8 29.6% 11 40.7% 3 11.1% 1 3.7% 2 7.4%
2001 1 9.1% 1 9.1% 1 9.1% 6 54.5% 1 9.1% 1 9.1%
2002 2 13.3% 6 40.0% 1 6.7% 5 33.3% 1 6.7% 0 0.0%
2003 2 7.1% 11 39.3% 4 14.3% 8 28.6% 3 10.7% 0 0.0%
2004 6 15.4% 23 59.0% 5 12.8% 2 5.1% 3 7.7% 0 0.0%
2005 3 9.7% 17 54.8% 4 12.9% 2 6.5% 5 16.1% 0 0.0%
2006 5 21.7% 5 21.7% 1 4.3% 3 13.0% 8 34.8% 1 4.4%
2007 6 11.8% 13 25.5% 4 7.8% 2 3.9% 26 51% 0 0.0%
2008 0 0.0% 2 25.0% 0 0.0% 0 0.0% 6 75.0% 0 0.0%
2009 0 0.0% 1 33.3% 1 33.3% 0 0.0% 1 33.3% 0 0.0%
2010 0 0.0% 2 10.5% 1 5.3% 1 5.3% 15 78.9% 0 0.0%
2011 1 7.7% 0 0.0% 0 0.0% 0 0.0% 12 92.3% 0 0.0%
Total 83 16.6% 177 35.3% 85 17.0% 59 11.8% 87 17.4% 10 2.0%
Months to
Outcome
Median(mean) 43 (49.5) 36 (39.5) 50 (57.9) 44 (48.6)
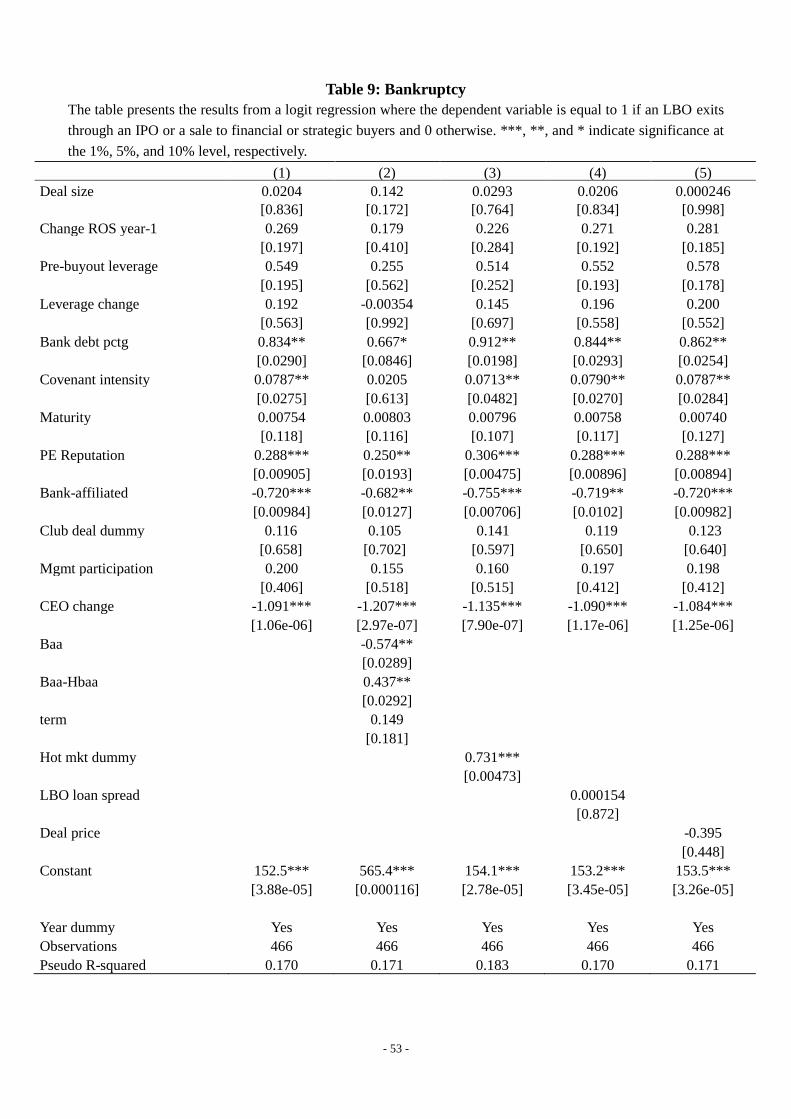
- 53 -
Table 9: Bankruptcy
The table presents the results from a logit regression where the dependent variable is equal to 1 if an LBO exits
through an IPO or a sale to financial or strategic buyers and 0 otherwise. ***, **, and * indicate significance at
the 1%, 5%, and 10% level, respectively.
(1) (2) (3) (4) (5)
Deal size 0.0204 0.142 0.0293 0.0206 0.000246
[0.836] [0.172] [0.764] [0.834] [0.998]
Change ROS year-1 0.269 0.179 0.226 0.271 0.281
[0.197] [0.410] [0.284] [0.192] [0.185]
Pre-buyout leverage 0.549 0.255 0.514 0.552 0.578
[0.195] [0.562] [0.252] [0.193] [0.178]
Leverage change 0.192 -0.00354 0.145 0.196 0.200
[0.563] [0.992] [0.697] [0.558] [0.552]
Bank debt pctg 0.834** 0.667* 0.912** 0.844** 0.862**
[0.0290] [0.0846] [0.0198] [0.0293] [0.0254]
Covenant intensity 0.0787** 0.0205 0.0713** 0.0790** 0.0787**
[0.0275] [0.613] [0.0482] [0.0270] [0.0284]
Maturity 0.00754 0.00803 0.00796 0.00758 0.00740
[0.118] [0.116] [0.107] [0.117] [0.127]
PE Reputation 0.288*** 0.250** 0.306*** 0.288*** 0.288***
[0.00905] [0.0193] [0.00475] [0.00896] [0.00894]
Bank-affiliated -0.720*** -0.682** -0.755*** -0.719** -0.720***
[0.00984] [0.0127] [0.00706] [0.0102] [0.00982]
Club deal dummy 0.116 0.105 0.141 0.119 0.123
[0.658] [0.702] [0.597] [0.650] [0.640]
Mgmt participation 0.200 0.155 0.160 0.197 0.198
[0.406] [0.518] [0.515] [0.412] [0.412]
CEO change -1.091*** -1.207*** -1.135*** -1.090*** -1.084***
[1.06e-06] [2.97e-07] [7.90e-07] [1.17e-06] [1.25e-06]
Baa -0.574**
[0.0289]
Baa-Hbaa 0.437**
[0.0292]
term 0.149
[0.181]
Hot mkt dummy 0.731***
[0.00473]
LBO loan spread 0.000154
[0.872]
Deal price -0.395
[0.448]
Constant 152.5*** 565.4*** 154.1*** 153.2*** 153.5***
[3.88e-05] [0.000116] [2.78e-05] [3.45e-05] [3.26e-05]
Year dummy Yes Yes Yes Yes Yes
Observations 466 466 466 466 466
Pseudo R-squared 0.170 0.171 0.183 0.170 0.171

- 54 -
Figure 1: A typical LBO Transaction and Hypotheses in LBO Value Creation
H1.2: Lenders’ Monitoring (bank loan proportion, covenant, maturity)
H2.3: Bank-affiliated LBO
H1: Debt Disciplining Hypothesis
H2.1: Private Equity Reputation;
H2.2: Club Deals
H3: Management Participation (CEO change)
Debt
Equity Equity Investors
Private Equity firms
Management of Targets
Lenders
Banks
Institutional investors
Public debt holders
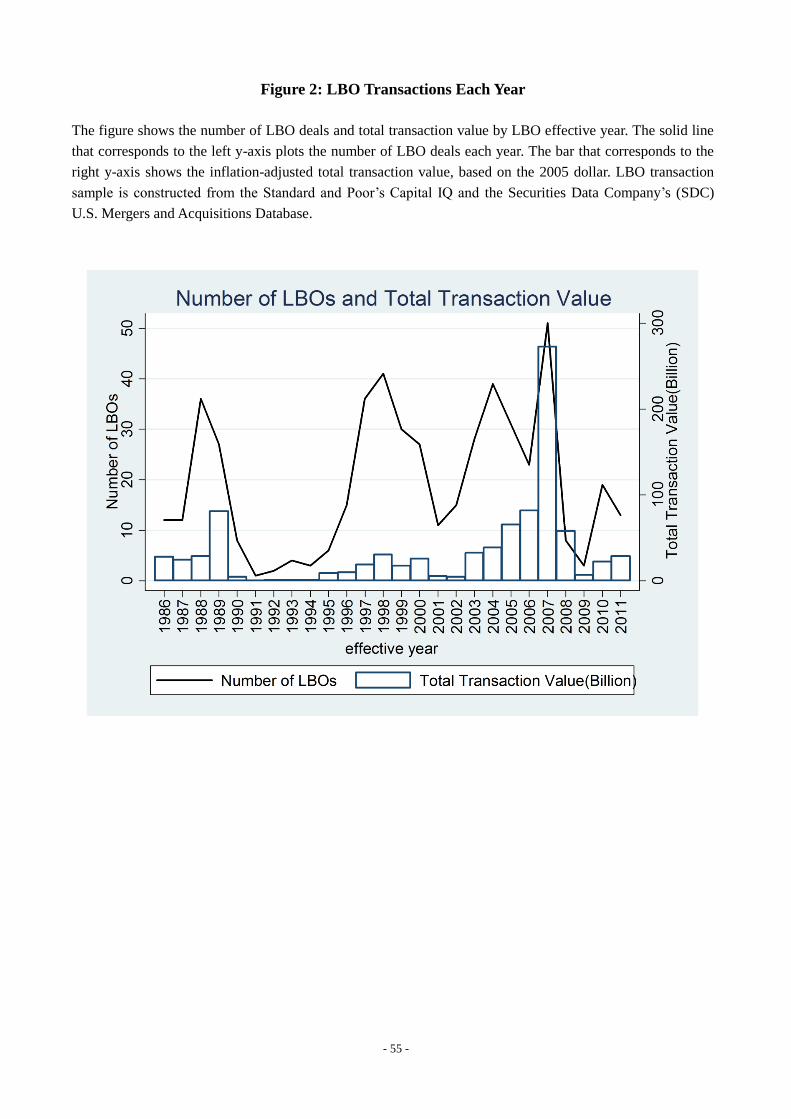
- 55 -
Figure 2: LBO Transactions Each Year
The figure shows the number of LBO deals and total transaction value by LBO effective year. The solid line
that corresponds to the left y-axis plots the number of LBO deals each year. The bar that corresponds to the
right y-axis shows the inflation-adjusted total transaction value, based on the 2005 dollar. LBO transaction
sample is constructed from the Standard and Poor’s Capital IQ and the Securities Data Company’s (SDC)
U.S. Mergers and Acquisitions Database.
