debugging -...
TRANSCRIPT

CHARLES UNIVERSITY IN PRAGUE
http://d3s.mff.cuni.cz
faculty of mathematics and physics faculty of mathematics and physics
Debugging
Pavel Parízek [email protected]

Motivation
Nástroje pro vývoj software Debugging 2
When some test fails
You know there is a bug in the program code
You do not know the root cause of the bug
Testing detects presence of bugs in the code
But you still have to find them and eliminate properly
Writing tests for smaller units of code does not help
Too much work with a little benefit (bad “cost-effect” ratio)
Solution: debugging

Debugging
Nástroje pro vývoj software Debugging 3
Manual process Monitoring execution of a given program
Inspecting and updating the current state
Tool support Stop and restart program execution
Manage breakpoints (set, delete)
Inspect and update memory content e.g., the current values of program variables
Attach debugger to a running program

Important concepts
Nástroje pro vývoj software Debugging 4
Breakpoint Source code location where the program execution is stopped intentionally
Additional conditions may have to be also satisfied total number of hits, the current value of a program variable
Types: HW (CPU, fast, limited), SW (interrupt, slow)
Core dump Full memory image of the crashed process
heap objects and fields, registers, stack trace of each thread
Records the full program state upon crash

Basic approaches
Nástroje pro vývoj software Debugging 5
Printing debug messages Add many print statements into your code
System.out.println(“[DEBUG] MyObj.doSmth: arg1 = “ + arg1 + “, v = “ + v + “, data = “ + this.data);
Read huge log files (search for text patterns) Useful when you need lot of data at the same time
“Online” debuggers
Control program execution and inspect current state Basic tools: GDB, DDD, jdb, JPDA, WinDbg, KD, CDB IDE support: Visual Studio, Eclipse, NetBeans, IDEA

GNU Debugger (GDB)
Nástroje pro vývoj software Debugging 6

GNU Debugger (GDB)
Nástroje pro vývoj software Debugging 7
User interface: command-line
Intended for Unix-like systems Low-level system software written in C/C++
Examples: utilities, web server, operating system kernel
Supports many languages C, C++, Ada, Pascal, Objective-C, ...
Web site http://www.sourceware.org/gdb/
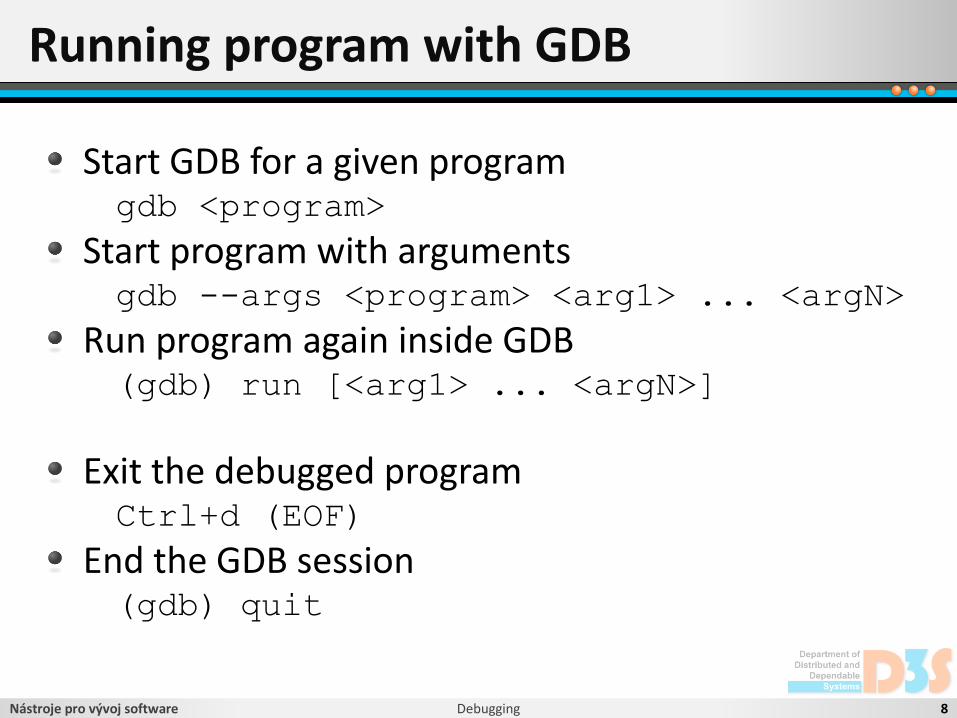
Running program with GDB
Nástroje pro vývoj software Debugging 8
Start GDB for a given program gdb <program>
Start program with arguments gdb --args <program> <arg1> ... <argN>
Run program again inside GDB (gdb) run [<arg1> ... <argN>]
Exit the debugged program Ctrl+d (EOF)
End the GDB session (gdb) quit

Breakpoints
Nástroje pro vývoj software Debugging 9
Define breakpoint (gdb) break <function name>
(gdb) break <line number>
(gdb) break <filename>:<line>
Continue execution (gdb) continue
Shortcut: (gdb) c

Breakpoints
Nástroje pro vývoj software Debugging 10
List of breakpoints (gdb) info breakpoints
Disable breakpoint (gdb) disable <num>
Enable breakpoint (gdb) enable <num>
Delete breakpoint (gdb) delete <num>

Single stepping
Nástroje pro vývoj software Debugging 11
Advance to the next source line (gdb) step [count]
Shortcut: (gdb) s
Advance to the next line in the current scope (gdb) next [count]
Shortcut: (gdb) n

Task 1
Nástroje pro vývoj software Debugging 12
Example http://d3s.mff.cuni.cz/teaching/software_development_tools/files/sudoku.tgz
Build with Make (sets flags “-g -Wall -O0”)
Run via the command ./sudoku vstup.txt
Try basic features run a program in debugger
breakpoints management
single stepping commands

Information about the debugged program
Nástroje pro vývoj software Debugging 13
Source code lines (gdb) list
(gdb) list <linenum>
Symbol table (gdb) info scope <function name>
(gdb) info source
(gdb) info functions
(gdb) info variables
(gdb) info locals

Information about program variables
Nástroje pro vývoj software Debugging 14
Values (gdb) print <expression>
Example: (gdb) print argv[1]
Shortcut: (gdb) p
Types (gdb) whatis <variable name>
(gdb) ptype <variable name>

Inspecting the call stack frames
Nástroje pro vývoj software Debugging 15
Print call stack (gdb) backtrace
Shortcut: (gdb) bt
Including local variables (gdb) bt full
Selecting frames
Move frame up: (gdb) up [n]
Move down: (gdb) down [n]

Changing expression values
Nástroje pro vývoj software Debugging 16
Make changes (gdb) set var <expr> = <new value>
(gdb) print <expr> = <new value>
Watch for changes (data breakpoint) (gdb) watch <expression>
List all watchpoints (gdb) info watchpoints

Task 2
Nástroje pro vývoj software Debugging 17
Try other features of debuggers (GDB)
Printing some information about the program
Printing information about program variables
Inspecting the call stack and switching frames
Changing values of selected program variables

Core dumps
Nástroje pro vývoj software Debugging 18
Set maximum size of core files ulimit -c unlimited
Analyze the core dump file (“core”) gdb <program binary> <core dump>
Attach to already running process gdb <program binary> <process ID>

Advanced features of GDB
Nástroje pro vývoj software Debugging 19
Calling functions and jumps
Breakpoint command list
Support for multi-threading
Reverse execution
Record and replay
Remote debugging
GUI frontend: DDD http://www.gnu.org/software/ddd

Concurrency
Nástroje pro vývoj software Debugging 20
Debuggers support multi-threaded programs
Including GDB
Problems
Programs behave differently when running in the debugger than in normal execution
Different internal timing of concurrent events
It is hard to find concurrency bugs with debuggers

Debugging tools for Windows/.NET
Nástroje pro vývoj software Debugging 21
Visual Studio debugger Supported languages: C#, Visual Basic, ASP .NET
Advanced features: edit & continue, attach to running process, scriptability
No support for debugging kernel space code
Other tools Windows debuggers (Windows SDK, WDK)
http://msdn.microsoft.com/library/windows/hardware/ff551063.aspx
http://msdn.microsoft.com/en-us/library/windows/hardware/hh406271.aspx
Tools: WinDbg, KD, CDB, Psscor4, various utilities
GDB-based: Visual Studio GDB Debugger, Visual GDB

Automated run-time checking
Nástroje pro vývoj software Debugging 22
Idea: search for bugs during program execution
Main approaches Replacing libraries with debugging versions
Program linked with special versions of some library functions
Library functions (malloc, free, ...) perform runtime checks
Force program to crash upon a detected memory access error
Supported errors: buffer overflows, leaks, using freed memory
Tools: Dmalloc, DUMA
Monitoring execution of an instrumented program and looking for specific errors
Tools: Valgrind

Valgrind
Nástroje pro vývoj software Debugging 23
Generic framework for creating runtime checkers (error detectors)
Supported platforms Linux: x86, x86-64, PowerPC
Android (x86, ARM), OS X
Basic principle: dynamic binary instrumentation
Includes several tools MemCheck: detects memory management errors
Helgrind: detects errors in thread synchronization

Running
Nástroje pro vývoj software Debugging 24
Command line: valgrind <program> <arguments>
Recommended compiler flags to use -g -O0 -Wall -fno-inline
Avoid optimizations (-O1,-O2) when using Valgrind to detect errors in your program

MemCheck
Nástroje pro vývoj software Debugging 25
Running valgrind [--tool=memcheck] <program>
Supported errors Accessing freed memory blocks
Reading uninitialized variables
Double-freeing of heap blocks
Memory leaks (missing “free”)
How to enable leak detection valgrind --leak-check=yes <program>

MemCheck: output
Nástroje pro vývoj software Debugging 26
Buffer overflow == 2456 == Invalid write of size 4
== 2456 == at 0x204A68D: myfunc (myprog.c:95)
== 2456 == at 0x204A120: main (myprog.c:14)
== 2456 == Address 0x2684FF0 is 8 bytes after a block of
size 64 alloc’d
== 2456 == at 0x2684FA8: malloc (vg_replace_malloc.c:130)
== 2456 == by 0x204A0E8: main(myproc.c:10)
Memory leak == 1789 == 32 bytes in 1 blocks are definitely lost in loss
record 1 of 1
== 1789 == at 0x2F4482D: malloc (vg_replace_malloc.c:130)
== 1789 == at 0x204A692: myfunc (myprog.c:112)
== 1789 == at 0x204A130: main (myprog.c:20)
PID
kind of error stacktrace identifies the point where the error occurred
description of the memory address involved in the error
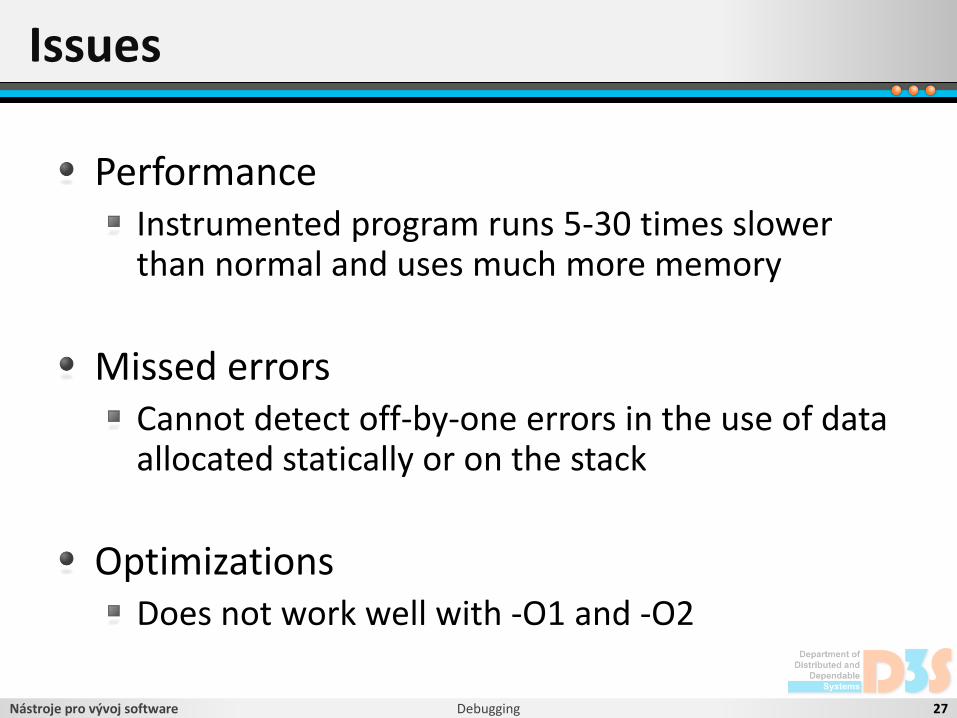
Issues
Nástroje pro vývoj software Debugging 27
Performance Instrumented program runs 5-30 times slower than normal and uses much more memory
Missed errors Cannot detect off-by-one errors in the use of data allocated statically or on the stack
Optimizations Does not work well with -O1 and -O2

Task 3
Nástroje pro vývoj software Debugging 28
Try using MemCheck on the sudoku program
Inspect reported warnings (memory leaks)
Try using Valgrind on some programs in the Linux distribution (ls, cat, ...) and on your simple programs in C/C++

Advanced topics
Nástroje pro vývoj software Debugging 29
Suppressions Ignoring reported false positives and errors found in system libraries
Useful options --read-var-info=yes
Information about variables (name, type, location)
--track-origins=yes
Shows where the uninitialized variables come from
Connecting Valgrind with GDB

Links
Nástroje pro vývoj software Debugging 30
GDB http://www.sourceware.org/gdb
jdb: The Java Debugger http://docs.oracle.com/javase/8/docs/technotes/tools/unix/jdb.html
Dmalloc http://dmalloc.com
DUMA http://sourceforge.net/projects/duma
Valgrind http://valgrind.org/

Homework
Nástroje pro vývoj software Debugging 31
Assignment
http://d3s.mff.cuni.cz/~parizek/teaching/sdt/
Deadline
27.11.2017 / 7.12.2017