debugging in a multiple-activities contextheather.cs.ucdavis.edu/~matloff/158/chapter5.pdfchapter 6...
TRANSCRIPT

Chapter 6
Debugging In AMultiple-Activities Context
Debugging is difficult to begin with, and it becomes even more challenging whenthe misbehaving application is trying to coordinate multiple, simultaneous activi-ties: client/server network programming, programming with threads, and parallelprocessing are examples of this paradigm. This chapter presents an overview of themost commonly used multiprogramming techniques and offers some tips on howto deal with bugs in these kinds of programs, focusing on the use of GDB/DDD inthe debugging process.
6.1 Debugging Client/Server Network Programs
Computer networks are extremely complex systems, and rigorous debugging ofnetworked software applications can sometimes require the use of hardware moni-tors to collect detailed information about the network traffic. An entire book couldbe written on this debugging topic alone. Our goal here is simply to introduce thesubject.
Our example consists of the following client/server pair. The client applicationallows a user to check the load on the machine on which the server applicationruns, even if the user does not have an account on the latter machine. The clientsends a request for information to the server—here, a query about the load on theserver’s system, via the Unix w command—over a network connection. The serverthen processes the request and returns the results, capturing the output of w and
1
sending it back over the connection. In general, a server can accept requests frommultiple remote clients; to keep things simple in our example, we assume there isonly instance of the client.
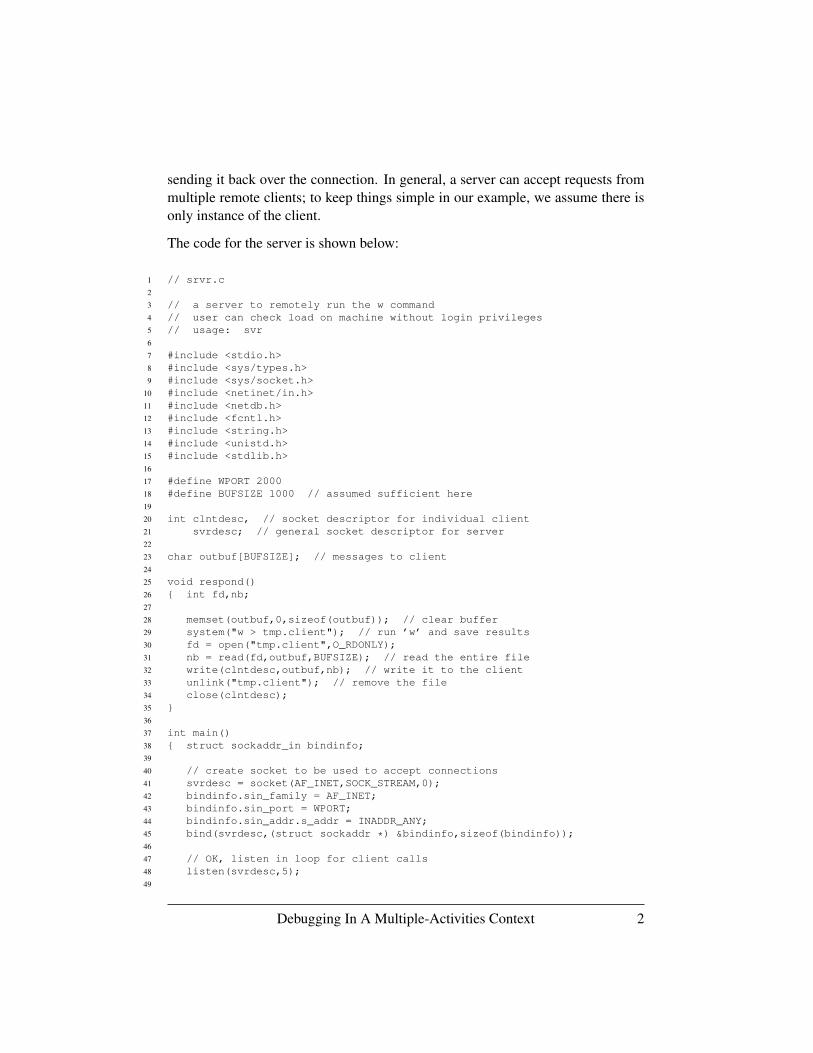
The code for the server is shown below:
1 // srvr.c2
3 // a server to remotely run the w command4 // user can check load on machine without login privileges5 // usage: svr6
7 #include <stdio.h>8 #include <sys/types.h>9 #include <sys/socket.h>
10 #include <netinet/in.h>11 #include <netdb.h>12 #include <fcntl.h>13 #include <string.h>14 #include <unistd.h>15 #include <stdlib.h>16
17 #define WPORT 200018 #define BUFSIZE 1000 // assumed sufficient here19
20 int clntdesc, // socket descriptor for individual client21 svrdesc; // general socket descriptor for server22
23 char outbuf[BUFSIZE]; // messages to client24
25 void respond()26 { int fd,nb;27
28 memset(outbuf,0,sizeof(outbuf)); // clear buffer29 system("w > tmp.client"); // run ’w’ and save results30 fd = open("tmp.client",O_RDONLY);31 nb = read(fd,outbuf,BUFSIZE); // read the entire file32 write(clntdesc,outbuf,nb); // write it to the client33 unlink("tmp.client"); // remove the file34 close(clntdesc);35 }36
37 int main()38 { struct sockaddr_in bindinfo;39
40 // create socket to be used to accept connections41 svrdesc = socket(AF_INET,SOCK_STREAM,0);42 bindinfo.sin_family = AF_INET;43 bindinfo.sin_port = WPORT;44 bindinfo.sin_addr.s_addr = INADDR_ANY;45 bind(svrdesc,(struct sockaddr *) &bindinfo,sizeof(bindinfo));46
47 // OK, listen in loop for client calls48 listen(svrdesc,5);49
Debugging In A Multiple-Activities Context 2

50 while (1) {51 // wait for a call52 clntdesc = accept(svrdesc,0,0);53 // process the command54 respond();55 }56 }
Here is the code for the client:
1 // clnt.c2
3 // usage: clnt server_machine4
5 #include <stdio.h>6 #include <sys/types.h>7 #include <sys/socket.h>8 #include <netinet/in.h>9 #include <netdb.h>
10 #include <string.h>11 #include <unistd.h>12
13 #define WPORT 2000 // server port number14 #define BUFSIZE 100015
16 int main(int argc, char **argv)17 { int sd,msgsize;18
19 struct sockaddr_in addr;20 struct hostent *hostptr;21 char buf[BUFSIZE];22
23 // create socket24 sd = socket(AF_INET,SOCK_STREAM,0);25 addr.sin_family = AF_INET;26 addr.sin_port = WPORT;27 hostptr = gethostbyname(argv[1]);28 memcpy(&addr.sin_addr.s_addr,hostptr->h_addr_list[0],hostptr->h_length);29
30 // OK, now connect31 connect(sd,(struct sockaddr *) &addr,sizeof(addr));32
33 // read and display response34 msgsize = read(sd,buf,BUFSIZE);35 if (msgsize > 0)36 write(1,buf,msgsize);37 printf("\n");38 return 0;39 }
For those unfamiliar with client/server programming, here is an overview of howthe programs work:
Debugging In A Multiple-Activities Context 3
On line 41 of the server code, we create a socket, which is an abstraction similarto a file descriptor; just as one uses a file descriptor to perform I/O operations on afilesystem object, one reads from and writes to a network connection via a socket.On line 45, the socket is bound to a specific port number, arbitrarily chosen to be2000. (User-level applications such as this one are restricted to port numbers of1024 and higher.) This number identifies a “mailbox” on the server’s system towhich clients send requests to be processed for this particular application.
The server “opens for business” by calling listen() on line 48. It then waitsfor a client request to come in, by calling accept() on line 52. That call blocksuntil a request arrives. It then returns a new socket for communicating with theclient. (When there are multiple clients, the original socket continues to acceptnew requests even while an existing request is being serviced, hence the need forseparate sockets. This would require the server to be implemented in a threadedfashion.) The server processes the client request with the respond() functionand sends the machine load information to the client by locally invoking the wcommand and writing the results to the socket in line 32.
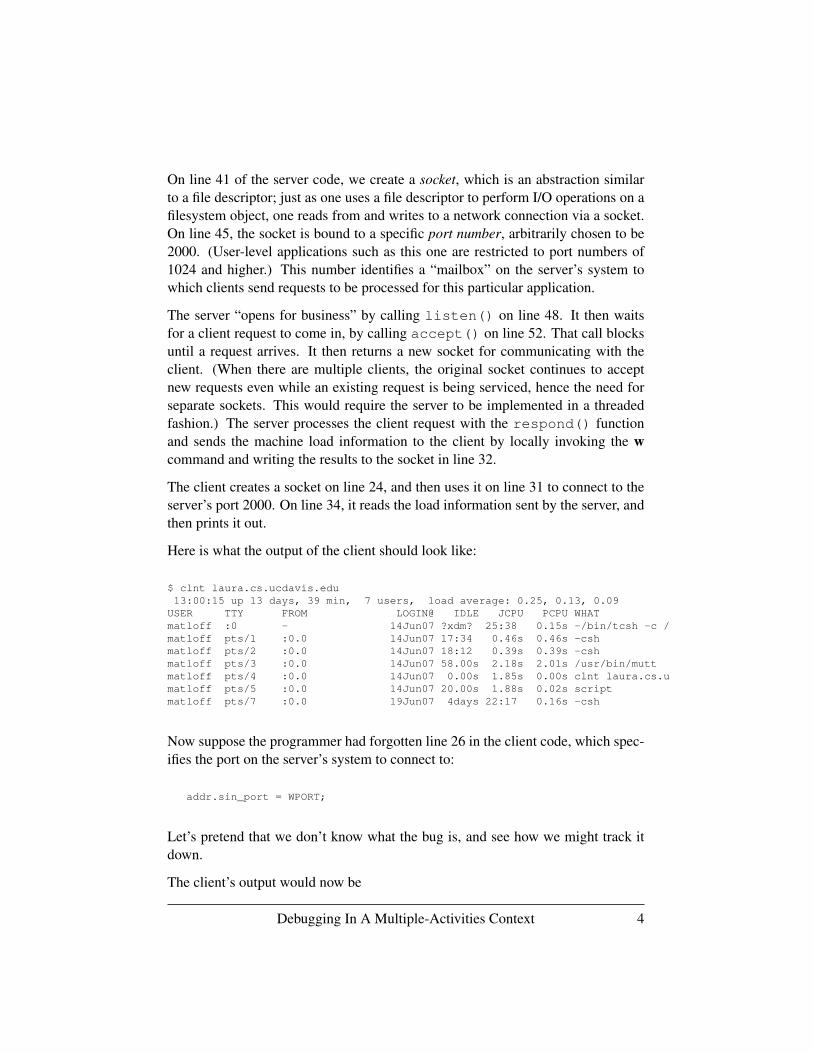
The client creates a socket on line 24, and then uses it on line 31 to connect to theserver’s port 2000. On line 34, it reads the load information sent by the server, andthen prints it out.
Here is what the output of the client should look like:
$ clnt laura.cs.ucdavis.edu13:00:15 up 13 days, 39 min, 7 users, load average: 0.25, 0.13, 0.09
USER TTY FROM LOGIN@ IDLE JCPU PCPU WHATmatloff :0 - 14Jun07 ?xdm? 25:38 0.15s -/bin/tcsh -c /matloff pts/1 :0.0 14Jun07 17:34 0.46s 0.46s -cshmatloff pts/2 :0.0 14Jun07 18:12 0.39s 0.39s -cshmatloff pts/3 :0.0 14Jun07 58.00s 2.18s 2.01s /usr/bin/muttmatloff pts/4 :0.0 14Jun07 0.00s 1.85s 0.00s clnt laura.cs.umatloff pts/5 :0.0 14Jun07 20.00s 1.88s 0.02s scriptmatloff pts/7 :0.0 19Jun07 4days 22:17 0.16s -csh
Now suppose the programmer had forgotten line 26 in the client code, which spec-ifies the port on the server’s system to connect to:
addr.sin_port = WPORT;
Let’s pretend that we don’t know what the bug is, and see how we might track itdown.
The client’s output would now be
Debugging In A Multiple-Activities Context 4

$ clnt laura.cs.ucdavis.edu
$
It appears that the client received nothing at all back from the server. This of coursecould be due to a variety of causes, in either the server or the client, or both.
Let’s take a look around, using GDB. First, let’s check to see that the client actu-ally did succeed in connecting to the server. We’ll set a breakpoint at the call toconnect(), and run the program:
(gdb) b 31Breakpoint 1 at 0x8048502: file clnt.c, line 31.(gdb) r laura.cs.ucdavis.eduStarting program: /fandrhome/matloff/public_html/matloff/public_html/Debug/Book/DDD/clnt laura.cs.ucdavis.edu
Breakpoint 1, main (argc=2, argv=0xbf81a344) at clnt.c:3131 connect(sd,(struct sockaddr *) &addr,sizeof(addr));
We use GDB to execute the connect() and check the return value for an errorcondition:
(gdb) p connect(sd,&addr,sizeof(addr))$1 = -1
It is indeed −1, the code for failure. That is a big hint. (Of course, as a matter ofdefensive programming, when we wrote the client code, we would have checkedthe return value of connect() and handled the case of failure to connect.)
By the way, note that in manually executing the call to connect(), we had toremove the cast. With the cast retained, we get an error:
(gdb) p connect(sd,(struct sockaddr *) &addr,sizeof(addr))No struct type named sockaddr.
This is due to a quirk in GDB, and arises because we haven’t used the struct else-where in our program.
Also note that if the connect() attempt had succeeded in our GDB session, wecould NOT have then gone ahead and executed line 31. Attempting to open analready-open socket is an error.
We would have had to skip over line 31, and go directly to line 34. We could do thisusing GDB’s jump command, issuingjump 34, but in general one should use this
Debugging In A Multiple-Activities Context 5

command with caution, as it might result in skipping some machine instructionswhich are needed further down in the code. So, if the connection attempt hadsucceeded, we probably would want to rerun the program.
Let’s try to track down the cause of the failure, by checking the argument addr inthe call to connect():
(gdb) p addr...connect(3, {sa_family=AF_INET, sin_port=htons(1032), sin_addr=inet_addr("127.0.0.1")}, 16) = -1 ECONNREFUSED (Connection refused)...
Aha! Port 2052, indeed! Not the 2000 we expect. This suggests that we eithermisspecified the port, or forgot to specify it altogether. We check, and quicklydiscover that the latter was the case.
Again, it would have been prudent to include a bit of machinery in our source codeto help the debugging process, such as checking the return values of system calls.Another helpful step is inclusion of the line
#include <errno.h>
which, on our system, creates a global variable errno, whose value can be printedout from within our code, or from within GDB:
(gdb) p errno$1 = 111
From the file /usr/include/linux/errno.h, we find that this error num-ber codes a connection refused error.
However, the implementation of the errno library may differ from platform toplatform. For example, the header file may have a different name, or errno maybe implemented as a macro call instead of a variable.
Another approach would be to use strace, which traces all system calls made bya program:
$ strace clnt laura.cs...connect(3, {sa_family=AF_INET, sin_port=htons(1032), sin_addr=inet_addr("127.0.0.1")}, 16) = -1 ECONNREFUSED (Connection refused)...
Debugging In A Multiple-Activities Context 6

This gives us two important pieces of information for the price of one. First, we seeright away that we had a ECONNREFUSED error. Second, we also see that the portwas htons(1032), which has the value 2052. We can check this latter value byissuing a command like
(gdb) p htons(1032)
from within GDB, which shows the value to be 2052, which obviously is not 2000,as expected.
strace is a handy tool in many contexts (networked and otherwise) for checkingthe results of system calls.
As another example, suppose that we accidentally omit the write to the client in theserver code (line 32):
write(clntdesc,outbuf,nb); // write it to the client
In this case, the client program would hang, waiting for a reply that is not forthcom-ing. Of course, in this simpleminded example we’d immediately suspect a problemwith the call to write() in the server, and quickly find that we had forgotten it.But in more complex programs the cause may not be so obvious. In such cases, wewould probably set up two simultaneous GDB sessions, one for the client and onefor the server, stepping through both of the programs in tandem. We would findthat at some point in their joint operation the client hangs, waiting to hear from theserver, and thus obtain a clue to the likely location of the bug within the server.We’d then focus our attention on the server GDB session, trying to figure out whyit did not send to the client at that point.
In really complex network debugging cases, the open source ethereal programcan be used to track individual TCP/IP packets.
6.2 Debugging Threaded Code
Threaded programming has become quite popular. For Unix, the most widespreadthreads package is the POSIX standard, Pthreads, so we will use it for our examplein this section. The principles are similar for other thread packages.
Debugging In A Multiple-Activities Context 7

6.2.1 Review of Processes and Threads
Modern operating systems use timesharing to manage multiple running programsin such a way that they appear to the user to execute simultaneously. Of course,if the machine has more than one CPU, more than one program actually can runsimultaneously, but for simplicity we will assume just one processor, in which casethe simultaneity is only apparent.
Each instance of a running program is represented by the OS as a process (in Unixterminology) or a task (in Windows). Thus, multiple invocations of a single pro-gram that execute at the same time (e.g., simultaneous sessions of the vi texteditor) are distinct processes. Processes have to “take turns” on a machine withone CPU. For concreteness, let’s assume that the “turns,” called timeslices, are oflength 30 milliseconds.
After a process has run for 30 milliseconds, a hardware timer emits an interrupt,which causes the OS to run. We say that the process has been pre-empted. TheOS saves the current state of the interrupted process so it can be resumed later,then selects the next process to give a timeslice to. This is known as a contextswitch, because the CPU’s execution environment has switched from one processto another. This cycle repeats indefinitely.
A turn may end early. For example, when a process needs to perform input/output,it ultimately calls a function in the OS that carries out low-level hardware opera-tions; for instance, a call to the C library function scanf() results in a call to theUnix OS read() system call, which interfaces with the keyboard driver. In thismanner the process relinquishes its turn to the OS, and the turn ends early.
One implication of this is that scheduling of timeslices for a given process is ratherrandom. The time it takes for the user to think and then hit a key is random, sothe time its next timeslice starts is unpredictable. Moreover, if we are debugging athreaded program, we do not know the order in which the threads will be scheduled;this may make our debugging more difficult.
Here is a bit more detail: The OS maintains a process table that lists informationabout all current processes. Roughly speaking, each process is marked in the tableas being in either the Run state or the Sleep state. Let’s consider an example inwhich a running program reaches a point at which it needs to read input from thekeyboard. As just noted, this will end the process’s turn. Because the processis now waiting for the I/O to complete, the OS marks it as being in the Sleepstate, making it ineligible for timeslices. Thus, being in Sleep state means that theprocess is blocked, waiting for some event to occur. When this event finally occurs
Debugging In A Multiple-Activities Context 8

later on, the OS will then change its state in the process table back to Run.
Non-I/O events can trigger a transition to Sleep state as well. For instance, if aparent process creates a child process and calls wait(), the parent will blockuntil the child finishes its work and terminates. Again, exactly when this happensis usually unpredictable.
Furthermore, being in the Run state does not mean that the process is actually exe-cuting on the CPU; rather, it merely means that it is ready to run—that is, eligiblefor a processor timeslice. Upon a context switch, the OS chooses the process thatis next given a turn on the CPU from among those currently in the Run state, ac-cording to the process table. The scheduling procedure used by the OS to selectthe new context guarantees that any given process will keep getting timeslices, andso eventually finish, but there is no promise of which timeslices it will receive.Thus, exactly when a sleeping process actually “awakens” once the event that itawaits has occurred is random, as is the exact rate of the process’s progress towardcompletion.
A thread is much like a process, except that they are designed to occupy less mem-ory and to take less time to create and switch between than processes do. Indeed,threads are sometimes called “lightweight” processes and, depending on the threadsystem and run-time environment, may even be implemented as operating systemprocesses. Like programs that spawn processes to get work done, a multithreadedapplication will generally execute a main() procedure that creates one or morechild threads. The parent, main(), is also a thread.
A major difference between processes and threads is that although each thread hasits own local variables, just as is the case for a process, the global variables of theparent program in a threaded environment are shared by all threads, and serve asthe main method of communication between the threads. (It is possible to shareglobals among Unix processes, but inconvenient to do so.)
On a Linux system, you can view all the processes and threads currently on thesystem by running the command ps axH.
There are nonpreemptive thread systems, but Pthreads uses a preemptive threadmanagement policy, and a thread in a program can be interrupted at any time byanother thread. Thus, the element of randomness described above for processes ina timeshared system also arises in the behavior of a threaded program. As a result,some bugs in applications developed using Pthreads are not readily reproducible.
Debugging In A Multiple-Activities Context 9

6.2.2 Basic Example
We’ll keep things simple and use the following code for finding prime numbersas our example. The program uses the classic Sieve of Eratosthenes. To find allthe primes from 2 through n, we first list all the numbers, then cross out all themultiples of 2, then all the multiples of 3, and so on. Whatever numbers remain atthe end are prime numbers.
1 // finds the primes between 2 and n; uses the Sieve of Eratosthenes,2 // deleting all multiples of 2, all multiples of 3, all multiples of 5,3 // etc.; not efficient, e.g. each thread should do deleting for a whole4 // block of values of base before going to nextbase for more5
6 // usage: sieve nthreads n7 // where nthreads is the number of worker threads8
9 #include <stdio.h>10 #include <math.h>11 #include <pthread.h>12
13 #define MAX_N 10000000014 #define MAX_THREADS 10015
16 // shared variables17 int nthreads, // number of threads (not counting main())18 n, // upper bound of range in which to find primes19 prime[MAX_N+1], // in the end, prime[i] = 1 if i prime, else 020 nextbase; // next sieve multiplier to be used21
22 int work[MAX_THREADS]; // to measure how much work each thread does,23 // in terms of number of sieve multipliers checked24
25 // lock index for the shared variable nextbase26 pthread_mutex_t nextbaselock = PTHREAD_MUTEX_INITIALIZER;27
28 // ID structs for the threads29 pthread_t id[MAX_THREADS];30
31 // "crosses out" all multiples of k, from k*k on32 void crossout(int k)33 { int i;34
35 for (i = k; i*k <= n; i++) {36 prime[i*k] = 0;37 }38 }39
40 // worker thread routine41 void *worker(int tn) // tn is the thread number (0,1,...)42 { int lim,base;43
44 // no need to check multipliers bigger than sqrt(n)45 lim = sqrt(n);
Debugging In A Multiple-Activities Context 10

46
47 do {48 // get next sieve multiplier, avoiding duplication across threads49 pthread_mutex_lock(&nextbaselock);50 base = nextbase += 2;51 pthread_mutex_unlock(&nextbaselock);52 if (base <= lim) {53 work[tn]++; // log work done by this thread54 // don’t bother with crossing out if base is known to be55 // composite56 if (prime[base])57 crossout(base);58 }59 else return;60 } while (1);61 }62
63 main(int argc, char **argv)64 { int nprimes, // number of primes found65 totwork, // number of base values checked66 i;67 void *p;68
69 n = atoi(argv[1]);70 nthreads = atoi(argv[2]);71 for (i = 2; i <= n; i++)72 prime[i] = 1;73 crossout(2);74 nextbase = 1;75 // get threads started76 for (i = 0; i < nthreads; i++) {77 pthread_create(&id[i],NULL,(void *) worker,(void *) i);78 }79
80 // wait for all done81 totwork = 0;82 for (i = 0; i < nthreads; i++) {83 pthread_join(id[i],&p);84 printf("%d values of base done\n",work[i]);85 totwork += work[i];86 }87 printf("%d total values of base done\n",totwork);88
89 // report results90 nprimes = 0;91 for (i = 2; i <= n; i++)92 if (prime[i]) nprimes++;93 printf("the number of primes found was %d\n",nprimes);94
95 }
There are two command-line arguments in this program, the upper bound n of therange to be checked for primes, and nthreads, the number of worker threads wewish to create.
Debugging In A Multiple-Activities Context 11
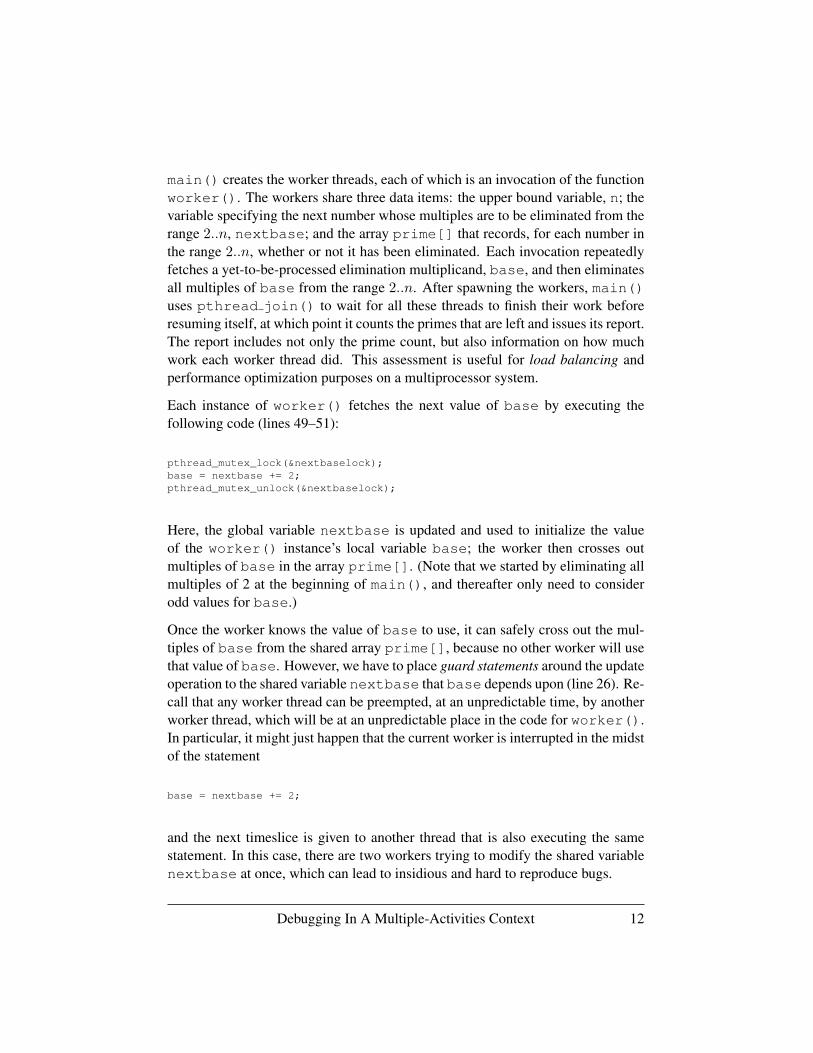
main() creates the worker threads, each of which is an invocation of the functionworker(). The workers share three data items: the upper bound variable, n; thevariable specifying the next number whose multiples are to be eliminated from therange 2..n, nextbase; and the array prime[] that records, for each number inthe range 2..n, whether or not it has been eliminated. Each invocation repeatedlyfetches a yet-to-be-processed elimination multiplicand, base, and then eliminatesall multiples of base from the range 2..n. After spawning the workers, main()uses pthread join() to wait for all these threads to finish their work beforeresuming itself, at which point it counts the primes that are left and issues its report.The report includes not only the prime count, but also information on how muchwork each worker thread did. This assessment is useful for load balancing andperformance optimization purposes on a multiprocessor system.
Each instance of worker() fetches the next value of base by executing thefollowing code (lines 49–51):
pthread_mutex_lock(&nextbaselock);base = nextbase += 2;pthread_mutex_unlock(&nextbaselock);
Here, the global variable nextbase is updated and used to initialize the valueof the worker() instance’s local variable base; the worker then crosses outmultiples of base in the array prime[]. (Note that we started by eliminating allmultiples of 2 at the beginning of main(), and thereafter only need to considerodd values for base.)
Once the worker knows the value of base to use, it can safely cross out the mul-tiples of base from the shared array prime[], because no other worker will usethat value of base. However, we have to place guard statements around the updateoperation to the shared variable nextbase that base depends upon (line 26). Re-call that any worker thread can be preempted, at an unpredictable time, by anotherworker thread, which will be at an unpredictable place in the code for worker().In particular, it might just happen that the current worker is interrupted in the midstof the statement
base = nextbase += 2;
and the next timeslice is given to another thread that is also executing the samestatement. In this case, there are two workers trying to modify the shared variablenextbase at once, which can lead to insidious and hard to reproduce bugs.
Debugging In A Multiple-Activities Context 12
Bracketing the code that manipulates the shared variable—known as a criticalsection—with the guard statements prevents this from happening. The calls topthread mutex lock() and pthread mutex unlock() ensure that thereis at most only ever one thread executing the enclosed program fragment. They tellthe OS to allow a thread to enter the critical section only if there is no other threadcurrently executing it, and to not preempt that thread until it completes the en-tire section. (The lock variable nextbaselock is used internally by the threadsystem to ensure this “mutual exclusion.”)
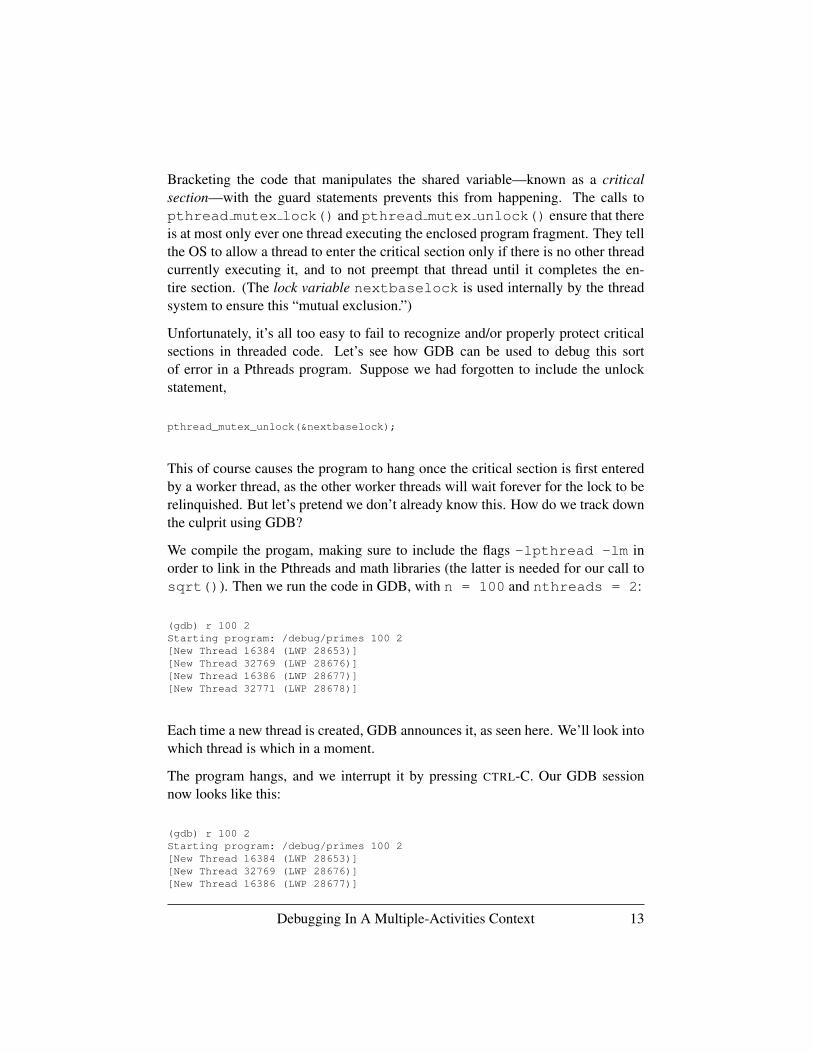
Unfortunately, it’s all too easy to fail to recognize and/or properly protect criticalsections in threaded code. Let’s see how GDB can be used to debug this sortof error in a Pthreads program. Suppose we had forgotten to include the unlockstatement,
pthread_mutex_unlock(&nextbaselock);
This of course causes the program to hang once the critical section is first enteredby a worker thread, as the other worker threads will wait forever for the lock to berelinquished. But let’s pretend we don’t already know this. How do we track downthe culprit using GDB?
We compile the progam, making sure to include the flags -lpthread -lm inorder to link in the Pthreads and math libraries (the latter is needed for our call tosqrt()). Then we run the code in GDB, with n = 100 and nthreads = 2:
(gdb) r 100 2Starting program: /debug/primes 100 2[New Thread 16384 (LWP 28653)][New Thread 32769 (LWP 28676)][New Thread 16386 (LWP 28677)][New Thread 32771 (LWP 28678)]
Each time a new thread is created, GDB announces it, as seen here. We’ll look intowhich thread is which in a moment.
The program hangs, and we interrupt it by pressing CTRL-C. Our GDB sessionnow looks like this:
(gdb) r 100 2Starting program: /debug/primes 100 2[New Thread 16384 (LWP 28653)][New Thread 32769 (LWP 28676)][New Thread 16386 (LWP 28677)]
Debugging In A Multiple-Activities Context 13

[New Thread 32771 (LWP 28678)]
Program received signal SIGINT, Interrupt.[Switching to Thread 32771 (LWP 28678)]0x4005ba35 in __pthread_sigsuspend () from /lib/i686/libpthread.so.0
At a point like this it’s crucial to know what each threads is doing, which we candetermine via GDB’s info threads command:
(gdb) info threads
* 4 Thread 32771 (LWP 28678) 0x4005ba35 in __pthread_sigsuspend ()from /lib/i686/libpthread.so.0
3 Thread 16386 (LWP 28677) 0x4005ba35 in __pthread_sigsuspend ()from /lib/i686/libpthread.so.0
2 Thread 32769 (LWP 28676) 0x420db1a7 in poll () from/lib/i686/libc.so.6
1 Thread 16384 (LWP 28653) 0x4005ba35 in __pthread_sigsuspend ()from /lib/i686/libpthread.so.0
The asterisk means that we are currently in thread 4. Let’s see what’s going onwith that thread:
(gdb) bt#0 0x4005ba35 in __pthread_sigsuspend () from /lib/i686/libpthread.so.0#1 0x4005adb8 in __pthread_wait_for_restart_signal ()
from /lib/i686/libpthread.so.0#2 0x4005d190 in __pthread_alt_lock () from /lib/i686/libpthread.so.0#3 0x40059d77 in pthread_mutex_lock () from /lib/i686/libpthread.so.0#4 0x0804855f in worker (tn=1) at Primes.c:49#5 0x40059881 in pthread_start_thread () from /lib/i686/libpthread.so.0#6 0x40059985 in pthread_start_thread_event () from/lib/i686/libpthread.so.0
(This works under the LinuxThreads implementation of Pthreads but may not bepossible on some other platforms.)
Aha—we see in frames 3 and 4 that this thread is on line 49 of the source code andis trying to acquire the lock and enter the critical section:
pthread_mutex_lock(&nextbaselock);
Note also from frame 0 above that the thread is apparently suspended pending thelock’s being relinquished by another thread. It will not get any timeslices until thishappens and the thread manager arranges for it to acquire the lock.
What are the other threads doing? We can inspect any thread’s stack by switchingto that thread and then issuing the bt command:
Debugging In A Multiple-Activities Context 14

(gdb) thread 3[Switching to thread 3 (Thread 16386 (LWP 28677))]#0 0x4005ba35 in__pthread_sigsuspend () from /lib/i686/libpthread.so.0(gdb) bt#0 0x4005ba35 in __pthread_sigsuspend () from /lib/i686/libpthread.so.0#1 0x4005adb8 in __pthread_wait_for_restart_signal ()
from /lib/i686/libpthread.so.0#2 0x4005d190 in __pthread_alt_lock () from /lib/i686/libpthread.so.0#3 0x40059d77 in pthread_mutex_lock () from /lib/i686/libpthread.so.0#4 0x0804855f in worker (tn=0) at Primes.c:49#5 0x40059881 in pthread_start_thread () from /lib/i686/libpthread.so.0#6 0x40059985 in pthread_start_thread_event () from/lib/i686/libpthread.so.0
Recall that we created two worker threads. We saw above that thread 4 was one ofthem (frame 4 from its bt output), and now we see from frame 4 of the output herethat thread 3 is the other one. We also see that thread 3 is trying to acquire the lockas well (frame 3).
There shouldn’t be any other worker threads, but one of the fundamental principlesof debugging is that nothing is taken on faith, and everything must be checked. Wedo this now by inspecting the status of the remaining threads. We find that the othertwo threads are nonworker threads, as follows:
(gdb) thread 2[Switching to thread 2 (Thread 32769 (LWP 28676))]#0 0x420db1a7 in poll()
from /lib/i686/libc.so.6(gdb) bt#0 0x420db1a7 in poll () from /lib/i686/libc.so.6#1 0x400589de in __pthread_manager () from /lib/i686/libpthread.so.0#2 0x4005962b in __pthread_manager_event () from/lib/i686/libpthread.so.0
So thread 2 is the threads manager. This is internal to the Pthreads package. It iscertainly not a worker thread, partially confirming our expectation that there areonly two worker threads. Checking thread 1,
(gdb) thread 1[Switching to thread 1 (Thread 16384 (LWP 28653))]#0 0x4005ba35 in__pthread_sigsuspend () from /lib/i686/libpthread.so.0(gdb) bt#0 0x4005ba35 in __pthread_sigsuspend () from /lib/i686/libpthread.so.0#1 0x4005adb8 in __pthread_wait_for_restart_signal ()
from /lib/i686/libpthread.so.0#2 0x40058551 in pthread_join () from /lib/i686/libpthread.so.0#3 0x080486aa in main (argc=3, argv=0xbfffe7b4) at Primes.c:83#4 0x420158f7 in __libc_start_main () from /lib/i686/libc.so.6
Debugging In A Multiple-Activities Context 15

we find it executes main(), and thus confirm that there are only two workerthreads.
However, both of the workers are stalled, each waiting for the lock to be relin-quished. No wonder the program is hanging! This is enough to pinpoint the lo-cation and nature of the bug, and we quickly realize that we forgot the call to theunlocking function.
6.2.3 A Variation
What if we hadn’t realized the necessity of guarding the update of the shared vari-able nextbase in the first place? What would have happened in our previousexample if we’d left out both the unlock and the lock operations?
A naive look at this question might lead to the guess that there would have been noharm in terms of correct operation of the program (i.e. getting an accurate count ofthe number of primes), albeit possibly with a slowdown due to duplicate work (i.e.using the same value of base more than once). It would seem that some threadsmay duplicate the work of others, namely when two workers happen to grab thesame value of nextbase to initialize their local copies of base. Some compositenumbers might then end up being crossed out twice, but the results (i.e., the countof the number of primes) would still be correct.
But let’s take a closer look. The statement
base = nextbase += 2;
compiles to at least two machine language instructions. For instance, using theGCC compiler on a Pentium machine running Linux, the C statement above trans-lates to the following assembly language instructions (obtained by running GCCwith the -S option, and then viewing the resulting .s file):
addl $2, nextbasemovl nextbase, %eaxmovl %eax, -8(%ebp)
This code increments nextbase by 2, then copies the value of nextbase tothe register EAX, and finally, copies the value of EAX to the place in the worker’sstack where its local variable base is stored.
Debugging In A Multiple-Activities Context 16
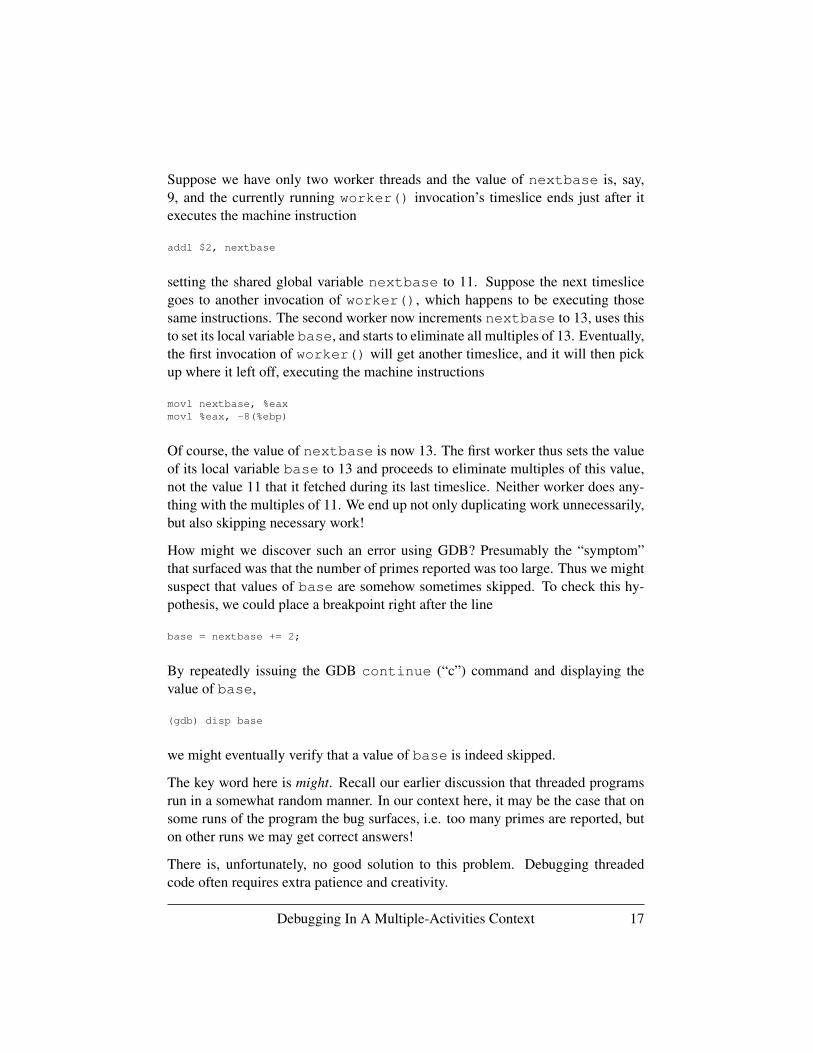
Suppose we have only two worker threads and the value of nextbase is, say,9, and the currently running worker() invocation’s timeslice ends just after itexecutes the machine instruction
addl $2, nextbase
setting the shared global variable nextbase to 11. Suppose the next timeslicegoes to another invocation of worker(), which happens to be executing thosesame instructions. The second worker now increments nextbase to 13, uses thisto set its local variable base, and starts to eliminate all multiples of 13. Eventually,the first invocation of worker() will get another timeslice, and it will then pickup where it left off, executing the machine instructions
movl nextbase, %eaxmovl %eax, -8(%ebp)
Of course, the value of nextbase is now 13. The first worker thus sets the valueof its local variable base to 13 and proceeds to eliminate multiples of this value,not the value 11 that it fetched during its last timeslice. Neither worker does any-thing with the multiples of 11. We end up not only duplicating work unnecessarily,but also skipping necessary work!
How might we discover such an error using GDB? Presumably the “symptom”that surfaced was that the number of primes reported was too large. Thus we mightsuspect that values of base are somehow sometimes skipped. To check this hy-pothesis, we could place a breakpoint right after the line
base = nextbase += 2;
By repeatedly issuing the GDB continue (“c”) command and displaying thevalue of base,
(gdb) disp base
we might eventually verify that a value of base is indeed skipped.
The key word here is might. Recall our earlier discussion that threaded programsrun in a somewhat random manner. In our context here, it may be the case that onsome runs of the program the bug surfaces, i.e. too many primes are reported, buton other runs we may get correct answers!
There is, unfortunately, no good solution to this problem. Debugging threadedcode often requires extra patience and creativity.
Debugging In A Multiple-Activities Context 17

6.2.4 GDB Threads Command Summary
Here is a summary of the usage of GDB’s thread-related commands:
• info threads (gives information on all current threads)
• thread 3 (change to thread 3)
• break 88 thread 3 (stop execution when thread 3 reaches source line 88)
• break 88 thread 3 if x==y (stop execution when thread 3 reachessource line 88 and the variables x and y are equal)
6.2.5 Threads Commands in DDD
In DDD, select Status | Threads, and a window will pop up, displaying all threads,in the manner of GDB’s info threads, as seen in Figure 6.1. You can click ona thread to switch the debugger’s focus to it.
You will probably want to keep this pop-up window around, rather than using itonce and then closing it. This way you don’t have to keep reopening it every timeyou want to see which thread is currently running or want to switch to a differentthread.
There appears to be no way to make a breakpoint thread-specific in DDD, e.g.with our GDB command break 88 thread 3 above. Instead, we issue sucha command to GDB via the DDD Console.
6.2.6 Threads Commands in Eclipse
Note first that the default makefile created by Eclipse will not include the-lpthread command-line argument for GCC (nor will it include the argumentsfor any other special libraries you need). You can alter the makefile directly if youwish, but it is easier to tell Eclipse to do it for you. While in the C/C++ perspective,right-click on your project name, and select Properties; point the triangle next toC/C++ Build downward; select Settings | Tool Settings; point the triangle next toGCC C Linker downward and select Libraries | Add (the latter is the green + icon);and fill in your library flags minus the -l, e.g. filling in m for -lm. Then buildyour project.
Debugging In A Multiple-Activities Context 18

Figure 6.1: Threads window
Debugging In A Multiple-Activities Context 19

Recall from Chapter ?? that Eclipse constantly displays your thread list, as opposedto having to request it in the case of DDD. Moreover, we do not need to ask for abacktrace kind of operation as in DDD; the call stack is shown in the thread list.This is depicted in Figure 6.2. As above, we ran the program for a while, theninterrupted it by clicking the Suspend icon to the right of Resume. The thread listis in the Debug view, which normally is in the upper-left portion of the screen, butappears here in expanded form due to our having clicked Maximize in the Debugtab. (We can click Restore to return to the standard layout.)
We see that thread 3 had been running at the time of the interruption; it had receiveda SIGINT signal, which is the interruption (“CTRL-C”) signal. We see also that theassociated system call had been invoked by pthread join(), which in turn hadbeen called by main(). From what we’ve seen about this program earlier, we seethat this indeed is the main thread.
To view the information for another thread, we merely click the triangle next to thethread, to point it downward. To change to another thread, we click on its entry inthe list.
We may wish to set a breakpoint that applies only to a specific thread. To do so,we must first wait until the thread is created. Then when execution pauses via aprevious setting of a breakpoint, or an interruption as above we right-click on thebreakpoint symbol in the same manner as we use to make a breakpoint conditional,but this time select Filtering. A pop-up window like the one in Figure 6.3 willappear. We see that currently this breakpoint applies to all three threads. If wewish it to apply only to thread 2, for instance, we would uncheck the boxes next tothe entries for the other two threads.
6.3 Debugging Parallel Applications
There are two main types of parallel programming architectures—shared memoryand message passing.
The term “shared memory” means exactly that: multiple CPUs all have accessto some common physical memory. Code running on one CPU communicateswith code running on the others by reading from and writing to this shared mem-ory, much as threads in a multithreaded application communicate with one anotherthrough a shared address space. (Indeed, threaded programming has become thestandard way to write application code for shared memory systems.)
Debugging In A Multiple-Activities Context 20

Figure 6.2: Threads Display in Eclipse
Debugging In A Multiple-Activities Context 21

Figure 6.3: Setting a Thread-Specific Breakpoint in Eclipse
Debugging In A Multiple-Activities Context 22
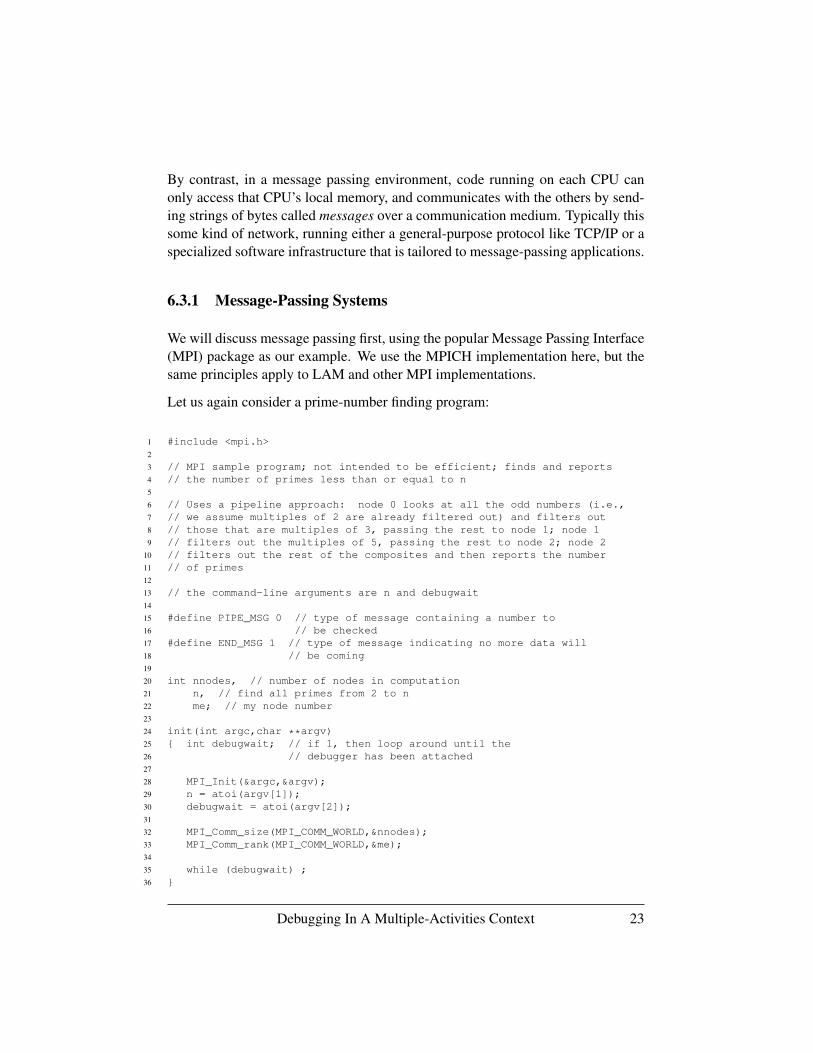
By contrast, in a message passing environment, code running on each CPU canonly access that CPU’s local memory, and communicates with the others by send-ing strings of bytes called messages over a communication medium. Typically thissome kind of network, running either a general-purpose protocol like TCP/IP or aspecialized software infrastructure that is tailored to message-passing applications.
6.3.1 Message-Passing Systems
We will discuss message passing first, using the popular Message Passing Interface(MPI) package as our example. We use the MPICH implementation here, but thesame principles apply to LAM and other MPI implementations.
Let us again consider a prime-number finding program:
1 #include <mpi.h>2
3 // MPI sample program; not intended to be efficient; finds and reports4 // the number of primes less than or equal to n5
6 // Uses a pipeline approach: node 0 looks at all the odd numbers (i.e.,7 // we assume multiples of 2 are already filtered out) and filters out8 // those that are multiples of 3, passing the rest to node 1; node 19 // filters out the multiples of 5, passing the rest to node 2; node 2
10 // filters out the rest of the composites and then reports the number11 // of primes12
13 // the command-line arguments are n and debugwait14
15 #define PIPE_MSG 0 // type of message containing a number to16 // be checked17 #define END_MSG 1 // type of message indicating no more data will18 // be coming19
20 int nnodes, // number of nodes in computation21 n, // find all primes from 2 to n22 me; // my node number23
24 init(int argc,char **argv)25 { int debugwait; // if 1, then loop around until the26 // debugger has been attached27
28 MPI_Init(&argc,&argv);29 n = atoi(argv[1]);30 debugwait = atoi(argv[2]);31
32 MPI_Comm_size(MPI_COMM_WORLD,&nnodes);33 MPI_Comm_rank(MPI_COMM_WORLD,&me);34
35 while (debugwait) ;36 }
Debugging In A Multiple-Activities Context 23

37
38 void node0()39 { int i,dummy,40 tocheck; // current number to check for passing on to next node41 for (i = 1; i <= n/2; i++) {42 tocheck = 2 * i + 1;43 if (tocheck > n) break;44 if (tocheck % 3 > 0)45 MPI_Send(&tocheck,1,MPI_INT,1,PIPE_MSG,MPI_COMM_WORLD);46 }47 MPI_Send(&dummy,1,MPI_INT,1,END_MSG,MPI_COMM_WORLD);48 }49
50 void node1()51 { int tocheck, // current number to check from node 052 dummy;53 MPI_Status status; // see below54
55 while (1) {56 MPI_Recv(&tocheck,1,MPI_INT,0,MPI_ANY_TAG,57 MPI_COMM_WORLD,&status);58 if (status.MPI_TAG == END_MSG) break;59 if (tocheck % 5 > 0)60 MPI_Send(&tocheck,1,MPI_INT,2,PIPE_MSG,MPI_COMM_WORLD);61 }62 // now send our end-of-data signal, which is conveyed in the63 // message type, not the message itself64 MPI_Send(&dummy,1,MPI_INT,2,END_MSG,MPI_COMM_WORLD);65 }66
67 void node2()68 { int tocheck, // current number to check from node 169 primecount,i,iscomposite;70 MPI_Status status;71
72 primecount = 3; // must account for the primes 2, 3 and 5, which73 // won’t be detected below74 while (1) {75 MPI_Recv(&tocheck,1,MPI_INT,1,MPI_ANY_TAG,76 MPI_COMM_WORLD,&status);77 if (status.MPI_TAG == END_MSG) break;78 iscomposite = 0;79 for (i = 7; i*i <= tocheck; i += 2)80 if (tocheck % i == 0) {81 iscomposite = 1;82 break;83 }84 if (!iscomposite) primecount++;85 }86 printf("number of primes = %d\n",primecount);87 }88
89 main(int argc,char **argv)90 { init(argc,argv);91 switch (me) {92 case 0: node0();
Debugging In A Multiple-Activities Context 24

93 break;94 case 1: node1();95 break;96 case 2: node2();97 };98 MPI_Finalize();99 }
As explained in the comments at the beginning of the program, here our Sieve ofEratosthenes runs on three nodes of a parallel system and works in a pipelinedmanner. The first node starts with odd numbers and removes all multiples of 3,passing on the remaining values; the second node takes the output of the first andremoves all multiples of 5; and the third node takes the output of the second andremoves the rest of the nonprimes and reports the number of primes that are left.
Here the pipelining is achieved by having each node pass one number at a time tothe next. (Much greater efficiency could be attained by passing groups of numbersin each MPI message, thus reducing communications overhead.) When sending anumber on to the next node, a node sends a message of type PIPE MSG. When anode has no more numbers to send, it indicates this by sending a message of typeEND MSG.
As our debugging example here, suppose we forget to include the latter notificationat the first node, that is, we forget line 46 in the code for node0():
MPI_Send(&dummy,1,MPI_INT,1,END_MSG,MPI_COMM_WORLD);
The program will hang at the “downstream” nodes. Let’s see how we can trackdown this bug. (Keep in mind that some line numbers in our GDB session belowwill differ by 1 from those in the above listing.)
We run an MPICH application program by invoking a script named mpirun onone node of the system. The script then starts the application program at each node,via SSH. Here we did this on a network of three machines, which we’ll call Node 0,Node 1, and Node 2, with n equal to 100. Our bug causes the program to hang at thelatter two nodes. The program also hangs at the first node, because no instance ofan MPI program will exit until all have executed the MPI FINALIZE() function.
We would like to use GDB, but because we used mpirun to invoke the applicationat each of the three nodes, rather than running them directly on the nodes, wecannot run GDB directly. However, GDB allows one to dynamically attach thedebugger to an already-running process, using the process number. So let’s run pson Node 1, to determine the number of the process that is executing our applicationthere:
Debugging In A Multiple-Activities Context 25

$ ps ax...2755 ? S 0:00 tcsh -c /home/matloff/primepipe node 1 32776 ? S 0:00 /home/matloff/primepipe node1 32812 42777 ? S 0:00 /home/matloff/primepipe node1 32812 4
Our MPI program is running as process 2776, so we attach GDB to the program atNode 1:
$ gdb primepipe 2776...0xffffe002 in ?? ()
This is not very informative! So, let’s check to see where we are:
(gdb) bt#0 0xffffe002 in ?? ()#1 0x08074a76 in recv_message ()#2 0x080748ad in p4_recv ()#3 0x0807ab46 in MPID_CH_Check_incoming ()#4 0x08076ae9 in MPID_RecvComplete ()#5 0x0806765f in MPID_RecvDatatype ()#6 0x0804a29f in PMPI_Recv ()#7 0x08049ce8 in node1 () at PrimePipe.c:56#8 0x08049e19 in main (argc=8, argv=0xbffffb24) at PrimePipe.c:94#9 0x420156a4 in __libc_start_main () from /lib/tls/libc.so.6
We see from frame 7 that the program is hanging at line 56, waiting to receive fromNode 0.
Next, it would be useful to know how much work has been done by the func-tion running at Node 1, node1(). Has it just started, or is it almost done? Wecan gauge the progress by determining the last value processed for the variabletocheck:
(gdb) frame 7#7 0x08049ce8 in node1 () at PrimePipe.c:5656 MPI_Recv(&tocheck,1,MPI_INT,0,MPI_ANY_TAG,(gdb) p tocheck$1 = 97
(Note that we needed to move to the stack frame for node1() first, using GDB’sframe command.)
This indicates that Node 1 is at the end of execution, as 97 should be the last numberthat Node 0 passes to it for prime checking. So, currently we would be expecting
Debugging In A Multiple-Activities Context 26

a message from node 0 of type END MSG. The fact that the program is hangingwould suggest to us that Node 0 might not have sent such a message, which wouldin turn lead us to check whether it had. In this manner, we hopefully would zero inquickly on the bug, which was the accidental omission of line 46.
By the way, keep in mind that when GDB is invoked with the command
$ gdb primepipe 2776
as we did above, GDB’s command-line processing first checks for a core file named2776. In the unlikely event that such a file exists, GDB will load it instead ofattaching to the intended process. Alternatively, GDB also has an attach com-mand.
In this example, the bug caused our program to hang. The approach to debug-ging a parallel program like this one is somewhat different when the symptom isincorrect output. Suppose, for example, that in line 71 we incorrectly initializedprimecount to 2 instead of 3. If we try to follow the same debugging procedure,the programs running on each node would finish execution and exit too quickly forus to attach GDB. (True, we could use a very large value of n, but it is usuallybetter to debug with simple cases at first.) We need some device that can be usedto make the programs wait and give us a chance to attach GDB. This is the purposeof line 34 in the init() function.
As can be seen in the source code, the value of debugwait is taken from thecommand line supplied by the user, with 1 meaning wait and 0 meaning no wait.If we specify 1 for the value of debugwait, then when each invocation of theprogram reaches line 34, it remains there. This gives us time to attach GDB. Wecan then break out of the infinite loop and proceed to debug. Here is what we do atNode 0:
node1:˜$ gdb primepipe 3124...0x08049c53 in init (argc=3, argv=0xbfffe2f4) at PrimePipe.c:3434 while (debugwait) ;(gdb) set debugwait = 0(gdb) cContinuing.
Ordinarily we dread infinite loops, but here we deliberately set one up in order tofacilitate debugging. We do the same thing at Node 1 and Node 2, and at the latterwe also take the opportunity to set a breakpoint at line 77 before continuing:
Debugging In A Multiple-Activities Context 27

[matloff@node3 ˜]$ gdb primepipe 294434 while (debugwait) ;(gdb) b 77Breakpoint 1 at 0x8049d7d: file PrimePipe.c, line 77.(gdb) set debugwait = 0(gdb) cContinuing.
Breakpoint 1, node2 () at PrimePipe.c:7777 if (status.MPI_TAG == END_MSG) break;(gdb) p tocheck$1 = 7(gdb) n78 iscomposite = 0;(gdb) n79 for (i = 7; i*i <= tocheck; i += 2)(gdb) n84 if (!iscomposite) primecount++;(gdb) n75 MPI_Recv(&tocheck,1,MPI_INT,1,MPI_ANY_TAG,(gdb) p primecount$2 = 3
At this point, we notice that primecount should be 4, not 3—the primes through7 are 2, 3, 5 and 7—and thus have found the location of the bug.
6.3.2 Shared-Memory Systems
Now, what about the shared-memory type of parallel programming? Here we haveseparate cases for true shared-memory machines and software distributed shared-memory settings.
True Shared Memory
As mentioned earlier, in a true shared-memory environment, application programsare often developed using threads. Our material in Section 6.2 on debugging withGDB/DDD then applies.
OpenMP has become a popular programming environment on such machines.OpenMP supplies the programmer with high-level parallel programming con-structs, which in turn make use of threads. The programmer still has thread-levelaccess if needed, but for the most part the threaded implementation of the OpenMPdirectives are largely transparent to the programmer.
Debugging In A Multiple-Activities Context 28
We present an extended example in Section 6.4 of debugging an OpenMP applica-tion.
Software Distributed Shared-Memory Systems
Prices of machines with dual-core CPUs are now within reach of ordinary con-sumers, but large-scale shared-memory systems with many processors still costhundreds of thousands of dollars. A popular, inexpensive alternative is a networkof workstations (NOW). NOW architectures use an underlying library that givesthe illusion of shared memory. The library, which is largely transparent to the ap-plication programmer, engages in network transactions that maintain consistencyof copies of shared variables across the different nodes.
This approach is called software distributed shared memory (SDSM). The mostwidely used SDSM library is Treadmarks, developed and maintained by RiceUniversity. Another excellent package is JIAJIA, available from the Chi-nese Academy of Sciences (http://www-users.cs.umn.edu/˜tianhe/paper/dist.htm).
SDSM applications exhibit certain kinds of behavior that may baffle the unwaryprogrammer. These are highly dependent on the particular system, so a generaltreatment cannot be given here, but we will briefly discuss a couple of issues com-mon to many of them.
Many SDSMs are page-based, meaning that they rely on the underlying virtualmemory hardware at the nodes. The actions are complex, but we can give a quickoverview. Consider a variable X that is to be shared among the NOW nodes. Theprogrammer indicates this intention by making a certain call to the SDSM library,which in turn makes a certain Unix system call requesting the OS to replace its ownseg fault handler with a function in the SDSM library, for page faults involving thepage containing X. The SDSM sets things up in such a way that only NOW nodeswith valid copies of X have the corresponding memory pages marked as resident.When X is accessed at some other node, a page fault results, and the underlyingSDSM software fetches the correct value from a node that has it.
Again, it’s not essential to know the precise workings of the SDSM system; rather,the important thing is simply to understand that there is an underlying VM-basedmechanism that’s being used to maintain consistency of local copies of shareddata across the NOW nodes. If you don’t, you will be mystified when you try todebug SDSM application code. The debugger will seem to mysteriously stop fornonexistent seg faults, because the SDSM infrastructure deliberately generates seg
Debugging In A Multiple-Activities Context 29

faults, and when an SDSM application program is run under a debugging tool, thetool senses them. Once you realize this, there is no problem at all—in GDB, you’dmerely issue a continue command to resume execution when one of these oddpauses occurs.
You may be tempted to order GDB not to stop or issue warning messages wheneverany seg faults occur, using the GDB command
handle SIGSEGV nostop noprint
You should use this approach with caution, as it may result in your missing anygenuine seg faults caused by bugs in the application program.
Yet another, related difficulty with debugging applications that run on page-basedSDSMs arises as follows. If a node on the network changes the value of a sharedvariable, then any other node that needs the value of that variable must obtainthe updated value through a network transaction. Once again, the details of howthis happens depends on the SDSM system, but this means that if we are single-stepping through the code executing on one node, we may find that GDB myste-riously hangs, because the node is now waiting for an update to its local copy ofa variable that was recently modified by another node. If we also happen to berunning a separate GDB session to step through the code on that other node aswell, the update will not occur on the first node until the debugging session on thesecond node progresses far enough. In other words, if the programmer is not alertand careful during the debugging of an SDSM application, he can cause his owndeadlock situation through the debugging process itself.
The SDSM situation is similar to that of the message-passing case in one sense—the need to have a variable like debugwait in our MPI example above, whichallowed us to have the program pause at all nodes, giving us a chance to attachGDB at each node and step through the program from the beginning.
6.4 Extended Example
This section presents an example of debugging a shared-memory application de-veloped using OpenMP. The necessary knowledge of OpenMP will be explainedbelow. All that is needed is a basic understanding of threads.
Debugging In A Multiple-Activities Context 30

6.4.1 OpenMP Overview
OpenMP is essentially a higher-level parallel programming interface to thread-management operations. The number of threads is set via the environment variableOMP NUM THREADS. In the C shell, for instance, we type
% setenv OMP_NUM_THREADS 4
at the shell prompt to arrange to have four threads.
Application code consists of C interspersed with OpenMP directives. Each direc-tive applies to the block that follows it, delimited by left and right braces. The mostbasic directive is
#pragma omp parallel
This sets up OMP NUM THREADS threads, each of which concurrently executesthe block of code following the pragma. There will typically be other directivesembedded within this block.
Another very common OpenMP directive is
#pragma omp barrier
This specifies a “meeting point” for all the threads. When any thread reaches thispoint, it will block until all the other threads have arrived there.
Often we wish to have just one thread execute a certain block, with the other threadsskipping it. This is accomplished by writing
#pragma omp single
There is an implied barrier immediately following such a block.
There are many other OpenMP directives, but the only other one we use in ourexample here is
#pragma omp critical
As the name implies, this creates a critical section, in which only one thread isallowed at any given time.
Debugging In A Multiple-Activities Context 31

6.4.2 OpenMP Example Program
We implement the famous Dijkstra algorithm for determining minimum distancesbetween pairs of vertices in a weighted graph. We are given distances betweenadjacent vertices (if two vertices are not adjacent, the distance between them is setto infinity). The goal is to find the minimum distances between vertex 0 and allother vertices.
Following is our source file, dijkstra.c. It generates random edge lengths among aspecified number of vertices and then finds the minimum distances from vertex 0to each of the other vertices.
1 // dijkstra.c2
3 // OpenMP example program: Dijkstra shortest-path finder in a4 // bidirectional graph; finds the shortest path from vertex 0 to all5 // others6
7 // usage: dijkstra nv print8
9 // where nv is the size of the graph, and print is 1 if graph and min10 // distances are to be printed out, 0 otherwise11
12 #include <omp.h> // required13 #include <values.h>14
15 // including stdlib.h and stdio.h seems to cause a conflict with the16 // Omni compiler, so declare directly17 extern void *malloc();18 extern int printf(char *,...);19
20 // global variables, shared by all threads21 int nv, // number of vertices22 *notdone, // vertices not checked yet23 nth, // number of threads24 chunk, // number of vertices handled by each thread25 md, // current min over all threads26 mv; // vertex which achieves that min27
28 int *ohd, // 1-hop distances between vertices; "ohd[i][j]" is29 // ohd[i*nv+j]30 *mind; // min distances found so far31
32 void init(int ac, char **av)33 { int i,j,tmp;34 nv = atoi(av[1]);35 ohd = malloc(nv*nv*sizeof(int));36 mind = malloc(nv*sizeof(int));37 notdone = malloc(nv*sizeof(int));38 // random graph39 for (i = 0; i < nv; i++)40 for (j = i; j < nv; j++) {
Debugging In A Multiple-Activities Context 32
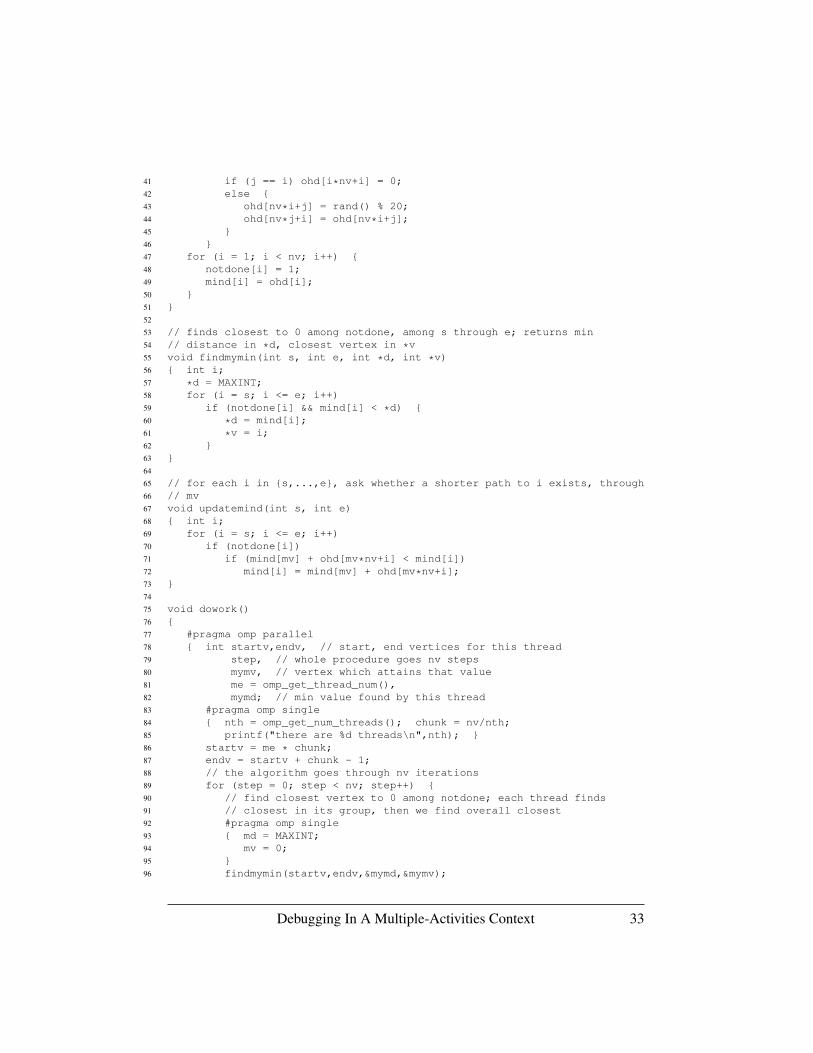
41 if (j == i) ohd[i*nv+i] = 0;42 else {43 ohd[nv*i+j] = rand() % 20;44 ohd[nv*j+i] = ohd[nv*i+j];45 }46 }47 for (i = 1; i < nv; i++) {48 notdone[i] = 1;49 mind[i] = ohd[i];50 }51 }52
53 // finds closest to 0 among notdone, among s through e; returns min54 // distance in *d, closest vertex in *v55 void findmymin(int s, int e, int *d, int *v)56 { int i;57 *d = MAXINT;58 for (i = s; i <= e; i++)59 if (notdone[i] && mind[i] < *d) {60 *d = mind[i];61 *v = i;62 }63 }64
65 // for each i in {s,...,e}, ask whether a shorter path to i exists, through66 // mv67 void updatemind(int s, int e)68 { int i;69 for (i = s; i <= e; i++)70 if (notdone[i])71 if (mind[mv] + ohd[mv*nv+i] < mind[i])72 mind[i] = mind[mv] + ohd[mv*nv+i];73 }74
75 void dowork()76 {77 #pragma omp parallel78 { int startv,endv, // start, end vertices for this thread79 step, // whole procedure goes nv steps80 mymv, // vertex which attains that value81 me = omp_get_thread_num(),82 mymd; // min value found by this thread83 #pragma omp single84 { nth = omp_get_num_threads(); chunk = nv/nth;85 printf("there are %d threads\n",nth); }86 startv = me * chunk;87 endv = startv + chunk - 1;88 // the algorithm goes through nv iterations89 for (step = 0; step < nv; step++) {90 // find closest vertex to 0 among notdone; each thread finds91 // closest in its group, then we find overall closest92 #pragma omp single93 { md = MAXINT;94 mv = 0;95 }96 findmymin(startv,endv,&mymd,&mymv);
Debugging In A Multiple-Activities Context 33
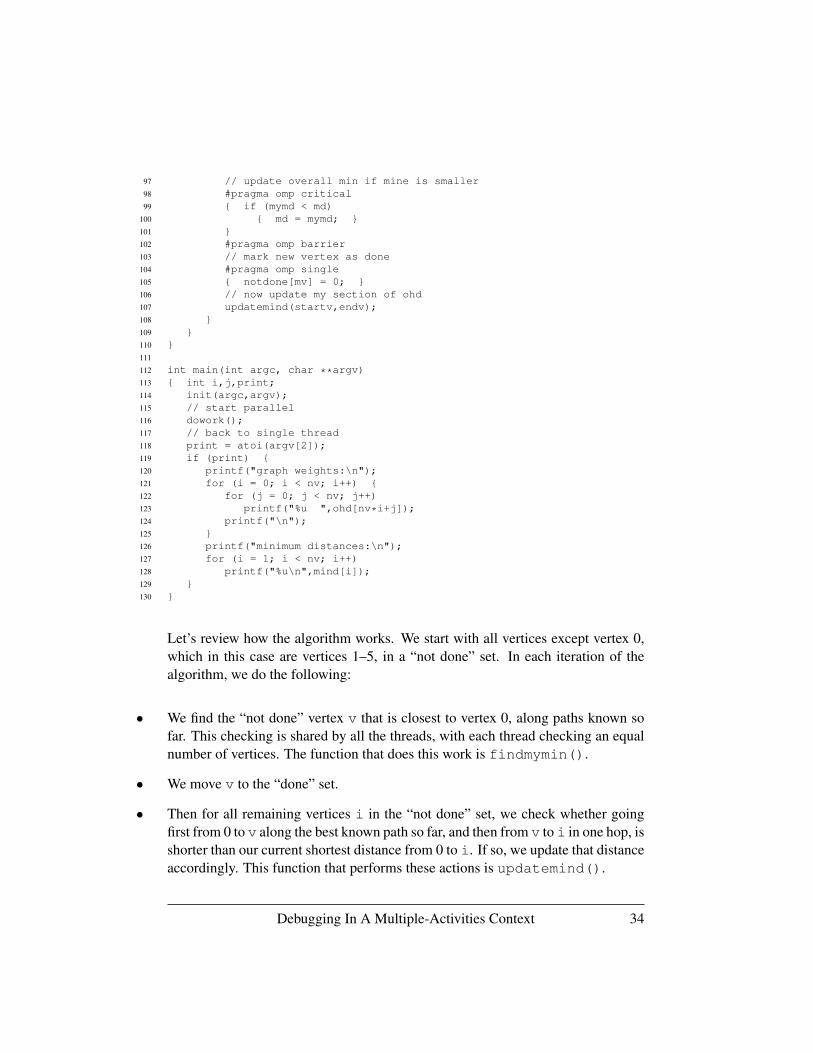
97 // update overall min if mine is smaller98 #pragma omp critical99 { if (mymd < md)
100 { md = mymd; }101 }102 #pragma omp barrier103 // mark new vertex as done104 #pragma omp single105 { notdone[mv] = 0; }106 // now update my section of ohd107 updatemind(startv,endv);108 }109 }110 }111
112 int main(int argc, char **argv)113 { int i,j,print;114 init(argc,argv);115 // start parallel116 dowork();117 // back to single thread118 print = atoi(argv[2]);119 if (print) {120 printf("graph weights:\n");121 for (i = 0; i < nv; i++) {122 for (j = 0; j < nv; j++)123 printf("%u ",ohd[nv*i+j]);124 printf("\n");125 }126 printf("minimum distances:\n");127 for (i = 1; i < nv; i++)128 printf("%u\n",mind[i]);129 }130 }
Let’s review how the algorithm works. We start with all vertices except vertex 0,which in this case are vertices 1–5, in a “not done” set. In each iteration of thealgorithm, we do the following:
• We find the “not done” vertex v that is closest to vertex 0, along paths known sofar. This checking is shared by all the threads, with each thread checking an equalnumber of vertices. The function that does this work is findmymin().
• We move v to the “done” set.
• Then for all remaining vertices i in the “not done” set, we check whether goingfirst from 0 to v along the best known path so far, and then from v to i in one hop, isshorter than our current shortest distance from 0 to i. If so, we update that distanceaccordingly. This function that performs these actions is updatemind().
Debugging In A Multiple-Activities Context 34
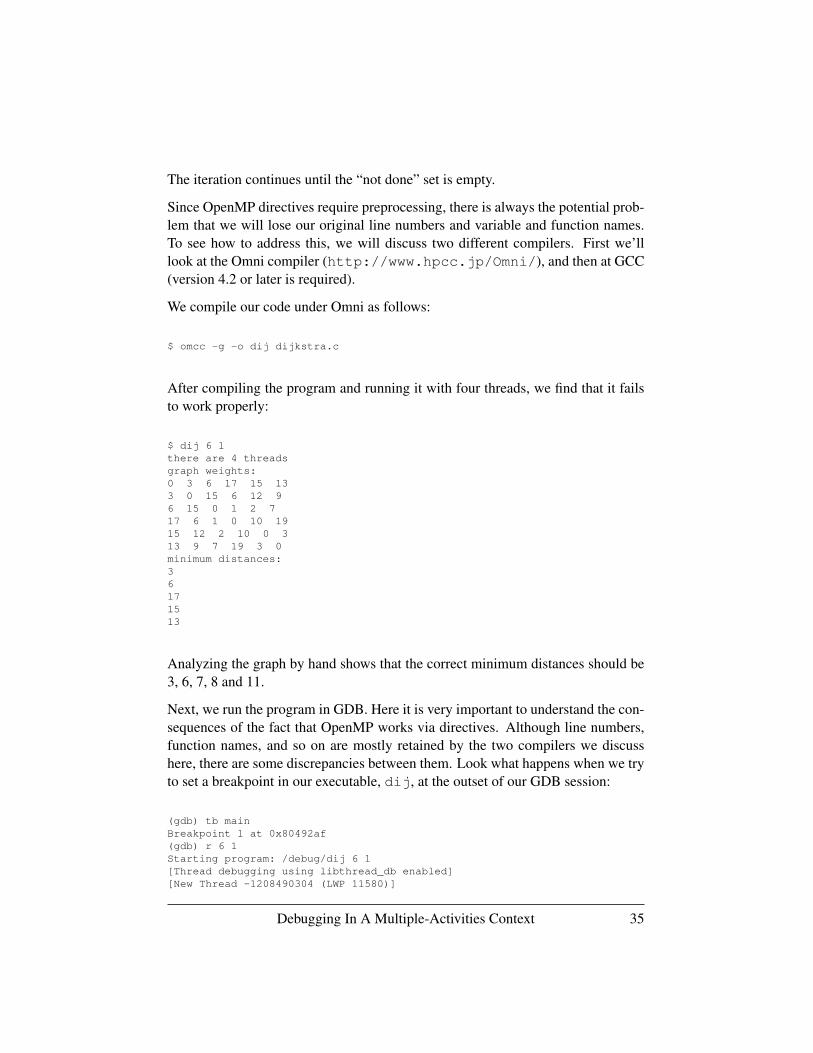
The iteration continues until the “not done” set is empty.
Since OpenMP directives require preprocessing, there is always the potential prob-lem that we will lose our original line numbers and variable and function names.To see how to address this, we will discuss two different compilers. First we’lllook at the Omni compiler (http://www.hpcc.jp/Omni/), and then at GCC(version 4.2 or later is required).
We compile our code under Omni as follows:
$ omcc -g -o dij dijkstra.c
After compiling the program and running it with four threads, we find that it failsto work properly:
$ dij 6 1there are 4 threadsgraph weights:0 3 6 17 15 133 0 15 6 12 96 15 0 1 2 717 6 1 0 10 1915 12 2 10 0 313 9 7 19 3 0minimum distances:36171513
Analyzing the graph by hand shows that the correct minimum distances should be3, 6, 7, 8 and 11.
Next, we run the program in GDB. Here it is very important to understand the con-sequences of the fact that OpenMP works via directives. Although line numbers,function names, and so on are mostly retained by the two compilers we discusshere, there are some discrepancies between them. Look what happens when we tryto set a breakpoint in our executable, dij, at the outset of our GDB session:
(gdb) tb mainBreakpoint 1 at 0x80492af(gdb) r 6 1Starting program: /debug/dij 6 1[Thread debugging using libthread_db enabled][New Thread -1208490304 (LWP 11580)]
Debugging In A Multiple-Activities Context 35

[Switching to Thread -1208490304 (LWP 11580)]0x080492af in main ()(gdb) l1 /tmp/omni_C_11486.c: No such file or directory.
in /tmp/omni_C_11486.c
We discover that the breakpoint is not in our source file. Instead, it is inOmni’s OpenMP infrastructure code. In other words, main() here is Omni’smain(), not our own. The Omni compiler mangled the name of our main() toompc main().
So, to set a breakpoint at our main(), we type
(gdb) tb _ompc_mainBreakpoint 2 at 0x80491b3: file dijkstra.c, line 114.
and check it by continuing:
(gdb) cContinuing.[New Thread -1208493152 (LWP 11614)][New Thread -1218983008 (LWP 11615)][New Thread -1229472864 (LWP 11616)]_ompc_main (argc=3, argv=0xbfab6314) at dijkstra.c:114114 init(argc,argv);
OK, there’s our familiar init() line. Of course, we also could have issued thecommand
(gdb) b dijkstra.c:114
Note the creation of the three new threads, making four in all.
However we choose to set our breakpoints, we must go to a bit more work herethan normal, so it’s extra important to stay within a single GDB session betweenruns of our program, even when we change our source code and recompile, so thatwe retain the breakpoints, conditions, and so on. That way we only have to go tothe trouble of setting these things up once.
Now, how do we track down the bug(s)? It is natural to approach the debugging ofthis program by checking the results at the end of each iteration. The main resultsare in the “not done” set, i.e. in the array notdone[], and in the current list ofbest known distances from 0 to the other vertices, that is, the array mind[]. For
Debugging In A Multiple-Activities Context 36

example, after the first iteration, the “not done” set should consist of vertices 2, 3,4, and 5, vertex 1 having been selected in that iteration.
Armed with this information, let’s apply our Principle of Confirmation and checknotdone[] and mind[] after each iteration of the for loop in dowork().
We have to be careful as to exactly where we set our breakpoints. Although anatural spot for this seems to be line 108, at the very end of the algorithm’s mainloop, this may not be so good, as GDB will stop there for each thread. Instead, weopt for placing a breakpoint inside an OpenMP single block, so that we’ll stopfor only one thread.
So, instead we’ll check the results after each iteration by stopping at the beginningof the loop, starting with the second iteration:
(gdb) b 92 if step >= 1Breakpoint 3 at 0x80490e3: file dijkstra.c, line 92.(gdb) cContinuing.there are 4 threads
Breakpoint 3, __ompc_func_0 () at dijkstra.c:9393 { md = MAXINT;
Let’s confirm that the first iteration did choose the correct vertex, vertex 1, to bemoved out of the “not done” set:
(gdb) p mv$1 = 0
Our hypothesis does not confirm after all. Inspection of our code shows that online 99 we forgot to set mv. We fix it to read
{ md = mymd; mv = mymv; }
So, we recompile and run the program again. As noted earlier in this section (andelsewhere in this book), it is very helpful to not exit GDB when we rerun theprogram. We could run the program in another terminal window, but just for varietylet’s take a different approach here. We’ll temporarily disable our breakpoints, byissuing the dis command, then run the recompiled program from within GDB,and then re-enable the breakpoints using ena:
Debugging In A Multiple-Activities Context 37

(gdb) dis(gdb) rThe program being debugged has been started already.Start it from the beginning? (y or n) y‘/debug/dij’ has changed; re-reading symbols.Starting program: /debug/dij 6 1[Thread debugging using libthread_db enabled][New Thread -1209026880 (LWP 11712)][New Thread -1209029728 (LWP 11740)][New Thread -1219519584 (LWP 11741)][New Thread -1230009440 (LWP 11742)]there are 4 threadsgraph weights:0 3 6 17 15 133 0 15 6 12 96 15 0 1 2 717 6 1 0 10 1915 12 2 10 0 313 9 7 19 3 0minimum distances:36171513
Program exited with code 06.(gdb) ena
We’re still getting wrong answers. Let’s check things at that breakpoint again:
(gdb) rStarting program: /debug/dij 6 1[Thread debugging using libthread_db enabled][New Thread -1209014592 (LWP 11744)][New Thread -1209017440 (LWP 11772)][New Thread -1219507296 (LWP 11773)][New Thread -1229997152 (LWP 11774)]there are 4 threads[Switching to Thread -1209014592 (LWP 11744)]
Breakpoint 3, __ompc_func_0 () at dijkstra.c:9393 { md = MAXINT;(gdb) p mv$2 = 1
At least mv now has the right value. Let’s check mind[]:
(gdb) p *mind@6$3 = {0, 3, 6, 17, 15, 13}
Debugging In A Multiple-Activities Context 38

Note that because we constructed the mind[] array dynamically via malloc(),we could not use GDB’s print command in its usual form. Instead, we usedGDB’s artificial array feature.
At any rate, mind[] is still incorrect. For instance, mind[3] should be 3+6 = 9,yet it is 17. Let’s check the code that updates mind[]:
(gdb) b 107 if me == 1Breakpoint 4 at 0x8049176: file dijkstra.c, line 107.(gdb) rThe program being debugged has been started already.Start it from the beginning? (y or n) yStarting program: /debug/dij 6 1[Thread debugging using libthread_db enabled][New Thread -1209039168 (LWP 11779)][New Thread -1209042016 (LWP 11807)][New Thread -1219531872 (LWP 11808)][New Thread -1230021728 (LWP 11809)]there are 4 threads[Switching to Thread -1230021728 (LWP 11809)]
Breakpoint 4, __ompc_func_0 () at dijkstra.c:107107 updatemind(startv,endv);
First we’ll confirm that startv and endv have sensible values:
(gdb) p startv$4 = 1(gdb) p endv$5 = 1
Our chunk size is only 1? Let’s see:
(gdb) p chunk$6 = 1
After checking the computation for chunk, we realize that we need the numberof threads to evenly divide nv. The latter has the value 6, which is not divisibleby our thread count, 4. We make a note to ourselves to insert some error-catchingcode later, and we decide to reduce our thread count to 3 for now.
Once again, we do not want to exit GDB to do this. GDB inherits the environmentvariables when it is first invoked, but the values of those variables can also bechanged or set within GDB, and that is what we do here:
(gdb) set environment OMP_NUM_THREADS = 3
Debugging In A Multiple-Activities Context 39

Now let’s run again:
(gdb) dis(gdb) rThe program being debugged has been started already.Start it from the beginning? (y or n) yStarting program: /debug/dij 6 1[Thread debugging using libthread_db enabled][New Thread -1208707392 (LWP 11819)][New Thread -1208710240 (LWP 11847)][New Thread -1219200096 (LWP 11848)]there are 3 threadsgraph weights:0 3 6 17 15 133 0 15 6 12 96 15 0 1 2 717 6 1 0 10 1915 12 2 10 0 313 9 7 19 3 0minimum distances:3671512
Program exited with code 06.(gdb) ena
Aiyah, still the same wrong answers! Let’s continue to check the updating processfor mind[]:
(gdb) rStarting program: /debug/dij 6 1[Thread debugging using libthread_db enabled][New Thread -1208113472 (LWP 11851)][New Thread -1208116320 (LWP 11879)][New Thread -1218606176 (LWP 11880)]there are 3 threads[Switching to Thread -1218606176 (LWP 11880)]
Breakpoint 4, __ompc_func_0 () at dijkstra.c:107107 updatemind(startv,endv);(gdb) p startv$7 = 2(gdb) p endv$8 = 3
All right, those are the correct values for startv and endv in the case of me =1. So, let’s enter the function:
Debugging In A Multiple-Activities Context 40

(gdb) s[Switching to Thread -1208113472 (LWP 11851)]
Breakpoint 3, __ompc_func_0 () at dijkstra.c:9393 { md = MAXINT;(gdb) cContinuing.[Switching to Thread -1218606176 (LWP 11880)]updatemind (s=2, e=3) at dijkstra.c:6969 for (i = s; i <= e; i++)
Note that due to context switches among the threads, we did not enterupdatemind() immediately. Now let’s check the case i = 3:
(gdb) tb 71 if i == 3Breakpoint 5 at 0x8048fb2: file dijkstra.c, line 71.(gdb) cContinuing.updatemind (s=2, e=3) at dijkstra.c:7171 if (mind[mv] + ohd[mv*nv+i] < mind[i])
As usual, we apply the Principle of Confirmation:
(gdb) p mv$9 = 0
Well, that’s a big problem. Recall that in the first iteration mv turns out to be 1;why is it 0 here?
After a while we realize that those context switches should have been a big hint tous. Take a look at the GDB output above again. The thread whose system ID is11851 was already on line 93—in other words, it was already in the next iterationof our algorithm’s main loop. In fact, when we hit c to continue, it even executedline 94, which is
mv = 0;
This thread overwrote mv’s previous value of 1, so that our thread that updatesmind[3] is now relying on the wrong value of mv. The solution is to add anotherbarrier:
updatemind(startv,endv);#pragma omp barrier
Debugging In A Multiple-Activities Context 41

After this fix, the program runs correctly.
The foregoing was based on the Omni compiler. As mentioned, beginning withversion 4.2, GCC handles OpenMP code as well. All you have to do is add the-fopenmp flag to the GCC command line.
Unlike Omni, GCC generates code in such a way that GDB’s focus is in your ownsource file from the beginning. Thus, issuing a command
(gdb) b main
at the very outset of a GDB session really will cause a breakpoint to be set in one’sown main(), unlike what we saw for the Omni compiler.
However, at this writing, a major shortcoming of GCC is that the symbols for localvariables that are inside an OpenMP parallel block (called private variables inOpenMP terminology) will not be visible within GDB. For example, the command
(gdb) p mv
that we issued for the Omni-generated code above will work for GCC-generatedcode, but our command above
(gdb) p startv
will fail on GCC-generated code.
There are ways to work around this, of course. For instance, if we wish to know thevalue of startv, we can query the value of s within updatemind(). Hope-fully this issue will be resolved in next version of GCC.
Debugging In A Multiple-Activities Context 42