decadal changes in the physical mechanisms of the seasonal
TRANSCRIPT

Decadal changes in the physical mechanisms of the seasonal cycleof summertime precipitation variability in Korea
Joon-Woo Roh,1,2 Kwang-Yul Kim,1 and Jong-Ghap Jhun1,3
Received 1 December 2011; revised 8 March 2012; accepted 8 March 2012; published 14 April 2012.
[1] Summertime precipitation variability in Korea has changed significantly in recentyears. To understand how the physical mechanisms of summertime precipitation in Koreavary with climate change, we analyzed observed precipitation records for 1996–2008 incomparison with those for 1979–1995 at 61 Korea Meteorological Administration stationsdistributed over South Korea. We investigated detailed physical changes by extractingspace-time structures of the physical mechanisms from the daily NCEP/NCAR reanalysisdata over East Asia via cyclostationary EOF (CSEOF) analysis. Due to the change oflow-level circulation patterns in the Asian region, the commencement, duration, and retreatof the East Asian monsoon front has varied significantly over recent years. Specifically,the first peak of the bimodal precipitation pattern in Korea has started earlier andsignificantly increased in intensity. The second peak has broadened in recent years and thetypical seasonal period of decreased precipitation has weakened. The strength of thesub-seasonal component of precipitation has increased in recent years due to thestrengthening of meridional circulation between the subtropics and the midlatitudes.A conspicuous change in the vertical structure of the sub-seasonal component is observedin recent records. Increased warm and moist advection from the south and decreasedcold and dry advection from the north seem to be the primary reasons for such a change.The high-frequency component of summer precipitation with time scales shorter than10 days is formed by the baroclinic instability observed in recent years. This componenthas increased by �25% due primarily to the strengthened dynamic and thermodynamicprocesses.
Citation: Roh, J.-W., K.-Y. Kim, and J.-G. Jhun (2012), Decadal changes in the physical mechanisms of the seasonal cycle ofsummertime precipitation variability in Korea, J. Geophys. Res., 117, D07115, doi:10.1029/2011JD017268.
1. Introduction
[2] Precipitation change and its social and economicaleffects are currently of great practical importance. Groismanet al. [2005] found a widespread increase in the frequency ofvery heavy precipitation in the midlatitudes during the past50 to 100 years. Emori and Brown [2005] suggested that agreater increase in global mean water vapor tends to yield agreater global mean thermodynamic increase in extremeprecipitation based on model results. Held and Soden [2006]used numerical models to examine changes in the hydro-logical cycle. Such changes include a decrease in convectivemass fluxes, an increase in horizontal moisture transport,associated enhancement of the pattern of evaporation minusprecipitation and its temporal variance, and a decrease in thehorizontal sensible heat transport in the extratropics. An
issue of local importance in recent years is the significantchange in local precipitation levels. Extreme precipitationevents have been projected to increase, but the cause and themechanism of increase are not clear. However, globalwarming, one of the biggest environmental issues in recentyears, is generally suspected to be responsible for suchchanges.[3] Trenberth [1999] asserted that the enhancement of
atmospheric moisture content feeds increased moisture to allweather systems. On a global mean basis, annual meanprecipitation is constrained by the energy balance betweenatmospheric radiative cooling and latent heating, which isexpected to limit the mean precipitation increase to be lowerthan the rate of atmospheric moisture increase [Allen andIngram, 2002]. On a regional basis, Emori and Brown[2005] showed that areas of extreme changes in precipita-tion are limited to a few regions. Thus, detailed mechanismsof heavy rainfall need to be examined individually onregional scales. Summertime precipitation variability inKorea has also changed significantly in recent years. In thisstudy, local changes in summer precipitation variability inKorea are investigated.[4] Korean summertime rainfall, accounting for about
three-fourths of the mean yearly precipitation, is primarily
1School of Earth and Environmental Sciences, Seoul NationalUniversity, Seoul, South Korea.
2Forecast Research Laboratory, National Institute of MeteorologicalAdministration, Seoul, South Korea.
3Research Institute of Oceanography, Seoul National University, Seoul,South Korea.
Copyright 2012 by the American Geophysical Union.0148-0227/12/2011JD017268
JOURNAL OF GEOPHYSICAL RESEARCH, VOL. 117, D07115, doi:10.1029/2011JD017268, 2012
D07115 1 of 17

caused by Changma, which denotes a rainy period associ-ated with the monsoon front and localized heavy rainfallwith convective instability [Lee, 2004]. The Changma frontis a quasi-stationary cold front between the continental coldlow from the Asian continent and the subtropical high fromthe western North Pacific [Lee, 2004; Ninomiya and Mizuno,1987]. Changma is regarded as a local component of theEast Asian summer monsoon [Ding, 2004; Wang and Ho,2002; Tao and Chen, 1987] or, more generally, a part ofthe Asian summer monsoon [Lim et al., 2002]. In regard tothe dynamic and thermodynamic features, summertime pre-cipitation over Korea is characterized by strong baroclinicityeven though the atmosphere over Korea is generally ther-modynamically neutral. This contrasts with the large con-vective available potential energy in the central UnitedStates of America [Hong, 2004]. Observational recordsexhibit a strong decadal change in the East Asian summermonsoon. In the current decade, for example, negative cor-relations between the intensity of the East Asian summermonsoon and that of the western North Pacific summermonsoon are much stronger compared with the last decade[Kwon et al., 2005].[5] Kim and Suh [2009] examined the change point and
pattern of the annual and heavy rainfall characteristics overSouth Korea during 1954–2007 using a Bayesian approach.Statistically significant change in the days and the amount ofheavy precipitation occurred in approximately 1996 or 1997.In this study, climatological (long-term and/or decadal)change of the seasonal cycle of summertime precipitation inKorea is investigated in the context of the underlying
physical mechanisms. Kim et al. [2010] showed that theseasonal cycle of the summertime precipitation variability inKorea consists of three components of distinct physicalmechanisms—the seasonal component, the sub-seasonalcomponent, and the high-frequency component. Thus, thephysical changes in the seasonal cycle will be compared inthe context of three distinct physical mechanisms betweenthe early period, 1979–1995 and the late period, 1996–2008using the observed precipitation records at 61 Korea Mete-orological Administration stations. Detailed physical struc-tures and their changes will be derived from various physicalvariables of the NCEP/NCAR reanalysis data set using thecyclostationary EOF (CSEOF) technique [Kim et al., 1996;Kim and North, 1997]. The primary goal of this study is toimprove our understanding of the impacts of climate changeon regional and local physical mechanisms of summer pre-cipitation over the Asian region. This will also help usunderstand the changes in local summertime precipitationvariability in Korea from dynamic and physical viewpoints.[6] The data used in this study are described in section 2,
followed by a description of the analytical tools used,including the CSEOF technique, in section 3. In section 4,results of the analyses are presented with correspondingphysical and dynamic interpretations. Concluding remarksare presented in section 5.
2. Data
[7] Precipitation data in Korea are the daily averagedmeasurements at 61 Korea Meteorological Association
Figure 1. The locations and station numbers of 61 Korea Meteorological Administration stations inSouth Korea.
ROH ET AL.: DECADAL CHANGES IN SUMMER PRECIPITATION D07115D07115
2 of 17

(KMA) stations distributed throughout South Korea(�126�–130�E, �33�–38�N) as shown in Figure 1. For thepresent analysis, 120 summer days from May 19 throughSeptember 15 spanning 30 years (1979–2008) were used. Todraw a connection between local precipitation and physicalprocesses over Asia, multilevel 2.5� � 2.5� daily geopo-tential height (GPH), temperature, wind, omega velocity(W), and specific humidity fields were taken from the dailyNCEP/NCAR reanalysis data set [Kalnay et al., 1996].Gridded daily NCEP/NCAR precipitation rates are availablein the form of a 1.875� � 94 Gaussian array.
3. Method of Analysis
[8] The primary reason for utilizing the CSEOF technique[Kim et al., 1996; Kim and North, 1997] is to extract phys-ical evolutions from variables in such a way that they arephysically consistent with each other. CSEOF analysis wasconducted on the 30-year (1979–2008: TOT) record of120-day summer precipitation measurements at 61 KMAstations in Korea:
P s; tð Þ ¼ ∑nLVn s; tð ÞPCn tð Þ; ð1Þ
where LVn(s, t) are CSEOF loading vectors (CSLV), PCn(t)are corresponding principal component (PC) time series,and s denotes the KMA station index (Figure 1). Manystudies indicated a climate regime shift in approximately1996 [e.g., Kim and Suh, 2009]. To understand any changesaround this shifting point, CSEOF analyses were carried outfor the first 17-year (1979–1995; PRE) record and for thelast 13-year (1996–2008; POS) record.[9] The nested periodwas set to be 120 days (1 summer year).
To investigate physical processes associated with the sum-mertime precipitation variability in Korea, CSEOF analyseswere similarly conducted on key physical variables over theAsian domain (80�–180�E � 0�–60�N).[10] Then, regression analysis was conducted on the PC
time series of precipitation in Korea (target) and the PC timeseries of other physical variables over the Asian region(predictors) to construct physical evolutions that are con-sistent with the physical evolution of precipitation in Korea[Seo and Kim, 2003]. As a result of the CSEOF analysisfollowed by regression analysis in CSEOF space, data canbe written as
Data r; tð Þ ¼ ∑n Pn r; tð Þ;Hn r; tð Þ;Vn r; tð Þ;…; Tn r; tð Þf gPCn tð Þ;ð2Þ
where {Pn(r, t), Hn(r, t), Vn(r, t),…, Tn(r, t)} denotes thephysical evolutions of various physical variables investi-gated in the present study. These spatial and temporalpatterns of evolutions describe the detailed nature ofindividual physical processes associated with the vari-ability of precipitation in Korea. The physical consistency of{Pn(r, t), Hn(r, t), Vn(r, t),…, Tn(r, t)} is expressed such thatall the physical evolutions in curly brackets have a commonamplitude time series, PCn(t), whereas physical evolutions inindividual variables may not be the same. In fact,{Pn(r, t), Hn(r, t), Vn(r, t),…, Tn(r, t)} are physically
connected in terms of dynamic and thermodynamic equa-tions governing the physics of each mode.
4. Results and Discussion
[11] Figure 2 shows the first CSEOF of summertime pre-cipitation in Korea for TOT years, PRE years, and POSyears. The solid lines are the loading vectors averaged overthe 61 KMA stations. This mode represents the seasonalcycle. The first CSEOF explains �17% of the total vari-ability during TOT years. The amplitude of the seasonalcycle fluctuates annually at approximately 7.71 with astandard deviation of 2.44 (Figure 2d). Figures 2b and 2calso represent the first CSEOFs of summertime precipita-tions during PRE and POS years and explain �18% and�20% of total variability, respectively. The amplitude of theseasonal cycle fluctuates annually at approximately 7.77 and8.66 with standard deviations of 2.93 and 3.93 in PRE andPOS years, respectively (Figure 2d). The amplitude of theseasonal cycle and the standard deviation have increasedremarkably in POS years (Table 1).[12] Kim et al. [2010] identified three distinct physical
mechanisms associated with the seasonal cycle of Koreansummertime precipitation variability. The 10–30 day sub-seasonal component of variability was obtained via band-pass filtering [Newton, 1988] with periods of 10–30 days.Similarly, high-frequency components of variability withperiods shorter than 10 days were derived via high-pass fil-tering with a cut-off period of 10 days. The seasonal com-ponent of variability on time scales greater than 30 days wasobtained by removing the sub-seasonal and the high-frequency components of variability from the seasonalcycle. Recent changes in the physical mechanisms of theseasonal cycle of precipitation will be addressed in terms ofthe three components of variability. It should be notedthat this study investigates the sub-seasonal and the high-frequency components of variability associated with the sea-sonal cycle. There may be sub-seasonal and high-frequencyvariability in higher modes as well, which is not dealt with inthe present study.
4.1. Seasonal Component of the Seasonal Cycle
[13] The dotted curves in Figures 2a–2c represent theseasonal cycle of summertime precipitation in Korea afterremoving the sub-seasonal and high-frequency componentsof variability with time scales shorter than 30 days (hereafterseasonal component). The three figures represent TOT(1979–2008), PRE (1979–1995), and POS (1996–2008)observational records, respectively. The seasonal componentof summertime precipitation variability based on the entirerecord is characterized by two main peaks in the first half ofJuly and in the second half of August separated by a periodof weakened precipitation; the seasonal evolution inFigure 2a clearly exhibits the bimodal structure [Qian et al.,2002; Chen et al., 2003; Lee et al., 2010; Ho and Kang,1988]. The first precipitation spell is called Changma inKorea, and is also called Baiu in Japan and Mei-Yu inChina. The second spell of precipitation is called the secondChangma or post-Changma in Korea [Lim et al., 2002]. Cli-matologically, the primary rainy period in Korea commencesin late June in association with the eastward movement of
ROH ET AL.: DECADAL CHANGES IN SUMMER PRECIPITATION D07115D07115
3 of 17

the Tibetan High and the westward movement of the NorthPacific High toward East Asia forming a monsoon troughover the Korean peninsula [Kang et al., 1999]. As themonsoon trough moves further north to the northeast ofAsia, the period of weakened precipitation develops over theKorean peninsula in early August. In late August, when themonsoon trough retreats southward to the Korean peninsula,the second Changma starts.[14] While the seasonal component of summer precipita-
tion in Korea, based on the PRE record, exhibits the typicalbimodal characteristics of summer precipitation, the sea-sonal evolution based on the POS record is different fromthat based on the PRE record. A comparison between PRE(Figure 2b) and POS (Figure 2c) data shows that the firstspell of precipitation, which typically lasts from July 1through July 20, appeared earlier in recent records and hasincreased significantly. The magnitude of the station-averaged precipitation, on average, has increased from163 mm to 213 mm during the 20-day (July 1–20) period,which is a 30% increase. The second peak has broadenedsignificantly without a well-developed period of decreasedprecipitation. The PC time series in Figure 2d give animpression that the year 2003 may have caused the differ-ence between the PRE record and the POS record shown inFigures 2b and 2c. CSEOF analysis on the POS recordswithout the year 2003 results in the seasonal component(figure not shown), which is very similar to Figure 3; thisconfirms that the substantial difference between the PREand the POS records is not due to the year 2003. In fact, a
super typhoon “Maemi” in 2003 caused heavy precipitationin Korea. The direct and indirect influences of typhoonswere separated mainly as the second and third modes; theseasonal cycle was not seriously contaminated by thetyphoons particularly in 2003.[15] To investigate the spatial pattern of the decadal
change, the seasonal components of summertime precipita-tion at 61 KMA stations in Korea (dotted lines in Figure 2)for PRE and POS years are shown in Figure 3. While thebimodal structure is clearly observed at most stations in PREyears (Figure 3a), it is not apparent at stations 1–25 in POSyears (Figure 3b); these stations are located in the northernpart of South Korea to the north of �37�N and the westernpart to the north of �36�N (see Figure 1). Excludingstations 11–14 with mountainous geographical character-istics, the seasonal components of precipitation in POS years(solid line) and in PRE years (dotted line) were comparedbetween stations 1–25 and stations 26–61 in Figure 4. In the
Figure 2. The first CSEOF of summertime precipitation at 61 KMA stations in Korea: precipitationin mm/day averaged over all 61 stations (solid) and the seasonal evolution (dotted) after removing high-frequency (<10 days) and sub-seasonal (10–30 days) components of variability: (a) total (TOT) precipi-tation data, as well as data from (b) PRE and (c) POS years; (d) PC time series for TOT (dotted), PRE(solid), and POS (solid) years.
Table 1. Percent Variability, Amplitude, and Standard Deviationof the Seasonal Cycle of the Daily Precipitation at 61 KMAStations for TOT, PRE, and POS Years
Case Percent Variability Amplitude Standard Deviation
TOT 16.65 7.71 2.44PRE 18.03 7.77 2.93POS 19.86 8.66 3.93
ROH ET AL.: DECADAL CHANGES IN SUMMER PRECIPITATION D07115D07115
4 of 17
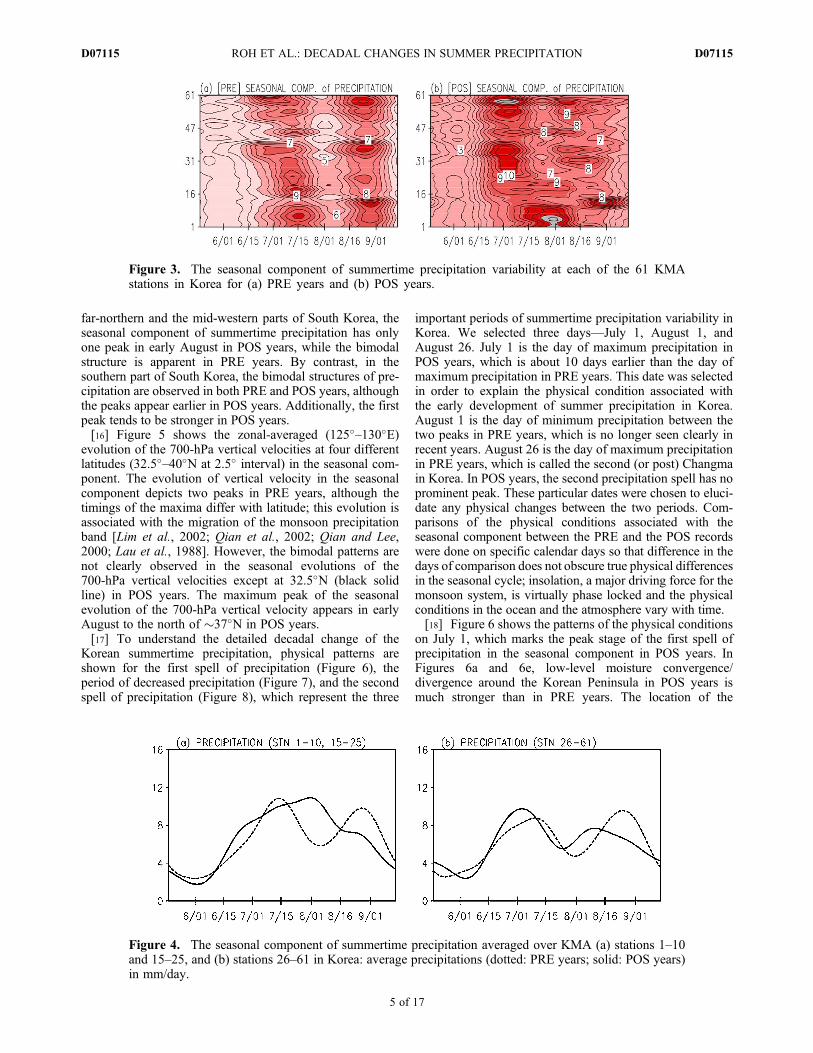
far-northern and the mid-western parts of South Korea, theseasonal component of summertime precipitation has onlyone peak in early August in POS years, while the bimodalstructure is apparent in PRE years. By contrast, in thesouthern part of South Korea, the bimodal structures of pre-cipitation are observed in both PRE and POS years, althoughthe peaks appear earlier in POS years. Additionally, the firstpeak tends to be stronger in POS years.[16] Figure 5 shows the zonal-averaged (125�–130�E)
evolution of the 700-hPa vertical velocities at four differentlatitudes (32.5�–40�N at 2.5� interval) in the seasonal com-ponent. The evolution of vertical velocity in the seasonalcomponent depicts two peaks in PRE years, although thetimings of the maxima differ with latitude; this evolution isassociated with the migration of the monsoon precipitationband [Lim et al., 2002; Qian et al., 2002; Qian and Lee,2000; Lau et al., 1988]. However, the bimodal patterns arenot clearly observed in the seasonal evolutions of the700-hPa vertical velocities except at 32.5�N (black solidline) in POS years. The maximum peak of the seasonalevolution of the 700-hPa vertical velocity appears in earlyAugust to the north of �37�N in POS years.[17] To understand the detailed decadal change of the
Korean summertime precipitation, physical patterns areshown for the first spell of precipitation (Figure 6), theperiod of decreased precipitation (Figure 7), and the secondspell of precipitation (Figure 8), which represent the three
important periods of summertime precipitation variability inKorea. We selected three days—July 1, August 1, andAugust 26. July 1 is the day of maximum precipitation inPOS years, which is about 10 days earlier than the day ofmaximum precipitation in PRE years. This date was selectedin order to explain the physical condition associated withthe early development of summer precipitation in Korea.August 1 is the day of minimum precipitation between thetwo peaks in PRE years, which is no longer seen clearly inrecent years. August 26 is the day of maximum precipitationin PRE years, which is called the second (or post) Changmain Korea. In POS years, the second precipitation spell has noprominent peak. These particular dates were chosen to eluci-date any physical changes between the two periods. Com-parisons of the physical conditions associated with theseasonal component between the PRE and the POS recordswere done on specific calendar days so that difference in thedays of comparison does not obscure true physical differencesin the seasonal cycle; insolation, a major driving force for themonsoon system, is virtually phase locked and the physicalconditions in the ocean and the atmosphere vary with time.[18] Figure 6 shows the patterns of the physical conditions
on July 1, which marks the peak stage of the first spell ofprecipitation in the seasonal component in POS years. InFigures 6a and 6e, low-level moisture convergence/divergence around the Korean Peninsula in POS years ismuch stronger than in PRE years. The location of the
Figure 3. The seasonal component of summertime precipitation variability at each of the 61 KMAstations in Korea for (a) PRE years and (b) POS years.
Figure 4. The seasonal component of summertime precipitation averaged over KMA (a) stations 1–10and 15–25, and (b) stations 26–61 in Korea: average precipitations (dotted: PRE years; solid: POS years)in mm/day.
ROH ET AL.: DECADAL CHANGES IN SUMMER PRECIPITATION D07115D07115
5 of 17

moisture convergence band over the Korean Peninsula inPOS years is shifted slightly northward relative to that inPRE years. This is consistent with the observation that thefirst peak of precipitation appears earlier and has increasedin intensity in recent years. A stronger moisture conver-gence in POS years can be explained in terms of the changein the low-level circulation and the resulting moisturetransport (Figures 6c and 6g). A stronger pressure contrastbetween the Asian continent and the ocean induces strongersouthwesterly anomalies along the eastern side of the Asiancontinent, which, in turn, increases moisture convergenceover the East Asian countries; warm advection and moistureconvergence over Korea by the southwesterly anomaly areregarded as the typical pattern of the East Asian summermonsoon front. The fact that the positive 850-hPa GPHanomaly to the south of Korea is relatively closer to Koreain POS years explains the observation that the firstChangma starts earlier in POS years.[19] Meanwhile, patterns of 500-hPa GPH and wind in
PRE and POS years are similar to each other as shown inFigures 6b and 6f. The meridional pressure gradient over theKorean peninsula, however, is stronger in PRE years;increased baroclinic instability associated with a stronger500-hPa GPH gradient over Korea in PRE years leads to astronger upward motion. Relatively strong upward motionover Korea is clearly observed at approximately 500 hPa inthe meridional vertical section (Figures 6d and 6h). Despiteslightly decreased upper-level upward motion over Korea inPOS years, relatively strong low-level convergence suggestsincreased precipitation in POS years.[20] A remarkable change in physical structures associ-
ated with the seasonal component of precipitation is alsoobserved in early August. Figures 7a–7d represent theAugust 1 physical condition during the period of decreasedprecipitation in PRE years, whereas Figures 7e–7h describethe physical condition on the same day in POS years. The
pressure gradient between the Asian continent and the sur-rounding oceans is no longer strong enough to support thesouthwesterly anomalies along the east coast of the Asiancontinent. Instead, low-level (925 hPa) easterly and south-easterly anomalies develop in conjunction with the positiveGPH anomalies to the east of Korea and negative GPHanomalies to the south of Korea (Figures 7a and 7e). In POSyears, the positive GPH anomaly to the east of Korea waslocated closer to the Korean Peninsula; as a result, strongersoutherly anomalies were induced toward the Korean pen-insula than in PRE years. Increased warm advection andmoisture advection toward Korea by the stronger low-levelsoutherly anomaly (comparison between Figures 7a and 7e)enhances convective instability of the atmosphere in POSyears as a comparison between Figures 7d and 7h shows.[21] Figures 7c and 7g show a zonal band of 500-hPa
positive vertical velocity anomalies at �15�N, a band ofnegative vertical velocity anomalies at�25�N, and a band ofpositive vertical velocity anomalies at �35�N; these arealigned in the meridional direction in the zonal band of110�–130�E. It appears that an enhanced upward motion inthe tropics (�10�–15�N) produced by strong convectiveinstability induces upper-level divergence and low-levelconvergence. As a result, a downward motion is induced inthe subtropics (�20�–25�N) with upper-level convergenceand lower-level divergence. Nitta [1987], in his observa-tional study, showed that an anticyclonic circulation asso-ciated with strong convective motions in low latitudes(15�–20�N) of the western Pacific is highly correlated witha circulation of opposite sign to the north. Then, an upwardmotion is induced in the midlatitudes (�30�–35�N). In thisway, meridionally oscillating patterns of 500-hPa verticalvelocities appear over the western North Pacific (Figures 7cand 7g). Similarly, oscillating patterns of relative vorticityanomalies in the meridional direction are observed at500 hPa (Figures 7b and 7f). The centers of these oscillation
Figure 5. The seasonal component of the zonal-averaged (125�–130�E) evolution of the 700 hPavertical velocity (interval: 1 � 10�2 Pa/sec) at 32.5�N (black solid), 35�N (red dashed), 37.5�N (greendash-dotted), and 40�N (blue dotted).
Figure 6. July 1 patterns of the seasonal evolution in (a and e) 1000–850 hPa moisture convergence (shaded at1� 10�8 kg/kg/sec intervals) and 1000-hPa GPH (contoured at 10 gpm interval) and wind >2 m/sec, (b and f) 500-hPa GPH(contoured at 60 gpm interval) and wind >2 m/sec (vector), (c and g) 850-hPa GPH (contoured at 3 gpm) and wind anoma-lies > 1 m/sec (vector), and (d and h) vertical meridional section of moisture convergence (shaded at 1 � 10�8 kg/kg/secintervals), vertical velocity anomalies (contoured at 1 � 10�2 Pa/sec) and wind anomalies >1 m/sec along 125�–130�E.The vertical component of winds have been scaled up by a factor of 100. Figures 6a–6d are for PRE years andFigures 6e–6h are for POS years.
ROH ET AL.: DECADAL CHANGES IN SUMMER PRECIPITATION D07115D07115
6 of 17

Figure 6
ROH ET AL.: DECADAL CHANGES IN SUMMER PRECIPITATION D07115D07115
7 of 17

Figure 7
ROH ET AL.: DECADAL CHANGES IN SUMMER PRECIPITATION D07115D07115
8 of 17

patterns are located closer to the Asian continent in POSyears than in PRE years (Figures 7b and 7c and Figures 7fand 7g). As a result, stronger negative relative vorticityand positive vertical velocity anomalies are observed overKorea in POS years than in PRE years (Figures 7b, 7d, 7fand 7h). In addition, Korea is located at the rear right ofthe entrance region of the upper-level jet (Figures 7band 7f). Korea is closer to the entrance region of the jet inPOS years, which suggests that upper-level divergencebecomes stronger in POS years [Bluestein, 1993; Keyserand Shapiro, 1986]. The role of the secondary circulationaround the upper level jet in regard to summertime heavyrainfall in Korea has been studied in many case studies [Leeet al., 2008, 1998]. Thus, relatively active convectivemotions are observed over Korea in POS years due tostronger low-level south wind anomalies, more active con-vective motion in the tropics, and the enhanced secondarycirculation near the entrance of the upper-level jet. For thesereasons, a period of decreased precipitation is not clearlyobserved in POS years.[22] Figure 8 shows the physical patterns on August 26;
this figure represents the period of the second rainy spellcaused by the reversal of the pressure gradient between thecontinent and the ocean [Lim et al., 2002]. A positive 925-hPa GPH anomaly is observed over the Asian continent anda negative GPH anomaly is observed over the southwesternNorth Pacific (Figures 8a and 8e), resulting in a strongpressure gradient between the two. Despite a weaker pres-sure gradient at 925 hPa, the easterly anomaly over Korea isstronger in PRE years. The location of a negative GPHanomaly is partly responsible for stronger easterly anomalyin PRE years. Specifically, the center of positive verticalvelocity in the tropics (�15�–20�N) is located at �130�E inPRE years (Figure 8c) whereas it is located at �140�E inPOS years (Figure 8g); as a result of this locational differ-ence, stronger vertical velocity is induced over Korea in PREyears, as shown in the meridional vertical cross section(Figures 8d and 8h). In addition, the upper-level jet overKorea in PRE years is also stronger, inducing strongerupper-level divergence than in POS years. These physicalconditions on August 26 explain the clear second spell ofprecipitation in PRE years, while the second spell of pre-cipitation in recent years is broader and weaker, as a com-parison between Figures 2b and 2c shows.[23] Figure 9 shows the zonal-averaged (125�–130�E)
evolutions of the 500-hPa vertical velocity in the seasonalcomponent. The positive 500-hPa vertical velocity anomalyin POS years migrates from �27�N in early June to �32�Nin early July, which corresponds to the initiation of the firstChangma in Korea. In POS years, the positive verticalvelocity anomaly arrives in Korea earlier and the strength is
greater than in PRE years. Compared with the PRE years,this frontal band has also broadened in August without asignificant weakening, particularly in the northern part ofKorea. As mentioned above, bands of vertical velocityanomalies with alternating signs are observed in the merid-ional direction. A north-south pair of positive verticalvelocity anomalies separated by a negative velocity anomalyis clearly observed from early August to late August in PREyears and from mid-July to mid-August in POS years. Infact, the 500-hPa positive vertical velocity anomaly at(127.5�E, 35�N) is positively correlated at over 0.8 with alow-latitudinal counterpart at (125�E, 10–15�N) during theperiod of active convections (July 16 to August 15) in POSyears. In PRE years, this correlation is over 0.9 during theperiod of August 1 to August 31. Thus, the climatologicalvariation of the seasonal component of summertime precip-itation variability in Korea appears to be correlated with thetropical variability of convection.
4.2. Sub-seasonal Component of the Seasonal Cycle
[24] Figure 10 represents the 10–30-day band-pass filteredand zonally averaged (127.5�–130�E) precipitation and low-level moisture convergence anomalies from the seasonalcycle in PRE years (Figure 10a) and in POS years(Figure 10c). The sub-seasonal component of the seasonalcycle of Korean summertime precipitation variability basedon the measurements at 61 KMA stations is reasonablysimilar to that derived from the NCEP/NCAR reanalysisdata; the sub-seasonal component of the NCEP/NCAR pre-cipitation averaged within the two vertical dotted lines(Figures 10a and 10c) is correlated with coefficients of 0.61and 0.81 with that of the KMA precipitation in PRE yearsand in POS years (Figures 10b and 10d), respectively.Anomalies with alternating signs appear to propagatenorthward with an averaged period of �15 days in PREyears and�13 days in POS years [e.g.,Wang et al., 2007]. Itshould be noted, however, that the impact of these seem-ingly northward propagating oscillations is limited to thesouthern part of South Korea (Figure 10).[25] Sub-seasonal oscillations of precipitation and
moisture convergence are not conspicuous throughout theentire 120-day period. In PRE years, sub-seasonal oscilla-tions between approximately 10�N and 30�N are not clearlyobserved, except for from late August through earlySeptember. Instead, seemingly southward propagation from�40�N to �30�N appears in mid-July, which is the periodof relatively active sub-seasonal precipitation in Korea inPRE years. Sub-seasonal oscillations are active from mid-July to mid-August in POS years; the magnitudes of theprecipitation and the low-level moisture convergence in theAsian domain are almost doubled in POS years comparedwith PRE years.
Figure 7. August 1 patterns of the seasonal evolution of (a and e) 925-hPa moisture convergence (shaded at 1 �10�8 kg/kg/sec intervals) and GPH anomalies (contoured at 3 gpm interval) and wind anomalies >1 m/sec,(b and f) 500-hPa relative vorticity anomalies (contoured at 1 � 10�5 sec�1 interval) and 200-hPa zonal wind ≥ 25 m/sec(shaded at 5 m/sec intervals), (c and g) 500-hPa vertical velocity anomalies (contoured at 1 � 10�2 Pa/sec), wind anomalies>1 m/sec (vector), and (d and h) vertical meridional sections of moisture convergence (shaded at 1 � 10�8 kg/kg/sec), ver-tical velocity anomalies (contoured at 1 � 10�2 Pa/sec), and wind anomalies >1 m/sec along 125�–130�E. The vertical com-ponent of wind has been scaled up by a factor of 100. Figures 7a–7d are for PRE years and Figures 7e–7h are for POS years.
ROH ET AL.: DECADAL CHANGES IN SUMMER PRECIPITATION D07115D07115
9 of 17

Figure 8. Same as Figure 7 but for August 26.
ROH ET AL.: DECADAL CHANGES IN SUMMER PRECIPITATION D07115D07115
10 of 17

[26] Figure 11 represents the positive composite fieldsassociated with the sub-seasonal component of the seasonalcycle. A positive composite pattern is defined by
C þð Þ rð Þ ¼ ∑Pf tð Þ>aPf tð Þ⋅LVPf r; tð Þ=ffiffiffiffiffiffiffiffiffiffiffiffiffiffiffiffiffiffiffiffiffiffiffiffiffiffi∑Pf tð Þ>aP
2f tð Þ
q; ð3Þ
where LVPf(r, t) denotes the sub-seasonal evolution of apredictor variable and Pf(t) is the sub-seasonal evolution ofthe summertime precipitation over Korea (Figures 10band 10d). Equation (3) is essentially a weighted averageof LVPf (r, t) with respect to the weight Pf (t). Note in (3)that LVPf (r, t) is averaged only when Pf (t) > a mm/dayand the threshold value a is 0.122 and 0.131 mm/day forPRE years and POS years, respectively; these thresholdvalues are taken to be a half of the respective standarddeviations. Negative composite patterns can be obtained ina similar manner (not shown).[27] During the positive phase of the sub-seasonal pre-
cipitation anomalies, oscillating patterns of GPH anomalies
are observed at 200 hPa along �40�N and correspondinganomalies of the same sign are observed between �110�Eand 170�E at 850 hPa along �40�N (Figures 11a, 11b, 11e,and 11f). The seemingly northward propagation in Figure 10seems to represent oscillations of meridional circulation cellsdue to nearly standing oscillations of midlatitude dis-turbances aloft (Figures 11b and 11f), as also addressed byKim et al. [2010]. The origin of the 200-hPa GPH anomaliesat �40�N is not clear but appears to be related to the typicalmidlatitude baroclinic waves [Holton, 1992]. A negative850 hPa GPH anomaly is observed to extend from thenortheast of Korea (�45�–50�N) to the southwest of Korea(�25�–30�N) in Figures 11a and 11e. Such a structure isreminiscent of a typical synoptic-scale background relatedto summertime heavy rainfall events in Korea addressed inprevious case studies [e.g., Lee et al., 2008; Kim and Lee,2006; Hong, 2004; Ninomiya, 2001, 2000; Lee et al.,1998; Ninomiya and Mizuno, 1987]. Lee et al. [1998]noted in a study of 10 heavy rainfall cases over Korea thata favorable synoptic background for heavy rainfall consists
Figure 9. The seasonal component of the zonal-averaged (125�–130�E) evolution of the 500-hPa verticalvelocity (interval: 1 � 10�2 Pa/sec). The two vertical dashed lines denote the meridional extent of the61 KMA stations.
ROH ET AL.: DECADAL CHANGES IN SUMMER PRECIPITATION D07115D07115
11 of 17

of warm advection from the south and cold advection fromnorthern China or Manchuria. As a result of this configu-ration, strong baroclinicity builds up over the KoreanPeninsula and its vicinity. Warm advection to the east ofKorea and cold advection to the west of Korea in con-junction with the negative GPH anomaly residing overKorea (Figures 11a and 11e) produce a favorable synopticbackground for heavy rainfall.[28] In PRE yeas, a positive 850-hPa specific humidity
(SHUM) anomaly with a southwesterly wind anomaly coversKorea and Japan. A negative SHUM anomaly appears to thenorthwest of Korea with a northerly anomaly (Figure 11a).The zonal vertical section (32.5�–40�N) shows that strongbaroclinicity builds up over Korea due to cold advection from
the northeast and warm advection from the southwest(Figures 11c and 11d). Cold advection from a shortwavetrough to the north of Korea and warm advection from thesouth with the supply of warm moist air constitute animportant mechanism of sub-seasonal variability from lateJune through mid-July. In POS years, warm advection isrelatively strong because of the increased pressure gradient tothe south of Korea (Figures 11e and 11h). Considering thatthe active period of the sub-seasonal fluctuation is later inPOS years than in PRE years (see Figure 10), positive GPHanomalies to the southeast of Korea are relatively strong andare shifted further northward in POS years; this results instronger warm advection in POS years. On the other hand,cold advection is relatively weak. The zonal cross section
Figure 10. (a and c): Sub-seasonal (10–30 day) component of precipitation (contours: 0.3 mm/day)and low-level (1000–850 hPa) moisture convergence (shade: 1 � 10�9 kg/kg/sec) anomalies along125�–130�E in the seasonal cycle, and (b and d): sub-seasonal component of precipitation (mm/day) inKorea averaged over the 61 KMA stations. The two vertical dotted lines in Figures 10a and 10c denotethe meridional extent of the 61 KMA stations. Figures 10a and 10b are for PRE years and Figures 10cand 10d are for POS years.
Figure 11. Positive composite of the sub-seasonal component of variability: (a and e) 850-hPa GPH (contour: 5 gpm), spe-cific humidity (shade: 1 � 10�4 kg/kg/sec), and wind >0.5 m/sec; (b and f) 200-hPa GPH (contour: 10 gpm), relative vor-ticity (shade: 1 � 10�5 sec�1), and wind >2 m/sec; (c and g) zonal cross section of GPH (contour: 4 gpm), relative vorticity(shade: 1 � 10�6 sec�1), and wind (u, �W) >0.5 m/s along the 32.5�–40�N band; (d and h) meridional cross section of GPH(contour: 4 gpm), vertical velocity anomalies (shade: 1 � 10�2 Pa/sec), and wind (v, �W) >0.5 m/s along the 122.5�–130�Eband. Figures 11a–11d are for PRE years and Figures 11e–11h are for POS years.
ROH ET AL.: DECADAL CHANGES IN SUMMER PRECIPITATION D07115D07115
12 of 17

Figure 11
ROH ET AL.: DECADAL CHANGES IN SUMMER PRECIPITATION D07115D07115
13 of 17

(32.5�–40�N) clearly shows a barotropic structure in POSyears (Figure 11g). Figures 11c and 11g suggest that theatmosphere is more barotropic than baroclinic because ofincreased warm advection and decreased cold advection inrecent years (Figures 11d and 11h). As a result, convective(barotropic) instability increases and is an important mecha-nism of the sub-seasonal variability in POS years.
4.3. High-Frequency Component of the Seasonal Cycle
[29] To investigate any physical change in the high-frequency component of precipitation variability, high-passfiltering was conducted on the seasonal cycle using a 10-daycutoff period. Figure 12 shows the 10-day high-pass filteredprecipitation in comparison with the high-pass filteredupper-level (200- to 600-hPa) GPH anomalies and low-level(850- to 1000-hPa) moisture convergence anomalies at(130�E, 37.5�N) over Korea. Relatively strong upper-levelGPH anomalies appear in late May through early July inPRE years and in early July through mid-August in POSyears. Low-level moisture convergence is relatively strongin early June and early September in PRE years. In POSyears, on the other hand, low-level moisture convergence isrelatively strong in late June and in August. There seems tobe a reasonable level of physical consistency between thehigh-frequency component of precipitation variability,derived from both the gauge data and the upper-level GPHanomalies, and the low-level moisture convergence anoma-lies, derived from the NCEP/NCAR reanalysis data. Thelatter variables are both correlated with the precipitationanomalies with a coefficient of �0.6. The magnitude of thehigh-frequency component of precipitation variability inKorea has increased by �25% in POS years. Such anincrease suggests that dynamic and thermodynamic pro-cesses have been enhanced in POS years, particularly inearly July through mid-August.[30] Figure 13 shows the positive composite maps of the
high-frequency component of variability. Negative GPHanomalies over Korea and positive GPH anomalies to theeast of Korea at the 850-hPa level (Figure 13a) are shiftedeastward from the corresponding GPH anomalies at the300-hPa level, forming westward tilt of GPH anomalies withelevation in PRE years (Figure 13b). Upper-level divergenceover Korea is clearly observed in the vertical zonal section(Figure 13b). This structure indicates that baroclinic wavesare a dominant ingredient for the high-frequency variabilityof precipitation with periods of approximately 6–8 days inKorea. In POS years, composite patterns are similar to thoseof PRE years. While a baroclinic structure is also observedin the vertical section (Figure 13d), 850-hPa negative GPHanomalies over Korea are much stronger in POS years. As aresult, stronger south and southwest wind anomalies, whichresult from a shortwave trough over Korea and a ridge to theeast of Korea, increase the transport of warm and moist airinto Korea in POS years; this explains the strengthenedupward motion in POS years at �130�E (Figure 13d). In themeridional vertical cross section, upward motion is alsoobserved to be stronger in POS years (figure not shown).
5. Summary and Concluding Remarks
[31] The level of summertime precipitation in Korea haschanged significantly in recent years, with frequent occurrences
of very heavy rainfall. The total amount of precipitationseems to have increased by approximately 25% in the recentdecade compared with the climatology preceding 2000. Inthis study, the recent decadal change in precipitation has beeninvestigated in the context of the underlying physicalmechanisms.[32] The seasonal cycle of summertime precipitation in
Korea, the first CSEOF mode, consists of three physicalcomponents—the seasonal (>30 days), the sub-seasonal(10–30 days), and the high-frequency (<10 days)evolutions—with distinct physical mechanisms and timescales. The bimodal pattern of precipitation and the associ-ated dynamic and thermodynamic patterns in the seasonal-scale variability are associated with the temporally varyingpressure contrast between the Asian continent and the sur-rounding oceans. It appears that the first peak has increasedby more than 25% and tends to appear earlier in recentyears; this is due to the change in low-level circulation,which transports more moisture during the mature stage ofthe Asian summer monsoon. As a result, commencement ofthe East Asian monsoon front occurred earlier and theassociated low-level moisture convergence strengthened inPOS years.[33] The typical spell of decreased precipitation is not
clear in POS years because of the strengthened convectiveactivity over Korea. The increased convective activity is dueto the strengthened low-level southerly anomalies. In addi-tion, both active convective motion in the subtropics and theincreased divergence near the entrance of the upper-level jetseem to facilitate convective activity over Korea.[34] During the period of the post-Changma, convective
activities over Korea have weakened in recent years. This isbecause the negative pressure anomaly over the north-western Pacific has retreated further to the east; as a result,moisture convergence over Korea is much weaker. Thisretreat of the lower pressure center is also observed in theweakened convective activity in the subtropics along�130�E. As a result, the second peak has broadened with-out a well-developed period of decreased precipitation inPOS years.[35] The sub-seasonal variability with 10–30-day time
scales describes alternating signs of precipitation seeminglypropagating northward from �20�N with an average periodof �15 days in PRE years and �13 days in POS years. Thesub-seasonal component of variability exhibits a substantialincrease in strength in POS years. Relatively strong sub-seasonal activities occur in late June through mid-July inPRE years, in contrast to later activities in August throughmid-September in POS years. This difference in timingsuggests that cold advection is more important in PRE yearsthan in POS years, whereas warm advection is moreimportant in POS years than in PRE years.[36] Fluctuation of cold advection induced by the short-
waves to the northeast of Korea appears to modulatebaroclinic instability over Korea. Fluctuation of warmadvection by low-level southerly winds, on the other hand,seems to modulate convective instability over Korea. Con-vective instability, as indicated by the nearly barotropicstructure of the atmosphere, is much stronger throughout thesummer in recent years; as a result, the magnitude of sub-seasonal variability has significantly increased in POS years.
ROH ET AL.: DECADAL CHANGES IN SUMMER PRECIPITATION D07115D07115
14 of 17

Figure 12. High-frequency component of precipitations (line), (a and c) GPH anomalies (red/blue shading:positive/negative) at 200–600 hPa, and (b and d) low-level (850–1000 hPa) moisture convergence anomalies(shading) in the high-frequency component in Korea (130�E, 37.5�N). Figures 12a and 12b are for PREyears and Figures 12c and 12d are for POS years. The right axis denotes the precipitation scale (mm/day).
ROH ET AL.: DECADAL CHANGES IN SUMMER PRECIPITATION D07115D07115
15 of 17

[37] The high-frequency component of precipitationformed by the baroclinic waves and their instability [Kimet al., 2010] remains nearly the same in its physical struc-tures between PRE years and POS years. The magnitude,however, has increased by approximately 25%; this impliesthat dynamic and thermodynamic processes leading to bar-oclinic instability have strengthened in POS years.[38] Due to a significant change in the heat distribution
between the continent and the oceans, the seasonal cycle ofthe Asian summer monsoon has strengthened by approxi-mately 25% in recent years. Due to the enhancement of theAsian summer monsoon, more moisture is transported tonortheastern countries, including Korea, Japan, and easternChina. As a result, East Asian regional monsoons, on aver-age, have become stronger in the last decade. According tothe results of this study, changes in the summertime pre-cipitation pattern in Korea are not just a matter of localinterest but may have a much broader impact.
[39] Acknowledgment. This study was supported by grants from theMinistry of Land, Transport, and Maritime Affairs, Korea (Ocean ClimateVariability Program and EAST-1 Project). This work was also supportedby the National Research Foundation of Korea (NRF) grant funded by theKorea government (MEST 2011-0021927, GRL).
ReferencesAllen, M. R., and M. J. Ingram (2002), Constraints on future changes in cli-mate and the hydrologic cycle, Nature, 419, 224–232, doi:10.1038/nature01092.
Bluestein, H. B. (1993), Synoptic-Dynamic Meteorology in Midlatitudes,594 pp., Oxford Univ. Press, New York.
Chen, J., H. Uyeda, and D.-I. Lee (2003), A method using radar reflectivitydata for the objective classification of precipitation during the Baiuseason, J. Meteorol. Soc. Jpn., 81, 229–249, doi:10.2151/jmsj.81.229.
Ding, Y. H. (2004), Seasonal march of the East Asian summer monsoon,in The East Asian Summer Monsoon, vol. 2, edited by C.-P. Chang,pp. 3–53, World Sci., Monterey, Calif.
Emori, S., and S. J. Brown (2005), Dynamic and thermodynamic changes inmean and extreme precipitation under changed climate, Geophys. Res.Lett., 32, L17706, doi:10.1029/2005GL023272.
Groisman, P. Y., R. W. Knight, D. R. Easterling, T. R. Karl, G. C. Hegerl,and V. N. Razuvaev (2005), Trends in intense precipitation in the climaterecord, J. Clim., 18, 1326–1350, doi:10.1175/JCLI3339.1.
Held, I. M., and B. J. Soden (2006), Robust responses of the hydrologicalcycle to global warming, J. Clim., 19, 5686–5699, doi:10.1175/JCLI3990.1.
Ho, C.-H., and I.-S. Kang (1988), The variability of precipitation in Korea,J. Korean Meteorol. Soc., 24(2), 38–48.
Holton, J. R. (1992), An Introduction to Dynamic Meteorology, 3rd ed.,511 pp., Academic, New York.
Hong, S.-Y. (2004), Comparison of heavy rainfall mechanisms in Koreaand the central US, J. Meteorol. Soc. Jpn., 82, 1469–1479, doi:10.2151/jmsj.2004.1469.
Figure 13. Positive composite of the high-frequency component of variability: (a and c) 850-hPa GPH(contour: 2 gpm), vertical velocity (shade: 1 � 10�2 Pa/sec), and wind >0.5 m/sec; (b and d) zonal crosssection of GPH (contour: 5 gpm), relative vorticity (shade: 1 � 10�6 sec�1), and wind (u, �W) >0.5 m/salong the 32.5�–37.5�N band. Figures 13a and 13b are for PRE years and Figures 13c and 13d are for POSyears.
ROH ET AL.: DECADAL CHANGES IN SUMMER PRECIPITATION D07115D07115
16 of 17

Kalnay, E., et al. (1996), The NCEP/NCAR 40-year reanalysis project,Bull. Am. Meteorol. Soc., 77, 437–471, doi:10.1175/1520-0477(1996)077<0437:TNYRP>2.0.CO;2.
Kang, I.-S., Y.-K. Lim, C.-H. Ho, and K.-M. Lau (1999), Principal modesof climatological seasonal and intraseasonal variations of the Asiansummer monsoon, Mon. Weather Rev., 127, 322–340, doi:10.1175/1520-0493(1999)127<0322:PMOCSA>2.0.CO;2.
Keyser, D., and M. A. Shapiro (1986), A review of the structure anddynamics of upper-level frontal zones, Mon. Weather Rev., 114,452–499, doi:10.1175/1520-0493(1986)114<0452:AROTSA>2.0.CO;2.
Kim, C., and M.-S. Suh (2009), Change-point and change pattern of precip-itation characteristics using Bayesian method over South Korea from1954 to 2007, Atmosphere, 19(2), 199–211.
Kim, H.-W., and D.-K. Lee (2006), An observational study of mesoscaleconvective systems with heavy rainfall over the Korean Peninsula,Weather Forecast., 21(2), 125–148, doi:10.1175/WAF912.1.
Kim, K.-Y., and G. R. North (1997), EOFs of harmonizable cyclostationaryprocesses, J. Atmos. Sci., 54, 2416–2427, doi:10.1175/1520-0469(1997)054<2416:EOHCP>2.0.CO;2.
Kim, K.-Y., G. R. North, and J. Huang (1996), EOFs of one-dimensionalcyclostationary time series: Computations, examples and stochasticmodeling, J. Atmos. Sci., 53, 1007–1017, doi:10.1175/1520-0469(1996)053<1007:EOODCT>2.0.CO;2.
Kim, K.-Y., J.-W. Roh, D.-K. Lee, and J.-G. Jhun (2010), Physical mechan-isms of the seasonal, subseasonal, and high-frequency variability in theseasonal cycle of summer precipitation in Korea, J. Geophys. Res., 115,D14110, doi:10.1029/2009JD013561.
Kwon, M., J.-G. Jhun, B. Wang, S.-I. Ahn, and J.-S. Kug (2005), Decadalchange in relationship between east Asian and WNP summer monsoons,Geophys. Res. Lett., 32, L16709, doi:10.1029/2005GL023026.
Lau, K.-M., G. J. Yang, and S. H. Shen (1988), Seasonal and intraseasonal cli-matology of summer monsoon rainfall over East Asia,Mon. Weather Rev.,116, 18–37, doi:10.1175/1520-0493(1988)116<0018:SAICOS>2.0.CO;2.
Lee, D.-K. (2004), Summertime climatology, in Korean Climatology,edited by H.-S. Chung, pp. 92–99, Meteorol. Res. Inst., Korea Meteorol.Admin., Seoul.
Lee, D.-K., H.-R. Kim, and S.-Y. Hong (1998), Heavy rainfall over Koreaduring 1980–1990, Korean J. Atmos. Sci., 1, 32–50.
Lee, D.-K., J.-G. Park, and J.-W. Kim (2008), Heavy rainfall events lasting18 days from July 31 to August 17, 1998, over Korea, J. Meteorol. Soc.Jpn., 86, 313–333, doi:10.2151/jmsj.86.313.
Lee, S.-S., P. N. Vinayashandran, K.-J. Ha, and J.-G. Jhun (2010), Shift ofpeak in summer monsoon rainfall over Korea and its association withEl Niño–Southern Oscillation, J. Geophys. Res., 115, D02111, doi:10.1029/2009JD011717.
Lim, Y.-K., K.-Y. Kim, and H. S. Lee (2002), Temporal and spatial evolu-tion of the Asian summer monsoon in the seasonal cycle of synopticfields, J. Clim., 15, 3630–3644, doi:10.1175/1520-0442(2002)015<3630:TASEOT>2.0.CO;2.
Newton, H. J. (1988), TIMESLAB: A Time Series Analysis Laboratory,623 pp., Wadsworth, New York.
Ninomiya, K. (2000), Large- and meso-a-scale characteristics of Meiyu/Baiu front associated with intense rainfalls in 1–10 July 1991, J. Meteorol.Soc. Jpn., 78, 141–157.
Ninomiya, K. (2001), Large l-shaped cloud zone formed around July 6,1991 with pole-ward moisture transport from intense rainfall area inMeiyu-Baiu front, J. Meteorol. Soc. Jpn., 79, 805–813, doi:10.2151/jmsj.79.805.
Ninomiya, K., and H. Mizuno (1987), Variations of Baiu precipitation overJapan in 1951–1980 and large-scale characteristics of wet and dryBaiu, J. Meteorol. Soc. Jpn., 65, 115–127.
Nitta, T. (1987), Convective activities in the tropical western Pacific andtheir impact on the Northern-Hemisphere summer circulation, J. Meteorol.Soc. Jpn., 65(3), 373–390.
Qian, W. H., and D.-K. Lee (2000), Seasonal march of Asian summer mon-soon, Int. J. Climatol., 20, 1371–1386, doi:10.1002/1097-0088(200009)20:11<1371::AID-JOC538>3.0.CO;2-V.
Qian, W. H., H.-S. Kang, and D.-K. Lee (2002), Distribution of seasonalrainfall in East Asian monsoon region, Theor. Appl. Climatol., 73,151–168, doi:10.1007/s00704-002-0679-3.
Seo, K.-H., and K.-Y. Kim (2003), Propagation and initiation mechanismsof the Madden-Julian oscillation, J. Geophys. Res., 108(D13), 4384,doi:10.1029/2002JD002876.
Tao, S. Y., and L. X. Chen (1987), A review of recent research on the EastAsian monsoon in China, inMonsoonMeteorology, edited by C.-P. Changand T. N. Krishnamurti, pp. 60–92, Oxford Univ. Press, London.
Trenberth, K. E. (1999), Atmospheric moisture recycling: Role of advec-tion and local evaporation, J. Clim., 12, 1368–1381, doi:10.1175/1520-0442(1999)012<1368:AMRROA>2.0.CO;2.
Wang, B., and L. Ho (2002), Rainy season of the Asian-Pacific summermonsoon, J. Clim., 15, 386–398, doi:10.1175/1520-0442(2002)015<0386:RSOTAP>2.0.CO;2.
Wang, B., J.-G. Jhun, and B.-K. Moon (2007), Variability and singularity ofSeoul, South Korea, rainy season (1778–2004), J. Clim., 20, 2572–2580,doi:10.1175/JCLI4123.1.
J.-G. Jhun, K.-Y. Kim, and J.-W. Roh, School of Earth andEnvironmental Sciences, Seoul National University, 1 Gwanangno,Gwanak-gu, Seoul, 151-747, South Korea. ([email protected])
ROH ET AL.: DECADAL CHANGES IN SUMMER PRECIPITATION D07115D07115
17 of 17