decarbonisation options for the dutch paper and board industry
TRANSCRIPT
DECARBONISATION OPTIONS FOR THE DUTCH PAPER AND BOARD INDUSTRY
K. Rademaker, M. Marsidi
20 August 2019
Manufacturing Industry Decarbonisation Data Exchange Network
Decarbonisation options for the Dutch paper and board industry © PBL Netherlands Environmental Assessment Agency; © ECN part of TNO The Hague, 2019 PBL publication number: 3480 TNO project no. 060.33956 Authors K. Rademaker and M. Marsidi Acknowledgements Special thanks to Corneel Lambregts (Royal VKP), Annita Westenbroek (KCPK) and Anton Wemmers (ECN part of TNO) MIDDEN project coordination and responsibility The MIDDEN project (Manufacturing Industry Decarbonisation Data Exchange Network) was initiated and is also coordinated and funded by PBL and ECN part of TNO. The project aims to support industry, policymakers, analysts, and the energy sector in their common efforts to achieve deep decarbonisation. Correspondence regarding the project may be addressed to: K.M. Schure (PBL), [email protected], or A.W.N van Dril (TNO), [email protected] Production coordination PBL Publishers This publication is a joint publication by PBL and ECN part of TNO and can be downloaded from: www.pbl.nl/en. Parts of this publication may be reproduced, providing the source is stated, in the form: K. Rademaker and M. Marsidi (2019), Decarbonisation options for the Dutch paper and board industry. PBL Netherlands Environmental Assessment Agency & ECN part of TNO, The Hague. PBL Netherlands Environmental Assessment Agency is the national institute for strategic policy analysis in the fields of the environment, nature and spatial planning. We contribute to improving the quality of political and administrative decision-making by conducting outlook studies, analyses and evaluations in which an integrated approach is considered paramount. Policy relevance is the prime concern in all of our studies. We conduct solicited and unsolicited research that is both independent and scientifically sound. ECN part of TNO has a twofold mission: to accelerate the energy transition and to strengthen the competitive position of the Netherlands. ECN part of TNO conducts independent and internationally leading research and we stand for an agenda-setting, initiating and supporting role for government, industry and NGOs. This report was reviewed by by Corneel Lambregts (Royal Dutch Association of Paper and Board Factories) and Annita Westenbroek (Knowledge Center for Paper and Board). PBL and ECN part of TNO remain responsible for the content. The decarbonisation options and parameters are explicitly not verified by the companies.

A MIDDEN report – PBL – ECN part of TNO | 3
Contents Summary 5
INTRODUCTION 7 1 PAPER AND BOARD PRODUCTION IN THE NETHERLANDS 8
1.1 Paper and board production in the Netherlands 8 1.2 Definition of paper and board types 8 1.3 Production volumes and CO2 emissions 10 1.4 Production and sales trend 12 1.5 Employment 14 1.6 Total energy and material flows Dutch paper and board industry 2015 16
Total energy consumption 16 Total material consumption 17 Combined Heat and Power installations 18
2 PAPER AND BOARD PRODUCTION PROCESSES 21
2.1 Stock preparation and drying 21
Specific energy consumption 23 Material input/output 25 Investment and operational cost 26
2.2 Steam supply 27
Energy use and efficiency 27 Capacity 27 Investment and operational cost 28
3 PAPER AND BOARD PRODUCTS AND APPLICATION 30
3.1 Paper and board end products 30 3.2 Commodity data 30
4 OPTIONS FOR DECARBONISATION 32
4.1 Energy efficiency improvement 32
Heat pumps 32 Compression refining 33
4.2 Decarbonisation of steam supply 34
Biogas boiler 34 Electric boilers 35 Hydrogen boiler 36 Ultra-deep geothermal energy 36
4.3 Alternative processes 37
Microwave drying 37 Air-laid technology 38
PBL – ECN part of TNO | 4 – A MIDDEN report
4.4 Other technologies 39
4.4.1 CapWa – Capture of evaporated Water 39 4.4.3 Technologies under development 40
5 DISCUSSION 41
5.1 Short-term options 41 5.2 Medium- to long-term options 41
REFERENCES 43

A MIDDEN report – PBL – ECN part of TNO | 5
FINDINGS
Summary
This report describes the current situation for Dutch paper and board production and the options and conditions for its decarbonisation. There are 21 paper and board producing mills in the Netherlands (see Table 1). In 2017, they produced over 3 million tonnes of paper and board. Total board production was about 2.2 million tonnes and graphic paper accounted for 0.7 million tonnes. The mills of the Dutch paper and board industry are categorised according to their products: • Graphic paper • Folding boxboard • Graphic paper made from recovered
paper • Sanitary paper
• Corrugated board • Moulded fibre • Solid board • Specialty paper
Table 1 Overview of CO2 eq emissions per Dutch paper mill
Production site Location EU ETS emissions 2015 [kt CO2 eq]
Total
1054.2
DS Smith Paper De Hoop EERBEEK 216
Smurfit Kappa Roermond Papier B.V.
ROERMOND 163
Sappi Maastricht B.V. MAASTRICHT 151
Crown Van Gelder B.V. VELSEN 143
Mayr-Melnhof Eerbeek B.V. EERBEEK 68
Eska B.V. HOOGEZAND 60
Solidus Solutions Board B.V. BAD NIEUWESCHANS
37
Eska B.V. SAPPEMEER 33
Solidus Solutions Board B.V. OUDE PEKELA 24
WEPA Nederland B.V. SWALMEN 23
Solidus Solutions Board B.V. COEVORDEN 22
Essity Operations Cuijk B.V. CUIJK 20
Papierfabriek Doetinchem B.V. DOETINCHEM 20
Smurfit Kappa Parenco RENKUM 19
Solidus Solutions Board B.V. HOOGKERK 17
Huhtamaki Nederland B.V. FRANEKER 13
Smart Packaging Solutions LOENEN 13
Neenah Coldenhove EERBEEK 10
Marsna Paper BV MEERSSEN 3
Schut Papier HEELSUM 0
VHP Security Paper B.V. APELDOORN 0
Source: NEa, 2018
PBL – ECN part of TNO | 6 – A MIDDEN report
In 2015, final heat consumption by the Dutch paper and board industry was 11.9 PJ and final electricity consumption was 4.7 PJ. Combined heat and power plants (CHP) are an important part of the utilities in the Dutch paper and board industry, with a total heat production of 7.8 PJ and electricity production of 4.1 PJ, of which 1.3 PJ electricity was sold to the grid. The most energy-intensive production process is that of the thermal drying of the paper web (drying step), which is responsible for around 81% of the steam/direct heat consumption in paper and board production (De Vries, 2016). The decarbonisation options, therefore, mostly focus on decreasing the CO2 emissions related to this process. There are several commercially available solutions that are relatively easy to implement: • Electric boilers can be implemented without adjustments to the production process to
replace natural gas boilers. However, electric boilers require significant investments in electricity grid connections, which, at current prices, hampers the use of electric boilers (Berenschot, Energy Matters, CE Delft, Industrial Energy Experts, 2017);
• Biogas is another short-term alternative to decarbonising part of the paper industry’s CO2 emissions. Its application is limited by the amount of available local biomass suitable for on-site digestion or by the amount of available biogas/green gas from third parties;
• Using hydrogen instead of natural gas is another solution that requires relatively few adjustments to the production process. However, there is currently no infrastructure or large-scale production of green (electrolysis-based) or blue (natural-gas-based combined with CCS) hydrogen. Moreover, the hydrogen price is expected by the industry to be high, which will hamper the use of H2.
In addition, there are several promising decarbonisation technologies currently under development, among which: • Compression refining is currently in the pilot phase of development. This option can
significantly reduce the CO2 emissions from graphic paper mills. An estimated reduction of around 5% to 10% of the drying energy is possible, in addition to a halving of the electricity consumption that is related to refining. However, a significant acceleration of the development is required if this technology is to be implemented within the coming 10 years;
• Heat pumps are an efficiency option, as they convert low temperature waste heat into high temperature heat. High temperature heat pumps that provide the steam pressure and temperature levels required for paper and board production are still under development. Once developed, this option should be able to decarbonise most of the direct CO2 emissions from the paper and board industry. A disadvantage of this technology is that connecting these heat pumps calls for certain adaptations to the production system;
• Air-laid technology produces paper without the use of water. Its low energy consumption and high production capacity are reasons to considers this technology. The input of fluff pulp makes this technology currently only suitable for products using virgin fibres rather than recovered paper;
• Ultra-deep geothermal energy has the potential to produce steam for paper and board mills. Its economic feasibility varies per location. In June 2017, a Green Deal was signed between Alliander, Parenco and QNQ to start a project around ultra-deep geothermal energy (Alliander, 2018). The possibility of applying geothermal heat varies per region;
• Microwave drying is a potential electrification technology for the drying process in paper and board production. The application of this technology in the paper and board industry is currently still at a low technology readiness level (TRL);
Various other technological options are under development, both within the sector (e.g. enhanced dewatering) and the general technologies that might be applicable in several sectors (e.g. vapour recompression).
A MIDDEN report – PBL – ECN part of TNO | 7
FULL RESULTS
Introduction This report describes the current situation for Dutch paper and board production and the options and preconditions for its decarbonisation. The study is part of the MIDDEN project (Manufacturing Industry Decarbonisation Data Exchange Network). The MIDDEN project aims to support industry, policymakers, analysts, and the energy sector in their common efforts to achieve deep decarbonisation. The MIDDEN project will update and elaborate further on options in the future, in close connection with the industry.
Scope Data on 2015 regarding the Dutch paper and board industry were provided by the association of the Dutch paper and board industry (VNP) and by the Centre of Competence Paper and Board (KCPK). This data set was used as a basis for the analysis of the current Dutch paper and board energy and material flows, and equipment and machinery. In addition, extensive literature research was conducted to cross-reference the calculated energy and material consumption and to identify and analyse potential decarbonisation options. This study encompasses all 21 Dutch paper and board production locations. The Dutch paper and board association (VNP) has 22 members, 21 of which are production locations1. Of the 21 production locations, 19 are part of the European Emissions Trading Scheme (EU ETS); the remaining two—‘Schut Papier’ and ‘VHP Security Paper B.V.’—are not part of the EU ETS.
Reading guide Chapter 1 describes the current situation of paper and board production in the Netherlands. A description of the production processes, specific energy and material consumption, and equipment cost is provided in Chapter 2. This is followed by an overview of the main paper and board products and their applications in Chapter 3. Chapter 4 discusses possible decarbonisation options and, finally, Chapter 5 provides an assessment of the decarbonisation options.
1 Kimberly-Clark is excluded from this study. As there are no data provided by the VNP, it is assumed this is
not a production location

PBL – ECN part of TNO | 8 – A MIDDEN report
1 Paper and board production in the Netherlands This chapter provides information regarding the types of paper and board produced in the Netherlands, which types are produced by which mills, and the total production capacity per type.
1.1 Paper and board production in the Netherlands
The pulp and paper industry forms the fourth largest industrial user of energy, worldwide. Asia has the largest share of the paper production (42%), followed by Europe (28%) and North America (23%). China is the largest producer of paper and board, followed by the United States, Japan, and Germany (Laurijssen, 2013). In the Netherlands, total revenues of the paper and board industry in 2017 were around EUR 1,859 million, with a production of almost 3 million tonnes of paper and board (VNP, 2018). In 2017, total CO2 emissions from the sector were slightly over 1 Mt CO2 eq (NEa, 2018).
1.2 Definition of paper and board types
Paper and board products consist mainly of cellulose and are used for a variety of applications such as writing materials and packaging. Paper and board are essentially the same material and have similar production processes. Generally, the distinction between paper and board is the grammage of the product (see Section 3.1). For this study, the paper and board products produced in the Netherlands are categorised into 8 types2: • Graphic paper: Graphic paper covers printing and writing paper, magazine paper and
specialty paper. Graphic paper is generally produced from primary fibre from chemical pulping3, because consumers demand a certain whiteness and brightness that is difficult to obtain using recovered paper;
• Graphic paper made from recovered paper: Like graphic paper, but produced from recovered paper instead of virgin fibres. This type of graphic paper is used, among other things, for leaflets;
2 The categorisation and descriptions are based on the PhD thesis ‘Energy use in the paper industry’
(Laurijssen, 2013). Note however that the category ‘newsprint’ has been replaced by ‘paper made from recovered paper’, since newsprint is no longer produced in the Netherlands.
3 The virgin fibres are imported as there are no chemical pulping facilities in the Netherlands.
A MIDDEN report – PBL – ECN part of TNO | 9
• Corrugated board: Corrugated board consists of different combinations of layers of sheets produced from recovered pulp, mechanical pulp and chemical pulp. In the Netherlands, mainly recovered pulp is used. This type of paper has a wide variety of applications but is mostly used for packaging;
• Solid board: Solid board consists of 100% recovered paper and has multiple applications, such as book covers and food plates. Paper and board products that use recovered paper generally require deinking to remove unwanted impurities, but this is not required for solid board, because of the types of applications;
• Folding boxboard: Folding boxboard consists of different types of fibres and is typically used as packaging material of various food products. In the Netherlands, this paper grade consists of recovered paper and mechanical pulp. Because of its application, the outer layer needs to look representative. The outer layers therefore need to be either deinked or bleached;
• Sanitary paper: Sanitary paper can be produced from primary fibre or recovered fibre and is used to produce, for example, toilet paper and tissues. The primary fibre is generally produced through chemical pulping. Sanitary paper needs to be strong, absorbent and soft;
• Moulded fibre: Moulded fibre is a packaging material used as protection in egg boxes, among other things, and is composed mainly of recycled paper and cardboard4;
• Specialty paper: Specialty paper covers a wide range of products that cannot be categorised using the above paper and board type definitions and are generally produced in relatively low volumes.
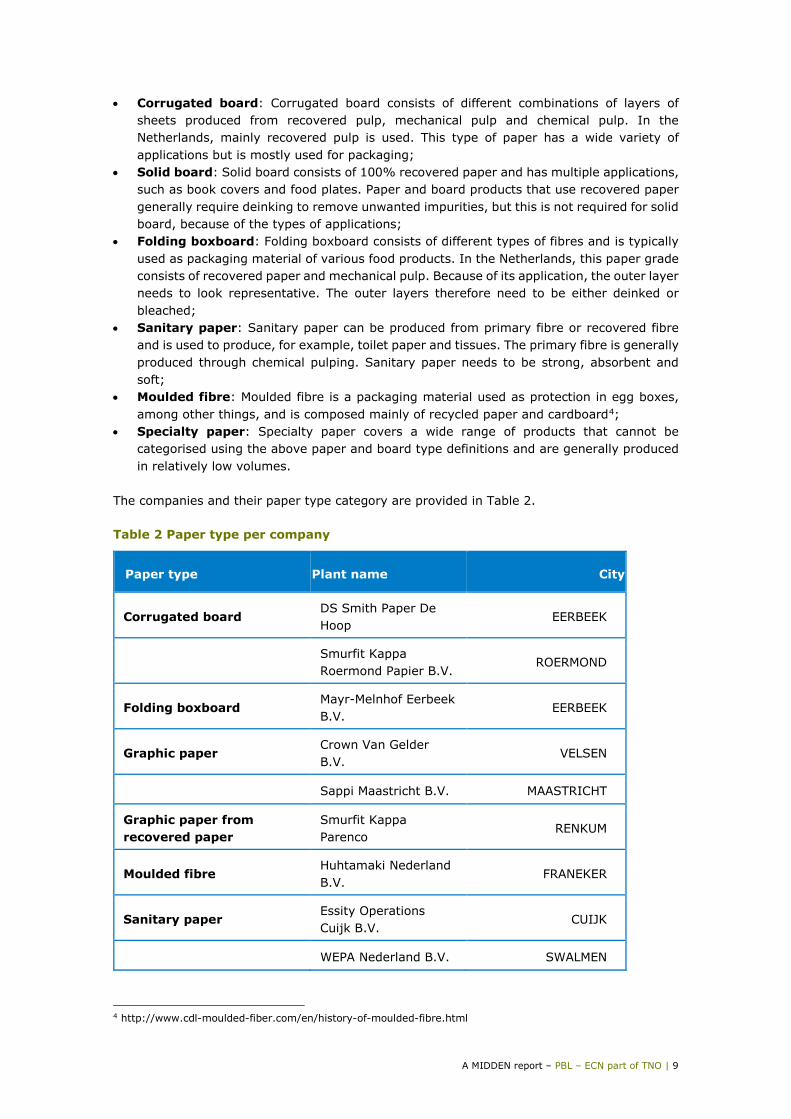
The companies and their paper type category are provided in Table 2. Table 2 Paper type per company
Paper type Plant name City
Corrugated board DS Smith Paper De Hoop
EERBEEK
Smurfit Kappa Roermond Papier B.V.
ROERMOND
Folding boxboard Mayr-Melnhof Eerbeek B.V.
EERBEEK
Graphic paper Crown Van Gelder B.V.
VELSEN
Sappi Maastricht B.V. MAASTRICHT
Graphic paper from recovered paper
Smurfit Kappa Parenco
RENKUM
Moulded fibre Huhtamaki Nederland B.V.
FRANEKER
Sanitary paper Essity Operations Cuijk B.V.
CUIJK
WEPA Nederland B.V. SWALMEN
4 http://www.cdl-moulded-fiber.com/en/history-of-moulded-fibre.html

PBL – ECN part of TNO | 10 – A MIDDEN report
Paper type Plant name City
Solid board Eska B.V. HOOGEZAND
Eska B.V. SAPPEMEER
Smart Packaging Solutions
LOENEN
Solidus Solutions Board B.V.
BAD NIEUWESCHANS
Solidus Solutions Board B.V.
COEVORDEN
Solidus Solutions Board B.V.
HOOGKERK
Solidus Solutions Board B.V.
OUDE PEKELA
Specialty paper Marsna Paper BV MEERSSEN
Papierfabriek Doetinchem B.V.
DOETINCHEM
Schut Papier HEELSUM
VHP Security Paper B.V.
APELDOORN
Neenah Coldenhove EERBEEK
1.3 Production volumes and CO2 emissions
The annual production capacity of the Dutch paper and board mill ranged from 5,000 to 600,000 tonnes in 2015. An overview of the 2015 production capacity per product type is presented in Table 3. Large mills typically produce products in bulk, whereas mills with lower production capacity tend to produce more specialised products. Table 3. Production capacity and CO2 emissions in the paper and board industry in 2015
Paper machine; main output
Sum of EU ETS emissions 2015 [kt]
Sum of production capacity [t/year]
Corrugated board 379 950,000
Folding boxboard 68 140,000
Graphic paper 294 520,000
Graphic paper from recovered paper
19 280,000

A MIDDEN report – PBL – ECN part of TNO | 11
Paper machine; main output
Sum of EU ETS emissions 2015 [kt]
Sum of production capacity [t/year]
Sanitary paper 43 105,000
Solid board 206 730,000
Moulded fibre 13 35,000
Specialty paper 33 110,000
Grand Total 1,054 2,870,000
Source: adapted VNP data In 2015, the total in greenhouse gas emissions from the Dutch paper and board industry, corresponding to a total production capacity of 2,870 kt paper and board, was 1,054 kt CO2 eq. The graphic paper mills using virgin fibres, with a total production capacity of 520 kt per year, were responsible for 294 kt CO2, and the graphic paper mills using recovered paper, with a total production capacity of 280 kt per year, emitted 19 kt CO25. The corrugated board mills, with a cumulative production capacity of 950 kt per year, emitted 379 kt CO2. Solid board, produced by 6 mills in the Netherlands with a total production capacity of 730 kt per year, emitted 206 kt CO2. Folding boxboard (a capacity of 140 kt per year) emitted 68 kt CO2. The sanitary paper producing companies in the Netherlands had a combined production capacity of 105 kt paper per year and emitted 43 kt CO2. In the Netherlands, moulded fibre production, with a capacity of 35 kt per year, emitted 13 kt CO2. Finally, the aggregated group of mills producing ‘specialty paper’, with a production capacity of 110 kt paper, emitted 33 kt CO2. The breakdown of the CO2 emissions per paper and board type are illustrated in Figure 1. Figure 1 Breakdown of CO2 emissions (kt) per paper and board type in 2015
5 The relatively low CO2 emission level compared to the production level is due to the large amount of bio-
energy used by these paper mills.
36%
28%
20%
2% 6%4%
1%
3%
Corrugated board Graphic paper
Solid board Graphic paper from recovered paper
Folding boxboard Sanitary paper
Moulded fibre Specialty paper
PBL – ECN part of TNO | 12 – A MIDDEN report
1.4 Production and sales trend
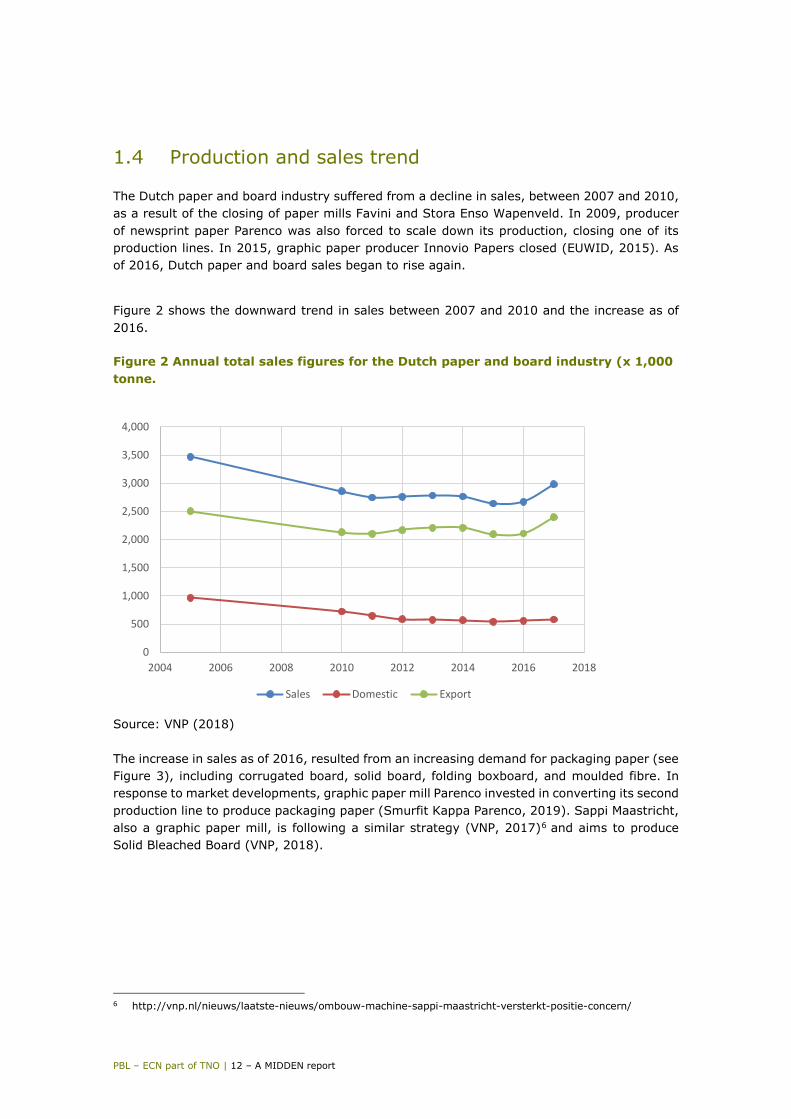
The Dutch paper and board industry suffered from a decline in sales, between 2007 and 2010, as a result of the closing of paper mills Favini and Stora Enso Wapenveld. In 2009, producer of newsprint paper Parenco was also forced to scale down its production, closing one of its production lines. In 2015, graphic paper producer Innovio Papers closed (EUWID, 2015). As of 2016, Dutch paper and board sales began to rise again.
Figure 2 shows the downward trend in sales between 2007 and 2010 and the increase as of 2016. Figure 2 Annual total sales figures for the Dutch paper and board industry (x 1,000 tonne.
Source: VNP (2018) The increase in sales as of 2016, resulted from an increasing demand for packaging paper (see Figure 3), including corrugated board, solid board, folding boxboard, and moulded fibre. In response to market developments, graphic paper mill Parenco invested in converting its second production line to produce packaging paper (Smurfit Kappa Parenco, 2019). Sappi Maastricht, also a graphic paper mill, is following a similar strategy (VNP, 2017)6 and aims to produce Solid Bleached Board (VNP, 2018).
6 http://vnp.nl/nieuws/laatste-nieuws/ombouw-machine-sappi-maastricht-versterkt-positie-concern/
0
500
1,000
1,500
2,000
2,500
3,000
3,500
4,000
2004 2006 2008 2010 2012 2014 2016 2018
Sales Domestic Export
A MIDDEN report – PBL – ECN part of TNO | 13
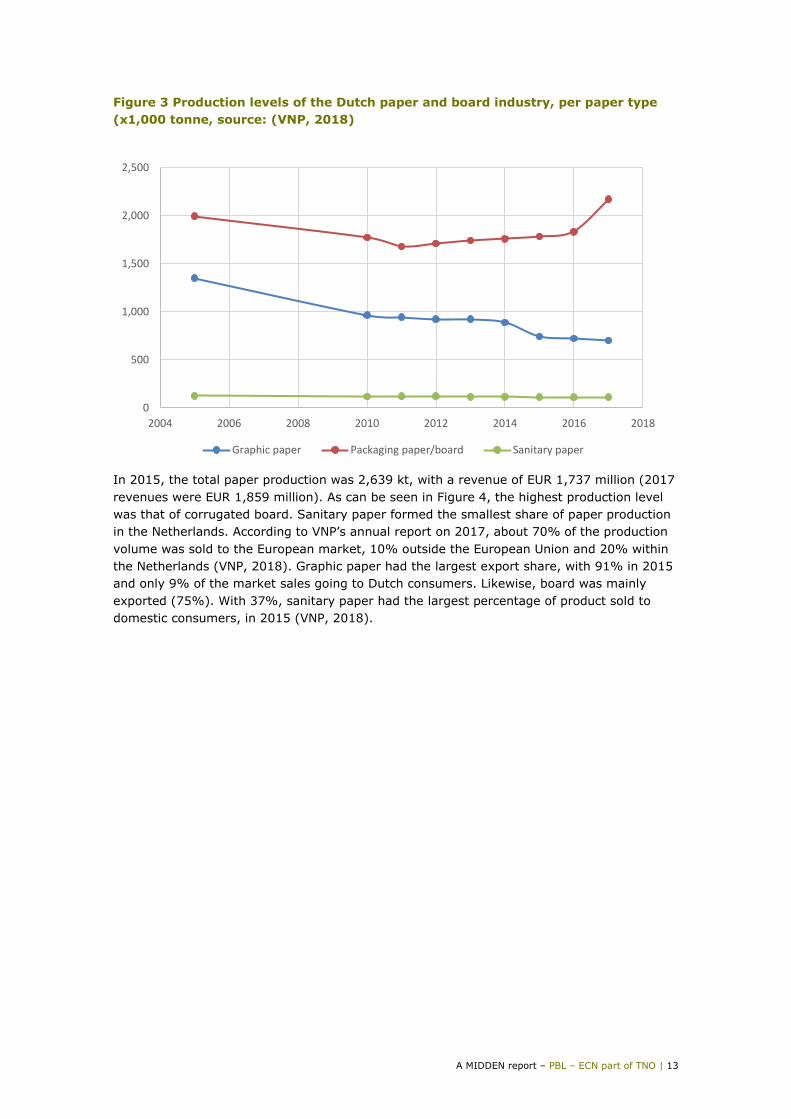
Figure 3 Production levels of the Dutch paper and board industry, per paper type (x1,000 tonne, source: (VNP, 2018)
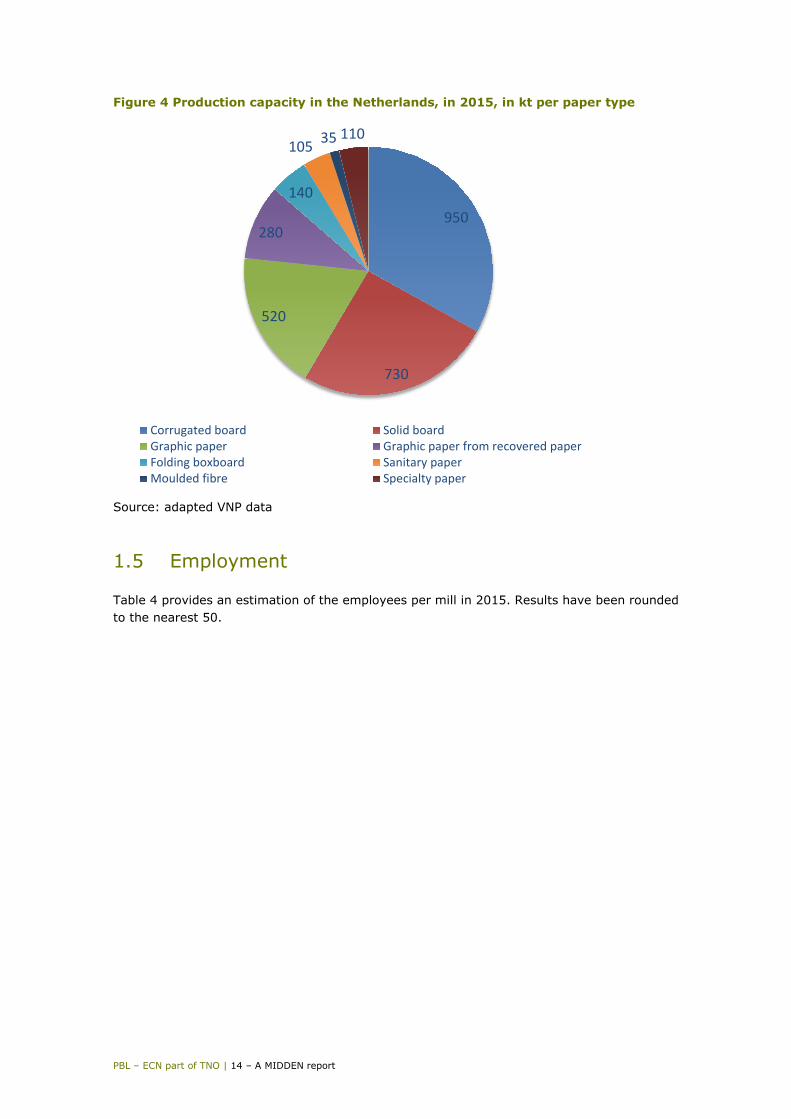
In 2015, the total paper production was 2,639 kt, with a revenue of EUR 1,737 million (2017 revenues were EUR 1,859 million). As can be seen in Figure 4, the highest production level was that of corrugated board. Sanitary paper formed the smallest share of paper production in the Netherlands. According to VNP’s annual report on 2017, about 70% of the production volume was sold to the European market, 10% outside the European Union and 20% within the Netherlands (VNP, 2018). Graphic paper had the largest export share, with 91% in 2015 and only 9% of the market sales going to Dutch consumers. Likewise, board was mainly exported (75%). With 37%, sanitary paper had the largest percentage of product sold to domestic consumers, in 2015 (VNP, 2018).
0
500
1,000
1,500
2,000
2,500
2004 2006 2008 2010 2012 2014 2016 2018
Graphic paper Packaging paper/board Sanitary paper
PBL – ECN part of TNO | 14 – A MIDDEN report
Figure 4 Production capacity in the Netherlands, in 2015, in kt per paper type
Source: adapted VNP data
1.5 Employment
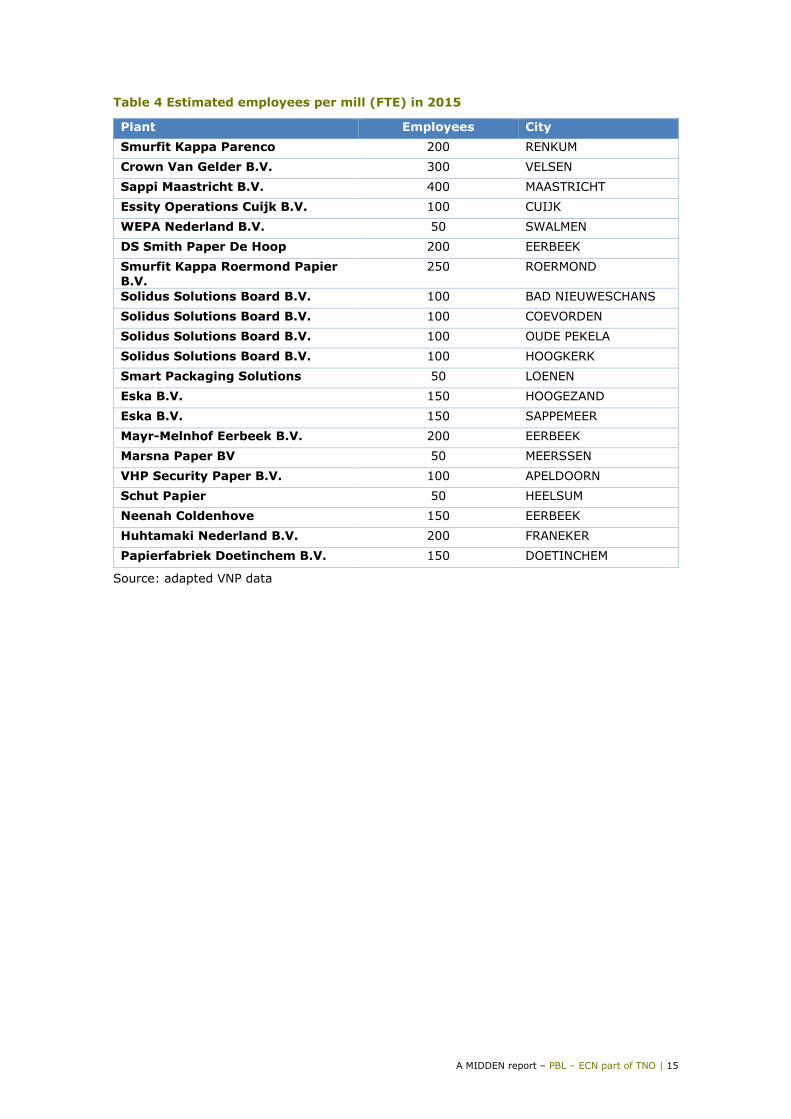
Table 4 provides an estimation of the employees per mill in 2015. Results have been rounded to the nearest 50.
950
730
520
280
140
105 35 110
Corrugated board Solid boardGraphic paper Graphic paper from recovered paperFolding boxboard Sanitary paperMoulded fibre Specialty paper
A MIDDEN report – PBL – ECN part of TNO | 15
Table 4 Estimated employees per mill (FTE) in 2015
Plant Employees City Smurfit Kappa Parenco 200 RENKUM Crown Van Gelder B.V. 300 VELSEN Sappi Maastricht B.V. 400 MAASTRICHT Essity Operations Cuijk B.V. 100 CUIJK WEPA Nederland B.V. 50 SWALMEN DS Smith Paper De Hoop 200 EERBEEK Smurfit Kappa Roermond Papier B.V.
250 ROERMOND
Solidus Solutions Board B.V. 100 BAD NIEUWESCHANS Solidus Solutions Board B.V. 100 COEVORDEN Solidus Solutions Board B.V. 100 OUDE PEKELA Solidus Solutions Board B.V. 100 HOOGKERK Smart Packaging Solutions 50 LOENEN Eska B.V. 150 HOOGEZAND Eska B.V. 150 SAPPEMEER Mayr-Melnhof Eerbeek B.V. 200 EERBEEK Marsna Paper BV 50 MEERSSEN VHP Security Paper B.V. 100 APELDOORN Schut Papier 50 HEELSUM Neenah Coldenhove 150 EERBEEK Huhtamaki Nederland B.V. 200 FRANEKER Papierfabriek Doetinchem B.V. 150 DOETINCHEM
Source: adapted VNP data

PBL – ECN part of TNO | 16 – A MIDDEN report
1.6 Total energy and material flows Dutch paper and board industry 2015
Total energy consumption The energy consumption varies significantly per mill due to the differences in size. Bulk producing corrugated board and graphic paper mills are significantly larger, and therefore consume more steam/heat, compared to the more specialised paper mills that produce a larger variety of products in much lower quantities. Almost all boilers and CHPs in the Dutch paper and board industry are natural-gas-fired. As for other fuels, Smurfit Kappa Parenco uses deinking sludge, biogas and imported biomass as fuel input (RVO, 2019). Smurfit Kappa Roermond Papier B.V. uses biogas produced by the on-site wastewater treatment plant (VNP, 2019), as do Eska B.V. (Eska, 2019), and Huhtamaki Nederland B.V. (RVO, 2014). DS Smith Paper De Hoop uses the biogas that is produced from their waste water by wastewater treatment plant Industriewater Eerbeek7 (VNP, 2016). Aside from steam production, natural gas is also used directly for drying instead of via steam: sanitary paper production uses hot air directly in the drying section in combination with steam (Yankee cylinder) and moulded fibre production uses hot air for drying in so called tunnel dryers. Figure 5 shows the final consumption of steam/heat per product type in 2015. The total consumption of steam/heat was 12.5 PJ, most of which (7.8 PJ) was produced by CHP installations. Figure 5 Overview of the amount of heat/steam used
Source: adapted VNP data
7 Industriewater Eerbeek also receives waste water from Neenah Coldenhove and Mayr-Melnhof
Eerbeek B.V. (RVO, 2015)
3.292.15
1.51
0.000.59 0.27 0.00 0.00
0.78
0.241.02
1.44 0.04 0.370.22 0.62
0.000.501.001.502.002.503.003.504.004.50
PJ
Steam CHP [PJ] Heat/steam excl CHP [PJ]
A MIDDEN report – PBL – ECN part of TNO | 17
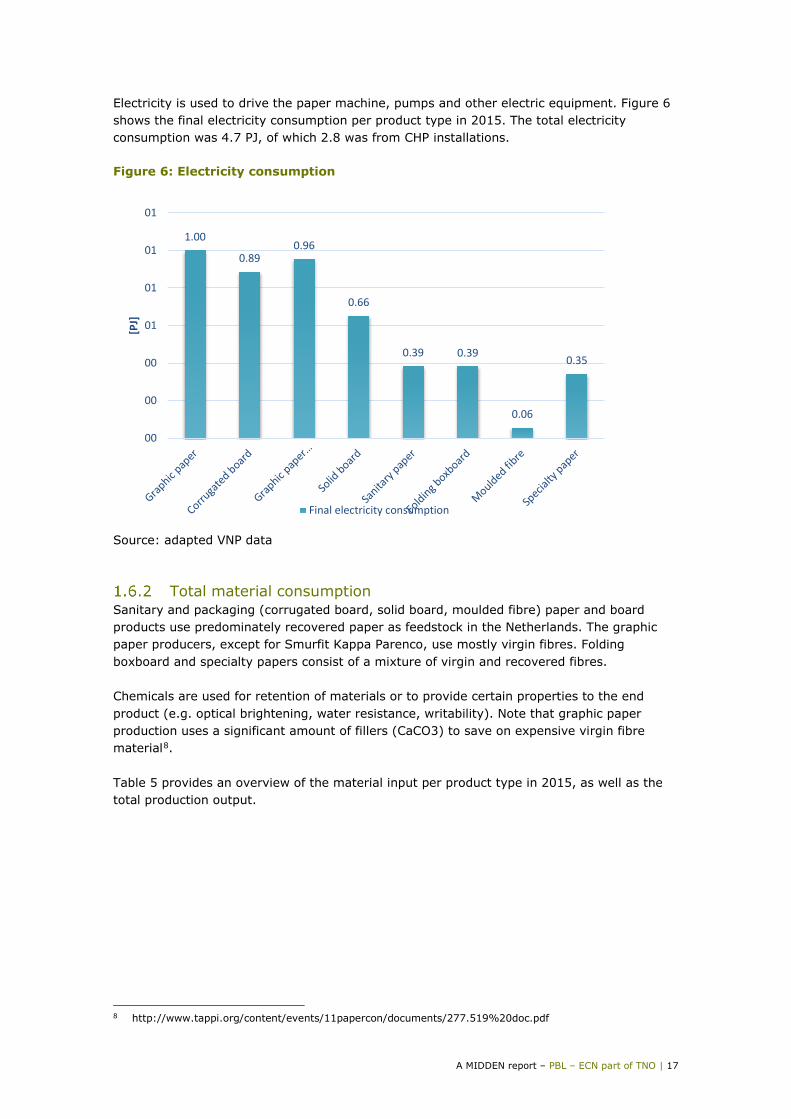
Electricity is used to drive the paper machine, pumps and other electric equipment. Figure 6 shows the final electricity consumption per product type in 2015. The total electricity consumption was 4.7 PJ, of which 2.8 was from CHP installations. Figure 6: Electricity consumption
Source: adapted VNP data
Total material consumption Sanitary and packaging (corrugated board, solid board, moulded fibre) paper and board products use predominately recovered paper as feedstock in the Netherlands. The graphic paper producers, except for Smurfit Kappa Parenco, use mostly virgin fibres. Folding boxboard and specialty papers consist of a mixture of virgin and recovered fibres. Chemicals are used for retention of materials or to provide certain properties to the end product (e.g. optical brightening, water resistance, writability). Note that graphic paper production uses a significant amount of fillers (CaCO3) to save on expensive virgin fibre material8. Table 5 provides an overview of the material input per product type in 2015, as well as the total production output.
8 http://www.tappi.org/content/events/11papercon/documents/277.519%20doc.pdf
1.00
0.890.96
0.66
0.39 0.39
0.06
0.35
00
00
00
01
01
01
01
[PJ]
Final electricity consumption
PBL – ECN part of TNO | 18 – A MIDDEN report
Table 5: Material consumption and production figures for the Dutch paper and board industry, in 2015 Paper machine; main output
Recovered paper [kt]
Cellulose [kt]
Fillers and chemicals
[kt]
Total material
input [kt]
Total production 2015 [kt]
Corrugated board
882 0 38 920 890
Folding boxboard
69 130 14 214 133
Graphic paper 0 302 187 489 478
Graphic paper from recovered paper
239 0 30 270 252
Sanitary paper 103 0 1 104 97
Solid board 643 0 3 646 646
Moulded fibre 37 0 0 37 35
Specialty paper
75 20 3 99 99
Total 1,936 432 274 2,642 2,495
Source: adapted VNP data
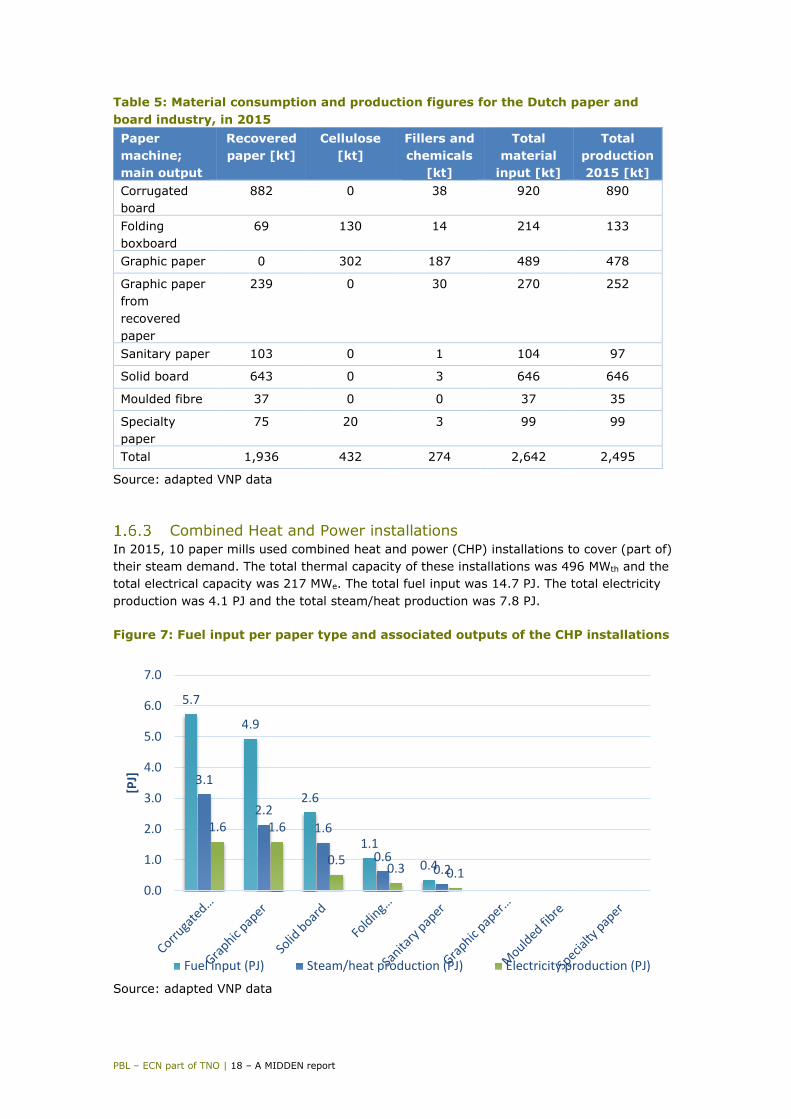
Combined Heat and Power installations In 2015, 10 paper mills used combined heat and power (CHP) installations to cover (part of) their steam demand. The total thermal capacity of these installations was 496 MWth and the total electrical capacity was 217 MWe. The total fuel input was 14.7 PJ. The total electricity production was 4.1 PJ and the total steam/heat production was 7.8 PJ. Figure 7: Fuel input per paper type and associated outputs of the CHP installations
Source: adapted VNP data
5.7
4.9
2.6
1.10.4
3.1
2.21.6
0.60.2
1.6 1.6
0.5 0.3 0.10.0
1.0
2.0
3.0
4.0
5.0
6.0
7.0
[PJ]
Fuel input (PJ) Steam/heat production (PJ) Electricity production (PJ)

A MIDDEN report – PBL – ECN part of TNO | 19
Decommissioned units According to Statistics Netherlands (CBS), in 2015 there were 25 CHP installations in the Dutch paper and board industry with a total electrical capacity of 309 MWe9 instead of 217 MWe. The difference can be explained by the fact that the Dutch paper and board industry had previously invested heavily in combined heat and power installations to meet their energy demand. Due to unfavourable natural gas and electricity prices, some of these installations have been decommissioned and therefore no longer appear in the database of the VNP but are still included in the statistics of CBS. Therefore, in 2015, there was only an active CHP capacity of 217 MWe in the Dutch paper and board industry (see Table 6). Table 6: Overview of CHP capcity per paper type, in 2015
Paper machine; main output Electrical capacity CHP
[MWe]
Thermal capacity CHP [MWth]
Graphic paper 93 213 Corrugated board 84 131 Solid board 24 115 Folding boxboard 13 22 Sanitary paper 4 15 Graphic paper from recovered paper 0 0 Moulded fibre 0 0 Specialty paper 0 0 Total 217 496
Source: adapted VNP data Electricity sold to the grid The final electricity consumption in the Dutch paper and board industry was 4.7 PJ in 2015 and the total electricity generation by CHP installations was 4.1 PJ. The CHP installations of the graphic paper and corrugated board mills exceeded their final electricity consumption; the excess electricity produced was sold to the grid (see Figure 8). The net consumption of electricity (electricity consumption minus electricity produced) from the grid was 0.5 PJ.
9 Source: Elektriciteit; productie en productiemiddelen, Statistics Netherlands (CBS) (preliminary data for
2015).

PBL – ECN part of TNO | 20 – A MIDDEN report
Figure 8: Electricity consumption and production per product type
Source: adapted VNP data
1.00.9 1.0
0.7
0.4 0.4
0.1
0.3
1.6 1.6
0.0
0.5
0.10.3
0.0 0.0
-0.6-0.7
1.0
0.10.3
0.1 0.1
0.3
-1.0
-0.5
0.0
0.5
1.0
1.5
2.0
Graphicpaper
Corrugatedboard
Graphicpaper fromrecovered
paper
Solid board Sanitarypaper
Foldingboxboard
Mouldedfibre
Specialtypaper
[PJ]
Final electricity consumption Electricity production CHP Net electricity consumption
A MIDDEN report – PBL – ECN part of TNO | 21
2 Paper and board production processes This chapter provides insights regarding the production processes of the paper and board mills in the Netherlands. This includes the specific energy/material consumption and capacity and cost of equipment. The VNP has provided a data set on the energy and material consumption of the paper mills in 2015 that was used to analyse the specific energy and material consumption for each paper type. The presented energy consumption in this chapter is provided in round figures, for reasons of confidentiality.
2.1 Stock preparation and drying
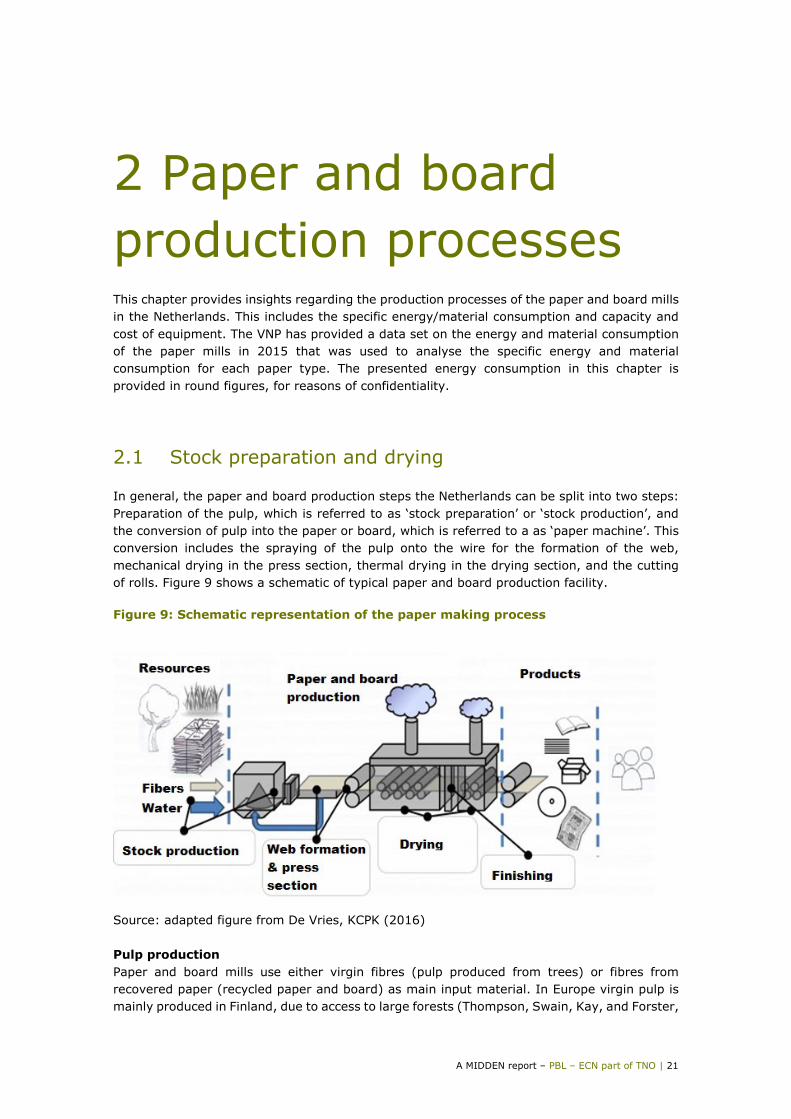
In general, the paper and board production steps the Netherlands can be split into two steps: Preparation of the pulp, which is referred to as ‘stock preparation’ or ‘stock production’, and the conversion of pulp into the paper or board, which is referred to a as ‘paper machine’. This conversion includes the spraying of the pulp onto the wire for the formation of the web, mechanical drying in the press section, thermal drying in the drying section, and the cutting of rolls. Figure 9 shows a schematic of typical paper and board production facility. Figure 9: Schematic representation of the paper making process
Source: adapted figure from De Vries, KCPK (2016) Pulp production Paper and board mills use either virgin fibres (pulp produced from trees) or fibres from recovered paper (recycled paper and board) as main input material. In Europe virgin pulp is mainly produced in Finland, due to access to large forests (Thompson, Swain, Kay, and Forster,
PBL – ECN part of TNO | 22 – A MIDDEN report
2001). In the Netherlands, only one mill, Mayr-Melnhof Eerbeek B.V. (HBM, 2015), produces (part of) its own pulp directly from wood. The rest of the pulp used by Dutch paper and board mills is either imported virgin fibre pulp or pulp made from recovered paper. The energy used to convert the recovered paper into pulp is part of the stock preparation process. Therefore, there is virtually no energy consumption related to pulp production in the Netherlands. Stock preparation In stock preparation, fibres are dissolved in water producing a mixture with a typical dry matter content (dmc) of 1% (De Vries, 2016). When needed, the fibres are treated to enhance their properties (e.g. improved bonding ability). The use of recovered paper and board often means that cleaning steps are required to remove plastics, small metal parts, ash and other impurities. De-inking and dispersion are sometimes also required to remove ink and other small particles, depending on the requirements for the end product. The main stock preparation steps are:
• Cleaning: Removal of unwanted elements through various sorting and screening steps; • Deinking: Ink removal; this is necessary for paper grades where brightness and
cleanliness are important, for example, for newsprint, tissue or light topliner of recovered paper-based carton boards (Laurrijssen, 2013).;
• Dispersion: Reducing impurities that could not be removed to a size small enough not to harm the paper quality (Laurrijssen, 2013);
• Refining: Paper grades produced from virgin fibres sometimes require a refining step. The fibres are beaten to roughen their surface which enhances the fibre properties. Currently, refining is done using rotating disks pressed on a stator (Laurrijssen, 2013)10.
Paper machine Paper and board is produced from pulp using the following processes:
• Forming: Formation of the paper web; • Pressing: Mechanical removal of water; • Pre-drying: Thermal removal of water; • Coating (if applicable): Surface property adaptations by applying e.g. starch; • After-drying (if applicable): Thermal removal of water after coating.
During the formation, pulp (1% dmc) is spread over a wide wire to let the fibres form paper. Most of the water is removed during this phase by gravitational forces. After the forming section, the dry matter content is around 20% to 25% (Laurrijssen, 2013). The paper is then mechanically pressed in the press section to remove as much water as possible. The dry matter content of the resulting paper web is then 50%–55% (De Vries, 2016). The remaining water content of the paper web is thermally dried by rolling the paper web over steam cylinders (multi-cylinder system, the most commonly used drying technology in paper and board production), blowing hot dry air into the web (done in combination with a large steam cylinder in so-called yankee dryers, typically used in the production of sanitary paper), or by using hot air convection in tunnel drying (typically used for the production of moulded fibre). Table 7 provides an overview of typical steam temperatures and pressures used to produce various product types.
10 Refining is energy intensive requiring on average 150 kWe/t (range varying from 80 kWe/t to 1,500 kWe/t) (Clumpkens, 2018).

A MIDDEN report – PBL – ECN part of TNO | 23
Table 7: Specific steam temperatures and pressures, per paper type
Paper type Steam temperature drying section (max) [C]
Steam pressure drying section (max)
[barg] Graphic paper 150 5 Graphic paper from recovered paper
150 5
Corrugated board 180 10 Solid board 180 10 Folding boxboard 180 10 Sanitary paper 165 7 Moulded fibre11 n/a n/a Specialty paper12 150 5
Source: adapted VNP data Depending on the requirements of the product an extra coating can be applied to the product after the (pre) dryer. Since the coating introduces extra moisture to the paper web, after-drying is needed. This can be done using infra-red drying (‘no contact’ drying) or multi-cylinder drying (De Vries, KCPK, 2016). Being a hygroscopic product, the moisture content of the final paper product is still 4%–8%, despite thermal drying (De Vries, KCPK, 2016).
Specific energy consumption The energy consumption per tonne of product (specific energy consumption) varies per paper type. For all paper types, the consumption of steam is greater than that of electricity. In terms of electricity, the average energy demand per paper type varies from 1.0–4.0 GJ/t product, while, in terms of steam (or direct heat for the tunnel and Yankee driers), the range for the average energy demand per paper type is 4.0–6.3 GJ/t product. Figure 10 illustrates the specific energy consumption per paper type.
11 Moulded fibre production does not use steam for drying (De Vries, 2016). 12 There is no data available for specialty paper but it is assumed the temperature and pressure used is the
same as for graphic paper.

PBL – ECN part of TNO | 24 – A MIDDEN report
Figure 10: Specific energy consumption per energy input per paper type in 2015
Source: adapted VNP data The process step with the highest energy consumption is the drying step. The specific energy consumption for the drying step varies per product type and depends on the dry matter content of the pulp before going into the drying section, the need for coating, the use of multi-cylinder drying or yankee dryers, and the amount of energy recovered from the heat coming out of the drying section (Laurijssen, 2013). After evaporation of the water in the drying section, the energy (in the form of waste heat) can be partially recovered via heat exchangers if there is a drying hood. The heat can be used with heat exchangers for heating of the drying air, process and cleaning water, and (during colder months) heating of the buildings. The amount of heat that can be recovered depends on the quality (dew point) of the waste heat. The specific electricity consumption varies depending on the need for cleaning steps during stock preparation and for refining. Sanitary paper and graphic paper made from recovered paper use a relatively large amount of electricity because of the deinking/dispersion steps of these mills. Solid board and corrugated board production, on the other hand, use relatively little electricity because they have little to no need for refining and require less extensive cleaning steps. Note that the SEC presented in Figure 10 is based on the data of one specific year, in which also different mills producing the same paper type are aggregated. A range of the specific energy consumption is provided in Table 8.
1.0
2.92.1
3.8 4.0
1.01.7
3.54.4
5.2 5.05.7
6.2
4.0
6.2 6.3
00
01
02
03
04
05
06
07
Corrugatedboard
Foldingboxboard
Graphicpaper
Graphicpaper fromrecovered
paper
Sanitarypaper
Solid board Mouldedfibre
Specialtypaper
[GJ/ton]
Specific electricity consumption Specific consumption of heat/steam
A MIDDEN report – PBL – ECN part of TNO | 25
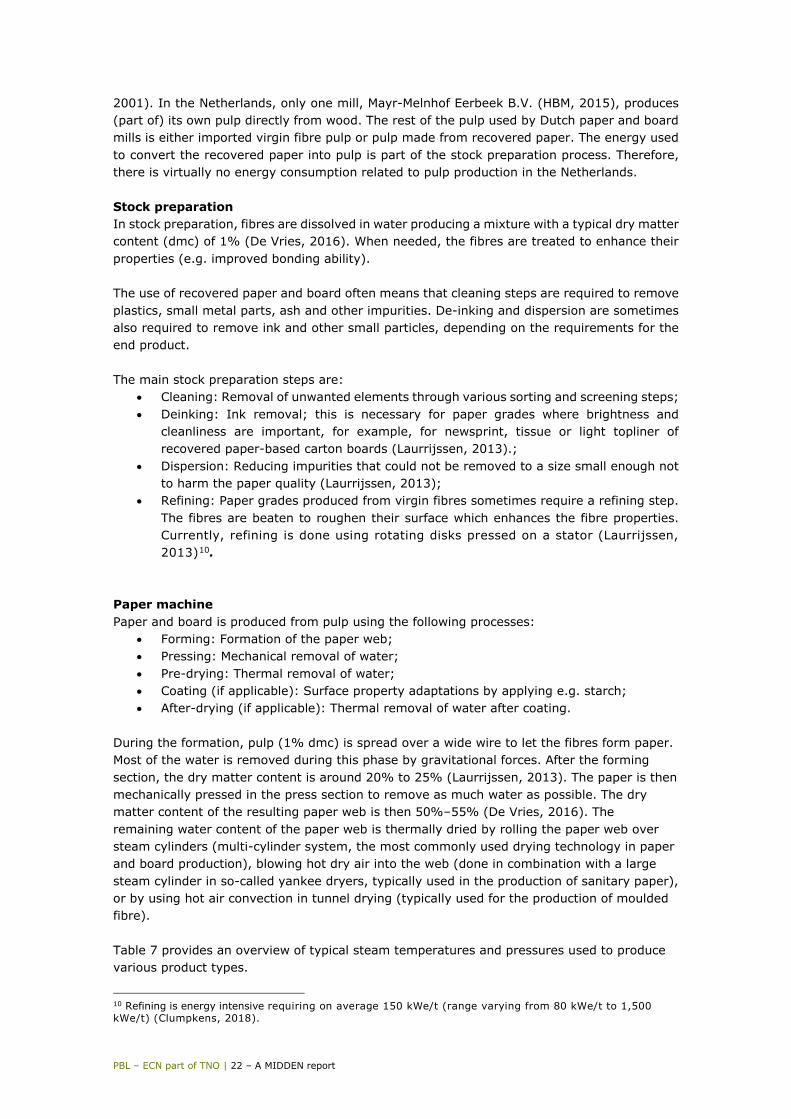
Table 8: SEC ranges for various product types
Product type Range specific electricity consumption (GJ/t)
Range specific steam consumption (GJ/t)
Graphic paper from recovered paper
3.6–4 5.4–6
Graphic paper 2–2.1 4.8–5.2 Sanitary paper 3.4–4.6 6.1–6.2 Corrugated board 0.7–1.3 4.1–5 Solid board 0.6–1.2 2.9–4.4 Folding boxboard 2.8–3 4.9–5.5 Moulded fibre 1.6–1.8 5.9–6.5 Specialty paper 2.8–>5 4.7–>8
Source: adapted VNP data The waste heat leaving the drying section has a dew point that varies from 25 oC to 74 oC, depending on the use and configuration of a drying hood. Some of the mills use the waste heat to heat the process water, buildings, and cleaning water. There is no mill-specific data available on waste heat dew point and volumes, but, based on discussions with internal experts and KCPK, it is assumed that mills with an annual production of 100 kt or more have a drying hood and a waste heat dew point of at least 55 oC (Laurrijssen, 2013) and, currently, use half of their waste heat to heat the dryer ventilation air, process water and the machine hall13, with the remaining waste heat dissipated into the atmosphere at 30 °C to 40 oC. The other mills are assumed to have no drying hood and, therefore, the waste heat from their drying section cannot be reused, as most of the heat leaves the machine room through ventilation, at 25 °C to 40 oC.
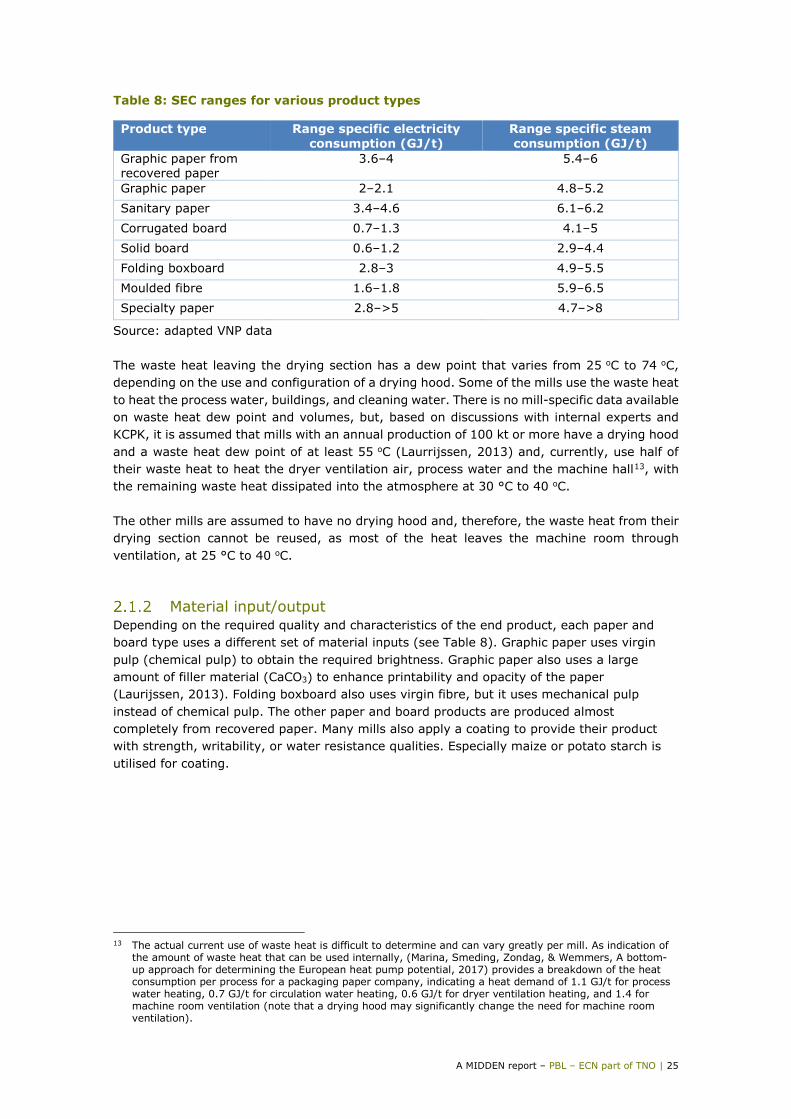
Material input/output Depending on the required quality and characteristics of the end product, each paper and board type uses a different set of material inputs (see Table 8). Graphic paper uses virgin pulp (chemical pulp) to obtain the required brightness. Graphic paper also uses a large amount of filler material (CaCO3) to enhance printability and opacity of the paper (Laurijssen, 2013). Folding boxboard also uses virgin fibre, but it uses mechanical pulp instead of chemical pulp. The other paper and board products are produced almost completely from recovered paper. Many mills also apply a coating to provide their product with strength, writability, or water resistance qualities. Especially maize or potato starch is utilised for coating.
13 The actual current use of waste heat is difficult to determine and can vary greatly per mill. As indication of
the amount of waste heat that can be used internally, (Marina, Smeding, Zondag, & Wemmers, A bottom-up approach for determining the European heat pump potential, 2017) provides a breakdown of the heat consumption per process for a packaging paper company, indicating a heat demand of 1.1 GJ/t for process water heating, 0.7 GJ/t for circulation water heating, 0.6 GJ/t for dryer ventilation heating, and 1.4 for machine room ventilation (note that a drying hood may significantly change the need for machine room ventilation).
PBL – ECN part of TNO | 26 – A MIDDEN report
Table 9: Overview of material consumption per paper type, in 2015
Paper machine; Main output
Recovered paper [t/t product]
Cellulose [t/t product]
Fillers and chemicals [t/t
product]
Total input [t/t product]
Corrugated board
1.0 0.0 0.0 1.0
Folding boxboard
0.5 1.0 0.1 1.614
Graphic paper 0.0 0.6 0.4 1.0 Graphic paper from recovered paper
0.9 0.0 0.1 1.1
Sanitary paper 1.1 0.0 0.0 1.1 Solid board 1.0 0.0 0.0 1.0 Moulded fibre 1.0 0.0 0.0 1.0 Specialty paper 0.8 0.2 0.0 1.0
Source: adapted VNP data.
Investment and operational cost Paper and board production is highly capital-intensive (Ghosal and Nair-Reicher, 2007) and the required investments for a paper machine are in the hundreds of millions. The refurbishment cycle and technical lifetime of a paper machine are difficult to estimate, as it consists of many different parts that are continuously replaced, whereas the main body of the machine can last for many decades. Table 10: Costs for multi-cylinder15 drying paper machine in the Netherlands (source: estimation from VNP)
Parameter Capacity [t/yr] Investment [euro]
Investment cost [euro/t/yr]
New paper machine 80,000 250,000,000 3,125 New paper machine 400,000 500,000,000 1,250 New paper machine 500,000 600,000,000 1,200 Stock preparation 400,000 3,000,000 8 Stock preparation 500,000 4,000,000 8
Operation and maintenance (O&M) costs16 are an important part of the operational costs in paper and board production. Estimates for the operation and maintenance costs (see Table 11) were provided by the Knowledge Centre for Paper and Cardboard (KCPK), using a report of the Technopolis Group (Technopolis group, 2016). The O&M costs are relatively high for sanitary paper and relatively low for corrugated board.
14 It is unclear what causes the larger required material input for folding boxboard. 15 Multi-cylinder drying is used in graphic paper, corrugated board, solid board, and folding box board
production. The investment cost for sanitary paper (Yankee dryer) and moulded fibre (tunnel dryer) are unknown.
16 The costs for energy and raw materials are not included in the O&M costs.

A MIDDEN report – PBL – ECN part of TNO | 27
Table 11: OPEX (source: estimation from KCPK)
[EUR2014 per tonne of product] Operating and maintenance costs (O&M)
Corrugated board 64 Graphic paper 84 Sanitary paper 132 Solid board 94 Folding boxboard 94 Graphic paper made from recovered paper
83
Moulded fibre 9417 Specialty paper 8418
2.2 Steam supply
The main energy input for the paper machine is steam. In the mills, steam is produced using either a CHP or a boiler. The energy input used are natural gas, biogas, and solid biomass19.
Energy use and efficiency The steam supply system of the Dutch paper and board industry consists of boilers and CHP installations. The energy use (natural gas, biomass) of the boilers and efficiency of the CHP installations varies per mill. Natural gas boilers are assumed to have an efficiency of 90% (LHV). A biomass boiler also, according to (ECN, 2016), has an efficiency of 90% (LHV) Based on VNP data, the total efficiency of the CHP installations of the Dutch paper industry varies between 73% and 93%, with electrical efficiency varying from 15% to 33%.
Capacity Based on VNP data, an overview of estimated installed MW for the boilers and CHP installations was created (see Table 12). Please note that the installed capacity is not directly correlated to the energy consumption, as some of the installed capacity may not be used (for example: a boiler that is no longer used due to the heat provided by a newly installed CHP).
17 There is no cost data for moulded fibre but are assumed to be the same as for solid board. 18 There is no cost data for specialty paper but are assumed to be the same as for graphic paper. 19 Note that other fuels such as diesel and LPG are also used, but in negligible quantities (less than 1%).

PBL – ECN part of TNO | 28 – A MIDDEN report
Table 12: CHP and Boiler MW installed
Paper machine; Main output
Electrical capacity CHP [MWe]
Thermal capacity CHP
[MWth]
Boiler capacity [MWth]
Graphic paper 93 213 258 Corrugated board 84 131 154 Solid board 24 115 192 Folding boxboard 13 22 42 Sanitary paper 4 15 27 Graphic paper from recovered paper
0 0 125
Moulded fibre 0 0 0 Specialty paper 0 0 50 Total 217 496 849
Source: adapted VNP data
Investment and operational cost The cost for CHP installations varies depending on the size of the installation (see Table 13). A major overhaul is required after 60,000 operational hours, requiring around 25% of the original investment (Energy Matters - Consultans for energy solutions, 2015). Table 13: CHP cost data
CHP Investment cost [EUR/kWe]
Cycle cost20 [EUR/MW]
Variable operational cost [EUR/MWh]
Source
Small CHP (6 MWel)21
650 30 8 (Energy Matters - Consultans for energy solutions, 2015)
Medium CHP (22 MWel)22
550 75 7 (Energy Matters - Consultans for energy solutions, 2015)
Large CHP (42 MWel)23
500 100 5.5 (Energy Matters - Consultans for energy solutions, 2015)
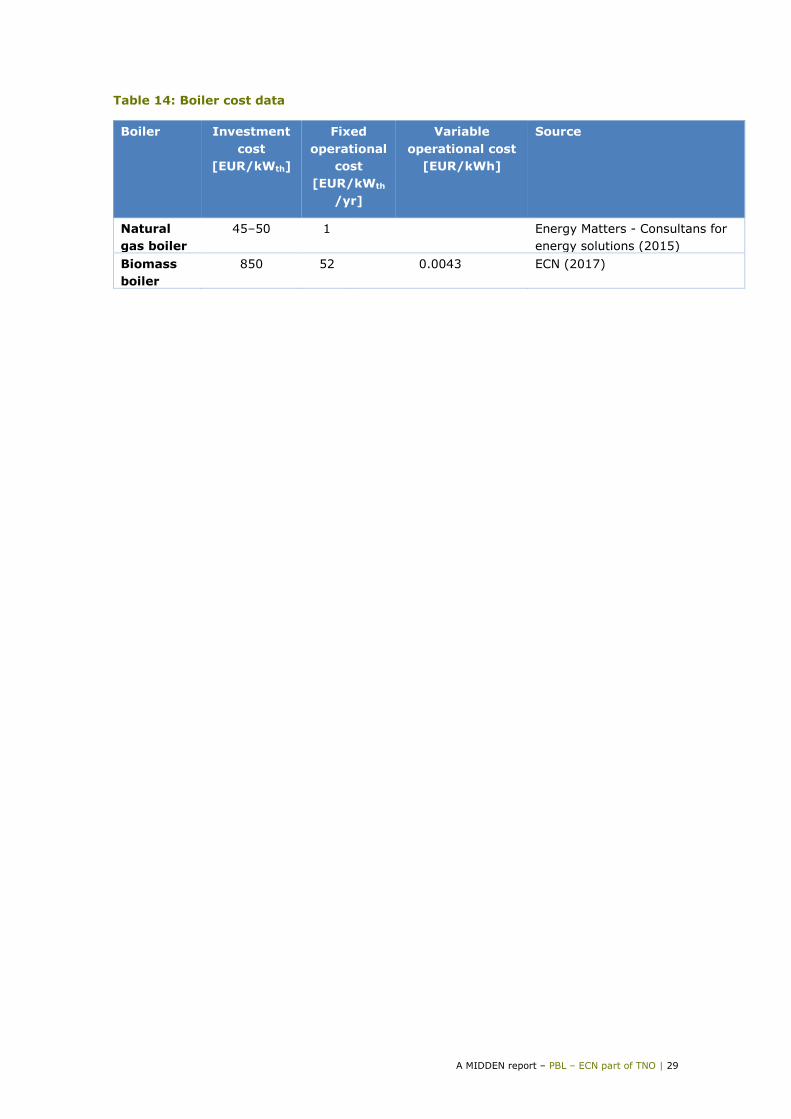
The paper mills generally use natural gas boilers to produce steam, except for one graphic paper mill (Parenco) that uses a biomass boiler. The costs related to these two types of boilers are presented in Table 14). The corrugated board mill Smurfit Kappa uses the biogas from their wastewater treatment plant for their combustion boiler. A natural gas combustion boiler has a technical lifetime of 25–40 years (IEA, 2010).
20 Maintenance cost related to start/stop of the installation (Energy Matters - Consultans for energy solutions,
2015) 21 Refers to a 6 MWel CHP with a 31.5% electrical efficiency and 42.5% thermal efficiency. 22 Refers to a 22 MWel CHP with a 33.5% electrical efficiency and 41.5% thermal efficiency. 23 Refers to a 42 MWel CHP with a 32.5% electrical efficiency and 42.5% thermal efficiency.
A MIDDEN report – PBL – ECN part of TNO | 29
Table 14: Boiler cost data
Boiler Investment cost
[EUR/kWth]
Fixed operational
cost [EUR/kWth
/yr]
Variable operational cost
[EUR/kWh]
Source
Natural gas boiler
45–50 1
Energy Matters - Consultans for energy solutions (2015)
Biomass boiler
850 52 0.0043 ECN (2017)

PBL – ECN part of TNO | 30 – A MIDDEN report
3 Paper and board products and application 3.1 Paper and board end products
The paper and board products characteristics and end-uses can be described as follows: • Graphic paper (from virgin or recovered paper) covers a wide range of products such as
magazine paper, leaflets, and specialty papers. Graphic paper starts with a grammage of 12 g/m2 and 18 g/m2 for silk paper and cigarette paper, respectively (Papier en Karton, 2018). Aquarelle paper can reach up to 150 g/m2 (Papier en Karton, 2018). Graphic paper can be bleached and non-bleached, ironed and non-ironed, wood containing and wood free, depending on customer demands (Papier en Karton, 2018);
• Corrugated board is board of 115-300 g/m2 (Testvalleypkg, 2018). This paper type is mainly used as case material and it can be bleached or mottled (Cepi, 2018). The production can be done in several ways to achieve different strengths. There are different flute types that make the corrugated board appear thicker (Testvalleypkg, 2018);
• Solid board, also referred to as grey board is board in the range of 250 – 550 g/m2 (VPK paper, 2018). The thickness is than 0,4 – 0,87 mm (VPK paper, 2018). Solid board finds it application in food and industrial packaging, and cores or rolls (VPK paper, 2018);
• Folding boxboard is board in the range of 200 – 350 g/m2 (Iggesund, 2018). It can be produced in single and multiple layers. Folding boxboards are used for food packaging, such that coating can be needed (Cepi, 2018). Yet, it is also available uncoated;
• Sanitary paper is a light paper product of 13 - 57 g/m2 (Greensesal, 2018). Typical products are toilet paper, hand towels, kitchen towels and tissues (Cepi, 2018).
• Moulded fibre is used in handling and packaging of products, providing protection and convenience. Moulded fibre is used for both food and non-food applications. Examples include food containers, food trays and packaging for electronics24.
3.2 Commodity data
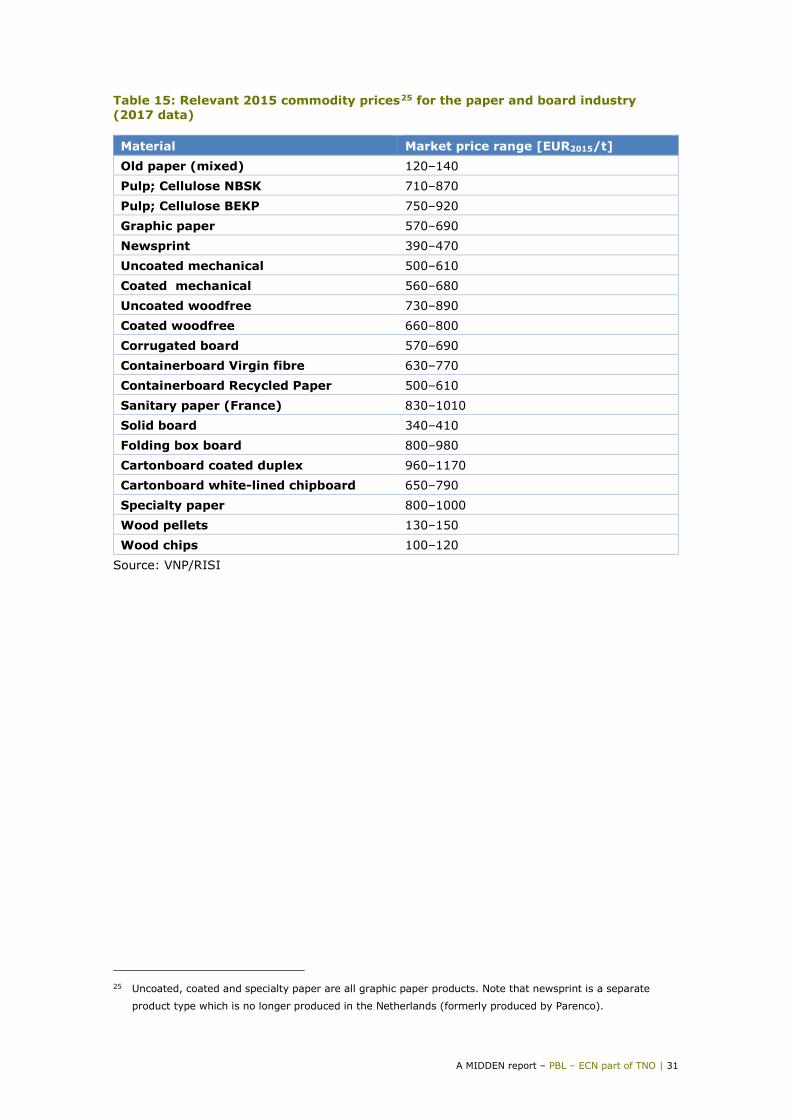
The market prices for paper and board input materials and end products for 2015 are provided in Table 15.
24 https://www.imfa.org/molded-fiber/
A MIDDEN report – PBL – ECN part of TNO | 31
Table 15: Relevant 2015 commodity prices25 for the paper and board industry (2017 data)
Material Market price range [EUR2015/t] Old paper (mixed) 120–140 Pulp; Cellulose NBSK 710–870 Pulp; Cellulose BEKP 750–920 Graphic paper 570–690 Newsprint 390–470 Uncoated mechanical 500–610 Coated mechanical 560–680 Uncoated woodfree 730–890 Coated woodfree 660–800 Corrugated board 570–690 Containerboard Virgin fibre 630–770 Containerboard Recycled Paper 500–610 Sanitary paper (France) 830–1010 Solid board 340–410 Folding box board 800–980 Cartonboard coated duplex 960–1170 Cartonboard white-lined chipboard 650–790 Specialty paper 800–1000 Wood pellets 130–150 Wood chips 100–120
Source: VNP/RISI
25 Uncoated, coated and specialty paper are all graphic paper products. Note that newsprint is a separate
product type which is no longer produced in the Netherlands (formerly produced by Parenco).
PBL – ECN part of TNO | 32 – A MIDDEN report
4 Options for decarbonisation This chapter provides examples of decarbonisation options for the paper and board production derived from literature. This list of options is not exhaustive and provides only a limited view of the total potential of future developments of production processes and technologies in the paper and board industry.
4.1 Energy efficiency improvement
Heat pumps Heat pumps move thermal energy in the opposite direction of spontaneous heat transfer, by absorbing heat from a cold space and releasing it to a warmer one. A heat pump uses a small amount of external power to accomplish the work of transferring energy from the heat source to the heat sink. Paper and board production uses steam with temperatures between 150 oC and 180 oC (VNP, 2018). High temperature (HT) heat pumps that provide heat well above 130 °C for industrial application are currently not available and most systems above 90 °C do not have an acceptable CAPEX (Marina, Smeding, Zondag and Wemmers, 2017). Furthermore, a large temperature lift, coupled with Carnot heat pump limitations results in a lower efficiency (Marina, Smeding, Zondag and Wemmers, 2017). Further research is needed to achieve temperature levels of around 200oC with efficient heat pump systems, which will enable heat pumps to be used by the paper and board industry using their current steam pressures. Heat pumps up to 90 oC are commercially available (TRL 9), although there has not been a substantial roll-out (ECN, 2018). TRL levels for different types of skid-mounted heat pumps of around 2 MWth output (ECN, 2018): • Compression heat pumps using synthetic refrigerant up to 120 oC – TRL 8; • Compression heat pumps using natural refrigerant up to 120 oC – TRL 6; • Compression heat pumps using synthetic or natural refrigerant up to 160 oC – TRL 5; • Compression heat pumps above 160 oC – TRL 4-5; • Thermo-acoustic heat pumps for heat supply of 120–200 oC – TRL 4-5. HT heat pumps have gained a significant amount of attention. Although a MW size HT heat pumps is not commercially available yet, it can be expected that this will be achieved within the next couple of years (Berenschot, Energy Matters, CE Delft, Industrial Energy Experts, 2017). A pilot scale HT heat pump installation (200 kW) was installed at the Dutch paper mill Smurfit Kappa Roermond by ECN (ECN, 2013).

A MIDDEN report – PBL – ECN part of TNO | 33
Note that electrification of the drying process will have an impact on the required grid connection. Literature does not provide a clear overview of the expected additional connection cost when using a heat pump, but to illustrate the potential cost, according to Tennet26 a 110 kV and 150 kV connection costs approx. EUR 1.5 million, and a 220 kV and 380 kV costs approx. EUR 3 million. Table 16: Heat pumps, economic data
Parameter Value Source
Output Steam Fuel Electricity, waste heat Emissions No on-site emissions Capacity 0.25–40 MWth Thermax (2018); ECN
(2017) Efficiency
3.5–4 COP ECN (2017)
Lifetime 10–15 years Lux Research (2018); Berenschot, Energy Matters, CE Delft, Industrial Energy Experts (2017)
Investment cost27 300–900 EUR/kWth Lux Research (2018; Berenschot, Energy Matters, CE Delft, Industrial Energy Experts (2017); ECN (2017)
O&M 3% of CAPEX ECN (2017)
Heat pumps have strong potential in the paper and board industry due to the steam demand (5–15 bar steam) and available waste heat at varying temperatures (dew point per machine varies from 25 °C to 74 oC). The disadvantages are the low TRL for high temperature (up to 200 oC) heat pumps, and the relatively high impact of the technology on the production process (when compared to e.g. electric boilers).
Compression refining The refining step is highly energy intensive, responsible for a significant amount of the electricity consumption in paper production. Recent research has shown that the current method of refining produces a high amount of fines (small particles that are splits of the main fibre). Production of these fines is partly responsible for the higher water retention and diminishes the recycling capability of the pulp material (Marsidi, 2008). An alternative technology currently under development is Compression Refining. This technology applies beating forces, which reduces the amount of produced fines. The energy required for refining can be decreased by approximately 20% because of the higher efficiency compared to the normal disc refiner (respectively 95% to 25%). The paper production energy is also reduced (20%), thanks to less energy requirements in the drying step, and faster dewatering on the strings (Marsidi, 2008). Compression Refining is a technology under development. A 2.5 t/h continuous production model will be tested in 2019 (Clumpkens M. , 2018). 26 https://www.tennet.eu/nl/elektriciteitsmarkt/aansluiten-op-het-nederlandse-hoogspanningsnet/kosten-van-
een-netaansluiting/ 27 For a reverse-Rankine cycle type heat pump.
PBL – ECN part of TNO | 34 – A MIDDEN report
Table 17: Compression Refining, economic data
Parameter Value Source Output Refined pulp Fuel Electricity Emissions No on-site emissions Capacity 2.5 t/h28 Clumpkens (2018) Efficiency
50% less electricity consumption; 5% to 10% less drying energy consumption29
Estimation based on Clumpkens (2018)
Lifetime Unknown Investment cost Unknown O&M Unknown
4.2 Decarbonisation of steam supply
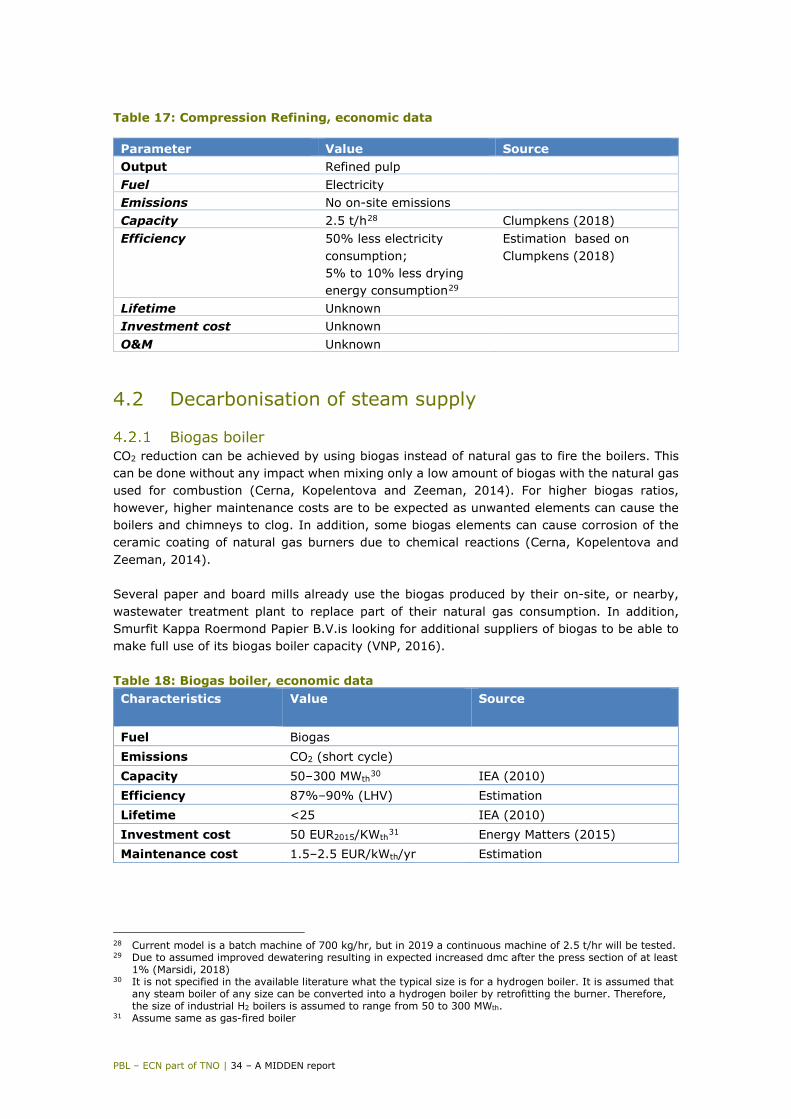
Biogas boiler CO2 reduction can be achieved by using biogas instead of natural gas to fire the boilers. This can be done without any impact when mixing only a low amount of biogas with the natural gas used for combustion (Cerna, Kopelentova and Zeeman, 2014). For higher biogas ratios, however, higher maintenance costs are to be expected as unwanted elements can cause the boilers and chimneys to clog. In addition, some biogas elements can cause corrosion of the ceramic coating of natural gas burners due to chemical reactions (Cerna, Kopelentova and Zeeman, 2014). Several paper and board mills already use the biogas produced by their on-site, or nearby, wastewater treatment plant to replace part of their natural gas consumption. In addition, Smurfit Kappa Roermond Papier B.V.is looking for additional suppliers of biogas to be able to make full use of its biogas boiler capacity (VNP, 2016). Table 18: Biogas boiler, economic data Characteristics Value Source
Fuel Biogas Emissions CO2 (short cycle) Capacity 50–300 MWth30 IEA (2010) Efficiency 87%–90% (LHV) Estimation Lifetime <25 IEA (2010) Investment cost 50 EUR2015/KWth31 Energy Matters (2015) Maintenance cost 1.5–2.5 EUR/kWth/yr Estimation
28 Current model is a batch machine of 700 kg/hr, but in 2019 a continuous machine of 2.5 t/hr will be tested. 29 Due to assumed improved dewatering resulting in expected increased dmc after the press section of at least
1% (Marsidi, 2018) 30 It is not specified in the available literature what the typical size is for a hydrogen boiler. It is assumed that
any steam boiler of any size can be converted into a hydrogen boiler by retrofitting the burner. Therefore, the size of industrial H2 boilers is assumed to range from 50 to 300 MWth.
31 Assume same as gas-fired boiler

A MIDDEN report – PBL – ECN part of TNO | 35
Electric boilers There are two types of industrial electric boiler systems: • Using an electric heating element that acts as a resistance (electric boiler); • Using the conductive and resistive properties of the water itself to carry electric current
(electrode boiler). Electric boilers and electrode boilers mainly apply to utility-related processes (steam production). The implementation threshold is perceived as relatively low as it does not require a complete redesign of primary processes (Berenschot, Energy Matters, CE Delft, Industrial Energy Experts, 2017). The electric/electrode boilers can also be used as flex option to be used during periods of low electricity prices (Berenschot, Energy Matters, CE Delft, Industrial Energy Experts, 2017)32. Saturated steam with temperatures of up to 350°C and 70 bar can be produced with commercially available electrode boilers (capacities of up to 70 MWe). Advantages of this technology is (Berenschot, Energy Matters, CE Delft, Industrial Energy Experts, 2017), (Berenschot, CE Delft and ISPT, 2015): • An efficiency of up to 99.9%; • Robust; • Low CAPEX; • Can be used as flexible capacity. Electric boilers can be provided with low voltage (400V) up to high voltage (690V). These boilers are already on the market (danstoker, 2018). Note that to be considered a decarbonisation option, the electricity supply must come from a renewable source. Table 19: Electric boiler, economic data
Characteristics Value Source
Fuel Electricity Emissions 0 Capacity 0.4–70 MWe Berenschot, Energy Matters, CE
Delft, Industrial Energy Experts (2017)
Electrical efficiency 95%–99% Thermona (2010) Lifetime 10–15 years Berenschot, CE Delft, ISPT,
(2015); VNP (2018) Investment costs/CAPEX 150–190 EUR/kWe2017
(incl. installation)33 Berenschot, CE Delft, ISPT, (2015)
Maintenance costs/OPEX 1.1 EUR/kW/yr FOM and 0.5 EUR/MWh VOM
Berenschot, Energy Matters, CE Delft, Industrial Energy Experts (2017)
Although electric boilers are commercially available, there are some challenges regarding the electricity infrastructure and additional costs for connection. For example, Smurfit Kappa
32 The potential for steam boilers with an integrated gas-fired and electric element is currently ongoing (TNO,
2018). 33 Note, however, that the electricity connection costs are site specific and can therefore vary significantly
PBL – ECN part of TNO | 36 – A MIDDEN report
Roermond Papier B.V. researched the option of implementing an electrode boiler for 9.5 or 30 MWe of flexible power to make use of low electricity prices, but came to the conclusion that the investment cost could not be recuperated unless the connection cost (150 kV cable) and annual grid cost could be shared with the grid operator (Berenschot, Delft, and ISPT, 2015).
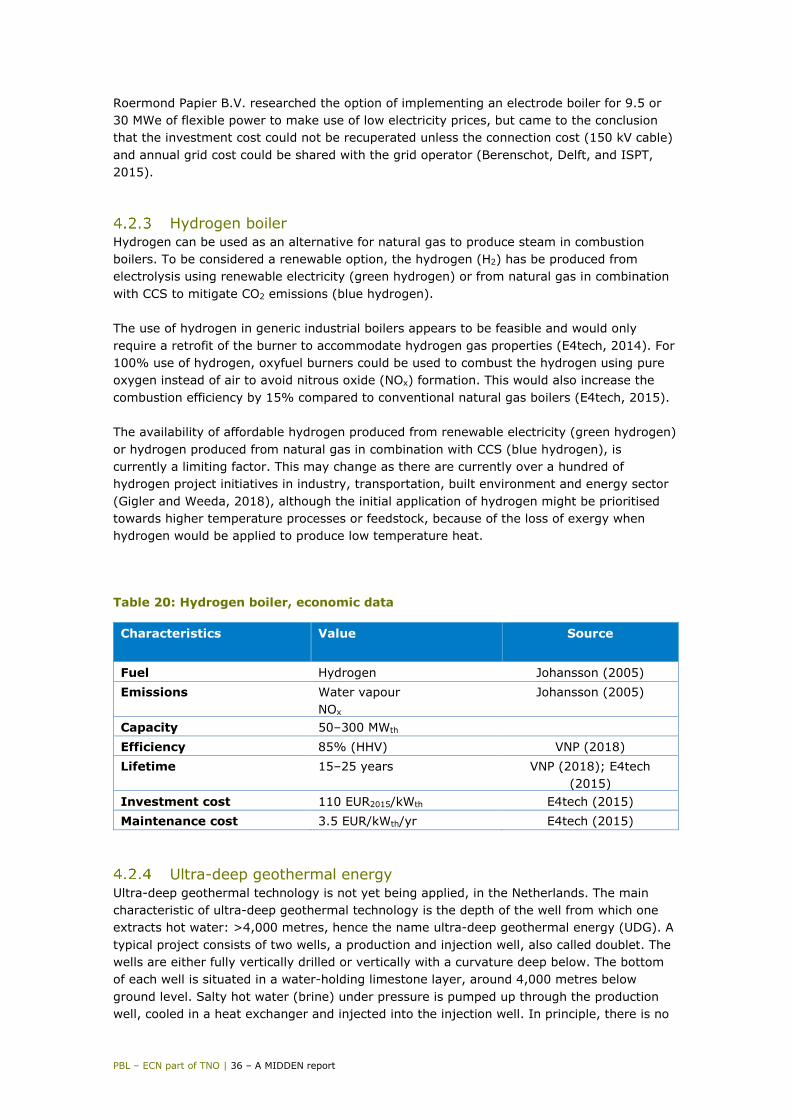
Hydrogen boiler Hydrogen can be used as an alternative for natural gas to produce steam in combustion boilers. To be considered a renewable option, the hydrogen (H2) has be produced from electrolysis using renewable electricity (green hydrogen) or from natural gas in combination with CCS to mitigate CO2 emissions (blue hydrogen). The use of hydrogen in generic industrial boilers appears to be feasible and would only require a retrofit of the burner to accommodate hydrogen gas properties (E4tech, 2014). For 100% use of hydrogen, oxyfuel burners could be used to combust the hydrogen using pure oxygen instead of air to avoid nitrous oxide (NOx) formation. This would also increase the combustion efficiency by 15% compared to conventional natural gas boilers (E4tech, 2015). The availability of affordable hydrogen produced from renewable electricity (green hydrogen) or hydrogen produced from natural gas in combination with CCS (blue hydrogen), is currently a limiting factor. This may change as there are currently over a hundred of hydrogen project initiatives in industry, transportation, built environment and energy sector (Gigler and Weeda, 2018), although the initial application of hydrogen might be prioritised towards higher temperature processes or feedstock, because of the loss of exergy when hydrogen would be applied to produce low temperature heat. Table 20: Hydrogen boiler, economic data
Characteristics Value Source
Fuel Hydrogen Johansson (2005) Emissions Water vapour
NOx Johansson (2005)
Capacity 50–300 MWth Efficiency 85% (HHV) VNP (2018) Lifetime 15–25 years VNP (2018); E4tech
(2015) Investment cost 110 EUR2015/kWth E4tech (2015) Maintenance cost 3.5 EUR/kWth/yr E4tech (2015)
Ultra-deep geothermal energy Ultra-deep geothermal technology is not yet being applied, in the Netherlands. The main characteristic of ultra-deep geothermal technology is the depth of the well from which one extracts hot water: >4,000 metres, hence the name ultra-deep geothermal energy (UDG). A typical project consists of two wells, a production and injection well, also called doublet. The wells are either fully vertically drilled or vertically with a curvature deep below. The bottom of each well is situated in a water-holding limestone layer, around 4,000 metres below ground level. Salty hot water (brine) under pressure is pumped up through the production well, cooled in a heat exchanger and injected into the injection well. In principle, there is no
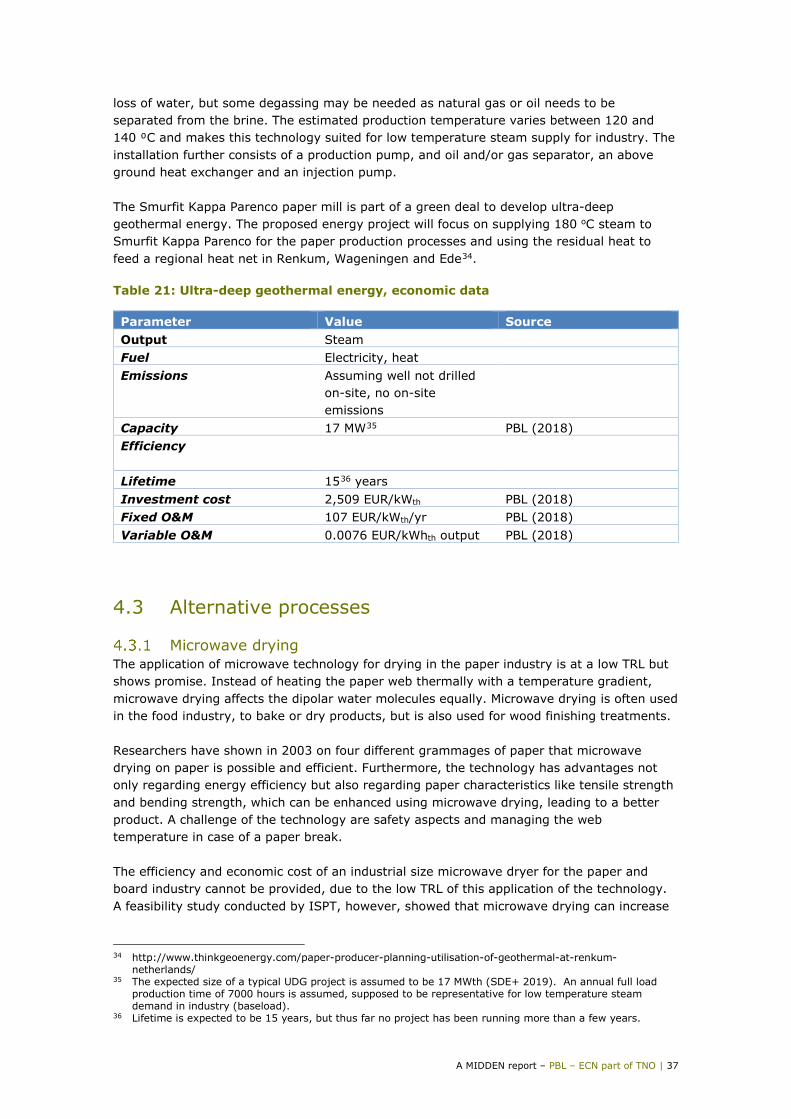
A MIDDEN report – PBL – ECN part of TNO | 37
loss of water, but some degassing may be needed as natural gas or oil needs to be separated from the brine. The estimated production temperature varies between 120 and 140 ⁰C and makes this technology suited for low temperature steam supply for industry. The installation further consists of a production pump, and oil and/or gas separator, an above ground heat exchanger and an injection pump. The Smurfit Kappa Parenco paper mill is part of a green deal to develop ultra-deep geothermal energy. The proposed energy project will focus on supplying 180 oC steam to Smurfit Kappa Parenco for the paper production processes and using the residual heat to feed a regional heat net in Renkum, Wageningen and Ede34. Table 21: Ultra-deep geothermal energy, economic data
Parameter Value Source Output Steam Fuel Electricity, heat Emissions Assuming well not drilled
on-site, no on-site emissions
Capacity 17 MW35 PBL (2018) Efficiency
Lifetime 1536 years Investment cost 2,509 EUR/kWth PBL (2018) Fixed O&M 107 EUR/kWth/yr PBL (2018) Variable O&M 0.0076 EUR/kWhth output PBL (2018)
4.3 Alternative processes
Microwave drying The application of microwave technology for drying in the paper industry is at a low TRL but shows promise. Instead of heating the paper web thermally with a temperature gradient, microwave drying affects the dipolar water molecules equally. Microwave drying is often used in the food industry, to bake or dry products, but is also used for wood finishing treatments. Researchers have shown in 2003 on four different grammages of paper that microwave drying on paper is possible and efficient. Furthermore, the technology has advantages not only regarding energy efficiency but also regarding paper characteristics like tensile strength and bending strength, which can be enhanced using microwave drying, leading to a better product. A challenge of the technology are safety aspects and managing the web temperature in case of a paper break. The efficiency and economic cost of an industrial size microwave dryer for the paper and board industry cannot be provided, due to the low TRL of this application of the technology. A feasibility study conducted by ISPT, however, showed that microwave drying can increase
34 http://www.thinkgeoenergy.com/paper-producer-planning-utilisation-of-geothermal-at-renkum-
netherlands/ 35 The expected size of a typical UDG project is assumed to be 17 MWth (SDE+ 2019). An annual full load
production time of 7000 hours is assumed, supposed to be representative for low temperature steam demand in industry (baseload).
36 Lifetime is expected to be 15 years, but thus far no project has been running more than a few years.

PBL – ECN part of TNO | 38 – A MIDDEN report
paper machine speeds by 30% and reduce energy consumption for drying by 20% (Bajpai, 2016).
Air-laid technology The most energy intensive part of paper production is the removal of water. A more drastic solution to reduce energy consumption is to make paper without the use of water. Dry formation, also known as air-laid technology, produces paper webs without the use of water (FINDEST, 2018). The technology is already applied in nonwoven textile production and could potentially be used in the papermaking industry (FINDEST, 2018). Currently, the achieved paper strength is rather low making it less suitable for board with packaging purposes but could be used in the production of sanitary paper or graphic paper. Reports have shown that the drying energy demand may be reduced by up to 50% (Bajpai, 2016). However, it has also been estimated that an additional 150–250 kWh electricity per ton paper would be needed (Bajpai, 2016). Wastewater treatment steps would be eliminated from the production process (FINDEST, 2018). Air-laid technology uses different techniques to ensure the quality of the paper product. One technique uses latex as a binder (LBAL). Thermal bonding (TBAL) is also possible. When these two techniques are combined this is called multi-bonded air-laid technology (MBAL) (Jezzi, 2017). Hydrogen-bonded air-laid (HBAL) technology is also known (Jezzi, 2017). MBAL is expected to grow substantially, in the future (Jezzi, 2017). Currently, Dan Web, located in Denmark, produces MBAL installations and has so far sold over 60 installations worldwide (Dan-web, 2018). A major advantage in the further development of MABL is that thicker products can be produced, although this involves higher costs (Jezzi, 2017). Figure 11 illustrates the multi-bond air-laid technology as supplied by Dan Web. The input in this process is fluff pulp, which is made from softwoods (Nanko, Button and Hillman, 2005). After the web is formed in the multi-head forming section, latex is sprayed on to the web to bond with the fibres (Jezzi, 2017). In the oven, the fibres are then also thermally bonded to ensure greater paper strength. Finally, the embosser refines the product by imprinting patterns. Figure 11: Schematic representation of air-laid technology (Jezzi, 2017)

A MIDDEN report – PBL – ECN part of TNO | 39
Table 22: Characteristics of air-laid technology from various sources
Property Value Source Energy reduction potential drying energy
50% FINDEST (2018)
Electricity consumption 150–250 kWh/t paper Bajpai (2016) Capacity 12,000–20,000 t/yr Jezzi (2017) CAPEX Unknown OPEX Unknown Speed limitation 400–500 miles/minute Jezzi (2017)
4.4 Other technologies
The technologies mentioned in Section 4.3 are radically new technologies that might need 10 to 20 years of development before they can be implemented. Since the technologies introduced mainly depend on electricity, one could argue that using those technologies could result in plant emissions reaching zero for the drying section. However, improving the existing drying technology also remains relevant. Electric drying technologies might only be applicable for a specific paper type. Furthermore, the development of any technology is strongly related to the interest and cooperation of large machine building companies, such as Voith. Involvement of main manufacturers of machinery for the paper and pulp industry is crucial for accelerated development, scale-up and implementation. Various other technologies within the paper sector are under development, as well as general heat recovery technologies that could be applied in many sectors. Below is a selection of these technologies.
4.4.1 CapWa – Capture of evaporated Water CapWa technology (short for Capture of evaporated Water) is used to recycle process-related water. Nowadays, when water evaporates it is lost to the atmosphere when it leaves the system. This water, thus, is then wasted instead of being recovered. However, with CapWa technology, gas separation membranes are installed in wet air outlets of manufacturers in the paper industry (Ludwin Daal, KEMA Nederland BV, 2013). Depending on the membrane, water can be separated in a purified form, after which it can be reused in the paper production process. The positive side effect is that it may be used to prepare the air containing steam from the drying section into a suitable ‘air-free’ stream to allow heat recovery via vapour recompression. This could potentially lead to CO2 reductions. This technology has already been tested laboratories and has found its first pilot in a coal fired station in Israel producing 100 kg of water per hour (Ludwin Daal, KEMA Nederland BV, 2013). Also, in a Dutch paper mill the method was tested and will find a follow up module in an upcoming project. Economically on European paper sector scale savings of EUR 1 billion are expected (Ludwin Daal, KEMA Nederland BV, 2013). However, this technology is still in its pilot phase but looks promising for scaling up in Dutch paper mills.
4.4.2 Mechanical vapour recompression Another option to optimise paper production is the use of MVR in the exhaust air of the paper drying section. The evaporated water from the paper web present in the exhaust air is recompressed mechanically so that the right temperature and pressure are achieved to
PBL – ECN part of TNO | 40 – A MIDDEN report
enable the steam to be integrated into the production process (GEA Process Engineering GmbH). The compressor consists of a centrifugal fan, which is driven by electrical energy. The installation becomes more efficient with increasing size of the heat exchanger surface (GEA Process Engineering GmbH). The thermal energy reduction may be up to 50%. There is an increase in electricity consumption of 160 kWh/t. This technology cannot completely eliminate CO2 emissions, however, reusing heating energy may significantly decrease the energy input for the drying section, thus reducing CO2 emissions from the steam production. This technology is already on the market. Investment costs are high, but the return on investment (ROI) is estimated at around 1.5 years. A disadvantage is the presence of air in the exhaust fumes from the drying section. Combination with the CapWa technology could potentially solve this problem.
4.4.3 Technologies under development In addition to the technologies described above, there are many research and development projects currently underway to increase the efficiency of paper drying and to further reduce CO2 emissions. Next to many other topics, superheated steam drying as well as impulse-assisted drying are of interest to the Dutch paper and board industry. When using superheated steam, it is easier to dry without the risk of condensation. Due to the research status, estimations on energy and emission reduction are not yet confirmed. Impulse-assisted drying is an extension of the common press section. In other sectors, this technique is already being used; however, no trials have yet been run in the paper sector.

A MIDDEN report – PBL – ECN part of TNO | 41
5 Discussion This chapter discusses the time frame for implementation of options and other current considerations.
5.1 Short-term options
Electric boilers are available and can be implemented without adjustments to the main production process. Steam production using electric boilers is generally expensive compared to steam production using natural gas boilers, due to the price of electricity compared to the price of natural gas. The flexibility of the electric boilers, however, allows them to be used only at times when the electricity prices are low.Electric boilers may require significant additional investments due to the required larger connection to the electricity grid, which, at current prices, hampers their application (Berenschot, Energy Matters, CE Delft, Industrial Energy Experts, 2017). Biogas is another short-term alternative to decarbonise part of the paper industry’s CO2 emissions. Five mills already use biogas (Smurfit Kappa Parenco, Smurfit Kappa Roermond B.V., Eska B.V., Huhtamaki Nederland B.V. and DS Smith paper De Hoop) as energy carrier, and Solidus Solutions Board B.V. is looking for partners to achieve economies of scale sufficiently large to create an attractive business case for their 300,000 m3 of biogas37. As with an electric boiler, biogas boilers can be implemented with little impact on the production process. Their application is limited by the amount of available biomass suitable for digestion or the amount of available biogas/green gas from third parties.
The use of hydrogen to replace natural gas is another utility side solution. However, there is currently no infrastructure nor large scale production of green or blue hydrogen. Also, initial hydrogen production might be steered predominantly towards higher temperature processes or to be used as feedstock, instead of steam production. 5.2 Medium- to long-term options
Compression refining is currently in the pilot scale phase of development. Once the development is finalised, this option can significantly lower the CO2 emissions from graphic paper mills, which are responsible for around one third of the total CO2 emissions from the Dutch paper and board industry (a reduction of around 5%–10% in drying energy, in addition to reducing the electricity consumption for refining by half). Heat pumps are an efficiency option that convert low temperature waste heat into high temperature heat. They are currently already available up to temperatures of 90 oC. High temperature heat pumps that provide the required steam pressure and temperature levels required for paper and board production are however still under development. Once developed, however, this option can reduce a substantial part of the direct CO2 emissions from the paper and board industry. The impact on the production process of a heat pump, however, is considerable. 37 https://vnp.nl/wp-content/uploads/2016/07/Naar-een-duurzame-energievoorziening.pdf
PBL – ECN part of TNO | 42 – A MIDDEN report
Air-laid technology has a rising market share and is promoted especially in new paper production sites. The technology has potential for large energy savings in the drying step. The input of fluff pulp makes this technology only suitable for products using virgin fibres rather than recovered paper. Note that increasing the use of virgin fibres is considered not desirable due to the lower energy efficiency within the total value chain, compared to products made from recovered fibres (Laurijssen, 2013). Ultra-deep geothermal energy has potential for paper and board mills, depending on the location. Smurfit Kappa Parenco started research in 2012 into geothermal energy (IF Technology, 2012). According to a geological study, the region of Renkum has a source of geothermal energy suitable for the paper mill’s needs. The depth of the digging would be 5,000 m NAP where the temperature is estimated to be 185°C (IF Technology, 2012). The heat from this depth would be used to convert water to steam. The capacity of this installation would be 20 MW and would be able to make warm water and steam of 3,8 bar and 160°C available for the production process (IF Technology, 2012). In the end this could save 25% of the natural gas consumption (IF Technology, 2012). For the realisation of the drilling and installing the technique an investment of EUR 54 million is expected (IF Technology, 2012). However, EUR 12.5 million in annual savings, including CO2 credits, is expected. In June 2017, a Green Deal was signed between Alliander, Smurfit Kappa Parenco and QNQ to start the project on ultra-deep geothermal energy (Alliander, 2018). From the studies executed so far it can be concluded that geothermal energy might be an interesting renewable energy source for the larger paper and board companies in the Netherlands. However, investment costs are high, making coalitions for such project almost mandatory. Geothermal energy is a locally dependent solution and might not be easily applied by other Dutch paper mills. Microwave drying is a technology that has the potential to electrify the drying energy consumption of the paper and board production. The application of this technology in the paper and board industry, however, is at a low TRL. Various other technological options are under development, both within the sector (e.g. enhanced dewatering) as well as general technologies that might be applicable in several sectors (e.g. vapor recompression).

A MIDDEN report – PBL – ECN part of TNO | 43
References Alliander (2018). Ultradiepe geothermie diep dieper diepst. www.allianderdgo.nl:
https://www.allianderdgo.nl/nieuws/ultradiepe-geothermie-diep-dieper-diepst.html. Bajpai (2016). Pulp and Paper Industry: Energy Conservation. Elsevier. Berenschot, CE Delft and ISPT (2015). Power to products. Berenschot, Energy Matters, CE Delft, Industrial Energy Experts (2017). Electrification in the
Dutch process industry. Cepi (2018). www.cepi.org: http://www.cepi.org/node/22328. Cerna K, Kopelentova K and Zeeman M. (2014). Biogas and its energy use. EU Lifelong
Learning Programme. Clumpkens M. (2018). Interview with Math Clumpkens. (M. Marsidi, Interviewer) Clumpkens M. (2018). Pitch Compressie behandeling KCPK. Danstoker (2018). Info on boilers in energy sector. http://danstoker.com/wp-
content/uploads/2017/11/Datasheet-Electric-Boilers-GB.pdf. Dan-web (2018). www.dan-web.com http://www.dan-web.com/about-us.html De Vries L, KCPK. (2016). Drogen in de papier- en kartonindustrie.
https://www.processinnovation.nl/drogen-in-de-papier-en-karton-industrie. https://www.processinnovation.nl/drogen-in-de-papier-en-karton-industrie.
E4tech (2015). Scenarios for deployment of hydrogen in contributing to meeting carbon budgets and the 2050 target.
E4tech and Energy (2014). Development of water electrolysis in the European Union. ECN (2016). Finaal eindadvies SDE+ 2017. ECN (2017). Conceptadvies basisbedragen SDE plus 2018. ECN (2017). Dutch programme for the acceleration of sustainable heat management in industry. ECN (2018). Internal data ECN. ECN (2018). Personal communication Anton Wemmers. Energy Matters (2015). Flexibilisering industriele WKK. The Netherlands: GasTerra. EPA (2015). CHP technologies section 4. steam turbines. Ferrite (2018). Communication with Ferrite. (K. Rademaker, Interviewer) FINDEST (2018). CSF4 Breakthrough Technology Roadmap. Netherlands: VNP. Ghosal V and Nair-Reicher U. (2007). Investments in modernization, innovation and gains in
productivity. Gigler J and Weeda M. (2018). Routekaart Waterstof TKI Nieuw Gas. Greensesal (2018). www.greenseal.org:
http://www.greenseal.org/Portals/0/Documents/Standards/GS-1/GS-1_Sanitary_Paper_Products_Standard_Fifth_Edition.pdf.
HBM (2015). Startnotitie m.e.r-procedure MayrMelnhof Eerbeek bv. IEA (2010). Industrial combustion boilers. IF Technology (2012). Geothermal energy at Norske Skog Parenco - Feasibility study. IF. Iggesund. (2018, 10). Opgehaald van www.iggesund.som:
https://www.iggesund.com/en/knowledge/product-catalogue/incada-family/incada-exel/.
Jezzi R. (2017). Airlaid Pulp Nonwoven: ‘The forgotten Technology’. (pp. 1–22). Sao Paulo: A.D. Jezzi & Associaties, LLC.
Johansson K. (2005). Hydrogen as fuel for turbines and engines. Sweden: Turbin- & Processteknik.
Laurijssen J. (2013). Energy use in the paper industry, An assessment of improvement potentials at different levels. PhD thesis Kenniscentrum Papier en Karton/Utrecht University.
PBL – ECN part of TNO | 44 – A MIDDEN report
Laurrijssen J. (2013). Energy use in the Dutch paper industry. Utrecht. Lux Research (2018). Taking the C out of steam. Marina A, Smeding S, Zondag H and Wemmers A. (2017). A bottom-up approach for
determining the European heat pump potential. Marsidi M. (2008). Climate change and material efficiency in paper production. Nanko H, Button A and Hillman D. (2005). The World of Market Pulp. USA: WOMP. NEa (2018). https://www.emissieautoriteit.nl/. Papier en Karton (2018). www.papierenkarton.nl: http://papierenkarton.nl/geschiedenis-
papier-en-karton/papier-in-nederland-2/. PBL (2018). Conceptadvies geothermie SDE+ 2019. PBL Netherlands Environmental Assessment Agency, The Hague. Raffaelli P. (2018). Tissue Drying Strategies – Factors to Consider to Achieve Yankee/Hood
Balance for the Highest Energy Efficiency. Opgehaald van TissueStory: http://www.tissuestory.com/2017/09/19/tissue-drying-strategies-factors-to-consider-to-achieve-yankeehood-balance-for-the-highest-energy-efficiency/.
Technopolis Group (2016). An assessment of the cumulative cost impact of specified EU legislation and policies on the EU forest-based industries. European Union.
Testvalleypkg (2018). www.testvalleypkg.co.uk: https://www.testvalleypkg.co.uk/userfiles/downloads/49/Corrugated%20Board%20Grades%20guide.pdf.
Thermax (2018). Heat pumps. www.thermaxglobal.com: https://www.thermaxglobal.com/thermax-absorption-cooling-systems/heat-pump/
Thermona (2010). Operation and Maintenance Manual for Electric Boilers. Thompson G, Swain J, Kay M and Forster C. (2001). The treatment of pulp and paper mill
effluent: a review. Bioresource Technology, 275–286. VNP (2018). Decarbonising the steam supply of the Dutch paper and board industry. VNP (2018). VNP jaarverslag 2017. VPK paper (2018). www.vpkpaper.com: http://www.vpkpaper.com/en/grey-board.