december 2011 - institutional presentation - dec, 2011
DESCRIPTION
TRANSCRIPT

| Apresentação do Roadshow
1
As of September 30, 2011December, 2011

Disclaimer
Statements regarding the Company’s future business perspectives and projections of operational andfinancial results are merely estimates and projections, and as such they are subject to different risks anduncertainties, including, but not limited to, market conditions, domestic and foreign performance in generaland in the Company’s line of business.These risks and uncertainties cannot be controlled or sufficiently predicted by the Company managementand may significantly affect its perspectives, estimates, and projections. Statements on futureperspectives, estimates, and projections do not represent and should not be construed as a guarantee ofperformance. The operational information contained herein, as well as information not directly derived fromthe financial statements, have not been subject to a special review by the Company’s independentauditors and may involve premises and estimates adopted by the management.
2

| Company overview

.1 Platform of brands of reference
Arezzo&Co is the leading company in the footwear an d accessories sector through its platform of Top of M ind brands
1
4

.2 Company overview
Arezzo&Co is the reference in the Brazilian retail sector and has a unique positioning combining growth with high cas h generation
1Leading company in the footwear and accessories sector with presence in all Brazilian states
Controlling shareholders are the reference in the sector
Development of collections with efficient supply chain
Asset light: high operational efficiency
Strong cash generation and high growth
7.1 million pairs of shoes(1)
494 thousand handbags(1)
c.2,094 points of sale
11.1% market share(2)
39 years of experience in the sector
Wide recognition
~11,500 models created per year
Lead time of 40 days
7 to 9 launches per year
88% outsourced production
ROIC of 43% in 3Q11
1,746 employees
Net revenues CAGR: 38.3% (07- 3Q11)
Net income CAGR: 54% (07- 3Q11)
Increased operating leverage
Notes:1. LTM as of September 20112. Refers to the Brazilian women footwear market (source: Euromonitor, IBGE and Company estimates) . Estimated for 2010.
5

� Founded in 1972
� Focused on brand and product
� Consolidation of industrial business model located in Minas Gerais
� 1.5 mm pairs per yearand 2,000 employees
� Focus on retail
� R&D and production outsourcing on Vale dos Sinos -RS
� Franchises expansion
� Specific brands for each segment
� Expansion of distribution channels
� Efficient supply chain
First store
Fast Fashion concept
Launch of the first design with
national success
+
Schutz launch
Launch of new brands
Merger
Commercial operations centralized in São Paulo
Strategic Partnership(November 2007)
Industry Reference Foundation and structuring Industrial Era Corporate EraRetail Era
2011…70’s 80’s 90’s 00’s
Opening of the first shoe factoryOpening of the first shoe factory
Opening of the flagship store at Oscar FreireOpening of the flagship store at Oscar Freire IPO
.3 Successful track record of entrepreneurshipThe right changes at the right time accelerated the Company's development
1
R$196.0 mn in primary offering
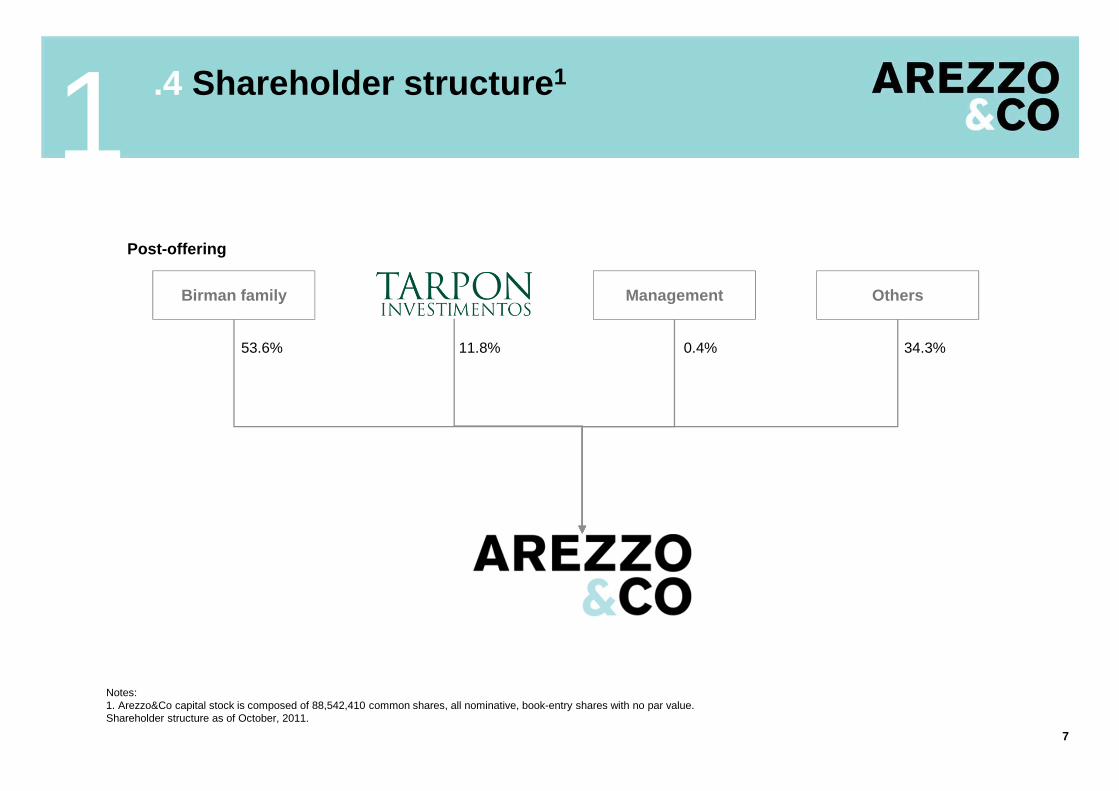
.4 Shareholder structure 1
Notes:1. Arezzo&Co capital stock is composed of 88,542,410 common shares, all nominative, book-entry shares with no par value.Shareholder structure as of October, 2011.
7
Post-offering
53.6% 34.3%
Birman family Management Others
11.8% 0.4%
1

8
.5 Culture & Management: Arezzo towards 2154
Code of Ethics
� “Our behavior is a positive example for all activities and internal or external interactions; and we treat everyone with respect, equality and cooperation”
� “We properly protect the confidentiality of our information, documents, trademarks, intellectual property and cherish the proper use of our assets”
� “The Arezzo Group’s interests prevail over personal or third party interests and guide any decision-making in the company”
� “We act with fairness in our relationships with suppliers, franchisees and customers, eliminating any situation that may generate expectations of bias in the context of receipt of gifts and invitations”
� “Our suppliers are evaluated and contracted based on clear criteria and in line with our ethical standards and conduct”
� “We are committed to ensure a responsible environmental stewardship by ensuring and establishing high standards for the purposes of protecting the environment and conserving its resources”
� “We have a socially responsible conduct and do not use any resources for unethical or illegal purposes, or that violates local or international laws”
� “It is our duty to report any breach of the Code of Ethics irrespective of the public involved”
2010
2154
Meritocratic culture based on best practices makes Arezzo a company prepared to reach 2154
1
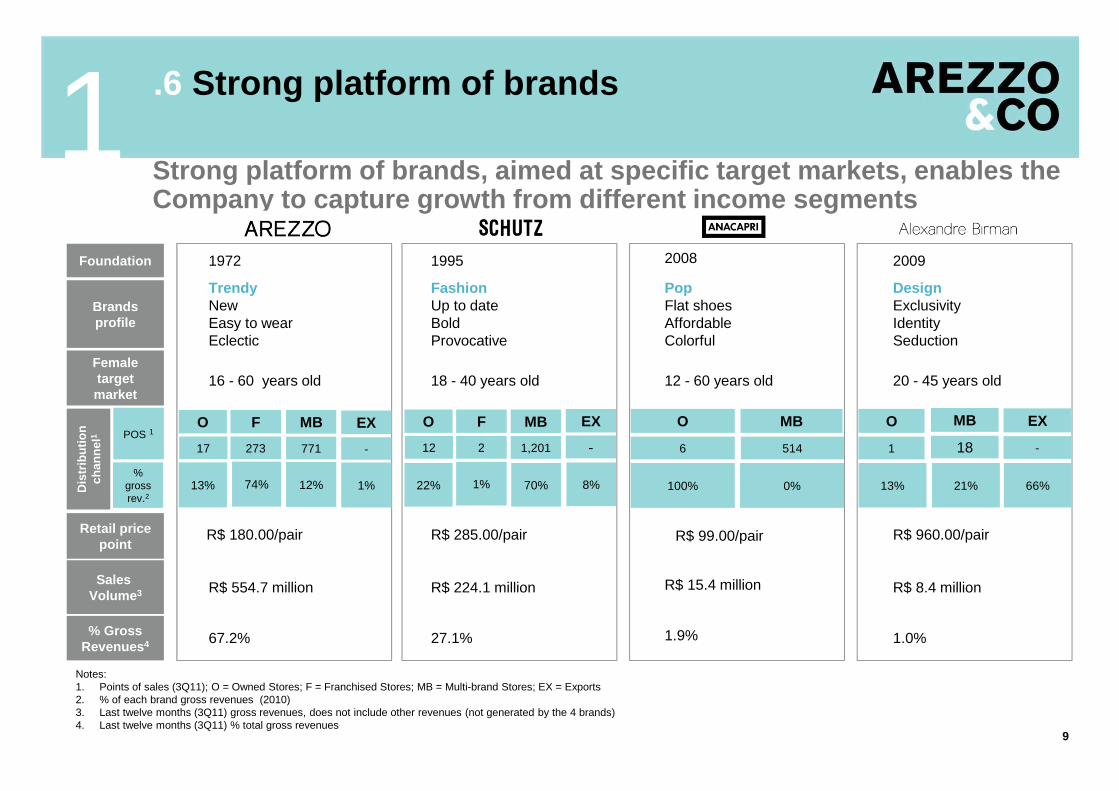
.6 Strong platform of brands
Strong platform of brands, aimed at specific target markets, enables the Company to capture growth from different income seg ments
1TrendyNewEasy to wearEclectic
FashionUp to dateBoldProvocative
16 - 60 years old 18 - 40 years old
R$ 285.00/pair
R$ 554.7 million R$ 224.1 million
PopFlat shoesAffordableColorful
12 - 60 years old
R$ 99.00/pair
R$ 15.4 million
DesignExclusivityIdentitySeduction
R$ 960.00/pair
R$ 8.4 million
20 - 45 years old
67.2% 27.1% 1.9% 1.0%
Brands profile
Female target market
Sales Volume 3
% Gross Revenues 4
Retail price point
Foundation 1972 1995 2008 2009
O
6
MB
18
O
1
O
17
F
273
MB
771
Notes:1. Points of sales (3Q11); O = Owned Stores; F = Franchised Stores; MB = Multi-brand Stores; EX = Exports2. % of each brand gross revenues (2010)3. Last twelve months (3Q11) gross revenues, does not include other revenues (not generated by the 4 brands)4. Last twelve months (3Q11) % total gross revenues
9
R$ 180.00/pair
MB
514
O
12
F
2
MB
1,201
Dis
trib
utio
n ch
anne
l1 POS 1
% gross rev.2
74% 12%13% 1% 70%22% 100%
EX
-
1%
EX
-
8%
EX
-
13% 21% 66%0%

50% 28% 16% 6% 100%
.7 Multiple distribution channels1
10
411
233
13150²
826
Flexible platform through three distribution channe ls with differentiated strategies, maximizing the Company's profitability
Gross Revenue Breakdown (R$ mn)¹
Gross Revenues per Channel
36 owned stores being 5 Flagship stores
More than 940 cities and 2,504 multi-brands
275 franchises in more than 140 cities
Broad distribution in every Brazilian
state
Franchises Multi-brands Owned stores Others Total
Notes:1. Last twelve months (3Q11) gross revenues2. Considers external market and other revenues in the domestic market

| Business model
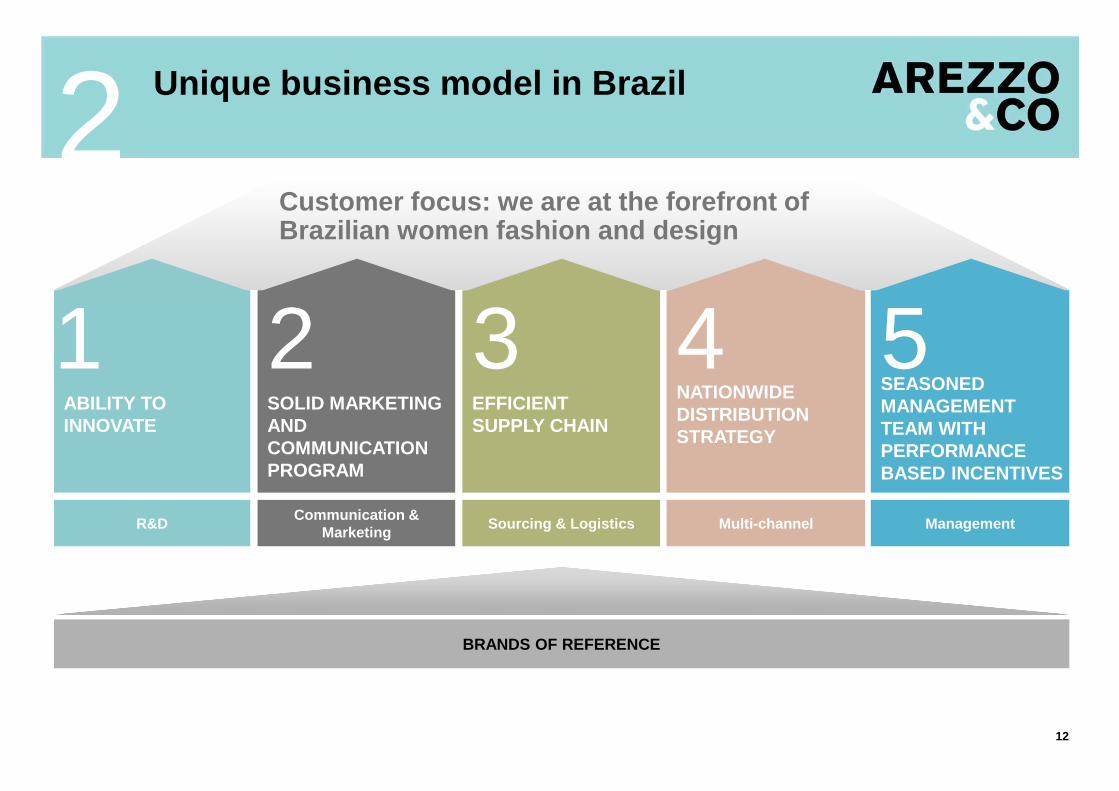
Management
BRANDS OF REFERENCE
Customer focus: we are at the forefront of Brazilian women fashion and design
Multi-channelSourcing & LogisticsCommunication &
Marketing
SEASONED MANAGEMENT TEAM WITH PERFORMANCE BASED INCENTIVES
NATIONWIDE DISTRIBUTION STRATEGY
EFFICIENTSUPPLY CHAIN
SOLID MARKETING AND COMMUNICATION PROGRAM
ABILITY TO INNOVATE
R&D
1 2 3 4 5
12
Unique business model in Brazil 2

.1 Ability to Innovate
We produce 7 to 9 collections per year2I. Research
Creation: 11,500 SKUs / year
II. Development III. Sourcing IV. Delivery
Arezzo&Co fulfills the various aspirations of wome n, delivering on average 5 new models per day, allowing for consistent desire-driv en purchases
Available for selection: 63% of SKUs created /
year
13
Stores:52% of SKUs created / year
Creation
Launch Orders
Production
Delivery
Normal sale
Discount sale
Winter I Winter II Winter III Summer I Summer II Summer III Summer IV
Activities JAN FEV MAR APR MAY JUN JUL AUG SEP O CT NOV DEC
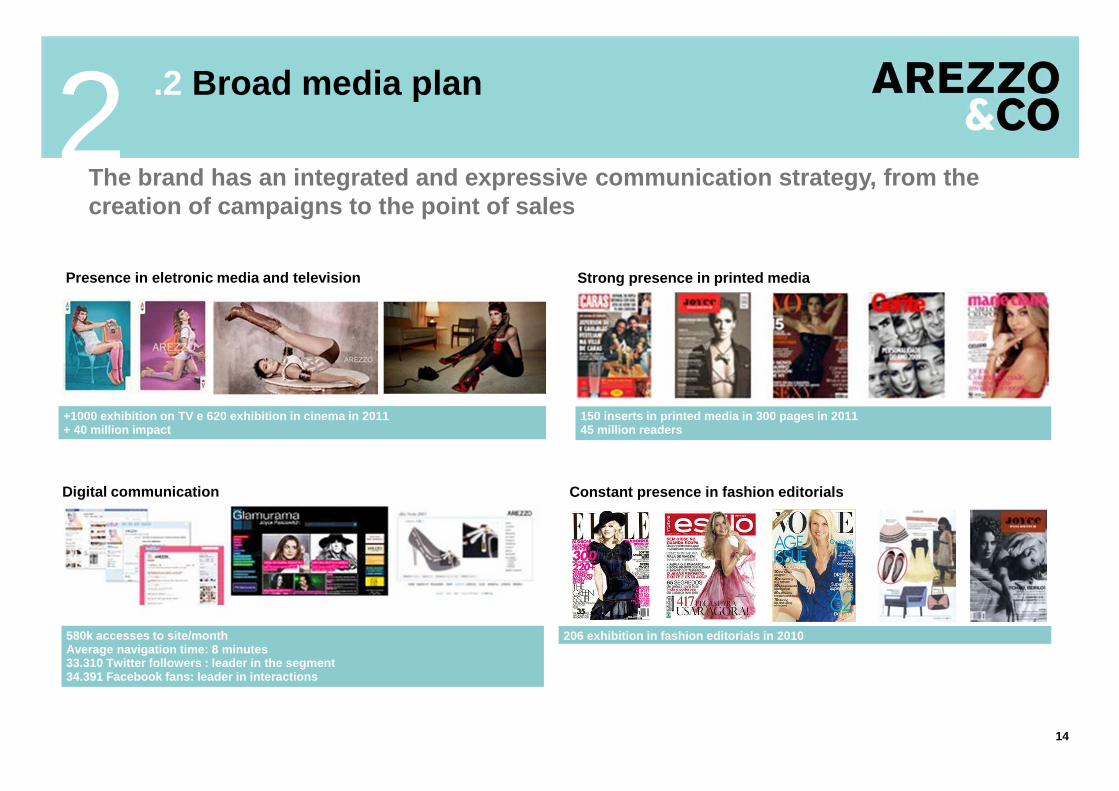
.2 Broad media plan2
14
The brand has an integrated and expressive communic ation strategy, from the creation of campaigns to the point of sales
Strong presence in printed media
150 inserts in printed media in 300 pages in 201145 million readers
Constant presence in fashion editorials
206 exhibition in fashion editorials in 2010
Digital communication
580k accesses to site/monthAverage navigation time: 8 minutes33.310 Twitter followers : leader in the segment34.391 Facebook fans: leader in interactions
Presence in eletronic media and television
+1000 exhibition on TV e 620 exhibition in cinema i n 2011+ 40 million impact

.2 Communication & marketing program reflected in every aspect of the storesStores constantly modified to incorporate the conce pt of each new collection, creating desire-driven purchases
2
All visual communication at stores is monitored and updated simultaneously throughout Brazil for each new collection
Flagship storesStore layout & visual merchandising
15
POS materials (catalogs, packaging, among others)

.2 Arezzo: constant modification on the atmosphere of the stores2
16
� Project model allows visual communication updates at low-cost investment
� Visual merchandising brings the most relevant collection information to stores’ level
� 3 main display updates per year
Flagship
Arezzo Oscar
Freire SP
Summer
Winter
Arezzo architectural project bets on chameleon concep t, with its stores constantly modified to incorporate the concept of each new col lection

.2 Schutz: flagship stores concept 2
1717
Schutz architectural project bets on flagships essence and highlights the products at a modern and cosmopolitan background
Closet� Jaquets and accessories� Brand horizontalization
Video Wall� Campaigns and marketing actions
Niches and lighting• More preeminence for products
Updated windows� Differentiated products

.3 Flexible production process…2
12%
88%
18
Arezzo’s size allows for large scale purchases from each supplier
Production speed, flexibility and scalability are a ble to ensure Arezzo&Co’s expected growth
Owned factory with capacity to produce 1.2 million pairs annually and strong relationship with Vale dos Sinos production cluster
Flexible supply model Gains of scale
Joint purchasesCertification and auditing of suppliers
In-house certification and auditing ensure quality and punctuality (ISO 9001 certification in 2008)
Negotiation of raw material jointly with local suppliers
Supply Profile Simultaneous consolidation and distribution in nati onal scale
Outsourced production
Owned plant
Reception: 100,000 units / day
Storage: 100,000 units / day
Picking: 150,000 units / day
Replacement of milky run strategy
12
3
4
5
Distribution: 200,000 units / day4

.4 ...leveraged by owned stores…
Multiple distribution model allows for capturing th e value in the chain while widening distribution capillarity and b rands’ visibility
2GREATER BRAND AWARENESS AND VISIBILITYCOUPLED WITH OPERATIONAL EFFICIENCIES
Owned stores strategy
19
Anacapri Schutz Arezzo Alexandre Birman
� Allows direct contact with consumer
� Main consumption centers (mainly SP and RJ)
� High profitability with great operational efficiency� Benchmark for franchisees
� Flagship stores ensure greater visibility and reinforce brand image
Total sales area and # of stores (m²)
1,044 1,3692,067
2,967
2007 2008 2009 2010
6974
6878
2007 2008 2009 2010
Average sales area / store (m²)
# of stores
Total sales area6
10
21
29
2
4 or more franchises
1 franchise
2 franchises
3 franchises
41%
13%
31%
16%
20
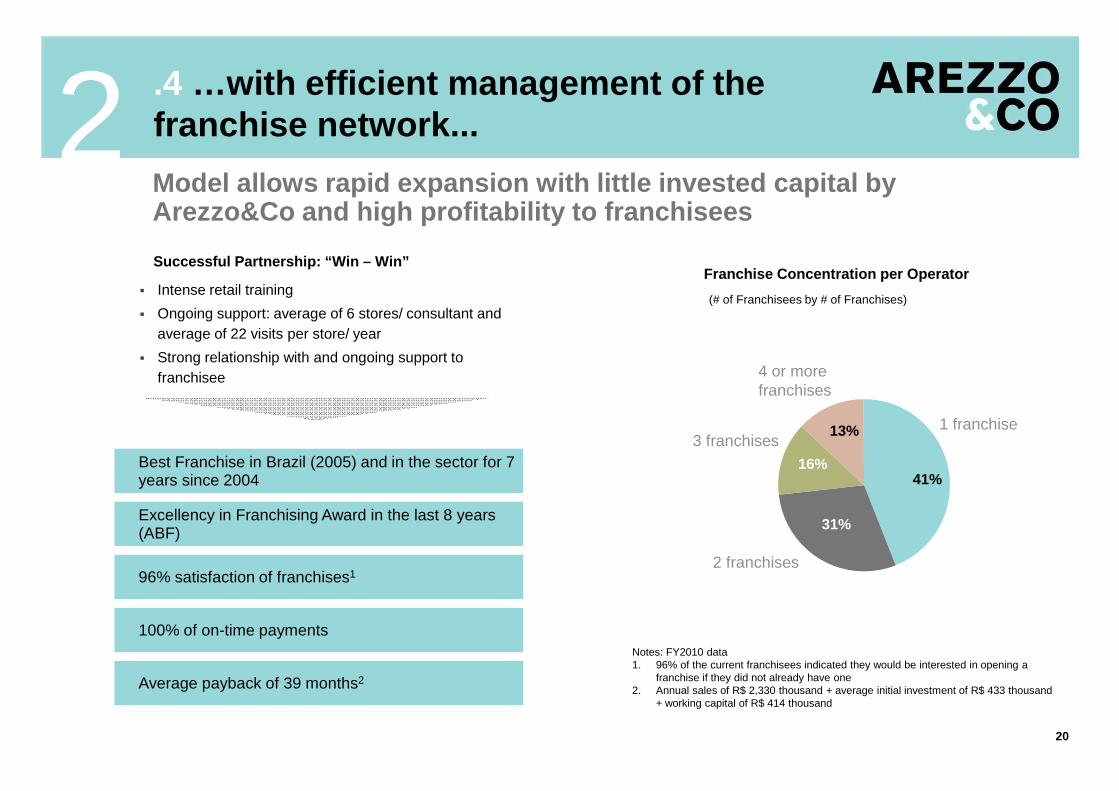
.4 …with efficient management of the franchise network...
Model allows rapid expansion with little invested c apital by Arezzo&Co and high profitability to franchisees
Successful Partnership: “Win – Win”Franchise Concentration per Operator
Average payback of 39 months2
100% of on-time payments
96% satisfaction of franchises1
Excellency in Franchising Award in the last 8 years (ABF)
Best Franchise in Brazil (2005) and in the sector for 7 years since 2004
(# of Franchisees by # of Franchises)� Intense retail training
� Ongoing support: average of 6 stores/ consultant and average of 22 visits per store/ year
� Strong relationship with and ongoing support to franchisee
Notes: FY2010 data1. 96% of the current franchisees indicated they would be interested in opening a
franchise if they did not already have one2. Annual sales of R$ 2,330 thousand + average initial investment of R$ 433 thousand
+ working capital of R$ 414 thousand
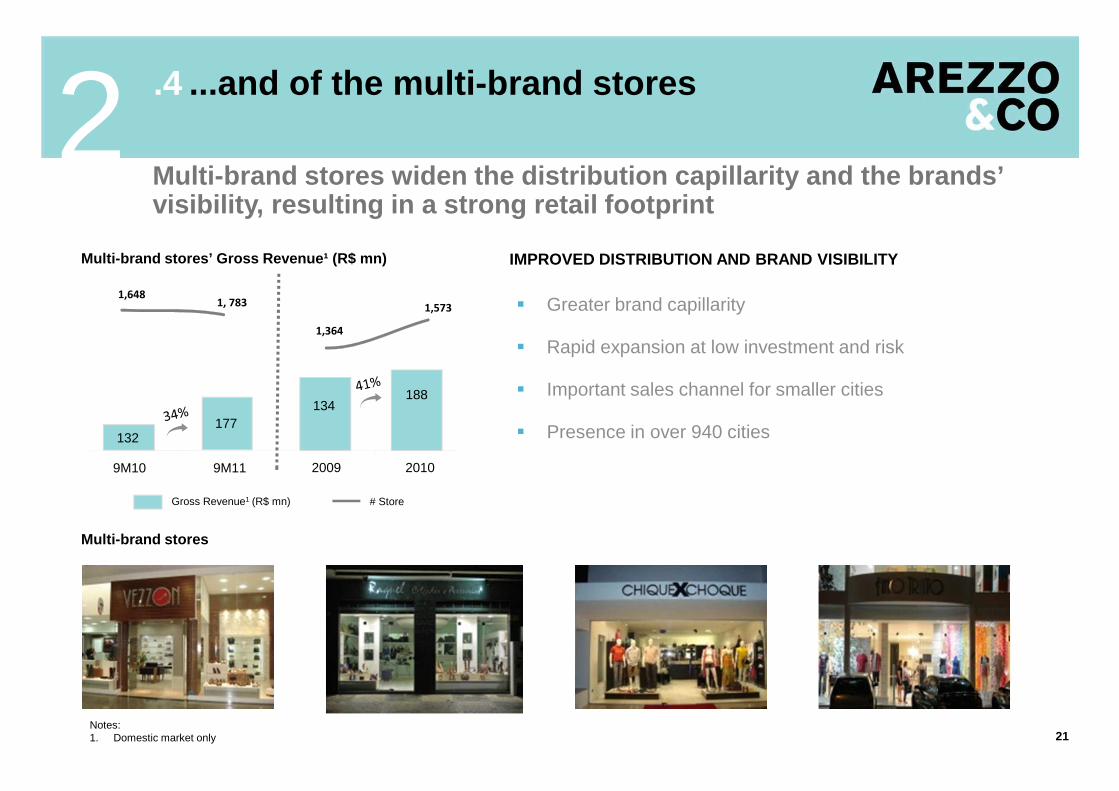
.4 ...and of the multi-brand stores2
Multi-brand stores
21
Multi-brand stores’ Gross Revenue¹ (R$ mn) IMPROVED DISTRIBUTION AND BRAND VISIBILITY
� Greater brand capillarity
� Rapid expansion at low investment and risk
� Important sales channel for smaller cities
� Presence in over 940 cities
Multi-brand stores widen the distribution capillari ty and the brands’ visibility, resulting in a strong retail footprint
Notes:1. Domestic market only
132177
134
9M10 9M11 2009
188
2010
Gross Revenue1 (R$ mn) # Store
1,6481, 783
1,364
1,573
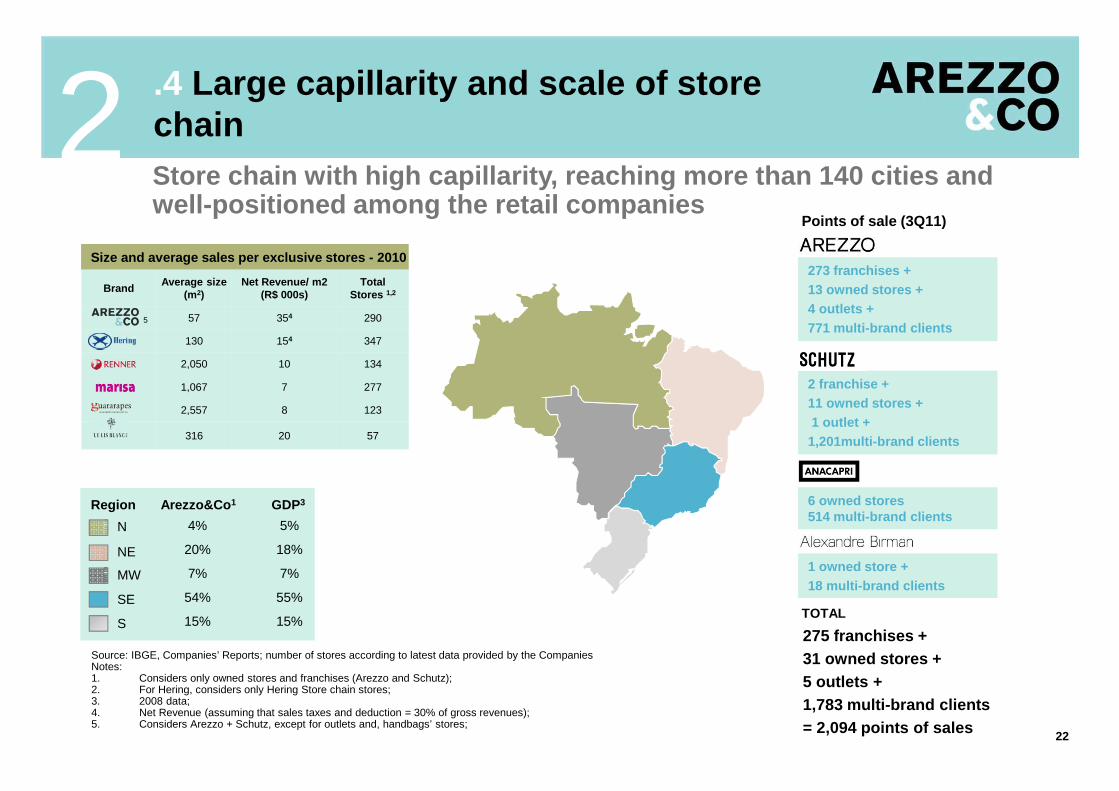
.4 Large capillarity and scale of store chainStore chain with high capillarity, reaching more th an 140 cities and well-positioned among the retail companies
2
22
Size and average sales per exclusive stores - 2010
BrandAverage size
(m2)Net Revenue/ m2
(R$ 000s)Total
Stores 1,2
57 354 290
130 154 347
2,050 10 134
1,067 7 277
2,557 8 123
316 20 57
5
273 franchises + 13 owned stores + 4 outlets +771 multi-brand clients
2 franchise + 11 owned stores +1 outlet +1,201multi-brand clients
Points of sale (3Q11)
TOTAL
6 owned stores514 multi-brand clients
1 owned store +18 multi-brand clients
275 franchises + 31 owned stores + 5 outlets +1,783 multi-brand clients= 2,094 points of sales
Source: IBGE, Companies’ Reports; number of stores according to latest data provided by the CompaniesNotes:1. Considers only owned stores and franchises (Arezzo and Schutz);2. For Hering, considers only Hering Store chain stores;3. 2008 data;4. Net Revenue (assuming that sales taxes and deduction = 30% of gross revenues);5. Considers Arezzo + Schutz, except for outlets and, handbags’ stores;
N
NE
MW
SE
S
Region Arezzo&Co 1 GDP3
4%
20%
7%
54%
15%
5%
18%
7%
55%
15%

Arezzo and Ana CapriSchutz and Alexandre
BirmanIndustrial Supply Chain Strategy and IT Financial
Alexandre Birman Cisso Klaus Marcio Jung Thiago BorgesKurt Richter
HR
Raquel Carneiro
Marco Coelho
Internal Auditing
Anderson Birman
Claudia Narciso
.5 Seasoned and professional management team2
Anderson Birman
Years at Arezzo
39
16
4
13
10
7
8
29
2
Years of experience
39
16
12
23
31
27
46
40
12
NameTitle
Anderson BirmanCEO
Alexandre BirmanCOO
Thiago Borges CFO and Investor Relations Officer
Claudia NarcisoDirector – R&D
Kurt RitchterDirector – Strategy and IT
Marcio Jung Director – Supply Chain
Cisso KlausDirector – Industrial
Marco CoelhoDirector – Internal Auditing
Raquel CarneiroDirector – HR
Highly qualified management team
23
� Stock option plan for key executives
� Performance based compensation package for all employees
� Independent business units for each brand but unified officers (Industrial, Logistics, Financial and HR) for the whole company

.5 Corporate governance
After the offering, the Board is composed by 8 memb ers being 2 appointed by Tarpon, 4 by the controlling sharehold ers and 2 independent members
2Name ExperienceTitle
Anderson BirmanChairman of the Board
Arezzo’s CEO since its foundation, with over 39 years of experience in the industry
Alexandre BirmanVice-Chairman of the Board
Arezzo’s COO and founder of Schutz, with 16 years of experience in the industry
Pedro FariaBoard Member
Tarpon’s partner since 2003, member of the Board of Directors of Direcional Engenharia, Omega Energia Renovável, Cremer and Comgás
Eduardo MufarejBoard Member
Tarpon’s partner since 2004, member of the Board of Directors of Tarpon, Omega Energia Renovável and Coteminas
José Murilo CarvalhoBoard Member
President of the Attorney’s Association of Minas Gerais
Board Member of the Brazilian Bar Association
José BolonhaBoard Member
Founder and CEO of “Ethos Desenvolvimento Humano e Organizacional"
Board member of the Inter-American Economic and Social Council (UN, WHO)
Guilherme A. FerreiraIndependent Board Member
CEO of Bahema Participações, board member of Pão de Açúcar, Banco Signatura Lazard, Eternit, Tavex and Rio Bravo Investimentos
24
Artur N. GrynbaumIndependent Board Member
CEO of Grupo Boticário (largest franchise company in Brazil) and Vice-President at Abihpec (Brazilian Association of Industries in the field of Personal Hygiene, Perfumes, and Cosmetics )
| Market Overview
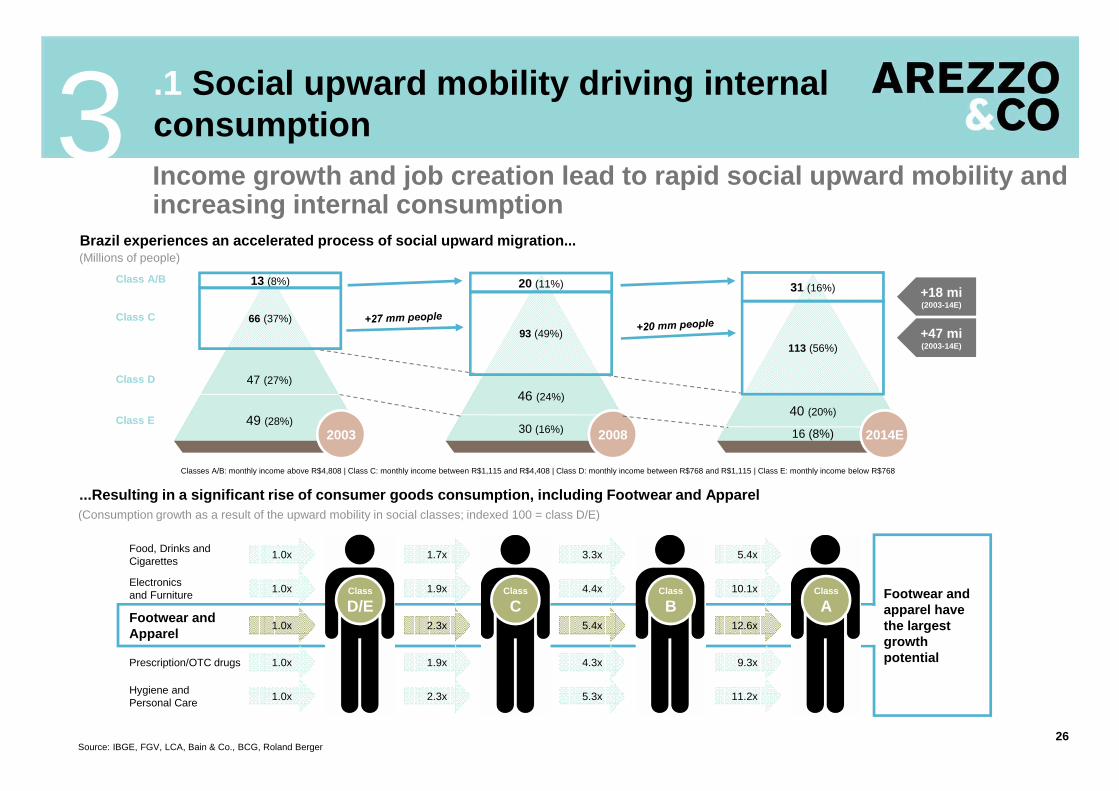
.1 Social upward mobility driving internal consumptionIncome growth and job creation lead to rapid social upward mobility and increasing internal consumption
3
26
2003
46 (24%)
30 (16%)
40 (20%)
16 (8%)
47 (27%)
49 (28%)
+18 mi(2003-14E)
+47 mi(2003-14E)
2014E2008
31 (16%)20 (11%)13 (8%)
66 (37%)93 (49%)
113 (56%)
...Resulting in a significant rise of consumer good s consumption, including Footwear and Apparel(Consumption growth as a result of the upward mobility in social classes; indexed 100 = class D/E)
Source: IBGE, FGV, LCA, Bain & Co., BCG, Roland Berger
Classes A/B: monthly income above R$4,808 | Class C: monthly income between R$1,115 and R$4,408 | Class D: monthly income between R$768 and R$1,115 | Class E: monthly income below R$768
Class
D/EClass
CClass
BClass
A
Food, Drinks and Cigarettes
Electronicsand Furniture
Footwear and Apparel
Prescription/OTC drugs
Hygiene and Personal Care
5.4x
10.1x
12.6x
9.3x
11.2x
Footwear and apparel have the largest growth potential
3.3x
4.4x
5.4x
4.3x
5.3x
1.7x
1.9x
2.3x
1.9x
2.3x
1.0x
1.0x
1.0x
1.0x
1.0x
Class C
Class A/B
Class D
Class E
Brazil experiences an accelerated process of social upward migration... (Millions of people)
27
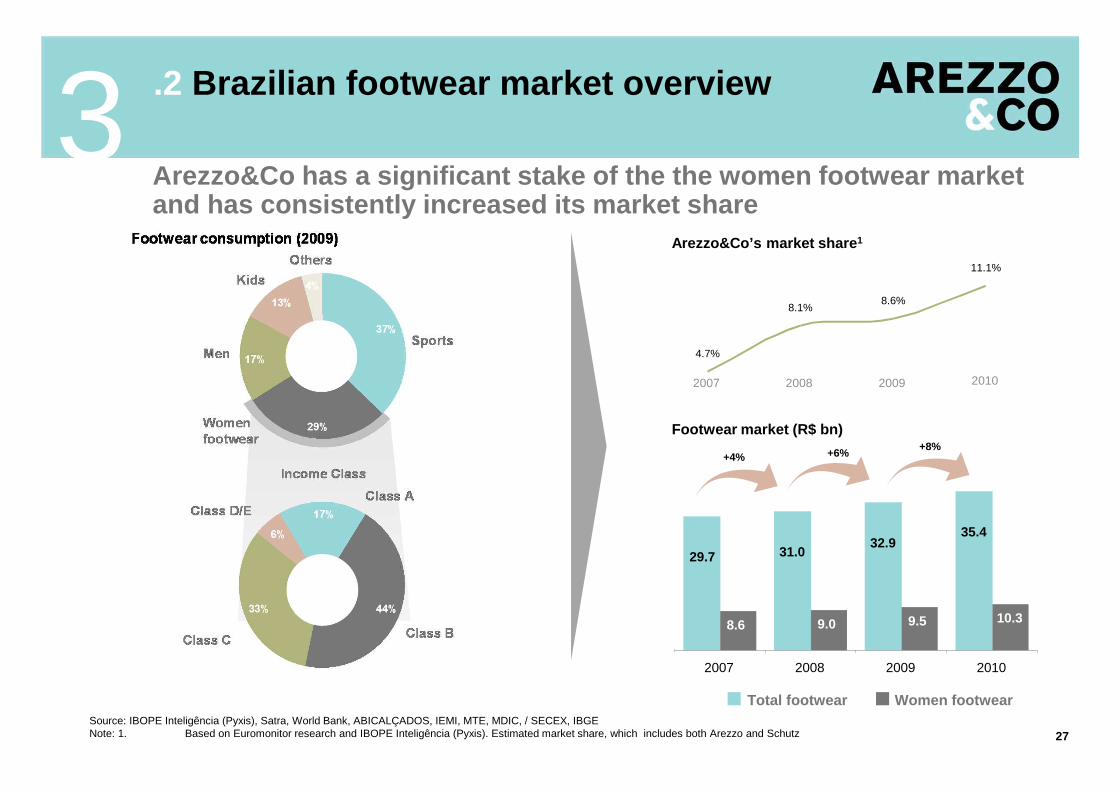
.2 Brazilian footwear market overview 3
+4% +6%
Footwear market (R$ bn)+8%
2007 2008 2009 2010
29.7 31.032.9
35.4
8.6 9.0 9.5 10.3
2007 2008 2009 2010
Total footwear Women footwear
4.7%
8.1%8.6%
11.1%
Arezzo&Co has a significant stake of the the women fo otwear market and has consistently increased its market share
Arezzo&Co’s market share 1
Source: IBOPE Inteligência (Pyxis), Satra, World Bank, ABICALÇADOS, IEMI, MTE, MDIC, / SECEX, IBGENote: 1. Based on Euromonitor research and IBOPE Inteligência (Pyxis). Estimated market share, which includes both Arezzo and Schutz

.3 Global Industry
Note:DDP: delivered duty paidFOB: free on board
BRAZILLead time: 40 daysProduction (pairs): 894 miCost (w/ taxes ): US$ 19/pairCost (w/ taxes ): US$ 29/pair
ITALYLead time: 70 daysProduction (pairs): 202 miCost (FOB): US$ 26/pairCost (DDP): US$ 38/pair INDIA
Lead time: 160 daysProduction (pairs): 2.000 miCost (FOB): US$ 15/pairCost (DDP): US$ 23/pair
CHINALead time: 120 to 150 daysProduction (pairs): 10.000 miCost (FOB): US$ 16/pairCost (DDP): US$ 40/pair
VIETNALead time: 120 to 150 daysProduction (pairs): 682 miCost (FOB): US$ 15/pairCost (DDP): US$ 23/pair
Brazil is a major shoe producer with a competitive c ost of women leather shoes for the domestic market
3
Source: Abilcalçados, Assintecal, Arezzo&Co28

29
.4 Brazilian footwear industry Overview3Brazilian Shoes Production (2010)
South Region South Region
Vale dos Sinos(RS)
Production - # pairs (million) 302 ~187
Export - # pairs (million) 32 ~20
Export - (million USD) 733 ~455
Jobs (thousand) 130 ~81
Companies 3.400 ~2.000
Southeast RegionSoutheast
Region
Production - # pairs (million) 189
Export - # pairs (million) 9
Export - (million USD) 152
Jobs (thousand) 90
Companies 4.000
Northeast RegionNortheast
Region
Production - # pairs (million) 399
Export - # pairs (million) 102
Export - (million USD) 595
Jobs (thousand) 126
Companies 627
Main producer States
� Expertise in the production of women leather shoes
894million pairs
Other producer regions:
� Expertise in the production of sports shoes� Expertise in the production of men leather shoes
Arezzo&Co mainly sources its products in the South of Brazil, the world’s largest footwear manufacturer cluster, specialized i n women leather shoes
Source: Abilcalçados, Assintecal, Arezzo&Co
Other667% Sports
8810%
Leather25328%
Rubber48755%

| Growth fundamentals

Growth fundamentals4
Inventory management
Increase operational efficiencies and margins
Improve store productivity
Expand distribution footprint
Capitalize on strong growth fundamentals in Brazil
Key value drivers
31
Net income (R$ mm) Net margin (%)
CAGR 05-3Q11: 48%
Net income (R$ mn) and net margin (%)
9 1017
22
49
2005 2006 2007 2008 2009 2010 3Q11(1)
65
86
Notes:1. 3Q11 (Last twelve months)
7%7%
9%
6%
12%11%
13%

� Reach consumers all over the country;
� Wide range of models in each collections.
� Greater presence and brand’s national visibility;
� Sales team optimization: internal team and commissioned sales representatives.
� Retail expertise, increasing channel’s relevance;
� Schutz owned store in 5 cities: Sao Paulo, Rio de Janeiro, Porto Alegre,
Brasília e Belo Horizonte.
� Arezzo&Co has been consolidating different distribution channels in which has
developed the expertise for its brands portfolio
Owned stores:
Webcommerce:
� Expansion of the most representative channel of the Group, now for Schutz brand;
� Relationship with local consumers.Franchises:
Multi Brand:
32
4 Flexible Distribution Strategy

Develop national presence for all brands based on a multi channel distribution strategy.
33
4 Expand footprint
Arezzo
Schutz
Anacapri
Alexandre Birman
Multi-brand
Ilustrative images Ilustrative images
FOCUS ON THE OPENING OF
MONOBRAND STORES
Large cities
Focus on shoppings centers
A/B1 Public

� Schutz new project for owned stores and franchises:
� Emphasizing the products and the campaigns;
� Reinforcing the brand with a complete presentation of each collection;
� Pilot project:
� Opening of 2 stores within the new project: Higienópolis Shopping – SP and Barra
Sul Shopping – POA;
� Launch of first pilot franchise in the city of Salvador - BA
Schutz – Higienópolis Shopping / São Paulo Schutz – Iguatemi Shopping / Salvador
34
4 Mono Brand Stores Strategy

Remodeling and Expansions4
35
Store area
Reveue growth post-expansion:
104%²AFTER
BEFORE
70m2
34m2
Expansion of the stores in 9M11 Renovation Schutz – S hop. Higienópolis¹:
■ 3 owned stores ■ 9 franchises
12 stores expansions
Almost 400 m² in 9M2011
New stores have 80 m² in average
All experiences have reached positive sales results
Note:(1) The stores were renovated in August 2011(2) Comparison between the sales results from August to November 2011 and August to November 2010Source: Arezzo&Co
Stores increasingly more attractive, offering a superi or shopping experience

Exemple – “South” Coordinator� Smaller regions for sales person, with an
increased team
� Regional Coordinator
� Consultants in areas with a greater
concentration of stores
� Sales representatives in less dense but with
potential growth areas
� Incentive for the prospect of new clients
and more frequent visits
� Geographical limits (e.g. mountains) and
higher travel costs control
� Internal targets: cities covered, number of
clients and sales per customer
36
4 Multi Brand Strategy

# Owned stores
# Franchises
275
3Q11 2011
36
311
267
2010
29
296 8
7
16
7
291
43
334 47
11
2012
338
54
392
� Reinforce our commitment to the opening of 38 stores in 2011;
� Existing stores were expanded in 391m² over last nine months, in line with the 1,000m² target until 2012;
� We increased in 20 stores the 2012 guidance, specially due to GTM project.
+5%
+7%
+17%
37
4 Expansion Guidance Update – Arezzo&Co
| 9M11 and 2010 Financial highlights

.1 Operational and financial highlights5Gross Revenues per Channel (R$ mn) – Domestic Market
39
Notes:1. Others: other sales’ channels in the Domestic Market.
26.5%
25.8%
0.4%
11.6%
28.9%
3.7%
17.6%
29.1%
SSS Sell-out (Owned Stores)
SSS Sell-in (Franchises)
247.6 300.4 260.9
358.7
132.4
177.1
133.7
188.4 72.5
93.3
70.4
110.0
5.1
4.8
3.7
5.4
9M10 9M11 2009 2010
Others - DM¹ Owned Stores Multi-brand Franchise
21.3%
28.8%
25.8%
37.5%
56.2%
41.3%
468.8
662.5
40.9%
33.8%
457.5
575.5

5
40
.2 Operational and financial highlights
Key highlights
Strong growth for the main brands in the third quarterly of the year
The third quarterly of 2011 ended with 311 store chain and Sales area expansion of 15.4% year-over-year
9M11 Net Revenues increased by 20.9% year-over-year (38.7% 2010/ 2009)
Number of Stores (R$ mn) and Total Area (m² - ‘000)
CAGR 07-10: 43.4%
Net Revenues (R$ mn)
396.7
479.7
193.8
367.1412.1
571.5
9M10 9M11 2007 2008 2009 2010
20.9%89.4%
12.3%38.7%
Area CAGR 07- 10: 14.4%
253 275208 227 242 267
27 36
6 10 2129
16.7
11,7 13,3 14,9
17.6
9M10 9M11 2007 2008 2009 2010
Owned Stores Franchises Total Area
280 311263+31
+23214
15.4%
237296
+26+33
13.2%12.5%
17.7%
311263
+23214 237296
+26+33
19.3

5Gross Profit (R$ mn) and Gross Margin (%)
41Notes:1. Adjusted for interest on shareholders’ equity and goodwill amortization
.3 Operational and financial highlights
Net Income (R$ mn) and Net Margin (%)
EBITDA (R$ mn) and EBITDA Margin (%)
163
201
138167
232
41.2% 41.9%
37.7%40.5% 40.5%
9M10 9M11 2008 2009 2010
64
85
42
61
95
16.3%17.6%
11.5%
14.7%
16.8%
9M10 9M11 2008 2009 2010
43
65
22
4965
10.8%
13.5%
6.1%
11.8% 11.3%
9M10 9M11 2008 2009 2010

42
5 .4 Operational and financial highlights
Cash Conversion Cycle (R$ thousand)
Cash Flows From Operating Activities (R$ thousand)
Capex (R$ million)
Sumary of investments (R$ 'm) 3Q10 3Q11 Growth or spread (%) 9M10 9M11 Growth or spread (% )
Total Capex 2.8 9.6 242.9% 9.3 16.9 81.7%
Stores - expansion and reforming 1.4 7.9 464.3% 5.2 12.2 134.6%
Corporate 1.1 1.5 36.4% 2.8 4.0 42.9%
Others 0.3 0.2 -33.3% 1.3 0.7 -46.2%
Cash flows from operating activity 3Q10 3Q11Growth or
spread9M10 9M11
Growth or spread
Income before income taxes 21,851 38,854 17,003 59,758 90,520 30,762 Depreciation and amortization 680 1,050 370 1,847 2,890 1,043 Others 499 (1,680) (2,179) 548 (7,943) (8,491)
Decrease (increase) in current assets / liabilities (15,848) (38,949) (23,101) (22,406) (28,200) (5,794)
Trade accounts reveivable (30,203) (51,314) (21,111) (8,461) (27,418) (18,957) Inventories (13,003) (3,983) 9,020 (30,193) (22,820) 7,373 Suppliers 16,350 12,778 (3,572) 14,285 21,306 7,021 Change in other current assets and liabilities 11,008 3,570 (7,438) 1,963 732 (1,231)
Change in other non current assets and liabilities 2,215 (946) (3,161) 4,074 (2,119) (6,193)
Tax and contributions (10,686) (6,363) 4,323 (12,766) (14,703) (1,937)
Net cash generated by operating activities (1,289) (8,034) (6,745) 31,055 40,445 9,391
#days R$ '000 #days R$ '000
86 119,731 110 181,780 24
Inventory 60 51,398 68 71,941 8
Accounts Receivable 76 111,692 89 159,889 13
(-)Accounts Payable 50 43,359 47 50,050 -3
Cash Conversion Cycle3Q10 3Q11 Change
(in days)
²
¹
¹
¹ Days of COGs
² Days of Net Revenues

43
5 .4 Operational and financial highlights
Indebtedness (R$ thousand)
Indebtedness totaled R$35.1 million in 3Q11 versus R$32.3 million in 2Q11
Long-term debt relevance stood at 53.6% in 3Q11 ver sus61.1% in 2Q11
Indebtedness policy remained conservative, with low weighted-average cost of Company's total debt
Cashposition and indebtedness 3Q10 2Q11 3Q11
Cash and cash equivalents 18,754 199,339 178,999
Total indebtedness 37,457 32,276 35,065
Short term 17,288 12,547 16,270
% da Dívida Total 46.2% 38.9% 46.4%
Long term 20,169 19,729 18,795
% da Dívida Total= 53.8% 61.1% 53.6%
Net debt 18,703 (167,063) (143,934)
EBITDA LTM 85,568 104,120 115,562 Net debt /EBITDA LTM 0.22x -1.60x -1.25x

44
Appendix

45
.1 Key performance indicatorsASummary of Results 3Q10 3Q11
Growth or Spread(%)
9M10 9M11 Growth or Spread (%)
Net Revenue 158,829 188,901 18.9% 396,741 479,736 20.9%
Gross Profit 63,114 78,925 25.1% 163,464 201,078 23.0%
Gross Margin 39.7% 41.8% 2.1 p.p. 41.2% 41.9% 0.7 p.p.
Ebitda¹ 24,093 35,535 47.5% 64,488 84,559 31.1%
Ebitda Margin¹ 15.2% 18.8% 3.6 p.p. 16.3% 17.6% 1.3 p.p.
Net Profit 15,890 25,945 63.3% 43,032 64,712 50.4%
Net Margin 10.0% 13.7% 3.7 p.p. 10.8% 13.5% 2.7 p.p.
Operating Indicators 3Q10 3Q11 Growth or Spread(%)
9M10 9M11 Growth or Spread (%)
# of pairs sold ('000) 1,893 2,213 16.9% 4,446 5,206 17.1%
# of handbags sold ('000) 95 129 35.6% 231 312 35.2%
# of emplyees 1,531 1,746 14.0% 1,531 1,746 14.0%
# of stores 280 311 11.1% 280 311 11.1%
Owned stores 27 36 33.3% 27 36 33.3%
Franchises 253 275 8.7% 253 275 8.7%
Outsourcing (as % of total production) 85.7% 87.6% 1.9 p.p. 82.7% 85.4% 2.7 p.p.
SSS² (franchises - sell-in) 25.8% 11.6% 34.5% 15.6%
SSS² (owned stores - sell-out) 26.5% 0.4% 25.8% 9.6%

46
.2 Balance Sheet - IFRSAAssets 3Q10 2Q11 3Q11 Liabilities 3Q10 2Q11 3Q11
Current assets 191,633 389,423 423,739 Current liabilities 84,946 79,068 97,635
Cash and cash equivalents 14,506 3,261 6,229 Loans and financing 17,288 12,547 16,270
Short-term investments 4,248 196,078 172,770 Trade accounts payable 43,359 37,272 50,050
Trade accounts receivables 111,692 108,576 159,889 Dividends and interest on equity capital payable - 7,177 -
Inventories 51,398 67,699 71,941 Other liabilities 24,299 22,072 31,315
Taxes recoverable 3,389 6,196 3,647
Other receivables 6,400 7,613 9,263 Non-current liabilities 27,206 26,365 25,697 Loans and financing 20,169 19,729 18,795
Non current assets 57,199 63,117 72,282 Related parties 2,066 762 894
Long-term assets 26,359 21,785 22,816 Other liabilities 4,971 5,874 6,008
Financial investments 99 66 78
Taxes recoverable 2,993 3,170 3,170 Equity 136,680 347,107 372,689 Deferred income and social contribution taxes 18,744 13,432 13,646 Capital 21,358 40,917 40,917
Other receivables 4,523 5,117 5,922 Capital reserve 71,019 238,086 237,723
Investments - - - Income reserves 6,177 37,779 37,779
Property, plant and equipment 18,460 22,904 24,901 Proposed additional dividends - - -
Intangible assets 12,380 18,428 24,565 Retained Earnings 38,126 30,325 56,270
Total assets 248,832 452,540 496,021 Total liabilities and shareholders’ equity 248,832 452,540 496,021

47
.3 Income Statement - IFRSAIncome statement - IFRS 3Q10 3Q11
Growth or spread (%)
9M10 9M11 Growth or spread (%)
Net operating revenue 158,829 188,901 18.9% 396,741 479,736 20.9%Cost of sales and services (95,715) (109,976) 14.9% (233,277) (278,658) 19.5%
Gross profit 63,114 78,925 25.1% 163,464 201,078 23.0%Operating income (expenses): (39,701) (44,440) 11.9% (100,823) (119,409) 18.4% Selling (26,955) (32,203) 19.5% (68,964) (84,203) 22.1% Administrative and general (13,087) (12,474) -4.7% (34,480) (35,864) 4.0% Other operating income, net 341 237 -30.5% 2,621 658 -74.9%
Income before financial results 23,413 34,485 47.3% 62,641 81,669 30.4%Financial income (expenses) (1,562) 4,369 -379.7% (2,883) 8,851 -407.0%
Income before income taxes 21,851 38,854 77.8% 59,758 90,520 51.5%Income and social contribution taxes (5,961) (12,909) 116.6% (16,726) (25,808) 54.3%
Current (7,171) (12,936) 80.4% (15,773) (20,201) 28.1%Deferred 1,210 27 -97.8% (953) (5,607) 488.4%
Net income for the year 15,890 25,945 63.3% 43,032 64,712 50.4%
Income per share 0.2031 0.2930 44.3% 0.5499 0.7416 34.8%
48
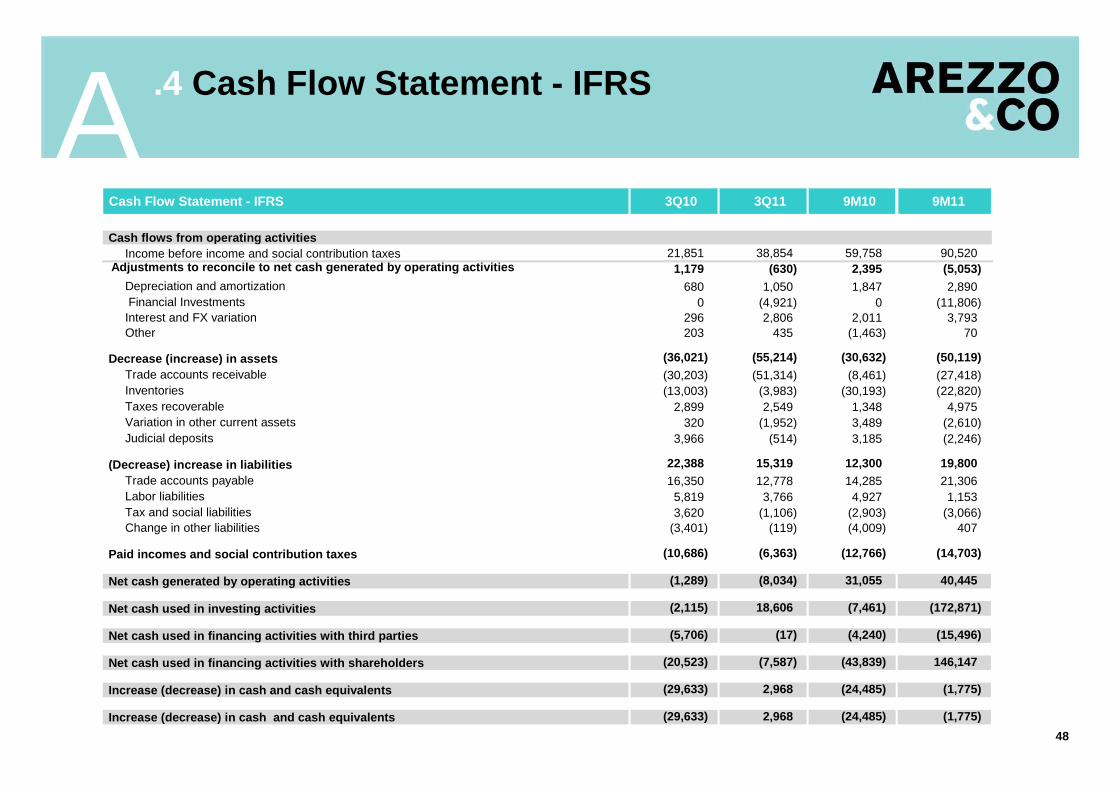
.4 Cash Flow Statement - IFRSACash Flow Statement - IFRS 3Q10 3Q11 9M10 9M11
Cash flows from operating activitiesIncome before income and social contribution taxes 21,851 38,854 59,758 90,520
Adjustments to reconcile to net cash generated by oper ating activities 1,179 (630) 2,395 (5,053)Depreciation and amortization 680 1,050 1,847 2,890 Financial Investments 0 (4,921) 0 (11,806)Interest and FX variation 296 2,806 2,011 3,793Other 203 435 (1,463) 70
Decrease (increase) in assets (36,021) (55,214) (30,632) (50,119)Trade accounts receivable (30,203) (51,314) (8,461) (27,418)Inventories (13,003) (3,983) (30,193) (22,820)Taxes recoverable 2,899 2,549 1,348 4,975Variation in other current assets 320 (1,952) 3,489 (2,610)Judicial deposits 3,966 (514) 3,185 (2,246)
(Decrease) increase in liabilities 22,388 15,319 12,300 19,800Trade accounts payable 16,350 12,778 14,285 21,306Labor liabilities 5,819 3,766 4,927 1,153Tax and social liabilities 3,620 (1,106) (2,903) (3,066)Change in other liabilities (3,401) (119) (4,009) 407
Paid incomes and social contribution taxes (10,686) (6,363) (12,766) (14,703)
Net cash generated by operating activities (1,289) (8,034) 31,055 40,445
Net cash used in investing activities (2,115) 18,606 (7,461) (172,871)
Net cash used in financing activities with third parties (5,706) (17) (4,240) (15,496)
Net cash used in financing activities with shareholders (20,523) (7,587) (43,839) 146,147
Increase (decrease) in cash and cash equivalents (29,633) 2,968 (24,485) (1,775)
Increase (decrease) in cash and cash equivalents (29,633) 2,968 (24,485) (1,775)

49
.5 Stock priceA
Notes:1. From February 2, 2011 to September 9, 20112. From February 2, 2011 to November 11, 2011
Spread over Ibovespa Index32.5%
ARZZ3 Ibovespa
19.0
20.8
22.7
24.6
15.1
17.0
02/02/2011 11/08/2011
Arezzo&Co
Listing 88,542,410Ticker ARZZ3Listing 2/2/2011
Share price (09/30/2011) 19.00Market Cap 1,682 milhões
Share price (11/08/2011) 22.70Market Cap 2,010 milhões
Share performance9M11¹ 0%2011² 19%

50
IR Contacts
� Thiago Borges
� Daniel Maia
Phone: +55 11 [email protected]
CFO and IR Officer
IR Manager