december 2012 vancouver real estate sales absorption report
DESCRIPTION
December 2012 month-end Vancouver real estate statistics for Downtown, North Vancouver, West Van, and Vancouver's East and West side.TRANSCRIPT

488 Drake Street, Vancouver, BC V6B 5S9
jefffitzpatrick.com | [email protected] | 604.612.6120
JEFF FITZPATRICK PERSONAL REAL ESTATE CORPORATION
VANCOUVER, BC | DECEMBER 2012
Vancouver real estate market statistics to keep you
ON TOP OF THE MARKET
SALES ABSORPTION REPORT

488 Drake Street Vancouver, BC V6B 5S9
jefffitzpatrick.com | [email protected] | 604.612.6120
JEFF FITZPATRICK PERSONAL REAL ESTATE CORPORATION
| 1
INTRODUCTION | DECEMBER 2012
Our monthly sales absorption report is designed to keep you up-to-date and on top of the market. Every report analyzes the real estate markets
in North and West Vancouver, Downtown, and the East and West side of the city in terms of monthly sales, listings, and absorption rates. The
data is further broken down by price, residential type and the number of bedrooms. In addition to statistics, a graph presents the past two years
of sales, and a featured properties page showcases our most recent listings and sold properties. To help you better understand the contents of
the report, we’ve compiled a list of definitions and explanations of certain statistics terminology:
ACTIVE LISTINGS The number of properties on the market. This number only includes those listed on the Multiple Listing Service
(MLS); properties not listed on the MLS, such as “For Sale By Owner”, are not accounted for. This number is dynamic and constantly
changes; new properties get listed and others are sold, terminated, cancelled, or expire.
ATTACHED PROPERTY A property that shares a common wall with another property such as a condo, apartment, townhome, duplex,
triplex, etc.
DAYS ON MARKET (DOM) The number of days a listing is active on the MLS before it is sold. Our report showcases the average days
on market which is calculated by adding all the days on market of each listing and dividing it by the number of listings for that month. In a
buyer’s market, the DOM is generally higher because inventory takes longer to sell and in a seller’s market, the DOM is lower.
DETACHED PROPERTY A property with no shared walls; a free standing house.
MONTH’S SUPPLY The number of months it would take at the current absorption rate (see below), assuming no new properties are
listed, for all of the currently listed properties to sell. To calculate month’s supply, take the total number of active listings in a month
divided by the total number of sales in the month. The widely accepted equilibrium benchmark in the industry is 5 months’ supply. At 5
months’ supply, the buyers are absorbing the existing inventory at a rate that stabilizes pricing; ergo, the supply demand curves are at
equilibrium. A market with greater than 5 months’ supply is considered a buyer’s market and one with less than 5 months’ supply is a
seller’s market. For example, if the market had only 2 months’ worth of supply available, pricing would be trending up (in favour of
sellers, hence a “seller’s market”). Conversely, an environment with 10 months’ supply would be putting downward pressure on pricing
(benefiting buyers) as buyers have more variety of properties to select from.
SALES ABSORPTION RATE The rate at which homes sell in an area; the higher the absorption rate, the faster homes are selling. To
calculate the absorption rate, take the number of homes sold in a month and divide it by the total number of listings available that month.
YEAR OVER YEAR (YOY) This rate compares a time period (in this case a month) against the same time period last year. For example,
July 2012 compared to July 2011. It is calculated by taking the current data (absorption rate, sale prices...etc) minus the previous year’s
data, and then divided by the previous year’s data. The key advantage to this metric is that it automatically negates the effect of
seasonality.
As the real estate market is dynamic and constantly changing, this report and its contents are our best representation of the market at the time
the report was created. If you have any questions, suggestions on how we can make the report better, or would like to know where the market
is at this very moment, please give us a call anytime!
E. & O.E.: This information is from sources which we deem reliable, but must be verified by prospective Purchasers and may be subject to change or withdrawal. If your
property is listed with a real estate broker, please disregard. It is not our intention to solicit the offerings of other real estate brokers. Independently Owned and Operated.
SALES
ABSORPTION
REPORT

488 Drake Street Vancouver, BC V6B 5S9
jefffitzpatrick.com | [email protected] | 604.612.6120
JEFF FITZPATRICK PERSONAL REAL ESTATE CORPORATION
| 2
DOWNTOWN Nov 2012 Dec 2012 % Change Dec 2011 YOY
Active Listings 1332 1102 -17.27% 1329 -17.08% Number of Sales 98 63 -35.71% 175 -64.00% Average Listing Price $696,831 $705,229 1.21% $675,840 4.35% Average Sale Price $662,825 $664,367 0.23% $650,856 2.08% Average DOM 51 61 19.61% 49 24.49% Overall Absorption 7.36% 5.72% -22.30% 13.17% -56.58%
Price Range # of Listings # of Sales Absorption Absorption % Change 0 - 300,000 67 7 10.45% 16.13% -35.22% 300,001 - 400,000 159 10 6.29% 25.73% -75.56% 400,001 - 500,000 194 12 6.19% 22.33% -72.29% 500,001 - 600,000 153 10 6.54% 17.39% -62.42% 600,001 - 700,000 86 5 5.81% 8.33% -30.23% 700,001 - 800,000 77 7 9.09% 19.35% -53.03% 800,001 - 900,000 58 2 3.45% 5.66% -39.08% 900,001 - 1,000,000 44 2 4.55% 4.44% 2.27% 1,000,001 - 1,250,000 59 4 6.78% 6.35% 6.78% 1,250,001 - 1,500,000 44 1 2.27% 3.08% -26.14% 1,500,001 - 1,750,000 27 0 0.00% 9.38% -100.00% 1,750,001 - 2,000,000 27 1 3.70% 5.88% -37.04% 2M+ 107 2 1.87% 2.94% -36.45% TOTAL 1102 63 5.72% 14.47% -60.50%
Unit Type # of Listings # of Sales Absorption Absorption % Change Studio 45 1 2.22% 8.33% -73.33% 1 Bedroom 413 28 6.78% 23.15% -70.71% 2 Bedroom 538 29 5.39% 10.59% -49.12% 3 Bedroom+ 106 5 4.72% 6.54% -27.90% TOTAL 1102 63 5.72% 14.47% -60.50%
DOWNTOWN | DECEMBER 2012
DOWNTOWN (ATTACHED ONLY)
• Includes Downtown, West End, Yaletown & Coal Harbour
• December’s overall absorption was 5.72%, which represents 17.48
months worth of supply (strong buyer’s market)
• Compared to last December, sales absorption rates are down
56.58%, from 13.17% in 2011 to 5.72% in December 2012
• Average sale price in December was $664,367, an increase of $1,542
(0.23%) from November’s average
• There were 230 fewer listings and 35 fewer sales than in November
• Most active properties were those listed under $300,000; least active
were listings over $2M
• Average DOM in December was 61 days; properties sat on the
market for 10 days longer than in November

488 Drake Street Vancouver, BC V6B 5S9
jefffitzpatrick.com | [email protected] | 604.612.6120
JEFF FITZPATRICK PERSONAL REAL ESTATE CORPORATION
| 3
VANCOUVER WESTSIDE | DECEMBER 2012
DETACHED Nov 2012 Dec 2012 % Change Dec 2011 YOY
Active Listings 986 856 -13.18% 799 7.13% Number of Sales 45 31 -31.11% 62 -50.00% Average Listing Price $2,300,768 $2,239,483 -2.66% $3,047,830 -26.52% Average Sale Price $2,135,403 $2,050,316 -3.98% $2,790,934 -26.54% Average DOM 46 64 39.13% 63 1.59% Overall Absorption 4.56% 3.62% -20.65% 7.76% -53.33%
Price Range # of Listings # of Sales Absorption Absorption % Change 0 - 800,000 3 0 0.00% 0.00% 0.00% 800,001 - 900,000 2 0 0.00% 0.00% 0.00% 900,001 - 1,000,000 2 1 50.00% 0.00% 100.00% 1,000,001 - 1,250,000 22 4 18.18% 31.25% -41.82% 1,250,001 - 1,500,000 56 2 3.57% 17.07% -79.08% 1,500,001 - 1,750,000 58 7 12.07% 20.93% -42.34% 1,750,001 - 2,000,000 75 4 5.33% 15.63% -65.87% 2,000,001 - 2,250,000 51 5 9.80% 3.57% 174.51% 2,250,001 - 2,500,000 100 2 2.00% 9.59% -79.14% 2,500,001 - 2,750,000 75 1 1.33% 18.00% -92.59% 2,750,001 - 3,000,000 69 0 0.00% 2.63% -100.00% 3 - 4M 176 3 1.70% 2.17% -21.45% 4M+ 167 2 1.20% 1.44% -16.83% TOTAL 856 31 3.62% 8.52% -57.48%
Unit Type # of Listings # of Sales Absorption Absorption % Change 2 Bedroom & Under 22 1 4.55% 23.08% -80.30% 3 Bedroom 73 5 6.85% 9.68% -29.22% 4 Bedroom 195 10 5.13% 11.60% -55.80% 5 Bedroom+ 566 15 2.65% 6.78% -60.91% TOTAL 856 31 3.62% 8.52% -57.48%
ATTACHED Nov 2012 Dec 2012 % Change Dec 2011 YOY
Active Listings 1284 1072 -16.51% 984 8.94% Number of Sales 82 52 -36.59% 121 -57.02% Average Listing Price $652,888 $639,132 -2.11% $694,192 -7.93% Average Sale Price $625,791 $612,013 -2.20% $675,098 -9.34% Average DOM 48 68 41.67% 51 33.33% Overall Absorption 6.39% 4.85% -24.04% 12.30% -60.55%
Price Range # of Listings # of Sales Absorption Absorption % Change 0 - 300,000 49 4 8.16% 18.60% -56.12% 300,001 - 400,000 155 10 6.45% 13.49% -52.18% 400,001 - 500,000 175 13 7.43% 19.23% -61.37% 500,001 - 600,000 152 6 3.95% 16.04% -75.39% 600,001 - 700,000 126 3 2.38% 10.53% -77.38% 700,001 - 800,000 83 4 4.82% 11.90% -59.52% 800,001 - 900,000 90 2 2.22% 15.15% -85.33% 900,001 - 1,000,000 60 4 6.67% 9.30% -28.33% 1,000,001 - 1,250,000 73 3 4.11% 11.48% -64.19% 1,250,001 - 1,500,000 51 2 3.92% 9.43% -58.43% 1,500,001 - 1,750,000 19 1 5.26% 15.79% -66.67% 1,750,001 - 2,000,000 10 0 0.00% 11.11% -100.00% 2M+ 29 0 0.00% 6.67% -100.00% TOTAL 1072 52 4.85% 13.69% -64.56%
Unit Type # of Listings # of Sales Absorption Absorption % Change Studio 10 0 0.00% 25.00% -100.00% 1 Bedroom 322 22 6.83% 15.94% -57.13% 2 Bedroom 555 24 4.32% 13.82% -68.72% 3 Bedroom+ 185 6 3.24% 8.44% -61.58% TOTAL 1072 52 4.85% 13.69% -64.56%
ATTACHED
• Excludes Downtown, West End, Yaletown & Coal Harbour
• Overall absorption was 4.85%, which represents 20.62 months
worth of supply (very strong buyer’s market)
• Compared to last December, sales absorption rates are down
60.55%, from 12.30% in December 2011 to 4.85% in 2012
• Average sale price in December was $612,013, a decrease of
$13,778 (-2.20%) from November’s average
• Average DOM in December was 68 days; properties sat on the
market for 20 days longer than in November
DETACHED
• Excludes Downtown, West End, Yaletown & Coal Harbour
• Absorption in December was 3.62%, which represents 27.62
months worth of supply (very strong buyer’s market)
• Compared to December 2011, sales absorption rates are down
by 53.33%, from 7.76% to 3.62% in December 2012
• Average sale price in December was $2,050,316, a decrease of
$85,087 (-3.98%) from November’s average
• Average DOM in December was 64 days; properties took 18
days longer to sell than in November
VANCOUVER
WESTSIDE
488 Drake Street Vancouver, BC V6B 5S9
jefffitzpatrick.com | [email protected] | 604.612.6120
JEFF FITZPATRICK PERSONAL REAL ESTATE CORPORATION
| 4
VANCOUVER EASTSIDE | DECEMBER 2012
ATTACHED Nov 2012 Dec 2012 % Change Dec 2011 YOY
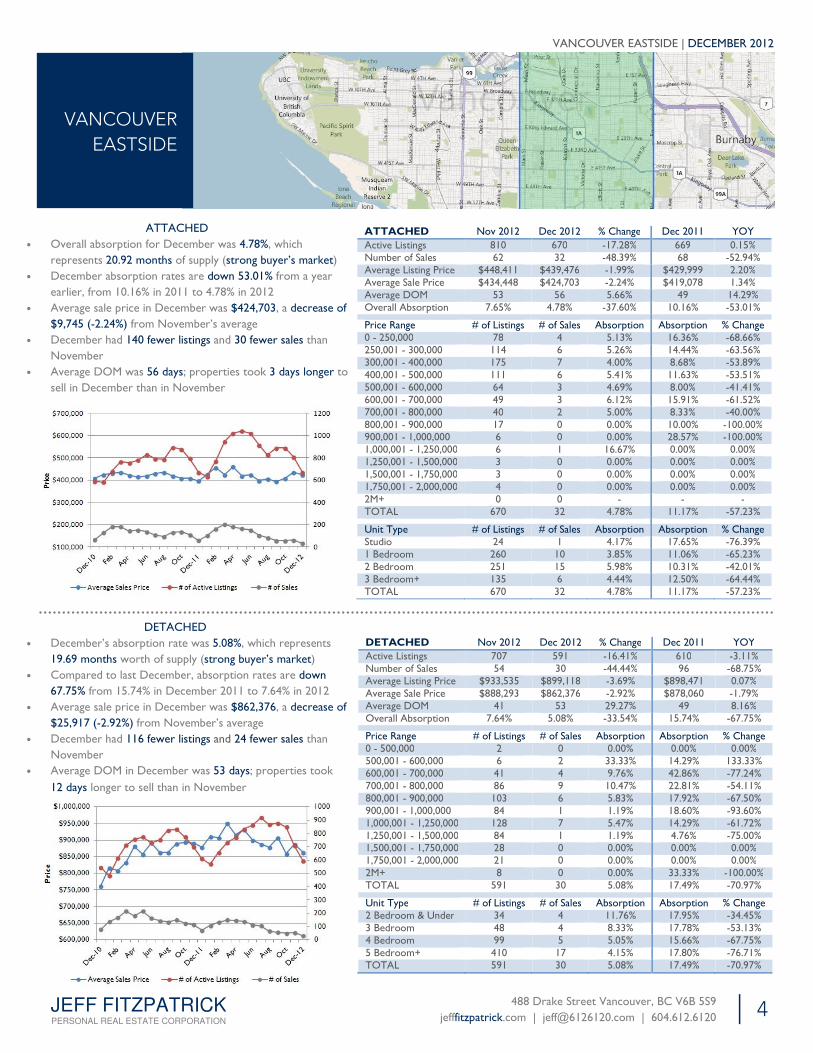
Active Listings 810 670 -17.28% 669 0.15% Number of Sales 62 32 -48.39% 68 -52.94% Average Listing Price $448,411 $439,476 -1.99% $429,999 2.20% Average Sale Price $434,448 $424,703 -2.24% $419,078 1.34% Average DOM 53 56 5.66% 49 14.29% Overall Absorption 7.65% 4.78% -37.60% 10.16% -53.01%
Price Range # of Listings # of Sales Absorption Absorption % Change 0 - 250,000 78 4 5.13% 16.36% -68.66% 250,001 - 300,000 114 6 5.26% 14.44% -63.56% 300,001 - 400,000 175 7 4.00% 8.68% -53.89% 400,001 - 500,000 111 6 5.41% 11.63% -53.51% 500,001 - 600,000 64 3 4.69% 8.00% -41.41% 600,001 - 700,000 49 3 6.12% 15.91% -61.52% 700,001 - 800,000 40 2 5.00% 8.33% -40.00% 800,001 - 900,000 17 0 0.00% 10.00% -100.00% 900,001 - 1,000,000 6 0 0.00% 28.57% -100.00% 1,000,001 - 1,250,000 6 1 16.67% 0.00% 0.00% 1,250,001 - 1,500,000 3 0 0.00% 0.00% 0.00% 1,500,001 - 1,750,000 3 0 0.00% 0.00% 0.00% 1,750,001 - 2,000,000 4 0 0.00% 0.00% 0.00% 2M+ 0 0 - - - TOTAL 670 32 4.78% 11.17% -57.23%
Unit Type # of Listings # of Sales Absorption Absorption % Change Studio 24 1 4.17% 17.65% -76.39% 1 Bedroom 260 10 3.85% 11.06% -65.23% 2 Bedroom 251 15 5.98% 10.31% -42.01% 3 Bedroom+ 135 6 4.44% 12.50% -64.44% TOTAL 670 32 4.78% 11.17% -57.23%
DETACHED Nov 2012 Dec 2012 % Change Dec 2011 YOY
Active Listings 707 591 -16.41% 610 -3.11% Number of Sales 54 30 -44.44% 96 -68.75% Average Listing Price $933,535 $899,118 -3.69% $898,471 0.07% Average Sale Price $888,293 $862,376 -2.92% $878,060 -1.79% Average DOM 41 53 29.27% 49 8.16% Overall Absorption 7.64% 5.08% -33.54% 15.74% -67.75%
Price Range # of Listings # of Sales Absorption Absorption % Change 0 - 500,000 2 0 0.00% 0.00% 0.00% 500,001 - 600,000 6 2 33.33% 14.29% 133.33% 600,001 - 700,000 41 4 9.76% 42.86% -77.24% 700,001 - 800,000 86 9 10.47% 22.81% -54.11% 800,001 - 900,000 103 6 5.83% 17.92% -67.50% 900,001 - 1,000,000 84 1 1.19% 18.60% -93.60% 1,000,001 - 1,250,000 128 7 5.47% 14.29% -61.72% 1,250,001 - 1,500,000 84 1 1.19% 4.76% -75.00% 1,500,001 - 1,750,000 28 0 0.00% 0.00% 0.00% 1,750,001 - 2,000,000 21 0 0.00% 0.00% 0.00% 2M+ 8 0 0.00% 33.33% -100.00% TOTAL 591 30 5.08% 17.49% -70.97%
Unit Type # of Listings # of Sales Absorption Absorption % Change 2 Bedroom & Under 34 4 11.76% 17.95% -34.45% 3 Bedroom 48 4 8.33% 17.78% -53.13% 4 Bedroom 99 5 5.05% 15.66% -67.75% 5 Bedroom+ 410 17 4.15% 17.80% -76.71% TOTAL 591 30 5.08% 17.49% -70.97%
ATTACHED
• Overall absorption for December was 4.78%, which
represents 20.92 months of supply (strong buyer’s market)
• December absorption rates are down 53.01% from a year
earlier, from 10.16% in 2011 to 4.78% in 2012
• Average sale price in December was $424,703, a decrease of
$9,745 (-2.24%) from November’s average
• December had 140 fewer listings and 30 fewer sales than
November
• Average DOM was 56 days; properties took 3 days longer to
sell in December than in November
DETACHED
• December’s absorption rate was 5.08%, which represents
19.69 months worth of supply (strong buyer’s market)
• Compared to last December, absorption rates are down
67.75% from 15.74% in December 2011 to 7.64% in 2012
• Average sale price in December was $862,376, a decrease of
$25,917 (-2.92%) from November’s average
• December had 116 fewer listings and 24 fewer sales than
November
• Average DOM in December was 53 days; properties took
12 days longer to sell than in November
VANCOUVER
EASTSIDE
488 Drake Street Vancouver, BC V6B 5S9
jefffitzpatrick.com | [email protected] | 604.612.6120
JEFF FITZPATRICK PERSONAL REAL ESTATE CORPORATION
| 5
NORTH VANCOUVER | DECEMBER 2012
NORTH
VANCOUVER
ATTACHED Nov 2012 Dec 2012 % Change Dec 2011 YOY
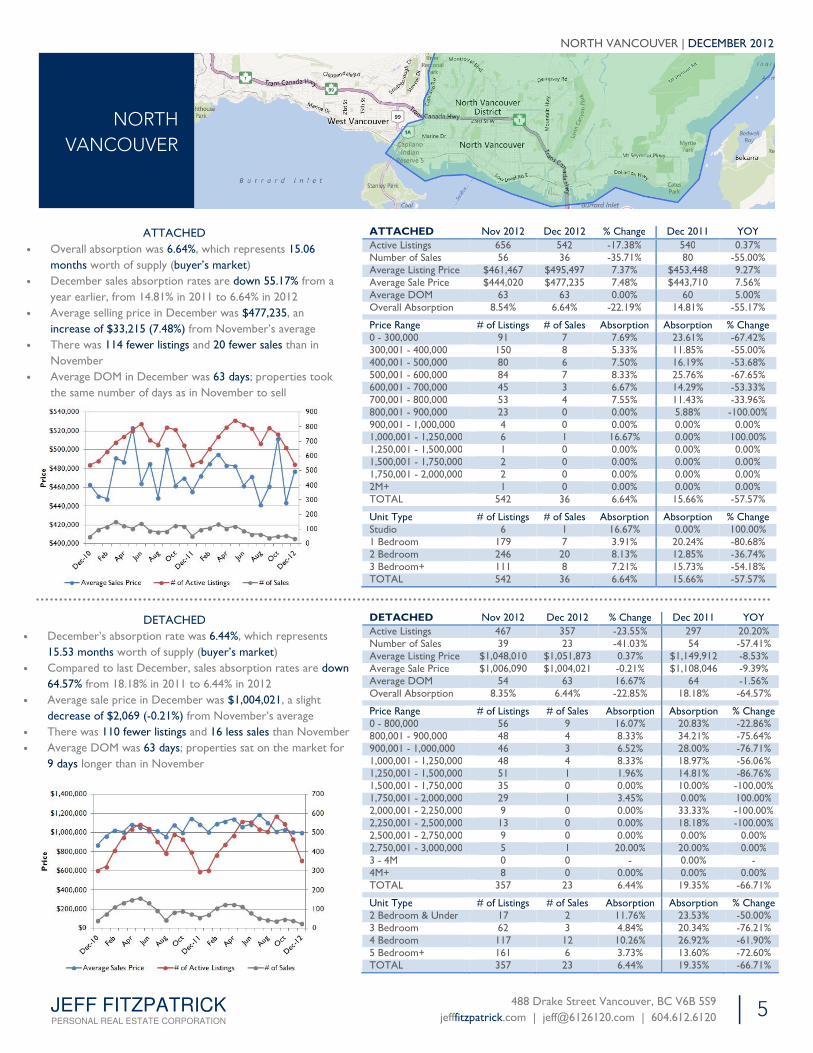
Active Listings 656 542 -17.38% 540 0.37% Number of Sales 56 36 -35.71% 80 -55.00% Average Listing Price $461,467 $495,497 7.37% $453,448 9.27% Average Sale Price $444,020 $477,235 7.48% $443,710 7.56% Average DOM 63 63 0.00% 60 5.00% Overall Absorption 8.54% 6.64% -22.19% 14.81% -55.17%
Price Range # of Listings # of Sales Absorption Absorption % Change 0 - 300,000 91 7 7.69% 23.61% -67.42% 300,001 - 400,000 150 8 5.33% 11.85% -55.00% 400,001 - 500,000 80 6 7.50% 16.19% -53.68% 500,001 - 600,000 84 7 8.33% 25.76% -67.65% 600,001 - 700,000 45 3 6.67% 14.29% -53.33% 700,001 - 800,000 53 4 7.55% 11.43% -33.96% 800,001 - 900,000 23 0 0.00% 5.88% -100.00% 900,001 - 1,000,000 4 0 0.00% 0.00% 0.00% 1,000,001 - 1,250,000 6 1 16.67% 0.00% 100.00% 1,250,001 - 1,500,000 1 0 0.00% 0.00% 0.00% 1,500,001 - 1,750,000 2 0 0.00% 0.00% 0.00% 1,750,001 - 2,000,000 2 0 0.00% 0.00% 0.00% 2M+ 1 0 0.00% 0.00% 0.00% TOTAL 542 36 6.64% 15.66% -57.57%
Unit Type # of Listings # of Sales Absorption Absorption % Change Studio 6 1 16.67% 0.00% 100.00% 1 Bedroom 179 7 3.91% 20.24% -80.68% 2 Bedroom 246 20 8.13% 12.85% -36.74% 3 Bedroom+ 111 8 7.21% 15.73% -54.18% TOTAL 542 36 6.64% 15.66% -57.57%
DETACHED Nov 2012 Dec 2012 % Change Dec 2011 YOY
Active Listings 467 357 -23.55% 297 20.20% Number of Sales 39 23 -41.03% 54 -57.41% Average Listing Price $1,048,010 $1,051,873 0.37% $1,149,912 -8.53% Average Sale Price $1,006,090 $1,004,021 -0.21% $1,108,046 -9.39% Average DOM 54 63 16.67% 64 -1.56% Overall Absorption 8.35% 6.44% -22.85% 18.18% -64.57%
Price Range # of Listings # of Sales Absorption Absorption % Change 0 - 800,000 56 9 16.07% 20.83% -22.86% 800,001 - 900,000 48 4 8.33% 34.21% -75.64% 900,001 - 1,000,000 46 3 6.52% 28.00% -76.71% 1,000,001 - 1,250,000 48 4 8.33% 18.97% -56.06% 1,250,001 - 1,500,000 51 1 1.96% 14.81% -86.76% 1,500,001 - 1,750,000 35 0 0.00% 10.00% -100.00% 1,750,001 - 2,000,000 29 1 3.45% 0.00% 100.00% 2,000,001 - 2,250,000 9 0 0.00% 33.33% -100.00% 2,250,001 - 2,500,000 13 0 0.00% 18.18% -100.00% 2,500,001 - 2,750,000 9 0 0.00% 0.00% 0.00% 2,750,001 - 3,000,000 5 1 20.00% 20.00% 0.00% 3 - 4M 0 0 - 0.00% - 4M+ 8 0 0.00% 0.00% 0.00% TOTAL 357 23 6.44% 19.35% -66.71%
Unit Type # of Listings # of Sales Absorption Absorption % Change 2 Bedroom & Under 17 2 11.76% 23.53% -50.00% 3 Bedroom 62 3 4.84% 20.34% -76.21% 4 Bedroom 117 12 10.26% 26.92% -61.90% 5 Bedroom+ 161 6 3.73% 13.60% -72.60% TOTAL 357 23 6.44% 19.35% -66.71%
ATTACHED
• Overall absorption was 6.64%, which represents 15.06
months worth of supply (buyer’s market)
• December sales absorption rates are down 55.17% from a
year earlier, from 14.81% in 2011 to 6.64% in 2012
• Average selling price in December was $477,235, an
increase of $33,215 (7.48%) from November’s average
• There was 114 fewer listings and 20 fewer sales than in
November
• Average DOM in December was 63 days; properties took
the same number of days as in November to sell
DETACHED
• December’s absorption rate was 6.44%, which represents
15.53 months worth of supply (buyer’s market)
• Compared to last December, sales absorption rates are down
64.57% from 18.18% in 2011 to 6.44% in 2012
• Average sale price in December was $1,004,021, a slight
decrease of $2,069 (-0.21%) from November’s average
• There was 110 fewer listings and 16 less sales than November
• Average DOM was 63 days; properties sat on the market for
9 days longer than in November
488 Drake Street Vancouver, BC V6B 5S9
jefffitzpatrick.com | [email protected] | 604.612.6120
JEFF FITZPATRICK PERSONAL REAL ESTATE CORPORATION
| 6
WEST VANCOUVER | DECEMBER 2012
WEST
VANCOUVER
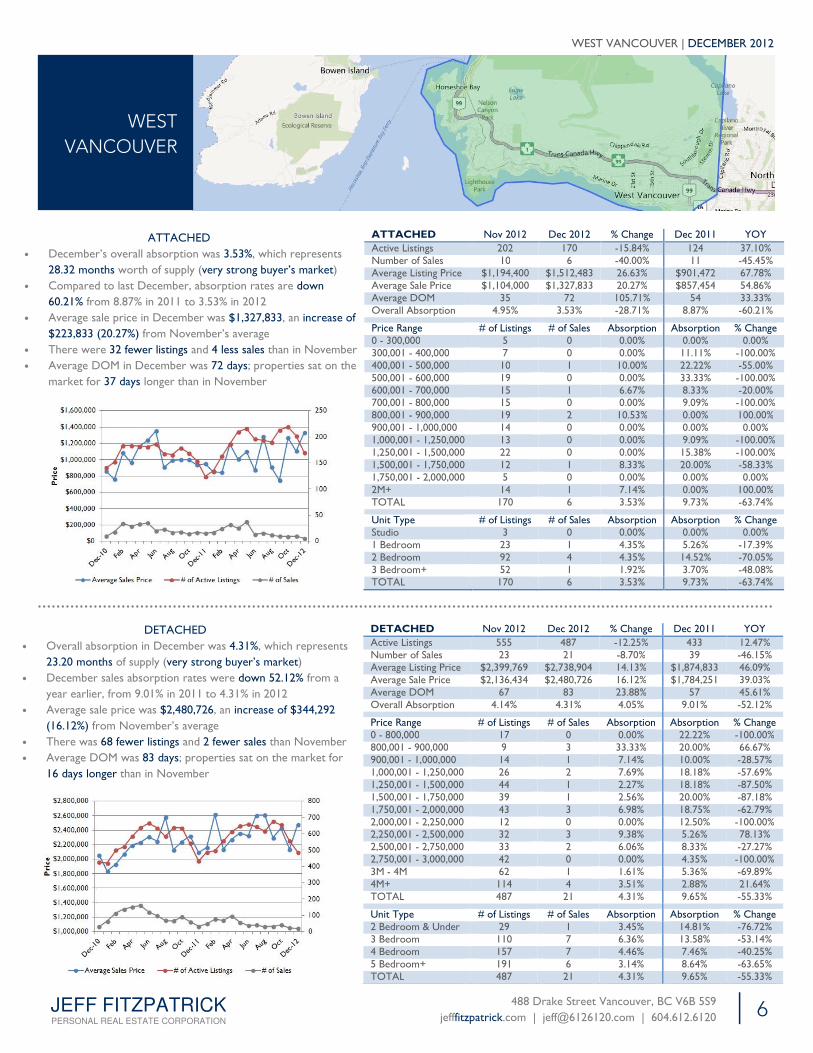
ATTACHED Nov 2012 Dec 2012 % Change Dec 2011 YOY
Active Listings 202 170 -15.84% 124 37.10% Number of Sales 10 6 -40.00% 11 -45.45% Average Listing Price $1,194,400 $1,512,483 26.63% $901,472 67.78% Average Sale Price $1,104,000 $1,327,833 20.27% $857,454 54.86% Average DOM 35 72 105.71% 54 33.33% Overall Absorption 4.95% 3.53% -28.71% 8.87% -60.21%
Price Range # of Listings # of Sales Absorption Absorption % Change 0 - 300,000 5 0 0.00% 0.00% 0.00% 300,001 - 400,000 7 0 0.00% 11.11% -100.00% 400,001 - 500,000 10 1 10.00% 22.22% -55.00% 500,001 - 600,000 19 0 0.00% 33.33% -100.00% 600,001 - 700,000 15 1 6.67% 8.33% -20.00% 700,001 - 800,000 15 0 0.00% 9.09% -100.00% 800,001 - 900,000 19 2 10.53% 0.00% 100.00% 900,001 - 1,000,000 14 0 0.00% 0.00% 0.00% 1,000,001 - 1,250,000 13 0 0.00% 9.09% -100.00% 1,250,001 - 1,500,000 22 0 0.00% 15.38% -100.00% 1,500,001 - 1,750,000 12 1 8.33% 20.00% -58.33% 1,750,001 - 2,000,000 5 0 0.00% 0.00% 0.00% 2M+ 14 1 7.14% 0.00% 100.00% TOTAL 170 6 3.53% 9.73% -63.74%
Unit Type # of Listings # of Sales Absorption Absorption % Change Studio 3 0 0.00% 0.00% 0.00% 1 Bedroom 23 1 4.35% 5.26% -17.39% 2 Bedroom 92 4 4.35% 14.52% -70.05% 3 Bedroom+ 52 1 1.92% 3.70% -48.08% TOTAL 170 6 3.53% 9.73% -63.74%
DETACHED Nov 2012 Dec 2012 % Change Dec 2011 YOY
Active Listings 555 487 -12.25% 433 12.47% Number of Sales 23 21 -8.70% 39 -46.15% Average Listing Price $2,399,769 $2,738,904 14.13% $1,874,833 46.09% Average Sale Price $2,136,434 $2,480,726 16.12% $1,784,251 39.03% Average DOM 67 83 23.88% 57 45.61% Overall Absorption 4.14% 4.31% 4.05% 9.01% -52.12%
Price Range # of Listings # of Sales Absorption Absorption % Change 0 - 800,000 17 0 0.00% 22.22% -100.00% 800,001 - 900,000 9 3 33.33% 20.00% 66.67% 900,001 - 1,000,000 14 1 7.14% 10.00% -28.57% 1,000,001 - 1,250,000 26 2 7.69% 18.18% -57.69% 1,250,001 - 1,500,000 44 1 2.27% 18.18% -87.50% 1,500,001 - 1,750,000 39 1 2.56% 20.00% -87.18% 1,750,001 - 2,000,000 43 3 6.98% 18.75% -62.79% 2,000,001 - 2,250,000 12 0 0.00% 12.50% -100.00% 2,250,001 - 2,500,000 32 3 9.38% 5.26% 78.13% 2,500,001 - 2,750,000 33 2 6.06% 8.33% -27.27% 2,750,001 - 3,000,000 42 0 0.00% 4.35% -100.00% 3M - 4M 62 1 1.61% 5.36% -69.89% 4M+ 114 4 3.51% 2.88% 21.64% TOTAL 487 21 4.31% 9.65% -55.33%
Unit Type # of Listings # of Sales Absorption Absorption % Change 2 Bedroom & Under 29 1 3.45% 14.81% -76.72% 3 Bedroom 110 7 6.36% 13.58% -53.14% 4 Bedroom 157 7 4.46% 7.46% -40.25% 5 Bedroom+ 191 6 3.14% 8.64% -63.65% TOTAL 487 21 4.31% 9.65% -55.33%
ATTACHED
• December’s overall absorption was 3.53%, which represents
28.32 months worth of supply (very strong buyer’s market)
• Compared to last December, absorption rates are down
60.21% from 8.87% in 2011 to 3.53% in 2012
• Average sale price in December was $1,327,833, an increase of
$223,833 (20.27%) from November’s average
• There were 32 fewer listings and 4 less sales than in November
• Average DOM in December was 72 days; properties sat on the
market for 37 days longer than in November
DETACHED
• Overall absorption in December was 4.31%, which represents
23.20 months of supply (very strong buyer’s market)
• December sales absorption rates were down 52.12% from a
year earlier, from 9.01% in 2011 to 4.31% in 2012
• Average sale price was $2,480,726, an increase of $344,292
(16.12%) from November’s average
• There was 68 fewer listings and 2 fewer sales than November
• Average DOM was 83 days; properties sat on the market for
16 days longer than in November

488 Drake Street Vancouver, BC V6B 5S9
jefffitzpatrick.com | [email protected] | 604.612.6120
JEFF FITZPATRICK PERSONAL REAL ESTATE CORPORATION
| 7
FEATURED PROPERTIES | DECEMBER 2012
5331 Saratoga Drive, Tsawwassen BC $590,000
3 Level split home 3 Bedrooms 2 Bathrooms
Beautifully updated 2 Decks & newer patio 2,040 sq. ft.
Granite counters Stainless steel appliances Freshly painted
Hardwood floors Double carport RV parking
231 – 9388 McKim Way, Richmond BC $289,900
1 Bedroom 1 Bathroom 667 sq. ft.
9 ft ceilings Granite counters Laminate floors
Air conditioning Central courtyard views Balcony
1 Parking Resort style building amenities
MLS V976438
260 – 12420 No. 1 Road, Richmond BC $410,000
2 level townhome 1 Bedroom plus den 2 Bathrooms
996 sq. ft. Private rooftop deck 10 ft ceilings
Skylights throughout Water & mountain views Hardwood
Prime location Private detached 2 car garage
MLS V969074
FEATURED
PROPERTIES (CLICK PROPERTY FOR
MORE DETAILS)
303 – 966 W. 14th Avenue, Vancouver BC $489,000
Largest unit in building Quiet corner suite 2 Bedrooms
2 Bathrooms 979 sq. ft. 2 Balconies
New washer & dryer New carpets throughout Rainscreened
In-suite laundry 1 Storage locker 1 Parking
NEW LISTING!
JUST SOLD! JUST SOLD!
MLS V983238 MLS V980100
JUST SOLD!