december 2013 - cfs · financial stability review, december 2013 monetary authority of singapore...
TRANSCRIPT


December 2013
Macroeconomic Surveillance Department
Monetary Authority of Singapore

ISSN 1793-3463 Published in December 2013 Macroeconomic Surveillance Department Monetary Authority of Singapore http://www.mas.gov.sg All rights reserved. No part of this publication may be reproduced, stored in a retrieval system or transmitted in any form or by any means, electronic, mechanised, photocopying, recording or otherwise, without the prior written permission of the copyright owner except in accordance with the provisions of the Copyright Act (Cap. 63). Applications for the copyright owner's written permission to reproduce any part of this publication should be addressed to: Macroeconomic Surveillance Department Monetary Authority of Singapore 10 Shenton Way MAS Building Singapore 079117 Printed by Oxford Graphic Printers Pte Ltd

Financial Stability Review, December 2013
Monetary Authority of Singapore Macroeconomic Surveillance Department
PREFACE i
OVERVIEW ii
1 GLOBAL ENVIRONMENT
1.1 G3 Macroeconomic Environment and Financial System 1
Box A: A Twist to the Search for Yield Story? 5
1.2 Asia Macroeconomic Environment and Financial System 8
Box B: Intermediating Banking Flows in Asia 19
Box C: Potential Impact of Abenomics on Asia: Boon or Bane? 22
2 SINGAPORE’S MACROECONOMIC ENVIRONMENT AND FINANCIAL SYSTEM
2.1 Macroeconomic Developments and Financial Markets 26
2.2 Corporate Sector 30
Box D: Corporate Bond Issuance in Singapore 35
2.3 Household Sector 38
Box E : Update on the Singapore Private Residential Property Market 41
Box F: Singapore Household Sector: When the Tide Goes Out 44
2.4 Banking Sector 49
Box G: Unconventional Monetary Policies (UMP) and the Banking System: When the Music Fades
55
Box H: Stress Testing Financial Institutions: Going the Distance 57
2.5 Non-Bank Financial Sector
2.5.1 Insurance Sector 61
Box I: Monitoring the Singapore Insurance Sector’s Systemic Importance and Emerging Risks
64
2.5.2 Capital Markets Sector 66
Box J: Shadow Banking in Singapore? 69
Box K: Over-the-Counter (OTC) Derivatives Reforms: Still A Ways to Go 73
STATISTICAL APPENDIX 75

Financial Stability Review, December 2013
Monetary Authority of Singapore Macroeconomic Surveillance Department
Definitions and Conventions
As used in this report, the term “country” does not in all cases refer to a territorial entity that is a state as
understood by international law and practice. As used here, the term also covers some territorial entities that
are not states but for which statistical data are maintained on a separate and independent basis.
In this report, the following country groupings are used:
Euro zone comprises Austria, Belgium, Cyprus, Estonia, Finland, France, Germany, Greece, Ireland, Italy,
Luxembourg, Malta, Netherlands, Portugal, Slovakia, Slovenia and Spain
“G3” refers to the euro zone and United Kingdom, Japan, and the United States
“G20” refers to the Group of Twenty comprising Argentina, Australia, Brazil, Canada, China, France,
Germany, India, Indonesia, Italy, Japan, Mexico, Russia, Saudi Arabia, South Africa, South Korea,
Turkey, the United Kingdom, the United States and the European Union
“Asia-10” comprises China (CHN), Hong Kong (HK), India (IND), Indonesia (IDN), Korea (KOR), Malaysia
(MYS), the Philippines (PHL), Singapore (SGP), Taiwan (TWN) and Thailand (THA)
“Asia-7” comprises India, Indonesia, Korea, Malaysia, the Philippines, Taiwan and Thailand
“NEA-3” comprises Hong Kong, Korea and Taiwan
“SEA-5” comprises Indonesia, Malaysia, the Philippines, Singapore and Thailand
Abbreviations used for financial data are as follows:
Currencies: Chinese Renminbi (RMB), Euro (EUR), Hong Kong Dollar (HKD), Indian Rupee (INR),
Indonesian Rupiah (IDR), Japanese Yen (JPY), Korean Won (KRW), Malaysian Ringgit (MYR), Philippine
Peso (PHP), Singapore Dollar (SGD), Taiwan Dollar (TWD), Thai Baht (THB), US Dollar (USD)
Stock Indices: Bombay Stock Exchange Sensitive Index (SENSEX), FTSE Bursa Malaysia KLCI (FBMKLCI),
Hang Seng Index (HSI), Ho Chi Minh Stock Index (VNINDEX), Jakarta Composite Index (JCI), Korea
Composite Stock Price Index (KOSPI), Nikkei 225 (NKY), Philippine Stock Exchange Index (PSEI),
Shanghai Composite Index (SHCOMP), Stock Exchange of Thailand Index (SET), Straits Times Index (STI),
Taiwan TAIEX Index (TWSE)
Other Abbreviations
ABSD Additional Buyer Stamp Duty
ACU Asian Currency Unit
ADB Asian Development Bank
ADM Asian Dollar Market
AFC Asian Financial Crisis
ASEAN Association of Southeast Asian Nations
AUM Assets Under Management
BCBS Basel Committee on Banking Supervision
BIS Bank for International Settlements
BoE Bank of England
BoJ Bank of Japan
CAR Capital Adequacy Ratio
CCP Central Counterparty
CCR Core Central Region
CCS Credit Counselling Singapore
Financial Stability Review, December 2013
Monetary Authority of Singapore Macroeconomic Surveillance Department
CDP Central Depository
CDS Credit Default Swap
CFTC Commodity Futures Trading Commission
CIS Collective Investment Scheme
CLO Collateralised Loan Obligation
CMBS Commercial Mortage-Backed Security
COE Certificate of Entitlement
CPF Central Provident Fund
CPI Consumer Price Index
CPSS Committee on Payment and Settlement Systems
DBU Domestic Banking Unit
DOS Department of Statistics
EBIT Earnings Before Interest and Tax
EC European Commission
EC Executive Condominium
ECB European Central Bank
EDB Economic Development Board
EME Emerging Market Economy
EMIR European Markets Infrastructure Regulation
ESM European Stability Mechanism
ETF Exchange-Traded Fund
EU European Union FAI Fixed Asset Investment FDI Foreign Direct Investment FI Financial Institution
FLS Funding for Lending Scheme
FMC Fund Management Company
FMI Financial Market Infrastructure
FSAP Financial Sector Assessment Programme
FSB Financial Stability Board
FSOC Financial Stability Oversight Council
FSR Financial Stability Review
GDP Gross Domestic Product
GFC Global Financial Crisis
GLS Government Land Sales
ICAAP Internal Capital Adequacy Assessment Process
IIF Institute of International Finance
IMF International Monetary Fund
IMFC International Monetary and Financial Committee
IOSCO International Organisation of Securities Commissions
IPTO Insolvency and Public Trustee’s Office
IWST Industry-Wide Stress Test
JGB Japanese Government Bond
LIBOR London Interbank Offered Rate
LCR Liquidity Coverage Ratio
LGFV Local Government Financing Vehicle
LSAP Large-Scale Asset Purchase
LTA Land Transport Authority
LTD Loan-to-Deposit
LTRO Long Term Refinancing Operations
LTV Loan-to-Value

Financial Stability Review, December 2013
Monetary Authority of Singapore Macroeconomic Surveillance Department
M&A Mergers and Acquisitions
MAS Monetary Authority of Singapore
MMF Money Market Fund
MSD Macroeconomic Surveillance Department
MSR Mortgage-Servicing Ratio
NAO National Audit Office
NAV Net Asset Value
NEER Nominal Effective Exchange Rate
NIM Net Interest Margin
NPL Non-Performing Loan
OCR Outside Central Region
ODRG OTC Derivatives Regulators Group
OIF Offshore Insurance Fund
OIF Other Investment Fund
OIS Overnight Indexed Swap
OTC Over-the-Counter
PE Private Equity
PFMI Principles for Financial Market Infrastructures
PIK Payment-in-Kind
PPI Property Price Index
RBC Risk-Based Capital
RBI Reserve Bank of India
RCR Rest of Central Region
REIT Real Estate Investment Trust
ROA Return on Assets
S&P Standard & Poor’s
SBL Securities Borrowing / Lending
SEC Securities and Exchange Commission
SFA Securities and Futures Act
SFV Structured Finance Vehicle
SGS Singapore Government Securities
SGX Singapore Exchange Ltd
SGX-DC Singapore Exchange Derivatives Clearing Ltd
SIBOR Singapore Interbank Offered Rate
SIF Singapore Insurance Fund
SLOOS Senior Loan Officer Opinion Survey
SME Small and Medium-Sized Enterprise
SMX Singapore Mercantile Exchange
SOR Swap Offer Rate
SSM Single Supervisory Mechanism
STI Straits Times Index
TDSR Total Debt-Servicing Ratio
TED Treasury-Interbank
TR Trade Repository
TSC Transport, Storage and Communication
UMP Unconventional Monetary Policy
URA Urban Redevelopment Authority
WEO World Economic Outlook
WMP Wealth Management Product
Financial Stability Review, December 2013
Monetary Authority of Singapore Macroeconomic Surveillance Department
i
PREFACE
The Monetary Authority of Singapore (MAS) conducts regular assessments of Singapore’s
financial system. Potential risks and vulnerabilities are identified, and the ability of the
financial system to withstand potential shocks is reviewed. The analysis and results are
published in the annual Financial Stability Review (FSR). The FSR aims to contribute to a
better understanding among market participants, analysts and the public of issues
affecting Singapore’s financial system.
Section 1 of the FSR provides a discussion of the macroeconomic environment and
financial markets both globally and in Asia. Section 2 starts by outlining key developments
in Singapore’s macroeconomic environment and financial system. This is followed by an
analysis of the corporate and household sectors, then the banking sector, which plays a
dominant role in Singapore’s financial landscape. Finally, a review of the non-bank
financial sector, which includes the insurance sector and capital market infrastructure and
intermediaries, is also provided.
The production of the FSR was coordinated by the Macroeconomic Surveillance
Department (MSD) team which comprises Chan Lily, Ng Heng Tiong, Patricia Chua, Foo
Suan Yong, Gay Bing Yong Kenneth, Ho Ruixia Cheryl, Ho Xinyi, Lam Mingli Angeline, Lee
Jia Sheng Harry, Lee Su Fen, Lim Ju Meng Aloysius, Lim Weilun, Qiu Qiaoling Angeline,
Soon Shu Ning Gael, Tan Si Jie, Teoh Shi-Ying, Wong Siang Leng, Yam Yujian, Yeo Siok Lee
Denise, Yeoh Lye Choon Brian, Yip Ee Xiu, Yoe Xue Ting Selene and Zhong Kemin under the
general direction of Dr Lam San Ling, Executive Director (MSD). Valuable statistical and
charting support was provided by members of the MSD Statistics Unit. The FSR also
incorporates contributions from the following departments: Banking Departments I, II &
III, Capital Markets Intermediaries Department, Economic Analysis Department, Economic
Surveillance and Forecasting Department, Insurance Department, International
Department, Investment Intermediaries Department, Market Conduct Department,
Markets Policy & Infrastructure Department, Monetary and Domestic Markets
Management Department, Prudential Policy Department and Specialist Risk Department.
The FSR reflects the views of the staff of the MSD and the contributing departments.
The FSR may be accessed in PDF format on the MAS website:
http://www.mas.gov.sg/Regulations-and-Financial-Stability/Financial-Stability/2013/Financial-Stability-
Review-2013.aspx

Financial Stability Review, December 2013
Monetary Authority of Singapore Macroeconomic Surveillance Department
ii
OVERVIEW
G3 macroeconomic and financial
conditions have improved in 2013,
but challenges remain
The G3 economies have recovered in 2013 – the
US shrugged aside fiscal headwinds, the euro
zone exited from recession, and Japan’s growth
was aided by robust exports and consumption.
The risk of bank defaults in the G3 has receded as
banks’ balance sheets have strengthened.
Deposit outflows have abated while cost cutting
and lower provisions have boosted earnings. G3
sovereign borrowing costs have stayed low, due
to a combination of forceful policy actions, ample
global liquidity, and search for yield by some
investors.
But challenges remain. In the euro zone, credit
quality concerns could impede credit growth and
in turn threaten the fragile recovery. If global
liquidity tightens or market sentiment turns
abruptly, funding costs could rise rapidly for
countries with weaker fundamentals. Emerging
market economies (EMEs) could also come under
pressure, with implications for G3 corporates and
banks that have strong presence in these regions.
In the longer term, structural reforms in the G3
are needed to improve the sustainability of public
finances, break the adverse feedback loops
between sovereigns and banks, and enhance
economic competitiveness.
Unconventional monetary policies
(UMP) cannot be in place indefinitely;
policy normalisation needs to be
carefully planned and communicated
Much of the improvements in G3 economic and
financial conditions have been underpinned by
unconventional monetary policies (UMP).
However, these policies cannot be in place
indefinitely because they have potential
implications for monetary and financial stability.
As G3 policymakers consider policy
normalisation, it is important that they do so in
carefully-considered steps that are clearly
communicated.
Asia’s economic growth and financial
markets have held up amid abundant
global liquidity and risk appetite …
Turning to Asia, economic growth has held up
despite mixed conditions. UMP has helped to
bolster global growth in the near term, in turn
providing support for Asia. Some authorities
have also adopted fiscal measures to provide a
fillip to growth.
Meanwhile, the abundant global liquidity and risk
appetite underpinned by UMP have combined
with record low interest rates in the region to
keep financial markets buoyant for the most part.
… but considerable downside risks lie ahead
However, considerable risks lie ahead.
Uncertainties surrounding the G3 economic
recovery and domestic restructuring efforts in
Asia cloud the growth outlook for the region.
Although Asia is more resilient now than during
the Asian Financial Crisis (AFC), the financial
market turbulence in recent months attests to
the strains that G3 policy normalisation can have
on the region.
Of particular concern is the build-up of private
and public sector debt in recent years. If G3
policy normalisation triggers an abrupt tightening
of financial conditions, debt-servicing burdens in
Asia can rise sharply. A dip in confidence can
lead to currency depreciation, which can add to
debt repayment costs for those who had
borrowed in foreign currencies. With volatile
capital flows, banks may come under foreign-
currency funding pressure. They may also tighten
credit supply as defaults rise, leading to a vicious
cycle of declining asset quality, tightening credit
and slowing growth. The potential impact across
Financial Stability Review, December 2013
Monetary Authority of Singapore Macroeconomic Surveillance Department
iii
Asia could be uneven, depending on market
perceptions of which economies are more
susceptible to external shocks.
Singapore’s economy and financial markets
have been resilient …
Singapore’s economic growth has held up in 2013
despite considerable swings in momentum, and is
expected to remain moderately positive in 2014.
Reflecting confidence in our economic
fundamentals and fiscal discipline, domestic
financial markets have stayed resilient.
Corporate and household balance sheets as
well as the banking system stay healthy …
Corporate and household balance sheets are
healthy in aggregate. The corporate sector’s
profitability has improved in a broad-based
manner while liquidity positions appear
adequate. Household net wealth continues to
grow, and stands at four times GDP.
The banking system has stayed resilient. Local
banks already meet Basel III capital requirements.
Loan growth has been firm, with increased
exposure to Asia. Asset quality remains healthy,
and Singapore Dollar (SGD) funding for domestic
lending remains adequate.
… but downside risks remain;
the need for vigilance is clear
However, several downside risks lie ahead. The
global environment could deteriorate, posing
uncertainties for Singapore’s growth outlook.
Interest rates – and therefore debt-servicing
burdens – could increase markedly and perhaps
unexpectedly soon. In turn, growth shocks and
financial market volatility could affect the
property market and the banking system.
Rising corporate and household sector
indebtedness could amplify strains
from higher interest rates
Corporate leverage has increased across almost
all sectors. Higher interest rates arising from G3
policy normalisation could leave the most
leveraged firms exposed to heavier debt-servicing
burdens.
Household sector debt has also trended up
alongside firm increases in assets and net wealth
over the past few years, albeit at a slower pace in
recent quarters. If mortgage rates rise by three
percentage points, the share of over-leveraged
households could rise to 10-15%. MAS has
introduced measures to encourage prudent
borrowing and help keep household debt in
check.
The property market continues to
warrant close monitoring
The Total Debt Servicing Ratio (TDSR) framework,
together with earlier policy measures by the
Government, has moderated property market
transaction activity and housing loan growth.
However, developer bids for land parcels remain
firm. The current uncertain environment
warrants continued caution and vigilance.
The banking sector needs to guard
against credit quality deterioration
and liquidity risks
The banking sector needs to guard against credit
quality deterioration and liquidity risks. In
particular, as banks expand their cross-border
lending to the region, they need to monitor these
exposures carefully.
In addition, banks need to continue managing
their liquidity risks prudently. The local banks
have been taking measures to improve their US
dollar (USD) funding profiles. They need to stay
vigilant on this front to avoid adverse effects
from any abrupt tightening in global USD
liquidity.
Macroeconomic Surveillance Department
Monetary Authority of Singapore
3 December 2013

Financial Stability Review, December 2013
Monetary Authority of Singapore Macroeconomic Surveillance Department
1
GLOBAL ENVIRONMENT
1.1 G3 Macroeconomic Environment and Financial System
Macroeconomic and financial conditions in the G3 improved in 2013, supported by unconventional
monetary policies (UMP). However, loose monetary conditions cannot be in place indefinitely, and a
sustained economic recovery would need to be backed by appropriate structural reforms.
With the growth outlook in advanced economies still subject to considerable uncertainty, the mere
prospect of the US starting to normalise policy by tapering its large-scale asset purchase (LSAP)
programme triggered heightened volatility in global financial markets. This attests to the ramifications
that the G3’s economic growth, financial system resilience and policy actions can have globally.
Macroeconomic conditions in the G3 have improved
The G3 economies recovered in 2013 (Chart 1.1.1),
though growth has slowed in some economies in the
latest quarter. The US’ and the UK’s GDP growth
continued to pick up in Q3 2013. The euro zone
unexpectedly exited from recession in Q2 2013 and
continued to expand in Q3, albeit at a slower rate. In
Japan, growth slowed in Q3 after a pick-up in H1 2013,
helped by firm exports and robust consumption.
G3 banking systems have generally
strengthened over the past year
G3 banks – particularly European banks – have generally
strengthened over the past year, with higher earnings
driven largely by cost-cutting and lower provisions.
Market expectations of bank defaults have receded
dramatically, especially for European banks, as seen by
the narrowing of credit default swap (CDS) spreads
(Chart 1.1.2). Bank funding conditions have also
improved in the euro zone. Deposit outflows have
largely abated (Chart 1.1.3), except for Cyprus which
took a bailout package in April this year. Europe’s move
towards a banking union with a common supervisory
framework, as well as ongoing efforts to put in place a
common resolution framework, has been broadly seen
as a step in the right direction, even though
implementation will bring challenges.
Chart 1.1.1 GDP Growth: G3 Economies
Source: Datastream
Chart 1.1.2 iTraxx Europe Senior Financial Index
Source: Bloomberg
-20
-15
-10
-5
0
5
10
2007 2008 2009 2010 2011 2012 2013
Qo
Q S
AA
R %
Gro
wth
US Japan Euro Zone UK
Q3
50
100
150
200
250
300
350
2011 2012 2013
Basis
Po
ints
Nov
Financial Stability Review, December 2013
Monetary Authority of Singapore Macroeconomic Surveillance Department
2
However, banking systems face
ongoing as well as new challenges
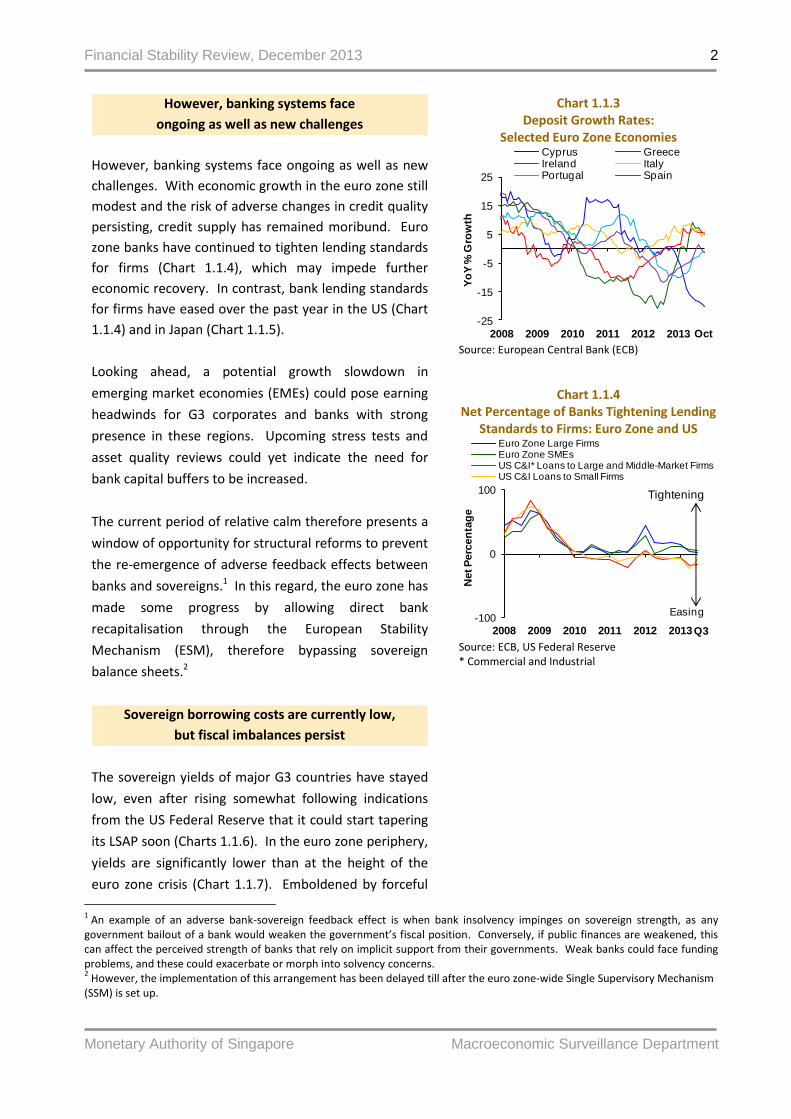
However, banking systems face ongoing as well as new
challenges. With economic growth in the euro zone still
modest and the risk of adverse changes in credit quality
persisting, credit supply has remained moribund. Euro
zone banks have continued to tighten lending standards
for firms (Chart 1.1.4), which may impede further
economic recovery. In contrast, bank lending standards
for firms have eased over the past year in the US (Chart
1.1.4) and in Japan (Chart 1.1.5).
Looking ahead, a potential growth slowdown in
emerging market economies (EMEs) could pose earning
headwinds for G3 corporates and banks with strong
presence in these regions. Upcoming stress tests and
asset quality reviews could yet indicate the need for
bank capital buffers to be increased.
The current period of relative calm therefore presents a
window of opportunity for structural reforms to prevent
the re-emergence of adverse feedback effects between
banks and sovereigns.1 In this regard, the euro zone has
made some progress by allowing direct bank
recapitalisation through the European Stability
Mechanism (ESM), therefore bypassing sovereign
balance sheets.2
Sovereign borrowing costs are currently low,
but fiscal imbalances persist
The sovereign yields of major G3 countries have stayed
low, even after rising somewhat following indications
from the US Federal Reserve that it could start tapering
its LSAP soon (Charts 1.1.6). In the euro zone periphery,
yields are significantly lower than at the height of the
euro zone crisis (Chart 1.1.7). Emboldened by forceful
Chart 1.1.3 Deposit Growth Rates:
Selected Euro Zone Economies
Source: European Central Bank (ECB)
Chart 1.1.4 Net Percentage of Banks Tightening Lending
Standards to Firms: Euro Zone and US
Source: ECB, US Federal Reserve * Commercial and Industrial
1 An example of an adverse bank-sovereign feedback effect is when bank insolvency impinges on sovereign strength, as any
government bailout of a bank would weaken the government’s fiscal position. Conversely, if public finances are weakened, this can affect the perceived strength of banks that rely on implicit support from their governments. Weak banks could face funding problems, and these could exacerbate or morph into solvency concerns. 2 However, the implementation of this arrangement has been delayed till after the euro zone-wide Single Supervisory Mechanism
(SSM) is set up.
-25
-15
-5
5
15
25
2008 2009 2010 2011 2012 2013
Yo
Y %
Gro
wth
Cyprus GreeceIreland ItalyPortugal Spain
Oct
-100
0
100
2008 2009 2010 2011 2012 2013
Net P
erc
en
tag
e
Euro Zone Large Firms Euro Zone SMEsUS C&I* Loans to Large and Middle-Market FirmsUS C&I Loans to Small Firms
Q3
Easing
Tightening

Financial Stability Review, December 2013
Monetary Authority of Singapore Macroeconomic Surveillance Department
3
policy actions and an environment of ample global
liquidity, some investors have continued their relentless
search for yield. Their demand for higher-yielding assets
has in turn contributed to lower interest rates overall.
This could bring about new risks. If global liquidity
tightens or market sentiment turns abruptly, funding
costs could rise rapidly for countries and firms with
weaker fundamentals (Box A).
The longer-term sustainability of public finances in many
G3 countries remains questionable. Their debt-to-GDP
ratios remain high compared to historical trends (Chart
1.1.8). Some euro zone countries under bailout
programmes may require additional funds to cover
financing gaps. In the US, budget deficits are expected
to persist at least over the next decade, making
improvements to the country’s public debt trajectory a
challenge. Furthermore, any standoff between US
policymakers during the annual budget process and
negotiations to raise the statutory debt ceiling would
likely add uncertainty to global financial markets and
economic sentiment. Japan’s government debt has
been largely held by domestic investors. However,
domestic banks have started diversifying their
investment portfolios even as the stock of Japanese
Government Bonds (JGBs) crossed the psychological one
quadrillion yen mark. In future, the sustainability of
Japan’s public finances may well be more exposed to
changes in foreign investor sentiment.
Unconventional monetary policies, which have
underpinned improvements in G3 economic and
financial conditions, cannot continue indefinitely
UMP have underpinned much of the improvements in
economic and financial conditions in the G3.
The US Federal Reserve has continued with its LSAP over
the past year. In the euro zone, the European Central
Bank (ECB)’s programmes to provide a backstop to
sovereigns as well as long-term financing for banks last
year have continued to bring relief to financial markets.
More recently, the ECB and the Bank of England (BoE)
Chart 1.1.5 Diffusion Index of Credit Standards
for Firms: Japan
Source: Bank of Japan (BoJ)
Chart 1.1.6 Ten-Year Sovereign Bond Yields:
Selected G3 Economies
Source: Bloomberg
Chart 1.1.7 Ten-Year Sovereign Bond Yields: Selected Euro Zone Economies
Source: Bloomberg
-6
0
6
12
18
24
30
2008 2009 2010 2011 2012 2013
Perc
en
tag
e P
oin
ts
Japan Large-Sized FirmsJapan Medium-Sized FirmsJapan Small-Sized Firms
Q3
Easing
0
1
2
3
4
5
6
2007 2009 2011 2013
Per C
en
t
France Germany Japan UKUS
Nov
0
10
20
30
40
0
5
10
15
20
2007 2009 2011 2013
Per C
en
t
Per C
en
t
Ireland ItalyPortugal SpainGreece (RHS)
Nov

Financial Stability Review, December 2013
Monetary Authority of Singapore Macroeconomic Surveillance Department
4
have used forward guidance on interest rates to try to
allay concerns that premature interest rate rises could
derail Europe’s fledgling recovery. The BoJ also started
an aggressive quantitative easing programme in April to
replace its previous asset purchase programme.
However UMP cannot be in place indefinitely. Such
policies have led to sharp expansions in the balance
sheets of major central banks since 2008 (Chart 1.1.9).
This has potential implications for monetary and
financial stability, and could also lead to financial market
distortions.
Looking ahead, it is vital to normalise policy
in carefully-considered steps
Looking ahead, as G3 policymakers begin to consider
normalising policy, it is important that they pay
attention to the potential spillover effects. A case in
point is the heightened volatility in global financial
markets and spillover effects on EMEs after the US
Federal Reserve indicated that it could start tapering its
LSAP programme.
Leaders of the International Monetary and Financial
Committee (IMFC) have stressed that the eventual
transition toward the normalisation of monetary policy
should be well timed, carefully calibrated, and clearly
communicated. G20 leaders have also called for
cooperation to manage these spillovers to other
countries.
Chart 1.1.8 Public Debt-to-GDP Ratio:
Selected G3 Economies
Source: International Monetary Fund (IMF) World Economic Outlook (WEO)
Chart 1.1.9
Central Bank Assets: Selected G3 Economies
Source: Bloomberg
0
50
100
150
200
250
300
1990 1995 2000 2005 2010 2015
Per C
en
t
France GermanyGreece IrelandItaly JapanPortugal SpainUnited Kingdom United States
Estimates as at 2013
2018
50
150
250
350
450
2008 2009 2010 2011 2012 2013
Ind
ex (Jan
2008 =
100)
Federal Reserve ECBBank of England Bank of Japan
Nov

Financial Stability Review, December 2013
Monetary Authority of Singapore Macroeconomic Surveillance Department
5
Box A
A Twist to the Search for Yield Story?
Rising search for yield in advanced economies may exacerbate risks
Over the past few years, UMP in the advanced economies and ample global liquidity have led to investors
migrating down the creditworthiness ladder in a search for yield. This search for yield is also evident in EMEs,
including Asia, where strong capital inflows have put upward pressure on asset prices. Indication by the US
Federal Reserve in May that it could start tapering its LSAP programme soon led to capital outflows from and
exchange rate volatility in EMEs. Looking ahead, as investors reassess the risk-return profile of EME
investments, the tide may turn, with investors, including those from EMEs, looking more to the advanced
economies for yield. This could result in a further build-up of risk in the more vulnerable market segments in
the advanced economies.
More signs of search for yield in advanced economies
There have been growing signs of search for yield in the advanced economies:
Sovereign bonds of euro zone periphery: Sovereign bond yields for peripheral euro zone countries have
remained low despite high public sector debts and slow progress in reforms to achieve fiscal
sustainability. While strong policy actions have staved off the risk of an immediate crisis in the euro
zone, some of the yield compression could also have been due to investors’ willingness to purchase
these sovereign bonds in the search for yield.
High-yield corporate debt in Europe and the US: Speculative-grade bond yields in Europe and the US
remain low (Chart A1), a sign of strong demand for high-yield debt. European high-yield corporate
bond issuance so far this year has exceeded the record issuance in 2012 (Chart A2), in spite of a dip in
June due to LSAP tapering concerns.
Chart A1 Speculative-Grade Corporate Bond Yields:
Europe and US
Source: Bloomberg
Chart A2 Speculative-Grade Corporate Bond Issuance:
Peripheral Euro Zone and Rest of Europe
Source: Dealogic
0
6
12
18
24
30
2008 2009 2010 2011 2012 2013
Per C
en
t
Europe US
Nov
0
20
40
60
80
100
2006 2007 2008 2009 2010 2011 2012 2013Oct
ytd
€B
illio
n
Peripheral Euro Zone Rest of Europe
Financial Stability Review, December 2013
Monetary Authority of Singapore Macroeconomic Surveillance Department
6
High-risk practices and use of leveraged instruments in US credit markets: Earlier this year, US Federal
Reserve governor Jeremy Stein3 highlighted an increase in high-risk practices such as the issuance of
payment-in-kind (PIK) notes and covenant-lite loans, as well as the use of dividend recapitalisations and
leverage in large buyout deals.4 The US Financial Stability Oversight Council (FSOC)5 also highlighted
that there were signs of weakening underwriting standards in covenants for some newly-issued bonds
and loans, and that the issuance of collateralised loan obligations (CLOs)6 was close to peak levels. The
use of leveraged exchange traded funds (ETFs) to amplify the returns on underlying indices also poses
concerns.
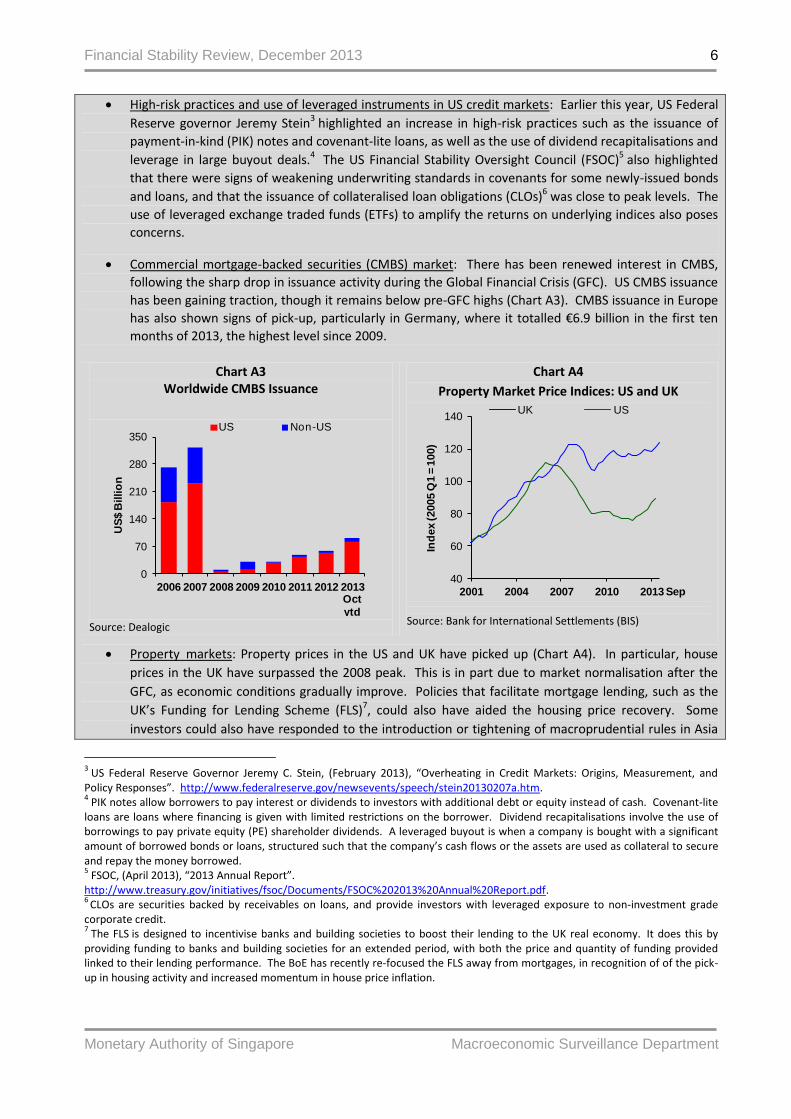
Commercial mortgage-backed securities (CMBS) market: There has been renewed interest in CMBS,
following the sharp drop in issuance activity during the Global Financial Crisis (GFC). US CMBS issuance
has been gaining traction, though it remains below pre-GFC highs (Chart A3). CMBS issuance in Europe
has also shown signs of pick-up, particularly in Germany, where it totalled €6.9 billion in the first ten
months of 2013, the highest level since 2009.
Chart A3 Worldwide CMBS Issuance
Source: Dealogic
Chart A4
Property Market Price Indices: US and UK
Source: Bank for International Settlements (BIS)
Property markets: Property prices in the US and UK have picked up (Chart A4). In particular, house
prices in the UK have surpassed the 2008 peak. This is in part due to market normalisation after the
GFC, as economic conditions gradually improve. Policies that facilitate mortgage lending, such as the
UK’s Funding for Lending Scheme (FLS)7, could also have aided the housing price recovery. Some
investors could also have responded to the introduction or tightening of macroprudential rules in Asia
3 US Federal Reserve Governor Jeremy C. Stein, (February 2013), “Overheating in Credit Markets: Origins, Measurement, and
Policy Responses”. http://www.federalreserve.gov/newsevents/speech/stein20130207a.htm. 4 PIK notes allow borrowers to pay interest or dividends to investors with additional debt or equity instead of cash. Covenant-lite
loans are loans where financing is given with limited restrictions on the borrower. Dividend recapitalisations involve the use of borrowings to pay private equity (PE) shareholder dividends. A leveraged buyout is when a company is bought with a significant amount of borrowed bonds or loans, structured such that the company’s cash flows or the assets are used as collateral to secure and repay the money borrowed. 5 FSOC, (April 2013), “2013 Annual Report”.
http://www.treasury.gov/initiatives/fsoc/Documents/FSOC%202013%20Annual%20Report.pdf. 6
CLOs are securities backed by receivables on loans, and provide investors with leveraged exposure to non-investment grade corporate credit. 7 The FLS is designed to incentivise banks and building societies to boost their lending to the UK real economy. It does this by
providing funding to banks and building societies for an extended period, with both the price and quantity of funding provided linked to their lending performance. The BoE has recently re-focused the FLS away from mortgages, in recognition of of the pick-up in housing activity and increased momentum in house price inflation.
0
70
140
210
280
350
2006 2007 2008 2009 2010 2011 2012 2013Oct
ytd
US
$ B
illio
n
US Non-US
40
60
80
100
120
140
2001 2004 2007 2010 2013
Ind
ex (2005 Q
1 =
100)
UK US
Sep

Financial Stability Review, December 2013
Monetary Authority of Singapore Macroeconomic Surveillance Department
7
by seeking returns in other property markets.
Risks that could arise from the search for yield
Lack of impetus for change could result in build-up of longer-term risks in peripheral Europe
Low sovereign bond yields in peripheral Europe have reduced the immediate pressure on governments to take
hard decisions on fundamental structural reforms. Longer-term risks could build up and be more painful to
unwind down the road.
Have investors understood sufficiently the risk implications?
The strong demand for high-yield debt raises the question of whether investors have sufficiently priced in the
possibility of increased default rates and widening credit spreads should markets turn.
Signs of stress in the CMBS market have emerged – the number of CMBS defaults in Europe in H1 2013 was
double that in the same period last year, though the number of defaults later fell in Q3 2013. Falling prices for
commercial properties outside major cities could suggest that some loans which support CMBS arranged during
boom times have been failing to repay at maturity. The US FSOC8 has warned that the commercial real estate
sector remains vulnerable to refinancing risks in the event of a sharp rise in interest rates, which could lead to
more CMBS defaults.
The US Securities and Exchange Commission (SEC)9 had highlighted previously that some ETFs could have
unusual investment objectives or use complex investment strategies that might be difficult to understand. For
example, leveraged ETFs may be unsuitable as long-term investment tools, as their investment objectives are
typically set on a short-term basis, something which may not be clear to unsophisticated investors. At a
broader level, the Federal Reserve10 has warned that trading activity of leveraged ETFs during bouts of market
volatility could lead to a cascading reaction that may destabilise the broader market.
The strong demand for high-yield debt could also be encouraging products with structures that may be
disadvantageous to investors, such as PIK toggle deals which give borrowers the option to repay lenders with
more debt rather than cash. These disadvantageous structures could become apparent to investors only in the
future should defaults pick up or (re)financing suddenly becomes more difficult.
Could new asset bubbles be forming?
Could the pace of house price increases in the US and the UK be a sign that asset bubbles are forming again?
Beyond risks to investors, there are also concerns that another asset bubble could lead to renewed risks for
bank asset quality.
Policymakers must stand prepared to manage risks
Although all eyes have recently been on heightened volatility in EMEs, it is important to be watchful of capital
inflows to vulnerable sectors in the advanced economies, which could lead to a build-up of risks. Peripheral
euro zone countries need to implement structural reforms to improve their economic competitiveness and
fiscal sustainability. Investors need to exercise caution when dealing with high-yield debt and other new
investment products. Policymakers need to stay vigilant and be prepared to take measures to manage risks
that may emerge.
8 FSOC, (April 2013), “2013 Annual Report”.
http://www.treasury.gov/initiatives/fsoc/Documents/FSOC%202013%20Annual%20Report.pdf. 9 US SEC (August 2012), “Investor Bulletin: Exchange-Traded Funds (ETFs)”. http://www.sec.gov/investor/alerts/etfs.pdf.
10 Tugkan Tuzun, US Federal Reserve (July 2013), “Are Leveraged and Inverse ETFs the New Portfolio Insurers?”.
http://www.federalreserve.gov/pubs/feds/2013/201348/201348pap.pdf.
Financial Stability Review, December 2013
Monetary Authority of Singapore Macroeconomic Surveillance Department
8
1.2 Asia Macroeconomic Environment and Financial System
Over the past few years, an unusual combination of factors – abundant global liquidity and risk appetite
underpinned by advanced economies’ UMP, record low interest rates and various fiscal measures in Asia –
has made it possible for Asia’s economic growth to hold up and financial markets to be buoyed by bullish
sentiment for the most part. This has been fuelled, in part, by a build-up of public and private sector debt.
The environment could soon change, as the US leads the way in starting to normalise monetary policy by
tapering its LSAP programme, even as uncertainties surround the G3 economic recovery and restructuring
efforts in Asia. Global financial tightening can lead to stresses, including interest rate increases, shifts in
sentiment and volatile capital flows. These stresses can manifest themselves quickly for borrowers,
financial markets and banking systems, with uneven impact on different parts of the region.
Asia as a region is more resilient today than during the Asian Financial Crisis (AFC). Various policy
measures have helped to reduce vulnerabilities to external shocks. Nonetheless, further progress in this
respect will strengthen the resilience of individual countries as well as the entire region.
Asia’s economic growth momentum has been
mixed, and considerable risks lie ahead
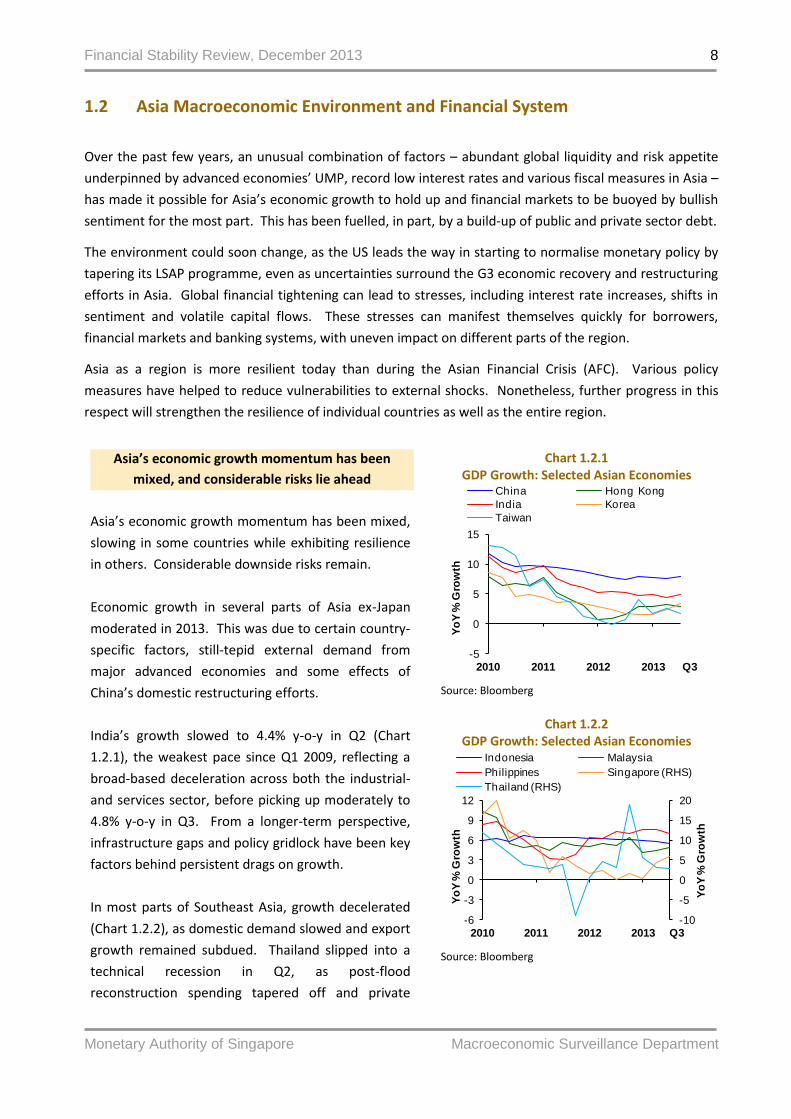
Asia’s economic growth momentum has been mixed,
slowing in some countries while exhibiting resilience
in others. Considerable downside risks remain.
Economic growth in several parts of Asia ex-Japan
moderated in 2013. This was due to certain country-
specific factors, still-tepid external demand from
major advanced economies and some effects of
China’s domestic restructuring efforts.
India’s growth slowed to 4.4% y-o-y in Q2 (Chart
1.2.1), the weakest pace since Q1 2009, reflecting a
broad-based deceleration across both the industrial-
and services sector, before picking up moderately to
4.8% y-o-y in Q3. From a longer-term perspective,
infrastructure gaps and policy gridlock have been key
factors behind persistent drags on growth.
In most parts of Southeast Asia, growth decelerated
(Chart 1.2.2), as domestic demand slowed and export
growth remained subdued. Thailand slipped into a
technical recession in Q2, as post-flood
reconstruction spending tapered off and private
Chart 1.2.1 GDP Growth: Selected Asian Economies
Source: Bloomberg
Chart 1.2.2 GDP Growth: Selected Asian Economies
Source: Bloomberg
-5
0
5
10
15
2010 2011 2012 2013
Yo
Y %
Gro
wth
China Hong Kong
India Korea
Taiwan
Q3
-10
-5
0
5
10
15
20
-6
-3
0
3
6
9
12
2010 2011 2012 2013
Yo
Y %
Gro
wth
Yo
Y %
Gro
wth
Indonesia Malaysia
Philippines Singapore (RHS)
Thailand (RHS)
Q3
Financial Stability Review, December 2013
Monetary Authority of Singapore Macroeconomic Surveillance Department
9
consumption was restrained by high household debt,
before returning to modest sequential growth in Q3.
Indonesia’s growth continued to ease as tighter
credit conditions crimped firms’ investment and low
commodity prices weighed on exports.
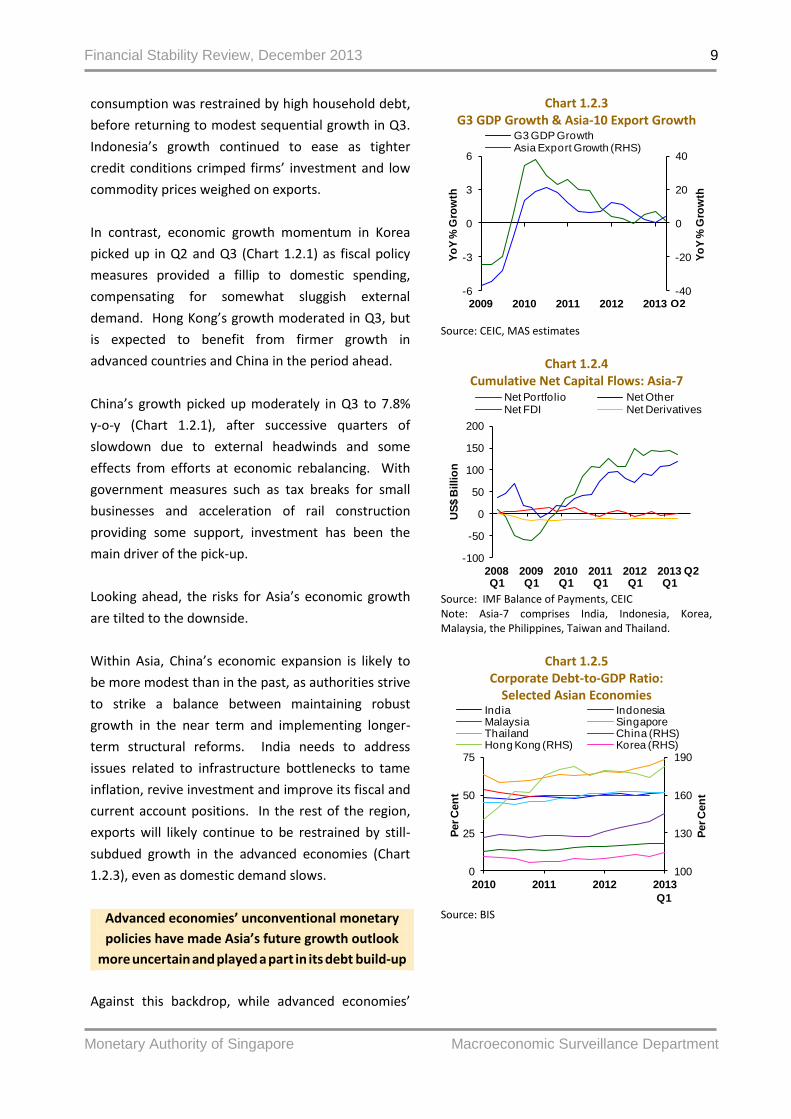
In contrast, economic growth momentum in Korea
picked up in Q2 and Q3 (Chart 1.2.1) as fiscal policy
measures provided a fillip to domestic spending,
compensating for somewhat sluggish external
demand. Hong Kong’s growth moderated in Q3, but
is expected to benefit from firmer growth in
advanced countries and China in the period ahead.
China’s growth picked up moderately in Q3 to 7.8%
y-o-y (Chart 1.2.1), after successive quarters of
slowdown due to external headwinds and some
effects from efforts at economic rebalancing. With
government measures such as tax breaks for small
businesses and acceleration of rail construction
providing some support, investment has been the
main driver of the pick-up.
Looking ahead, the risks for Asia’s economic growth
are tilted to the downside.
Within Asia, China’s economic expansion is likely to
be more modest than in the past, as authorities strive
to strike a balance between maintaining robust
growth in the near term and implementing longer-
term structural reforms. India needs to address
issues related to infrastructure bottlenecks to tame
inflation, revive investment and improve its fiscal and
current account positions. In the rest of the region,
exports will likely continue to be restrained by still-
subdued growth in the advanced economies (Chart
1.2.3), even as domestic demand slows.
Advanced economies’ unconventional monetary
policies have made Asia’s future growth outlook
more uncertain and played a part in its debt build-up
Against this backdrop, while advanced economies’
Chart 1.2.3 G3 GDP Growth & Asia-10 Export Growth
Source: CEIC, MAS estimates
Chart 1.2.4
Cumulative Net Capital Flows: Asia-7
Source: IMF Balance of Payments, CEIC Note: Asia-7 comprises India, Indonesia, Korea, Malaysia, the Philippines, Taiwan and Thailand.
Chart 1.2.5
Corporate Debt-to-GDP Ratio: Selected Asian Economies
Source: BIS
-40
-20
0
20
40
-6
-3
0
3
6
2009 2010 2011 2012 2013
Yo
Y %
Gro
wth
Yo
Y %
Gro
wth
G3 GDP Growth Asia Export Growth (RHS)
Q2
-100
-50
0
50
100
150
200
2008Q1
2009Q1
2010Q1
2011Q1
2012Q1
2013Q1
US
$ B
illio
n
Net Portfolio Net OtherNet FDI Net Derivatives
Q2
100
130
160
190
0
25
50
75
2010 2011 2012 2013
Per C
en
t
Per C
en
t
India IndonesiaMalaysia SingaporeThailand China (RHS)Hong Kong (RHS) Korea (RHS)
Q1
Financial Stability Review, December 2013
Monetary Authority of Singapore Macroeconomic Surveillance Department
10
UMP have helped bolster global economic growth in
the near term, they have also made Asia’s future
growth outlook more uncertain and played a part in
the build-up of debt within the region.
UMP have made it more difficult to gauge whether
advanced economies’ trend growth is now
structurally lower compared to pre-crisis levels.
There is hence less clarity over the support which
Asian economies can expect to get from the demand
recovery in advanced economies.
UMP have also underpinned abundant global liquidity
and risk appetite. Together with record low interest
rates in Asia, these have contributed to capital
inflows and the build-up of private sector debt in
several parts of the region.
In recent years, Asia, along with other EM regions,
received substantial financial flows in a global search
for yield. Much of these inflows were in the form of
portfolio and other investment flows (Chart 1.2.4),
widely regarded as shorter-term in nature.
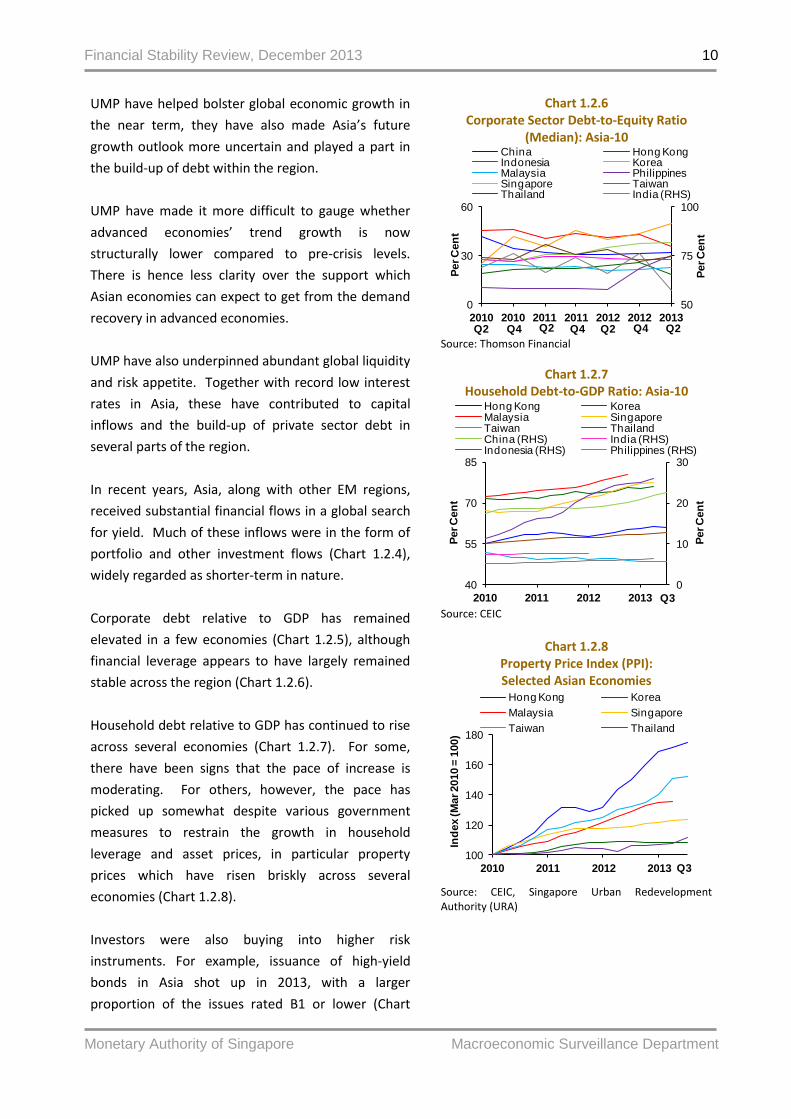
Corporate debt relative to GDP has remained
elevated in a few economies (Chart 1.2.5), although
financial leverage appears to have largely remained
stable across the region (Chart 1.2.6).
Household debt relative to GDP has continued to rise
across several economies (Chart 1.2.7). For some,
there have been signs that the pace of increase is
moderating. For others, however, the pace has
picked up somewhat despite various government
measures to restrain the growth in household
leverage and asset prices, in particular property
prices which have risen briskly across several
economies (Chart 1.2.8).
Investors were also buying into higher risk
instruments. For example, issuance of high-yield
bonds in Asia shot up in 2013, with a larger
proportion of the issues rated B1 or lower (Chart
Chart 1.2.6 Corporate Sector Debt-to-Equity Ratio
(Median): Asia-10
Source: Thomson Financial
Chart 1.2.7 Household Debt-to-GDP Ratio: Asia-10
Source: CEIC
Chart 1.2.8
Property Price Index (PPI): Selected Asian Economies
Source: CEIC, Singapore Urban Redevelopment Authority (URA)
50
75
100
0
30
60
2010 2010 2011 2011 2012 2012 2013
Per C
en
t
Per C
en
t
China Hong KongIndonesia KoreaMalaysia PhilippinesSingapore TaiwanThailand India (RHS)
Q2 Q4 Q2 Q4 Q2 Q4 Q2
0
10
20
30
40
55
70
85
2010 2011 2012 2013
Per C
en
t
Per C
en
t
Hong Kong KoreaMalaysia SingaporeTaiwan Thailand China (RHS) India (RHS)Indonesia (RHS) Philippines (RHS)
Q3
100
120
140
160
180
2010 2011 2012 2013
Ind
ex (M
ar 2010 =
100)
Hong Kong Korea
Malaysia Singapore
Taiwan Thailand
Q3

Financial Stability Review, December 2013
Monetary Authority of Singapore Macroeconomic Surveillance Department
11
1.2.9). Further, Moody’s reported that many issuers
were able to refinance at lower rates (Chart 1.2.10)
Interest in Asian real estate investment trusts (REITs)
also grew, with the market capitalisation of Asian
REITs growing by 67% between 2010 and 2013 (Chart
1.2.11).
Meanwhile, some fiscal measures taken by
authorities to bolster growth are not without risks
Meanwhile, some fiscal measures taken by
authorities in different parts of Asia to bolster growth
and help lower-income groups are not without risks.
For example, some subsidies and assistance
programmes have contributed to increases in public
debts relative to GDP (Chart 1.2.12) but may not help
strengthen growth drivers in future. For China, while
central government finances appear sound,
estimates drawing from official sources indicate that
local government debt has more than doubled since
2007, rising to 23% of GDP (Chart 1.2.13).
The unusual combination of factors
making it possible for economic growth to hold up
and debt-servicing burdens to remain manageable
could soon change
The unusual combination of factors making it
possible for growth in Asia to hold up and debt-
servicing burdens to remain manageable could soon
change.
The US Federal Reserve plans to begin normalising its
monetary conditions when economic and financial
conditions justify such a move, through tapering its
LSAP. In the euro zone, while the ECB has committed
to keeping interest rates low for an extended period
of time, it could still raise rates earlier than expected
should the economic recovery there pick up speed.
While the start of policy normalisation is expected to
coincide with firmer growth recovery in the advanced
economies, the benefits of such a recovery would
Chart 1.2.9 Moody’s Rated Asian High-Yield Bond Issuance:
Ratings Composition
Source: Moody’s
Chart 1.2.10 Moody’s Rated Asian High-Yield Bond Issuance:
Weighted Average Coupons
Source: Moody’s
Chart 1.2.11
Market Capitalisation of Asian REITs
Source: Bloomberg
0
3
6
9
12
15
2010Q1
2010Q3
2011Q1
2011Q3
2012Q1
2012Q3
2013Q1
2013Q3
US
$ B
illio
n
Ba1 Ba2 Ba3 B1 B2 B3 and below
48%rated in
B-
category
Oct
32%rated in
B-
category
43%rated in
B-
category
52%rated in
B-
category
0.0
2.5
5.0
7.5
10.0
12.5
0
5
10
15
20
25
2010 2011 2012 2013Oct
ytd
Per C
en
t / Y
ears
US
$ B
illio
nRated Bond IssuanceAverage Face AmountWeighted Average Coupon (RHS)Average Tenor (RHS)
0
30
60
90
2010 2011 2012 2013
US
$ B
illio
n
Sep

Financial Stability Review, December 2013
Monetary Authority of Singapore Macroeconomic Surveillance Department
12
take some time to filter through to Asia.
Furthermore, growth in advanced economies could
soften again after the start of policy normalisation if
unanticipated shocks occur.
Therefore, debt-servicing burdens in Asia could well
rise markedly even as the region’s growth outlook
remains subject to considerable uncertainty. As
financial conditions tighten globally and interest rates
rise, the private sector’s resilience will be tested.
Sovereign balance sheets may also come under
greater scrutiny.
Tighter financial conditions and volatile capital
flows likely ahead, and impact could be uneven
Looking ahead, Asia – like other EM regions – is likely
to face tighter financial conditions and volatile capital
flows. This is an unavoidable part of the necessary
path to more normalised global monetary conditions.
The impact of these financial stresses could be
uneven, as shown by the market turbulence in recent
months.
In recent years, Asia, along with other EM regions,
received substantial financial flows in a global search
for yield. This trend was boosted by ample global
liquidity, as well as a general sentiment that Asia had
sound fundamentals and would remain resilient to
shocks.
From late-May 2013 onward, the prospect of the US
starting LSAP tapering led to an abrupt shift in
sentiment towards EMEs, including Asia. For several
weeks, financial conditions tightened across Asia and
stresses emerged in several areas.
Differentiation between markets within the region
was quite stark. Dips were sharpest for stock
markets which had rallied the most when risk
appetite was strong, and for countries perceived as
relatively more susceptible to adverse external
shocks due to certain vulnerabilities such as
Chart 1.2.12 Public Debt-to-GDP Ratio: Selected Asian Economies
Source: IMF, CEIC
Chart 1.2.13 China Local Government Debt
Source: MAS’ estimates based on findings by China National Audit Office (NAO)
50
55
60
65
70
10
20
30
40
50
2010 2011 2012
Per C
en
t
Per C
en
t
China Hong KongIndonesia KoreaPhilippines ThailandIndia (RHS) Malaysia (RHS)
15
20
25
30
0
5
10
15
2007 2008 2009 2010 2011 2012
Per C
en
t
RM
B T
rillio
n
Local Government Debt
Total Local Government Debt/ GDP (RHS)

Financial Stability Review, December 2013
Monetary Authority of Singapore Macroeconomic Surveillance Department
13
persistent and sizeable current account deficits, fiscal
deficits and/or external (re)financing needs (Chart
1.2.14). On a cumulative basis, net fund outflows
from Asia-10 equities amounted to US$27.7 billion
(Chart 1.2.15) over the five months between late May
and late October, reversing close to half of the net
fund inflows since 2012.
Similarly, investor sentiment turned quickly in the
bond markets. Concerns that credit spreads might
have become too narrow and that there could be too
much supply in both the investment-grade and high-
yield markets rapidly came to the fore, and persisted
over several weeks. Market conditions tightened
markedly. According to market sources, prospects of
higher rates and yields in the near future doused
what had until very recently been strong investor
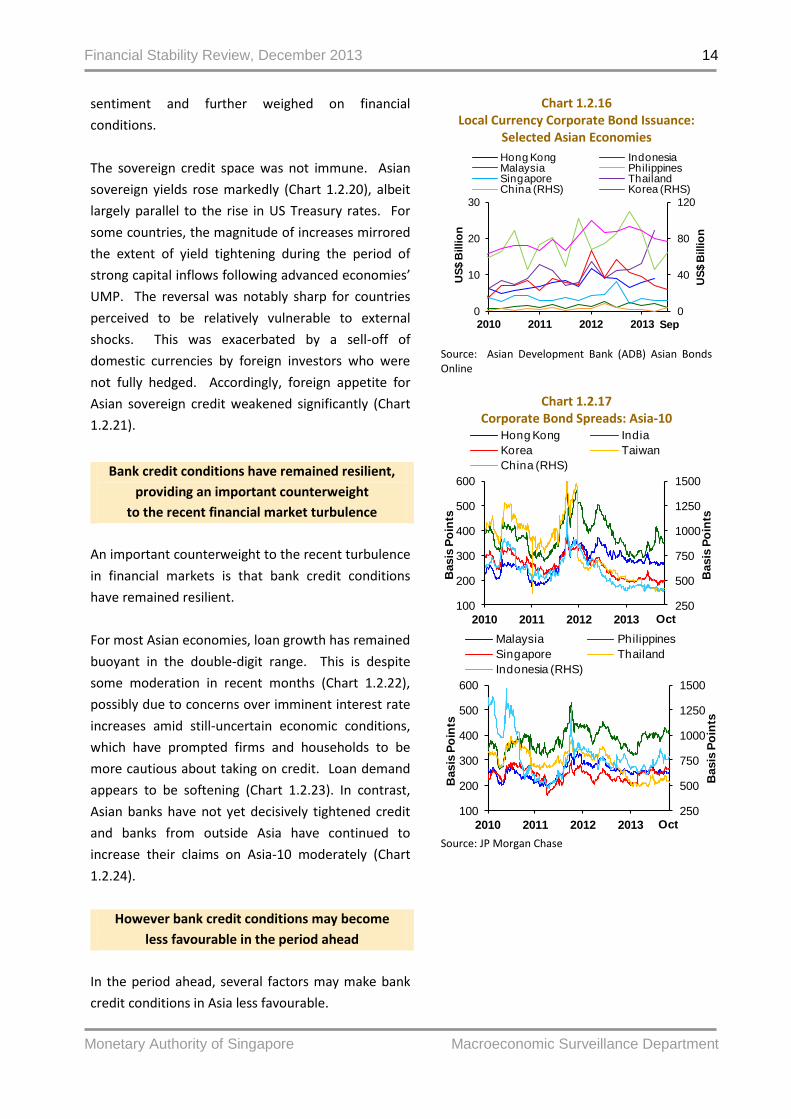
demand and issuer appetite. Issuance activity for
local-currency corporate bonds – which make up the
bulk of the outstanding stock across Asia – weakened
for quite a few countries between June and
September (Chart 1.2.16). Credit spreads widened in
several instances (Chart 1.2.17), while various
accounts suggested that some investors became
more inclined towards tightening covenants.
Meanwhile, currencies depreciated to varying
degrees (Chart 1.2.18). While economic
fundamentals across the region have remained
generally sound, those economies perceived to be
relatively more susceptible to adverse external
shocks came under heavier selling pressure. Some
currencies hit troughs against the US dollar which
had not been seen since the most severe phase of
the GFC.
For some economies with a substantial or rising
proportion of corporate bonds denominated in
foreign currency (Chart 1.2.19), risk aversion was
compounded by concerns that prolonged currency
depreciation could sharply increase debt repayment
burdens for borrowers, weaken firms, and result in
more defaults. This in turn perpetuated negative
Chart 1.2.14 Stock Market Indices: Asia-10
Source: Bloomberg
Chart 1.2.15 Cumulative Net Fund Flows: Asia-10
Source: EPFR
40
60
80
100
120
140
2010 2011 2012 2013
Ind
ex (1 J
an
2010 =
100)
China Hong KongIndia KoreaTaiwan
Nov
60
100
140
180
220
260
2010 2011 2012 2013
Ind
ex (1 J
an
2010 =
100)
Indonesia Malaysia
Philippines Singapore
Thailand
Nov
0
20
40
60
80
100
2010 2011 2012 2013
US
$ B
illio
n
Equity Debt
Oct
Financial Stability Review, December 2013
Monetary Authority of Singapore Macroeconomic Surveillance Department
14
sentiment and further weighed on financial
conditions.
The sovereign credit space was not immune. Asian
sovereign yields rose markedly (Chart 1.2.20), albeit
largely parallel to the rise in US Treasury rates. For
some countries, the magnitude of increases mirrored
the extent of yield tightening during the period of
strong capital inflows following advanced economies’
UMP. The reversal was notably sharp for countries
perceived to be relatively vulnerable to external
shocks. This was exacerbated by a sell-off of
domestic currencies by foreign investors who were
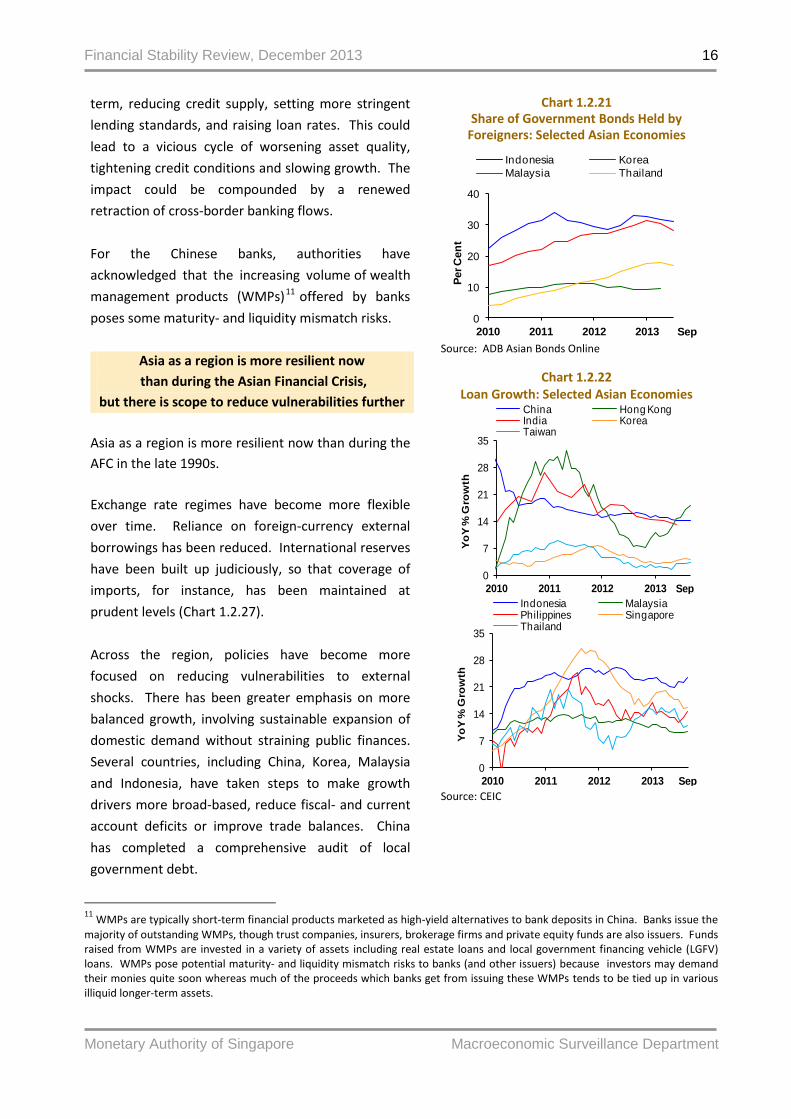
not fully hedged. Accordingly, foreign appetite for
Asian sovereign credit weakened significantly (Chart
1.2.21).
Bank credit conditions have remained resilient,
providing an important counterweight
to the recent financial market turbulence
An important counterweight to the recent turbulence
in financial markets is that bank credit conditions
have remained resilient.
For most Asian economies, loan growth has remained
buoyant in the double-digit range. This is despite
some moderation in recent months (Chart 1.2.22),
possibly due to concerns over imminent interest rate
increases amid still-uncertain economic conditions,
which have prompted firms and households to be
more cautious about taking on credit. Loan demand
appears to be softening (Chart 1.2.23). In contrast,
Asian banks have not yet decisively tightened credit
and banks from outside Asia have continued to
increase their claims on Asia-10 moderately (Chart
1.2.24).
However bank credit conditions may become
less favourable in the period ahead
In the period ahead, several factors may make bank
credit conditions in Asia less favourable.
Chart 1.2.16 Local Currency Corporate Bond Issuance:
Selected Asian Economies
Source: Asian Development Bank (ADB) Asian Bonds Online
Chart 1.2.17
Corporate Bond Spreads: Asia-10
Source: JP Morgan Chase
0
40
80
120
0
10
20
30
2010 2011 2012 2013
US
$ B
illio
n
US
$ B
illio
n
Hong Kong IndonesiaMalaysia PhilippinesSingapore ThailandChina (RHS) Korea (RHS)
Sep
250
500
750
1000
1250
1500
100
200
300
400
500
600
2010 2011 2012 2013
Basis
Po
ints
Basis
Po
ints
Hong Kong India
Korea Taiwan
China (RHS)
Oct
250
500
750
1000
1250
1500
100
200
300
400
500
600
2010 2011 2012 2013
Basis
Po
ints
Basis
Po
ints
Malaysia Philippines
Singapore Thailand
Indonesia (RHS)
Oct

Financial Stability Review, December 2013
Monetary Authority of Singapore Macroeconomic Surveillance Department
15
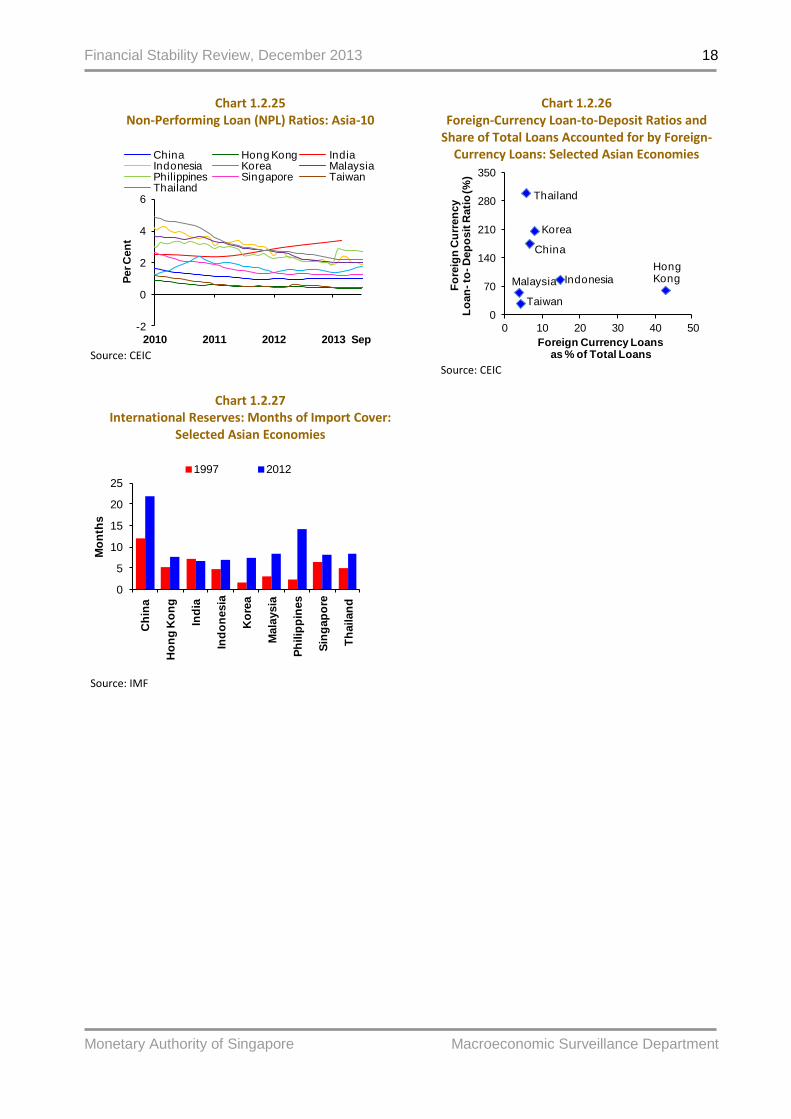
Credit quality deterioration has not materialised in a
broad-based manner so far, with notable increases in
banking-system non-performing loan (NPL) ratios
confined to India, Korea and the Philippines (Chart
1.2.25). However, some banks have reportedly
exercised greater “forbearance” towards certain
borrowers, in anticipation that an improvement in
economic conditions next year or a cyclical turn for
certain industries would enable these borrowers to
realise healthier incomes streams and repay their
loans.
In the meantime, some signs of strains have already
emerged in various sectors across different
economies. These range from small and medium-
sized enterprises (SMEs) in China, Korea and Malaysia
to utility firms and shipbuilders in Korea, as well as
borrowers from the aviation, textile and telecoms
industries in India.
Individually, some banks may have sizeable cross-
border exposures to borrowers whose capacities to
repay foreign currency-denominated debt have been
weakened by prolonged depreciation of their
domestic currencies.
In the coming months, alongside the possibility of
further increases in NPLs, funding conditions may
tighten for some banks as global financial conditions
change.
Furthermore, although foreign-currency loans
account for quite a small share of total loans for most
Asian banking systems, the corresponding loan-to-
deposit (LTD) ratios are quite high for several
economies (Chart 1.2.26). Banks in these economies
could come under foreign-currency funding pressure
if wholesale markets tighten alongside volatile capital
flows.
If global financial conditions tighten abruptly, and
especially if loan defaults rise, some Asian banks
could react by holding more liquid assets in the near
Chart 1.2.18 Currency Indices: Selected Asian Economies
Source: Bloomberg
Chart 1.2.19 Foreign Currency-Denominated Corporate
Bonds as a Share of Total Outstanding: Selected Asian Economies
Source: ADB Asian Bonds Online Chart 1.2.20
Sovereign Bond Yields: Asia-10
Source: Bloomberg
40
60
80
100
120
2008 2009 2010 2011 2012 2013
Ind
ex (1 J
an
2008 =
100)
India IndonesiaKorea MalaysiaPhilippines Thailand
Nov
0
20
40
60
80
2010 2011 2012 2013
Per C
en
t
China Hong KongIndonesia KoreaMalaysia PhilippinesSingapore Thailand
Q2
5
6
7
8
9
10
0.0
1.5
3.0
4.5
6.0
7.5
2010 2011 2012 2013
Per C
en
t
Per C
en
t
China Hong KongKorea TaiwanIndia (RHS)
Nov
0
4
8
12
0
2
4
6
2010 2011 2012 2013
Per C
en
t
Per C
en
t
Malaysia Singapore
Thailand Indonesia (RHS)
Philippines (RHS)
Nov
Financial Stability Review, December 2013
Monetary Authority of Singapore Macroeconomic Surveillance Department
16
11
WMPs are typically short-term financial products marketed as high-yield alternatives to bank deposits in China. Banks issue the
majority of outstanding WMPs, though trust companies, insurers, brokerage firms and private equity funds are also issuers. Funds raised from WMPs are invested in a variety of assets including real estate loans and local government financing vehicle (LGFV) loans. WMPs pose potential maturity- and liquidity mismatch risks to banks (and other issuers) because investors may demand their monies quite soon whereas much of the proceeds which banks get from issuing these WMPs tends to be tied up in various illiquid longer-term assets.
term, reducing credit supply, setting more stringent
lending standards, and raising loan rates. This could
lead to a vicious cycle of worsening asset quality,
tightening credit conditions and slowing growth. The
impact could be compounded by a renewed
retraction of cross-border banking flows.
For the Chinese banks, authorities have
acknowledged that the increasing volume of wealth
management products (WMPs)11 offered by banks
poses some maturity- and liquidity mismatch risks.
Asia as a region is more resilient now
than during the Asian Financial Crisis,
but there is scope to reduce vulnerabilities further
Asia as a region is more resilient now than during the
AFC in the late 1990s.
Exchange rate regimes have become more flexible
over time. Reliance on foreign-currency external
borrowings has been reduced. International reserves
have been built up judiciously, so that coverage of
imports, for instance, has been maintained at
prudent levels (Chart 1.2.27).
Across the region, policies have become more
focused on reducing vulnerabilities to external
shocks. There has been greater emphasis on more
balanced growth, involving sustainable expansion of
domestic demand without straining public finances.
Several countries, including China, Korea, Malaysia
and Indonesia, have taken steps to make growth
drivers more broad-based, reduce fiscal- and current
account deficits or improve trade balances. China
has completed a comprehensive audit of local
government debt.
Chart 1.2.21
Share of Government Bonds Held by Foreigners: Selected Asian Economies
Source: ADB Asian Bonds Online
Chart 1.2.22 Loan Growth: Selected Asian Economies
Source: CEIC
0
10
20
30
40
2010 2011 2012 2013
Per C
en
t
Indonesia Korea
Malaysia Thailand
Sep
0
7
14
21
28
35
2010 2011 2012 2013
Yo
Y %
Gro
wth
China Hong KongIndia KoreaTaiwan
Sep
0
7
14
21
28
35
2010 2011 2012 2013
Yo
Y %
Gro
wth
Indonesia MalaysiaPhilippines SingaporeThailand
Sep

Financial Stability Review, December 2013
Monetary Authority of Singapore Macroeconomic Surveillance Department
17
Some countries have taken measures to check
increases in household- and corporate sector
leverage, and cushion adverse effects from potential
fallouts. For example, Korea’s financial regulators
have been working with banks on ways to improve
risk assessments of more heavily-indebted corporate
borrowers and loan-restructuring. Some authorities,
including those in Hong Kong and Indonesia, have
taken measures to cool property markets, which
would also help curb household leverage.
Finally, some countries have taken action to mitigate
potential strains from global liquidity tightening.
Authorities in China and other countries have
reminded banks to manage liquidity risks while
indicating their readiness to ensure that funding
markets function smoothly. Some central banks have
extended swap lines. The Reserve Bank of India (RBI)
has adjusted its earlier liquidity tightening measures,
imposed more restrictions on imports of non-
essential items, and liberalised external financing
(including raising overseas borrowing limits for
banks) to help stabilise the rupee.
Looking ahead, more progress in implementing
policies for improving economic and financial system
fundamentals will strengthen the resilience of
individual countries, as well as the entire region by
reducing the likelihood of cross-border contagion.
Chart 1.2.23 Credit Standards and Loan Demand
in Emerging Asia
Source: Institute of International Finance (IIF) Note: “Emerging Asia” includes China, India, Indonesia, Korea, Malaysia, the Philippines and Thailand. The diffusion index captures the average value of responses of all the banks in a region to each question in a survey. A diffusion index reading of 50 should be interpreted as a neutral reading; a reading above 50 indicates rising loan demand and vice versa.
Chart 1.2.24
Cross-Border Bank Claims on Asia-10
Global Bank Claims
Euro Zone Bank Claims
Source: BIS Note: “Others” include Indonesia, Malaysia, Thailand and the Philippines.
30
40
50
60
70
2010 Q1
2011 Q1
2012Q1
2013 Q1
Dif
fusio
n In
dex
Credit Standards Demand for Loans
Q3
0
700
1400
2100
2800
2010 2011 2012 2013
US
$ B
illio
n
China Hong Kong IndiaKorea Singapore Taiwan Others
Q2
0
150
300
450
2010 2011 2012 2013
US
$ B
illio
n
China Hong Kong IndiaKorea Singapore TaiwanOthers
Q2
Financial Stability Review, December 2013
Monetary Authority of Singapore Macroeconomic Surveillance Department
18
Chart 1.2.25 Non-Performing Loan (NPL) Ratios: Asia-10
Source: CEIC
Chart 1.2.27
International Reserves: Months of Import Cover: Selected Asian Economies
Source: IMF
Chart 1.2.26 Foreign-Currency Loan-to-Deposit Ratios and
Share of Total Loans Accounted for by Foreign-Currency Loans: Selected Asian Economies
Source: CEIC
-2
0
2
4
6
2010 2011 2012 2013
Per C
en
t
China Hong Kong IndiaIndonesia Korea MalaysiaPhilippines Singapore TaiwanThailand
Sep
0
5
10
15
20
25
Ch
ina
Ho
ng
Ko
ng
Ind
ia
Ind
on
esia
Ko
rea
Mala
ysia
Ph
ilip
pin
es
Sin
gap
ore
Th
ailan
d
Mo
nth
s
1997 2012
0
70
140
210
280
350
0 10 20 30 40 50
Fo
reig
n C
urr
en
cy
Lo
an
-to
-D
ep
osit
Rati
o (%
)
Foreign Currency Loans as % of Total Loans
Thailand
Malaysia
Taiwan
China
Korea
Indonesia
HongKong

Financial Stability Review, December 2013
Monetary Authority of Singapore Macroeconomic Surveillance Department
19
Box B
Intermediating Banking Flows in Asia
Singapore hosts a rising amount of intra-region bank credit intermediation Singapore hosts a large number of banks for which cross-border credit intermediation has been a key activity.
Much of this activity is intra-Asia. Asia12 (excluding Singapore) is the source of about half of the cross-border
deposits and also the destination for the bulk of the cross-border loans (65% as of September 2013)
intermediated by banks in Singapore.
The nature of the risks which cross-border banking activity poses to Singapore’s banking system is changing as banks’ business models evolve Some banks’ business models have evolved over the past several years since the GFC. For example, before the
GFC, some banks tended to rely on interbank funding. Since the GFC, recurrent concerns over counterparty
credit risks have prompted some of these banks to depend more on cross-border intra-group funding to
underpin the expansion of their non-bank loans to the region. Further, UMP could have played a role in
keeping banking flows to Asia buoyant – with interest rates and yields kept low in advanced economies,
investors’ search for yield has centred on EMEs, including Asia.
With evolving business models, the nature of the risks that Singapore’s banking system faces from its cross-
border activities also changes over time. External shocks can be transmitted through several channels.
Firstly, adverse shocks which arise from or affect the home country of foreign banks in Singapore could lead to
cutbacks in head office funding, and therefore non-bank lending to Asian borrowers.
Secondly, cross-border banking activity may carry greater currency mismatch risk than intra-country lending.
Loans are more likely to be denominated in foreign currencies. Sharp or prolonged depreciation of domestic
currencies may weaken borrowers’ capacities to repay such foreign currency-denominated loans.
Thirdly, in the current environment where the US Federal Reserve is expected to start tapering its LSAP as a first
step to normalising monetary conditions, pronounced shifts in interest rate or yield gaps between the advanced
world and emerging Asia could lead to unexpectedly sharp changes in cross-border banking flows.
Banks based in Singapore have been lending more to China and India
Another significant trend is the growing importance of China and India as lending destinations for Singapore’s
banking system, even as they continue to provide material amounts of cross-border funding. The gross flows of
funds (both loans and deposits) post-Lehman between Singapore and China and between Singapore and India
have grown by 85% and 129% respectively, compared to pre-Lehman. However, a key difference is that China,
which was previously a net lender to Singapore, is now a net borrower from Singapore, whereas India has
remained a net borrower.
The total volume of loans (comprising interbank loans, non-bank loans and trade bills) to China has been
trending up since 2009 (Chart B1). During this period, the composition of loans has changed significantly. Since
August 2011, trade bills overtook interbank loans to become the primary contributor of loans to China. As of
September 2013, trade bills accounted for about 65% of total loans from Singapore to China (Chart B2). The
12
Asia includes Australia, Bangladesh, Brunei, Cambodia, China, Hong Kong, India, Indonesia, Japan, Korea, Laos, Macau, Malaysia, Myanmar, Nepal, Pakistan, the Philippines, Singapore, Sri Lanka, Taiwan, Thailand, Vietnam and New Zealand.

Financial Stability Review, December 2013
Monetary Authority of Singapore Macroeconomic Surveillance Department
20
large increase in trade bills over the last two years has come alongside rapid growth of trade between the
economies of the Association of Southeast Asian Nations (ASEAN) and China. Meanwhile, the share accounted
for by non-bank loans has remained relatively stable, standing at about 11% as of September 2013 (Chart B2).
Chart B1 Volume of Loans
from Singapore’s Banking System to China
Chart B2 Composition of Loans to China
Source: MAS Source: MAS
In comparison, although loans to India have similarly trended upward since 2009, the increase tapered off
towards end-2011 (Chart B3). Another key difference between India and China is that non-bank loans have
been the primary driver of the increase in loans to India, and accounted for more than half of all loans to India
as of September 2013 (Chart B4). A third difference is that the increase in volume of trade bills to India has
been more gradual than for China.
Chart B3 Volume of Loans
from Singapore’s Banking System to India
Chart B4 Composition of Loans to India
Source: MAS Source: MAS
With the significant increase in lending to the two countries, loans to China and India now represent 9.2% and
4.2%, respectively, of total loans made by local banking groups13 and foreign banks located in Singapore. For
China, portfolio concentration is higher for local banking groups than for foreign banks, and the divergence has
become more accentuated over the past two years (Chart B5). For India, the reverse is true – portfolio
13
Loan figures for local banking groups are compiled on an ultimate-risk basis, whereas loan figures for foreign banks based in Singapore are compiled on an immediate-borrower basis.
0
300
600
900
1200
1500
2004 2007 2010 2013
Ind
ex (S
ep
2004 =
100)
Sep Sep Sep Sep
0
20
40
60
80
100
2004 2007 2010 2013
Per C
en
t
Interbank Loans Non-Bank Loans Trade Bills
Sep Sep Sep Sep
0
100
200
300
400
500
600
2004 2007 2010 2013
Ind
ex ( S
ep
2004= 1
00)
Sep Sep Sep Sep
0
20
40
60
80
100
2004 2007 2010 2013
Per C
en
t
Interbank Loans Non-Bank Loans Trade Bills
Sep Sep Sep Sep

Financial Stability Review, December 2013
Monetary Authority of Singapore Macroeconomic Surveillance Department
21
concentration has been higher for foreign banks than for local banking groups (Chart B6). MAS’ analysis
indicates that some of the largest India-related borrowers are from the manufacturing sector as well as the
financial institutions sector. The largest Chinese borrowers are from the general commerce and transport,
storage and communication (TSC) sectors.
Chart B5 Portfolio Concentration of Loans to China
by Bank Type
Chart B6 Portfolio Concentration of Loans to India
by Bank Type
Source: MAS Source: MAS
Banks need to manage the risk implications of their growing exposures to China and India
The risk implications of the growing credit exposures to China and India need to be seen in the context of the
rising economic and financial importance of both countries, uncertain economic growth prospects, possibility of
financial conditions tightening ahead, and country-specific factors. Even as banks expand their businesses, they
need to take active steps to understand and manage the attendant risks.
For example, as advanced economies progress towards policy normalisation, global interest rates will likely rise
from current record lows and funding conditions could tighten. Cross-border banking flows may then increase
at a slower rate or even contract. Domestic banks in Asia may also tighten credit to conserve liquidity and
manage asset quality risks. Banks and non-bank borrowers that have managed their financial risks prudently
will be more resilient to potential stresses arising from such developments.
0
4
8
12
16
2010 2011 2012 2013
Per C
en
t
Local Banking Groups Foreign Banks
Sep Sep Sep Sep
0
2
4
6
8
2010 2011 2012 2013
Per C
en
t
Local Banking Groups Foreign Banks
Sep Sep Sep Sep

Financial Stability Review, December 2013
Monetary Authority of Singapore Macroeconomic Surveillance Department
22
Box C
Potential Impact of Abenomics on Asia: Boon or Bane?
Japan and Asia-10 economies have long had strong trade and investment links. The advent of Abenomics14
along with new quantitative easing programmes in Japan raises the question of how these policies would
impact different parts of Asia. If Abenomics does bring about a sustained economic recovery in Japan, would
linkages between Japan and Asia become more or less extensive? Could new impact transmission channels be
formed? And would the impact of Abenomics – including potential risks – on different parts of the region vary
significantly?
Japan has close trade and financial linkages with Asia
Japan is among the top trading partners for each of the Asia-10 economies. Exports to Japan are particularly
important for the Southeast Asian economies of the Philippines, Indonesia, Malaysia and Thailand, accounting
for more than 10% of the exports of each of these economies (Chart C1). In addition, financial flows from
Japan to the region have increased sharply following the most severe phase of the GFC, partially fuelled by the
strength of the Japanese yen. From 2010 to 2012, net financial flows to Asia-10 economies from Japan totalled
34.2 trillion yen (Chart C2) and accounted for approximately 16% of Asia-10’s total gross financial inflows.15
Since 2010, Japan has been a significant contributor of inward foreign direct investment (FDI) to Asia-10
economies, particularly to Thailand, the Philippines and Korea where they account for more than 20% of the
inward FDI (Chart C3). In 2012, about two-thirds of Japan’s FDI in Asia-10 were to the manufacturing sector.
Chart C1 Chart C2
Trade Linkages with Japan: Asia-10 (2012)
Cumulative Financial Flows from Japan to Asia-10
Source: CEIC
Note: The sizes of the bubbles indicate the dollar amounts of
exports in 2012.
Source: BOJ
14
The BOJ introduced a “Quantitative and Qualitative Easing” programme in April 2013, which increased its purchases of different types of assets including money market securities, JGBs, ETFs and Japanese real estate investment trusts (J-REITs). The goal was to expand the monetary base at an annual pace of 50-60 trillion yen and the outstanding amount of JGBs at an annual pace of 50 trillion yen. 15
Figure excludes Malaysia which has not published gross financial inflow numbers for 2010-2012.
0
2
4
6
8
10
0 4 8 12 16 20
% o
f G
DP
% of Total Exports
China Hong Kong IndiaIndonesia Korea MalaysiaPhillippines Singapore TaiwanThailand
-10
0
10
20
30
40
50
2000 2003 2006 2009 2012
Tri
llio
n Y
en

Financial Stability Review, December 2013
Monetary Authority of Singapore Macroeconomic Surveillance Department
23
Chart C3 Average FDI from Japan as a Share of
Total Inward FDI (2010-2012 Average): Asia-10*
Source: CEIC, national authorities
*Excludes 2012 for Singapore and Hong Kong
Japanese banks have also increased lending to Asia-10 economies
Japanese banks have more than doubled their cross-border claims on Asia-10 economies (Chart C4), from
US$158 billion as at Q1 2009 to US$339 billion as at Q1 2013. Within Asia-10 economies, Japanese banks
account for material shares of domestic credit in Thailand, Singapore and Indonesia (Chart C5).
Chart C4 Bank Claims by Japanese Banks and Syndicated
Loans Arranged by Japanese Megabanks: Asia-10*
Chart C5 Share of Economies’ Banking Assets
Accounted for by Japanese Banks 2012*: Asia-10
Source: BIS, Bloomberg *Loans arranged by Sumitomo Mitsui Financial Group, Mitsubishi UFJ Financial and Mizuho Financial Group – major Japanese banks that are active in the international market.
Source: BIS, CEIC, national authorities *Data for India is as of March 2012, the last available data point.
Japanese banks are known to have followed their corporate clients into Asia-10. A large part of Japanese banks’
loans in Asia are to the overseas affiliates of Japanese companies. Post-GFC, Japanese banks have also
increased lending to non-Japanese corporates. This has helped ameliorate the impact of a pullback by
European banks (Chart 1.2.24) in the region. This trend is reflected especially in the rapid growth of syndicated
loans by Japanese banks – which primarily go to large corporate borrowers in Asia-10, with the volume of such
loans rising more quickly than Japanese banks’ total claims on Asia-10 (Chart C4).
0
10
20
30
40
50T
hailan
d
Ph
ilip
pin
es
Ko
rea
Mala
ysia
Taiw
an
Ind
ia
Sin
gap
ore
Ind
on
esia
Ch
ina
Ho
ng
Ko
ng
Per C
en
t
Average across Asia-10
0
6
12
18
24
30
0
70
140
210
280
350
2006 2008 2010 2012
US
$ B
illio
n
US
$ B
illio
n
Japanese Banks' Claims on Asia-10
Japanese Banks' Syndicated Loans (RHS)
0
2
4
6
8
Th
ailan
d
Sin
gap
ore
Ind
on
esia
Ko
rea
Ho
ng
Ko
ng
Mala
ysia
Ph
ilip
pin
es
Ind
ia
Taiw
an
Ch
ina
Per C
en
t
Average across Asia-10

Financial Stability Review, December 2013
Monetary Authority of Singapore Macroeconomic Surveillance Department
24
As a regional financial centre, Singapore intermediates funds to Asia from other regions, with 65% of the
banking system’s cross-border loans going towards Asia. In particular, loans to emerging Asia16 accounted for
almost 50% of the cross-border loans by the Singapore banking system at end-2012. For Japanese banks in
particular, Singapore serves as a regional hub to deploy funds from Japan to the rest of Asia. In 2012, 49.3% of
the gross financial outflows from Japan to Asia-10 were channelled through Singapore.
In comparison, portfolio flows from Japan to Asia-10 economies remain small
Relative to FDI and banking flows, portfolio flows from Japan to the rest of the region have remained small.
Japan accounted for an average of 1.4% of portfolio inflows to Asia-10 economies between 2010 and 2012
(Chart C6). Bond investments out of Japan have largely gone to North America and Europe. From 2010 to
2012, Asia accounted for 2.4% of Japan’s outward portfolio investments. In contrast, the US accounted for 37%
and Europe accounted for 17%.
Chart C6
Gross Portfolio Inflows to Asia-10 (2010-2012)
Source: BOJ, IMF Balance of Payments
Japan’s extensive linkages with Asia-10 carry both potential benefits and risks for economies in the region
The close trade and financial linkages between Japan and Asia-10 economies have the potential to benefit these
economies should Japan’s economic recovery pick up. A firm economic recovery for Japan could lead to
increased trade with and greater direct investment in Asia-10 economies, which would have a positive impact
on economic growth and employment in Asia-10. A sustained growth uplift in Japan should lead to an
expansion of Japanese production activity and investments in Asia-10, as Japanese companies set up more
operations in different parts of the region as a means to meet Japan’s domestic demand.
In contrast to the recent volatility in Asia-10 financial markets following the US Federal Reserve’s indication that
it could soon start tapering its LSAP, an economic recovery and attendant rollback of monetary loosening
measures in Japan would probably not have a significant negative impact on Asia-10 markets. This is because
portfolio flows from Japan to Asia-10 have been relatively small (Chart C6).
Conversely, the continued banking and FDI flows from Japan to Asia-10 are supported by economic and
demographic fundamentals, and may partly mitigate the effects of a withdrawal of funds from Asian markets
upon policy normalisation in the US and Europe. Notwithstanding an economic recovery in Japan, the effects of
Japan’s aging population might not be easily reversed, and Asia would likely remain an attractive destination for
16
Emerging Asia is defined here as Bangladesh, Brunei, Cambodia, China, Hong Kong, India, Indonesia, Korea, Laos, Macau, Malaysia, Myanmar, Nepal, Pakistan, Philippines, Sri Lanka, Taiwan, Thailand and Vietnam.
-20
0
20
40
60
80
100
Ch
ina
Ko
rea
Ho
ng
Ko
ng
Ind
ia
Mala
ysia
Ind
on
esia
Th
ailan
d
Ph
ilip
pin
es
Taiw
an
Sin
gap
ore
US
$ B
illio
n
Gross Portfolio Inflows Japan's Portion

Financial Stability Review, December 2013
Monetary Authority of Singapore Macroeconomic Surveillance Department
25
financial flows from Japan.
Nonetheless, some risks exist. Authorities in Asia-10 need to guard against the risk of any further build-up of
financial imbalances in the region alongside what has already been fuelled by other advanced economies’ UMP.
Any excessive dependence on financial flows from Japan could have risk implications should there be
intermittent stops in these flows, for example, due to temporary weaknesses in the yen.
There could also be increased risks to the region should Japan’s economic recovery slow or stall, and cause
Japanese banks to pull back their lending to the region. Nonetheless, the impact of any potential credit
withdrawal by the Japanese banks would be tempered by their lending profile. Japanese banks have thus far
tended to lend to Japanese companies and large Asian firms (Chart C4). These companies would be in better
positions to find alternate sources of funding than SMEs should a loss of confidence in Japan’s recovery put
pressure on the health of Japanese banks and lead them to cut back lending to Asia-10.
Abenomics in Japan will bring both potential benefits as well as potential risks to Asia-10 economies
Looking ahead, bank lending and foreign direct investment will probably continue to drive investment flows
between Japan and the region. Asia-10 economies look likely to benefit from their substantial and growing
economic and financial linkages with Japan. However, these linkages may pose risks regardless of whether
Abenomics succeeds in bringing about a sustained economic recovery in Japan. How these linkages change
over time should be closely watched, and the attendant risks carefully managed.
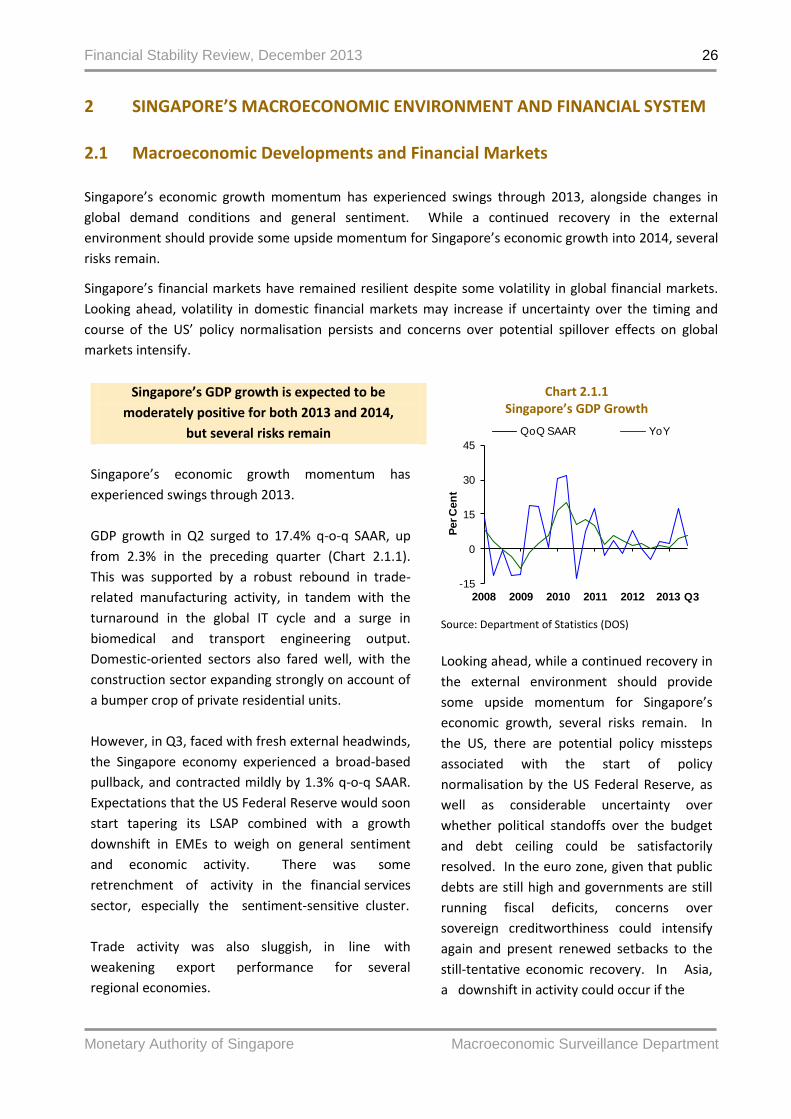
Financial Stability Review, December 2013
Monetary Authority of Singapore Macroeconomic Surveillance Department
26
2 SINGAPORE’S MACROECONOMIC ENVIRONMENT AND FINANCIAL SYSTEM
2.1 Macroeconomic Developments and Financial Markets
Singapore’s economic growth momentum has experienced swings through 2013, alongside changes in
global demand conditions and general sentiment. While a continued recovery in the external
environment should provide some upside momentum for Singapore’s economic growth into 2014, several
risks remain.
Singapore’s financial markets have remained resilient despite some volatility in global financial markets.
Looking ahead, volatility in domestic financial markets may increase if uncertainty over the timing and
course of the US’ policy normalisation persists and concerns over potential spillover effects on global
markets intensify.
Singapore’s GDP growth is expected to be
moderately positive for both 2013 and 2014,
but several risks remain
Singapore’s economic growth momentum has
experienced swings through 2013.
GDP growth in Q2 surged to 17.4% q-o-q SAAR, up
from 2.3% in the preceding quarter (Chart 2.1.1).
This was supported by a robust rebound in trade-
related manufacturing activity, in tandem with the
turnaround in the global IT cycle and a surge in
biomedical and transport engineering output.
Domestic-oriented sectors also fared well, with the
construction sector expanding strongly on account of
a bumper crop of private residential units.
However, in Q3, faced with fresh external headwinds,
the Singapore economy experienced a broad-based
pullback, and contracted mildly by 1.3% q-o-q SAAR.
Expectations that the US Federal Reserve would soon
start tapering its LSAP combined with a growth
downshift in EMEs to weigh on general sentiment
and economic activity. There was some retrenchment of activity in the financial services
sector, especially the sentiment-sensitive cluster.
Trade activity was also sluggish, in line with
weakening export performance for several
regional economies.
Chart 2.1.1 Singapore’s GDP Growth
Source: Department of Statistics (DOS)
Looking ahead, while a continued recovery in
the external environment should provide
some upside momentum for Singapore’s
economic growth, several risks remain. In
the US, there are potential policy missteps
associated with the start of policy
normalisation by the US Federal Reserve, as
well as considerable uncertainty over
whether political standoffs over the budget
and debt ceiling could be satisfactorily
resolved. In the euro zone, given that public
debts are still high and governments are still
running fiscal deficits, concerns over
sovereign creditworthiness could intensify
again and present renewed setbacks to the
still-tentative economic recovery. In Asia,
a downshift in activity could occur if the
-15
0
15
30
45
2008 2009 2010 2011 2012 2013
Per C
en
t
QoQ SAAR YoY
Q3
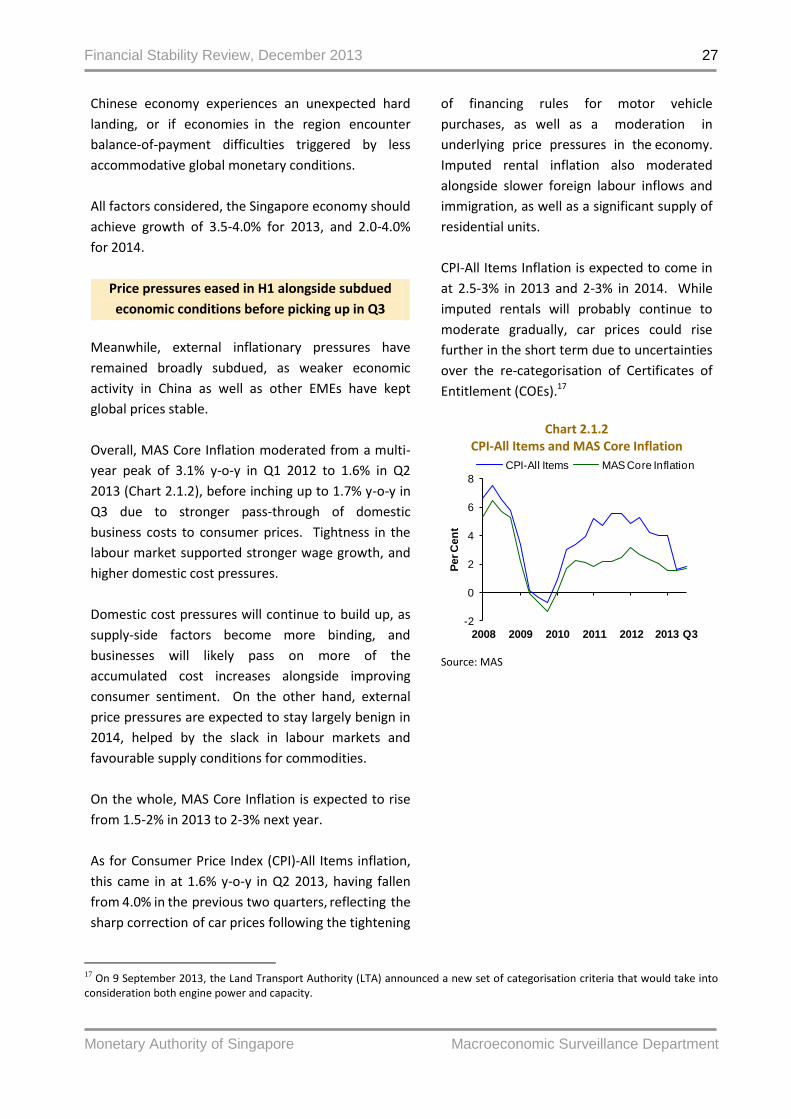
Financial Stability Review, December 2013
Monetary Authority of Singapore Macroeconomic Surveillance Department
27
17 On 9 September 2013, the Land Transport Authority (LTA) announced a new set of categorisation criteria that would take into consideration both engine power and capacity.
Chinese economy experiences an unexpected hard
landing, or if economies in the region encounter
balance-of-payment difficulties triggered by less
accommodative global monetary conditions.
All factors considered, the Singapore economy should
achieve growth of 3.5-4.0% for 2013, and 2.0-4.0%
for 2014.
Price pressures eased in H1 alongside subdued
economic conditions before picking up in Q3
Meanwhile, external inflationary pressures have
remained broadly subdued, as weaker economic
activity in China as well as other EMEs have kept
global prices stable.
Overall, MAS Core Inflation moderated from a multi-
year peak of 3.1% y-o-y in Q1 2012 to 1.6% in Q2
2013 (Chart 2.1.2), before inching up to 1.7% y-o-y in
Q3 due to stronger pass-through of domestic
business costs to consumer prices. Tightness in the
labour market supported stronger wage growth, and
higher domestic cost pressures.
Domestic cost pressures will continue to build up, as
supply-side factors become more binding, and
businesses will likely pass on more of the
accumulated cost increases alongside improving
consumer sentiment. On the other hand, external
price pressures are expected to stay largely benign in
2014, helped by the slack in labour markets and
favourable supply conditions for commodities.
On the whole, MAS Core Inflation is expected to rise
from 1.5-2% in 2013 to 2-3% next year.
As for Consumer Price Index (CPI)-All Items inflation,
this came in at 1.6% y-o-y in Q2 2013, having fallen
from 4.0% in the previous two quarters, reflecting the
sharp correction of car prices following the tightening
of financing rules for motor vehicle
purchases, as well as a moderation in underlying price pressures in the economy.
Imputed rental inflation also moderated
alongside slower foreign labour inflows and
immigration, as well as a significant supply of
residential units.
CPI-All Items Inflation is expected to come in
at 2.5-3% in 2013 and 2-3% in 2014. While
imputed rentals will probably continue to
moderate gradually, car prices could rise
further in the short term due to uncertainties
over the re-categorisation of Certificates of
Entitlement (COEs).17
Chart 2.1.2
CPI-All Items and MAS Core Inflation
Source: MAS
-2
0
2
4
6
8
2008 2009 2010 2011 2012 2013
Per C
en
tCPI-All Items MAS Core Inflation
Q3

Financial Stability Review, December 2013
Monetary Authority of Singapore Macroeconomic Surveillance Department
28
In October 2013, MAS maintained its monetary
stance of a modest and gradual appreciation of the
Singapore dollar nominal effective exchange rate
(S$NEER) (Chart 2.1.3), taking into account the
medium-term impact of tighter foreign worker
policies alongside other factors which could exert upward pressure on prices. This policy stance will
help to ensure medium-term price stability, and keep
the economy on a path of restructuring towards
sustainable growth.
Singapore’s financial markets have remained
resilient, but could become more volatile ahead
Singapore’s financial markets have remained stable
through 2013, with advanced economies’ UMP
keeping global financial conditions easy and
Singapore’s economic growth holding up despite
considerable swings in momentum. However
markets are expected to experience more volatility in
the period ahead, partly due to uncertainty over
when the US Federal Reserve will start to taper its
LSAP, how quickly this will proceed, and what
spillover effects this may have.
In line with accommodative global monetary
conditions, Singapore’s domestic interest rates have
remained close to historical lows, with the three-
month SGD Singapore Interbank Offered Rate (SIBOR)
and three-month SGD Singapore Swap Offer Rate
(SOR) staying below 0.40% (Chart 2.1.4). The Asian
Dollar Market (ADM) has also continued to function
well, as the US’ UMP has kept US dollar (USD)
interest rates, including USD SIBOR, well-anchored.
Meanwhile, concerns related to liquidity risks and
counterparty credit risks have remained muted, as
reflected in the low and stable SGD and USD
interbank overnight indexed swap (OIS) and
Treasury-interbank (TED) spreads (Chart 2.1.5).
For most of H1 2013, Singapore’s equity market
rallied on positive market sentiment arising from
expectations that the US would continue its LSAP.
The Straits Times Index (STI) rose by 9.1% between
Chart 2.1.3 S$ Nominal Effective Exchange Rate (S$NEER)
Source: MAS
Chart 2.1.4
Three-Month Interbank Rates
Source: Bloomberg Note: LIBOR refers to London Interbank Offered Rate
Chart 2.1.5 Money Market Spreads
Source: Bloomberg Note: USD TED Spread is the difference between the three-month interbank rate and the yield on US three-month Treasury bills. SGD TED Spread is the difference between the three-month interbank rate and the yield on three-month MAS bills.
95
100
105
110
115
2010 2011 2012 2013
S$NEER
Oct
Ind
ex (1-7
Jan
2010 A
vera
ge=100)
-1
0
1
2
3
4
5
2008 2009 2010 2011 2012 2013
Per
Cen
t
USD LIBOR USD SIBORSGD SIBOR SGD SOR
Nov
0
1
2
3
4
5
2008 2009 2010 2011 2012 2013
Per C
en
t
USD LIBOR-OIS SpreadUSD TED SpreadSGD SIBOR-OIS SpreadSGD TED Spread
Nov
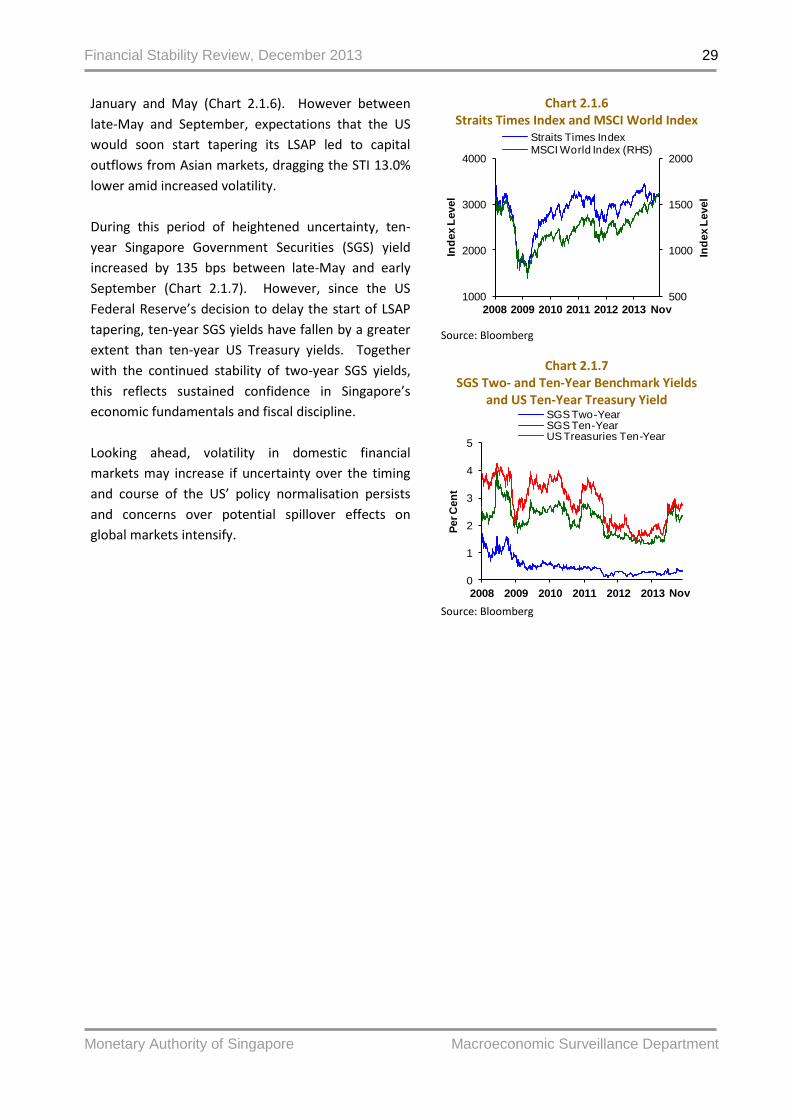
Financial Stability Review, December 2013
Monetary Authority of Singapore Macroeconomic Surveillance Department
29
January and May (Chart 2.1.6). However between
late-May and September, expectations that the US
would soon start tapering its LSAP led to capital
outflows from Asian markets, dragging the STI 13.0%
lower amid increased volatility.
During this period of heightened uncertainty, ten-
year Singapore Government Securities (SGS) yield
increased by 135 bps between late-May and early
September (Chart 2.1.7). However, since the US
Federal Reserve’s decision to delay the start of LSAP
tapering, ten-year SGS yields have fallen by a greater
extent than ten-year US Treasury yields. Together
with the continued stability of two-year SGS yields,
this reflects sustained confidence in Singapore’s
economic fundamentals and fiscal discipline.
Looking ahead, volatility in domestic financial
markets may increase if uncertainty over the timing
and course of the US’ policy normalisation persists
and concerns over potential spillover effects on
global markets intensify.
Chart 2.1.6 Straits Times Index and MSCI World Index
Source: Bloomberg
Chart 2.1.7 SGS Two- and Ten-Year Benchmark Yields
and US Ten-Year Treasury Yield
Source: Bloomberg
500
1000
1500
2000
1000
2000
3000
4000
2008 2009 2010 2011 2012 2013
Ind
ex L
evel
Ind
ex L
evel
Straits Times IndexMSCI World Index (RHS)
Nov
0
1
2
3
4
5
2008 2009 2010 2011 2012 2013
Per C
en
t
SGS Two-YearSGS Ten-YearUS Treasuries Ten-Year
Nov
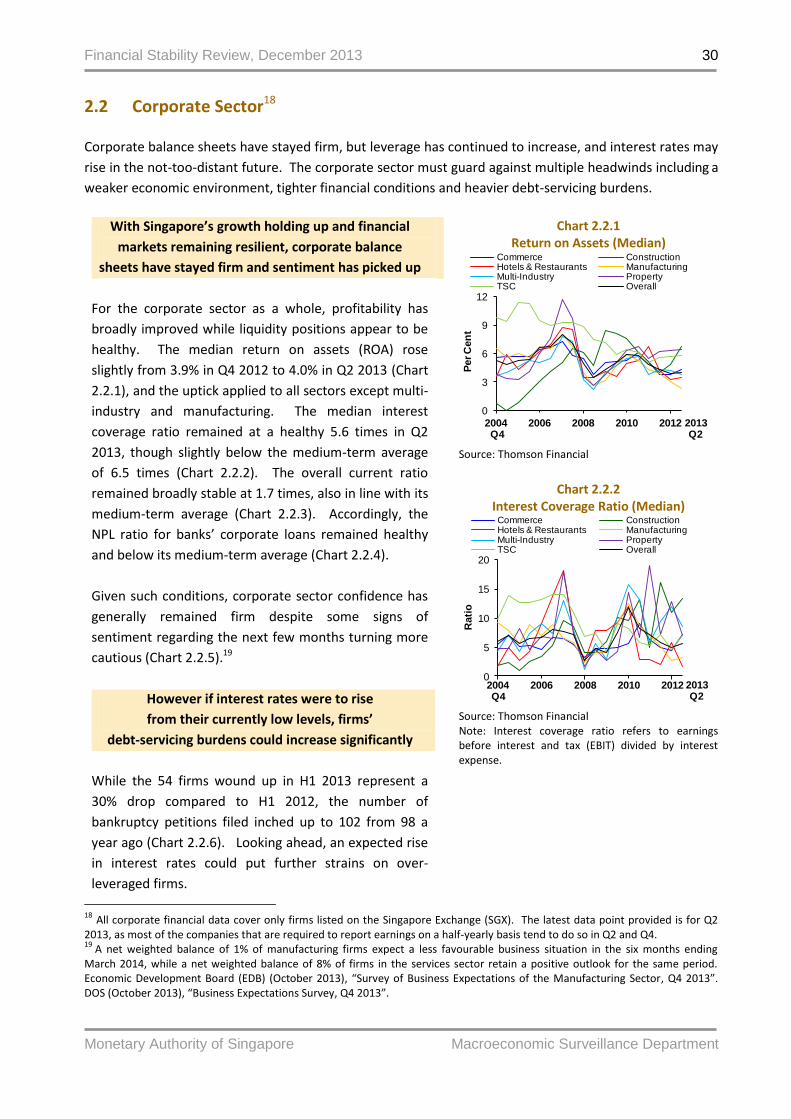
Financial Stability Review, December 2013
Monetary Authority of Singapore Macroeconomic Surveillance Department
30
2.2 Corporate Sector18
Corporate balance sheets have stayed firm, but leverage has continued to increase, and interest rates may
rise in the not-too-distant future. The corporate sector must guard against multiple headwinds including a
weaker economic environment, tighter financial conditions and heavier debt-servicing burdens.
With Singapore’s growth holding up and financial
markets remaining resilient, corporate balance
sheets have stayed firm and sentiment has picked up
For the corporate sector as a whole, profitability has
broadly improved while liquidity positions appear to be
healthy. The median return on assets (ROA) rose
slightly from 3.9% in Q4 2012 to 4.0% in Q2 2013 (Chart
2.2.1), and the uptick applied to all sectors except multi-
industry and manufacturing. The median interest
coverage ratio remained at a healthy 5.6 times in Q2
2013, though slightly below the medium-term average
of 6.5 times (Chart 2.2.2). The overall current ratio
remained broadly stable at 1.7 times, also in line with its
medium-term average (Chart 2.2.3). Accordingly, the
NPL ratio for banks’ corporate loans remained healthy
and below its medium-term average (Chart 2.2.4).
Given such conditions, corporate sector confidence has
generally remained firm despite some signs of
sentiment regarding the next few months turning more
cautious (Chart 2.2.5).19
However if interest rates were to rise
from their currently low levels, firms’
debt-servicing burdens could increase significantly
While the 54 firms wound up in H1 2013 represent a
30% drop compared to H1 2012, the number of
bankruptcy petitions filed inched up to 102 from 98 a
year ago (Chart 2.2.6). Looking ahead, an expected rise
in interest rates could put further strains on over-
leveraged firms.
Chart 2.2.1 Return on Assets (Median)
Source: Thomson Financial
Chart 2.2.2
Interest Coverage Ratio (Median)
Source: Thomson Financial Note: Interest coverage ratio refers to earnings before interest and tax (EBIT) divided by interest expense.
18
All corporate financial data cover only firms listed on the Singapore Exchange (SGX). The latest data point provided is for Q2 2013, as most of the companies that are required to report earnings on a half-yearly basis tend to do so in Q2 and Q4. 19
A net weighted balance of 1% of manufacturing firms expect a less favourable business situation in the six months ending March 2014, while a net weighted balance of 8% of firms in the services sector retain a positive outlook for the same period. Economic Development Board (EDB) (October 2013), “Survey of Business Expectations of the Manufacturing Sector, Q4 2013”. DOS (October 2013), “Business Expectations Survey, Q4 2013”.
0
3
6
9
12
2004Q4
2006 2008 2010 2012
Per C
en
t
Commerce ConstructionHotels & Restaurants ManufacturingMulti-Industry PropertyTSC Overall
2013Q2
0
5
10
15
20
2004Q4
2006 2008 2010 2012
Rati
o
Commerce ConstructionHotels & Restaurants ManufacturingMulti-Industry PropertyTSC Overall
2013Q2
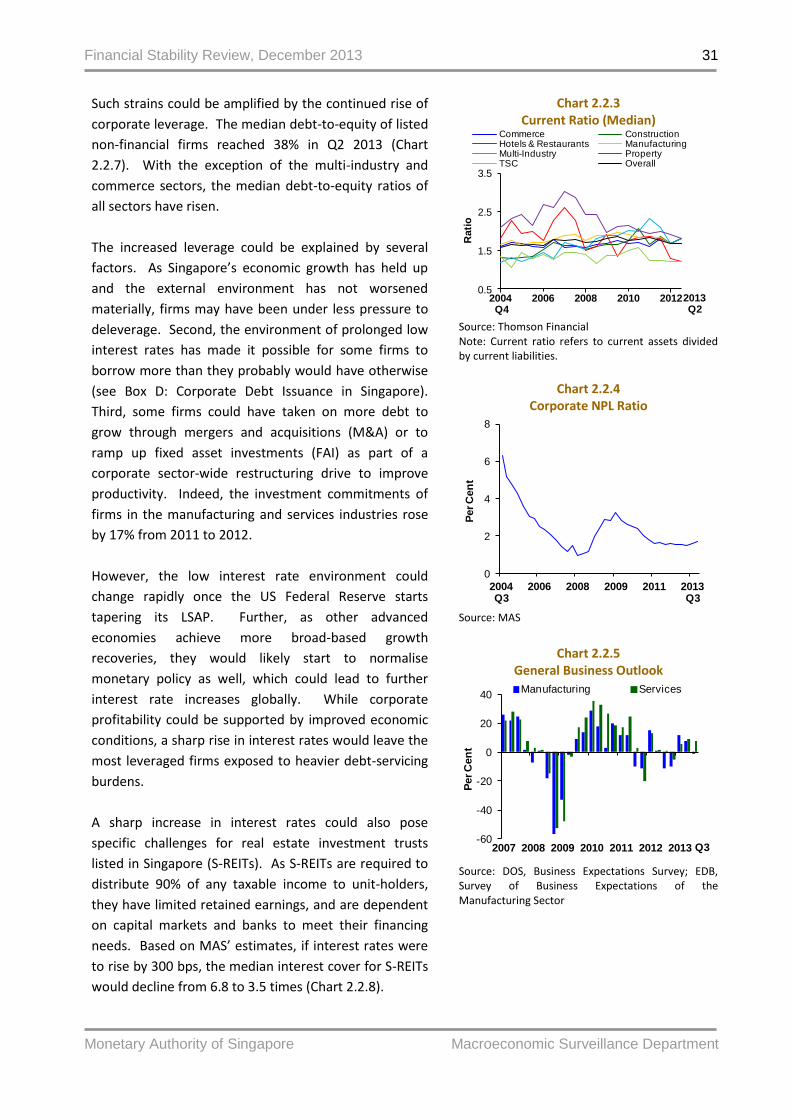
Financial Stability Review, December 2013
Monetary Authority of Singapore Macroeconomic Surveillance Department
31
Such strains could be amplified by the continued rise of
corporate leverage. The median debt-to-equity of listed
non-financial firms reached 38% in Q2 2013 (Chart
2.2.7). With the exception of the multi-industry and
commerce sectors, the median debt-to-equity ratios of
all sectors have risen.
The increased leverage could be explained by several
factors. As Singapore’s economic growth has held up
and the external environment has not worsened
materially, firms may have been under less pressure to
deleverage. Second, the environment of prolonged low
interest rates has made it possible for some firms to
borrow more than they probably would have otherwise
(see Box D: Corporate Debt Issuance in Singapore).
Third, some firms could have taken on more debt to
grow through mergers and acquisitions (M&A) or to
ramp up fixed asset investments (FAI) as part of a
corporate sector-wide restructuring drive to improve
productivity. Indeed, the investment commitments of
firms in the manufacturing and services industries rose
by 17% from 2011 to 2012.
However, the low interest rate environment could
change rapidly once the US Federal Reserve starts
tapering its LSAP. Further, as other advanced
economies achieve more broad-based growth
recoveries, they would likely start to normalise
monetary policy as well, which could lead to further
interest rate increases globally. While corporate
profitability could be supported by improved economic
conditions, a sharp rise in interest rates would leave the
most leveraged firms exposed to heavier debt-servicing
burdens.
A sharp increase in interest rates could also pose
specific challenges for real estate investment trusts
listed in Singapore (S-REITs). As S-REITs are required to
distribute 90% of any taxable income to unit-holders,
they have limited retained earnings, and are dependent
on capital markets and banks to meet their financing
needs. Based on MAS’ estimates, if interest rates were
to rise by 300 bps, the median interest cover for S-REITs
would decline from 6.8 to 3.5 times (Chart 2.2.8).
Chart 2.2.3 Current Ratio (Median)
Source: Thomson Financial Note: Current ratio refers to current assets divided by current liabilities.
Chart 2.2.4
Corporate NPL Ratio
Source: MAS
Chart 2.2.5
General Business Outlook
Source: DOS, Business Expectations Survey; EDB, Survey of Business Expectations of the Manufacturing Sector
0.5
1.5
2.5
3.5
2004Q4
2006 2008 2010 2012
Rati
o
Commerce ConstructionHotels & Restaurants ManufacturingMulti-Industry PropertyTSC Overall
2013Q2
0
2
4
6
8
2004Q3
2006 2008 2009 2011 2013Q3
Per C
en
t
-60
-40
-20
0
20
40
2007 2008 2009 2010 2011 2012 2013
Per C
en
t
Manufacturing Services
Q3

Financial Stability Review, December 2013
Monetary Authority of Singapore Macroeconomic Surveillance Department
32
Further, higher interest rates would likely increase
interest expenses and lower dividend payouts for
investors. This could reduce the attractiveness of S-
REITs and constrain their ability to tap on the capital
markets for further financing.
Nevertheless, the debt maturity profile of S-REITs has
improved compared to during the GFC, with a smaller
proportion of debt due for refinancing in the next two
years (Chart 2.2.9).
Financing conditions for SMEs have recovered
after a slowdown in H2 2012, but SMEs need to guard
against abrupt changes in economic conditions
Financing conditions for SMEs have recovered after a
slowdown in the amount of credit extended in H2 2012,
but there is a need to be vigilant against abrupt changes
in economic conditions.
The volume of loans extended to SMEs slowed in H2
2012, but has since returned to moderate growth. Total
SME loans increased by almost 6% y-o-y in H1 2013,
compared to 0.3% as at end-2012 (Chart 2.2.10). This
was mainly due to a rise in the volume of non-trade
facilities, and corroborated by findings from a survey of
banks, which indicated increased demand for and
supply of SME credit in H1 2013.
The commerce and construction sectors continue to
account for more than half of total outstanding SME
loans, at 33% and 26% respectively (Chart 2.2.11).
Foreign banks are also starting to account for a larger
share of SME loans, at 46.2% in H1 2013 compared to
45.6% in H1 2012. The outlook for SME lending remains
optimistic, with banks surveyed expecting demand for
and supply of SME credit to rise more quickly over the
next two quarters.
Reflecting the low interest rate environment and
competition, net interest margins (NIMs) on SME loans
narrowed slightly from 2.1% in H1 2012 to 2.0% in H1
2013 (Chart 2.2.12). A survey of banks indicates that
credit terms and conditions are expected to remain
broadly unchanged over the next two quarters, though
Chart 2.2.6 Corporate Bankruptcies
Source: Ministry of Law, Insolvency and Public
Trustee’s Office (IPTO)
Chart 2.2.7 Debt-to-Equity Ratio (Median)
Source: Thomson Financial
Chart 2.2.8
Sensitivity Test on S-REITs’ Interest Coverage Ratio
Source: Thomson Financial, MAS estimates
25
50
75
100
125
2007 H1
2008 2009H1
2010 2011H1
2012 2013H1
Nu
mb
er o
f C
om
pan
ies
Companies wound up Petitions filed
0
20
40
60
80
2004Q4
2006 2008 2010 2012
Per C
en
t
Commerce ConstructionHotels & Restaurants ManufacturingMulti-Industry PropertyTSC Overall
2013Q2
0
2
4
6
8
10
Inte
rest C
overa
ge R
ati
o
25th Percentile Median 75th Percentile
Base Case 300 bps Increase

Financial Stability Review, December 2013
Monetary Authority of Singapore Macroeconomic Surveillance Department
33
spreads may widen in anticipation of G3 policy
normalisation.
The overall credit quality of banks’ SME loan portfolios
has remained strong. The NPL ratio for SME loans has
stabilised at around 1% in the past year (Chart 2.2.13),
after a period of gradual reduction. While a majority of
SME loans are collateralised by property (mainly
commercial and industrial), the amount of unsecured
loans has risen marginally (Chart 2.2.14).
Although the recovery in SME financing conditions in H1
2013 is positive, this could reverse if adverse changes in
economic conditions materialise. A renewed weakening
of global economic growth, coupled with a rise in
interest rates, could lead to tighter credit conditions for
SMEs.
The corporate sector as a whole needs to
guard against tighter financial conditions
For the corporate sector as a whole, there is a need to
be mindful that downside risks to economic growth
remain considerable and an increase in debt-servicing
burdens is likely in the not-too-distant future.
Firms should consider the use of leverage carefully, and
exercise financial prudence alongside restructuring
efforts for more sustainable long-term growth.
Chart 2.2.9 Debt Maturity Profile of S-REITs
Source: MAS, Bloomberg Note: T refers to the initial year for each time series (i.e. T+1 refers to the whole of 2009 and 2014 respectively).
Chart 2.2.10
SME Loans Outstanding
Source: MAS
Chart 2.2.11
SME Loans by Sector (as at Q2 2013)
Source: MAS
0
10
20
30
40
T T+1 T+2 T+3 T+4 > T+4
Per C
en
t
As of Dec 2008 As of Dec 2013
0
5
10
15
20
25
0
15
30
45
60
75
2010Q2
2010Q4
2011Q2
2011Q4
2012Q2
2012Q4
2013Q2
Per C
en
t
S$ B
illio
n
Loans Outstanding YoY Growth (RHS)
Manufacturing
8%
Construction26%
Agriculture, Mining &
Quarrying, Electricity,
Gas & Water
2%
Commerce33%
TSC8%
Business Services
4%
Non-Bank Financial
Institutions11%
Other Services
8%Manufacturing
8%
Construction 26%

Financial Stability Review, December 2013
Monetary Authority of Singapore Macroeconomic Surveillance Department
34
Chart 2.2.12 Net Interest Margin on SME Loans
(Weighted Average)
Source: MAS
Chart 2.2.14 Outstanding SME Loans by
Type of Collateralisation
Source: MAS
Chart 2.2.13 NPL Ratio: SME Loans
Source: MAS
1.0
1.5
2.0
2.5
3.0
2010H1
2010H2
2011H1
2011H2
2012H1
2012H2
2013H1
Per C
en
t
0
20
40
60
80
100
2010Q2
2010Q4
2011Q2
2011Q4
2012Q2
2012Q4
2013Q2
Per C
en
t
Collateralised by PropertyCollateralised by OthersUnsecured
0.0
1.0
2.0
3.0
2010Q2
2010Q4
2011Q2
2011Q4
2012Q2
2012Q4
2013Q2
Per C
en
t
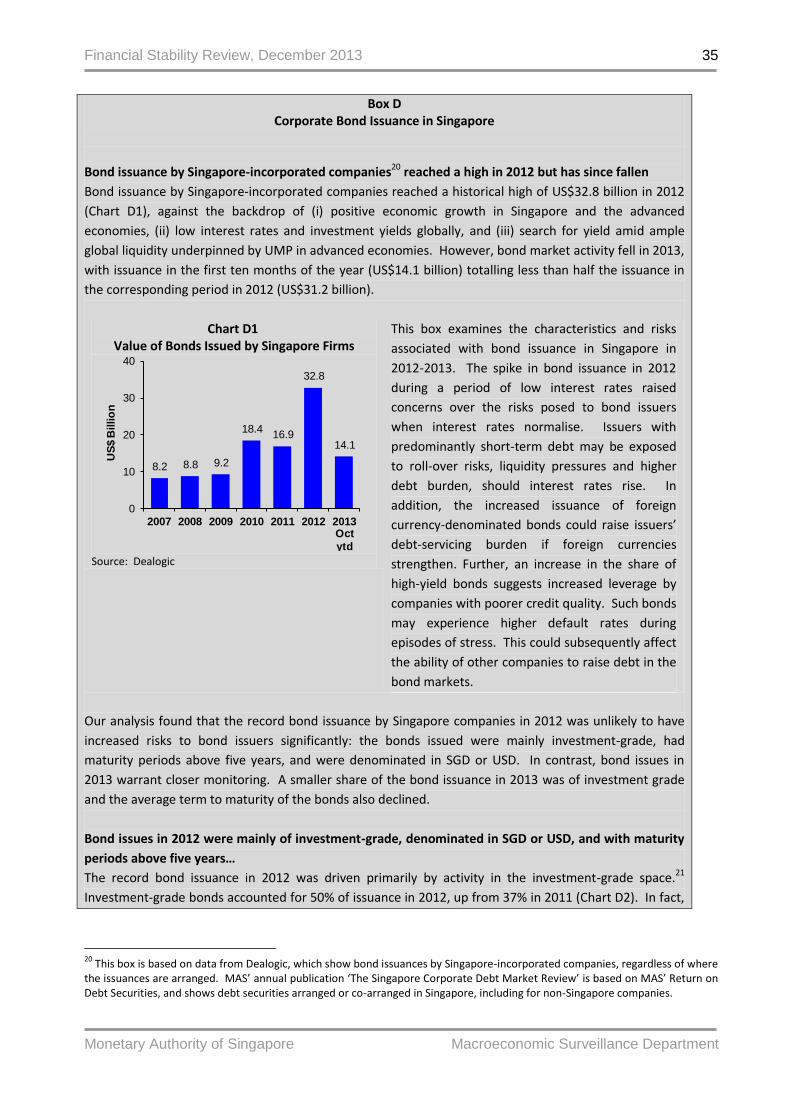
Financial Stability Review, December 2013
Monetary Authority of Singapore Macroeconomic Surveillance Department
35
Box D Corporate Bond Issuance in Singapore
Bond issuance by Singapore-incorporated companies20 reached a high in 2012 but has since fallen
Bond issuance by Singapore-incorporated companies reached a historical high of US$32.8 billion in 2012
(Chart D1), against the backdrop of (i) positive economic growth in Singapore and the advanced
economies, (ii) low interest rates and investment yields globally, and (iii) search for yield amid ample
global liquidity underpinned by UMP in advanced economies. However, bond market activity fell in 2013,
with issuance in the first ten months of the year (US$14.1 billion) totalling less than half the issuance in
the corresponding period in 2012 (US$31.2 billion).
Chart D1 Value of Bonds Issued by Singapore Firms
Source: Dealogic
This box examines the characteristics and risks
associated with bond issuance in Singapore in
2012-2013. The spike in bond issuance in 2012
during a period of low interest rates raised
concerns over the risks posed to bond issuers
when interest rates normalise. Issuers with
predominantly short-term debt may be exposed
to roll-over risks, liquidity pressures and higher
debt burden, should interest rates rise. In
addition, the increased issuance of foreign
currency-denominated bonds could raise issuers’
debt-servicing burden if foreign currencies
strengthen. Further, an increase in the share of
high-yield bonds suggests increased leverage by
companies with poorer credit quality. Such bonds
may experience higher default rates during
episodes of stress. This could subsequently affect
the ability of other companies to raise debt in the
bond markets.
Our analysis found that the record bond issuance by Singapore companies in 2012 was unlikely to have
increased risks to bond issuers significantly: the bonds issued were mainly investment-grade, had
maturity periods above five years, and were denominated in SGD or USD. In contrast, bond issues in
2013 warrant closer monitoring. A smaller share of the bond issuance in 2013 was of investment grade
and the average term to maturity of the bonds also declined.
Bond issues in 2012 were mainly of investment-grade, denominated in SGD or USD, and with maturity
periods above five years…
The record bond issuance in 2012 was driven primarily by activity in the investment-grade space.21
Investment-grade bonds accounted for 50% of issuance in 2012, up from 37% in 2011 (Chart D2). In fact,
20
This box is based on data from Dealogic, which show bond issuances by Singapore-incorporated companies, regardless of where the issuances are arranged. MAS’ annual publication ‘The Singapore Corporate Debt Market Review’ is based on MAS’ Return on Debt Securities, and shows debt securities arranged or co-arranged in Singapore, including for non-Singapore companies.
8.2 8.8 9.2
18.416.9
32.8
14.1
0
10
20
30
40
2007 2008 2009 2010 2011 2012 2013Oct
ytd
US
$ B
illio
n
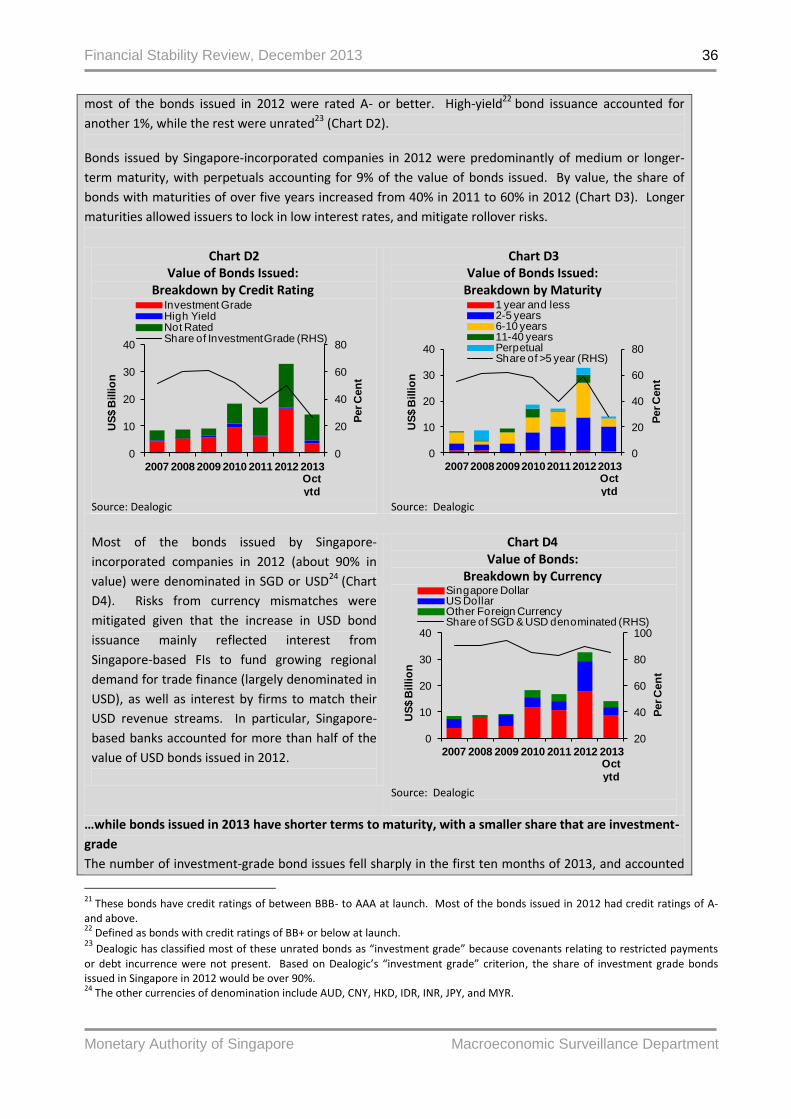
Financial Stability Review, December 2013
Monetary Authority of Singapore Macroeconomic Surveillance Department
36
most of the bonds issued in 2012 were rated A- or better. High-yield22 bond issuance accounted for
another 1%, while the rest were unrated23 (Chart D2).
Bonds issued by Singapore-incorporated companies in 2012 were predominantly of medium or longer-
term maturity, with perpetuals accounting for 9% of the value of bonds issued. By value, the share of
bonds with maturities of over five years increased from 40% in 2011 to 60% in 2012 (Chart D3). Longer
maturities allowed issuers to lock in low interest rates, and mitigate rollover risks.
Chart D2 Value of Bonds Issued:
Breakdown by Credit Rating
Source: Dealogic
Chart D3 Value of Bonds Issued:
Breakdown by Maturity
Source: Dealogic
Most of the bonds issued by Singapore-
incorporated companies in 2012 (about 90% in
value) were denominated in SGD or USD24 (Chart
D4). Risks from currency mismatches were
mitigated given that the increase in USD bond
issuance mainly reflected interest from
Singapore-based FIs to fund growing regional
demand for trade finance (largely denominated in
USD), as well as interest by firms to match their
USD revenue streams. In particular, Singapore-
based banks accounted for more than half of the
value of USD bonds issued in 2012.
Chart D4 Value of Bonds:
Breakdown by Currency
Source: Dealogic
…while bonds issued in 2013 have shorter terms to maturity, with a smaller share that are investment-
grade
The number of investment-grade bond issues fell sharply in the first ten months of 2013, and accounted
21
These bonds have credit ratings of between BBB- to AAA at launch. Most of the bonds issued in 2012 had credit ratings of A- and above. 22
Defined as bonds with credit ratings of BB+ or below at launch. 23
Dealogic has classified most of these unrated bonds as “investment grade” because covenants relating to restricted payments
or debt incurrence were not present. Based on Dealogic’s “investment grade” criterion, the share of investment grade bonds issued in Singapore in 2012 would be over 90%. 24
The other currencies of denomination include AUD, CNY, HKD, IDR, INR, JPY, and MYR.
0
20
40
60
80
0
10
20
30
40
2007 2008 2009 2010 2011 2012 2013Oct
ytd
Per C
en
t
US
$ B
illio
n
Investment GradeHigh YieldNot RatedShare of Investment Grade (RHS)
0
20
40
60
80
0
10
20
30
40
2007200820092010201120122013Oct
ytd
Per C
en
t
US
$ B
illio
n
1 year and less2-5 years6-10 years11-40 yearsPerpetualShare of >5 year (RHS)
20
40
60
80
100
0
10
20
30
40
2007 2008 2009 2010 2011 2012 2013Oct
ytd
Per C
en
t
US
$ B
illio
n
Singapore DollarUS DollarOther Foreign CurrencyShare of SGD & USD denominated (RHS)
Financial Stability Review, December 2013
Monetary Authority of Singapore Macroeconomic Surveillance Department
37
for only 26% of the total value of bonds issued in the period, compared to 50% in 2012 (Chart D2). The
rest of the issues were largely unrated, though there was a higher share of high yield bonds (6% by
value). The share of bonds with maturities over five years fell from 60% in 2012 to 28% in the first ten
months of 2013 (Chart D3). Most of the bonds (about 85% by value) issued by Singapore-incorporated
companies were denominated in SGD or USD (Chart D4).
Record bond issuance in 2012 did not lead to a significant increase in risks to bond issuers but risks
have surfaced in 2013
The record bond issuances by Singapore-incorporated companies in 2012 were mostly of investment
grade, denominated in SGD or USD (and matched to currencies of trade finance or revenue streams), and
had maturity periods of above five years. These characteristics help to mitigate risks associated with
issuers’ debt repayment capacity, currency mismatches and rollover strains. However, these risks have
increased in 2013, with a larger share of the bonds issued being unrated or below investment grade and
having shorter maturities. MAS will continue to monitor risks in the domestic bond market.
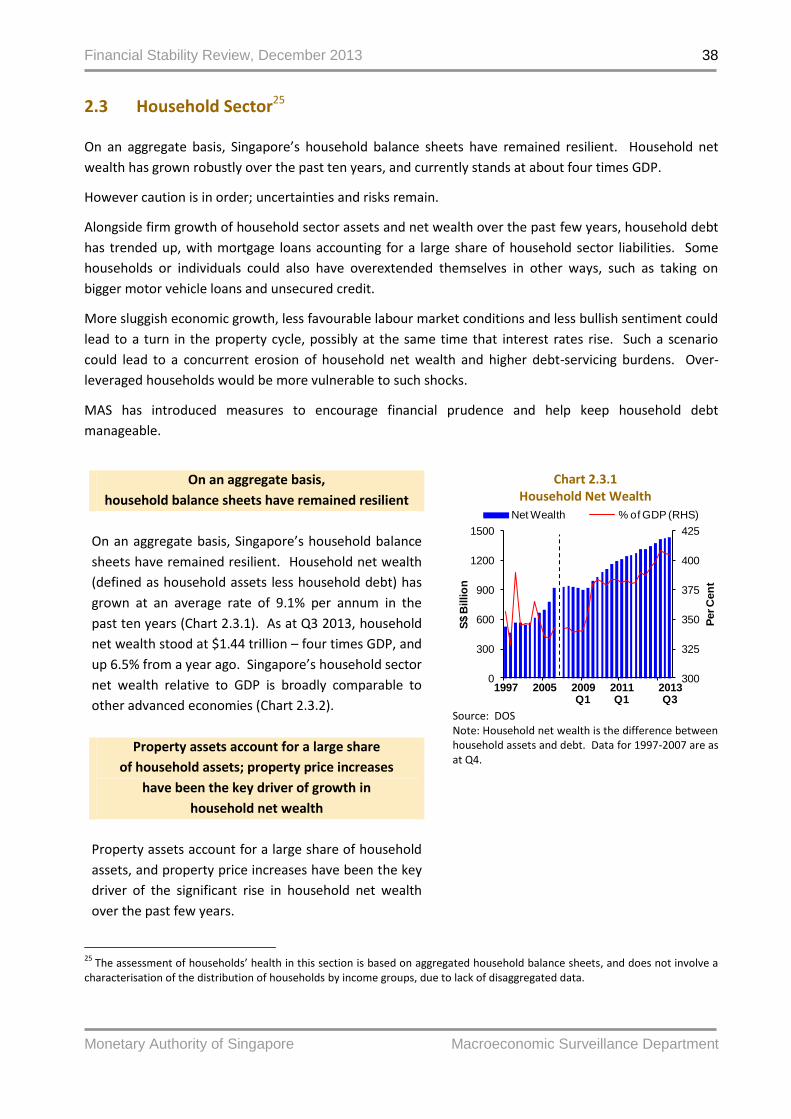
Financial Stability Review, December 2013
Monetary Authority of Singapore Macroeconomic Surveillance Department
38
2.3 Household Sector25
On an aggregate basis, Singapore’s household balance sheets have remained resilient. Household net
wealth has grown robustly over the past ten years, and currently stands at about four times GDP.
However caution is in order; uncertainties and risks remain.
Alongside firm growth of household sector assets and net wealth over the past few years, household debt
has trended up, with mortgage loans accounting for a large share of household sector liabilities. Some
households or individuals could also have overextended themselves in other ways, such as taking on
bigger motor vehicle loans and unsecured credit.
More sluggish economic growth, less favourable labour market conditions and less bullish sentiment could
lead to a turn in the property cycle, possibly at the same time that interest rates rise. Such a scenario
could lead to a concurrent erosion of household net wealth and higher debt-servicing burdens. Over-
leveraged households would be more vulnerable to such shocks.
MAS has introduced measures to encourage financial prudence and help keep household debt
manageable.
25
The assessment of households’ health in this section is based on aggregated household balance sheets, and does not involve a characterisation of the distribution of households by income groups, due to lack of disaggregated data.
On an aggregate basis,
household balance sheets have remained resilient
On an aggregate basis, Singapore’s household balance
sheets have remained resilient. Household net wealth
(defined as household assets less household debt) has
grown at an average rate of 9.1% per annum in the
past ten years (Chart 2.3.1). As at Q3 2013, household
net wealth stood at $1.44 trillion – four times GDP, and
up 6.5% from a year ago. Singapore’s household sector
net wealth relative to GDP is broadly comparable to
other advanced economies (Chart 2.3.2).
Property assets account for a large share
of household assets; property price increases
have been the key driver of growth in
household net wealth
Property assets account for a large share of household
assets, and property price increases have been the key
driver of the significant rise in household net wealth
over the past few years.
Chart 2.3.1 Household Net Wealth
Source: DOS Note: Household net wealth is the difference between household assets and debt. Data for 1997-2007 are as at Q4.
300
325
350
375
400
425
0
300
600
900
1200
1500
1997 2005 2009Q1
2011 Q1
2013 Q3
Per C
en
t
S$ B
illio
n
Net Wealth % of GDP (RHS)
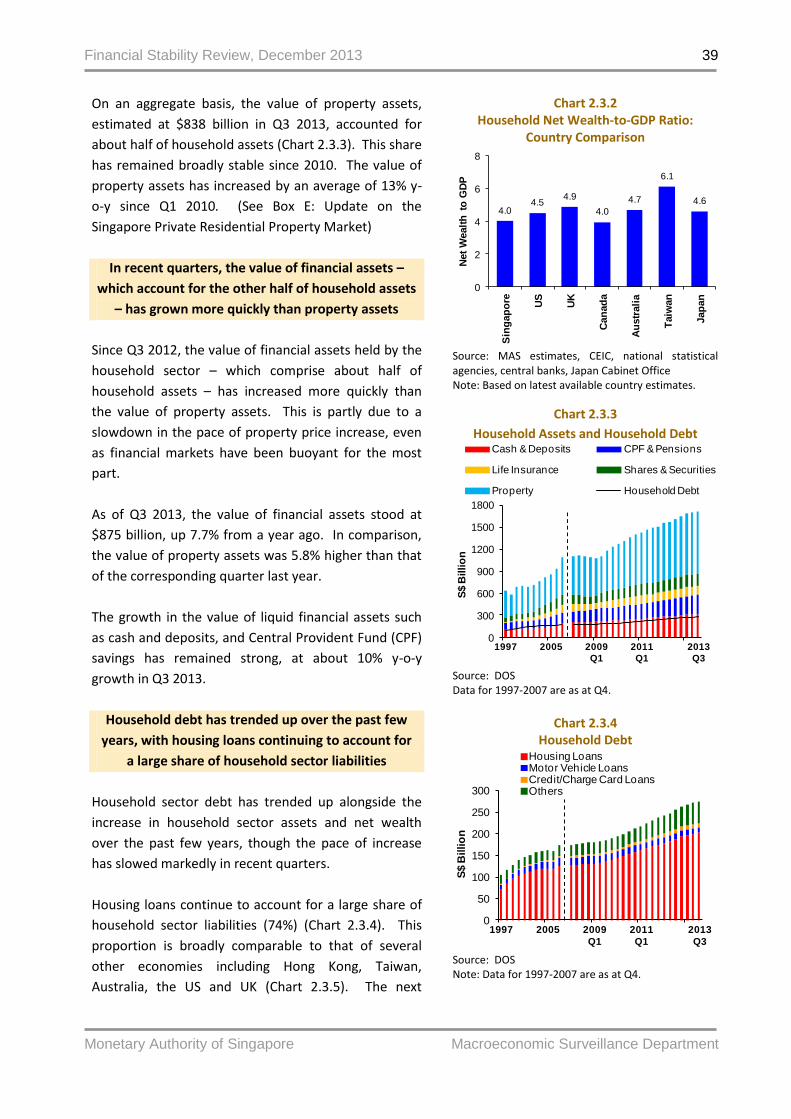
Financial Stability Review, December 2013
Monetary Authority of Singapore Macroeconomic Surveillance Department
39
On an aggregate basis, the value of property assets,
estimated at $838 billion in Q3 2013, accounted for
about half of household assets (Chart 2.3.3). This share
has remained broadly stable since 2010. The value of
property assets has increased by an average of 13% y-
o-y since Q1 2010. (See Box E: Update on the
Singapore Private Residential Property Market)
In recent quarters, the value of financial assets –
which account for the other half of household assets
– has grown more quickly than property assets
Since Q3 2012, the value of financial assets held by the
household sector – which comprise about half of
household assets – has increased more quickly than
the value of property assets. This is partly due to a
slowdown in the pace of property price increase, even
as financial markets have been buoyant for the most
part.
As of Q3 2013, the value of financial assets stood at
$875 billion, up 7.7% from a year ago. In comparison,
the value of property assets was 5.8% higher than that
of the corresponding quarter last year.
The growth in the value of liquid financial assets such
as cash and deposits, and Central Provident Fund (CPF)
savings has remained strong, at about 10% y-o-y
growth in Q3 2013.
Household debt has trended up over the past few
years, with housing loans continuing to account for
a large share of household sector liabilities
Household sector debt has trended up alongside the
increase in household sector assets and net wealth
over the past few years, though the pace of increase
has slowed markedly in recent quarters.
Housing loans continue to account for a large share of
household sector liabilities (74%) (Chart 2.3.4). This
proportion is broadly comparable to that of several
other economies including Hong Kong, Taiwan,
Australia, the US and UK (Chart 2.3.5). The next
Chart 2.3.2 Household Net Wealth-to-GDP Ratio:
Country Comparison
Source: MAS estimates, CEIC, national statistical agencies, central banks, Japan Cabinet Office Note: Based on latest available country estimates.
Chart 2.3.3
Household Assets and Household Debt
Source: DOS Data for 1997-2007 are as at Q4.
Chart 2.3.4
Household Debt
Source: DOS Note: Data for 1997-2007 are as at Q4.
4.04.5
4.9
4.0
4.7
6.1
4.6
0
2
4
6
8
Sin
gap
ore US
UK
Can
ad
a
Au
str
ali
a
Taiw
an
Jap
an
Net
Wealt
h t
o G
DP
0
300
600
900
1200
1500
1800
1997 2005 2009
Q1
2011
Q1
2013
Q3
S$ B
illio
nCash & Deposits CPF & Pensions
Life Insurance Shares & Securities
Property Household Debt
0
50
100
150
200
250
300
1997 2005 2009
Q1
2011
Q1
2013
Q3
S$ B
illio
n
Housing Loans Motor Vehicle Loans Credit/Charge Card Loans Others

Financial Stability Review, December 2013
Monetary Authority of Singapore Macroeconomic Surveillance Department
40
26
The most commonly-cited reasons for debt problems are related to employment and overspending.
biggest component after housing loans is motor vehicle
loans, which constituted 4.6% of household liabilities
as of Q3 2013.
The generally benign environment of moderate
economic growth, tight labour market conditions and
low interest rates could change in the period ahead.
These could pose strains on some households.
Data from Credit Counselling Singapore (CCS) shows
that the average outstanding debt owed by individuals
seeking credit counselling has increased by 15% over
the past four years, from $69,600 to $79,700.26
The number of individual bankruptcy orders made has
been trending up, from about 1,500 cases in 2011 to
about 1,700 cases in 2012 (Chart 2.3.6). This trend has
continued for the first three quarters of 2013
compared to the same period last year.
Over-leveraged individuals and households would be
more vulnerable to adverse shocks. If the economy
slows down and labour market conditions become less
favourable, the property cycle could turn. Some
households’ financial resilience could deteriorate – the
value of their assets could fall even as their debt-
servicing burdens increase in tandem with rising
interest rates as advanced economies embark on
monetary policy normalisation.
To limit excessive increase in household leverage and
help households build up financial buffers, MAS
introduced a series of measures to encourage financial
prudence among borrowers. Broadly, these cover:
housing loans, motor vehicle loans and unsecured
credit. (See Box F: Singapore Household Sector: When
the Tide Goes Out)
Chart 2.3.5 Country Comparison of Housing Loans
Source: MAS estimates, CEIC, Datastream, national statistical agencies, central banks Note: Latest available estimates are used when 2013 data are not available.
Chart 2.3.6 Number of Individual
Bankruptcy Orders Made
Source: Ministry of Law, IPTO
40
50
60
70
80
90
100
-4 -2 0 2 4 6 8 10 12 14 16 18
Ho
usin
g L
oan
s a
s %
of
Ho
useh
old
Deb
t, 2
013
Average Annual % Growth in Housing Loans, 2008 - 2013
Singapore
UK
US
Australia
Taiwan
HongKong
Korea
Malaysia
23
China
Canada
0
1
2
3
4
5
1997 2002 2007 2012
Un
its (T
ho
usan
d)
2007 2012
Jan-Sep
2013
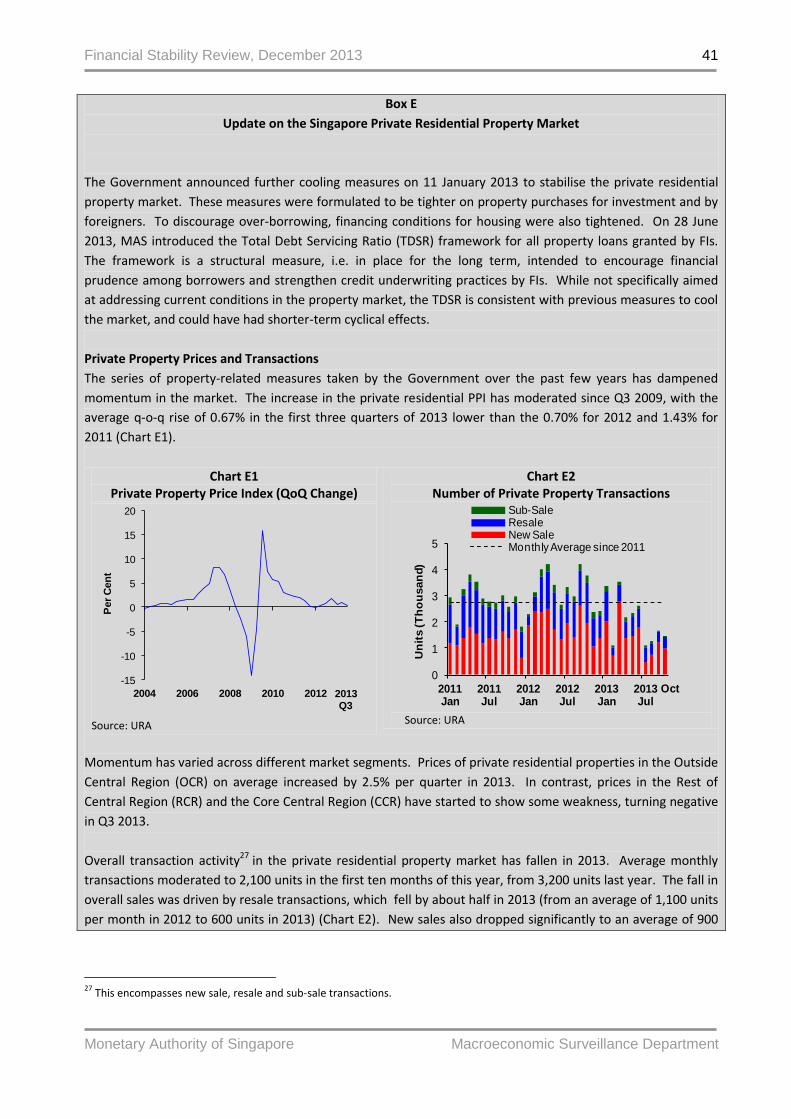
Financial Stability Review, December 2013
Monetary Authority of Singapore Macroeconomic Surveillance Department
41
Box E
Update on the Singapore Private Residential Property Market
The Government announced further cooling measures on 11 January 2013 to stabilise the private residential
property market. These measures were formulated to be tighter on property purchases for investment and by
foreigners. To discourage over-borrowing, financing conditions for housing were also tightened. On 28 June
2013, MAS introduced the Total Debt Servicing Ratio (TDSR) framework for all property loans granted by FIs.
The framework is a structural measure, i.e. in place for the long term, intended to encourage financial
prudence among borrowers and strengthen credit underwriting practices by FIs. While not specifically aimed
at addressing current conditions in the property market, the TDSR is consistent with previous measures to cool
the market, and could have had shorter-term cyclical effects.
Private Property Prices and Transactions
The series of property-related measures taken by the Government over the past few years has dampened
momentum in the market. The increase in the private residential PPI has moderated since Q3 2009, with the
average q-o-q rise of 0.67% in the first three quarters of 2013 lower than the 0.70% for 2012 and 1.43% for
2011 (Chart E1).
Chart E1 Private Property Price Index (QoQ Change)
Source: URA
Chart E2 Number of Private Property Transactions
Source: URA
Momentum has varied across different market segments. Prices of private residential properties in the Outside
Central Region (OCR) on average increased by 2.5% per quarter in 2013. In contrast, prices in the Rest of
Central Region (RCR) and the Core Central Region (CCR) have started to show some weakness, turning negative
in Q3 2013.
Overall transaction activity27 in the private residential property market has fallen in 2013. Average monthly
transactions moderated to 2,100 units in the first ten months of this year, from 3,200 units last year. The fall in
overall sales was driven by resale transactions, which fell by about half in 2013 (from an average of 1,100 units
per month in 2012 to 600 units in 2013) (Chart E2). New sales also dropped significantly to an average of 900
27
This encompasses new sale, resale and sub-sale transactions.
-15
-10
-5
0
5
10
15
20
2004 2006 2008 2010 2012
Per
Cen
t
2013Q3
0
1
2
3
4
5
2011Jan
2011Jul
2012Jan
2012Jul
2013Jan
2013Jul
Un
its (T
ho
usan
d)
Sub-SaleResaleNew SaleMonthly Average since 2011
Oct
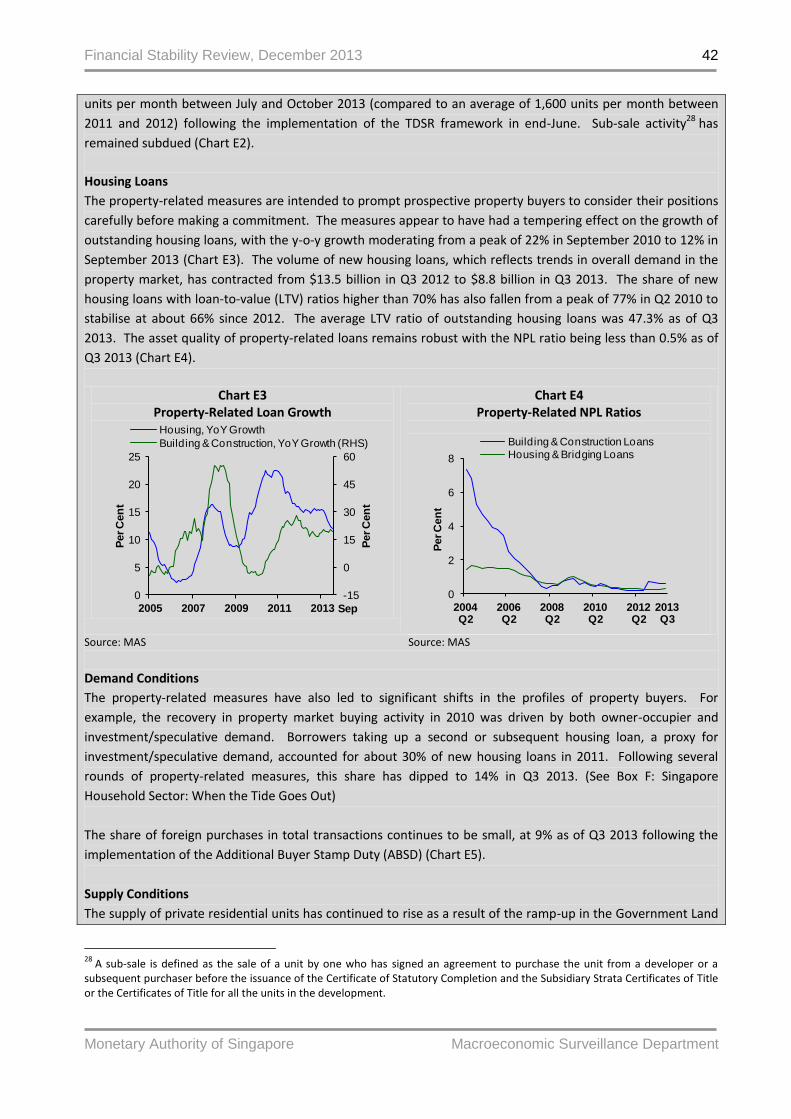
Financial Stability Review, December 2013
Monetary Authority of Singapore Macroeconomic Surveillance Department
42
units per month between July and October 2013 (compared to an average of 1,600 units per month between
2011 and 2012) following the implementation of the TDSR framework in end-June. Sub-sale activity28 has
remained subdued (Chart E2).
Housing Loans
The property-related measures are intended to prompt prospective property buyers to consider their positions
carefully before making a commitment. The measures appear to have had a tempering effect on the growth of
outstanding housing loans, with the y-o-y growth moderating from a peak of 22% in September 2010 to 12% in
September 2013 (Chart E3). The volume of new housing loans, which reflects trends in overall demand in the
property market, has contracted from $13.5 billion in Q3 2012 to $8.8 billion in Q3 2013. The share of new
housing loans with loan-to-value (LTV) ratios higher than 70% has also fallen from a peak of 77% in Q2 2010 to
stabilise at about 66% since 2012. The average LTV ratio of outstanding housing loans was 47.3% as of Q3
2013. The asset quality of property-related loans remains robust with the NPL ratio being less than 0.5% as of
Q3 2013 (Chart E4).
Chart E3 Property-Related Loan Growth
Chart E4 Property-Related NPL Ratios
Source: MAS Source: MAS
Demand Conditions
The property-related measures have also led to significant shifts in the profiles of property buyers. For
example, the recovery in property market buying activity in 2010 was driven by both owner-occupier and
investment/speculative demand. Borrowers taking up a second or subsequent housing loan, a proxy for
investment/speculative demand, accounted for about 30% of new housing loans in 2011. Following several
rounds of property-related measures, this share has dipped to 14% in Q3 2013. (See Box F: Singapore
Household Sector: When the Tide Goes Out)
The share of foreign purchases in total transactions continues to be small, at 9% as of Q3 2013 following the
implementation of the Additional Buyer Stamp Duty (ABSD) (Chart E5).
Supply Conditions
The supply of private residential units has continued to rise as a result of the ramp-up in the Government Land
28
A sub-sale is defined as the sale of a unit by one who has signed an agreement to purchase the unit from a developer or a subsequent purchaser before the issuance of the Certificate of Statutory Completion and the Subsidiary Strata Certificates of Title or the Certificates of Title for all the units in the development.
-15
0
15
30
45
60
0
5
10
15
20
25
2005 2007 2009 2011 2013
Per C
en
t
Per C
en
t
Housing, YoY Growth
Building & Construction, YoY Growth (RHS)
Sep
0
2
4
6
8
2004Q2
2006Q2
2008Q2
2010Q2
2012Q2
Per C
en
tBuilding & Construction LoansHousing & Bridging Loans
2013 Q3

Financial Stability Review, December 2013
Monetary Authority of Singapore Macroeconomic Surveillance Department
43
Sales (GLS) programme. As at Q3 2013, there was a total supply of about 84,900 uncompleted private
residential units from projects in the pipeline, an increase of about 13% compared to the average supply in the
last three years. Of these uncompleted units, about 37% remained unsold as at Q3 2013 (Chart E6). Apart
from these, there were also 12,400 Executive Condominium (EC) units in the pipeline. In addition, another
10,000 units will soon be added to the pipeline supply.29 In all, there will be about 107,400 private housing and
EC units in the pipeline, many of which are expected to be completed over the next three to four years.
Chart E5 Private Property Transactions
By Purchaser Type
Source: URA
Chart E6 Pipeline Supply of Private
Residential Units (Excluding ECs)
Source: URA
Conclusion
While the property-related measures taken over the past few years have dampened momentum in the market,
vigilance is needed. Price levels remain high. The Government will continue to monitor the property market
closely, and if necessary, step in to ensure stability and sustainability in the market.
29
These units are from GLS sites that have been awarded to developers, but for which planning approvals have not yet been obtained as at Q3 2013, as well as Confirmed List sites from the H2 2013 GLS Programme which have not yet been awarded.
0
20
40
60
80
100
2005 2007 2009 2011 2013
% S
hare
Foreigner Company
Permanent Resident Singaporean
Q30
20
40
60
80
100
2005 2007 2009 2011 2013
Un
its (T
ho
usan
d)
Unsold Sold
Q3

Financial Stability Review, December 2013
Monetary Authority of Singapore Macroeconomic Surveillance Department
44
Box F
Singapore Household Sector: When the Tide Goes Out
While the overall financial position of Singapore’s household sector is healthy in aggregate (see Section 2.3),
household sector debt has been on a rising trend. Some households could have taken on excessive leverage
over the past few years, lulled by rising property prices as well as relatively easy credit conditions, made
possible by low interest rates and stretched loan tenures. As the vast majority of mortgage loans offered by FIs
in Singapore are floating-rate packages, these households may encounter greater difficulty servicing their debts
should interest rates rise. Lower-income households may be more adversely affected given their smaller
financial buffers.
Overall Household Sector Leverage
The household debt-to-income ratio has risen, from a low of 1.9 times in 2008 during the Lehman crisis to 2.1
times in 2012 (Chart F1). In addition, household debt has grown more quickly than household assets since Q2
2011 (Chart F2).30
Chart F1 Household Debt and Income
Source: MAS estimates, DOS Note: Estimates of household debt are as at Q2, to be consistent with household income estimates.
Chart F2 Growth of Household Assets and Debt
Source: DOS
Housing Debt
Housing loans account for about three-quarters of total household liabilities, and could be a significant source
of risk for households. The credit profile of certain housing loans was a source of concern. For example, the
share of new housing loans with LTVs above 70% rose from 62% in Q1 2009 to 77% in Q2 2010 (Chart F3). Also,
the share of new loans accounted for by borrowers taking on a second or subsequent housing loan (and who
may be taking on greater risk) was about 30% in 2011 (Chart F4). The average loan tenure of new housing
loans lengthened from about 25 years as of Q1 2009 to a record 30 years in Q3 2012 (Chart F5).
However, following successive rounds of property-related measures, the credit profile of housing loans has
improved. For example, with more stringent rules for LTVs and loan tenures, the share of new housing loans
with LTVs above 70% has fallen from a peak of 77% in Q2 2010 to stabilise at about 66% since 2012 (Chart F3).
For outstanding housing loans, the share of loans with LTVs above 70% has fallen from a high of 35% in Q3
30
In Q3 2013, household debt grew by 7.9% y-o-y, while household assets grew by 6.8% y-o-y.
0.0
0.5
1.0
1.5
2.0
2.5
3.0
0
50
100
150
200
250
300
1997 2001 2005 2009
Rati
o
S$ B
illi
on
Estimated Household IncomeHousehold Debt
Household Debt-to-Income Ratio (RHS)
2012
-5
0
5
10
15
20
2004Q1
2006 2008 2010 2012 2013 Q3
Yo
Y %
Gro
wth
Assets Debt

Financial Stability Review, December 2013
Monetary Authority of Singapore Macroeconomic Surveillance Department
45
2009 to 26% in Q3 2013. The share of housing loans in negative equity also remains negligible (Chart F6).
Borrowers taking up a second or subsequent housing loan, accounted for about 30% of new housing loans in
2011. This share has dipped to 14% in Q3 2013 (Chart F4). Furthermore, the average loan tenure of new
housing loans has shortened from 30 years in Q3 2012, to about 24 years currently (Chart F5). While the NPL
ratio for housing loans remains low, close monitoring is warranted. Strains on borrowers can quickly
materialise if the economic outlook and employment conditions worsen, or interest rates – and therefore
mortgage repayments – increase.
Chart F3 New Housing Loans by LTV Ratios
Source: MAS
Chart F4 Share of New Housing Loan Borrowers
with Existing Housing Loans
Source: MAS
Note: The number of housing loans includes new housing loans
under application.
Chart F5 Average Loan Tenure of
New Private Housing Loans
Source: MAS
Chart F6 Outstanding Housing Loans by LTV Ratios
Source: MAS
Simulations show that the current mortgage-servicing burden (mortgage payment as a share of total income)
among households remains manageable. However, certain segments could be vulnerable to adverse changes
in economic and financial conditions. The vast majority of mortgage loans offered by FIs in Singapore are
floating-rate packages. As some households may have over-leveraged in order to buy properties which are
priced higher now than before, strains can quickly materialise if interest rates rise after being at a low level for
a prolonged period of time. For instance, in a scenario where mortgage rates rise by 300 bps, households with
0
20
40
60
80
100
2008 Q1
2009 Q1
2010 Q1
2011 Q1
2012 Q1
2013 Q1
Per
Cen
t
LTV > 80% LTV between 70%-80%
LTV < 70% LTV between 60%-70%
LTV between 50%-60% LTV < 50%
Q30
20
40
60
80
100
2011Jan
2011Jul
2012Jan
2012Jul
2013Jan
2013 Jul
Per
Cen
t
3 and more Loans 2 Loans 1 Loan
Sep
20
22
24
26
28
30
2009Q1
2010Q1
2011Q1
2012Q1
2013Q1
Lo
an
Ten
ure
(in
Years
)
30 years
24 years
Q30
20
40
60
80
100
2004Q2
2006 2008 2010 2012 2013Q3
Per C
en
t
< 70% 70% - 80%80% - 90% 90% - 100%> 100% (-ve equity)

Financial Stability Review, December 2013
Monetary Authority of Singapore Macroeconomic Surveillance Department
46
a current mortgage-servicing ratio (MSR) of 30% could see their MSR rise by 11% points. Households that are
more leveraged would be more adversely affected, with the MSR of households with an initial MSR of 60%
estimated to increase by twice as much (21% points) (Chart F7).
While there is no precise measure to indicate whether a household is over-leveraged, a rough guide could be to
look at the total debt-servicing burden, or the proportion of monthly income used for loan repayments. By this
measure, MAS estimates that about 5-10% of borrowers have monthly debt-servicing burden greater than 60%
and that the percentage of over-leveraged households could increase to 10-15% should mortgage rates rise by
300 bps.
Chart F7
Sensitivity Test on Mortgage Servicing Burden
Source: MAS estimates Note: The sensitivity test uses assumptions of a housing loan tenure of 25 years and uses a medium-term interest rate for the MSR before stress.
MAS has taken a series of measures to promote financial prudence. The TDSR framework announced in June
2013 for property-related loans granted by FIs aims to encourage households to borrow within their means.
Other Components of Household Leverage
Apart from housing loans, MAS is also concerned about other types of household debt such as motor vehicle
loans and unsecured credit facilities (including credit cards). Although these loans account for a smaller share
of household debt compared to housing loans, there remains the risk in this low-interest rate environment that
some households could have overextended themselves in using these credit facilities.
Motor Vehicle Loans
Motor vehicle loans account for a relatively small proportion of overall household debt at 4.6% as of Q3 2013,
but there are signs of some borrowers having overextended themselves. The average motor vehicle loan
quantum increased from about $40,000 in 2006 to about $90,000 as of 2012 (Chart F8). LTVs also tend to be
quite high, despite motor vehicles being depreciating assets.
This year, MAS re-introduced financing restrictions on motor vehicle loans, to instill financial prudence among
households and to dampen the demand for motor vehicles and hence moderate COE prices and the CPI. Since
the introduction of the financing restrictions, the outstanding volume of motor vehicle loans has decreased
from $13.8 billion in Q1 2013 to $12.7 billion in Q3 2013.
2030
4050
607
11
14
17
21
0
20
40
60
80
100
Per
Cen
t
Increase in Mortgage-Servicing Ratio due to Medium-Term Interest Rate Rising by 300bps
MSR before Stress

Financial Stability Review, December 2013
Monetary Authority of Singapore Macroeconomic Surveillance Department
47
Chart F8 Average Motor Vehicle Loan Quantum
Source: Credit Bureau Singapore (CBS)
Credit Cards and Unsecured Credit
Some households could have taken on excessive credit card debt. In the first nine months of this year, the
number of cards in active circulation increased from 9.4 million to 9.7 million, which translated to an average of
about five cards per cardholder. While the growing use of credit cards can be attributed to the marketing
activities of banks and credit card companies, the convenience provided by such cards and rising income among
households, it could also lead to excessive credit card borrowing. Indeed, outstanding credit card balances
have been rising, and currently stand at $10.3 billion (Chart F9).
Even though the credit card charge-off rates31 have remained largely stable at 4-5% since 2010, some risks exist
(Chart F10). For example, the number of frequent revolvers32 has increased over the last five years alongside
the rising number of credit cardholders across all age groups (Chart F11).
Accordingly, steps to pre-empt excesses from building up are necessary. The credit card and unsecured credit
policies recently announced by MAS aim to discourage individuals from spending beyond their means. These
include preventing FIs from extending further credit to a borrower who exceeds the cap on the total amount of
unsecured credit that can be obtained from across all FIs, or who is more than 60 days past due on his loans.
Chart F9 Outstanding Credit Card Balances
Source: MAS
Chart F10 Credit Card Charge-off Rates
Source: MAS
31
The charge-off rate refers to bad debts written off expressed as a percentage of total rollover balances. 32
“Frequent revolvers” refer to those who have not paid their outstanding balances in full for at least three consecutive months.
0
20
40
60
80
100
2006 2007 2008 2009 2010 2011 2012
Un
its (T
ho
usan
d)
0
5
10
15
20
0
3
6
9
12
2004 2006 2008 2010 2012
Per C
en
t
S$ B
illio
n
Total Outstanding Balance
YoY Growth of Total Outstanding Balance (RHS)
2013 Q3
0
2
4
6
8
10
2004 2006 2008 2010 2012
Per C
en
t
2013 Q3

Financial Stability Review, December 2013
Monetary Authority of Singapore Macroeconomic Surveillance Department
48
Chart F11 Number of Frequent Revolvers Across Age Groups
and Number of Cardholders33
Source: CBS
Conclusion
With household leverage continuing to rise in a low interest rate environment, certain segments of
households, especially those with lower incomes and/or higher debt-servicing burdens, could be more
vulnerable to adverse shocks. The various measures MAS has recently taken aim to encourage greater financial
prudence among households on three fronts – housing loans, motor vehicle loans, and unsecured credit.
33
Note: Number of cardholders refers to main cardholders.
0.0
0.5
1.0
1.5
2.0
0
40
80
120
160
2004 2006 2008 2010 2012
Un
its (
Mil
lio
n)
Un
its (
Th
ou
san
d)
21-29 30-3940-49 50&OverNo of Cardholders (RHS)

Financial Stability Review, December 2013
Monetary Authority of Singapore Macroeconomic Surveillance Department
49
2.4 Banking Sector
Singapore’s banking system has stayed resilient through 2013. The local banks remain well-capitalised,
and already meet Basel III capital requirements.
Reflecting confidence in Asia, the banking system’s cross-border exposure to the region has increased.
This confidence should be balanced with an appropriate dose of vigilance. Stresses arising from tightening
financial conditions can manifest themselves quickly. Banks need to monitor and manage the risks from
different types of exposures carefully.
At this juncture, asset quality remains healthy, but this could deteriorate if an unexpectedly sharp rise in
interest rates puts a strain on the debt-servicing ability of over-extended borrowers.
Banks should also continue to manage their foreign-currency liquidity risks prudently, as an abrupt global
financial tightening could result in US dollar liquidity stresses.
Singapore’s banking system has remained resilient
and overall loan growth has stayed firm,
with non-bank loans the key driver
Singapore’s banking system has remained resilient
through 2013 and loan growth has continued to be
firm, despite uncertainties in the outlook for the world
economy and considerable volatility in the global
financial system.
Several factors have been key – growth, interest rates
and the financial resilience of borrowers. Singapore’s
GDP growth has held up despite swings in momentum,
and is expected to do so as well in 2014. Despite some
indications of G3 policy normalisation in the not-too-
distant future, interest rates have continued to be low.
The balance sheets of both the corporate and
household sectors have remained healthy in aggregate.
Given such conditions, overall loan growth has stayed
firm through 2013, up from 1.3% y-o-y in Q3 2012 to
9.6% y-o-y in Q3 this year (Chart 2.4.1).
Non-bank loan growth has been the key driver,
accelerating from 9.7% in Q3 2012 to 16.4% y-o-y in Q3
2013. In particular, there has been stronger growth in
Asian Currency Unit (ACU) non-bank lending since Q3
2012.
Interbank lending has returned to positive growth of
Chart 2.4.1 Components of Overall Loan Growth
Source: MAS
Chart 2.4.2
Growth of ACU Cross-Border Interbank Loans by Region
Source: MAS
-15
-10
-5
0
5
10
15
20
25
2008 2009 2010 2011 2012 2013 Q3
% P
oin
t C
on
trib
uti
on
to Y
oY
% G
row
th
Total DBU Interbank LoansTotal ACU Interbank LoansTotal DBU Non-Bank LoansTotal ACU Non-Bank LoansYoY Growth
-60
-40
-20
0
20
40
60
2008 2009 2010 2011 2012 2013
Yo
Y %
Gro
wth
Asia AmericasEurope OthersTotal
Sep

Financial Stability Review, December 2013
Monetary Authority of Singapore Macroeconomic Surveillance Department
50
0.6% y-o-y in Q3 this year, after contracting for six
consecutive quarters. ACU interbank loan growth
turned positive, offsetting the continued contraction in
DBU interbank loans.
Increased cross-border lending to Asia
reflect continued confidence in the region,
but there is a need to remain mindful of risks
The banking system’s cross-border exposure to Asia
has increased in both the interbank and non-bank
markets.
The pick-up in outstanding ACU cross-border interbank
loan growth to 5.1% y-o-y in Q3 2013 has been driven
primarily by exposures to Asia (Chart 2.4.2). In
contrast, interbank loans to the Americas and Europe
have contracted for the most part since Q3 2012. As a
result, Asia now accounts for a substantially bigger
share of total ACU cross-border interbank loans than
pre-Lehman – 57% against 43% (Chart 2.4.3).
Meanwhile, the volume of ACU cross-border non-bank
loans has expanded in a broad-based manner across all
regions, although Asia dominates. The pace has picked
up from 0.9% y-o-y in Q3 2012 to 17.6% y-o-y in Q3
2013 (Chart 2.4.4). Asia now accounts for 60% of ACU
cross-border non-bank loans (Chart 2.4.5).
In terms of types of facilities, syndicated loans and
trade finance facilities have continued to grow
robustly, with the rate of expansion picking up from
three-year lows of 4.2% and 9.3% in Q3 2012
respectively to 7.3% y-o-y and 33.5% y-o-y in Q3 2013.
Local banks and other Asian banks operating in
Singapore have substantially increased their market
share for syndicated loan and trade finance activities
since the GFC (Chart 2.4.6). This is notwithstanding
recent signs of some European banks increasing their
trade finance activities, and regaining some market
share.
Clearly, Singapore-based banks have remained
confident about the prospects for their Asian
Chart 2.4.3 ACU Cross-Border
Interbank Loans by Region
Source: MAS
Chart 2.4.4 Growth of ACU Cross-Border Non-Bank Loans by Region
Source: MAS
Chart 2.4.5 ACU Cross-Border
Non-Bank Loans by Region
Source: MAS
0
150
300
450
600
750
2008 2009 2010 2011 2012 2013
S$ B
illio
n
Asia Americas Europe Others
Sep
-40
-20
0
20
40
60
2008 2009 2010 2011 2012 2013
Yo
Y %
Gro
wth
Asia AmericasEurope OthersTotal
Sep
0
70
140
210
280
350
2008 2009 2010 2011 2012 2013
S$ B
illio
n
Asia Americas Europe Others
SepSep
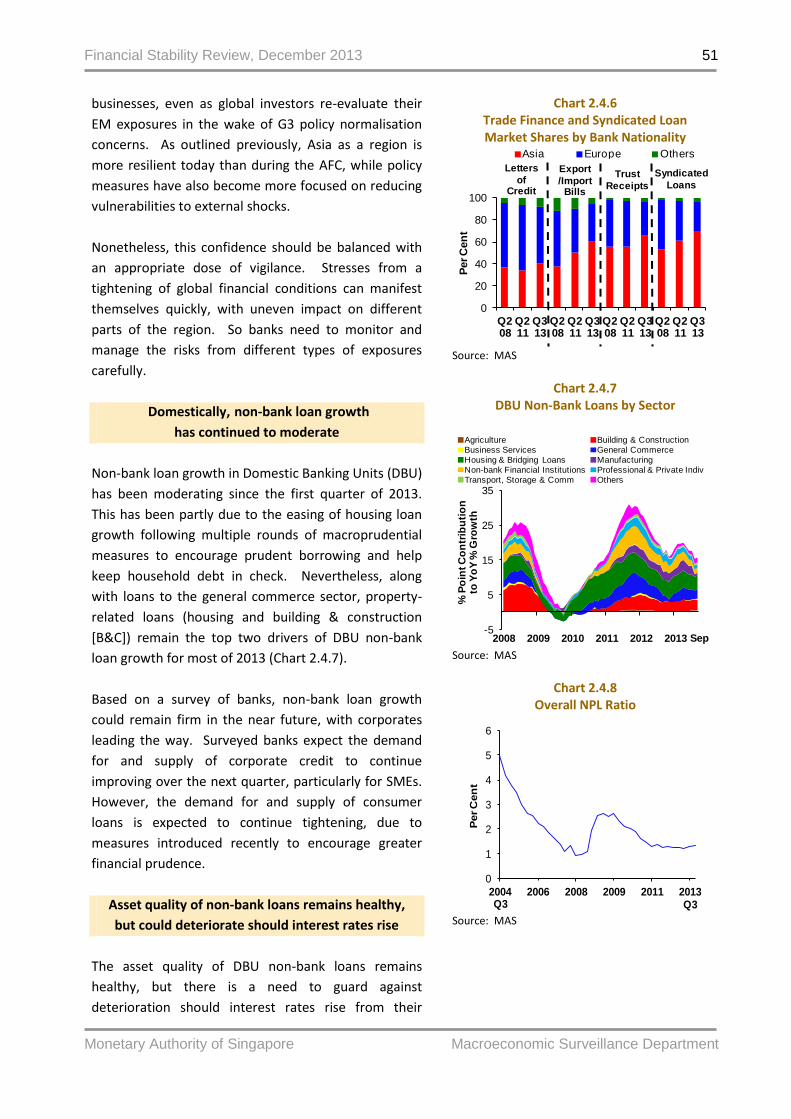
Financial Stability Review, December 2013
Monetary Authority of Singapore Macroeconomic Surveillance Department
51
businesses, even as global investors re-evaluate their
EM exposures in the wake of G3 policy normalisation
concerns. As outlined previously, Asia as a region is
more resilient today than during the AFC, while policy
measures have also become more focused on reducing
vulnerabilities to external shocks.
Nonetheless, this confidence should be balanced with
an appropriate dose of vigilance. Stresses from a
tightening of global financial conditions can manifest
themselves quickly, with uneven impact on different
parts of the region. So banks need to monitor and
manage the risks from different types of exposures
carefully.
Domestically, non-bank loan growth
has continued to moderate
Non-bank loan growth in Domestic Banking Units (DBU)
has been moderating since the first quarter of 2013.
This has been partly due to the easing of housing loan
growth following multiple rounds of macroprudential
measures to encourage prudent borrowing and help
keep household debt in check. Nevertheless, along
with loans to the general commerce sector, property-
related loans (housing and building & construction
[B&C]) remain the top two drivers of DBU non-bank
loan growth for most of 2013 (Chart 2.4.7).
Based on a survey of banks, non-bank loan growth
could remain firm in the near future, with corporates
leading the way. Surveyed banks expect the demand
for and supply of corporate credit to continue
improving over the next quarter, particularly for SMEs.
However, the demand for and supply of consumer
loans is expected to continue tightening, due to
measures introduced recently to encourage greater
financial prudence.
Asset quality of non-bank loans remains healthy,
but could deteriorate should interest rates rise
The asset quality of DBU non-bank loans remains
healthy, but there is a need to guard against
deterioration should interest rates rise from their
Chart 2.4.6 Trade Finance and Syndicated Loan Market Shares by Bank Nationality
Source: MAS
Chart 2.4.7
DBU Non-Bank Loans by Sector
Source: MAS
Chart 2.4.8
Overall NPL Ratio
Source: MAS
0
20
40
60
80
100
Q208
Q211
Q313
Q208
Q211
Q313
Q208
Q211
Q313
Q208
Q211
Q313
Per C
en
t
Asia Europe Others
Export
/Import Bills
Letters
of Credit
Trust
Receipts
Syndicated
Loans
-5
5
15
25
35
2008 2009 2010 2011 2012 2013
% P
oin
t C
on
trib
uti
on
to Y
oY
% G
row
th
Agriculture Building & ConstructionBusiness Services General Commerce
Housing & Bridging Loans ManufacturingNon-bank Financial Institutions Professional & Private IndivTransport, Storage & Comm Others
Sep
0
1
2
3
4
5
6
2004Q3
2006 2008 2009 2011 2013Q2
Per C
en
t
Q3

Financial Stability Review, December 2013
Monetary Authority of Singapore Macroeconomic Surveillance Department
52
current low levels.
The overall NPL ratio ticked up slightly to 1.3% (Chart
2.4.8). The rise in NPLs has been concentrated in the
general commerce sector, as well as the TSC sector
which has been impacted by the global slump in the
shipping industry.
Looking ahead, should advanced countries start
normalising policy, interest rates in Singapore could
rise from the low levels which they have been at. An
unexpectedly sharp increase, especially if it comes
earlier than expected, could strain the debt-servicing
ability of over-extended borrowers.
In this regard, it is notable that both corporate and
household sector leverage have trended up over the
past few years as evidenced by the increase in
corporate debt-to-equity ratios (Chart 2.2.7) and
household debt-to-income ratios (Chart F1) in recent
years.
With the economic outlook still uncertain but interest
rates increases looking more likely, the risk of banks’
asset quality deteriorating cannot be discounted.
Banks should therefore continue to maintain sound
underwriting standards, including pricing risks
appropriately and managing credit concentration risks
effectively. Banks should also continue to monitor
their borrowers’ financial health in line with sound risk
management practices.
SGD funding for domestic lending remains adequate,
but non-SGD funding risk persists
and warrants close monitoring
SGD funding for domestic lending remains adequate,
but non-SGD funding risk persists and warrants close
monitoring.
Both SGD (Chart 2.4.9) and non-SGD LTD ratios (Chart
2.4.10) have trended up over the past year, although
they remain far below their historical peaks.
Chart 2.4.9 Banking System SGD
Loan-To-Deposit Ratio
Source: MAS
Chart 2.4.10
Banking System Non-SGD Loan-To-Deposit Ratio
Source: MAS
Chart 2.4.11
Local Banks’ Profit Components and Net Interest Margin
Source: Local banks’ financial statements
40
60
80
100
120
Per C
en
t
2013 Sep
0
60
120
180
240
300P
er C
en
t
Sep
-4
-2
0
2
4
6
8
2008 2009 2010 2011 2012 2013
S$ B
illio
n
Net Interest IncomeStaff CostsOther Operating ExpensesProvisioning Expenditure and TaxOther IncomeNet Profit Attributable to Shareholders
2013 Q3
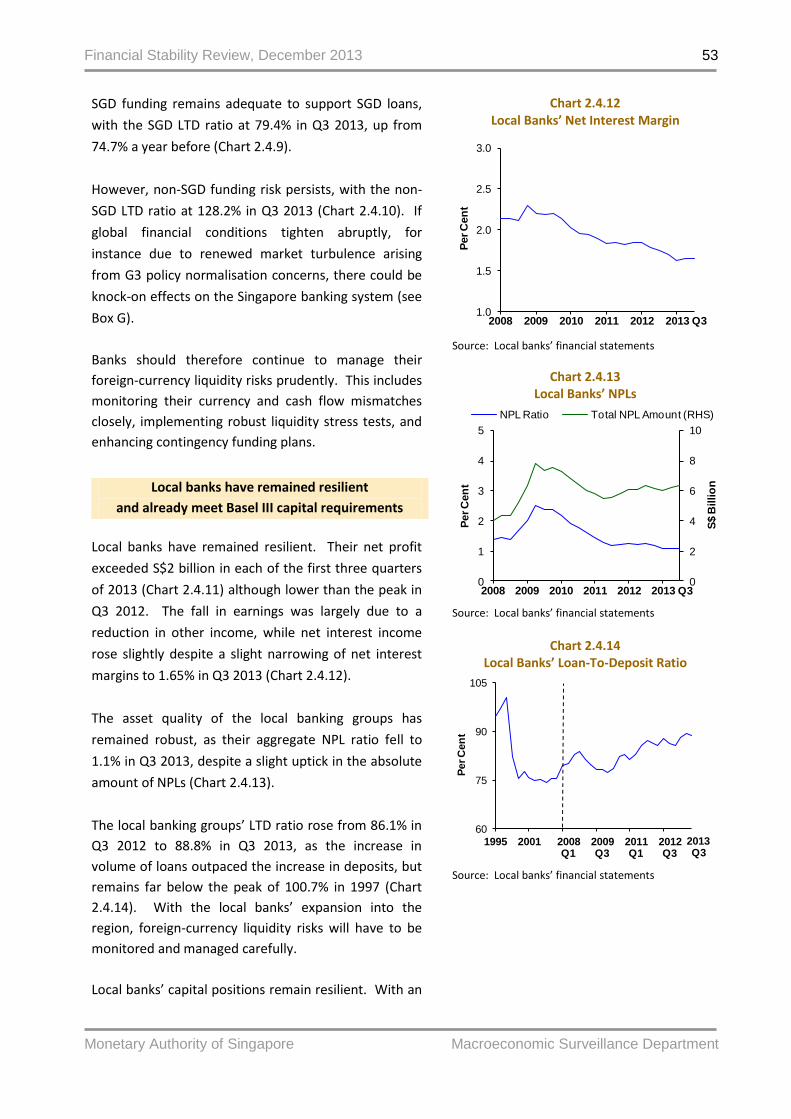
Financial Stability Review, December 2013
Monetary Authority of Singapore Macroeconomic Surveillance Department
53
SGD funding remains adequate to support SGD loans,
with the SGD LTD ratio at 79.4% in Q3 2013, up from
74.7% a year before (Chart 2.4.9).
However, non-SGD funding risk persists, with the non-
SGD LTD ratio at 128.2% in Q3 2013 (Chart 2.4.10). If
global financial conditions tighten abruptly, for
instance due to renewed market turbulence arising
from G3 policy normalisation concerns, there could be
knock-on effects on the Singapore banking system (see
Box G).
Banks should therefore continue to manage their
foreign-currency liquidity risks prudently. This includes
monitoring their currency and cash flow mismatches
closely, implementing robust liquidity stress tests, and
enhancing contingency funding plans.
Local banks have remained resilient
and already meet Basel III capital requirements
Local banks have remained resilient. Their net profit
exceeded S$2 billion in each of the first three quarters
of 2013 (Chart 2.4.11) although lower than the peak in
Q3 2012. The fall in earnings was largely due to a
reduction in other income, while net interest income
rose slightly despite a slight narrowing of net interest
margins to 1.65% in Q3 2013 (Chart 2.4.12).
The asset quality of the local banking groups has
remained robust, as their aggregate NPL ratio fell to
1.1% in Q3 2013, despite a slight uptick in the absolute
amount of NPLs (Chart 2.4.13).
The local banking groups’ LTD ratio rose from 86.1% in
Q3 2012 to 88.8% in Q3 2013, as the increase in
volume of loans outpaced the increase in deposits, but
remains far below the peak of 100.7% in 1997 (Chart
2.4.14). With the local banks’ expansion into the
region, foreign-currency liquidity risks will have to be
monitored and managed carefully.
Local banks’ capital positions remain resilient. With an
Chart 2.4.12 Local Banks’ Net Interest Margin
Source: Local banks’ financial statements
Chart 2.4.13 Local Banks’ NPLs
Source: Local banks’ financial statements
Chart 2.4.14
Local Banks’ Loan-To-Deposit Ratio
Source: Local banks’ financial statements
1.0
1.5
2.0
2.5
3.0
2008 2009 2010 2011 2012 2013
Per C
en
t
Q3
0
2
4
6
8
10
0
1
2
3
4
5
2008 2009 2010 2011 2012 2013
S$ B
illio
n
Per C
en
t
NPL Ratio Total NPL Amount (RHS)
Q3
60
75
90
105
1995 2001 2008 Q1
2009Q3
2011 Q1
2012Q3
Per C
en
t
2013Q3

Financial Stability Review, December 2013
Monetary Authority of Singapore Macroeconomic Surveillance Department
54
average Tier 1 Capital Adequacy Ratio (CAR) of 13.5% in
Q3 2013 (Chart 2.4.15), the banks are well above MAS’
regulatory requirement of 8% applicable from 1
January 2015.
Local banks must continue to be vigilant against
risks from a changing operating environment
Local banks must continue to be vigilant against risks
due to changes in their operating environment.
From their current position of resilience, local banks
should continue to manage their risks prudently.
These include maintaining prudent underwriting
standards and robust monitoring of credit
performance, and taking measures to improve their
USD funding profiles. In this regard, local banks have
already taken steps such as raising USD term funding,
diversifying USD funding sources and stepping up USD
deposit-taking efforts.
Chart 2.4.15 Local Banks’ Capital Adequacy Ratio (CAR)
Source: Local banks’ financial statements
0
5
10
15
20
2008 2009 2010 2011 2012 2013 Q3
Per C
en
t
Tier-1 CAR Total CAR
MAS Tier-1 CAR Minimum Requirement
MAS Total CAR Minimum Requirement
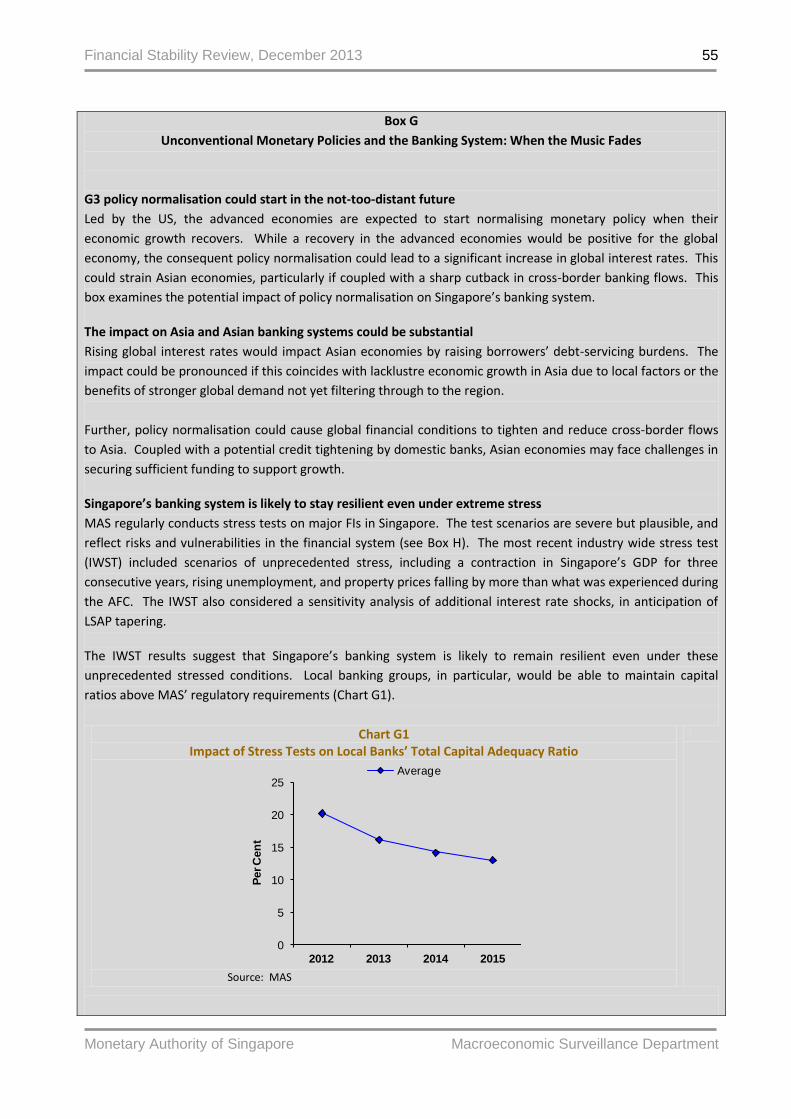
Financial Stability Review, December 2013
Monetary Authority of Singapore Macroeconomic Surveillance Department
55
Box G
Unconventional Monetary Policies and the Banking System: When the Music Fades
G3 policy normalisation could start in the not-too-distant future
Led by the US, the advanced economies are expected to start normalising monetary policy when their
economic growth recovers. While a recovery in the advanced economies would be positive for the global
economy, the consequent policy normalisation could lead to a significant increase in global interest rates. This
could strain Asian economies, particularly if coupled with a sharp cutback in cross-border banking flows. This
box examines the potential impact of policy normalisation on Singapore’s banking system.
The impact on Asia and Asian banking systems could be substantial
Rising global interest rates would impact Asian economies by raising borrowers’ debt-servicing burdens. The
impact could be pronounced if this coincides with lacklustre economic growth in Asia due to local factors or the
benefits of stronger global demand not yet filtering through to the region.
Further, policy normalisation could cause global financial conditions to tighten and reduce cross-border flows
to Asia. Coupled with a potential credit tightening by domestic banks, Asian economies may face challenges in
securing sufficient funding to support growth.
Singapore’s banking system is likely to stay resilient even under extreme stress
MAS regularly conducts stress tests on major FIs in Singapore. The test scenarios are severe but plausible, and
reflect risks and vulnerabilities in the financial system (see Box H). The most recent industry wide stress test
(IWST) included scenarios of unprecedented stress, including a contraction in Singapore’s GDP for three
consecutive years, rising unemployment, and property prices falling by more than what was experienced during
the AFC. The IWST also considered a sensitivity analysis of additional interest rate shocks, in anticipation of
LSAP tapering.
The IWST results suggest that Singapore’s banking system is likely to remain resilient even under these
unprecedented stressed conditions. Local banking groups, in particular, would be able to maintain capital
ratios above MAS’ regulatory requirements (Chart G1).
Chart G1 Impact of Stress Tests on Local Banks’ Total Capital Adequacy Ratio
Source: MAS
0
5
10
15
20
25
2012 2013 2014 2015
Per C
en
t
Average

Financial Stability Review, December 2013
Monetary Authority of Singapore Macroeconomic Surveillance Department
56
Independently, the IMF’s stress tests for Singapore, conducted as part of the Financial Sector Assessment
Programme (FSAP), yielded similar outcomes. The IMF concluded that stress tests suggest banks in Singapore
are resilient to adverse macroeconomic scenarios.
Domestic funding sources would likely be sufficient to meet domestic needs...
As a financial centre, Singapore’s banking system serves the financing needs of borrowers based in Singapore
as well as intermediates cross-border banking flows to and from Asia. The banking system does not rely on
foreign funding to support domestic lending. Funds sourced from within Singapore exceed loans to domestic
borrowers, both in the interbank (Chart G2) and non-bank markets (Chart G3). Ample funding from domestic
sources helps to insulate the economy from funding shortages during times of stress.
Chart G2 Banking System Interbank Funding vs. Lending
(As at Sep 2013)
Source: MAS
Chart G3 Banking System Non-Bank Funding vs. Lending
(As at Sep 2013)
Source: MAS
But USD liquidity challenges for some banks could affect their cross-border lending activity
However, a rapid cutback in cross-border banking flows could pose USD liquidity management challenges for
some banks. In the event of a very severe stress that causes the swap markets to stall, some banks may
encounter USD funding shortages and their cross-border lending activity could be adversely affected. To
mitigate this risk, banks have taken steps to diversify their funding sources, for example, by issuing USD debt.
Singapore is well positioned to weather spillover effects of G3 policy normalisation
Overall, Singapore is well positioned to weather strains which may result from policy normalisation by
advanced economies. The banking system is likely to remain resilient under stressed conditions and banks
have taken steps to diversify funding sources. MAS will remain vigilant in watching out for unforeseen risks and
their implications for the banking system as we transition to more normal monetary conditions globally.
0
250
500
750
1,000
InterbankDeposits
Interbank Lending
S$ B
illio
n
Singapore Rest of the World
0
300
600
900
1,200
Non-bank Deposits
Non-bank Lending
S$ B
illio
n
Singapore Rest of the World
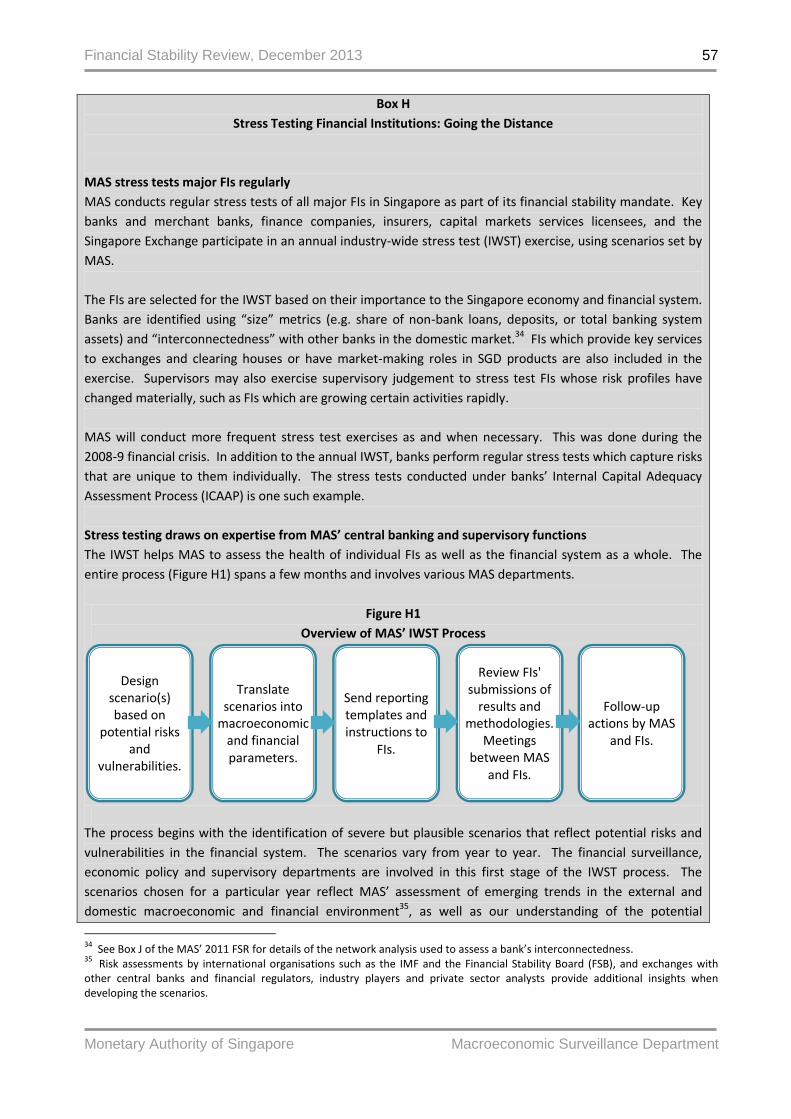
Financial Stability Review, December 2013
Monetary Authority of Singapore Macroeconomic Surveillance Department
57
Box H
Stress Testing Financial Institutions: Going the Distance
MAS stress tests major FIs regularly
MAS conducts regular stress tests of all major FIs in Singapore as part of its financial stability mandate. Key
banks and merchant banks, finance companies, insurers, capital markets services licensees, and the
Singapore Exchange participate in an annual industry-wide stress test (IWST) exercise, using scenarios set by
MAS.
The FIs are selected for the IWST based on their importance to the Singapore economy and financial system.
Banks are identified using “size” metrics (e.g. share of non-bank loans, deposits, or total banking system
assets) and “interconnectedness” with other banks in the domestic market.34 FIs which provide key services
to exchanges and clearing houses or have market-making roles in SGD products are also included in the
exercise. Supervisors may also exercise supervisory judgement to stress test FIs whose risk profiles have
changed materially, such as FIs which are growing certain activities rapidly.
MAS will conduct more frequent stress test exercises as and when necessary. This was done during the
2008-9 financial crisis. In addition to the annual IWST, banks perform regular stress tests which capture risks
that are unique to them individually. The stress tests conducted under banks’ Internal Capital Adequacy
Assessment Process (ICAAP) is one such example.
Stress testing draws on expertise from MAS’ central banking and supervisory functions
The IWST helps MAS to assess the health of individual FIs as well as the financial system as a whole. The
entire process (Figure H1) spans a few months and involves various MAS departments.
Figure H1
Overview of MAS’ IWST Process
The process begins with the identification of severe but plausible scenarios that reflect potential risks and
vulnerabilities in the financial system. The scenarios vary from year to year. The financial surveillance,
economic policy and supervisory departments are involved in this first stage of the IWST process. The
scenarios chosen for a particular year reflect MAS’ assessment of emerging trends in the external and
domestic macroeconomic and financial environment35, as well as our understanding of the potential
34
See Box J of the MAS’ 2011 FSR for details of the network analysis used to assess a bank’s interconnectedness. 35
Risk assessments by international organisations such as the IMF and the Financial Stability Board (FSB), and exchanges with other central banks and financial regulators, industry players and private sector analysts provide additional insights when developing the scenarios.
Design scenario(s) based on
potential risks and
vulnerabilities.
Translate scenarios into
macroeconomic and financial parameters.
Send reporting templates and instructions to
FIs.
Review FIs' submissions of
results and methodologies.
Meetings between MAS
and FIs.
Follow-up actions by MAS
and FIs.

Financial Stability Review, December 2013
Monetary Authority of Singapore Macroeconomic Surveillance Department
58
vulnerabilities and transmission channels of the financial system, any new and fast-growing activities, and
FIs’ business models. This inclusive and rigorous process aims to minimise the possibility of key risks being
omitted or not given enough emphasis.
The scenarios selected are translated into macroeconomic and financial variables with specific numbers or
values attached, using a combination of quantitative tools and expert judgement. As Singapore is a very
open economy, the stress scenario(s) will include macroeconomic variables of external economies that have
significant trade and financial linkages with Singapore. MAS’ macro-econometric model of the economy is
used to ensure that the projections of Singapore’s macroeconomic variables are model-consistent with
forecasts of external macroeconomic variables. Financial market variables (such as credit spreads and yield
curves) are in turn produced through a variety of methods, including satellite models which link
macroeconomic variables with financial market rates or indices, benchmarking against historical stress
periods/crises, and views of industry analysts.
A common set of stress parameters, together with a qualitative description of the scenario(s) chosen, is
communicated to participating FIs for their stress tests. Relevant data templates and instructions are
included to facilitate the FIs’ stress tests and submissions to MAS. Upon receiving the FIs’ results, MAS
validates them for accuracy, reasonableness and robustness. While MAS does not prescribe the stress test
methodologies that FIs use, we assess them rigorously with a view to verifying that risk exposures are
sufficiently covered, and the methodologies employed are sensitive to such risks.
FIs in the IWST exercise vary greatly in terms of the size and complexity of their business operations, and
MAS encourages them to develop stress test methodologies which are commensurate with their risks. The
use of FI-specific granular data, an intimate understanding of customer profiles and knowledge of their own
global strategies and risk appetites enable FIs to customise the stress test methodologies to best suit their
needs.
MAS invests significant resources to analyse the stress test results submitted by FIs (“bottom-up” stress
testing). MAS meets FIs to establish a deeper understanding of the methodologies employed, including any
additional assumptions made. Given the common scenarios prescribed, peer analyses of the results allow
MAS to identify weaknesses arising from FIs’ risk exposures and stress testing methodologies. For example,
an analysis based on common borrowers across FIs is used to assess the relative severity of banks’
approaches.36
MAS complements the industry’s “bottom-up” stress testing with MAS’ own “top-down” stress testing.
Unlike the “bottom-up” stress test, a common methodology is applied for the “top-down” stress test, so as
to produce results that can be compared across the FIs. This provides an additional perspective and serves
as a robustness check of the banks’ stress test results.
Stress tests results are used to engage FIs on risk management issues and to assess financial stability
Stress testing is critical to FIs’ risk management. MAS expects the boards of directors and senior
management of FIs to be involved in the stress testing process, as part of their risk management oversight.
36
As an example, suppose Company X is a client of both Bank A and Bank B, i.e. Company X is a common borrower of Banks A and B. By comparing the degree of credit deterioration of Company X that Bank A and Bank B expect under the stress scenario, MAS obtains a perspective of the relative severity of stress testing methodologies of Bank A and Bank B.

Financial Stability Review, December 2013
Monetary Authority of Singapore Macroeconomic Surveillance Department
59
Stress test results – from both “bottom-up” and “top-down” exercises – serve as useful inputs for MAS to
engage FIs in discussions on their resilience to plausible severe scenarios, their planned responses, and
actions to mitigate risk management gaps identified from the exercise.
MAS uses the stress test results in assessing Singapore’s financial stability. The stress test results help us
identify common vulnerabilities across FIs, such as exposures to a particular sector or country. Reverse
stress tests, where FIs describe scenarios in which their solvency would come under threat, provide further
insights on the risks that could impair Singapore’s financial system. Stress testing also allows MAS to assess
the sensitivity of the financial system to different stress events. Stress test results inform our regulatory and
macroprudential policies, such as the resilience of our banking system to property price corrections and the
appropriate capital requirements to impose on key FIs.
The 2013 stress test exercise was based on severe stress scenarios
The 2013 IWST exercise formed part of the IMF’s assessment of Singapore’s financial sector under its FSAP
this year. It featured a baseline scenario, consistent with what was covered in the IMF October 2012 WEO,
and two stress scenarios which were also formulated based on IMF’s requirements.
The scenarios capture a combination of economic and financial shocks which are severe by historical
standards. Key macroeconomic variables (i.e. parameters used for stress testing) were distilled from
previous stress tests based on the variables which would have the most impact on corporate and households
loans, and on banks’ overall exposure. For example, the performance of corporate loans tends to be
affected by overall or sectoral GDP growth, property prices, interest rates and sometimes exchange rates.
Consumer loans are sensitive to the unemployment rate, property prices and interest rates. Banks are also
impacted by the macroeconomic and financial variables of other countries to which they have exposures.
Feedback loops and contagion effects across variables were incorporated by judgmentally increasing the
severity of the stress parameters.
The first stress scenario is a ‘V-shaped’ recession in Singapore, driven by a hard landing in China and an
intensification of the euro zone crisis. The second stress scenario is triggered by depressed US economic
activity arising from fiscal uncertainty and a deeper recession in the euro zone. This leads to an
unprecedented downturn in Singapore which lasts three years. Singapore’s GDP contracts sharply in the
first scenario and enters a prolonged decline in the second scenario. In both scenarios, the local
unemployment rate rises above that seen during the AFC and property prices fall dramatically. The IWST
also included a sensitivity analysis of interest rate shocks arising from a potential LSAP tapering.
Key FIs remain resilient under extreme stresses
Results from this year’s exercise show that the major banks would remain solvent under severe stress
scenarios. In particular, the local banks’ capital adequacy ratios would remain above Basel III capital
requirements. The IMF’s stress test, which extends the stress period to five years, produced similar results,
underscoring the resilience of Singapore’s financial system. It also validates the robustness of MAS’ stress
testing framework.
The resilience of the major banks is corroborated by their current credit ratings. Moody’s continues to
assign the local banks the highest average credit ratings (Aa1) among banking systems globally. Likewise,
Standard & Poor’s (S&P) recently affirmed the local banks’ strong AA- ratings and “Stable” outlook, based on
their strong financial profiles and prudent management strategies.

Financial Stability Review, December 2013
Monetary Authority of Singapore Macroeconomic Surveillance Department
60
MAS will continue to refine our “bottom-up” and “top-down” stress testing processes
Stress testing is and will remain integral to MAS’ surveillance of the financial sector and supervision of FIs.
MAS will work closely with industry participants to enhance their stress testing capabilities. At the same
time, MAS will refine its own stress testing methodologies to better incorporate macro-financial linkages,
feedback loops and contagion effects, to complement the microprudential focus of FIs’ stress tests. Like
other authorities, MAS will continue to leverage on simulations and stress tests to guide us in policy
formulation.
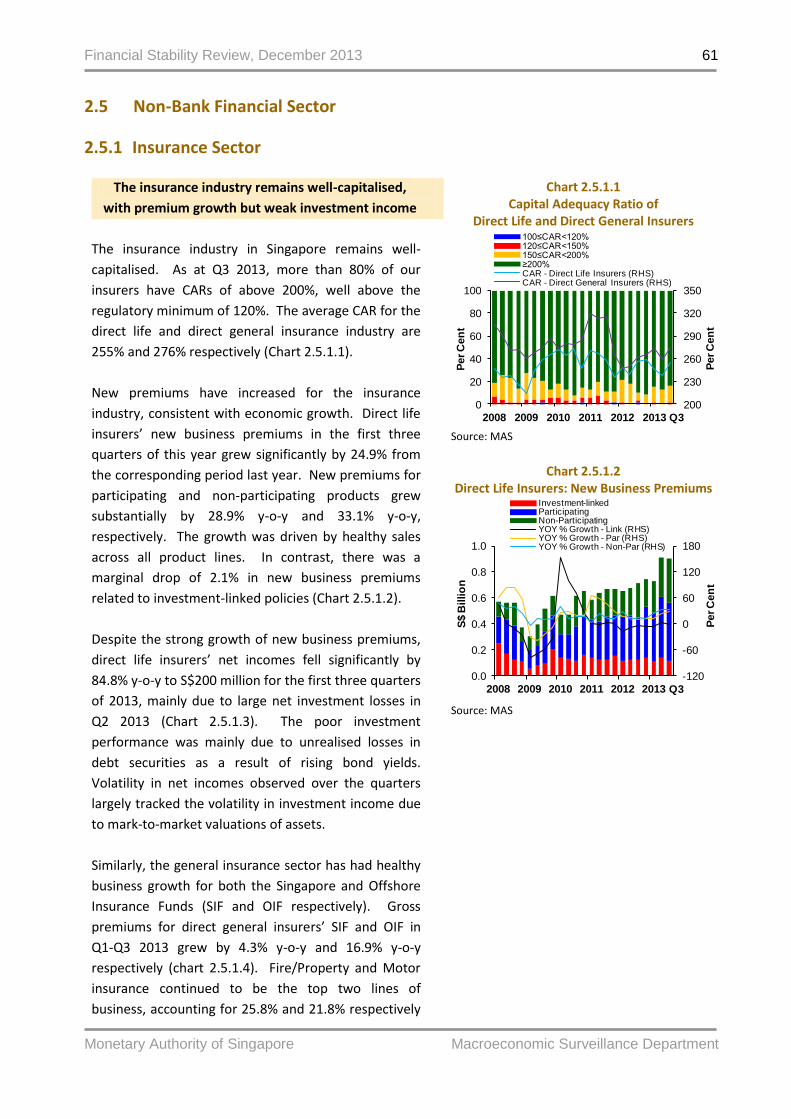
Financial Stability Review, December 2013
Monetary Authority of Singapore Macroeconomic Surveillance Department
61
2.5 Non-Bank Financial Sector
2.5.1 Insurance Sector
The insurance industry remains well-capitalised,
with premium growth but weak investment income
The insurance industry in Singapore remains well-
capitalised. As at Q3 2013, more than 80% of our
insurers have CARs of above 200%, well above the
regulatory minimum of 120%. The average CAR for the
direct life and direct general insurance industry are
255% and 276% respectively (Chart 2.5.1.1).
New premiums have increased for the insurance
industry, consistent with economic growth. Direct life
insurers’ new business premiums in the first three
quarters of this year grew significantly by 24.9% from
the corresponding period last year. New premiums for
participating and non-participating products grew
substantially by 28.9% y-o-y and 33.1% y-o-y,
respectively. The growth was driven by healthy sales
across all product lines. In contrast, there was a
marginal drop of 2.1% in new business premiums
related to investment-linked policies (Chart 2.5.1.2).
Despite the strong growth of new business premiums,
direct life insurers’ net incomes fell significantly by
84.8% y-o-y to S$200 million for the first three quarters
of 2013, mainly due to large net investment losses in
Q2 2013 (Chart 2.5.1.3). The poor investment
performance was mainly due to unrealised losses in
debt securities as a result of rising bond yields.
Volatility in net incomes observed over the quarters
largely tracked the volatility in investment income due
to mark-to-market valuations of assets.
Similarly, the general insurance sector has had healthy
business growth for both the Singapore and Offshore
Insurance Funds (SIF and OIF respectively). Gross
premiums for direct general insurers’ SIF and OIF in
Q1-Q3 2013 grew by 4.3% y-o-y and 16.9% y-o-y
respectively (chart 2.5.1.4). Fire/Property and Motor
insurance continued to be the top two lines of
business, accounting for 25.8% and 21.8% respectively
Chart 2.5.1.1 Capital Adequacy Ratio of
Direct Life and Direct General Insurers
Source: MAS
Chart 2.5.1.2 Direct Life Insurers: New Business Premiums
Source: MAS
200
230
260
290
320
350
0
20
40
60
80
100
2008 2009 2010 2011 2012 2013
100≤CAR<120%120≤CAR<150%150≤CAR<200%≥200%CAR - Direct Life Insurers (RHS)CAR - Direct General Insurers (RHS)
Per C
en
t
Per C
en
t
Q3
-120
-60
0
60
120
180
0.0
0.2
0.4
0.6
0.8
1.0
2008 2009 2010 2011 2012 2013
Investment-linkedParticipatingNon-ParticipatingYOY % Growth - Link (RHS)YOY % Growth - Par (RHS) YOY % Growth - Non-Par (RHS)
S$ B
illio
n
Per C
en
t
Q3

Financial Stability Review, December 2013
Monetary Authority of Singapore Macroeconomic Surveillance Department
62
of total direct general insurance premiums. Gross
premiums for general reinsurers also grew by 6.1%
y-o-y and 9.2% y-o-y for their SIF and OIF, respectively,
with OIF business accounting for 92.6% of total general
reinsurance premiums.
General insurers’ underwriting performance improved
significantly for the first three quarters of the year
compared to the corresponding period in 2012. Direct
general insurers’ underwriting profits grew by 35%
y-o-y to S$607 million, largely attributable to the
profits from the OIF Fire/Property business (Chart
2.5.1.5). General reinsurers’ underwriting gains
increased significantly from S$94 million in 2012 to
S$765 million in 2013 as a result of better claims
experience for the OIF Fire/Property business. In
terms of investment performance, direct general
insurers achieved investment income of S$171 million
in the first three quarters of 2013. General reinsurers
reported a net investment loss of S$170 million,
compared with an investment gain of S$156 million in
the corresponding period in 2012.
Uncertain global economic conditions
and rising interest rates pose considerable
short-term investment risks for insurers
Looking ahead, uncertainty surrounding the US’ policy
normalisation could introduce further uncertainty into
equity and bond markets, which could in turn affect
insurers’ investment performance and balance sheets.
Due to the nature of insurance liabilities, insurers tend
to invest in assets with long duration (particularly life
insurers) or assets which can be easily liquidated
(particularly general insurers). Insurers hold most of
their assets in corporate debt, government securities
and equities, in addition to cash and deposits (Chart
2.5.1.6). More than 80% of the debt holdings are in
investment-grade securities. A majority of insurers’
sovereign debt holdings are in SGS, while US Treasury
bills/bonds make up the largest proportion of insurers’
foreign sovereign debt holdings. Insurers’ equity
holdings are not overly concentrated in any particular
industry, and are largely Singapore-issued stocks.
Chart 2.5.1.3 Direct Life Insurers’ Net Income By Source
Source: MAS Note: Total Outgo = Net Premiums + Net Investment Income + Other Income - Net Income. Items under Total Outgo include net claims settled, increase/decrease in policy liabilities, expenses, etc.
Chart 2.5.1.4 Direct General Insurers: Gross Premiums
Source: MAS
Chart 2.5.1.5 Direct General Insurers: Operating Results
Source: MAS Note: The chart is truncated at -S$600 million. The underwriting loss and underwriting margin was S$2.1 billion and -254% in Q4 2011, respectively.
-0.9
-0.6
-0.3
0.0
0.3
0.6
0.9
-15
-10
-5
0
5
10
15
2008 2009 2010 2011 2012 2013
Net PremiumsNet Investment IncomeOther IncomeTotal OutgoNet Income (RHS)
S$ B
illio
n
S$ B
illio
n
Q3
-30
-15
0
15
30
45
60
0.0
0.3
0.6
0.9
1.2
1.5
1.8
2008 2009 2010 2011 2012 2013
SIFOIFYOY % Growth - SIF (RHS)YOY % Growth - OIF (RHS)
S$ B
illio
n
Per C
en
t
Q3
-20
-10
0
10
20
30
40
-0.2
-0.1
0.0
0.1
0.2
0.3
0.4
2008 2009 2010 2011 2012 2013
Underwriting ResultsNet Investment IncomeUnderwriting Margin (RHS)
S$ B
illio
n
Per C
en
t
Q3

Financial Stability Review, December 2013
Monetary Authority of Singapore Macroeconomic Surveillance Department
63
The annual stress test results indicate that widening
corporate credit spreads, rising yields and equity price
falls would generally have the greatest impact on
direct life insurers and direct general insurers in the
near term. However, rising interest rates would have
positive effects on the industry over the longer term
(Box I).
Chart 2.5.1.6 Asset Allocation of All Insurers
Source: MAS
0
20
40
60
80
100
Direct & Composite
Life Industry
Direct General
Industry
Reinsurance Industry
Per C
en
t
Government Debt Corporate Debt Structured DebtListed Equity Unlisted Equity CashProperty Loan DerivativesOther Assets

Financial Stability Review, December 2013
Monetary Authority of Singapore Macroeconomic Surveillance Department
64
Box I
Monitoring the Singapore Insurance Sector’s Systemic Importance and Emerging Risks
MAS continuously monitors the systemic importance of Singapore’s insurance sector to the financial system
and real economy…
MAS has a macroprudential surveillance framework to examine the Singapore insurance sector’s connectedness
and linkages with the economy, financial markets and other financial intermediaries. In the 2011 FSR, we
outlined this macroprudential surveillance framework and the results of our preliminary study based on a
survey of a group of significant insurers. Since then, more granular data on all insurers’ asset and liability
exposures have been collected on both quarterly and annual bases. This allows MAS to perform
macroprudential surveillance analysis for the entire insurance industry on an ongoing basis. To date, findings
remain largely similar to those in 2011.
Insurers may have a fairly significant impact on the SGS and local corporate debt market. Based on an
analysis of end-2012 data, the sector collectively accounted for 17% and 12% of the SGS and local
corporate debt markets respectively. In contrast, insurers accounted for insignificant shares of the
Singapore Exchange’s (SGX) listed equities and derivatives markets.
The insurance sector poses negligible liquidity and credit risks to the domestic banking system.
Insurers’ deposits made up less than 1% of the non-bank deposits of the key banks in Singapore.
Moreover, insurers’ share of the total equity and debt capital issued by the local banks was only 5.2%.
Insurers are a source of business for Singapore fund managers. A few insurers outsourced their fund
management to related entities. As such, the failure of these insurers may have a negative impact on
the continued operation of some fund management companies.
The insurance industry’s linkages to financial markets and intermediaries via credit enhancements are
minimal. Singapore-licensed insurers currently underwrite only a small volume of inward mortgage
reinsurance and no financial guarantees or CDS. In addition, Singapore-based insurers have not issued
insurance-linked securities and there are currently no special purpose reinsurance vehicles to transfer
risk to capital markets in Singapore.
The market for most of the general insurance business lines is not overly concentrated, except for
Marine & Aviation (Hull & Liability) business. The Marine & Aviation business accounted for only 8% of
the overall gross premiums written in Singapore, and coverage for this line of business is available from
insurers based overseas. These factors mitigate concerns over lack of substitutability.
Direct general insurers ceded around 30% of their SIF business to reinsurers, of which only 30% was
ceded to onshore registered direct general insurers and general reinsurers. In turn, general reinsurers
ceded out less than one-third of their SIF insurance risks, with around half ceded to onshore
retrocessionaires. In contrast, direct life insurers ceded less than 5% of their insurance risks and
therefore would bear the brunt of any losses. Therefore, direct general insurers are more
interconnected with reinsurers than life insurers.
Overall, our analysis showed that Singapore insurers pose limited systemic risk. However, we will
continue to closely monitor developments that could raise the systemic importance of the insurance
industry in Singapore.
MAS also monitors the impact of emerging risks on Singapore’s insurance sector…
Direct life insurers and direct general insurers are required to conduct annual stress tests, where emerging risks
form part of the stress test scenarios. MAS monitors the impact of emerging risks on Singapore’s insurance
sector on an ongoing basis.

Financial Stability Review, December 2013
Monetary Authority of Singapore Macroeconomic Surveillance Department
65
Rising interest rates
Interest rates have been low for a prolonged period of time.37 Rising rates will have a negative impact on
insurers in Singapore in the short term. However, there will be positive effects on insurers in the longer term if
higher interest rates persist for a prolonged period. The impact on life insurers will be more significant than on
general insurers.
General insurers typically hold shorter-duration fixed-income assets which are less sensitive to interest rate
changes. In addition, most of the policy liabilities of general insurers are short-term, and not required to be
discounted under the current capital framework. As such, general insurers will be less impacted by rising
interest rates.
In contrast, life insurers tend to hold longer-duration fixed-income assets to match their longer-term liabilities.
This causes them to be more sensitive to interest rate movements. Higher interest rates will cause an
immediate reduction in the mark-to-market values of fixed income assets held by insurers. The impact on
policy liabilities varies over time due to the operation of the current valuation rules.38 In the short term, as the
long-term risk-free discount rate used to value policy liabilities adjusts only gradually to rising interest rates, the
values of policy liabilities do not fall as quickly as the mark-to-market values of fixed income assets held by
insurers. As a result, life insurers will be affected negatively in the immediate aftermath of an interest rate
increase. However, if higher interest rates persist, the discount rate will rise and the value of policy liabilities
will decline more quickly. In addition, insurers will benefit from the higher interest rates through higher coupon
income from new fixed-income assets in their portfolios. As a result, life insurers’ balance sheets as well as
capital positions are expected to improve over the longer term.
Increasing exposure to catastrophe risk
With offshore insurance business growing, insurers are increasingly exposed to greater catastrophe risk, which
may cause a one-time spike in claims experience. Such increase in claims experience could have a significant
impact on an insurer’s solvency, particularly if the insurer is exposed to risks concentrated in a particular area or
business line. Recent natural disasters, including the earthquakes in Japan and New Zealand, and floods in
Thailand, have shown that catastrophe risk is a real risk to insurers in Singapore writing offshore risks in the
region.
MAS is reviewing the Risk- Based Capital (RBC) framework to help insurers better manage emerging risks
The RBC framework was first introduced in 2004. Since then, there have been developments in international
standards and market practices. MAS is reviewing the RBC framework (RBC 2 review) to improve the
comprehensiveness of its risk coverage and its risk sensitivity.
MAS recognises that for predictable liability cash flows, the fixed-income assets used to back the policy
liabilities are more likely to be held to maturity and therefore do not face the risk posed by short-term interest
rate movements. MAS is studying ways to recognise this under RBC 2.
MAS is also working towards incorporating an explicit catastrophe risk charge in the RBC 2 framework, to help
ensure that insurers are capitalised to meet potential liabilities arising from a 1-in-200 year catastrophic event.
37
MAS’ annual stress test results show that low interest rates are not a major stress factor for the Singapore insurance sector as the level of investment guarantees within the insurance products sold in Singapore is not high, and insurers also sell a significant amount of investment-linked and pure protection products. 38
Currently, where the duration of a liability is 20 years or more, insurers are required to use a long term risk free discount rate (LTRFDR). LTRFDR is relatively stable, as it is calculated as a weighted average of the historical yield since inception of the 15 and 20 year SGS (90% weight), and the recent 6 month average yield of the 20 year SGS (10% weight).
Financial Stability Review, December 2013
Monetary Authority of Singapore Macroeconomic Surveillance Department
66
2.5.2 Capital Markets Sector
39
A Singapore qualifying hedge fund is defined as a hedge fund with net asset value (NAV) greater than US$500 million and managed by a Singapore hedge fund manager. 40
This is based on MAS’ Return on Debt Securities and includes all corporate debt (including commercial paper) issued or co-arranged in Singapore, regardless of where the issuers are incorporated. This is different from the analysis in Box D, which is based on Dealogic data on bond issuances by Singapore-incorporated companies, regardless of where the issuances are arranged.
Capital market intermediaries continue to
maintain sound financial positions
as capital markets remain orderly
MAS monitors the financial strength of capital market
intermediaries and maintains close engagement with
exchanges and clearing houses responsible for
frontline oversight of their members.
Securities and derivatives members of SGX and the
Singapore Mercantile Exchange (SMX) have maintained
adequate financial resources to meet regulatory
requirements, and remain vigilant in monitoring
customer exposures.
SGX and SMX have not experienced any member
default, and hence have not had to draw on their
clearing funds.
The investment management industry
has grown despite continued volatility
in global financial markets
The investment management industry has grown over
the past year despite continued volatility in global
financial markets.
Assets under management (AUM) increased by 21.5%
y-o-y to $1.63 trillion as at end-2012. Following the
implementation of the enhanced regulatory regime for
fund management companies (FMCs) in August 2012,
there are a total of 611 FMCs operating in Singapore as
at end-October 2013. These include former exempt
fund managers which have since become licensed or
registered fund management companies.
MAS participated in the International Organisation of
Securities Commissions (IOSCO)’s 2012
global hedge fund survey, together with 14
other securities regulators from Asia Pacific,
Europe and the Americas. The survey found
that Singapore qualifying hedge funds 39
accounted for 1% of the total number of
qualifying hedge funds globally.
Qualifying hedge funds from Singapore are
mainly equity-oriented and multi-strategy
funds and generally have low leverage. As
the majority of such funds in Singapore do
not engage in credit intermediation, they
may pose less of a shadow banking concern
(see Box J).
Investments by Singapore-based funds,
including hedge funds, were estimated to
account for only about 5% and 12% of
Singapore’s equity and bond markets
respectively. On the whole, the portfolios
are liquid and fund managers have indicated
that they do not expect any difficulty
liquidating their portfolios to meet investor
redemptions.
Singapore’s capital markets
continue to deepen
Fund-raising activity has continued to grow
in 2013. While IPO activity on both the SGX
Main Board and Catalist has remained
stable (Chart 2.5.2.1), corporate debt 40
issuance rose to $127 billion in the first
three quarters of 2013, up from $103 billion
in the same period last year (Chart 2.5.2.2).

Financial Stability Review, December 2013
Monetary Authority of Singapore Macroeconomic Surveillance Department
67
In addition, Singapore, Malaysia and Thailand have
signed an agreement to implement an ASEAN
Collective Investment Scheme (CIS) framework. This
framework will allow Singapore-based fund managers
to offer their retail funds directly to investors in the
other two countries under a streamlined process.
MAS has also fine-tuned the regulatory framework for
CIS by (i) enhancing disclosure requirements for offers
of CIS to both retail and non-retail investors, and (ii)
regulating closed-end funds as CIS so that investors in
these funds are accorded the same level of protection
as investors in open-end funds.
More initiatives have been put in place to support
safety and efficiency of clearing houses and
transparency of markets
More initiatives have been put in place to support the safety and efficiency of clearing houses and to promote transparency of markets. In January 2013, MAS published the Monograph on
Supervision of Financial Market Infrastructures (FMIs)
in Singapore. The monograph describes MAS’
approach in supervising FMIs in Singapore to foster
their safety and efficiency. The monograph also
explains MAS’ application of the Principles for Financial
Market Infrastructures (PFMI) issued by the Committee
on Payment and Settlement Systems and the Technical
Committee of the International Organisation of
Securities Commissions (CPSS-IOSCO).
The PFMI contains international standards designed to
ensure that the infrastructure supporting global
financial markets is robust and well-placed to
withstand financial shocks. All systemically-important
payment systems, central counterparties, securities
settlement systems and central securities depositories
in Singapore are required by MAS to comply with the
PFMI.
In line with the PFMI, the Central Depository (CDP) and
Singapore Exchange Derivatives Clearing Limited (SGX-
DC) have implemented various initiatives over the past
Chart 2.5.2.1 Initial Public Offerings
Source: SGX, Bloomberg
Chart 2.5.2.2 Corporate Debt Issuance
Source: MAS
0
2
4
6
8
10
0
15
30
45
60
75
2007 2008 2009 2010 2011 2012 2013
S$ B
illio
n
Nu
mb
er o
f IP
Os
MainboardCatalistAmount Raised (RHS)
Jan-Sep
0
10
20
30
40
50
2007 2008 2009 2010 2011 2012 2013
S$ B
illio
n
SGD Non-SGD
Q3

Financial Stability Review, December 2013
Monetary Authority of Singapore Macroeconomic Surveillance Department
68
year. These include the January 2013 implementation
of margining for securities cleared by CDP, and the
publication of SGX-DC’s and CDP’s disclosure
documents detailing their operation, governance and
risk management of post-trade clearing, settlement
and depository activities.
In March 2013, SGX implemented rules to require
market participants to mark all short sale orders. This
is in line with IOSCO Principles on Regulation of Short
Selling that short selling should be subjected to a
reporting regime that provides timely information to
the market and market authorities. The aggregate
value and volume of short sell orders for each security
is published daily, enhancing the level of information
available to market participants.
Regulation of over-the-counter (OTC) derivatives
markets continues to be enhanced
in line with global initiatives
MAS is committed to meet the objectives set by G20
leaders on the regulation of OTC derivatives. Further
details of MAS’ ongoing initiatives are presented in Box
K.

Financial Stability Review, December 2013
Monetary Authority of Singapore Macroeconomic Surveillance Department
69
Box J
Shadow Banking in Singapore?
Shadow banking entities conduct credit intermediation outside the regular banking system and can pose
risks to financial stability, both on their own and via their connections to the regular banking system and
financial markets. At the G20’s request, the Financial Stability Board (FSB) has developed a monitoring
framework for national authorities to track the shadow banking system. In collaboration with other
international standard setting bodies, it has also recommended measures to strengthen the regulation of
the shadow banking system. MAS participates in these FSB initiatives.
Using the FSB’s methodology, MAS estimates that potential shadow banking in Singapore is small relative
to the regular banking system. Nevertheless, MAS will continue to monitor the size of shadow banking
activities in Singapore and the risks these activities pose.
In measuring shadow banking, MAS has “cast the net wide”, before narrowing down to credit
intermediation activities
In line with the FSB’s recommendation for jurisdictions to “cast the net wide”, our mapping of potential
shadow banking entities in Singapore initially includes the following non-bank financial intermediaries41:
money market funds (MMFs), ETFs, structured finance vehicles (SFVs), hedge funds, private equity (PE)
funds, other investment funds (OIFs)42 and broker-dealers.
We then narrow the focus by concentrating on non-bank financial intermediaries which are involved in
credit intermediation and the systemic risks they may pose. The primary concerns relate to activities that
involve maturity transformation, liquidity transformation, credit risk transfer, or leverage. Maturity
transformation refers to the use of short-term liabilities to finance the purchase of medium to long-term
assets. Liquidity transformation is the issuance of liabilities that are easily redeemable to finance assets
that may not be easily liquidated. Credit risk transfer refers to actions taken by credit originators or
intermediaries to transfer their credit risk to others.43 While leverage is not in itself a measure of shadow
banking risk, it can act as an amplifier in times of distress.
Maturity or liquidity transformation within the shadow banking system, especially if combined with high
leverage, raises systemic concerns for authorities. In particular, short-term deposit-like funding in the
shadow banking system can create “modern bank-runs”, if undertaken on a sufficiently large scale.
Additionally, greater interconnectedness between the shadow banking system and the regular banking
system could lead to wider contagion within the financial system.
Potential shadow banking in Singapore is small, relative to the domestic financial system
The size of the potential shadow banking sector in Singapore is small relative to Singapore’s overall
financial system assets and to the global shadow banking system. Using the assets of non-bank financial
intermediaries as a proxy, the size of Singapore’s potential shadow banking system is $923.7 billion,
compared with $3.5 trillion for the overall financial system in Singapore (Chart J1), and $86.8 trillion for
41
We have excluded pawn brokers and licensed money lenders because their total assets are very small, at about 0.07% of total financial system assets. 42
OIFs in Singapore are mostly traditional long-only funds. 43
When entities attempt to transfer credit risk, they may take on other risks (such as counterparty credit risk, operational risk or liquidity risk) or, on closer analysis, not have fully transferred the credit risk.
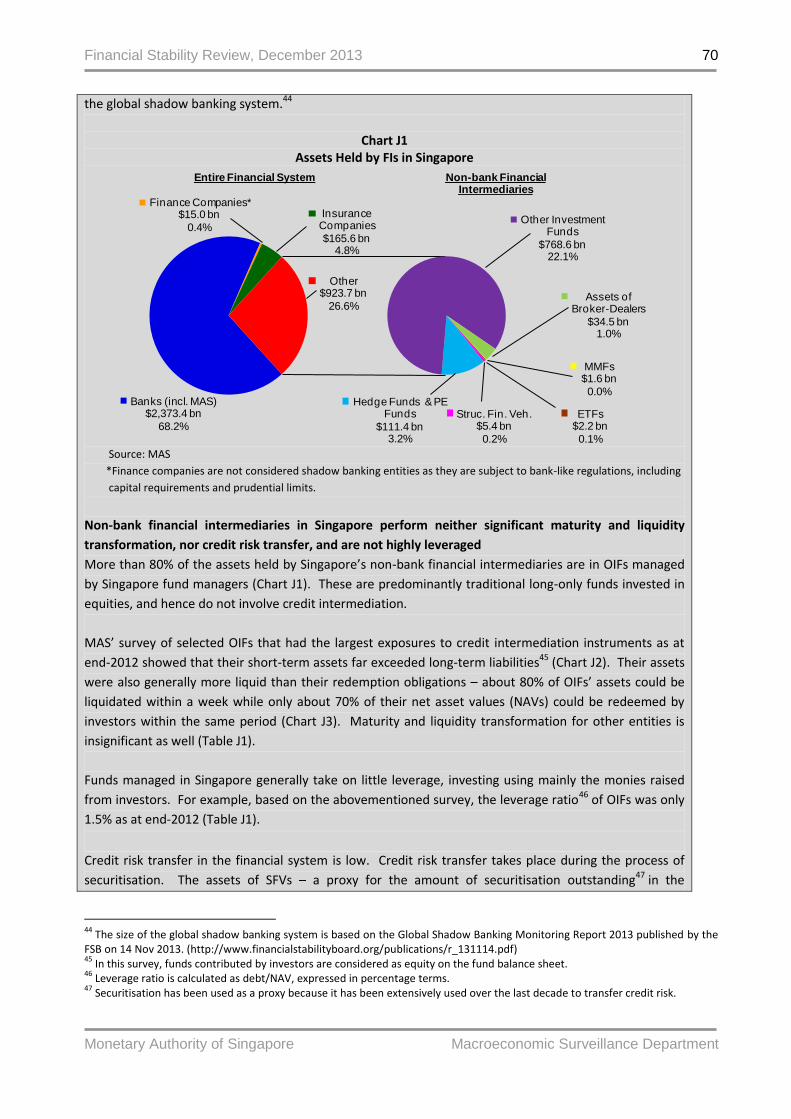
Financial Stability Review, December 2013
Monetary Authority of Singapore Macroeconomic Surveillance Department
70
the global shadow banking system.44
Chart J1
Assets Held by FIs in Singapore
Source: MAS
*Finance companies are not considered shadow banking entities as they are subject to bank-like regulations, including
capital requirements and prudential limits.
Non-bank financial intermediaries in Singapore perform neither significant maturity and liquidity
transformation, nor credit risk transfer, and are not highly leveraged
More than 80% of the assets held by Singapore’s non-bank financial intermediaries are in OIFs managed
by Singapore fund managers (Chart J1). These are predominantly traditional long-only funds invested in
equities, and hence do not involve credit intermediation.
MAS’ survey of selected OIFs that had the largest exposures to credit intermediation instruments as at
end-2012 showed that their short-term assets far exceeded long-term liabilities45 (Chart J2). Their assets
were also generally more liquid than their redemption obligations – about 80% of OIFs’ assets could be
liquidated within a week while only about 70% of their net asset values (NAVs) could be redeemed by
investors within the same period (Chart J3). Maturity and liquidity transformation for other entities is
insignificant as well (Table J1).
Funds managed in Singapore generally take on little leverage, investing using mainly the monies raised
from investors. For example, based on the abovementioned survey, the leverage ratio46 of OIFs was only
1.5% as at end-2012 (Table J1).
Credit risk transfer in the financial system is low. Credit risk transfer takes place during the process of
securitisation. The assets of SFVs – a proxy for the amount of securitisation outstanding47 in the
44
The size of the global shadow banking system is based on the Global Shadow Banking Monitoring Report 2013 published by the FSB on 14 Nov 2013. (http://www.financialstabilityboard.org/publications/r_131114.pdf) 45
In this survey, funds contributed by investors are considered as equity on the fund balance sheet. 46
Leverage ratio is calculated as debt/NAV, expressed in percentage terms. 47
Securitisation has been used as a proxy because it has been extensively used over the last decade to transfer credit risk.
Banks (incl. MAS)$2,373.4 bn
68.2%
Finance Companies*$15.0 bn
0.4%
Insurance Companies
$165.6 bn4.8%
MMFs$1.6 bn
0.0%
ETFs$2.2 bn
0.1%
Struc. Fin. Veh.$5.4 bn
0.2%
Hedge Funds & PE Funds
$111.4 bn3.2%
Other Investment Funds
$768.6 bn22.1%
Assets of Broker-Dealers
$34.5 bn1.0%
Other$923.7 bn
26.6%
Entire Financial System Non-bank Financial Intermediaries

Financial Stability Review, December 2013
Monetary Authority of Singapore Macroeconomic Surveillance Department
71
Singapore financial system – represent only 0.6% of outstanding non-bank loans granted by banks in
Singapore (Chart J4).
Chart J2 Other Investment Funds: Maturity Transformation
Source: MAS
Chart J3 Other Investment Funds: Liquidity Transformation
Source: MAS
*Calendar Day
Table J1 Risk Factors by Entity Type
Entity Type % of Non-bank Financial Intermediary
Assets
Credit Intermediation
(% assets in credit instruments)
Maturity & Liquidity Transformation
Leverage (debt / net assets)
OIFs 83% 25% Insignificant 1.5% Hedge Funds and PE Funds
12% 8.6% Insignificant 13%
SFVs 0.6% 91%48 Insignificant 99%49 MMFs 0.2% 38% Insignificant 0.0% ETFs 0.2% 29% Insignificant 0.4% Broker-dealers 3.7% 2.0% Insignificant 8.1%
Source: MAS
Chart J4 Total Assets of SFVs vs. Total Non-Bank Loans
Source: MAS
48
None of these assets is collateral originated by banks. 49
Leverage for SFVs is high as assets purchased are financed by the issuance of collateralised notes.
0
5
10
15
20
< 1
year
1-3
years
3-5
years
5-1
0
years
>10
years
No
m
atu
rity
date
S$ B
illio
n
Assets Liabilities
20
40
60
80
100
<1
CD
*
1-7
CD
8-3
0C
D
31-9
0C
D
91-1
80
CD
181-3
65
CD >365
CD
Per C
en
t
Asset Liquidity Redemption Liquidity
0.0
0.3
0.6
0.9
1.2
1.5
0
200
400
600
800
1000
20052006200720082009201020112012
Per cen
t
S$ B
illio
n
Total Non-Bank Loans
Assets of SFVs
Total Assets of SFVs to Total Non-Bank Loans (RHS)

Financial Stability Review, December 2013
Monetary Authority of Singapore Macroeconomic Surveillance Department
72
Limited linkages between the potential shadow banking sector and the banking system…
MAS’ survey also indicates that linkages between non-bank financial intermediaries and Singapore’s
banking system are insignificant, at 2.4% of banks’ total non-bank deposits, and 1.7% of their non-bank
loans (Table J2). Non-bank financial intermediaries account for only 1.2% of banks’ total derivative
transactions. Banks’ guarantees to and investments in non-bank financial intermediaries are also
insignificant.
... and with financial markets in Singapore
In addition, non-bank financial entities do not pose significant systemic risks to the financial markets.
Take, for example, Singapore’s fund management industry – approximately 80% of the funds managed in
Singapore are sourced from outside Singapore, while 86% are invested outside Singapore. These funds’
investments in Singapore represent only about 5% and 12% of Singapore’s equity and bond markets
respectively.
Table J2 Linkages with Banks by Entity Type
Entity Type Deposits with
Banks50
Loans from Banks51
Derivatives Exposure
with Banks52
Guarantees by Banks
Investments by Banks
OIFs 1.3% 0.6% 0.3% Insignificant Insignificant Hedge Funds and PE Funds
0.2% 0.0% 0.0%
Insignificant Insignificant
SFVs 0.0% 0.0% 0.0% Insignificant Insignificant MMFs 0.1% 0.0% 0.0% Insignificant Insignificant ETFs 0.0% 0.0% 0.0% Insignificant Insignificant Dealer-brokers 0.9% 1.1% 0.9% Insignificant Insignificant Total 2.4% 1.7% 1.2% Insignificant Insignificant
Source: MAS
Securities borrowing/lending (SBL) and repo markets in Singapore are nascent
Based on a preliminary survey conducted on banks, brokers, insurers and central depositories, SBL and
repo activities in Singapore are nascent. Banks are the main players in this market, but SBL and repo
activities account for only a small proportion of banks’ overall business activities. In addition, prime
broking activities in Singapore are generally limited to client-servicing and marketing services, with
transactions conducted mainly with entities outside of Singapore.
Funds managed in Singapore generally do not undertake SBL or repo transactions. Some hedge funds
engage in SBL for their trading strategies, though these transactions make up only a small share of their
assets under management. Rehypothecation of collateral is also uncommon. Overall, the level of SBL,
repo and prime broking activities in Singapore is unlikely to pose systemic risk to the financial system.
Conclusion
Non-bank financial intermediaries in Singapore do not appear to pose significant shadow banking risks
because (i) most of their assets are not credit instruments; (ii) there is insignificant maturity and liquidity
transformation; (iii) leverage and credit risk transfer are generally low; and (iv) they have limited linkages
with the banking system and financial markets. In addition, SBL and repo activities in Singapore are
nascent, and rehypothecation is uncommon. Nonetheless, MAS will continue to watch out for potential
shadow banking risks in Singapore while contributing towards ongoing FSB initiatives in this area.
50
As a share of total non-bank deposits held by banks 51
As a share of total non-bank loans extended by banks 52
As a share of total (gross) value of derivative transactions by banks

Financial Stability Review, December 2013
Monetary Authority of Singapore Macroeconomic Surveillance Department
73
Box K
Over-the-Counter (OTC) Derivatives Reforms: Still A Ways to Go
In 2009, G-20 leaders agreed to enhance regulation of the OTC derivatives market by end-2012, to address risks
arising from weaknesses identified during the GFC. The FSB subsequently made 21 recommendations, covering the
following areas: (i) standardising OTC derivatives; (ii) requiring all standardised OTC derivatives to be cleared
through central counterparties (CCPs); (iii) reporting all OTC derivatives transactions to trade repositories (TRs); and
(iv) encouraging the trading of standardised OTC derivatives contracts on exchanges or electronic trading
platforms, where appropriate.
Good progress has been made….
Since then, good progress has been made on OTC derivatives reform.
According to the Sixth Progress Report by the FSB, progress on implementing trade reporting is most advanced,
with most jurisdictions expected to have adopted legislation and regulations for mandatory reporting by end-2014.
Implementation in other areas of OTC derivatives reforms, such as central clearing and trading on electronic
platforms where appropriate, is taking place more slowly.
Development of international standards for a number of areas in the OTC derivatives reform has also been
completed. The Basel Committee on Banking Supervision (BCBS) and IOSCO released a finalised framework for
margin requirements for non-centrally cleared derivatives in September 2013. Jurisdictions will begin phasing in
the margin requirements from December 2015, incorporating the recommendations into their regulatory regimes.
In addition, CPSS and IOSCO also published their final report on Authorities’ Access to Trade Repository Data in
August 2013.
…but cross-border regulation of OTC derivatives transactions remains to be addressed
To-date, cross-border regulation of OTC derivatives has proven to be one of the most contentious areas for
national regulators and the financial industry. The FSB has tasked the OTC Derivatives Regulators Group (ODRG), of
which MAS is a member, to identify and resolve cross-border issues relating to potential overlaps, conflicts and
inconsistencies in the regulation of OTC derivatives transactions across jurisdictions.
The US Dodd-Frank Act and the European Markets Infrastructure Regulation (EMIR) are key pieces of regulation
with cross-border implications for entities and OTC derivatives transactions outside the US and EU (e.g. US and EU
bank branches and subsidiaries operating in Singapore). Without a coordinated approach by regulators, market
participants could be subject to multiple sets of regulations with the potential for conflicting requirements, giving
rise to legal and operational risks. If there are such conflicts, or if the burden of complying with multiple sets of
rules is significant, this may prevent the execution of cross-border trades. This, in turn, could lead to fragmented
markets and the disappearance of valuable hedging mechanisms. The ODRG recognises this and seeks to reach
common ground among international regulators to avoid conflicting rules and eliminate inconsistent and
duplicative requirements.
In this regard, the US Commodity Futures Trading Commission (CFTC) and the European Commission (EC) have
adopted a substituted compliance and equivalence assessment approach respectively, so that entities have the
latitude to comply with just one set of rules. MAS is participating in the substituted compliance and equivalence
assessments with the US CFTC and EC, and is putting in place the regulatory regime to support cross-border

Financial Stability Review, December 2013
Monetary Authority of Singapore Macroeconomic Surveillance Department
74
transactions. This will help reduce uncertainty and allay concerns over regulatory burden. MAS continues to
engage the US CFTC and EC, and will work with them on the substituted compliance and equivalence assessments,
even as implementation of our OTC derivatives regulatory regime progresses.
The systemic implications of cross-border requirements would also need to be considered. For instance, national
regulators in the US and EU require cross-border trades to be centrally cleared with CCPs recognised within their
jurisdictions. To facilitate the trading activities of their clearing clients, CCPs would need to be recognised by
multiple jurisdictions. This may, however, lead to the concentration of risks in a few large global CCPs, and
ironically result in a “too-big-to-fail” situation. Regulatory authorities should work together to mitigate the risk of
this occurring.
Reforms to domestic OTC derivatives market underway…
MAS remains committed to implementing OTC derivatives reform in a timely manner. In line with the G20 and FSB
recommendations, MAS has been steadily making progress in developing our OTC derivatives regulatory regime
over the past two years. We consulted on the overarching framework for OTC derivatives reform in February 2012.
This set out our proposed approach for the reporting, clearing and trading mandates, as well as our proposed
regulation of TRs, clearing houses, markets, and intermediaries. The legislative amendments to the Securities and
Futures Act (SFA) to provide for mandatory reporting and clearing, as well as the licensing regimes for TRs and
clearing houses, were passed into law in November 2012. The regulatory regimes for TRs and clearing houses have
since commenced in August 2013.
With regard to mandatory reporting of OTC derivatives, the regulations were finalised end-October 2013, with the
reporting framework starting with interest rate and credit derivatives contracts. All banks will begin reporting
these two types of derivatives contracts by 1 April 2014; all non-bank financial entities by 1 July 2014; and all
significant derivatives holders by 1 October 2014. Reporting of other classes of OTC derivatives contracts (including
foreign exchange, equity and commodity derivatives contracts) will be mandated at a later stage. As part of an
industry initiative53, a number of banks committed to commence reporting ahead of the mandatory reporting
timeline. This is a positive move which supports MAS’ efforts to meet the G20 objective of strengthening
regulatory oversight of OTC derivatives through trade reporting.
For mandatory central clearing, work on draft regulations is currently underway and the regime is expected to
commence in H2 2014. In deciding whether to introduce a trading mandate, MAS will take into consideration
feedback received on the feasibility of a trading mandate as well as possible unintended consequences highlighted
by IOSCO, such as a withdrawal of liquidity by some market participants that will make it costly for others to hedge
their risks. The implementation of the reporting mandate will provide MAS with market data that will enable us to
better assess the characteristics of the Singapore market, and the incremental benefits of having a trading
mandate.
MAS continues to review other aspects of our OTC derivatives regulatory regime, including the regulation of
intermediaries dealing in OTC derivatives and of OTC derivatives market operators, and is committed to implement
a sound and effective regulatory framework.
53
Please refer to the ISDA letter on OTC derivatives trade reporting in Singapore submitted to MAS on 5 November 2013. http://www2.isda.org/attachment/NjA5NQ==/MAS%20Commitment%20Letter_Public.pdf

Financial Stability Review, December 2013
Monetary Authority of Singapore Macroeconomic Surveillance Department
75
STATISTICAL APPENDIX SINGAPORE NON-FINANCIAL SECTOR Table A.1: Corporate Sector’s Financial Ratios and Number of Companies Wound Up Table A.2: Household Sector’s Financial Indicators
SINGAPORE FINANCIAL SECTOR Table B.1: Banking Sector’s Selected Financial Indicators Table B.2: Local Banks’ Selected Financial Indicators Table B.3: Direct Life Insurers: Total New Business Gross Premiums Table B.4: Direct Life Insurers: Asset Distribution of Singapore Insurance Fund (Non-
Linked Assets) Table B.5: General Direct Insurers: Gross Premiums Table B.6: General Direct Insurers: Composition of Net Premiums of Singapore
Insurance Fund Table B.7: General Direct Insurers: Incurred Loss Ratio of Singapore Insurance Fund

Financial Stability Review, December 2013
Monetary Authority of Singapore Macroeconomic Surveillance Department
76
SINGAPORE NON-FINANCIAL SECTOR
Table A.1: Corporate Sector’s Financial Ratios and Number of Companies Wound up
H2 H1 H2 H1 H2 H1 H2 H1
2009 2010 2010 2011 2011 2012 2012 2013
Median Return on Assets (Per Cent)
Transport, Storage & Communication 7.2 5.9 6.3 6.1 5.1 5.2 5.7 5.8
Property 3.7 5.0 6.3 6.7 5.5 5.9 6.3 6.4
Multi-Industry 4.0 4.7 5.5 5.7 3.8 4.3 4.2 3.7
Manufacturing 3.1 4.7 5.9 5.3 4.3 3.7 3.0 2.3
Hotels & Restaurants 4.2 3.5 4.9 5.3 6.7 4.3 3.2 3.4
Construction 8.5 8.1 7.5 6.1 5.1 4.0 4.8 6.8
Commerce 5.1 5.1 5.2 6.1 5.1 3.8 3.8 4.3
Median Current Ratio (Ratio)
Transport, Storage & Communication 1.4 1.4 1.5 1.6 1.3 1.3 1.2 1.2
Property 2.0 2.1 2.1 2.0 1.9 2.0 1.9 1.8
Multi-Industry 1.9 1.9 2.0 2.0 2.3 2.1 1.7 1.8
Manufacturing 1.9 2.0 1.9 1.8 1.8 1.8 1.7 1.7
Hotels & Restaurants 1.9 1.3 1.8 1.8 1.9 1.8 1.3 1.2
Construction 1.7 1.7 1.8 2.1 1.7 1.9 1.7 1.8
Commerce 1.7 1.8 1.7 1.7 1.6 1.8 1.7 1.8
Median Total Debt/Equity (Per Cent)
Transport, Storage & Communication 35.0 26.8 41.3 45.0 43.9 56.2 49.4 55.5
Property 51.7 51.6 51.8 51.2 48.3 49.0 50.6 52.1
Multi-Industry 32.3 35.5 34.5 42.4 41.1 43.7 51.5 34.1
Manufacturing 21.3 16.2 19.4 19.9 22.0 25.0 25.0 26.4
Hotels & Restaurants 23.1 24.5 25.5 39.8 31.6 32.1 62.4 67.9
Construction 42.7 34.1 28.2 34.1 35.3 48.4 41.1 49.1
Commerce 31.1 30.9 25.4 29.4 33.1 34.7 34.5 27.6
Median Interest Coverage Ratio* (Ratio)
Transport, Storage & Communication 4.2 9.0 8.2 5.9 5.4 7.1 4.6 6.9
Property 2.7 4.2 14.4 7.1 19.1 7.7 12.8 7.0
Multi-Industry 2.9 10.4 15.8 12.7 5.9 9.4 12.0 8.5
Manufacturing 4.0 9.0 13.1 8.8 6.9 5.3 2.6 3.3
Hotels & Restaurants 7.8 9.2 12.1 3.0 3.0 2.0 5.9 1.6
Construction 6.0 10.1 9.7 13.2 4.9 12.6 11.0 13.3
Commerce 4.7 4.9 5.7 9.0 6.4 5.1 4.4 7.2
Number of Companies Wound Up
All Sectors 75 74 68 40 73 78 73 54
Source: Thomson Financial, Ministry of Law * Earnings before interest and tax divided by interest expense. Note: A revised list of firms (all SGX-listed firms as of October 2013) was included in the computation of ratios for H2 2012 and H1 2013 in the table above.

Financial Stability Review, December 2013
Monetary Authority of Singapore Macroeconomic Surveillance Department
77
Table A.2: Household Sector’s Financial Indicators
Source: DOS, MAS and Ministry of Law. * Charge-off rate for the quarter is calculated by annualising the ratio obtained from dividing bad debts written off for the quarter by the average rollover balance for the same quarter.
Q2 Q3 Q4 Q1 Q2 Q3 Q4 Q1 Q2 Q3
2011 2011 2011 2012 2012 2012 2012 2013 2013 2013
Per Cent (unless otherwise stated)
Household Assets (S$ Billion)
1466.2 1487.1 1511.7 1552.8 1568.3 1604.2 1642.6 1684.7 1694.4 1712.5
Residential Property Assets as % of Total Assets
49.5 50.3 50.3 49.5 49.7 49.4 49.5 49.1 49.4 48.9
Household Liabilities (S$ Billion)
224.6 231.7 237.0 242.0 248.0 255.2 262.9 267.5 271.4 275.2
Household Liabilities to Assets Ratio (%)
15.3 15.6 15.7 15.6 15.8 15.9 16.0 15.9 16.0 16.1
Household Liabilities as % of GDP
69.3 70.3 70.9 71.9 72.8 74.5 76.1 77.1 77.4 77.5
Per Cent (unless otherwise stated)
Credit Card Charge-Off Rate*
4.7 4.4 4.3 4.7 4.8 5.1 4.8 4.6 5.1 4.7
Housing & Bridging Loan NPL Ratio
0.4 0.3 0.3 0.3 0.3 0.3 0.3 0.3 0.3 0.3
Professional & Private Individuals Loan NPL Ratio
0.9 0.8 0.8 0.8 0.7 0.6 0.6 0.6 0.6 0.5
Number of Individual Bankruptcy Orders
426 402 382 416 446 425 461 485 576 475

Financial Stability Review, December 2013
Monetary Authority of Singapore Macroeconomic Surveillance Department
78
SINGAPORE FINANCIAL SECTOR Table B.1: Banking Sector’s* Selected Financial Indicators
2010** 2011** 2012** Q1
2012 Q2
2012 Q3
2012 Q4
2012 Q1
2013 Q2
2013 Q3
2013
Loan Concentrations (% of Total Commercial Bank Loans)
Interbank Loans 51.4 46.0 42.5 45.1 44.5 43.3 42.5 40.5 40.3 39.8
Non-Bank Loans 48.6 54.0 57.5 54.9 55.5 56.7 57.5 59.5 59.7 60.2
Loans through the Asian Dollar Market (% of Total Commercial Bank Loans)
Total ADM Loans 62.7 60.9 58.6 60.4 60.0 59.2 58.6 58.2 58.9 59.5
Of which to (% of Total Asian Dollar Market Loans):
USA 5.2 4.9 3.3 3.6 3.3 3.4 3.3 3.4 2.9 3.0
United Kingdom 6.9 6.9 6.6 6.7 7.3 7.0 6.6 6.4 6.5 5.8
Switzerland 3.9 4.0 3.8 3.8 3.8 4.1 3.8 3.3 3.2 3.7
Japan 10.3 6.6 8.7 6.5 7.4 8.5 8.7 8.0 6.8 7.5
Hong Kong 8.9 10.2 8.9 10.0 9.7 8.9 8.9 9.2 9.8 10.3
Interbank 61.5 58.1 56.7 57.7 57.5 57.3 56.7 54.5 54.7 54.5
Non-Bank 38.5 41.9 43.3 42.3 42.5 42.7 43.3 45.5 45.3 45.5
Loans through Domestic Banking Units (% of Total Commercial Bank Loans)
Total DBU Loans 37.3 39.1 41.4 39.6 40.0 40.8 41.4 41.8 41.1 40.5
Of which to (% of Total DBU Loans):
Manufacturing 2.2 3.3 4.3 3.6 3.9 4.5 4.3 5.3 5.2 4.7
Building & Construction 10.9 11.7 12.4 12.0 11.9 12.1 12.4 12.7 13.0 13.3
Housing 22.9 22.8 24.0 23.1 23.2 23.6 24.0 23.8 24.1 24.5
Professional & Private Individuals
8.6 9.1 9.6 9.3 9.3 9.6 9.6 9.4 9.5 9.5
Non-Bank Financial Institutions 7.7 9.6 10.3 9.6 9.8 10.2 10.3 10.0 10.3 10.5
Banks 34.3 27.0 22.5 25.9 25.0 23.2 22.5 21.2 19.7 18.2
Per Cent
DBU Net Interest Income to Total DBU Loans
1.6 1.5 1.5 1.5 1.5 1.5 1.5 1.4 1.4 1.4
Per Cent
Liquid DBU Assets to Total DBU Assets
9.3 9.9 9.7 9.6 9.3 9.9 9.7 9.9 9.9 9.5
Liquid DBU Assets to Total DBU Liabilities
10.1 10.7 10.5 10.4 10.1 10.6 10.5 10.7 10.7 10.2
All DBU Loans to All DBU Deposits
97.7 102.5 105.3 102.2 105.6 105.8 105.3 104.5 105.6 107.7
DBU Non-Bank Loans to DBU Non-Bank Deposits
74.4 87.0 94.6 87.8 91.9 93.7 94.6 96.5 99.5 101.8
DBU Non-Bank Loan Growth (y-o-y)
14.7 30.3 16.7 26.0 20.9 16.5 16.7 19.7 17.7 15.7
DBU Non-Bank Deposit Growth (y-o-y)
10.8 11.4 7.4 10.8 8.2 6.5 7.4 8.9 8.6 6.5
Source: MAS * Data relates to all commercial banks, Singapore operations only. ** Annual figures are as at Q4.

Financial Stability Review, December 2013
Monetary Authority of Singapore Macroeconomic Surveillance Department
79
Table B.2: Local Banks’* Selected Financial Indicators
2010** 2011** 2012** Q1
2012 Q2
2012 Q3
2012 Q4
2012 Q1
2013 Q2
2013 Q3
2013
Capital Adequacy (Per Cent)
Regulatory Capital to Risk-Weighted Assets (RWA)
18.6 16.0 18.1 16.5 15.8 17.4 18.1 16.9 16.3 16.1
Regulatory Tier I Capital to Risk-Weighted Assets (RWA)
15.5 13.5 14.9 13.6 13.4 14.3 14.9 14.2 13.6 13.5
Shareholders’ Funds to Total Assets^
9.5 8.7 9.2 8.9 8.8 8.9 9.2 8.9 8.6 8.3
Asset Quality (Per Cent)
Non-Bank NPLs to Non-Bank Loans
1.6 1.2 1.2 1.3 1.2 1.3 1.2 1.1 1.1 1.1
Total Provisions to Non-Bank NPLs
110.9 125.5 128.3 123.1 127.1 122.5 128.3 133.7 134.3 131.2
Specific Provisions to Non-Bank NPLs
40.5 39.3 41.8 38.9 40.7 38.5 41.8 39.9 38.7 35.7
Loan Concentration (% of Total Loans)
Interbank Loans 12.2 13.3 12.7 14.8 14.8 15.1 12.7 13.6 13.3 14.4
Non-Bank loans 87.8 86.7 87.3 85.2 85.2 84.9 87.3 86.4 86.7 85.6
Of which to (% of Total Loans):
Manufacturing 8.1 8.1 7.9 8.1 8.1 7.9 7.9 8.9 8.8 8.1
Building & Construction 12.0 12.1 12.6 11.9 12.0 12.1 12.6 12.9 13.0 13.0
Housing 23.2 20.7 22.0 20.7 20.8 21.3 22.0 21.3 20.8 20.4
Professional & Private Individuals
8.6 8.3 8.8 8.2 8.3 8.5 8.8 8.6 8.7 8.6
Non-Bank Financial Institutions
11.7 10.7 10.7 10.9 10.6 10.6 10.7 8.9 8.9 8.8
Profitability (Per Cent)
ROA (Simple Average) 1.2 1.0 1.1 1.2 1.1 1.1 1.1 1.1 1.0 1.0
ROE (Simple Average) 12.2 11.1 12.0 13.2 11.9 12.0 12.0 11.8 11.3 11.6
Net Interest Margin (Simple Average)
2.0 1.9 1.8 1.9 1.8 1.8 1.8 1.7 1.7 1.6
Non-Interest Income to Total Income
40.6 37.3 43.6 41.1 38.8 39.1 43.6 42.6 40.9 40.1
Source: Local banks’ financial statements, MAS calculations * Local banks' consolidated operations. ** Annual figures are as at Q4. ^ Figures include assets of Great Eastern Holdings.

Financial Stability Review, December 2013
Monetary Authority of Singapore Macroeconomic Surveillance Department
80
Table B.3: Direct Life Insurers: Total New Business Gross Premiums
2010 2011 2012
Q1 2012
Q2 2012
Q3 2012
Q4 2012
Q1 2013
Q2 2013
Q3 2013
Year-on-Year % Change
Policies 0.6 5.9 -0.6 -0.1 0.5 -1.6 -1.3 -17.6 3.0 5.9
Annual Premiums 26.0 23.0 19.6 27.9 8.9 14.1 23.0 20.4 39.8 26.5
Single Premiums 7.4 16.4 -10.0 -4.8 -11.0 -12.5 -13.7 -18.0 27.7 31.9
Sum Insured 10.8 27.0 15.3 16.6 3.0 18.9 37.2 -7.5 -6.4 3.4
Source: MAS
Table B.4: Direct Life Insurers: Asset Distribution of Singapore Insurance Fund (Non-Linked Assets)
2010 2011 2012
Q1 2012
Q2 2012
Q3 2012
Q4 2012
Q1 2013
Q2 2013
Q3 2013
S$ Million (% of Total Assets)
Debt Securities
56,988 61,041 71,347 62,533 64,317 69,188 71,347 71,770 69,997 71,365
(61.4) (63.2) (66.1) (61.9) (63.4) (65.5) (66.1) (65.5) (65.2) (65.3)
Equity Shares
21,683 19,218 21,931 21,495 20,811 21,003 21,938 23,343 23,091 24,221
(23.4) (19.9) (20.3) (21.3) (20.5) (19.9) (20.3) (21.3) (21.5) (22.2)
Cash & Deposits
4,491 7,172 5,695 7,327 6,945 5,989 5,696 5,409 5,706 5,047
(4.8) (7.4) (5.3) (7.3) (6.8) (5.7) (5.3) (4.9) (5.3) (4.6)
Loans 4,040 3,885 3,320 3,785 3,603 3,466 3,320 3,369 3,370 3,278
(4.4) (4.0) (3.1) (3.7) (3.6) (3.3) (3.1) (3.1) (3.1) (3.0)
Land & Buildings
2,889 3,056 3,109 2,963 2,963 2,938 3,104 3,111 3,067 3,073
(3.1) (3.2) (2.9) (2.9) (2.9) (2.8) (2.9) (2.8) (2.9) (2.8)
Other Assets
2,721 2,164 2,512 2,952 2,831 3,018 2,488 2,601 2,109 2,308
(2.9) (2.2) (2.3) (2.9) (2.8) (2.9) (2.3) (2.4) (2.0) (2.1)
Total Assets
92,812 96,537 107,914 101,055 101,470 105,602 107,893 109,604 107,341 109,292
(100) (100) (100) (100) (100) (100.0) (100) (100) (100) (100.0)
Source: MAS
Table B.5: General Direct Insurers: Gross Premiums
2010 2011 2012
Q1 2012
Q2 2012
Q3 2012
Q4 2012
Q1 2013
Q2 2013
Q3 2013
S$ Million
Total Operations
4,572.6 5,056.5 5,524.6 1,489.5 1,325.3 1,292.2 1,240.8 1,545.6 1,485.0 1,428.2
SIF 3,230.6 3,423.6 3,626.7 1,028.6 860.2 834.9 799.0 1,048.9 908.5 884.2
OIF 1,342.0 1,632.9 1,897.9 460.9 465.1 457.3 441.8 496.7 576.5 544.0
Source: MAS

Financial Stability Review, December 2013
Monetary Authority of Singapore Macroeconomic Surveillance Department
81
Table B.6: General Direct Insurers: Composition of Net Premiums of Singapore Insurance Fund
2010 2011 2012
Q1 2012
Q2 2012
Q3 2012
Q4 2012
Q1 2013
Q2 2013
Q3 2013
S$ Million
Marine & Aviation
- Cargo 79.7 84.9 80.7 20.6 21.4 20.6 17.8 19.6 20.3 19.6
- Hull & Liability 112.5 113.3 122.3 20.4 21.7 26.2 24.1 18.9 20.1 27.0
Fire 143.1 155.7 161.5 46.7 43.6 38.1 33.3 53.5 46.2 39.5
Motor 1,071.8 1,103.1 1,150.1 321.6 272.6 266.4 285.1 318.9 278.5 264.7
Work Injury Compensation
237.2 258.4 297.7 90.4 73.7 73.2 59.3 103.3 84.3 80.6
Personal Accident 187.3 207.4 225.5 57.9 59.1 53.8 55.6 62.7 63.8 60.3
Health 141.9 164.4 213.0 71.6 52.8 47.5 40.1 84.5 57.6 46.2
Miscellaneous 318.8 326.1 354.9 97.3 93.7 87.2 77.6 91.9 105.2 92.6
Total 2,292.3 2,413.3 2,605.7 726.5 638.6 613.0 592.9 753.3 676.0 630.5
Source: MAS
Table B.7: General Direct Insurers: Incurred Loss Ratio of Singapore Insurance Fund
2010 2011 2012
Q1 2012
Q2 2012
Q3 2012
Q4 2012
Q1 2013
Q2 2013
Q3 2013
Per Cent
Marine & Aviation
- Cargo 11.4 28.2 22.0 13.8 15.1 25.7 29.6 22.4 31.5 25.3
- Hull & Liability 61.5 71.8 54.5 51.5 50.2 57.5 51.5 76.4 56.5 66.0
Fire 22.9 27.2 44.6 89.1 41.6 32.0 12.3 24.0 34.9 41.4
Motor 74.3 68.5 66.2 65.0 65.5 67.6 67.8 67.1 63.3 65.5
Work Injury Compensation
67.8 66.8 64.8 65.7 64.1 69.4 71.7 57.8 65.1 72.1
Personal Accident 27.1 28.3 34.9 31.4 31.6 31.6 39.6 28.4 32.2 31.8
Health 64.3 63.1 62.8 58.9 66.0 70.9 58.9 68.8 70.3 62.2
Miscellaneous 33.5 33.7 20.8 26.8 28.3 39.0 9.0 35.3 14.7 31.7
Total 57.0 56.0 53.7 55.8 53.4 57.1 52.1 54.7 51.5 55.5
Source: MAS