december 2017 ndis performance report - sa disability reform council performance report - south...
TRANSCRIPT

South Australia - 31 December 2017
Quarterly Performance ReportDisability Reform Council
COAG

COAG Disability Reform Council Performance Report - South Australia 31 December 2017 2
This report is the sixth quarterly report during the NDIS Transition period, which commenced on 1 July 2016.
PARTICIPANTS & PLANNING
PROVIDERS & MARKETS
COMMITTED SUPPORTS & PAYMENTS
INFORMATION, LINKAGES &
CAPACITY BUILDING
MAINSTREAM INTERFACE
FINANCIAL SUSTAINABILITY
Overview

Executive summary
COAG Disability Reform Council Performance Report - South Australia 31 December 2017 3
Participants and Planning
Committed Supports and Payments
Mainstream InterfaceProviders and Markets
1,526 approved providers, a 15% increase for the quarter.
75-95% of payments made by the NDIA are received by 25% of providers.
34% of service providers are individual/sole traders.
92% of active participants with a plan approved in 2017-18 Q2 access mainstream services.
The proportion of participants entering in the current quarter accessing mainstream services is higher compared to prior quarters.
$271.8 million has been paid to providers and participants since Scheme inception.
Overall, • 53% of committed supports were utilised in 2013-14, • 61% in 2014-15, • 61% in 2015-16, • 56% in 2016-17.2017-18 experience is still emerging.
1,735 additional participants with plans this quarter, with 120 of those previously confirmed as ECEI at 2017-18 Q1.
270 additional children have a confirmed referral to the ECEI gateway this quarter.
As at 31 December 2017, plans approved and ECEI referrals represent:• 85% of year to date bilateral estimate met (1 July 2017 - 31 December 2017)• 101% of transition to date bilateral estimate met (1 July 2016 - 31 December 2017)• 92% of scheme to date bilateral estimate met (1 July 2013 - 31 December 2017)
75% of participants surveyed in the quarter rated their satisfaction with the Agency's planning process as either good or very good.
Summary

South Australia - 31 December 2017
PART 1
Participants and Planning
As the transition phase to full scheme continues, the NDIS in South Australia continues to grow with 1,735 additional participants with approved plans this quarter.

PART 1 - Participants and Planning
COAG Disability Reform Council Performance Report - South Australia 31 December 2017 5
The NDIS is transitioning to full-scheme in line with phasing schedules bilaterally agreed by State/Territory and Commonwealth governments.
Summary
Key Statistics
ACCESS DECISIONS IN 2017-18 Q2
(INCLUDING BOTH ACCESS MET AND ACCESS NOT MET)
3,636INITIAL PLANS APPROVED IN 2017-18 Q2
OF THE 1,735 INITIAL PLANS APPROVED THIS QUARTER, 120 WERE PREVIOUSLY CONFIRMED AS ECEI AT 2017-18 Q1
1,735ADDITIONAL CHILDREN WITH A CONFIRMED ECEI GATEWAY REFERRAL IN 2017-18 Q2
270OF YEAR TO DATE BILATERAL ESTIMATE MET (1 JULY 2017 - 31 DECEMBER 2017)
85%
OF SCHEME TO DATE BILATERAL ESTIMATE MET (1 JULY 2013 - 31 DECEMBER 2017)
92%OF TRANSITION TO DATE BILATERAL ESTIMATE MET (1 JULY 2016 - 31 DECEMBER 2017)
101%OF PARTICIPANTS WITH AN INITIAL PLAN APPROVED IN 2017-18 Q2 HAVE A REPORTED PRIMARY DISABILITY OF INTELLECTUAL DISABILITY
33%OF PARTICIPANTS ENTERING IN 2017-18 Q2 ARE AGED OVER 15 YEARS OLD
75%

PART 1 - Participants and Planning
COAG Disability Reform Council Performance Report - South Australia 31 December 2017 6
2017-18 Q2
Of the 3,164 participants deemed 'eligible' this quarter 71% entered from an existing State/Territory program.
Of the 1,735 plan approvals this quarter, 60% had transitioned from an existing State/Territory program, 83% entered with a permanent disability and 120 were previously confirmed as ECEI at 2017-18 Q1.
Quarterly Intake
531
2,243
390
New
State/Territory
Commonwealth
Participant Entry point
ACC
ESS
MET
PLAN
AP
PRO
VALS
477
1,040
218
270
New
State/Territory
Commonwealth
ECEI
Participant Entry point
290
1,445
270
Early Intervention
Permanent Disability
ECEI
Participant Pathway type
access decisions
3,636
access met
3,164
planapprovals(excluding ECEI)
1,735
ECEI
270
PART 1 - Participants and Planning
COAG Disability Reform Council Performance Report - South Australia 31 December 2017 7
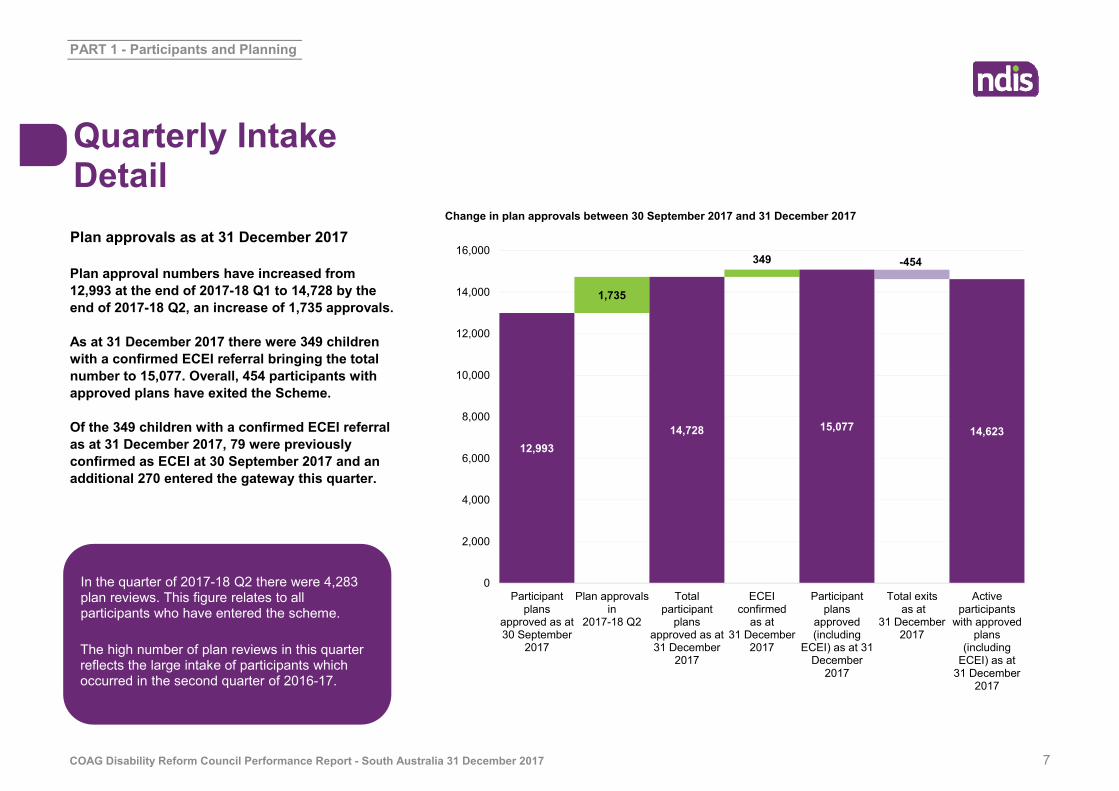
Plan approvals as at 31 December 2017
Plan approval numbers have increased from 12,993 at the end of 2017-18 Q1 to 14,728 by the end of 2017-18 Q2, an increase of 1,735 approvals.
As at 31 December 2017 there were 349 children with a confirmed ECEI referral bringing the total number to 15,077. Overall, 454 participants with approved plans have exited the Scheme.
Of the 349 children with a confirmed ECEI referral as at 31 December 2017, 79 were previously confirmed as ECEI at 30 September 2017 and an additional 270 entered the gateway this quarter.
Change in plan approvals between 30 September 2017 and 31 December 2017
Quarterly Intake Detail
In the quarter of 2017-18 Q2 there were 4,283 plan reviews. This figure relates to all participants who have entered the scheme.
1,735
12,99314,728
349
15,077
-454
14,623
0
2,000
4,000
6,000
8,000
10,000
12,000
14,000
16,000
Participantplans
approved as at30 September
2017
Plan approvalsin
2017-18 Q2
Totalparticipant
plansapproved as at31 December
2017
ECEIconfirmed
as at31 December
2017
Participantplans
approved(including
ECEI) as at 31December
2017
Total exits as at
31 December2017
Activeparticipants
with approvedplans
(includingECEI) as at
31 December2017
The high number of plan reviews in this quarter reflects the large intake of participants which occurred in the second quarter of 2016-17.

PART 1 - Participants and Planning
COAG Disability Reform Council Performance Report - South Australia 31 December 2017 8
As at the end of 2017-18 Q2, the cumulative total number of participants receiving support was 15,077 (including 349 children supported through the ECEI gateway). Of these, 5,617 transitioned from an existing State/Territory program and 680 transitioned from an existing Commonwealth program.
In addition, 5,122 participants were awaiting a plan as at 31 December 2017.
Overall, since 1 July 2013, there have been 21,763 people with access decisions.
Plan approvals as at 31 December 2017
Cumulative plan approvals compared with bilateral estimate
Cumulative Position of year to date bilateral estimate met
(1 July 2017 - 31 December 2017)
85%
of scheme to date bilateral estimate met (1 July 2013 - 31 December 2017)
92%
plan approvals to date; 15,077 including ECEI confirmed
14,728
Cumulative position reporting is inclusive of trial participants for the reported period and represents participants who have or have had an approved plan.
of transition to date bilateral estimate met (1 July 2016 - 31 December 2017)
101%
7,1187,878
10,30711,081
12,112
13,227
15,077
0
2,000
4,000
6,000
8,000
10,000
12,000
14,000
16,000
18,000
ECEI
Total (excluding ECEI)
Bilateral estimate as at 31 December 2017
5,617
680
8,431
3490
1,0002,0003,0004,0005,0006,0007,0008,0009,000
Plan approvals by participant referral pathway
PART 1 - Participants and Planning
COAG Disability Reform Council Performance Report - South Australia 31 December 2017 9
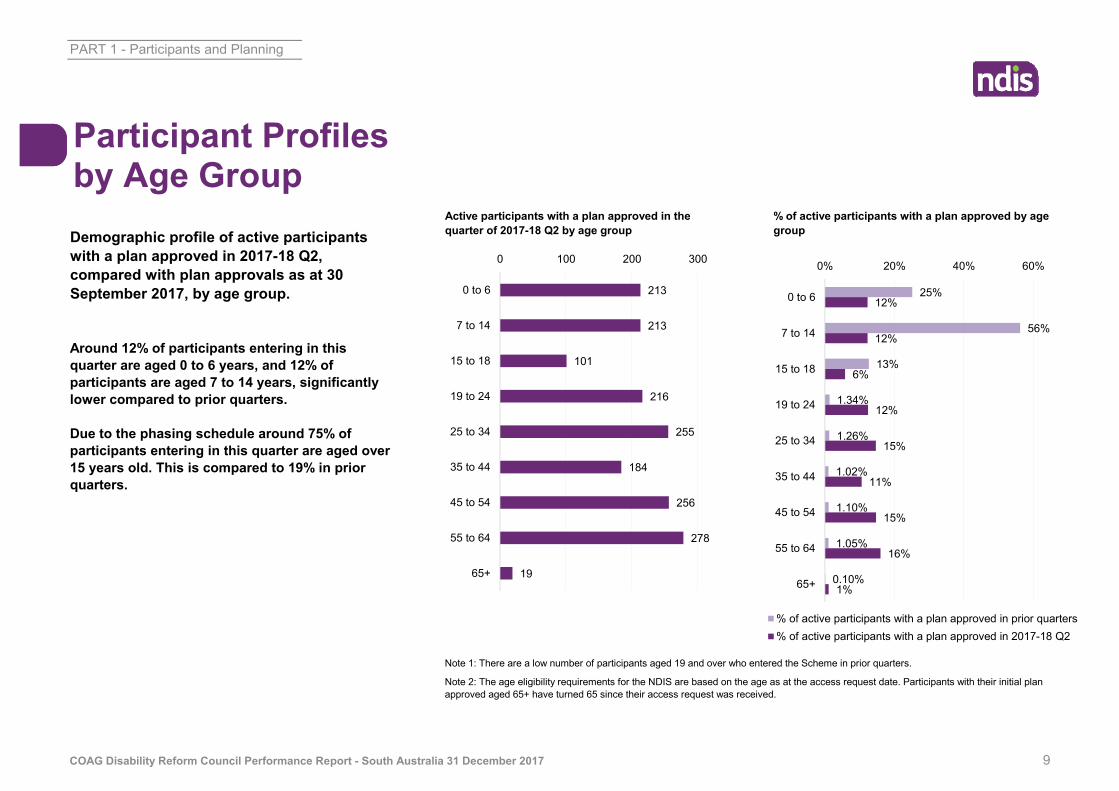
Note 1: There are a low number of participants aged 19 and over who entered the Scheme in prior quarters.
Note 2: The age eligibility requirements for the NDIS are based on the age as at the access request date. Participants with their initial plan approved aged 65+ have turned 65 since their access request was received.
Around 12% of participants entering in this quarter are aged 0 to 6 years, and 12% of participants are aged 7 to 14 years, significantly lower compared to prior quarters.
Due to the phasing schedule around 75% of participants entering in this quarter are aged over 15 years old. This is compared to 19% in prior quarters.
Demographic profile of active participants with a plan approved in 2017-18 Q2, compared with plan approvals as at 30 September 2017, by age group.
Active participants with a plan approved in the quarter of 2017-18 Q2 by age group
% of active participants with a plan approved by age group
Participant Profiles by Age Group
213
213
101
216
255
184
256
278
19
0 100 200 300
0 to 6
7 to 14
15 to 18
19 to 24
25 to 34
35 to 44
45 to 54
55 to 64
65+
25%
56%
13%
1.34%
1.26%
1.02%
1.10%
1.05%
0.10%
12%
12%
6%
12%
15%
11%
15%
16%
1%
0% 20% 40% 60%
0 to 6
7 to 14
15 to 18
19 to 24
25 to 34
35 to 44
45 to 54
55 to 64
65+
% of active participants with a plan approved in prior quarters% of active participants with a plan approved in 2017-18 Q2

PART 1 - Participants and Planning
COAG Disability Reform Council Performance Report - South Australia 31 December 2017 10
Note: Of the 578 active participants identified as having an intellectual disability, 54 (9%), have down syndrome.
33% of participants entering in the quarter of 2017-18 Q2 have a primary disability group of Intellectual Disability. This is higher than previous quarters.
23% of participants entering this quarter have a primary disability of Autism compared to 48% in prior quarters. This reflects the phasing schedule, with younger participants having been phased into the scheme in prior quarters.
Demographic profile of active participants with a plan approved in 2017-18 Q2, compared with plan approvals as at 30 September 2017, by disability group.
% of active participants with a plan approved by disability group
Active participants with a plan approved in the quarter of 2017-18 Q2 by disability group
Participant Profiles by Disability Group
578
393
118
99
86
74
61
60
55
54
37
30
30
30
29
1
0 200 400 600
Intellectual Disability
Autism
Other Physical
Acquired Brain Injury
Developmental Delay
Cerebral Palsy
Visual Impairment
Other Neurological
Multiple Sclerosis
Hearing Impairment
Other Sensory/Speech
Global Developmental Delay
Psychosocial disability
Spinal Cord Injury
Stroke
Other
17%
48%
2%
1%
8%
4%
1%
2%
0%
3%
7%
4%
0%
0%
0%
1%
33%
23%
7%
6%
5%
4%
4%
3%
3%
3%
2%
2%
2%
2%
2%
0%
0% 20% 40% 60%
Intellectual Disability
Autism
Other Physical
Acquired Brain Injury
Developmental Delay
Cerebral Palsy
Visual Impairment
Other Neurological
Multiple Sclerosis
Hearing Impairment
Other Sensory/Speech
Global Developmental Delay
Psychosocial disability
Spinal Cord Injury
Stroke
Other
% of active participants with a plan approved in prior quarters% of active participants with a plan approved in 2017-18 Q2
PART 1 - Participants and Planning
COAG Disability Reform Council Performance Report - South Australia 31 December 2017 11
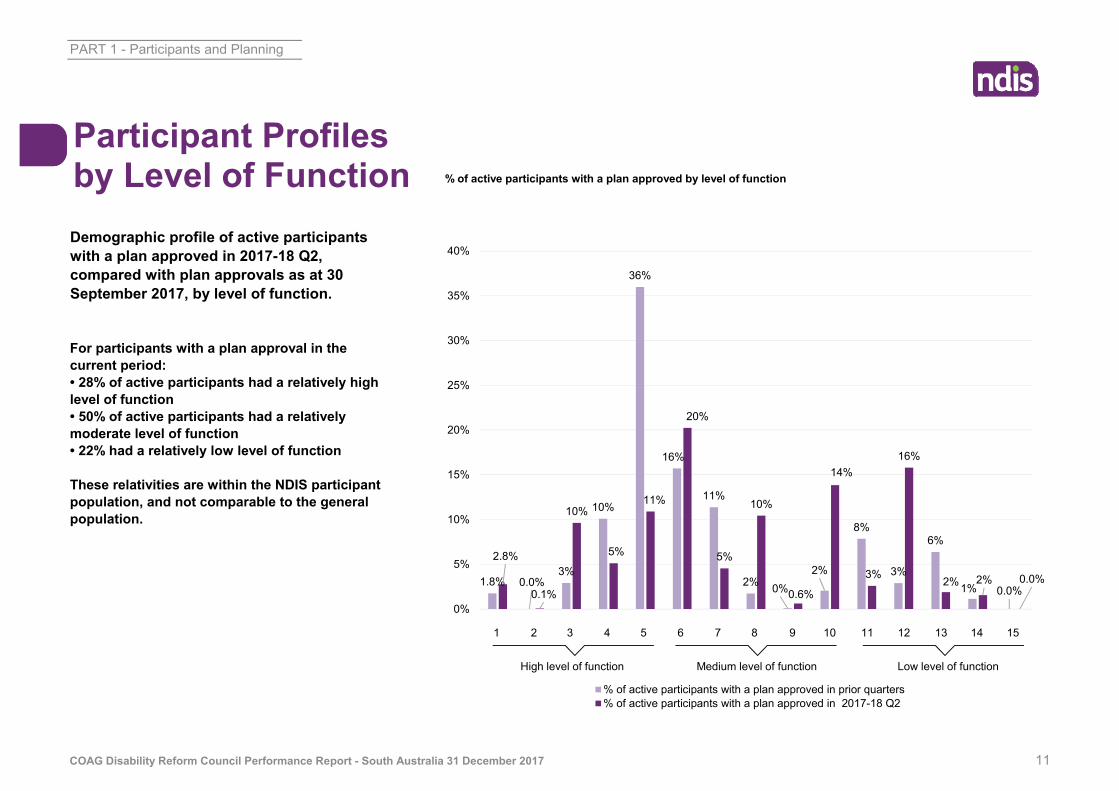
For participants with a plan approval in the current period: • 28% of active participants had a relatively high level of function• 50% of active participants had a relatively moderate level of function • 22% had a relatively low level of function
These relativities are within the NDIS participant population, and not comparable to the general population.
Demographic profile of active participants with a plan approved in 2017-18 Q2, compared with plan approvals as at 30 September 2017, by level of function.
% of active participants with a plan approved by level of function
Participant Profiles by Level of Function
1.8% 0.0%3%
10%
36%
16%
11%
2% 0%2%
8%
3%
6%
1% 0.0%
2.8%
0.1%
10%
5%
11%
20%
5%
10%
0.6%
14%
3%
16%
2% 2% 0.0%
0%
5%
10%
15%
20%
25%
30%
35%
40%
% of active participants with a plan approved in prior quarters% of active participants with a plan approved in 2017-18 Q2
1 2 3 4 5 6 7 8 9 10 11 12 13 14 15
Medium level of function Low level of functionHigh level of function
PART 1 - Participants and Planning
COAG Disability Reform Council Performance Report - South Australia 31 December 2017 12
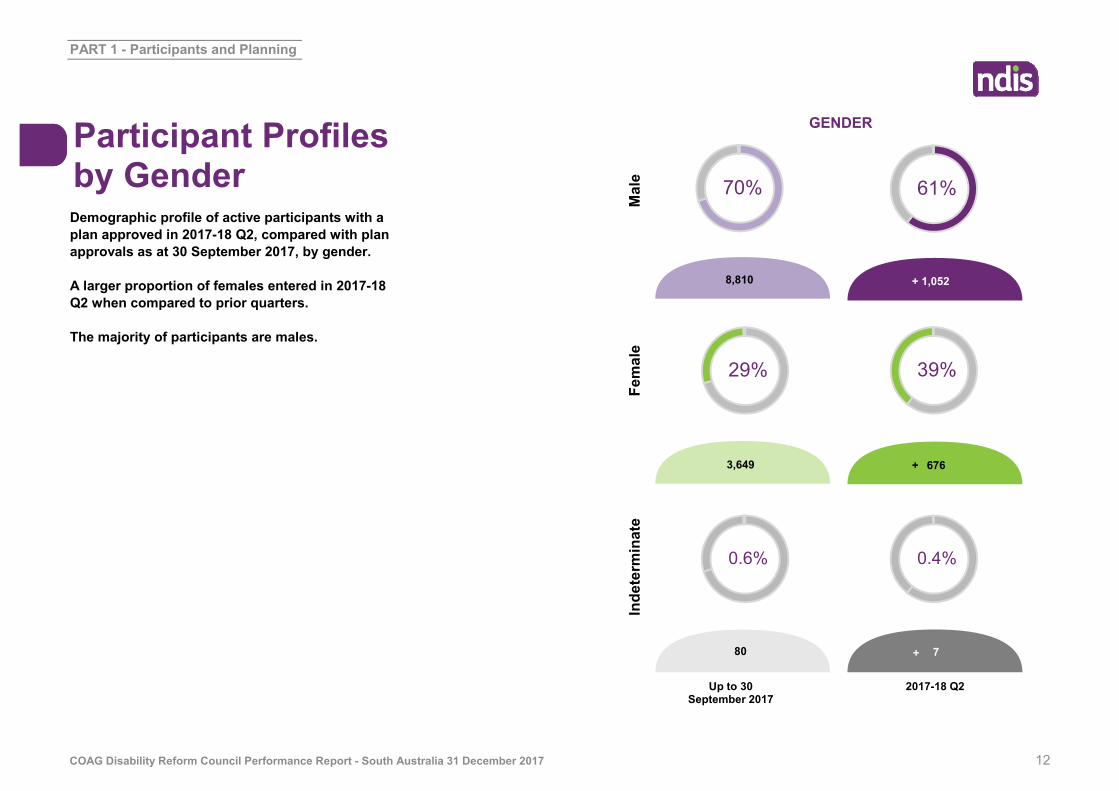
Demographic profile of active participants with a plan approved in 2017-18 Q2, compared with plan approvals as at 30 September 2017, by gender.
A larger proportion of females entered in 2017-18 Q2 when compared to prior quarters.
The majority of participants are males.
Participant Profiles by Gender 61%
+
39%
676+
0.4%
7
70%
8,810
29%
3,649
0.6%
80
GENDER
Mal
eFe
mal
eIn
dete
rmin
ate
2017-18 Q2Up to 30 September 2017
1,052
+

PART 1 - Participants and Planning
53
1,656
26
6
1,729
106
1,629
0
COAG Disability Reform Council Performance Report - South Australia 31 December 2017 13
Aboriginal and Torres Strait Islander
Not Aboriginal and Torres Strait Islander
Not Stated
Not stated
Young people in residential aged care status
Culturally and linguistically diverse status
Culturally and linguistically diverse
Not culturally and linguistically diverse
Young people in residential aged care
Young people not in residential aged care
Aboriginal & Torres-Strait Islander status
Demographic profile of active participants with a plan approved in 2017-18 Q2, compared with plan approvals as at 30 September 2017.
Of the participants with a plan approvedin 2017-18 Q2:
• 3.1% were Aboriginal or Torres Strait Islander, compared with 4.7% for prior periods.
• 0.3% were Young people in residential aged care, compared with 0.0% for prior periods.
• 6.1% were Culturally and linguistically diverse, compared with 6.0% for prior periods.
2017-18 Q2 % of active participants
2017-18 Q2 % of active participants
4.7%
89.0%
6.3%
3.1%
95.4%
1.5%
Prior Quarters
2017-18 Q2
0.0%
100.0%0.3%
99.7%Prior Quarters
2017-18 Q2
Participant Profiles
6.0%
92.1%
1.9%
6.1%
93.9%0.0%
Prior Quarters2017-18 Q2
2017-18 Q2 % of active participants

PART 1 - Participants and Planning
COAG Disability Reform Council Performance Report - South Australia 31 December 2017 14
The proportion of participants who are fully or partly self-managing their plan was lower in 2017-18 Q2 (23%) compared with prior quarters of transition (25%). 46% of participants who have had a plan approved in 2017-18 Q2 have support coordination in their plan, compared to 45% in prior quarters of transition.
Plan Management Support Co-ordination
11.5% 13.9% 11.3% 63.3%
0% 10% 20% 30% 40% 50% 60% 70% 80% 90% 100%
10.4% 12.4% 10.8% 66.5%
0% 10% 20% 30% 40% 50% 60% 70% 80% 90% 100%
Self Managed fully Self Managed Partly
Plan Managed/Agency Managed Fully Agency Managed
2017-18 Q2
Prior quarters (transition only)
Support Co-ordination
2017-18 Q2 Prior quarters
46% 45%

PART 1 - Participants and Planning
COAG Disability Reform Council Performance Report - South Australia 31 December 2017 15
Plan activation refers to the amount of time between plan approval and the commencement of the participant receiving support.
The percentage of plans activated within 90 days of approval were: • 62% of plans approved in prior quarters• 70% of plans approved in 2017-18 Q1.
Note: Given that plans approved in 2017-18 Q2 are relatively new, it is too early to examine the duration to plan activation for these plans and hence these have been excluded from the charts.
Plan Activation
Plan activation can only be approximated using data on payments. As there is a lag between when support is provided and payments made, these statistics are likely to be conservative. That is, it is likely that plan activation is faster than presented. Further, in-kind supports have been excluded from the calculation, which further contributes to the conservative figures.
Duration to Plan activation for initial plans
49.7% 14.7% 5.2%
2.6%
1.0%
26.9%
0% 10% 20% 30% 40% 50% 60% 70% 80% 90% 100%
Less than 30 days 30 to 59 days 60 to 89 days90 to 119 days 120 days and over No payments
38.1% 14.7% 9.5% 5.7% 13.0% 19.1%
0% 10% 20% 30% 40% 50% 60% 70% 80% 90% 100%
2017-18 Q1
Prior Quarters (Transition Only)
PART 1 - Participants and Planning
COAG Disability Reform Council Performance Report - South Australia 31 December 2017 16
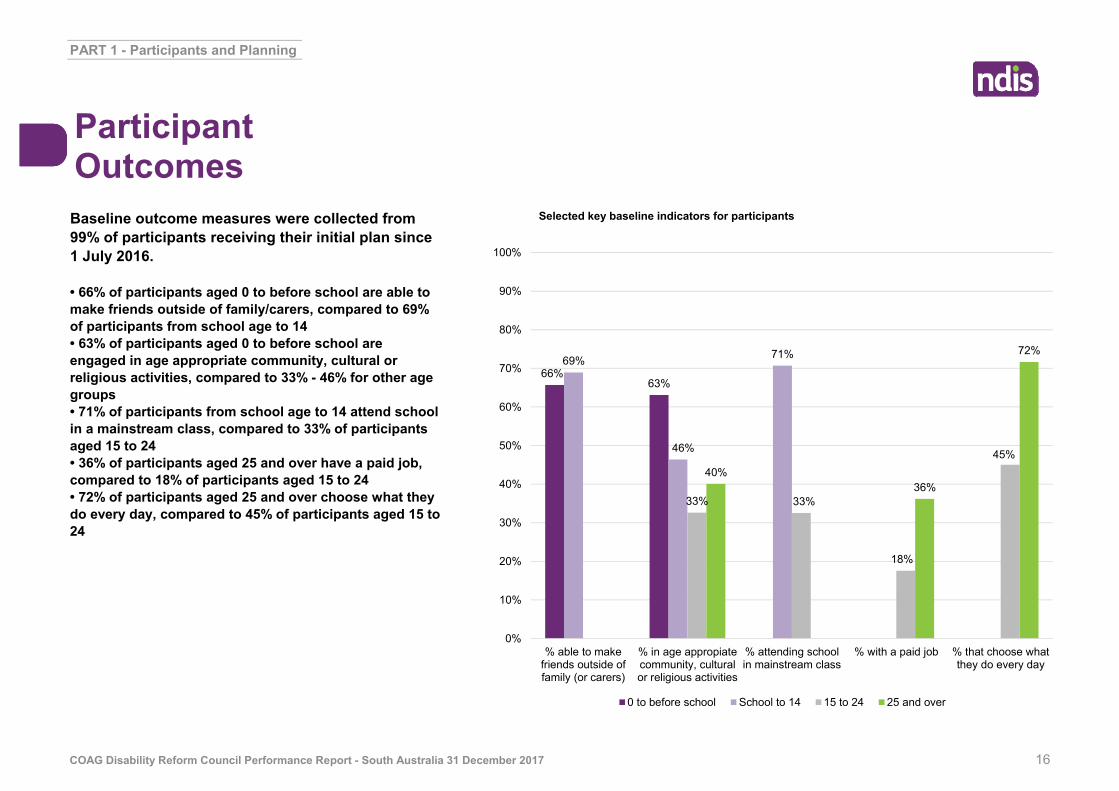
Selected key baseline indicators for participantsBaseline outcome measures were collected from 99% of participants receiving their initial plan since 1 July 2016.
• 66% of participants aged 0 to before school are able to make friends outside of family/carers, compared to 69% of participants from school age to 14• 63% of participants aged 0 to before school are engaged in age appropriate community, cultural or religious activities, compared to 33% - 46% for other age groups• 71% of participants from school age to 14 attend school in a mainstream class, compared to 33% of participants aged 15 to 24• 36% of participants aged 25 and over have a paid job, compared to 18% of participants aged 15 to 24• 72% of participants aged 25 and over choose what they do every day, compared to 45% of participants aged 15 to 24
Participant Outcomes
66%63%
69%
46%
71%
33% 33%
18%
45%40%
36%
72%
0%
10%
20%
30%
40%
50%
60%
70%
80%
90%
100%
% able to makefriends outside offamily (or carers)
% in age appropiatecommunity, culturalor religious activities
% attending schoolin mainstream class
% with a paid job % that choose whatthey do every day
0 to before school School to 14 15 to 24 25 and over

PART 1 - Participants and Planning
Selected key baseline indicators for families and carers of participants
COAG Disability Reform Council Performance Report - South Australia 31 December 2017 17
The percentage of participants' family/carers:• working in a paid job was highest for participants aged 0 to 14 (47%)• able to advocate for their child/family member was highest for participants aged 0 to 14 (79%)• who have friends and family they can see as often as they like was highest for participants aged 25 and over (61%)• who feel in control selecting services was highest for participants aged 25 and over (53%)• who support/plan for their family member through life stage transitions was highest for participants aged 0 to 14 (88%)
Family/Carers Outcomes
47%
79%
54%
88%
45%
77%
51%
45% 46%
30%
77%
61%
53%
37%
0%
10%
20%
30%
40%
50%
60%
70%
80%
90%
100%
% working in a paidjob
% able to advocatefor their child/family
member
% with friends andfamily they see asoften as they like
% who feel in controlselecting services
% who support/planfor their family
member through lifestage transitions
0 to 14 15 to 24 25 and over

PART 1 - Participants and Planning
"Has the NDIS helped?" questions for participants
COAG Disability Reform Council Performance Report - South Australia 31 December 2017 18
Note: There was insufficient data for participants aged 25 and over
Perceptions of whether the NDIS has helped.
Participants who entered the Scheme in the first half of 2016/17 and had been in the Scheme long enough at plan review to give a meaningful answer were asked questions about whether the NDIS had helped them.
The percentage responding 'Yes' was the highest for the domain of:• Daily Living (93%), for participants aged 0 to before school• Daily Living (62%), for participants of school age to 14• Choice and control (63%), for participants aged 15 to 24
Has the NDIS helped? Participants
93%
83%
73%
62%
51%48%
56%
44%
59%
13%
63%
0%
10%
20%
30%
40%
50%
60%
70%
80%
90%
100%
Daily Living Relationships Social, communityand civic participation
Work Choice and control
0 to before school School to 14 15 to 24

PART 1 - Participants and Planning
"Has the NDIS helped?" questions for families and carers of participants
COAG Disability Reform Council Performance Report - South Australia 31 December 2017 19
Perceptions of whether the NDIS has helped.
Families and carers of participants who entered the Scheme in the first half of 2016/17 and had been in the Scheme long enough at plan review to give a meaningful answer were asked questions about whether the NDIS had helped them.
The percentage responding 'Yes' was higher in all areas for family/carers of participants aged 0 to 14 than participants aged 15 and over.
The NDIS has helped families and carers of participants most with life stage transitions and in feeling supported.
Has the NDIS helped? Family/Carers
61%
75% 73%77%
52%48%
65%61%
41%
0%
10%
20%
30%
40%
50%
60%
70%
80%
90%
100%
Families/carers knowtheir rights and can
advocate
Families/carers feelsupported
Families/carers areable to access
services, programsand activities
Families/carers helpwith life stage
transitions
Families/carers enjoyhealth and wellbeing
0 to 14 15 and over

PART 1 - Participants and Planning
Note: Participant satisfaction results are not shown if there is insufficient data in the group.
COAG Disability Reform Council Performance Report - South Australia 31 December 2017 20
Proportion of participants describing satisfaction with the Agency's planning process as good or very good - by quarter
75% of participants rated their satisfaction with the Agency's planning process as either good or very good in the current quarter. This has decreased since the last quarter.
The Participant Pathway Review aims to improve the participant experience.
Participant Satisfaction
Participant satisfaction continues to be high, but has dropped during transition, compared with trial site experience.
91%98% 98% 100% 100%
96%
73%
84% 86%83%
75%
0%
10%
20%
30%
40%
50%
60%
70%
80%
90%
100%
Prop
ortio
n of
Par
ticip
ants
%
Quarter

South Australia - 31 December 2017
PART 2
Committed Supports and Payments
Both committed and paid supports to participants are increasing in line with the growing scheme.
To date funding committed to participants with an approved plan amounts to $691.5 million (including support periods in the future), of which $271.8 million has been paid.
PART 2 - Committed Supports and Payments
^Note: The $275.4 million in respect of 2017-18 only includes approved plans to date, and not all of these plans cover the full 2017-18 year.*Note: The $60.3 million committed in future years is due to current plans in place that have an end date past 30 June 2018.COAG Disability Reform Council Performance Report - South Australia 31 December 2017 22
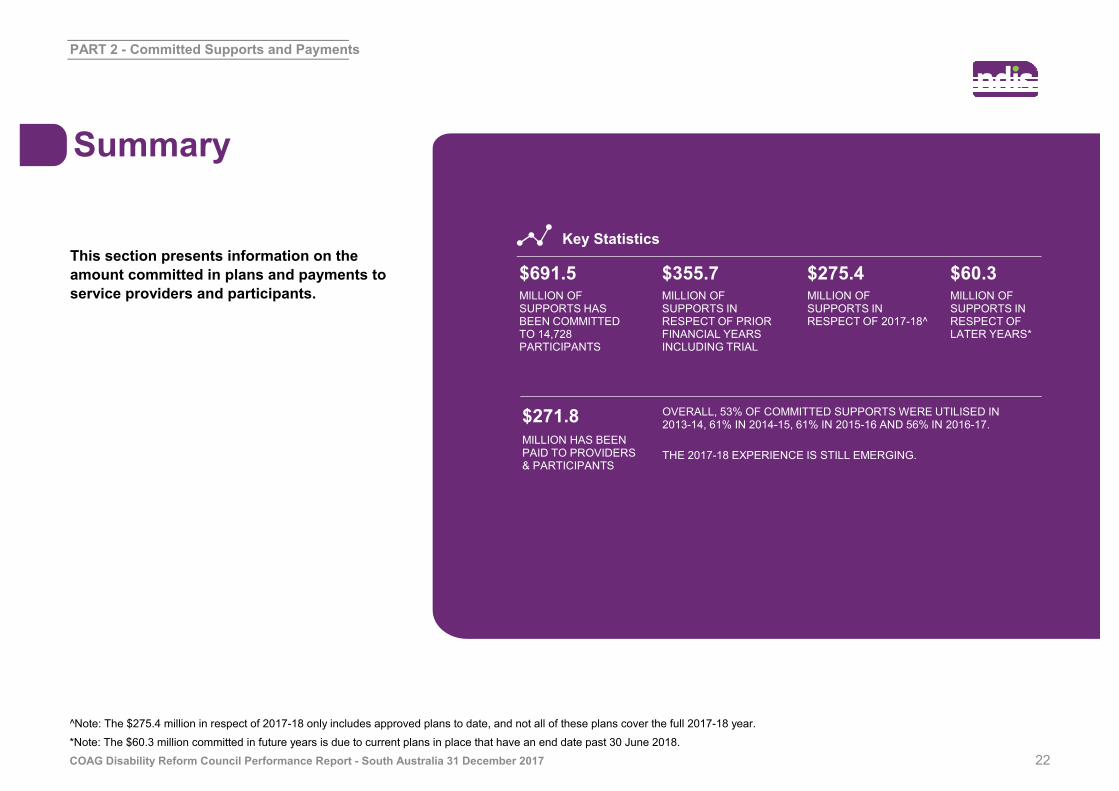
This section presents information on the amount committed in plans and payments to service providers and participants.
Summary
Key Statistics
MILLION OF SUPPORTS HAS BEEN COMMITTED TO 14,728 PARTICIPANTS
$691.5
MILLION HAS BEEN PAID TO PROVIDERS & PARTICIPANTS
$271.8 OVERALL, 53% OF COMMITTED SUPPORTS WERE UTILISED IN 2013-14, 61% IN 2014-15, 61% IN 2015-16 AND 56% IN 2016-17.
THE 2017-18 EXPERIENCE IS STILL EMERGING.
MILLION OF SUPPORTS IN RESPECT OF PRIOR FINANCIAL YEARS INCLUDING TRIAL
$355.7MILLION OF SUPPORTS IN RESPECT OF 2017-18^
$275.4MILLION OF SUPPORTS IN RESPECT OF LATER YEARS*
$60.3
PART 2 - Committed Supports and Payments
COAG Disability Reform Council Performance Report - South Australia 31 December 2017 23
Committed and paid by expected support year
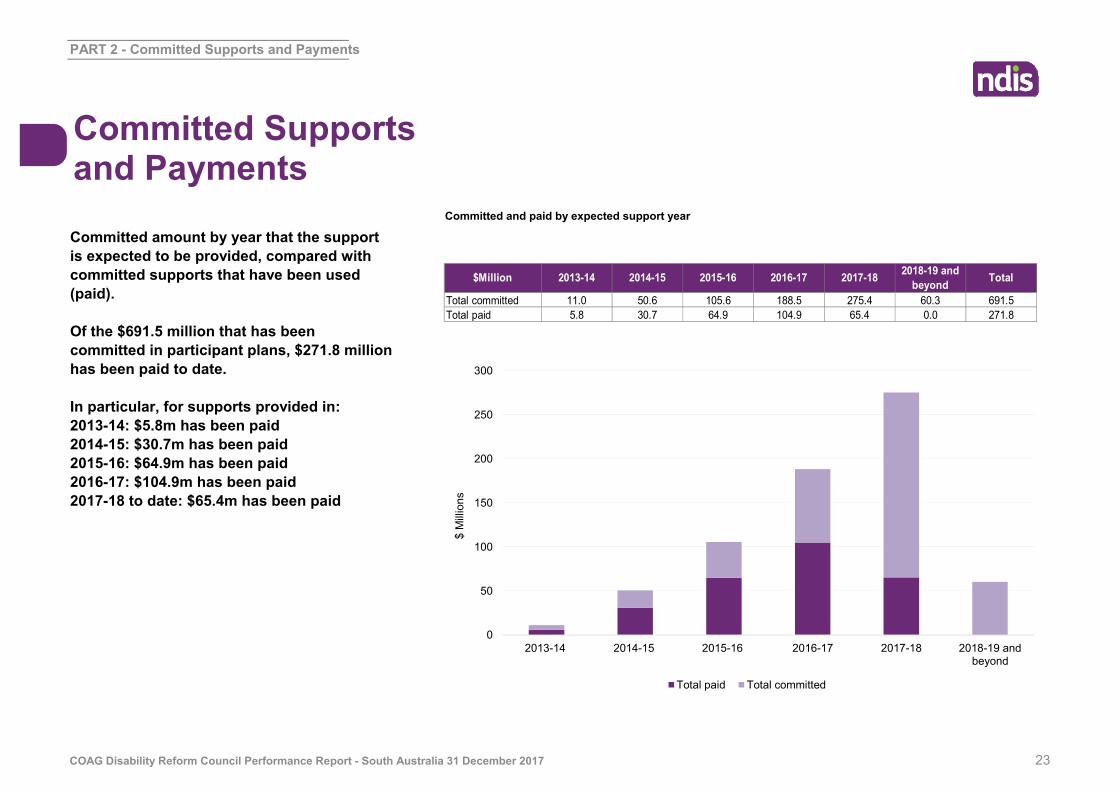
Committed amount by year that the support is expected to be provided, compared with committed supports that have been used (paid).
Of the $691.5 million that has been committed in participant plans, $271.8 million has been paid to date.
In particular, for supports provided in:2013-14: $5.8m has been paid2014-15: $30.7m has been paid2015-16: $64.9m has been paid2016-17: $104.9m has been paid2017-18 to date: $65.4m has been paid
Committed Supports and Payments
0
50
100
150
200
250
300
2013-14 2014-15 2015-16 2016-17 2017-18 2018-19 andbeyond
$ M
illio
ns
Total paid Total committed
$Million 2013-14 2014-15 2015-16 2016-17 2017-18 2018-19 and beyond Total
Total committed 11.0 50.6 105.6 188.5 275.4 60.3 691.5Total paid 5.8 30.7 64.9 104.9 65.4 0.0 271.8

PART 2 - Committed Supports and Payments
COAG Disability Reform Council Performance Report - South Australia 31 December 2017 24
A higher proportion of initial plan approvals in 2017-18 Q2 have average annualised committed supports greater than $20,000 compared with participants who entered in prior quarters when participants with shared supported accommodation (SSA) supports are included.
This is also the case when SSA participants are excluded.
Committed Supports by Cost Band
0%5%
10%15%20%25%30%35%
Distribution of average annualised committed supports by cost band (including SSA)
0%5%
10%15%20%25%30%35%
Distribution of average annualised committed supports by cost band (excluding SSA)
As at Q1 2017-18 Q2 2017-18

PART 2 - Committed Supports and Payments
COAG Disability Reform Council Performance Report - South Australia 31 December 2017 25
Note: The age eligibility requirements for the NDIS are based on the age as at the access request date. Participants with their initial plan approved aged 65+ have turned 65 since their access request was received.
Average annualised committed supports increase at a declining rate up to age 25, and then stabilises to age 64.
The average annualised committed supports for participants aged 35 and over has increased in the current quarter. This is reflective of the phasing schedule.
Average annualised committed supports by age band
Committed Supports by Age Band
0
10,000
20,000
30,000
40,000
50,000
60,000
70,000
80,000
0 to 6 7 to 14 15 to 18 19 to 24 25 to 34 35 to 44 45 to 54 55 to 64 65+
As at Q1 2017-18 Q2 2017-18
PART 2 - Committed Supports and Payments
Note: Average annualised committed supports are not shown if there are insufficient data in the group.
COAG Disability Reform Council Performance Report - South Australia 31 December 2017 26
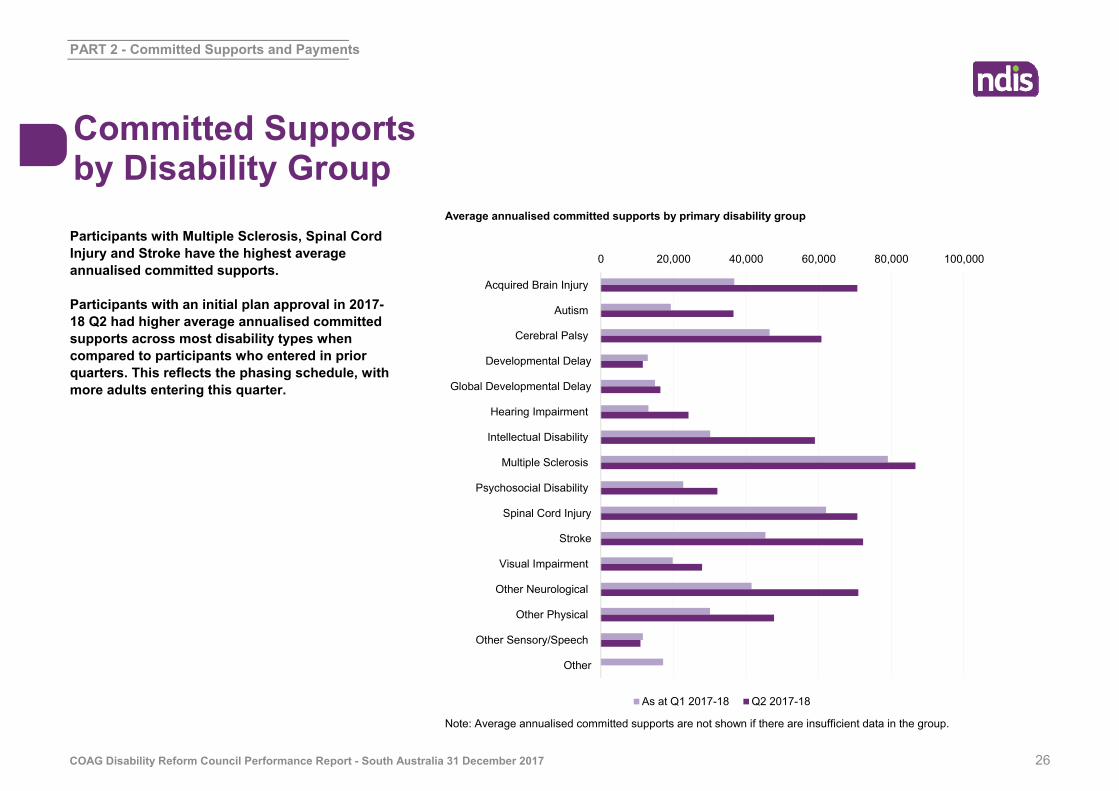
Participants with Multiple Sclerosis, Spinal Cord Injury and Stroke have the highest average annualised committed supports.
Participants with an initial plan approval in 2017-18 Q2 had higher average annualised committed supports across most disability types when compared to participants who entered in prior quarters. This reflects the phasing schedule, with more adults entering this quarter.
Average annualised committed supports by primary disability group
Committed Supports by Disability Group
0 20,000 40,000 60,000 80,000 100,000
Acquired Brain Injury
Autism
Cerebral Palsy
Developmental Delay
Global Developmental Delay
Hearing Impairment
Intellectual Disability
Multiple Sclerosis
Psychosocial Disability
Spinal Cord Injury
Stroke
Visual Impairment
Other Neurological
Other Physical
Other Sensory/Speech
Other
As at Q1 2017-18 Q2 2017-18
PART 2 - Committed Supports and Payments
COAG Disability Reform Council Performance Report - South Australia 31 December 2017 27
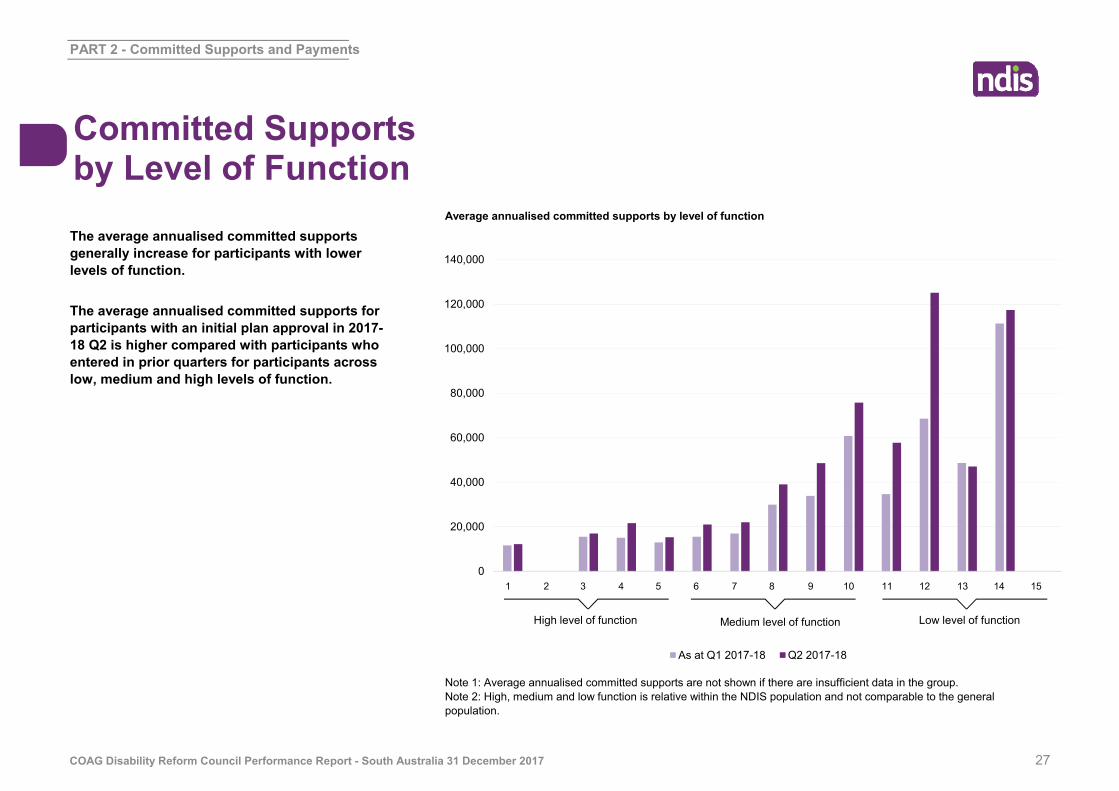
Average annualised committed supports by level of function
The average annualised committed supports generally increase for participants with lower levels of function.
The average annualised committed supports for participants with an initial plan approval in 2017-18 Q2 is higher compared with participants who entered in prior quarters for participants across low, medium and high levels of function.
Note 1: Average annualised committed supports are not shown if there are insufficient data in the group.Note 2: High, medium and low function is relative within the NDIS population and not comparable to the general population.
Committed Supports by Level of Function
0
20,000
40,000
60,000
80,000
100,000
120,000
140,000
1 3 5 7 9 11 13 15As at Q1 2017-18 Q2 2017-18
1 2 3 4 5 6 7 8 9 10 11 12 13 14 15
Medium level of function Low level of functionHigh level of function
PART 2 - Committed Supports and Payments
COAG Disability Reform Council Performance Report - South Australia 31 December 2017 28
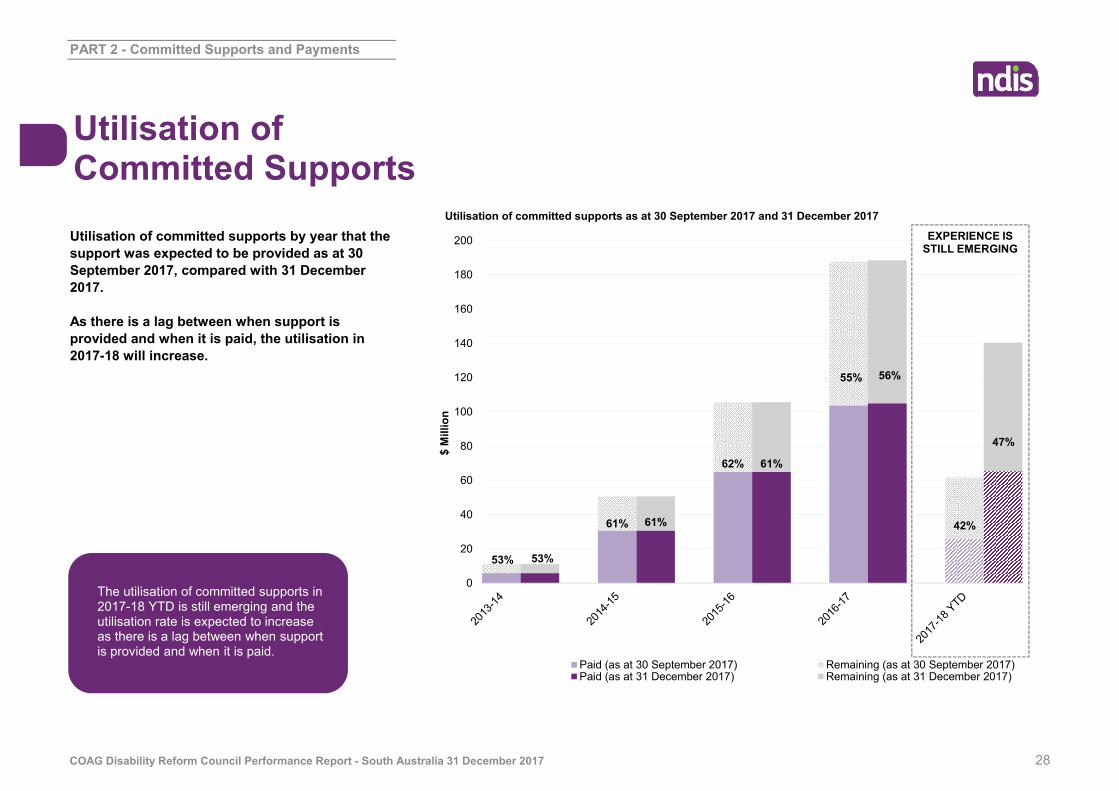
Utilisation of committed supports as at 30 September 2017 and 31 December 2017
Utilisation of committed supports by year that the support was expected to be provided as at 30 September 2017, compared with 31 December 2017.
As there is a lag between when support is provided and when it is paid, the utilisation in 2017-18 will increase.
The utilisation of committed supports in 2017-18 YTD is still emerging and the utilisation rate is expected to increase as there is a lag between when support is provided and when it is paid.
Utilisation of Committed Supports
53%
61%
62%
53%
61%
61%
55% 56%
42%
47%
0
20
40
60
80
100
120
140
160
180
200
$ M
illio
n
Paid (as at 30 September 2017) Remaining (as at 30 September 2017)Paid (as at 31 December 2017) Remaining (as at 31 December 2017)
EXPERIENCE IS STILL EMERGING

South Australia - 31 December 2017
PART 3
Providers and Markets
The scale and extent of the market continues to grow, with a 15% increase in the number of providers during the quarter to 1,526.
COAG Disability Reform Council Performance Report - South Australia 31 December 2017 30
PART 3 - Providers and Markets
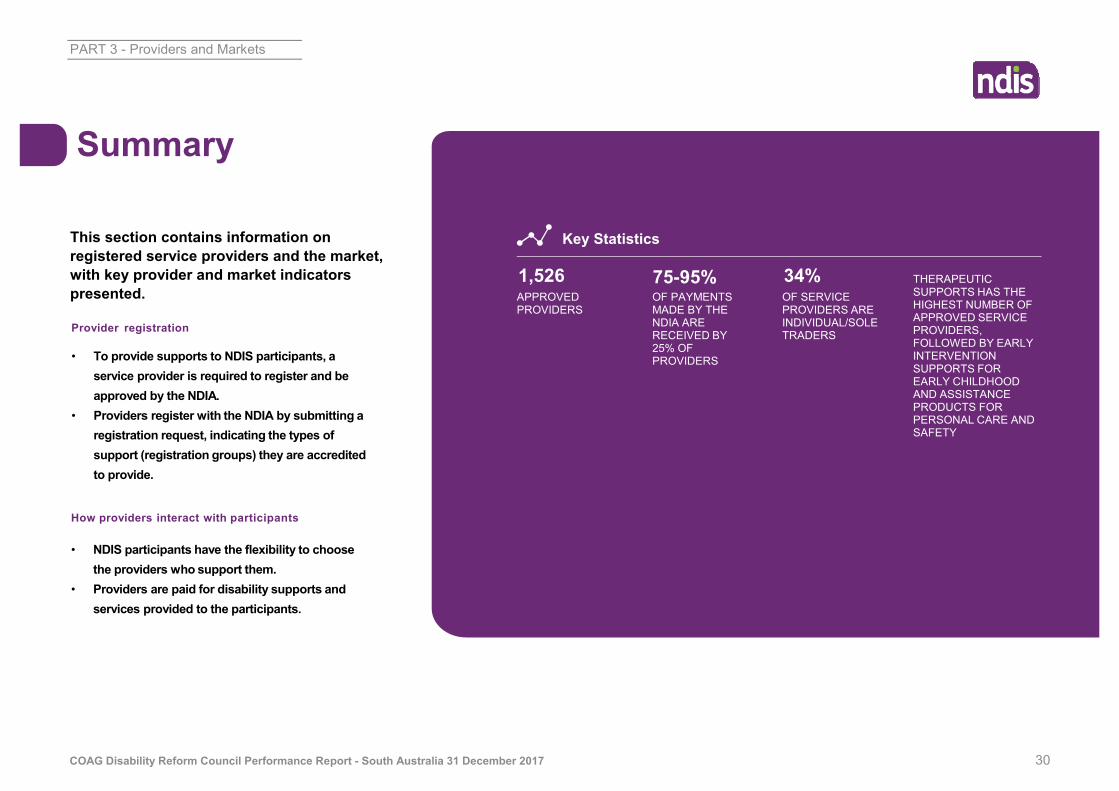
This section contains information on registered service providers and the market, with key provider and market indicators presented.
Summary
Key Statistics
OF SERVICE PROVIDERS ARE INDIVIDUAL/SOLE TRADERS
THERAPEUTIC SUPPORTS HAS THE HIGHEST NUMBER OF APPROVED SERVICE PROVIDERS, FOLLOWED BY EARLY INTERVENTION SUPPORTS FOR EARLY CHILDHOOD AND ASSISTANCE PRODUCTS FOR PERSONAL CARE AND SAFETY
Provider registration
• To provide supports to NDIS participants, a service provider is required to register and be approved by the NDIA.
• Providers register with the NDIA by submitting a registration request, indicating the types of support (registration groups) they are accredited to provide.
How providers interact with participants
• NDIS participants have the flexibility to choose the providers who support them.
• Providers are paid for disability supports and services provided to the participants.
APPROVED PROVIDERS
OF PAYMENTS MADE BY THE NDIA ARE RECEIVED BY 25% OF PROVIDERS
1,526 75-95% 34%
COAG Disability Reform Council Performance Report - South Australia 31 December 2017 31
PART 3 - Providers and Markets
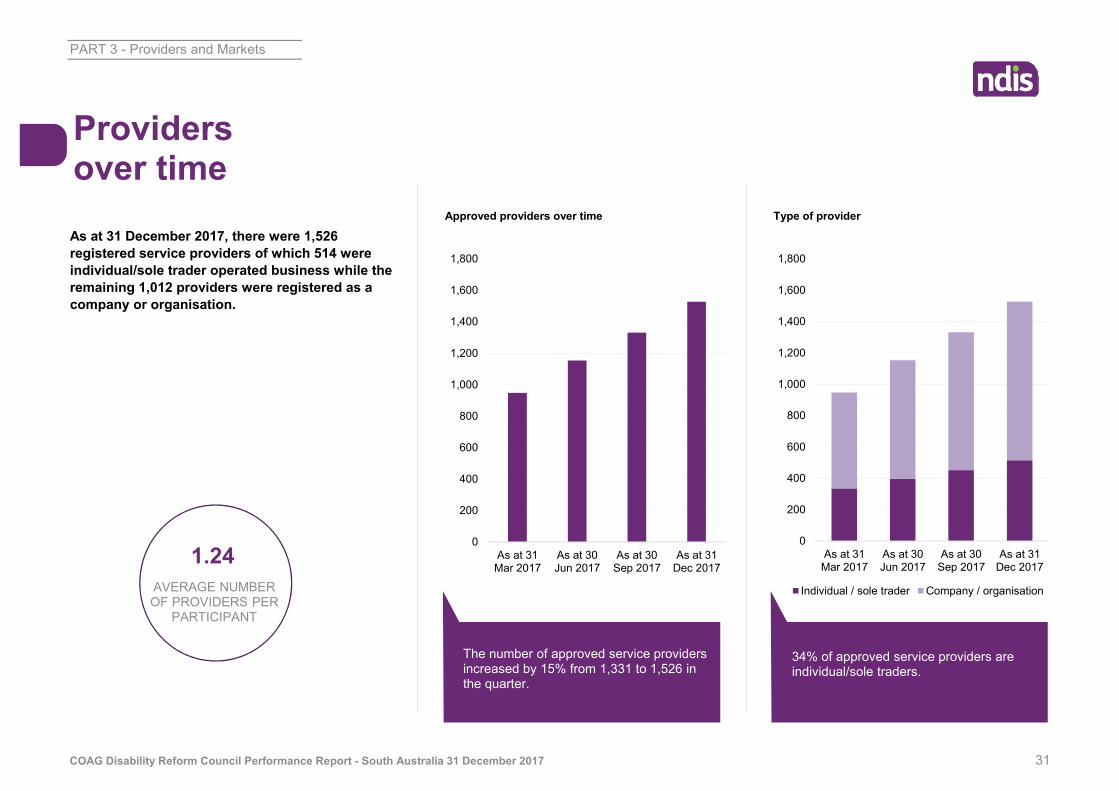
Approved providers over time Type of provider
As at 31 December 2017, there were 1,526 registered service providers of which 514 were individual/sole trader operated business while the remaining 1,012 providers were registered as a company or organisation.
Providers over time
0
200
400
600
800
1,000
1,200
1,400
1,600
1,800
As at 31Mar 2017
As at 30Jun 2017
As at 30Sep 2017
As at 31Dec 2017
0
200
400
600
800
1,000
1,200
1,400
1,600
1,800
As at 31Mar 2017
As at 30Jun 2017
As at 30Sep 2017
As at 31Dec 2017
Individual / sole trader Company / organisation
The number of approved service providers increased by 15% from 1,331 to 1,526 in the quarter.
34% of approved service providers are individual/sole traders.
1.24AVERAGE NUMBER OF PROVIDERS PER
PARTICIPANT
COAG Disability Reform Council Performance Report - South Australia 31 December 2017 32
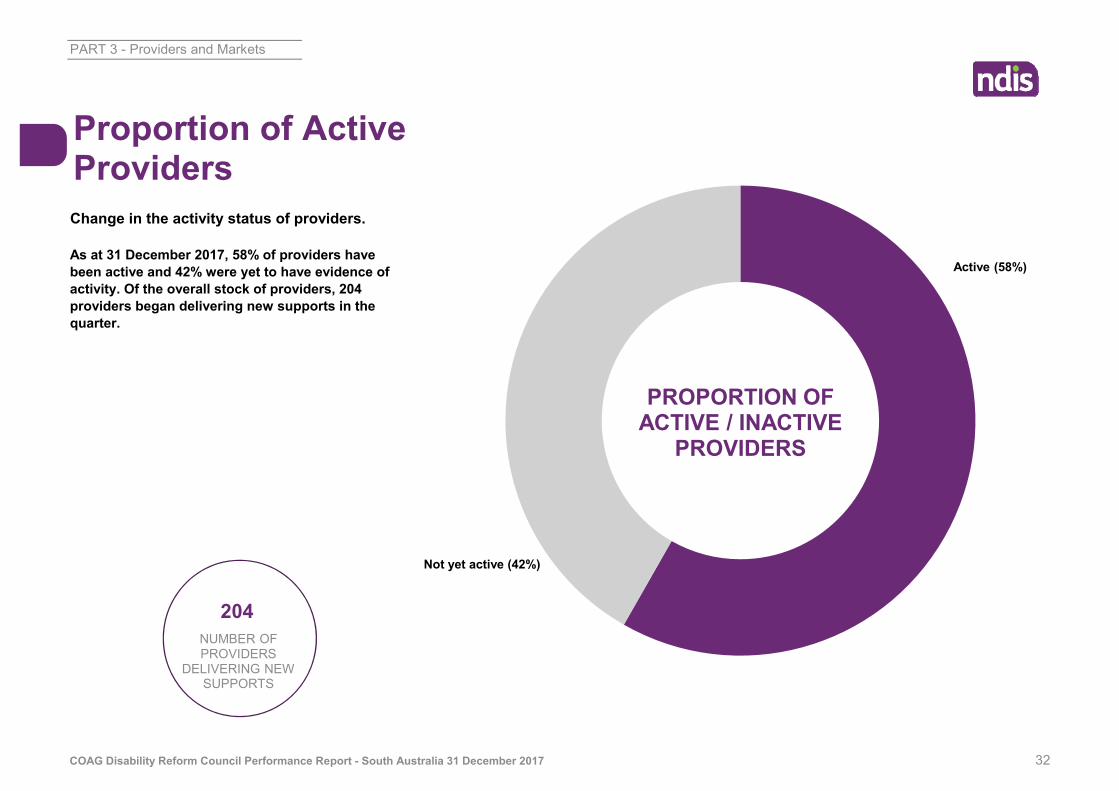
Change in the activity status of providers.
PART 3 - Providers and Markets
As at 31 December 2017, 58% of providers have been active and 42% were yet to have evidence of activity. Of the overall stock of providers, 204 providers began delivering new supports in the quarter.
Proportion of Active Providers
Active (58%)
Not yet active (42%)
PROPORTION OF ACTIVE / INACTIVE
PROVIDERS
204NUMBER OF PROVIDERS
DELIVERING NEW SUPPORTS
COAG Disability Reform Council Performance Report - South Australia 31 December 2017 33
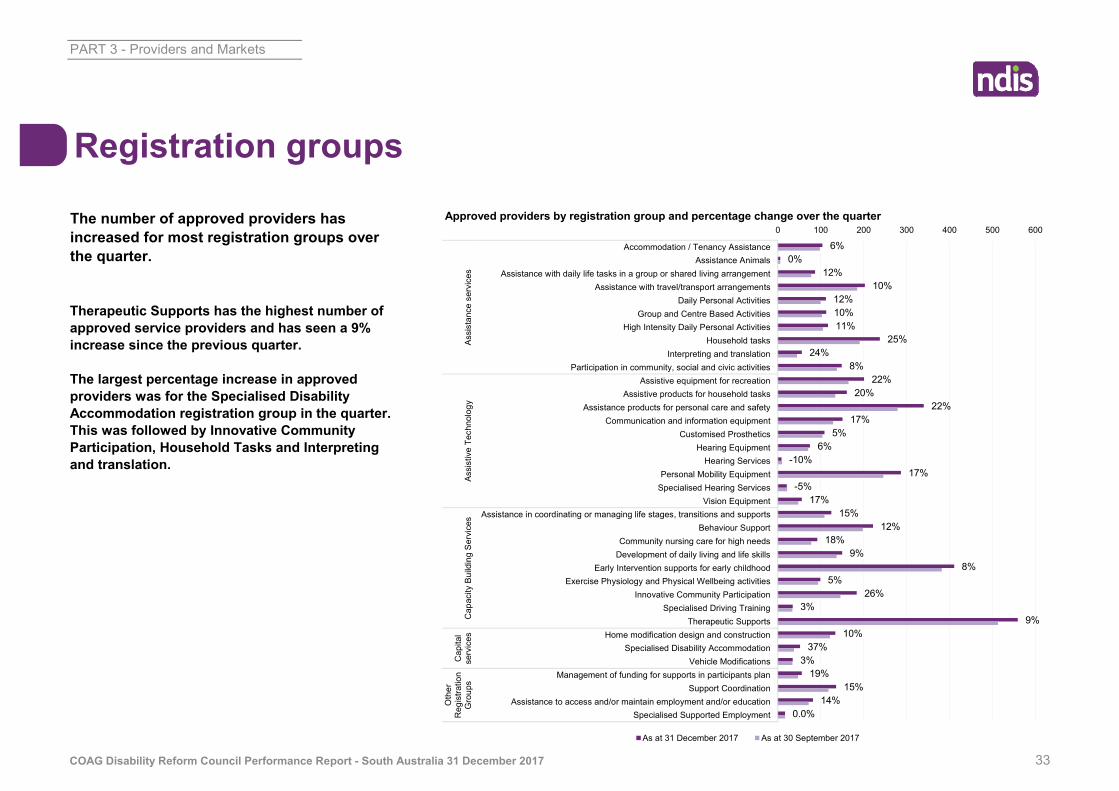
Therapeutic Supports has the highest number of approved service providers and has seen a 9% increase since the previous quarter.
The largest percentage increase in approved providers was for the Specialised Disability Accommodation registration group in the quarter. This was followed by Innovative Community Participation, Household Tasks and Interpreting and translation.
PART 3 - Providers and Markets
Approved providers by registration group and percentage change over the quarterThe number of approved providers has increased for most registration groups over the quarter.
Registration groups
6%0%
12%10%
12%10%11%
25%24%
8%22%
20%22%
17%5%
6%-10%
17%-5%
17%15%
12%18%
9%8%
5%26%
3%9%
10%37%
3%19%
15%14%
0.0%
0 100 200 300 400 500 600
Accommodation / Tenancy AssistanceAssistance Animals
Assistance with daily life tasks in a group or shared living arrangementAssistance with travel/transport arrangements
Daily Personal ActivitiesGroup and Centre Based Activities
High Intensity Daily Personal ActivitiesHousehold tasks
Interpreting and translationParticipation in community, social and civic activities
Assistive equipment for recreationAssistive products for household tasks
Assistance products for personal care and safetyCommunication and information equipment
Customised ProstheticsHearing Equipment
Hearing ServicesPersonal Mobility Equipment
Specialised Hearing ServicesVision Equipment
Assistance in coordinating or managing life stages, transitions and supportsBehaviour Support
Community nursing care for high needsDevelopment of daily living and life skills
Early Intervention supports for early childhoodExercise Physiology and Physical Wellbeing activities
Innovative Community ParticipationSpecialised Driving Training
Therapeutic SupportsHome modification design and construction
Specialised Disability AccommodationVehicle Modifications
Management of funding for supports in participants planSupport Coordination
Assistance to access and/or maintain employment and/or educationSpecialised Supported Employment
Assi
stan
ce s
ervi
ces
Assi
stiv
e Te
chno
logy
Cap
acity
Bui
ldin
g S
ervi
ces
Cap
ital
serv
ices
Oth
erR
egis
tratio
nG
roup
s
As at 31 December 2017 As at 30 September 2017

COAG Disability Reform Council Performance Report - South Australia 31 December 2017 34
Market share of the top 25% of providers by registration group.25% of service providers received 75-95% of the dollars paid for major registration groups.
PART 3 - Providers and Markets
Market share oftop providers
DAILY PERSONAL ACTIVITIES
(%)
EARLY INTERVENTION
SUPPORTS FOR EARLY CHILDHOOD
(%)
PARTICIPATION IN COMMUNITY,
SOCIAL AND CIVIC ACTIVITIES
(%)
ASSISTANCE WITH DAILY LIFE TASKS
IN A GROUP OR SHARED LIVING ARRANGEMENT
(%)
THERAPEUTIC SUPPORTS
(%)
81% 87% 78%
93% 84%

South Australia - 31 December 2017
PART 4
Information, Linkages and Capacity Building
Information, Linkages and Capacity Building was covered in the national version of the COAG Quarterly Performance Report.
South Australia - 31 December 2017
PART 5
Mainstream Interface
The proportion of participants entering in the current quarter accessing mainstream services is higher compared to prior quarters.

COAG Disability Reform Council Performance Report - South Australia 31 December 2017 37
92% of active participants with a plan approved in 2017-18 Q2 access mainstream services, an increase from prior quarters. Participants are accessing mainstream services predominantly for lifelong learning, health and wellbeing and daily activities.
PART 5 - Mainstream Interface
Mainstream Interface
daily activities
0%health and wellbeing
0%lifelong learning
0%
2017-18 Q2
HEALTH AND WELLBEING
DAILY ACTIVITIES
PRIOR QUARTERS (TRANSITION ONLY)
8%37%
32%
32%
25%
LIFELONG LEARNING
7%
92%
% of active participants
accessing mainstream
supports
2017-18 Q2
89%In prior quarters (transition only)

South Australia - 31 December 2017
PART 6
Financial Sustainability
Financial Sustainability was covered in the national version of the COAG Quarterly Performance Report.