december 5, 1969 business statistics - st. louis fed · a united states department of commerce...
TRANSCRIPT
A UNITED STATES
DEPARTMENT OF
COMMERCE PUBLICATION BUSINESS
STATISTICS
December 5, 1969
A WEEKLY SUPPLEMENT TO THE
SURVEY OF CURRENT BUSINESS*
U.S. DEPARTMENT OF COMMERCE / OFFICE OF BUSINESS ECONOMICS
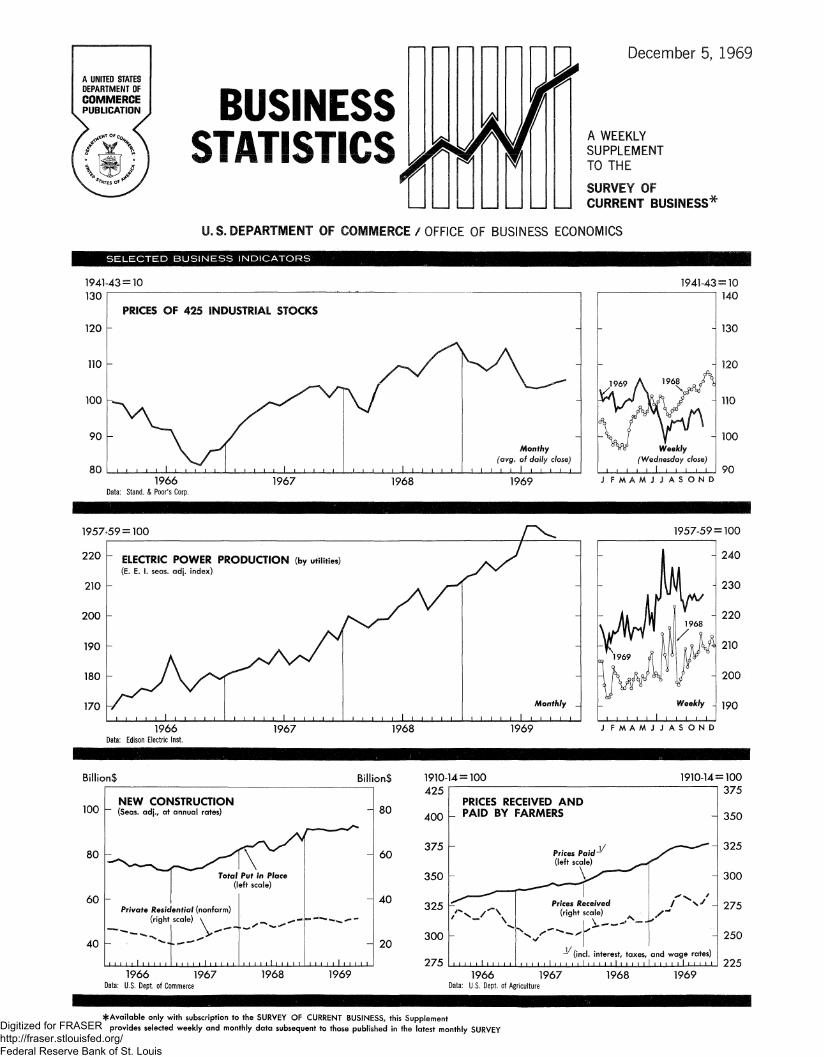
S I N D I C A T O R S
1941-43 = 10 130
120
110
100
90
80
PRICES OF 425 INDUSTRIAL STOCKS
-
1 1 1 1 J..,„JLjL J L™l 1 - J 1—J L™i_J 1 LJL™1_J— — i — 1 l—l I 1 1 1 1 1 — ! _
^ N / \
-
_ Monthy
(avg. of daily close)
i i i i i 1 i i i i i
1941-43=10 140
130
Weekly (Wednesday close)
• ' ' » I I ' ' ' • *
120
H 100
90 1966
Data: Stand. & Poor's Corp. 1967 1968 1969 J F M A M J J A S O N D
1957^59 = 100
220
210
200
190
180
170
" ELECTRIC POWER PRODUCTION (by utilities) As^/ (E. E. 1. seas. a d j . index) ^ y ^^
A /~*
A /
J V /****
1 i , i , , i i i i i 1 i i i i i • I . I i 1 1 -J L_J 1 1 . i _
-
-
-
-
Monthly _
i i i i i 1 i i i i i
1957-59 = 1
1966 Edison Electric Inst.
1967 1968 1969 J F M A M J J A S O N D
Billion$
100
60
40
NEW CONSTRUCTION (Seas, adj., at annual rates)
Total Put in Place (left scale)
Private Residential (nonfarm) (right scale) \ I
I I I I I I I I I I I I I I I I
Billion$
80
H 60
40
i i i i I i i i
20
1966 1967 Data: U.S. Dept. of Commerce
1968 1969
1910-14 = 100 425
400
375
350
325
300
275
1910-14 =
PRICES RECEIVED AND _ PAID BY FARMERS
Prices Paid~^ >< (left scale) ^ ^ \
\^y
> - _ / - \ ^
• 1 1 1 1 1
Prices Received (r ight scale)
1 \.-~-- —-
-
- ^ (incl. interest, taxes, and w a g e rates)
1 1 M 1 1 1 M 1 1 |„U_1_U_I 1 1 1 1 1 1 1 U L - J M i l l
= 100 375
350
325
300
275
250
225 1966 1967
Data: U.S. Dept. of Agriculture 1968 1969
^Available only with subscription to the SURVEY OF CURRENT BUSINESS, this Supplement provides selected weekly and monthly data subsequent to those published in the latest monthly SURVEY Digitized for FRASER
http://fraser.stlouisfed.org/ Federal Reserve Bank of St. Louis

2 WEEKLY BUSINESS STATISTICS1
ITEM
WHOLESALE PRICES, 22 COMMODITIES 2/.. 1957-59=100..
ALL RETAIL STORES, SALES . .mil. $.. Nondurable goods stores do....
INITIAL UNEMPLOYMENT CLAIMS, State programs thous.. INSURED UNEMPLOYMENT, all programs do State programs (50 States, D.C., and Puerto Rico)...do....
FAILURES, INDUST. AND COMMERCIAL (Dun & Bradstreet).number..
FINANCE: Currency in circulation 3/ mil. ..$.. Federal Reserve bank credit outstanding, total jj,. .do..... Member bank reserve balances 2/ -do.... Excess reserves, estimated 3/ do....
Assets and liabilities of large commercial banks: }J Demand deposits, adjusted mil. $.. Savings deposits do.... Loans and investments, gross adjusted, total do.... U.S. Government obligations .do.... Commercial and industrial loans (gross) do.... Real estate loans (gross) do....
Bond yields, domestic corporate (Moody's) 2/ percent.. Stock prices, 500 stocks (Stand. & Poor 's)V. 1941-43=10.. Industrials, 425 stocks do....
PRODUCTION: Bituminous c o a l 3 / t h o u s . s h . t o n s . . E l e c t r i c power, by u t i l i t i e s . m i l . k w . - h r . . Motor v e h i c l e s (passenger c a r s ) number. . Petroleum (crude) and condensate 2 / t h o u s . b b l . .
S t e e l , raw t h o u s . s h . t o n s . . Index of p roduc t ion .1957-59=100. .
RAIL FREIGHT, REVENUE TON-MILES b i l . . Jl/Data do not .always cover ca lendar weeks. 2/Tuesday p r i c e
1968
Nov. 23
6,954 4,693
212 994 922 154
49,475 58,723 26,960
-77
78,553 48,772
224,550 28,644 70,937 31,832
6.56 -**-106.14 **115.43
1,891 25,948
216,153 9,006
2,244 120.5 15.3
Nov. 30
97-9
6,988 4,773
1180 1,080 1,002
137
49,638 58,532 26,594
-59
71,178 31,752
6.63 107.76 117.33
1,933 24,612
174,419 8,998
2,356 126.5
13.4
1969
Nov. 8
11.9
6,802 4 ,702
206 1,005
935 222
51,819 62 ,091 27,635
310
77,953 46,409
227,305 23,428 78,117 33,947
7 .68 97 .64
107 .31
1,868 27,059
186,904 9,280
2,730 146.5
1 5 . 8
Nov. 15
*112.1
6,965 4,795
197 1,084 1,007
161
52,314 62,458 27,696
-202
78,396 46,343
226,984 22,971 78,246 33,995
7.70 97.89
107.62
1,942 27,357
180,736 9,254
2,769 24-8.6
15.7
Nov. 22
112.2
7,065 4,914
231
" " l 8 3
52,551 63,102 27,949
- 1
79,835 46,345
226,372 22 ,641 77,995 34,065
7.78 95.90
105.58
1,739 28,157
182,727 9,277
2,784 149.4
Nov. 29
111.6
199
52,687 62,850 27,527
63
7*90 93.27
102.85
123,950
2,807 150.6
3 /Da i ly ave rage , /^/Wednesday a a t a . ^Monday p r i c e . **Tuesday d a t a .
MONTHLY BUSINESS STATISTICS
ITEM
1968
Oct. Nov.
1969
Aug. Sept. Oct. Nov.
COMMODITY PRICES
PRICES RECEIVED BY FARMERS, ALL FARM PRODUCTS..1910-14=100. Crops do... Commercial vegetables do...
Cotton do... Feed grains and hay do.,. Food grains do...
Fruit do... Tobacco do...
Livestock and products do... Dairy products do... Meat animals do... Poultry and eggs do...
PRICES PAID BY FARMERS: All commodities and services do... Family living items do... Production items do...
All commod., services, int., taxes, and wage rates..do...
PARITY RATIO .do...
WHOLESALE PRICE INDEX: All commodities 1957-59=100. Farm products do... Processed foods and feeds do... Industrial commodities do...
PURCHASING POWER OF THE DOLLAR AS MEASURED BY— Wholesale prices 1957-59=$!.00.,
262 228 284
224 148 155
332 562
291 337 338 149
312 339 292 358
73
109 .1 101.2 114.4 109-7
$0,917
264 231 353
204 156 159
285 577
292 340 337 154
314 341 294 360
73
109.6 103 .1 114.7 109.9
D.912
279 220 297
173 167 145
257 607
330 325 422 153
324 352 304 373
75
113.4 108.9 121.5 112.8
$0,882
275 214 285
164 166 152
245 615
328 337 407 164
325 354 304 374
74
113.6 108.4 121.3 113.2
277 217 313
183 165 157
228 611
327 349 401 161
326 355 305 376
74
114.0 107.9 121.6 113.8
3.877
285 228 436
180 162 158
222 605
333 355 398 184
327 356 306 377
76
114.5 110.4 121.6 114.0
$0,873
7173
Digitized for FRASER http://fraser.stlouisfed.org/ Federal Reserve Bank of St. Louis
MONTHLY BUSINESS STATISTICS —Continued 3
ITEM
GENERAL BUSINESS INDICATORS
INDUSTRIAL AND COMMERCIAL FAILURES (Dun & Bradstreet, Inc.): Failures, total number. Commercial service do... Construction do... Manufacturing and mining do... Retail trade do... Wholesale trade do...
Liabilities (current), total thous. $. Commercial service do... Construction. .do... Manufacturing and mining. do... Retail trade do... Wholesale trade do...
Failure annual rate (seas. adj.)..No. per 10,000 concerns.
CONSTRUCTION AND REAL ESTATE
NEW CONSTRUCTION PUT IN PLACE (UNADJ.), TOTAL mil. $. Private, total do... Residential (nonfarm) do... New housing units do...
Nonresidential buildings, total 1/ do... Industrial .do... Commercial do...
Public, total. do... NEW CONSTRUCTION PUT IN PLACE (SEASONALLY ADJUSTED AT ANNUAL
RATES), TOTAL bil. $. Private, total. do... Residential (nonfarm) do... Nonresidential buildings, total 1/ .do... Industrial do... Commercial do...
Public, total do... CONSTRUCTION COST INDEXES: DEPARTMENT OF COMMERCE COMPOSITE 1957-59=100.,
FINANCE Bank debits to demand deposit accounts, except interbank
and U.S. Govt, accounts, annual rates, seas, adj.: Total (233 SMSA's) bil. $..
New York SMSA do... Total 232 SMSA's (except N.Y.) do..., 6 other leading SMSA's...... do..., 226 other SMSA's do...,
LIFE INSURANCE: Life Insurance Agency Management Association: Insurance written (new paid-for insurance): Value, estimated total .mil. $., Ordinary (incl. mass-marketed ord.) do..., Group do... Industrial do...,
Turnover of demand deposits except interbank and U.S. Govt., annual rates, seasonally adjusted:
Total (233 SMSA's) ratio of debits to deposits., New York SMSA's.. do...,
Total 232 SMSA's (except N.Y.) do..., 6 other leading SMSA's do..., 226 other SMSA's do...,
FOREIGN TRADE
EXPORTS (MDSE.), INCL. REEXPORTS, TOTAL mil. $. Excl. Department of Defense shipments do... Seasonally adjusted do...
GENERAL IMPORTS, TOTAL do...
Seasonally adjusted do...
TRANSPORTATION AND COMMUNICATION
HOTEIS: Average sale per occupied room dollars. Rooms occupied % of total. Restaurant sales index same mo. 1951=100.
CHEMICAIS AND ALLIED PRODUCTS
ORGANIC CHEMICAIS, PRODUCTION: Acetic anhydride mil. lb. Acety^.salicylic acid (aspirin) do... Creosote oil mil. gal. DDT. .mil. lb. Ethyl acetate (85$) do. Formaldehyde (37$ HCHO) d o . . . Glycerin, refined, a l l grades:
Production , . . . d o . . . Stocks, end of month d o . . .
Methanol, synthetic mil. gal . Phthalic anhydride mil. lb .
1968
Sept.
705 68
112 126 320 79
58,651 5,857
15,703 15,951 13,721 7,419 40.3
8,082 5,364 2,780 2,139 1,716
508 793
2,718
85.3 57.4 29.4 18.6 5.5 8.5
27.8
133
8,369.6 3,857.8 4,511.8 1,840.2 2,671.6
11,126 8,138 2,457
531
63.7 138.5 43.6 60.9 36.5
2,990.2 2,947.0 3,211.1
2,879.6 2,950.6
11.85 63
122
142. 2, 9.
10, U.
332,
28.7 28.4 47.5 59.1
Oct.
768 92
151 111 347
67 65,384 6,631
18,001 13,512 17,594 9,646 37.5
7,891 5,406 2,678 2,130 1,808
538 844
2,485
87.8 59.3 29.8 19.7 6.1 8.9
28.5
135
8,602.1 3,953.7 4,648.4 1,904.9 2,743.5
13,546 9,831 3,162
553
r66.3 rl43.0 r45.5 r63.5 r38.1
2,780.5 2,732.0 2,631.1
2,935.5 2,736.0
12.31 72
118
137.1 3.1
10.5
364.6
27.0
28.1 50.5 66.2
r/Revised.
7173
.l/Except farm and public u t i l i t i e s .
1969
July
113 131 113 283 49
112,727 8,047
19,457 63,474 17,189 4,560 34.9
8,180 5,776 2,906 2,267 1,945
562 907
2,404
91.6 62.5 29 22 6
10 29
rl43
9,242.8 3,908.6 5,334.2 2,244.4 3,089.8
12,104 9,053 2,560
491
67.6 136.1 49.4 71.8 40.3
3,045.6 2,997.9 3,171.5
3,153.9 3,066.3
11.59 57
119
140.9 3.2
10.2 10.3 12.7
320.4
28.9 28.8 51.2 65.8
Aug.
702 86
126 108 303
79 62,930 4,347
10,293 19,252 17,851 11,087
36.0
r8,651 r6,013 r3,051
2,186 r2,013
r558 r936
r2,638
r91.0 r64.0 r30.9 r22.7
6.4 10.3
r27.0
143
9,430.1 4,148.4 5,281.7 2,242.8 3,038.9
13,230 8,791 3,931
508
70.1 146.5 49.7 72.9 40.3
3,227.3 3,165.4 3,385.1
2,909.6 3,180.2
13.09 60
118
144.4 3.0 9.0
10.2 11.4
r348.7
26.5 32.4 51.7 58.6
Sept.
726 90
124 110 338
64 73,698 9,416
10A73 18,412 24,016 11,681
39.9
r8,719 r6,100 r2,944 r2,123 r2,200
r621 rl ,033 r2,6l9
r93.0 r65.5 r31.0 r23.8 r6.7
r l l . l r27.4
143
r9,737.3 4,311.5 5,425.8 2,249.6
r3,176.3
12,464 8,905 3,026
533
72.3 153.5 50.9 73.0 41.9
3,136. 3,112. 3,325.
3,131. 3,055-
13.04 60
122
129.5 1.7 9.3
""iVl 357.8
30.3 31.6 54.1 58.2
Digitized for FRASER http://fraser.stlouisfed.org/ Federal Reserve Bank of St. Louis
4 MONTHLY BUSINESS STATISTICS—Continued
ITEM
METAIS AND MANUFACTURES
PIG IRON: Production (excl. ferroalloys)....... thous. sh. tons.
STEEL (RAW) : Production..................................do.. Index............. daily average 1957-59=100.
Aluminum shipments: Ingot and mill products (net).......................mil. lb. Mill products, total .do... Plate and sheet (excluding foil) do...
Oil burners: Shipments. .'.thous. Stocks, end of month. do..
Ranges, gas, domestic cooking, shipments..-.'.-.«.......... .do.. Top burner sections (4~burner equiv.), shipments.........do.. Stoves, domestic heating, shipments, total...............do.. Gas .do..
Warm-air furnaces, shipments, total .do.. Gas....................................................do..
Furnaces and ovens (indust.), donu new orders, net.....mil. $ Electric processing. do.. Fuel-fired (except for hot rolling steel) .do..
TEXTILE PRODUCTS
COTTON (exclusive of linters): 1/ Consumption....................................thous. bales. Manufactures: Spindle activity (cotton system spindles): Active spindles, last working day, total..,....millions. Consuming 100 percent cotton. .do...
Spindle hours operated, all fibers, total......billions. Average per working day do...
Consuming 100 percent cotton .do... Women's, misses', juniors' outerwear, cuttings: Coats .thous. units. Dresses ..........do... Suits do... Blouses, waists, and shirts thous. doz. Skirts do...
1968
Sept.
..
. .
5,481 8,086 101.3
779.9 564.0 255.4
73*7 28 .4
211.2 19.5
174.9 125 .1
183 .1 137.2
8.2 . 8
4 .3
5,916 9,006 109.2
839.8 625.7 284.8
82.6 27.3
217.0 18.4
197.7 144.4
230.4 177.3
1 3 . 1 1.0 9 .0
643
Oct.
813
20.2 13.3 9.9
• 495 6.5
2 ,051 19,892
532 1,148
645
20 .2 13.3 12.5
| .502 8.3
2,222 22,984
622 1,389
773
1969
July
7,836 11,365 137.8
873.6 626.9 302.4
40.3 30.5
I69.O 15.6
128.5 95.7
154.1 124.7
8.4 1.2 4.7
649
19.9 12.9 10.2 .406 6.4
1,707 19,089
541 1,160
830
Aug.
7,699 11,421 138.4
r849. r606. r297.
63. 28.
221.2 15.8
176.4 133.5
rl72.3 136.3
6.4 .3
4.0
629
19.8 12.8 9.6 480 6.2
1,727 r20,068
496 r1,074
r738
Sept.
7,739 11,523 144.3
930. 641. 300,
66 < 23.
230. 18.
176. 136,
202.7 153.9
5.9 1.6 2.2
r634
r l9 .7 12.7 9.6
r.480 r6 .1
1,750 20,615
519 1,095
698
Oct.
8,292 12,324 U9-4
6.7 .6
3.1
802
19.7 12.7 12.4 • 495 7.9
r/Revised. 1/Data Oct. 1968 and July and Oct. I969 cover 5 weeksj other months, 4 weeks. USCOMM—DC—7173
UNITED STATES GOVERNMENT PRINTING OFFICE
DIVISION OF PUBLIC DOCUMENTS
WASHINGTON, D.C. 20402
POSTAGE AND FEES PAID
U.S. GOVERNMENT PRINTING OFFICE
OFFICIAL BUSINESS
First-Class Mail
WEEKLY SUPPLEMENT
SURVEY OF CURRENT BUSINESS Digitized for FRASER http://fraser.stlouisfed.org/ Federal Reserve Bank of St. Louis