december, q4, h2 & full year...
TRANSCRIPT
December, Q4, H2 & Full Year 2019
- Slowest passenger traffic growth in 5 years reported during 2019, mainly due to stronger
deceleration in the non-EU market, declining domestic traffic as well as airline bankruptcies &
capacity restraint in the EU market. - A record 2.43 billion passengers welcomed by Europe’s
airports in 2019 & Passenger traffic still up by +32.3% since 2014.
- EU airports added +57.8 million passengers in 2019, accounting for 76% of the growth.
- The Majors (Top 5 European airports: +1.8%) and smaller regionals (+0.3%)
underperformed the European average.
- Freight traffic at -1.9% in 2019, dragged down by EU airports.
Brussels, 13 February 2020: European airport trade association, ACI EUROPE today
releases its traffic report for December, Q4, H2 and Full Year 2019. This is the only air
traffic report that includes all types of airline passenger flights to, from and within Europe
(full service, low cost, regional, charter and others).
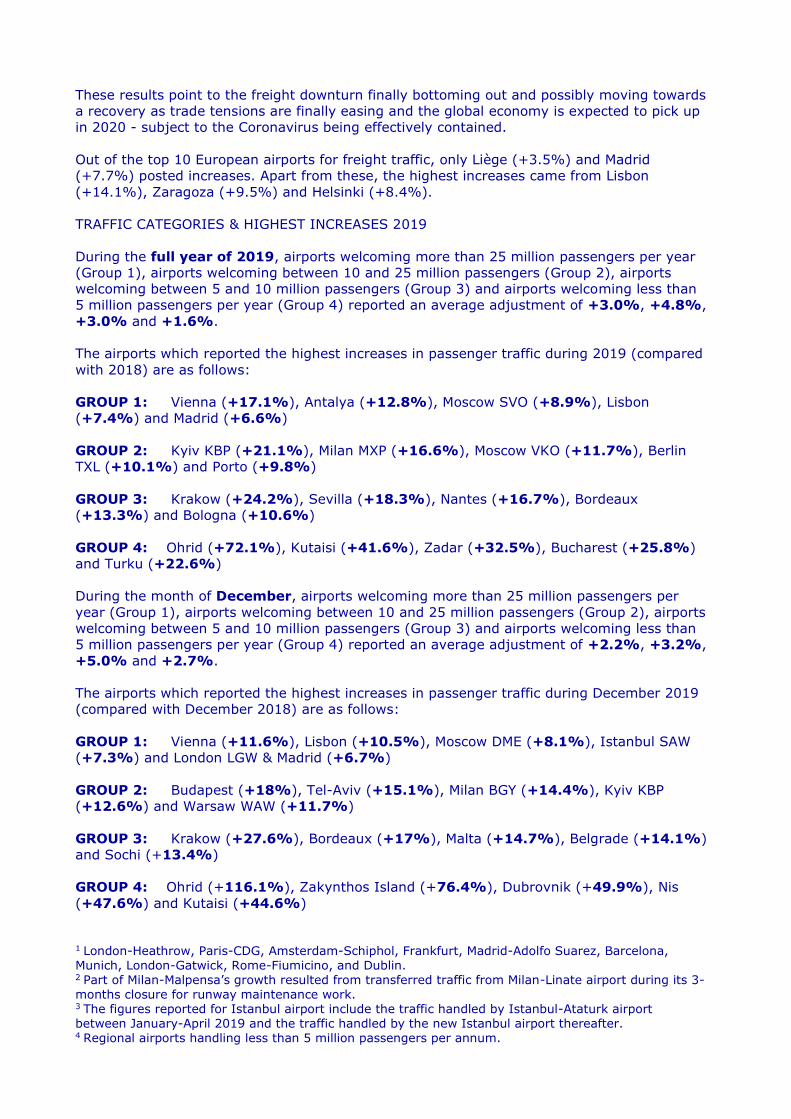
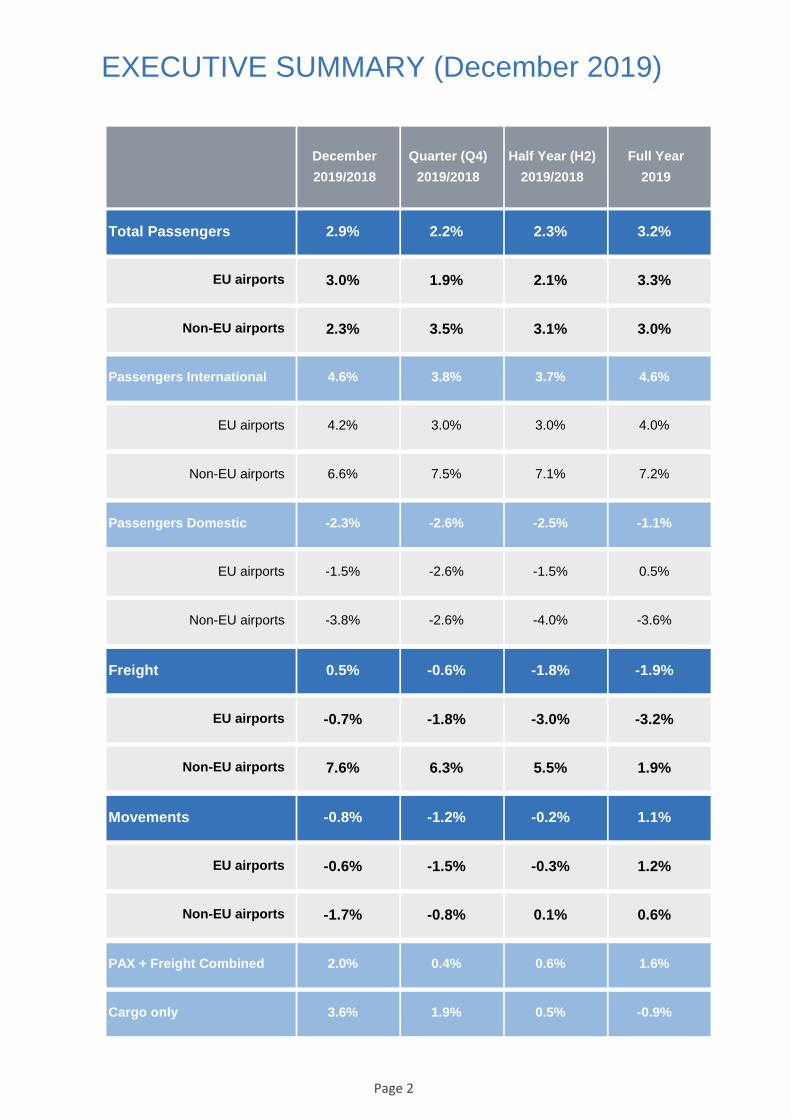
Passenger traffic across the European airport network (46 countries) grew by +3.2% in
2019. While this is just over half the growth rate registered in 2018 (+6.1%) and the
weakest performance in 5 years, it still resulted in Europe’s airports welcoming a record
2.43 billion passengers in 2019.
The passenger growth slowdown in 2019 was more significant at non-EU airports and largely
driven by a decline in domestic traffic (-1.1%), as International traffic kept growing
dynamically (+4.6%). It also reflected airline consolidation and limited airline capacity
expansion, as aircraft movements only increased by +1.1% during the year and even
became negative in the last Q4 (-1.2%). Meanwhile, freight traffic dropped by -1.9% in
2019, the worst performance since 2012.
Olivier Jankovec, Director General of ACI EUROPE said : “Over the past 5 years,
Europe’s airports have increased their passenger traffic by more than +32% - meaning they
have actually accommodated an extra 595 million passengers since 2014. But 2019 has been
a pivotal year. Volumes were still up, but the deceleration has been notable on the back of
both supply and demand pressures.”
Looking at the months ahead, Jankovec noted that many airports have planned for continued
lower growth in passenger traffic in the face of uncertain trading conditions. He commented:
“Some of the supply side pressures might start easing, especially if the 737 MAX is finally
approved to fly again and if the recent decrease in oil prices is not reversed. However, there
are for now few if any signals that airlines may be considering more capacity expansion – and
further airline consolidation remains a very realistic prospect.
He added: “The immediate big question mark is what happens with the coronavirus outbreak.
Europe’s airports have been coordinating closely with and assisting public health authorities
in their containment efforts.
The traffic impact so far has been marginal and mostly limited to those airports with direct air
services to China. We estimate that in February, the top10 EU/UK airports1 will collectively
lose 475.000 passengers, which should amount to just 1.2% of their total traffic for the
month. But as wider economic consequences start kicking-in in China and potentially beyond,
the impact on air traffic could become more widespread and significant for Europe’ airports.”
EU AIRPORTS GROWTH HIT BY AIRLINE BANKRUPTCIES & CAPACITY RESTRAINTS
EU airports saw passenger traffic increasing by +3.3% in 2019 (compared with +5.4% in
2018). This resulted in 57.8 million additional passengers over the previous year - the
equivalent of the yearly traffic handled by Madrid-Barajas airport. The EU market accounted
for 76% of the total passenger traffic growth in Europe in 2019.
European airports report slower passenger
growth & declining freight in 2019
The pace of growth halved as the year progressed (from +4.8% in Q1 to +1.9% in Q4) –
although it somewhat rebounded in December (+3%). This mainly reflected the exposure of
EU airports to airline bankruptcies (Thomas Cook, Aigle Azur, XL Airways and Adria Airways)
as well as EU airlines generally limiting capacity growth and network expansion on the back
of less favourable economic conditions and Brexit uncertainties.
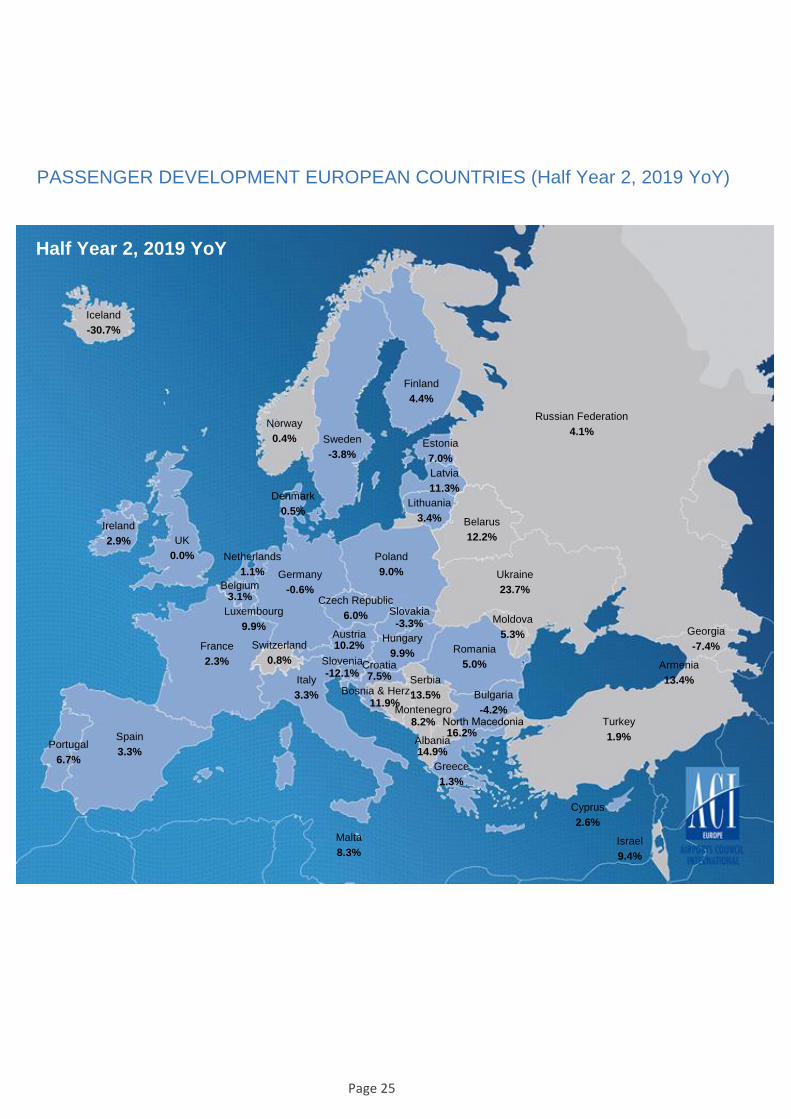
Airports in Austria, Estonia, Latvia, Poland, Hungary, Croatia, Romania, Malta, Luxembourg
and Portugal grew at more than twice the EU average. Airports in the UK, Germany, the
Netherlands, Belgium, Denmark and Greece underperformed while those in Sweden, Bulgaria,
Slovakia and Slovenia registered declines in passenger traffic.
Amongst capital & larger EU airports, the highest growth in passenger traffic came from
Vienna (+17.1%), Milan-Malpensa (+16.6%2), Riga (+10.5%), Luxembourg (+9.5%),
Budapest (+8.8%), Tallinn (+8.6%), London-Luton (+8.1%), Lisbon (+7.4%), Madrid
(+6.6%), Bucharest (+6.4%) and Warsaw (+6.2%).
NON-EU MARKET SHARPLY DECELERATING
Passenger traffic growth at non-EU airports stood at +3% in 2019 – a significant
deceleration compared to the previous year (+8.3% in 2018). This resulted in non-EU
airports only adding an additional 18.3 million passengers in 2019.
While airline bankruptcies (WOW) also affected the non-EU market, macro-economic
conditions generally played a bigger role in shaping their fortunes – resulting in a significant
impact on domestic passenger traffic (-3.6%). These factors explain the considerable
variation in passenger traffic performance within the non-EU markets – from the impressive
growth posted by airports in Ukraine (+22.3%) to the severe slump in Iceland (-26.1%).
Amongst the largest markets, Russia grew above the non-EU average (+5.8%), while Turkish
airports grew only marginally (+0.4%).
The best passenger traffic performance at capital & larger non-EU airports came from Kyiv-
Boryspil (+21.1%), Tirana (+13.3%), Antalya (+12.8%), Minsk (+12.5%), Yerevan
(+12.3%), Moscow-Vnukovo (+11.7%), Pristina (+9.6%), Skopje & Sarajevo (+9.3%) and
Belgrade (+9.2%).
MAJORS & SMALLER REGIONAL AIRPORTS UNDERPERFORMING
Passenger traffic at the Majors (top 5 European airports) increased by +1.8% in 2019,
down from +4.8% in the previous year.
Continued physical capacity constraints and airlines limiting expansion were the main factors
containing their performance. Collectively, the Majors added 6.5 million passengers, with
60% of that incremental growth coming from Paris-CDG alone (+5.5% - 2ND position with
76.2 million passengers), followed by Frankfurt (+1.5% - 4th position with 70.5 million
passengers), London-Heathrow (+1% - 1st position with 80.8 million passengers),
Amsterdam-Schiphol (+0.9% - 3rd position with 71.7 million passengers) and Istanbul
(+0.2% - 5th position with 68.5 million passengers3).
51% of smaller regional airports4 saw their traffic increasing, compared to 77% for the
rest of the industry – reflecting once again the fragility of their markets.
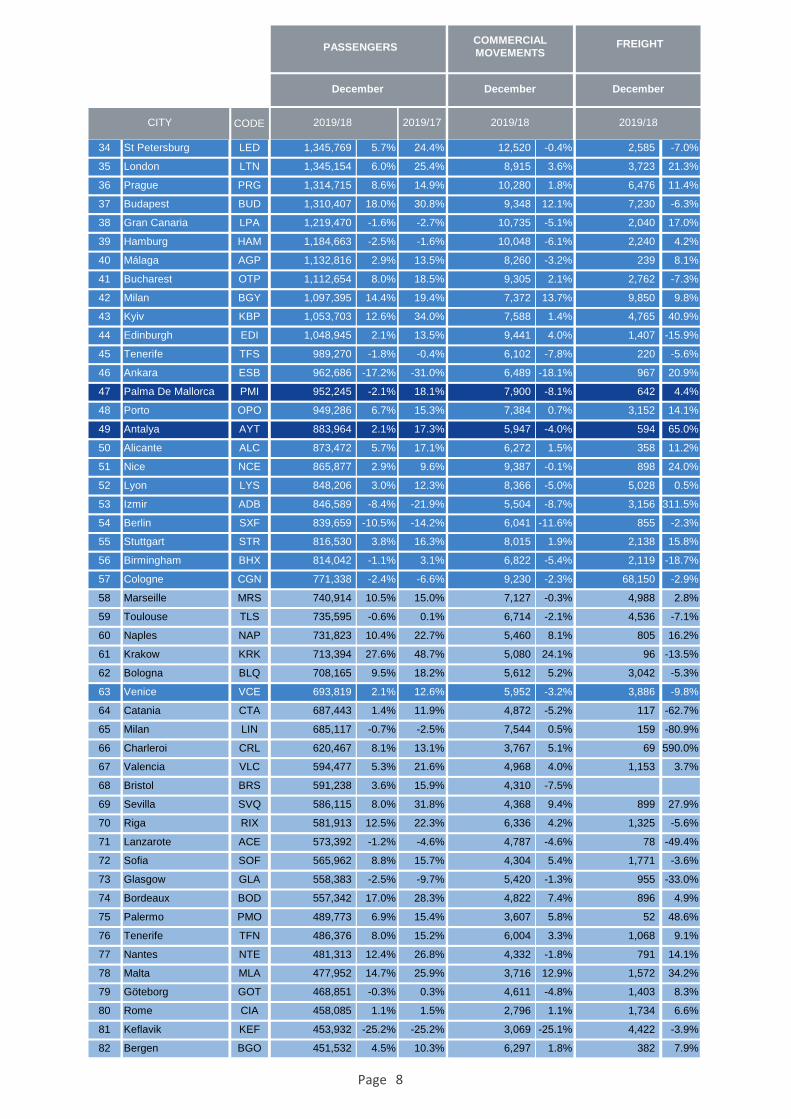
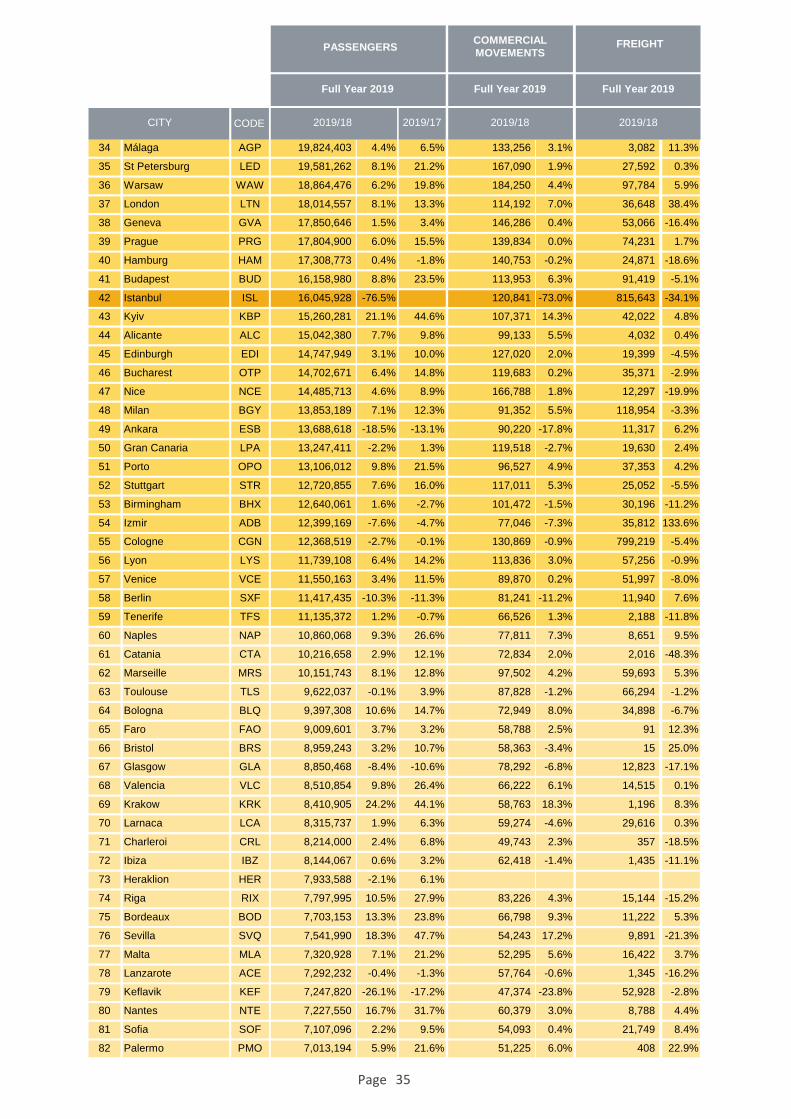
However, many larger regional airports posted impressive gains in passenger traffic,
including Krakow (+24.2%), Seville (+18.3%), Nantes (+16.7%), Dubrovnik (+14.1%),
Bordeaux (+13.3%), Brest (+11.8%), Bologna (+10.6%), Bari (+10.2%), Porto (+9.8%),
Valencia (+9.8%), Naples (+9.3%) and Marseille (+8.1%). These results account for the
success of their route development strategies and the continued expansion of direct
international air connectivity - including new long-haul services.
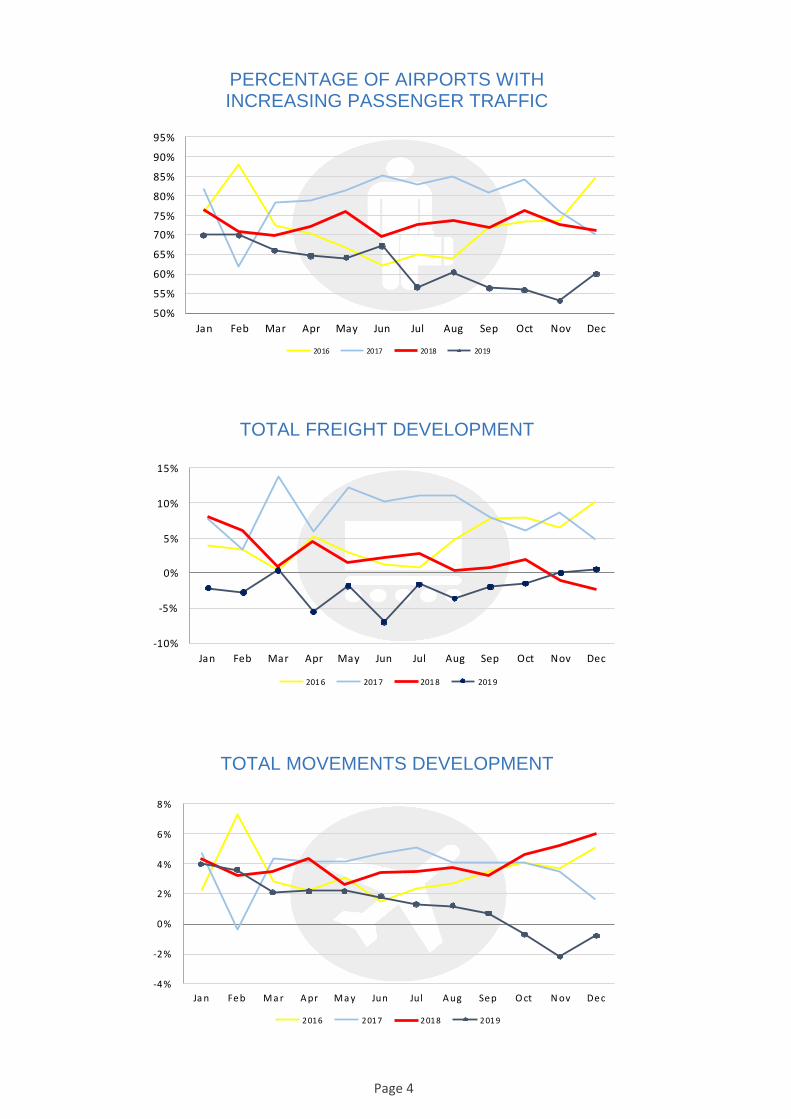
FREIGHT TRAFFIC DRAGGED DOWN BY THE EU MARKET – RECOVERY IN SIGHT?
Freight traffic remained negative all along 2019 with the exception of December (+0.5%),
the first positive monthly since October 2018. EU airports dragged the performance down in
2019 at -3.2% (and still negative in December at -0.7%) while non-EU airports remained
mostly positive at +1.9% (increasing to +7.6% in December).
These results point to the freight downturn finally bottoming out and possibly moving towards
a recovery as trade tensions are finally easing and the global economy is expected to pick up
in 2020 - subject to the Coronavirus being effectively contained.
Out of the top 10 European airports for freight traffic, only Liège (+3.5%) and Madrid
(+7.7%) posted increases. Apart from these, the highest increases came from Lisbon
(+14.1%), Zaragoza (+9.5%) and Helsinki (+8.4%).
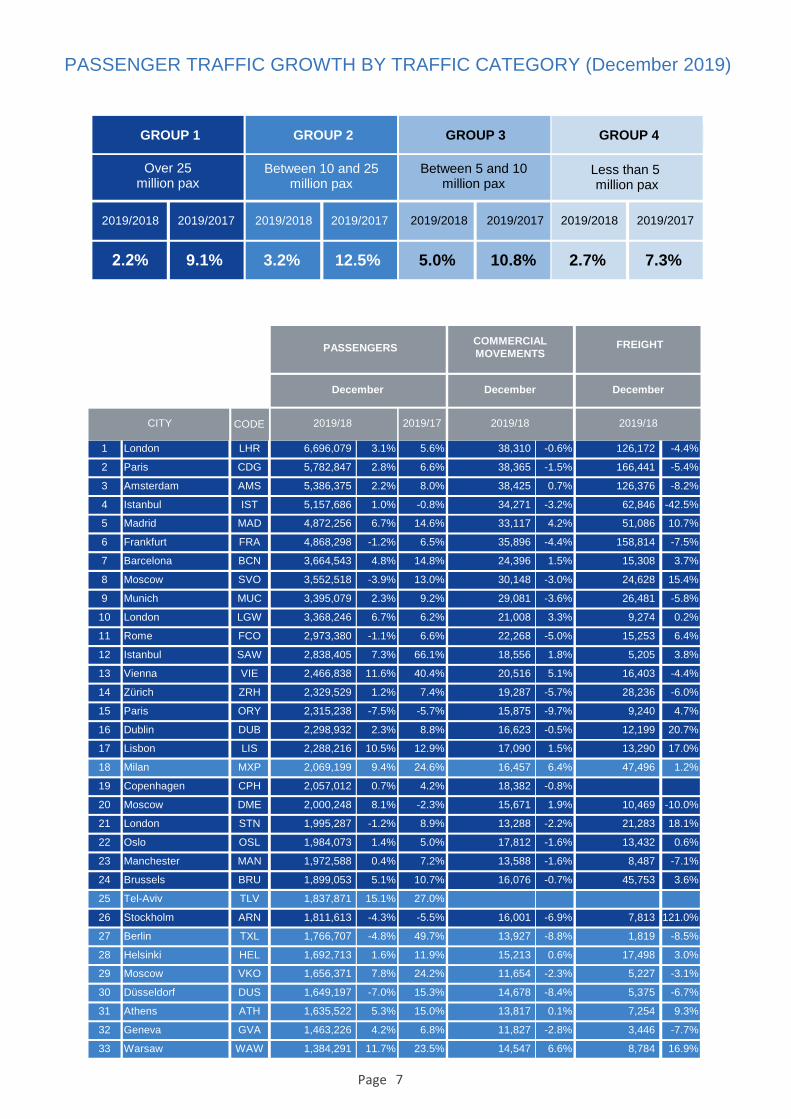
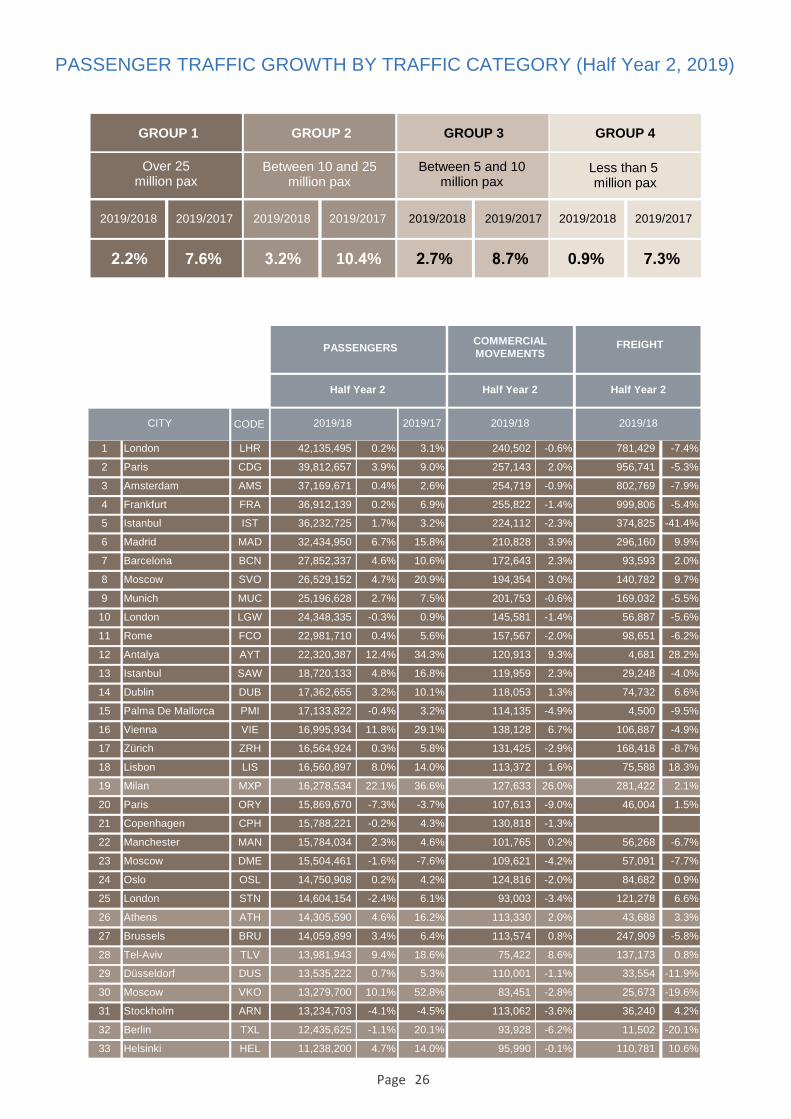
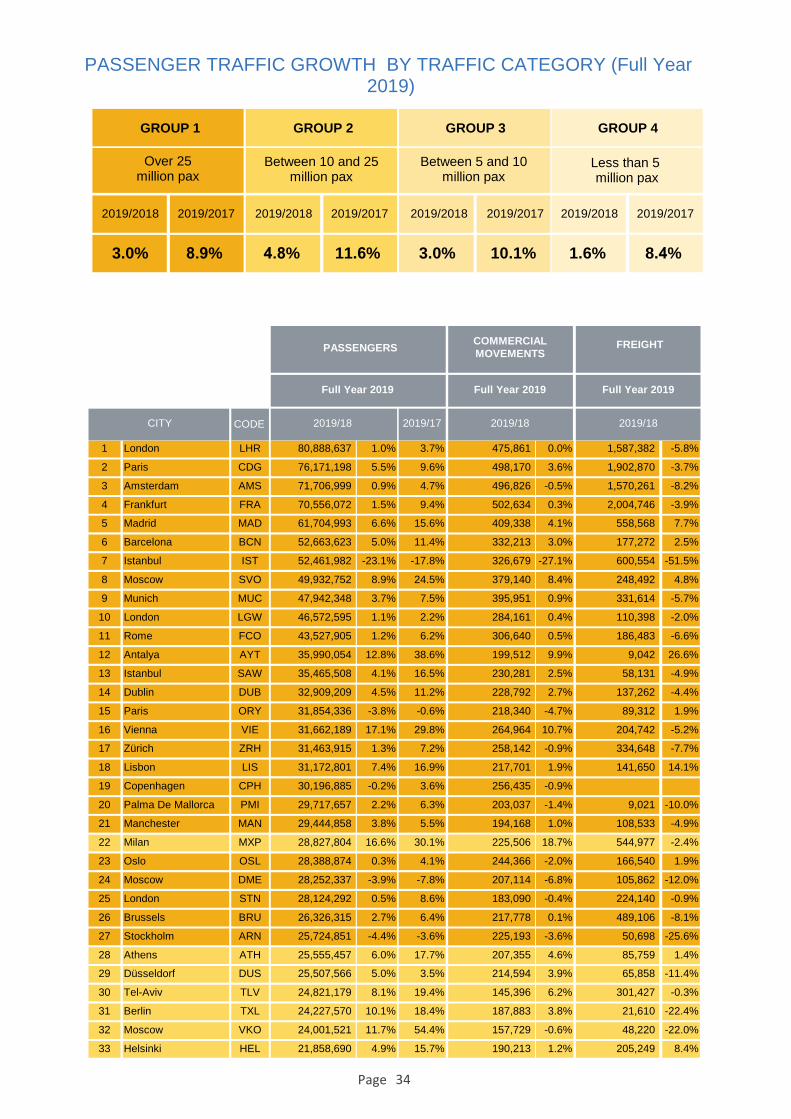
TRAFFIC CATEGORIES & HIGHEST INCREASES 2019
During the full year of 2019, airports welcoming more than 25 million passengers per year
(Group 1), airports welcoming between 10 and 25 million passengers (Group 2), airports
welcoming between 5 and 10 million passengers (Group 3) and airports welcoming less than
5 million passengers per year (Group 4) reported an average adjustment of +3.0%, +4.8%,
+3.0% and +1.6%.
The airports which reported the highest increases in passenger traffic during 2019 (compared
with 2018) are as follows:
GROUP 1: Vienna (+17.1%), Antalya (+12.8%), Moscow SVO (+8.9%), Lisbon
(+7.4%) and Madrid (+6.6%)
GROUP 2: Kyiv KBP (+21.1%), Milan MXP (+16.6%), Moscow VKO (+11.7%), Berlin
TXL (+10.1%) and Porto (+9.8%)
GROUP 3: Krakow (+24.2%), Sevilla (+18.3%), Nantes (+16.7%), Bordeaux
(+13.3%) and Bologna (+10.6%)
GROUP 4: Ohrid (+72.1%), Kutaisi (+41.6%), Zadar (+32.5%), Bucharest (+25.8%)
and Turku (+22.6%)
During the month of December, airports welcoming more than 25 million passengers per
year (Group 1), airports welcoming between 10 and 25 million passengers (Group 2), airports
welcoming between 5 and 10 million passengers (Group 3) and airports welcoming less than
5 million passengers per year (Group 4) reported an average adjustment of +2.2%, +3.2%,
+5.0% and +2.7%.
The airports which reported the highest increases in passenger traffic during December 2019
(compared with December 2018) are as follows:
GROUP 1: Vienna (+11.6%), Lisbon (+10.5%), Moscow DME (+8.1%), Istanbul SAW
(+7.3%) and London LGW & Madrid (+6.7%)
GROUP 2: Budapest (+18%), Tel-Aviv (+15.1%), Milan BGY (+14.4%), Kyiv KBP
(+12.6%) and Warsaw WAW (+11.7%)
GROUP 3: Krakow (+27.6%), Bordeaux (+17%), Malta (+14.7%), Belgrade (+14.1%)
and Sochi (+13.4%)
GROUP 4: Ohrid (+116.1%), Zakynthos Island (+76.4%), Dubrovnik (+49.9%), Nis
(+47.6%) and Kutaisi (+44.6%)
1 London-Heathrow, Paris-CDG, Amsterdam-Schiphol, Frankfurt, Madrid-Adolfo Suarez, Barcelona, Munich, London-Gatwick, Rome-Fiumicino, and Dublin. 2 Part of Milan-Malpensa’s growth resulted from transferred traffic from Milan-Linate airport during its 3-months closure for runway maintenance work. 3 The figures reported for Istanbul airport include the traffic handled by Istanbul-Ataturk airport between January-April 2019 and the traffic handled by the new Istanbul airport thereafter. 4 Regional airports handling less than 5 million passengers per annum.
EXECUTIVE SUMMARY (December 2019)
Total Passengers
Non-EU airports
EU airports
Passengers International
Non-EU airports
EU airports
Passengers Domestic
Non-EU airports
EU airports
Freight
Non-EU airports
EU airports
Movements
Non-EU airports
EU airports
PAX + Freight Combined
Cargo only
2.9% 2.2% 2.3% 3.2%
3.0% 1.9% 2.1% 3.3%
2.3% 3.5% 3.1% 3.0%
4.6% 3.8% 3.7% 4.6%
4.2% 3.0% 3.0% 4.0%
6.6% 7.5% 7.1% 7.2%
-2.3% -2.6% -2.5% -1.1%
-1.5% -2.6% -1.5% 0.5%
-3.8% -2.6% -4.0% -3.6%
0.5% -0.6% -1.8% -1.9%
-0.7% -1.8% -3.0% -3.2%
7.6% 6.3% 5.5% 1.9%
-0.8% -1.2% -0.2% 1.1%
-0.6% -1.5% -0.3% 1.2%
-1.7% -0.8% 0.1% 0.6%
2.0% 0.4% 0.6% 1.6%
3.6% 1.9% 0.5% -0.9%
December
2019/2018 2019/2018 2019/2018 2019
Quarter (Q4) Half Year (H2) Full Year
Page 2
0 %
2 %
4 %
6 %
8 %
1 0 %
1 2 %
1 4 %
1 6 %
Ja n F e b M a r A p r M a y Ju n Ju l A u g S e p O ct N o v D e c
2 0 16 2 0 17 2 0 18 2 0 19
-4%
-2%
0%
2%
4%
6%
8%
Ja n Feb Ma r A pr Ma y Jun Jul A ug Sep O ct N ov Dec
Tot al Passen ge rs Inte rn atio nal Do mest ic
0%
1%
2%
3%
4%
5%
6%
7%
Jan Feb Mar Apr May Jun Jul Aug Sep Oct Nov Dec
Total Passenge rs EU Non-EU
TOTAL PASSENGER DEVELOPMENT(Year-on-year changes)
INTERNATIONAL & DOMESTIC PASSENGERS
EU/NON-EU AIRPORTS PASSENGER TRAFFIC
Page 3
50%
55%
60%
65%
70%
75%
80%
85%
90%
95%
Jan Feb Mar Apr May Jun Jul Aug Sep Oct Nov Dec
2016 2017 2018 2019
-10%
-5%
0%
5%
10%
15%
Jan Feb Mar Apr May Jun Jul Aug Sep Oct Nov Dec
201 6 201 7 201 8 201 9
-4%
-2%
0%
2%
4%
6%
8%
Ja n Feb Ma r A pr Ma y Jun Jul A ug Sep O ct N ov Dec
2016 2017 2018 2019
PERCENTAGE OF AIRPORTS WITHINCREASING PASSENGER TRAFFIC
TOTAL FREIGHT DEVELOPMENT
TOTAL MOVEMENTS DEVELOPMENT
Page 4
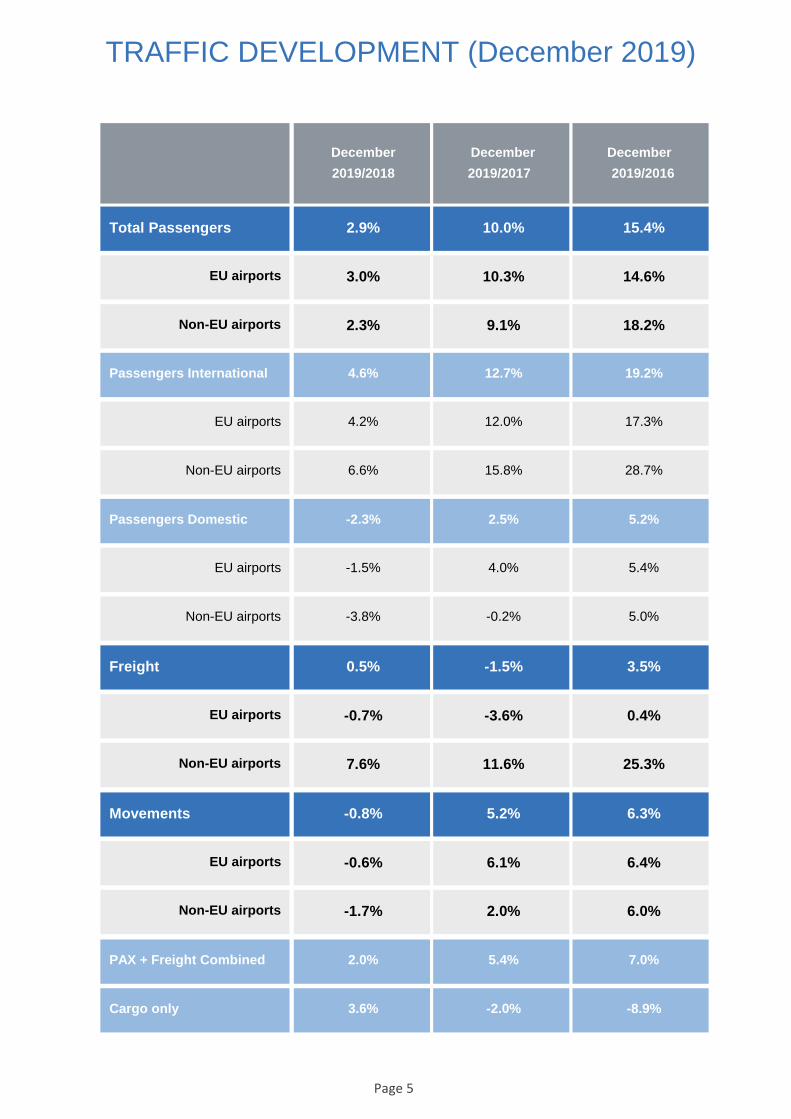
TRAFFIC DEVELOPMENT (December 2019)
Total Passengers
Non-EU airports
EU airports
Passengers International
Non-EU airports
EU airports
Passengers Domestic
Non-EU airports
EU airports
Freight
Non-EU airports
EU airports
Movements
Non-EU airports
EU airports
PAX + Freight Combined
Cargo only
2.9% 10.0% 15.4%
3.0% 10.3% 14.6%
2.3% 9.1% 18.2%
4.6% 12.7% 19.2%
4.2% 12.0% 17.3%
6.6% 15.8% 28.7%
-2.3% 2.5% 5.2%
-1.5% 4.0% 5.4%
-3.8% -0.2% 5.0%
0.5% -1.5% 3.5%
-0.7% -3.6% 0.4%
7.6% 11.6% 25.3%
-0.8% 5.2% 6.3%
-0.6% 6.1% 6.4%
-1.7% 2.0% 6.0%
2.0% 5.4% 7.0%
3.6% -2.0% -8.9%
December
2019/2018 2019/2017 2019/2016
December December
Page 5

Iceland
-25.2%
Finland
0.3%
Sweden
-3.1%
Norway
2.1%
Ireland
1.9% UK
2.4% Netherlands
2.9%
Belgium5.8%
France
1.6%
Portugal
8.3%
Spain
3.6%
Italy
4.3%
Switzerland
2.3%
Luxembourg
14.6%
Germany
-1.9%
Poland
14.5%
Czech Republic
8.2%
Austria9.9%
Slovenia-20.7%
Croatia8.9%
Bosnia & Herz.8.3%
Albania19.5%
Malta
14.7%
Greece
2.7%
North Macedonia15.3%
Montenegro12.1%
Serbia
16.5%
Hungary
18.0%
Slovakia2.9%
Romania
8.7%
Bulgaria
10.6%
Cyprus
11.6%
Turkey
-1%
Israel
15.1%
Georgia
-1.8%
Ukraine
15.2%
Russian Federation
2.6%
Moldova
5.6%
Estonia
5.9%
Latvia
12.5%
Lithuania
6.7%
Denmark
1.3%
PASSENGER DEVELOPMENT EUROPEAN COUNTRIES (December 2019 YoY)
December 2019 YoY
Belarus
18.1%
Armenia
6.1%
Page 6
GROUP 1
2019/2018
Over 25million pax
2.2%
2019/2017
9.1%
GROUP 2
2019/2018
Between 10 and 25million pax
3.2%
2019/2017
12.5%
GROUP 3
2019/2018
Between 5 and 10million pax
5.0%
2019/2017
10.8%
GROUP 4
2019/2018
Less than 5 million pax
2.7%
2019/2017
7.3%
PASSENGER TRAFFIC GROWTH BY TRAFFIC CATEGORY (December 2019)
December December December
2019/18 2019/18 2019/182019/17
PASSENGERSCOMMERCIAL
MOVEMENTSFREIGHT
CITY CODE
1 London LHR 6,696,079 3.1% 5.6% 38,310 -0.6% 126,172 -4.4%
2 Paris CDG 5,782,847 2.8% 6.6% 38,365 -1.5% 166,441 -5.4%
3 Amsterdam AMS 5,386,375 2.2% 8.0% 38,425 0.7% 126,376 -8.2%
4 Istanbul IST 5,157,686 1.0% -0.8% 34,271 -3.2% 62,846 -42.5%
5 Madrid MAD 4,872,256 6.7% 14.6% 33,117 4.2% 51,086 10.7%
6 Frankfurt FRA 4,868,298 -1.2% 6.5% 35,896 -4.4% 158,814 -7.5%
7 Barcelona BCN 3,664,543 4.8% 14.8% 24,396 1.5% 15,308 3.7%
8 Moscow SVO 3,552,518 -3.9% 13.0% 30,148 -3.0% 24,628 15.4%
9 Munich MUC 3,395,079 2.3% 9.2% 29,081 -3.6% 26,481 -5.8%
10 London LGW 3,368,246 6.7% 6.2% 21,008 3.3% 9,274 0.2%
11 Rome FCO 2,973,380 -1.1% 6.6% 22,268 -5.0% 15,253 6.4%
12 Istanbul SAW 2,838,405 7.3% 66.1% 18,556 1.8% 5,205 3.8%
13 Vienna VIE 2,466,838 11.6% 40.4% 20,516 5.1% 16,403 -4.4%
14 Zürich ZRH 2,329,529 1.2% 7.4% 19,287 -5.7% 28,236 -6.0%
15 Paris ORY 2,315,238 -7.5% -5.7% 15,875 -9.7% 9,240 4.7%
16 Dublin DUB 2,298,932 2.3% 8.8% 16,623 -0.5% 12,199 20.7%
17 Lisbon LIS 2,288,216 10.5% 12.9% 17,090 1.5% 13,290 17.0%
18 Milan MXP 2,069,199 9.4% 24.6% 16,457 6.4% 47,496 1.2%
19 Copenhagen CPH 2,057,012 0.7% 4.2% 18,382 -0.8% 0 -
20 Moscow DME 2,000,248 8.1% -2.3% 15,671 1.9% 10,469 -10.0%
21 London STN 1,995,287 -1.2% 8.9% 13,288 -2.2% 21,283 18.1%
22 Oslo OSL 1,984,073 1.4% 5.0% 17,812 -1.6% 13,432 0.6%
23 Manchester MAN 1,972,588 0.4% 7.2% 13,588 -1.6% 8,487 -7.1%
24 Brussels BRU 1,899,053 5.1% 10.7% 16,076 -0.7% 45,753 3.6%
25 Tel-Aviv TLV 1,837,871 15.1% 27.0% 0 - 0 -
26 Stockholm ARN 1,811,613 -4.3% -5.5% 16,001 -6.9% 7,813 121.0%
27 Berlin TXL 1,766,707 -4.8% 49.7% 13,927 -8.8% 1,819 -8.5%
28 Helsinki HEL 1,692,713 1.6% 11.9% 15,213 0.6% 17,498 3.0%
29 Moscow VKO 1,656,371 7.8% 24.2% 11,654 -2.3% 5,227 -3.1%
30 Düsseldorf DUS 1,649,197 -7.0% 15.3% 14,678 -8.4% 5,375 -6.7%
31 Athens ATH 1,635,522 5.3% 15.0% 13,817 0.1% 7,254 9.3%
32 Geneva GVA 1,463,226 4.2% 6.8% 11,827 -2.8% 3,446 -7.7%
33 Warsaw WAW 1,384,291 11.7% 23.5% 14,547 6.6% 8,784 16.9%
Page 7
December December December
2019/18 2019/18 2019/182019/17
PASSENGERSCOMMERCIAL
MOVEMENTSFREIGHT
CITY CODE
34 St Petersburg LED 1,345,769 5.7% 24.4% 12,520 -0.4% 2,585 -7.0%
35 London LTN 1,345,154 6.0% 25.4% 8,915 3.6% 3,723 21.3%
36 Prague PRG 1,314,715 8.6% 14.9% 10,280 1.8% 6,476 11.4%
37 Budapest BUD 1,310,407 18.0% 30.8% 9,348 12.1% 7,230 -6.3%
38 Gran Canaria LPA 1,219,470 -1.6% -2.7% 10,735 -5.1% 2,040 17.0%
39 Hamburg HAM 1,184,663 -2.5% -1.6% 10,048 -6.1% 2,240 4.2%
40 Málaga AGP 1,132,816 2.9% 13.5% 8,260 -3.2% 239 8.1%
41 Bucharest OTP 1,112,654 8.0% 18.5% 9,305 2.1% 2,762 -7.3%
42 Milan BGY 1,097,395 14.4% 19.4% 7,372 13.7% 9,850 9.8%
43 Kyiv KBP 1,053,703 12.6% 34.0% 7,588 1.4% 4,765 40.9%
44 Edinburgh EDI 1,048,945 2.1% 13.5% 9,441 4.0% 1,407 -15.9%
45 Tenerife TFS 989,270 -1.8% -0.4% 6,102 -7.8% 220 -5.6%
46 Ankara ESB 962,686 -17.2% -31.0% 6,489 -18.1% 967 20.9%
47 Palma De Mallorca PMI 952,245 -2.1% 18.1% 7,900 -8.1% 642 4.4%
48 Porto OPO 949,286 6.7% 15.3% 7,384 0.7% 3,152 14.1%
49 Antalya AYT 883,964 2.1% 17.3% 5,947 -4.0% 594 65.0%
50 Alicante ALC 873,472 5.7% 17.1% 6,272 1.5% 358 11.2%
51 Nice NCE 865,877 2.9% 9.6% 9,387 -0.1% 898 24.0%
52 Lyon LYS 848,206 3.0% 12.3% 8,366 -5.0% 5,028 0.5%
53 Izmir ADB 846,589 -8.4% -21.9% 5,504 -8.7% 3,156 311.5%
54 Berlin SXF 839,659 -10.5% -14.2% 6,041 -11.6% 855 -2.3%
55 Stuttgart STR 816,530 3.8% 16.3% 8,015 1.9% 2,138 15.8%
56 Birmingham BHX 814,042 -1.1% 3.1% 6,822 -5.4% 2,119 -18.7%
57 Cologne CGN 771,338 -2.4% -6.6% 9,230 -2.3% 68,150 -2.9%
58 Marseille MRS 740,914 10.5% 15.0% 7,127 -0.3% 4,988 2.8%
59 Toulouse TLS 735,595 -0.6% 0.1% 6,714 -2.1% 4,536 -7.1%
60 Naples NAP 731,823 10.4% 22.7% 5,460 8.1% 805 16.2%
61 Krakow KRK 713,394 27.6% 48.7% 5,080 24.1% 96 -13.5%
62 Bologna BLQ 708,165 9.5% 18.2% 5,612 5.2% 3,042 -5.3%
63 Venice VCE 693,819 2.1% 12.6% 5,952 -3.2% 3,886 -9.8%
64 Catania CTA 687,443 1.4% 11.9% 4,872 -5.2% 117 -62.7%
65 Milan LIN 685,117 -0.7% -2.5% 7,544 0.5% 159 -80.9%
66 Charleroi CRL 620,467 8.1% 13.1% 3,767 5.1% 69 590.0%
67 Valencia VLC 594,477 5.3% 21.6% 4,968 4.0% 1,153 3.7%
68 Bristol BRS 591,238 3.6% 15.9% 4,310 -7.5% 0 -
69 Sevilla SVQ 586,115 8.0% 31.8% 4,368 9.4% 899 27.9%
70 Riga RIX 581,913 12.5% 22.3% 6,336 4.2% 1,325 -5.6%
71 Lanzarote ACE 573,392 -1.2% -4.6% 4,787 -4.6% 78 -49.4%
72 Sofia SOF 565,962 8.8% 15.7% 4,304 5.4% 1,771 -3.6%
73 Glasgow GLA 558,383 -2.5% -9.7% 5,420 -1.3% 955 -33.0%
74 Bordeaux BOD 557,342 17.0% 28.3% 4,822 7.4% 896 4.9%
75 Palermo PMO 489,773 6.9% 15.4% 3,607 5.8% 52 48.6%
76 Tenerife TFN 486,376 8.0% 15.2% 6,004 3.3% 1,068 9.1%
77 Nantes NTE 481,313 12.4% 26.8% 4,332 -1.8% 791 14.1%
78 Malta MLA 477,952 14.7% 25.9% 3,716 12.9% 1,572 34.2%
79 Göteborg GOT 468,851 -0.3% 0.3% 4,611 -4.8% 1,403 8.3%
80 Rome CIA 458,085 1.1% 1.5% 2,796 1.1% 1,734 6.6%
81 Keflavik KEF 453,932 -25.2% -25.2% 3,069 -25.1% 4,422 -3.9%
82 Bergen BGO 451,532 4.5% 10.3% 6,297 1.8% 382 7.9%
Page 8
December December December
2019/18 2019/18 2019/182019/17
PASSENGERSCOMMERCIAL
MOVEMENTSFREIGHT
CITY CODE
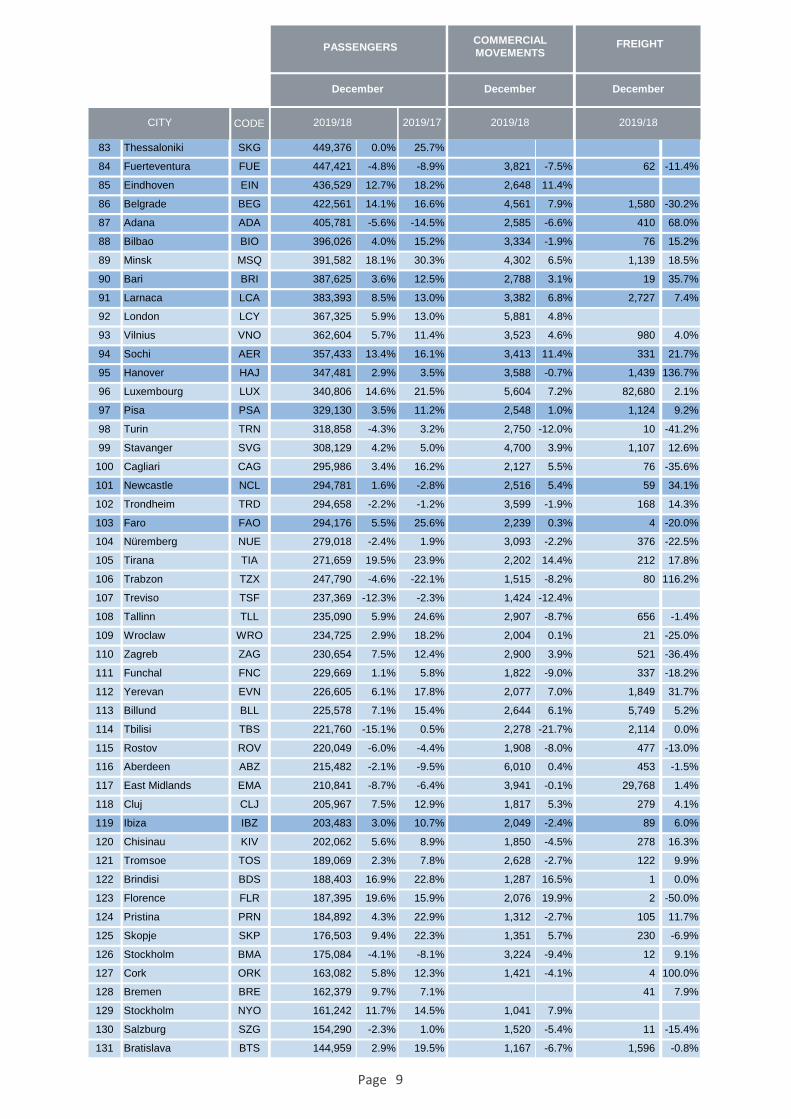
83 Thessaloniki SKG 449,376 0.0% 25.7% 0 - 0 -
84 Fuerteventura FUE 447,421 -4.8% -8.9% 3,821 -7.5% 62 -11.4%
85 Eindhoven EIN 436,529 12.7% 18.2% 2,648 11.4% 0 -
86 Belgrade BEG 422,561 14.1% 16.6% 4,561 7.9% 1,580 -30.2%
87 Adana ADA 405,781 -5.6% -14.5% 2,585 -6.6% 410 68.0%
88 Bilbao BIO 396,026 4.0% 15.2% 3,334 -1.9% 76 15.2%
89 Minsk MSQ 391,582 18.1% 30.3% 4,302 6.5% 1,139 18.5%
90 Bari BRI 387,625 3.6% 12.5% 2,788 3.1% 19 35.7%
91 Larnaca LCA 383,393 8.5% 13.0% 3,382 6.8% 2,727 7.4%
92 London LCY 367,325 5.9% 13.0% 5,881 4.8% 0 -
93 Vilnius VNO 362,604 5.7% 11.4% 3,523 4.6% 980 4.0%
94 Sochi AER 357,433 13.4% 16.1% 3,413 11.4% 331 21.7%
95 Hanover HAJ 347,481 2.9% 3.5% 3,588 -0.7% 1,439 136.7%
96 Luxembourg LUX 340,806 14.6% 21.5% 5,604 7.2% 82,680 2.1%
97 Pisa PSA 329,130 3.5% 11.2% 2,548 1.0% 1,124 9.2%
98 Turin TRN 318,858 -4.3% 3.2% 2,750 -12.0% 10 -41.2%
99 Stavanger SVG 308,129 4.2% 5.0% 4,700 3.9% 1,107 12.6%
100 Cagliari CAG 295,986 3.4% 16.2% 2,127 5.5% 76 -35.6%
101 Newcastle NCL 294,781 1.6% -2.8% 2,516 5.4% 59 34.1%
102 Trondheim TRD 294,658 -2.2% -1.2% 3,599 -1.9% 168 14.3%
103 Faro FAO 294,176 5.5% 25.6% 2,239 0.3% 4 -20.0%
104 Nüremberg NUE 279,018 -2.4% 1.9% 3,093 -2.2% 376 -22.5%
105 Tirana TIA 271,659 19.5% 23.9% 2,202 14.4% 212 17.8%
106 Trabzon TZX 247,790 -4.6% -22.1% 1,515 -8.2% 80 116.2%
107 Treviso TSF 237,369 -12.3% -2.3% 1,424 -12.4% 0 -
108 Tallinn TLL 235,090 5.9% 24.6% 2,907 -8.7% 656 -1.4%
109 Wroclaw WRO 234,725 2.9% 18.2% 2,004 0.1% 21 -25.0%
110 Zagreb ZAG 230,654 7.5% 12.4% 2,900 3.9% 521 -36.4%
111 Funchal FNC 229,669 1.1% 5.8% 1,822 -9.0% 337 -18.2%
112 Yerevan EVN 226,605 6.1% 17.8% 2,077 7.0% 1,849 31.7%
113 Billund BLL 225,578 7.1% 15.4% 2,644 6.1% 5,749 5.2%
114 Tbilisi TBS 221,760 -15.1% 0.5% 2,278 -21.7% 2,114 0.0%
115 Rostov ROV 220,049 -6.0% -4.4% 1,908 -8.0% 477 -13.0%
116 Aberdeen ABZ 215,482 -2.1% -9.5% 6,010 0.4% 453 -1.5%
117 East Midlands EMA 210,841 -8.7% -6.4% 3,941 -0.1% 29,768 1.4%
118 Cluj CLJ 205,967 7.5% 12.9% 1,817 5.3% 279 4.1%
119 Ibiza IBZ 203,483 3.0% 10.7% 2,049 -2.4% 89 6.0%
120 Chisinau KIV 202,062 5.6% 8.9% 1,850 -4.5% 278 16.3%
121 Tromsoe TOS 189,069 2.3% 7.8% 2,628 -2.7% 122 9.9%
122 Brindisi BDS 188,403 16.9% 22.8% 1,287 16.5% 1 0.0%
123 Florence FLR 187,395 19.6% 15.9% 2,076 19.9% 2 -50.0%
124 Pristina PRN 184,892 4.3% 22.9% 1,312 -2.7% 105 11.7%
125 Skopje SKP 176,503 9.4% 22.3% 1,351 5.7% 230 -6.9%
126 Stockholm BMA 175,084 -4.1% -8.1% 3,224 -9.4% 12 9.1%
127 Cork ORK 163,082 5.8% 12.3% 1,421 -4.1% 4 100.0%
128 Bremen BRE 162,379 9.7% 7.1% 0 - 41 7.9%
129 Stockholm NYO 161,242 11.7% 14.5% 1,041 7.9% 0 -
130 Salzburg SZG 154,290 -2.3% 1.0% 1,520 -5.4% 11 -15.4%
131 Bratislava BTS 144,959 2.9% 19.5% 1,167 -6.7% 1,596 -0.8%
Page 9
December December December
2019/18 2019/18 2019/182019/17
PASSENGERSCOMMERCIAL
MOVEMENTSFREIGHT
CITY CODE
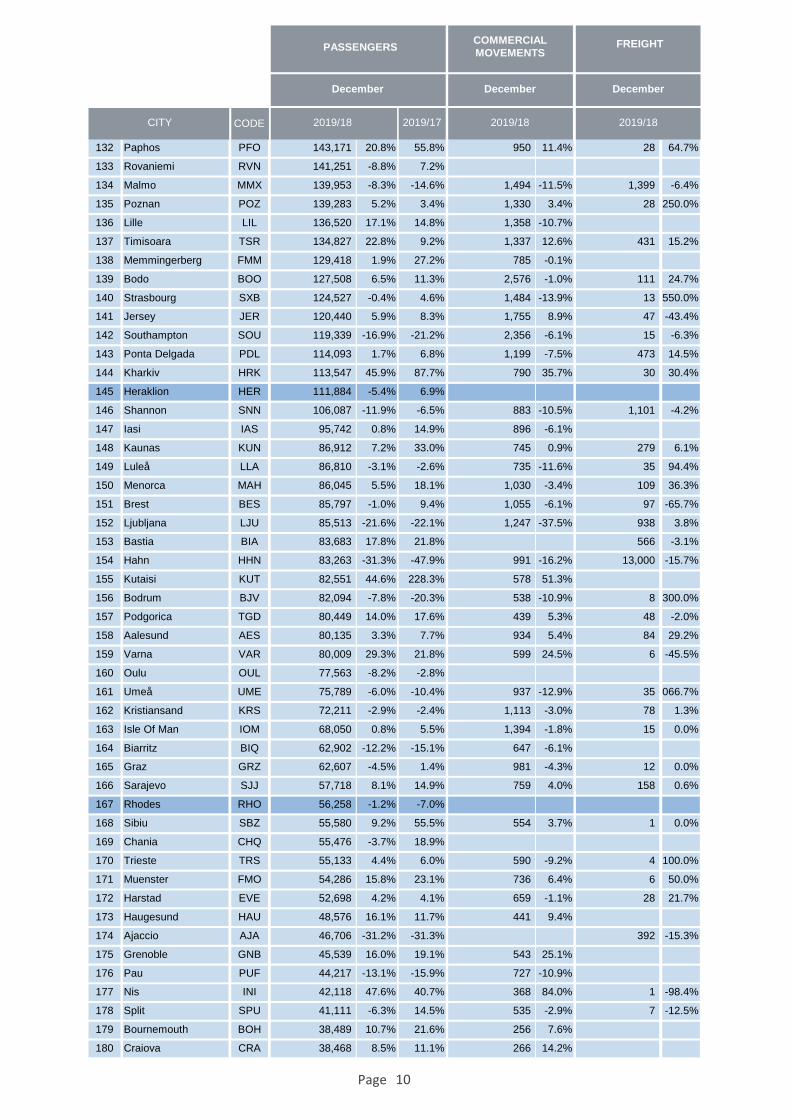
132 Paphos PFO 143,171 20.8% 55.8% 950 11.4% 28 64.7%
133 Rovaniemi RVN 141,251 -8.8% 7.2% 0 - 0 -
134 Malmo MMX 139,953 -8.3% -14.6% 1,494 -11.5% 1,399 -6.4%
135 Poznan POZ 139,283 5.2% 3.4% 1,330 3.4% 28 250.0%
136 Lille LIL 136,520 17.1% 14.8% 1,358 -10.7% 0 -
137 Timisoara TSR 134,827 22.8% 9.2% 1,337 12.6% 431 15.2%
138 Memmingerberg FMM 129,418 1.9% 27.2% 785 -0.1% 0 -
139 Bodo BOO 127,508 6.5% 11.3% 2,576 -1.0% 111 24.7%
140 Strasbourg SXB 124,527 -0.4% 4.6% 1,484 -13.9% 13 550.0%
141 Jersey JER 120,440 5.9% 8.3% 1,755 8.9% 47 -43.4%
142 Southampton SOU 119,339 -16.9% -21.2% 2,356 -6.1% 15 -6.3%
143 Ponta Delgada PDL 114,093 1.7% 6.8% 1,199 -7.5% 473 14.5%
144 Kharkiv HRK 113,547 45.9% 87.7% 790 35.7% 30 30.4%
145 Heraklion HER 111,884 -5.4% 6.9% 0 - 0 -
146 Shannon SNN 106,087 -11.9% -6.5% 883 -10.5% 1,101 -4.2%
147 Iasi IAS 95,742 0.8% 14.9% 896 -6.1% 0 -
148 Kaunas KUN 86,912 7.2% 33.0% 745 0.9% 279 6.1%
149 Luleå LLA 86,810 -3.1% -2.6% 735 -11.6% 35 94.4%
150 Menorca MAH 86,045 5.5% 18.1% 1,030 -3.4% 109 36.3%
151 Brest BES 85,797 -1.0% 9.4% 1,055 -6.1% 97 -65.7%
152 Ljubljana LJU 85,513 -21.6% -22.1% 1,247 -37.5% 938 3.8%
153 Bastia BIA 83,683 17.8% 21.8% 0 - 566 -3.1%
154 Hahn HHN 83,263 -31.3% -47.9% 991 -16.2% 13,000 -15.7%
155 Kutaisi KUT 82,551 44.6% 228.3% 578 51.3% 0 -
156 Bodrum BJV 82,094 -7.8% -20.3% 538 -10.9% 8 300.0%
157 Podgorica TGD 80,449 14.0% 17.6% 439 5.3% 48 -2.0%
158 Aalesund AES 80,135 3.3% 7.7% 934 5.4% 84 29.2%
159 Varna VAR 80,009 29.3% 21.8% 599 24.5% 6 -45.5%
160 Oulu OUL 77,563 -8.2% -2.8% 0 - 0 -
161 Umeå UME 75,789 -6.0% -10.4% 937 -12.9% 351,066.7%
162 Kristiansand KRS 72,211 -2.9% -2.4% 1,113 -3.0% 78 1.3%
163 Isle Of Man IOM 68,050 0.8% 5.5% 1,394 -1.8% 15 0.0%
164 Biarritz BIQ 62,902 -12.2% -15.1% 647 -6.1% 0 -
165 Graz GRZ 62,607 -4.5% 1.4% 981 -4.3% 12 0.0%
166 Sarajevo SJJ 57,718 8.1% 14.9% 759 4.0% 158 0.6%
167 Rhodes RHO 56,258 -1.2% -7.0% 0 - 0 -
168 Sibiu SBZ 55,580 9.2% 55.5% 554 3.7% 1 0.0%
169 Chania CHQ 55,476 -3.7% 18.9% 0 - 0 -
170 Trieste TRS 55,133 4.4% 6.0% 590 -9.2% 4 100.0%
171 Muenster FMO 54,286 15.8% 23.1% 736 6.4% 6 50.0%
172 Harstad EVE 52,698 4.2% 4.1% 659 -1.1% 28 21.7%
173 Haugesund HAU 48,576 16.1% 11.7% 441 9.4% 0 -
174 Ajaccio AJA 46,706 -31.2% -31.3% 0 - 392 -15.3%
175 Grenoble GNB 45,539 16.0% 19.1% 543 25.1% 0 -
176 Pau PUF 44,217 -13.1% -15.9% 727 -10.9% 0 -
177 Nis INI 42,118 47.6% 40.7% 368 84.0% 1 -98.4%
178 Split SPU 41,111 -6.3% 14.5% 535 -2.9% 7 -12.5%
179 Bournemouth BOH 38,489 10.7% 21.6% 256 7.6% 0 -
180 Craiova CRA 38,468 8.5% 11.1% 266 14.2% 0 -
Page 10
December December December
2019/18 2019/18 2019/182019/17
PASSENGERSCOMMERCIAL
MOVEMENTSFREIGHT
CITY CODE
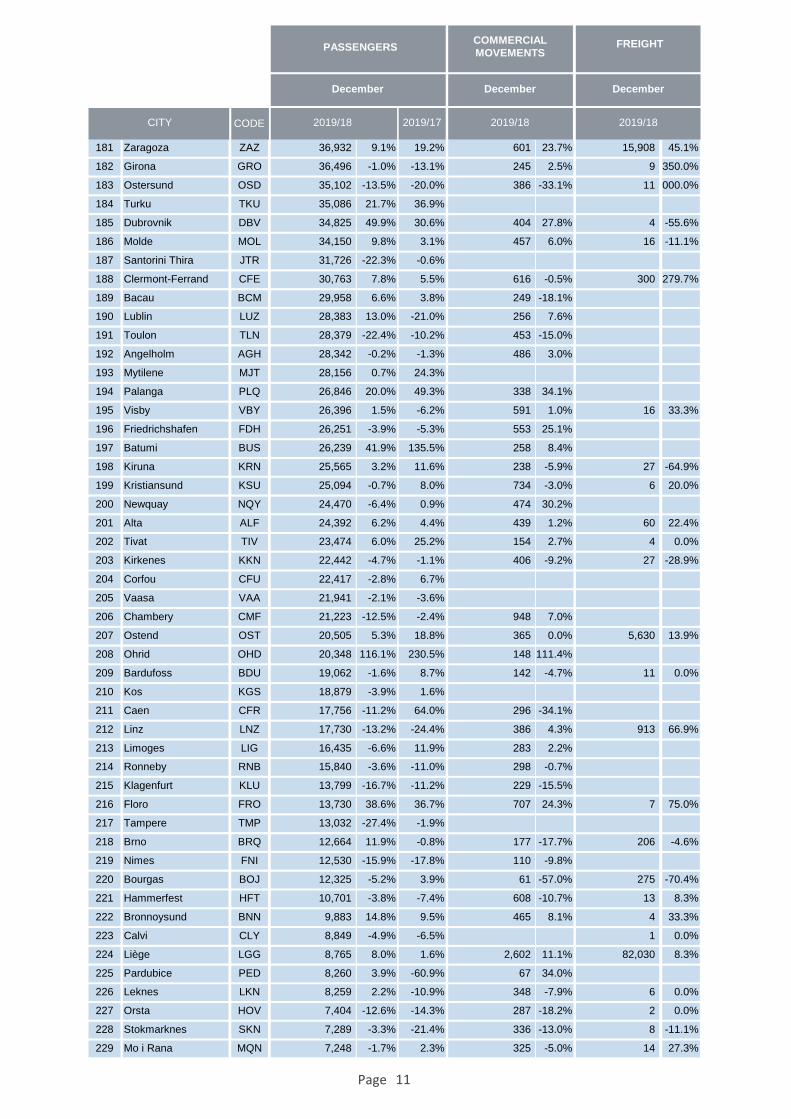
181 Zaragoza ZAZ 36,932 9.1% 19.2% 601 23.7% 15,908 45.1%
182 Girona GRO 36,496 -1.0% -13.1% 245 2.5% 9 350.0%
183 Ostersund OSD 35,102 -13.5% -20.0% 386 -33.1% 111,000.0%
184 Turku TKU 35,086 21.7% 36.9% 0 - 0 -
185 Dubrovnik DBV 34,825 49.9% 30.6% 404 27.8% 4 -55.6%
186 Molde MOL 34,150 9.8% 3.1% 457 6.0% 16 -11.1%
187 Santorini Thira JTR 31,726 -22.3% -0.6% 0 - 0 -
188 Clermont-Ferrand CFE 30,763 7.8% 5.5% 616 -0.5% 300 279.7%
189 Bacau BCM 29,958 6.6% 3.8% 249 -18.1% 0 -
190 Lublin LUZ 28,383 13.0% -21.0% 256 7.6% 0 -
191 Toulon TLN 28,379 -22.4% -10.2% 453 -15.0% 0 -
192 Angelholm AGH 28,342 -0.2% -1.3% 486 3.0% 0 -
193 Mytilene MJT 28,156 0.7% 24.3% 0 - 0 -
194 Palanga PLQ 26,846 20.0% 49.3% 338 34.1% 0 -
195 Visby VBY 26,396 1.5% -6.2% 591 1.0% 16 33.3%
196 Friedrichshafen FDH 26,251 -3.9% -5.3% 553 25.1% 0 -
197 Batumi BUS 26,239 41.9% 135.5% 258 8.4% 0 -
198 Kiruna KRN 25,565 3.2% 11.6% 238 -5.9% 27 -64.9%
199 Kristiansund KSU 25,094 -0.7% 8.0% 734 -3.0% 6 20.0%
200 Newquay NQY 24,470 -6.4% 0.9% 474 30.2% 0 -
201 Alta ALF 24,392 6.2% 4.4% 439 1.2% 60 22.4%
202 Tivat TIV 23,474 6.0% 25.2% 154 2.7% 4 0.0%
203 Kirkenes KKN 22,442 -4.7% -1.1% 406 -9.2% 27 -28.9%
204 Corfou CFU 22,417 -2.8% 6.7% 0 - 0 -
205 Vaasa VAA 21,941 -2.1% -3.6% 0 - 0 -
206 Chambery CMF 21,223 -12.5% -2.4% 948 7.0% 0 -
207 Ostend OST 20,505 5.3% 18.8% 365 0.0% 5,630 13.9%
208 Ohrid OHD 20,348 116.1% 230.5% 148 111.4% 0 -
209 Bardufoss BDU 19,062 -1.6% 8.7% 142 -4.7% 11 0.0%
210 Kos KGS 18,879 -3.9% 1.6% 0 - 0 -
211 Caen CFR 17,756 -11.2% 64.0% 296 -34.1% 0 -
212 Linz LNZ 17,730 -13.2% -24.4% 386 4.3% 913 66.9%
213 Limoges LIG 16,435 -6.6% 11.9% 283 2.2% 0 -
214 Ronneby RNB 15,840 -3.6% -11.0% 298 -0.7% 0 -
215 Klagenfurt KLU 13,799 -16.7% -11.2% 229 -15.5% 0 -
216 Floro FRO 13,730 38.6% 36.7% 707 24.3% 7 75.0%
217 Tampere TMP 13,032 -27.4% -1.9% 0 - 0 -
218 Brno BRQ 12,664 11.9% -0.8% 177 -17.7% 206 -4.6%
219 Nimes FNI 12,530 -15.9% -17.8% 110 -9.8% 0 -
220 Bourgas BOJ 12,325 -5.2% 3.9% 61 -57.0% 275 -70.4%
221 Hammerfest HFT 10,701 -3.8% -7.4% 608 -10.7% 13 8.3%
222 Bronnoysund BNN 9,883 14.8% 9.5% 465 8.1% 4 33.3%
223 Calvi CLY 8,849 -4.9% -6.5% 0 - 1 0.0%
224 Liège LGG 8,765 8.0% 1.6% 2,602 11.1% 82,030 8.3%
225 Pardubice PED 8,260 3.9% -60.9% 67 34.0% 0 -
226 Leknes LKN 8,259 2.2% -10.9% 348 -7.9% 6 0.0%
227 Orsta HOV 7,404 -12.6% -14.3% 287 -18.2% 2 0.0%
228 Stokmarknes SKN 7,289 -3.3% -21.4% 336 -13.0% 8 -11.1%
229 Mo i Rana MQN 7,248 -1.7% 2.3% 325 -5.0% 14 27.3%
Page 11
December December December
2019/18 2019/18 2019/182019/17
PASSENGERSCOMMERCIAL
MOVEMENTSFREIGHT
CITY CODE
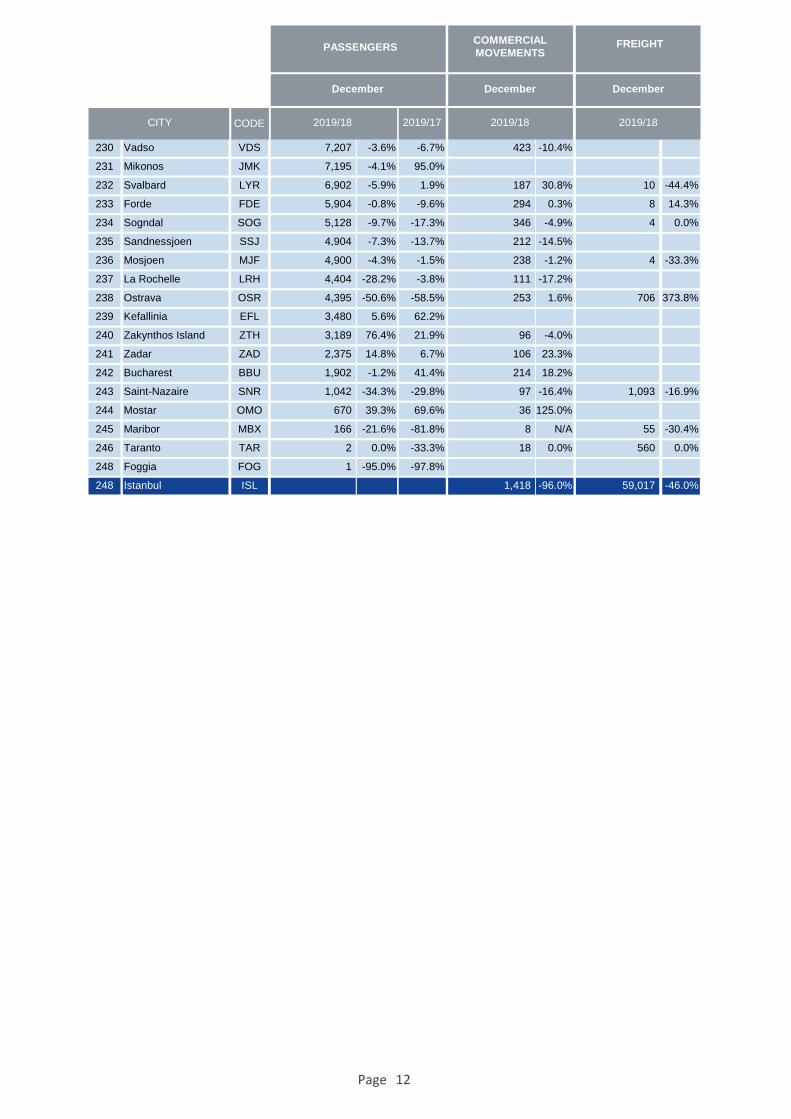
230 Vadso VDS 7,207 -3.6% -6.7% 423 -10.4% 0 -
231 Mikonos JMK 7,195 -4.1% 95.0% 0 - 0 -
232 Svalbard LYR 6,902 -5.9% 1.9% 187 30.8% 10 -44.4%
233 Forde FDE 5,904 -0.8% -9.6% 294 0.3% 8 14.3%
234 Sogndal SOG 5,128 -9.7% -17.3% 346 -4.9% 4 0.0%
235 Sandnessjoen SSJ 4,904 -7.3% -13.7% 212 -14.5% 0 -
236 Mosjoen MJF 4,900 -4.3% -1.5% 238 -1.2% 4 -33.3%
237 La Rochelle LRH 4,404 -28.2% -3.8% 111 -17.2% 0 -
238 Ostrava OSR 4,395 -50.6% -58.5% 253 1.6% 706 373.8%
239 Kefallinia EFL 3,480 5.6% 62.2% 0 - 0 -
240 Zakynthos Island ZTH 3,189 76.4% 21.9% 96 -4.0% 0 -
241 Zadar ZAD 2,375 14.8% 6.7% 106 23.3% 0 -
242 Bucharest BBU 1,902 -1.2% 41.4% 214 18.2% 0 -
243 Saint-Nazaire SNR 1,042 -34.3% -29.8% 97 -16.4% 1,093 -16.9%
244 Mostar OMO 670 39.3% 69.6% 36 125.0% 0 -
245 Maribor MBX 166 -21.6% -81.8% 8 N/A 55 -30.4%
246 Taranto TAR 2 0.0% -33.3% 18 0.0% 560 0.0%
248 Foggia FOG 1 -95.0% -97.8% 0 - 0 -
248 Istanbul ISL 1,418 -96.0% 59,017 -46.0%
Page 12
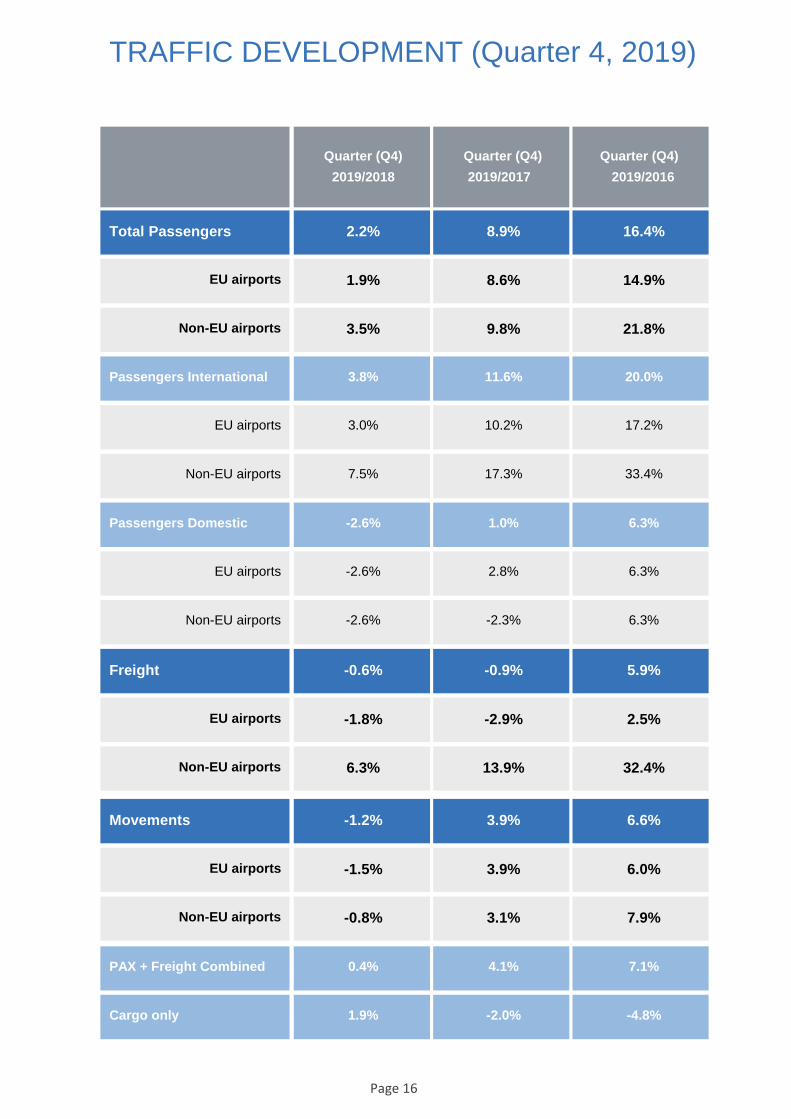
TRAFFIC DEVELOPMENT (Quarter 4, 2019)
Total Passengers
Non-EU airports
EU airports
Passengers International
Non-EU airports
EU airports
Passengers Domestic
Non-EU airports
EU airports
Freight
Non-EU airports
EU airports
Movements
Non-EU airports
EU airports
PAX + Freight Combined
Cargo only
2.2% 8.9% 16.4%
1.9% 8.6% 14.9%
3.5% 9.8% 21.8%
3.8% 11.6% 20.0%
3.0% 10.2% 17.2%
7.5% 17.3% 33.4%
-2.6% 1.0% 6.3%
-2.6% 2.8% 6.3%
-2.6% -2.3% 6.3%
-0.6% -0.9% 5.9%
-1.8% -2.9% 2.5%
6.3% 13.9% 32.4%
-1.2% 3.9% 6.6%
-1.5% 3.9% 6.0%
-0.8% 3.1% 7.9%
0.4% 4.1% 7.1%
1.9% -2.0% -4.8%
Quarter (Q4)
2019/2018 2019/2017 2019/2016
Quarter (Q4) Quarter (Q4)
Page 16

Iceland
-30.7%
Finland
2.0%
Sweden
-4.7%
Norway
0.3%
Ireland
1.2% UK
-0.2% Netherlands
1.6%
Belgium4.3%
France
1.7%
Portugal
6.5%
Spain
2.8%
Italy
3.1%
Switzerland
0.5%
Luxembourg
11.6%
Germany
-2.2%
Poland
13.4%
Czech Republic
7.7%
Austria8.7%
Slovenia-30.3%
Croatia12.1%
Bosnia & Herz.11.8%
Albania18.4%
Malta
10.2%
Greece
2.1%
North Macedonia19.8%
Montenegro14.9%
Serbia
16.3%
Hungary
13.8%
Slovakia-2.0%
Romania
5.7%
Bulgaria
4.8%
Cyprus
5.8%
Turkey
2.6%
Israel
14.5%
Georgia
-4.0%
Ukraine
19.7%
Russian Federation
4.1%
Moldova
5.8%
Estonia
8.2%
Latvia
9.8%
Lithuania
7.4%
Denmark
0.3%
PASSENGER DEVELOPMENT EUROPEAN COUNTRIES (Quarter 4, 2019 YoY)
Quarter 4, 2019 YoY
Belarus
14.6%
Armenia
10.5%
Page 17
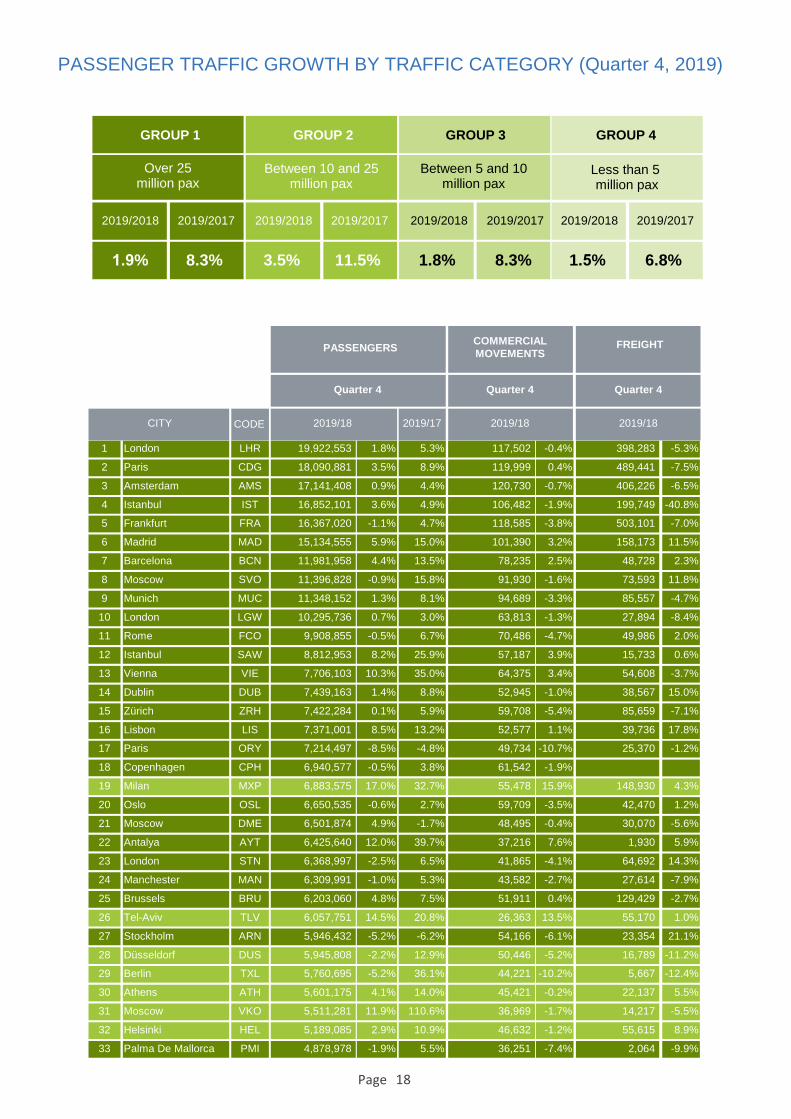
GROUP 1
2019/2018
Over 25million pax
1.9%
2019/2017
8.3%
GROUP 2
2019/2018
Between 10 and 25million pax
3.5%
2019/2017
11.5%
GROUP 3
2019/2018
Between 5 and 10million pax
1.8%
2019/2017
8.3%
GROUP 4
2019/2018
Less than 5 million pax
1.5%
2019/2017
6.8%
PASSENGER TRAFFIC GROWTH BY TRAFFIC CATEGORY (Quarter 4, 2019)
Quarter 4 Quarter 4 Quarter 4
2019/18 2019/18 2019/182019/17
PASSENGERSCOMMERCIAL
MOVEMENTSFREIGHT
CITY CODE
1 London LHR 19,922,553 1.8% 5.3% 117,502 -0.4% 398,283 -5.3%
2 Paris CDG 18,090,881 3.5% 8.9% 119,999 0.4% 489,441 -7.5%
3 Amsterdam AMS 17,141,408 0.9% 4.4% 120,730 -0.7% 406,226 -6.5%
4 Istanbul IST 16,852,101 3.6% 4.9% 106,482 -1.9% 199,749 -40.8%
5 Frankfurt FRA 16,367,020 -1.1% 4.7% 118,585 -3.8% 503,101 -7.0%
6 Madrid MAD 15,134,555 5.9% 15.0% 101,390 3.2% 158,173 11.5%
7 Barcelona BCN 11,981,958 4.4% 13.5% 78,235 2.5% 48,728 2.3%
8 Moscow SVO 11,396,828 -0.9% 15.8% 91,930 -1.6% 73,593 11.8%
9 Munich MUC 11,348,152 1.3% 8.1% 94,689 -3.3% 85,557 -4.7%
10 London LGW 10,295,736 0.7% 3.0% 63,813 -1.3% 27,894 -8.4%
11 Rome FCO 9,908,855 -0.5% 6.7% 70,486 -4.7% 49,986 2.0%
12 Istanbul SAW 8,812,953 8.2% 25.9% 57,187 3.9% 15,733 0.6%
13 Vienna VIE 7,706,103 10.3% 35.0% 64,375 3.4% 54,608 -3.7%
14 Dublin DUB 7,439,163 1.4% 8.8% 52,945 -1.0% 38,567 15.0%
15 Zürich ZRH 7,422,284 0.1% 5.9% 59,708 -5.4% 85,659 -7.1%
16 Lisbon LIS 7,371,001 8.5% 13.2% 52,577 1.1% 39,736 17.8%
17 Paris ORY 7,214,497 -8.5% -4.8% 49,734 -10.7% 25,370 -1.2%
18 Copenhagen CPH 6,940,577 -0.5% 3.8% 61,542 -1.9% 3 0.0%
19 Milan MXP 6,883,575 17.0% 32.7% 55,478 15.9% 148,930 4.3%
20 Oslo OSL 6,650,535 -0.6% 2.7% 59,709 -3.5% 42,470 1.2%
21 Moscow DME 6,501,874 4.9% -1.7% 48,495 -0.4% 30,070 -5.6%
22 Antalya AYT 6,425,640 12.0% 39.7% 37,216 7.6% 1,930 5.9%
23 London STN 6,368,997 -2.5% 6.5% 41,865 -4.1% 64,692 14.3%
24 Manchester MAN 6,309,991 -1.0% 5.3% 43,582 -2.7% 27,614 -7.9%
25 Brussels BRU 6,203,060 4.8% 7.5% 51,911 0.4% 129,429 -2.7%
26 Tel-Aviv TLV 6,057,751 14.5% 20.8% 26,363 13.5% 55,170 1.0%
27 Stockholm ARN 5,946,432 -5.2% -6.2% 54,166 -6.1% 23,354 21.1%
28 Düsseldorf DUS 5,945,808 -2.2% 12.9% 50,446 -5.2% 16,789 -11.2%
29 Berlin TXL 5,760,695 -5.2% 36.1% 44,221 -10.2% 5,667 -12.4%
30 Athens ATH 5,601,175 4.1% 14.0% 45,421 -0.2% 22,137 5.5%
31 Moscow VKO 5,511,281 11.9% 110.6% 36,969 -1.7% 14,217 -5.5%
32 Helsinki HEL 5,189,085 2.9% 10.9% 46,632 -1.2% 55,615 8.9%
33 Palma De Mallorca PMI 4,878,978 -1.9% 5.5% 36,251 -7.4% 2,064 -9.9%
Page 18
Quarter 4 Quarter 4 Quarter 4
2019/18 2019/18 2019/182019/17
PASSENGERSCOMMERCIAL
MOVEMENTSFREIGHT
CITY CODE
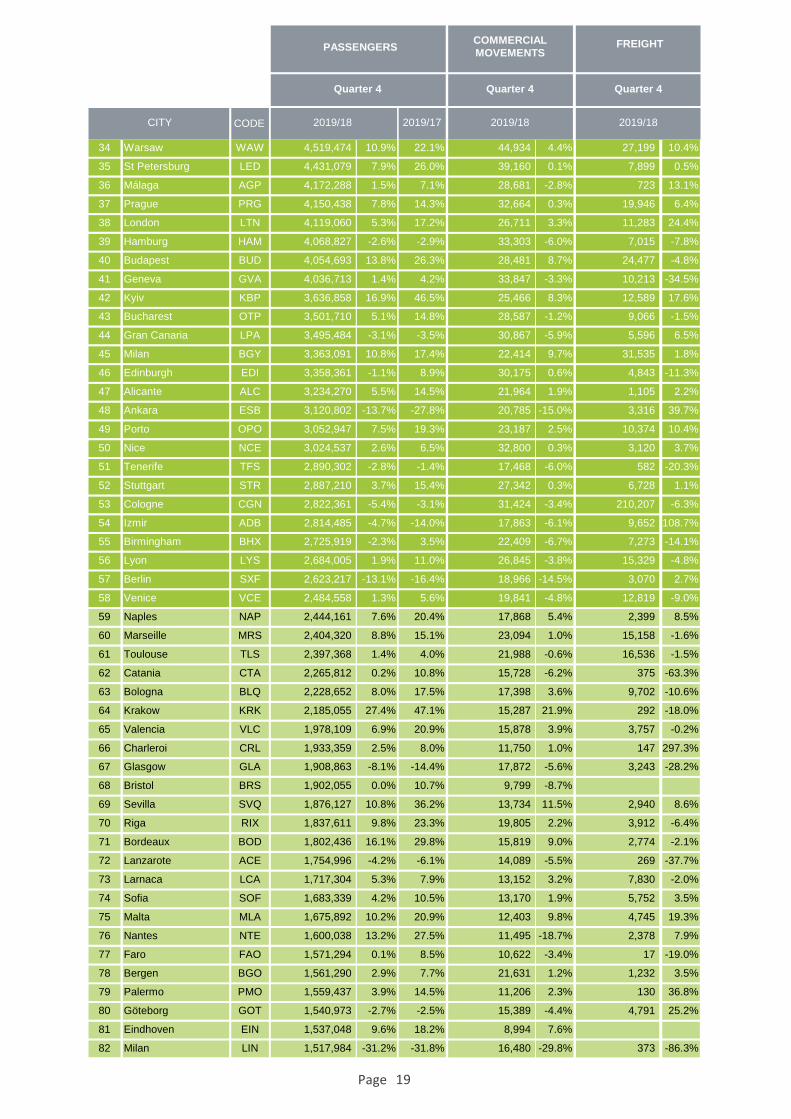
34 Warsaw WAW 4,519,474 10.9% 22.1% 44,934 4.4% 27,199 10.4%
35 St Petersburg LED 4,431,079 7.9% 26.0% 39,160 0.1% 7,899 0.5%
36 Málaga AGP 4,172,288 1.5% 7.1% 28,681 -2.8% 723 13.1%
37 Prague PRG 4,150,438 7.8% 14.3% 32,664 0.3% 19,946 6.4%
38 London LTN 4,119,060 5.3% 17.2% 26,711 3.3% 11,283 24.4%
39 Hamburg HAM 4,068,827 -2.6% -2.9% 33,303 -6.0% 7,015 -7.8%
40 Budapest BUD 4,054,693 13.8% 26.3% 28,481 8.7% 24,477 -4.8%
41 Geneva GVA 4,036,713 1.4% 4.2% 33,847 -3.3% 10,213 -34.5%
42 Kyiv KBP 3,636,858 16.9% 46.5% 25,466 8.3% 12,589 17.6%
43 Bucharest OTP 3,501,710 5.1% 14.8% 28,587 -1.2% 9,066 -1.5%
44 Gran Canaria LPA 3,495,484 -3.1% -3.5% 30,867 -5.9% 5,596 6.5%
45 Milan BGY 3,363,091 10.8% 17.4% 22,414 9.7% 31,535 1.8%
46 Edinburgh EDI 3,358,361 -1.1% 8.9% 30,175 0.6% 4,843 -11.3%
47 Alicante ALC 3,234,270 5.5% 14.5% 21,964 1.9% 1,105 2.2%
48 Ankara ESB 3,120,802 -13.7% -27.8% 20,785 -15.0% 3,316 39.7%
49 Porto OPO 3,052,947 7.5% 19.3% 23,187 2.5% 10,374 10.4%
50 Nice NCE 3,024,537 2.6% 6.5% 32,800 0.3% 3,120 3.7%
51 Tenerife TFS 2,890,302 -2.8% -1.4% 17,468 -6.0% 582 -20.3%
52 Stuttgart STR 2,887,210 3.7% 15.4% 27,342 0.3% 6,728 1.1%
53 Cologne CGN 2,822,361 -5.4% -3.1% 31,424 -3.4% 210,207 -6.3%
54 Izmir ADB 2,814,485 -4.7% -14.0% 17,863 -6.1% 9,652 108.7%
55 Birmingham BHX 2,725,919 -2.3% 3.5% 22,409 -6.7% 7,273 -14.1%
56 Lyon LYS 2,684,005 1.9% 11.0% 26,845 -3.8% 15,329 -4.8%
57 Berlin SXF 2,623,217 -13.1% -16.4% 18,966 -14.5% 3,070 2.7%
58 Venice VCE 2,484,558 1.3% 5.6% 19,841 -4.8% 12,819 -9.0%
59 Naples NAP 2,444,161 7.6% 20.4% 17,868 5.4% 2,399 8.5%
60 Marseille MRS 2,404,320 8.8% 15.1% 23,094 1.0% 15,158 -1.6%
61 Toulouse TLS 2,397,368 1.4% 4.0% 21,988 -0.6% 16,536 -1.5%
62 Catania CTA 2,265,812 0.2% 10.8% 15,728 -6.2% 375 -63.3%
63 Bologna BLQ 2,228,652 8.0% 17.5% 17,398 3.6% 9,702 -10.6%
64 Krakow KRK 2,185,055 27.4% 47.1% 15,287 21.9% 292 -18.0%
65 Valencia VLC 1,978,109 6.9% 20.9% 15,878 3.9% 3,757 -0.2%
66 Charleroi CRL 1,933,359 2.5% 8.0% 11,750 1.0% 147 297.3%
67 Glasgow GLA 1,908,863 -8.1% -14.4% 17,872 -5.6% 3,243 -28.2%
68 Bristol BRS 1,902,055 0.0% 10.7% 9,799 -8.7% 3 0.0%
69 Sevilla SVQ 1,876,127 10.8% 36.2% 13,734 11.5% 2,940 8.6%
70 Riga RIX 1,837,611 9.8% 23.3% 19,805 2.2% 3,912 -6.4%
71 Bordeaux BOD 1,802,436 16.1% 29.8% 15,819 9.0% 2,774 -2.1%
72 Lanzarote ACE 1,754,996 -4.2% -6.1% 14,089 -5.5% 269 -37.7%
73 Larnaca LCA 1,717,304 5.3% 7.9% 13,152 3.2% 7,830 -2.0%
74 Sofia SOF 1,683,339 4.2% 10.5% 13,170 1.9% 5,752 3.5%
75 Malta MLA 1,675,892 10.2% 20.9% 12,403 9.8% 4,745 19.3%
76 Nantes NTE 1,600,038 13.2% 27.5% 11,495 -18.7% 2,378 7.9%
77 Faro FAO 1,571,294 0.1% 8.5% 10,622 -3.4% 17 -19.0%
78 Bergen BGO 1,561,290 2.9% 7.7% 21,631 1.2% 1,232 3.5%
79 Palermo PMO 1,559,437 3.9% 14.5% 11,206 2.3% 130 36.8%
80 Göteborg GOT 1,540,973 -2.7% -2.5% 15,389 -4.4% 4,791 25.2%
81 Eindhoven EIN 1,537,048 9.6% 18.2% 8,994 7.6% 3 0.0%
82 Milan LIN 1,517,984 -31.2% -31.8% 16,480 -29.8% 373 -86.3%
Page 19
Quarter 4 Quarter 4 Quarter 4
2019/18 2019/18 2019/182019/17
PASSENGERSCOMMERCIAL
MOVEMENTSFREIGHT
CITY CODE
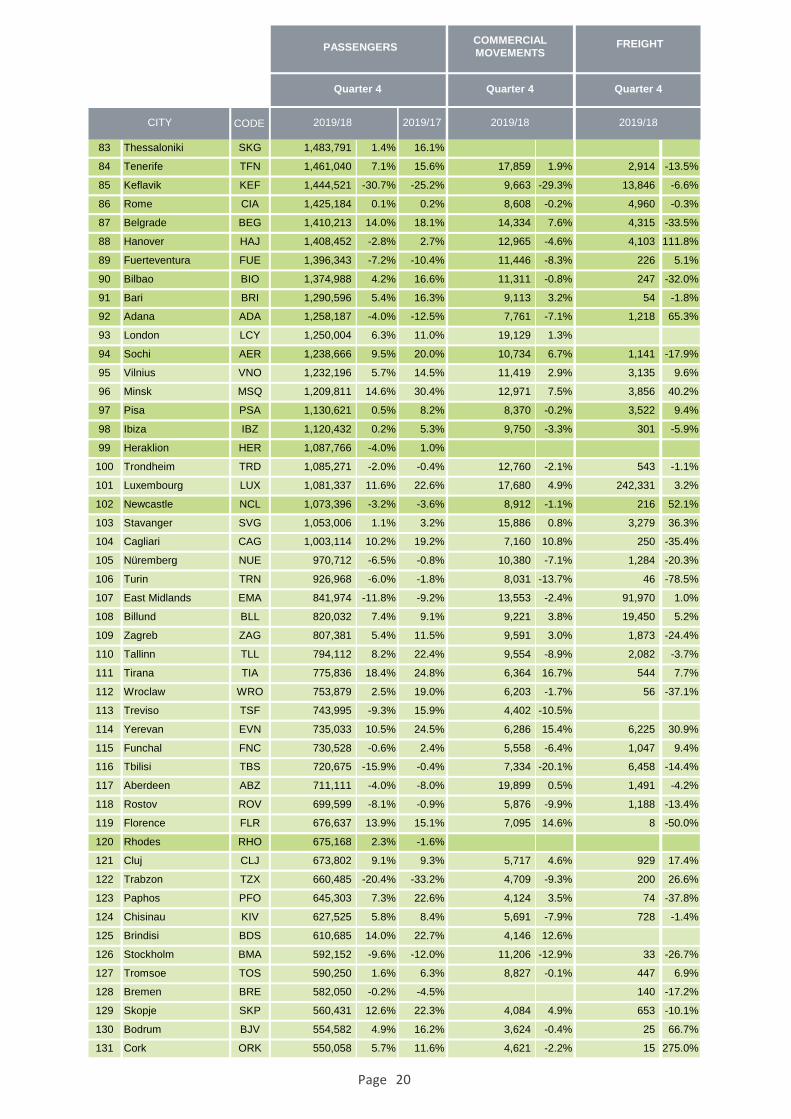
83 Thessaloniki SKG 1,483,791 1.4% 16.1% 3 0.0% 3 0.0%
84 Tenerife TFN 1,461,040 7.1% 15.6% 17,859 1.9% 2,914 -13.5%
85 Keflavik KEF 1,444,521 -30.7% -25.2% 9,663 -29.3% 13,846 -6.6%
86 Rome CIA 1,425,184 0.1% 0.2% 8,608 -0.2% 4,960 -0.3%
87 Belgrade BEG 1,410,213 14.0% 18.1% 14,334 7.6% 4,315 -33.5%
88 Hanover HAJ 1,408,452 -2.8% 2.7% 12,965 -4.6% 4,103 111.8%
89 Fuerteventura FUE 1,396,343 -7.2% -10.4% 11,446 -8.3% 226 5.1%
90 Bilbao BIO 1,374,988 4.2% 16.6% 11,311 -0.8% 247 -32.0%
91 Bari BRI 1,290,596 5.4% 16.3% 9,113 3.2% 54 -1.8%
92 Adana ADA 1,258,187 -4.0% -12.5% 7,761 -7.1% 1,218 65.3%
93 London LCY 1,250,004 6.3% 11.0% 19,129 1.3% 3 0.0%
94 Sochi AER 1,238,666 9.5% 20.0% 10,734 6.7% 1,141 -17.9%
95 Vilnius VNO 1,232,196 5.7% 14.5% 11,419 2.9% 3,135 9.6%
96 Minsk MSQ 1,209,811 14.6% 30.4% 12,971 7.5% 3,856 40.2%
97 Pisa PSA 1,130,621 0.5% 8.2% 8,370 -0.2% 3,522 9.4%
98 Ibiza IBZ 1,120,432 0.2% 5.3% 9,750 -3.3% 301 -5.9%
99 Heraklion HER 1,087,766 -4.0% 1.0% 3 0.0% 3 0.0%
100 Trondheim TRD 1,085,271 -2.0% -0.4% 12,760 -2.1% 543 -1.1%
101 Luxembourg LUX 1,081,337 11.6% 22.6% 17,680 4.9% 242,331 3.2%
102 Newcastle NCL 1,073,396 -3.2% -3.6% 8,912 -1.1% 216 52.1%
103 Stavanger SVG 1,053,006 1.1% 3.2% 15,886 0.8% 3,279 36.3%
104 Cagliari CAG 1,003,114 10.2% 19.2% 7,160 10.8% 250 -35.4%
105 Nüremberg NUE 970,712 -6.5% -0.8% 10,380 -7.1% 1,284 -20.3%
106 Turin TRN 926,968 -6.0% -1.8% 8,031 -13.7% 46 -78.5%
107 East Midlands EMA 841,974 -11.8% -9.2% 13,553 -2.4% 91,970 1.0%
108 Billund BLL 820,032 7.4% 9.1% 9,221 3.8% 19,450 5.2%
109 Zagreb ZAG 807,381 5.4% 11.5% 9,591 3.0% 1,873 -24.4%
110 Tallinn TLL 794,112 8.2% 22.4% 9,554 -8.9% 2,082 -3.7%
111 Tirana TIA 775,836 18.4% 24.8% 6,364 16.7% 544 7.7%
112 Wroclaw WRO 753,879 2.5% 19.0% 6,203 -1.7% 56 -37.1%
113 Treviso TSF 743,995 -9.3% 15.9% 4,402 -10.5% 3 0.0%
114 Yerevan EVN 735,033 10.5% 24.5% 6,286 15.4% 6,225 30.9%
115 Funchal FNC 730,528 -0.6% 2.4% 5,558 -6.4% 1,047 9.4%
116 Tbilisi TBS 720,675 -15.9% -0.4% 7,334 -20.1% 6,458 -14.4%
117 Aberdeen ABZ 711,111 -4.0% -8.0% 19,899 0.5% 1,491 -4.2%
118 Rostov ROV 699,599 -8.1% -0.9% 5,876 -9.9% 1,188 -13.4%
119 Florence FLR 676,637 13.9% 15.1% 7,095 14.6% 8 -50.0%
120 Rhodes RHO 675,168 2.3% -1.6% 3 0.0% 3 0.0%
121 Cluj CLJ 673,802 9.1% 9.3% 5,717 4.6% 929 17.4%
122 Trabzon TZX 660,485 -20.4% -33.2% 4,709 -9.3% 200 26.6%
123 Paphos PFO 645,303 7.3% 22.6% 4,124 3.5% 74 -37.8%
124 Chisinau KIV 627,525 5.8% 8.4% 5,691 -7.9% 728 -1.4%
125 Brindisi BDS 610,685 14.0% 22.7% 4,146 12.6% 3 0.0%
126 Stockholm BMA 592,152 -9.6% -12.0% 11,206 -12.9% 33 -26.7%
127 Tromsoe TOS 590,250 1.6% 6.3% 8,827 -0.1% 447 6.9%
128 Bremen BRE 582,050 -0.2% -4.5% 3 0.0% 140 -17.2%
129 Skopje SKP 560,431 12.6% 22.3% 4,084 4.9% 653 -10.1%
130 Bodrum BJV 554,582 4.9% 16.2% 3,624 -0.4% 25 66.7%
131 Cork ORK 550,058 5.7% 11.6% 4,621 -2.2% 15 275.0%
Page 20
Quarter 4 Quarter 4 Quarter 4
2019/18 2019/18 2019/182019/17
PASSENGERSCOMMERCIAL
MOVEMENTSFREIGHT
CITY CODE
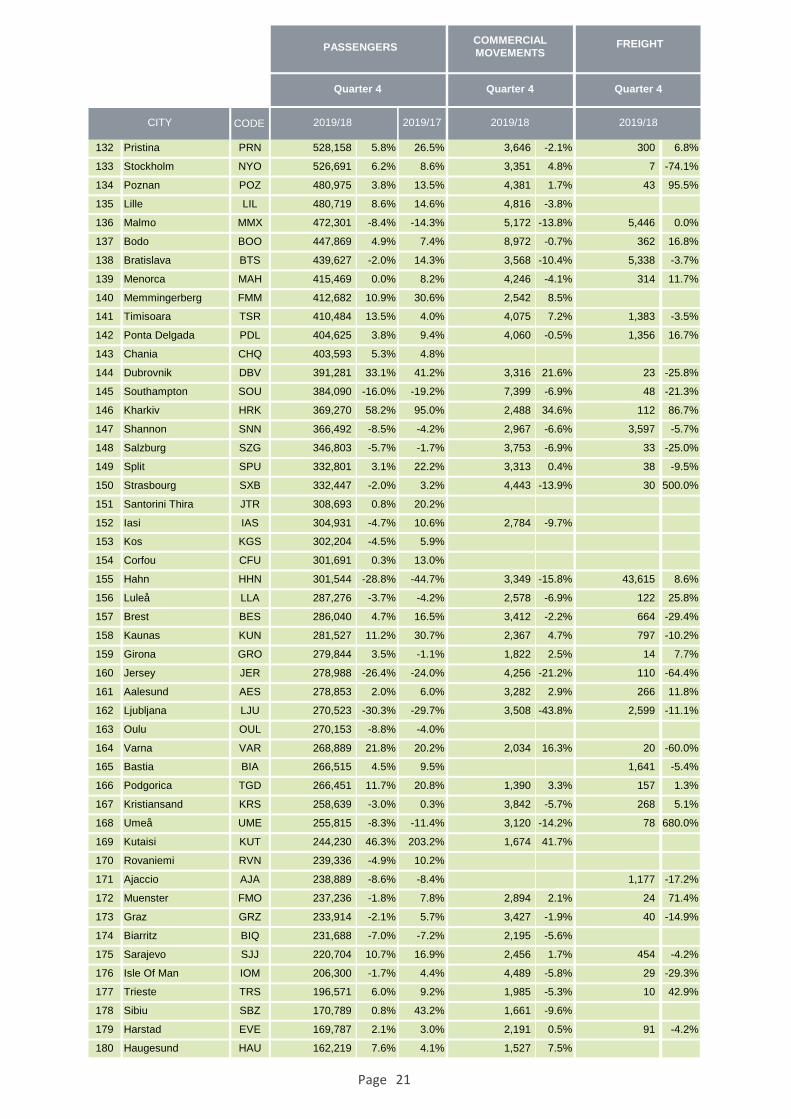
132 Pristina PRN 528,158 5.8% 26.5% 3,646 -2.1% 300 6.8%
133 Stockholm NYO 526,691 6.2% 8.6% 3,351 4.8% 7 -74.1%
134 Poznan POZ 480,975 3.8% 13.5% 4,381 1.7% 43 95.5%
135 Lille LIL 480,719 8.6% 14.6% 4,816 -3.8% 3 0.0%
136 Malmo MMX 472,301 -8.4% -14.3% 5,172 -13.8% 5,446 0.0%
137 Bodo BOO 447,869 4.9% 7.4% 8,972 -0.7% 362 16.8%
138 Bratislava BTS 439,627 -2.0% 14.3% 3,568 -10.4% 5,338 -3.7%
139 Menorca MAH 415,469 0.0% 8.2% 4,246 -4.1% 314 11.7%
140 Memmingerberg FMM 412,682 10.9% 30.6% 2,542 8.5% 3 0.0%
141 Timisoara TSR 410,484 13.5% 4.0% 4,075 7.2% 1,383 -3.5%
142 Ponta Delgada PDL 404,625 3.8% 9.4% 4,060 -0.5% 1,356 16.7%
143 Chania CHQ 403,593 5.3% 4.8% 3 0.0% 3 0.0%
144 Dubrovnik DBV 391,281 33.1% 41.2% 3,316 21.6% 23 -25.8%
145 Southampton SOU 384,090 -16.0% -19.2% 7,399 -6.9% 48 -21.3%
146 Kharkiv HRK 369,270 58.2% 95.0% 2,488 34.6% 112 86.7%
147 Shannon SNN 366,492 -8.5% -4.2% 2,967 -6.6% 3,597 -5.7%
148 Salzburg SZG 346,803 -5.7% -1.7% 3,753 -6.9% 33 -25.0%
149 Split SPU 332,801 3.1% 22.2% 3,313 0.4% 38 -9.5%
150 Strasbourg SXB 332,447 -2.0% 3.2% 4,443 -13.9% 30 500.0%
151 Santorini Thira JTR 308,693 0.8% 20.2% 3 0.0% 3 0.0%
152 Iasi IAS 304,931 -4.7% 10.6% 2,784 -9.7% 3 0.0%
153 Kos KGS 302,204 -4.5% 5.9% 3 0.0% 3 0.0%
154 Corfou CFU 301,691 0.3% 13.0% 3 0.0% 3 0.0%
155 Hahn HHN 301,544 -28.8% -44.7% 3,349 -15.8% 43,615 8.6%
156 Luleå LLA 287,276 -3.7% -4.2% 2,578 -6.9% 122 25.8%
157 Brest BES 286,040 4.7% 16.5% 3,412 -2.2% 664 -29.4%
158 Kaunas KUN 281,527 11.2% 30.7% 2,367 4.7% 797 -10.2%
159 Girona GRO 279,844 3.5% -1.1% 1,822 2.5% 14 7.7%
160 Jersey JER 278,988 -26.4% -24.0% 4,256 -21.2% 110 -64.4%
161 Aalesund AES 278,853 2.0% 6.0% 3,282 2.9% 266 11.8%
162 Ljubljana LJU 270,523 -30.3% -29.7% 3,508 -43.8% 2,599 -11.1%
163 Oulu OUL 270,153 -8.8% -4.0% 3 0.0% 3 0.0%
164 Varna VAR 268,889 21.8% 20.2% 2,034 16.3% 20 -60.0%
165 Bastia BIA 266,515 4.5% 9.5% 3 0.0% 1,641 -5.4%
166 Podgorica TGD 266,451 11.7% 20.8% 1,390 3.3% 157 1.3%
167 Kristiansand KRS 258,639 -3.0% 0.3% 3,842 -5.7% 268 5.1%
168 Umeå UME 255,815 -8.3% -11.4% 3,120 -14.2% 78 680.0%
169 Kutaisi KUT 244,230 46.3% 203.2% 1,674 41.7% 3 0.0%
170 Rovaniemi RVN 239,336 -4.9% 10.2% 3 0.0% 3 0.0%
171 Ajaccio AJA 238,889 -8.6% -8.4% 3 0.0% 1,177 -17.2%
172 Muenster FMO 237,236 -1.8% 7.8% 2,894 2.1% 24 71.4%
173 Graz GRZ 233,914 -2.1% 5.7% 3,427 -1.9% 40 -14.9%
174 Biarritz BIQ 231,688 -7.0% -7.2% 2,195 -5.6% 3 0.0%
175 Sarajevo SJJ 220,704 10.7% 16.9% 2,456 1.7% 454 -4.2%
176 Isle Of Man IOM 206,300 -1.7% 4.4% 4,489 -5.8% 29 -29.3%
177 Trieste TRS 196,571 6.0% 9.2% 1,985 -5.3% 10 42.9%
178 Sibiu SBZ 170,789 0.8% 43.2% 1,661 -9.6% 3 -62.5%
179 Harstad EVE 169,787 2.1% 3.0% 2,191 0.5% 91 -4.2%
180 Haugesund HAU 162,219 7.6% 4.1% 1,527 7.5% 3 0.0%
Page 21
Quarter 4 Quarter 4 Quarter 4
2019/18 2019/18 2019/182019/17
PASSENGERSCOMMERCIAL
MOVEMENTSFREIGHT
CITY CODE
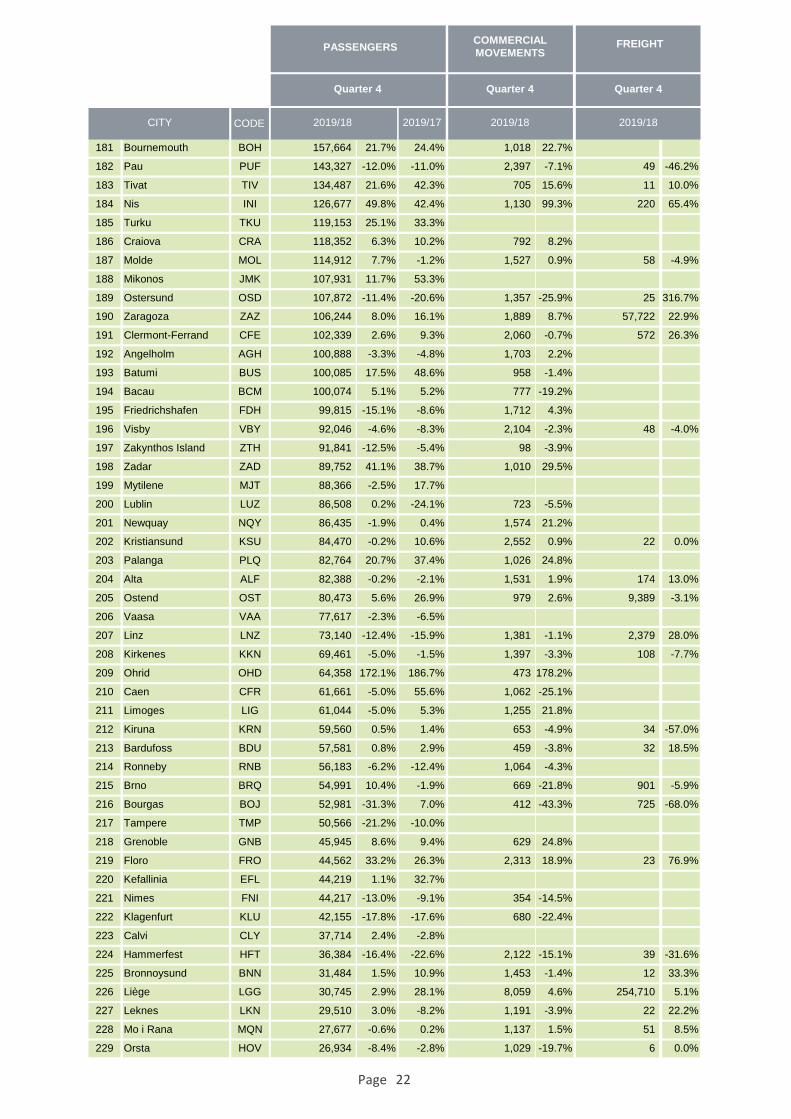
181 Bournemouth BOH 157,664 21.7% 24.4% 1,018 22.7% 3 0.0%
182 Pau PUF 143,327 -12.0% -11.0% 2,397 -7.1% 49 -46.2%
183 Tivat TIV 134,487 21.6% 42.3% 705 15.6% 11 10.0%
184 Nis INI 126,677 49.8% 42.4% 1,130 99.3% 220 65.4%
185 Turku TKU 119,153 25.1% 33.3% 3 0.0% 3 0.0%
186 Craiova CRA 118,352 6.3% 10.2% 792 8.2% 3 0.0%
187 Molde MOL 114,912 7.7% -1.2% 1,527 0.9% 58 -4.9%
188 Mikonos JMK 107,931 11.7% 53.3% 3 0.0% 3 0.0%
189 Ostersund OSD 107,872 -11.4% -20.6% 1,357 -25.9% 25 316.7%
190 Zaragoza ZAZ 106,244 8.0% 16.1% 1,889 8.7% 57,722 22.9%
191 Clermont-Ferrand CFE 102,339 2.6% 9.3% 2,060 -0.7% 572 26.3%
192 Angelholm AGH 100,888 -3.3% -4.8% 1,703 2.2% 3 0.0%
193 Batumi BUS 100,085 17.5% 48.6% 958 -1.4% 3 0.0%
194 Bacau BCM 100,074 5.1% 5.2% 777 -19.2% 3 0.0%
195 Friedrichshafen FDH 99,815 -15.1% -8.6% 1,712 4.3% 3 0.0%
196 Visby VBY 92,046 -4.6% -8.3% 2,104 -2.3% 48 -4.0%
197 Zakynthos Island ZTH 91,841 -12.5% -5.4% 98 -3.9% 3 0.0%
198 Zadar ZAD 89,752 41.1% 38.7% 1,010 29.5% 3 0.0%
199 Mytilene MJT 88,366 -2.5% 17.7% 3 0.0% 3 0.0%
200 Lublin LUZ 86,508 0.2% -24.1% 723 -5.5% 3 0.0%
201 Newquay NQY 86,435 -1.9% 0.4% 1,574 21.2% 3 0.0%
202 Kristiansund KSU 84,470 -0.2% 10.6% 2,552 0.9% 22 0.0%
203 Palanga PLQ 82,764 20.7% 37.4% 1,026 24.8% 3 0.0%
204 Alta ALF 82,388 -0.2% -2.1% 1,531 1.9% 174 13.0%
205 Ostend OST 80,473 5.6% 26.9% 979 2.6% 9,389 -3.1%
206 Vaasa VAA 77,617 -2.3% -6.5% 3 0.0% 3 0.0%
207 Linz LNZ 73,140 -12.4% -15.9% 1,381 -1.1% 2,379 28.0%
208 Kirkenes KKN 69,461 -5.0% -1.5% 1,397 -3.3% 108 -7.7%
209 Ohrid OHD 64,358 172.1% 186.7% 473 178.2% 3 0.0%
210 Caen CFR 61,661 -5.0% 55.6% 1,062 -25.1% 3 0.0%
211 Limoges LIG 61,044 -5.0% 5.3% 1,255 21.8% 3 0.0%
212 Kiruna KRN 59,560 0.5% 1.4% 653 -4.9% 34 -57.0%
213 Bardufoss BDU 57,581 0.8% 2.9% 459 -3.8% 32 18.5%
214 Ronneby RNB 56,183 -6.2% -12.4% 1,064 -4.3% 3 0.0%
215 Brno BRQ 54,991 10.4% -1.9% 669 -21.8% 901 -5.9%
216 Bourgas BOJ 52,981 -31.3% 7.0% 412 -43.3% 725 -68.0%
217 Tampere TMP 50,566 -21.2% -10.0% 3 0.0% 3 0.0%
218 Grenoble GNB 45,945 8.6% 9.4% 629 24.8% 3 0.0%
219 Floro FRO 44,562 33.2% 26.3% 2,313 18.9% 23 76.9%
220 Kefallinia EFL 44,219 1.1% 32.7% 3 0.0% 3 0.0%
221 Nimes FNI 44,217 -13.0% -9.1% 354 -14.5% 3 0.0%
222 Klagenfurt KLU 42,155 -17.8% -17.6% 680 -22.4% 3 0.0%
223 Calvi CLY 37,714 2.4% -2.8% 3 0.0% 3 0.0%
224 Hammerfest HFT 36,384 -16.4% -22.6% 2,122 -15.1% 39 -31.6%
225 Bronnoysund BNN 31,484 1.5% 10.9% 1,453 -1.4% 12 33.3%
226 Liège LGG 30,745 2.9% 28.1% 8,059 4.6% 254,710 5.1%
227 Leknes LKN 29,510 3.0% -8.2% 1,191 -3.9% 22 22.2%
228 Mo i Rana MQN 27,677 -0.6% 0.2% 1,137 1.5% 51 8.5%
229 Orsta HOV 26,934 -8.4% -2.8% 1,029 -19.7% 6 0.0%
Page 22
Quarter 4 Quarter 4 Quarter 4
2019/18 2019/18 2019/182019/17
PASSENGERSCOMMERCIAL
MOVEMENTSFREIGHT
CITY CODE
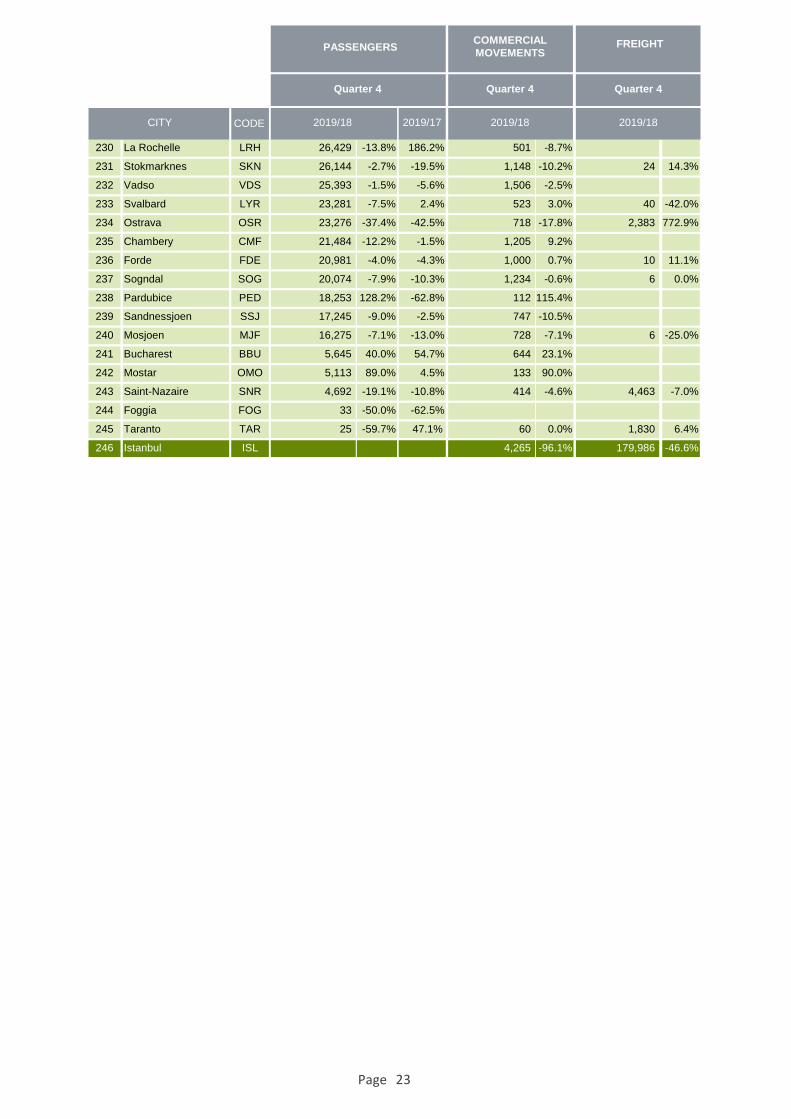
230 La Rochelle LRH 26,429 -13.8% 186.2% 501 -8.7% 3 0.0%
231 Stokmarknes SKN 26,144 -2.7% -19.5% 1,148 -10.2% 24 14.3%
232 Vadso VDS 25,393 -1.5% -5.6% 1,506 -2.5% 3 0.0%
233 Svalbard LYR 23,281 -7.5% 2.4% 523 3.0% 40 -42.0%
234 Ostrava OSR 23,276 -37.4% -42.5% 718 -17.8% 2,383 772.9%
235 Chambery CMF 21,484 -12.2% -1.5% 1,205 9.2% 3 0.0%
236 Forde FDE 20,981 -4.0% -4.3% 1,000 0.7% 10 11.1%
237 Sogndal SOG 20,074 -7.9% -10.3% 1,234 -0.6% 6 0.0%
238 Pardubice PED 18,253 128.2% -62.8% 112 115.4% 3 0.0%
239 Sandnessjoen SSJ 17,245 -9.0% -2.5% 747 -10.5% 3 0.0%
240 Mosjoen MJF 16,275 -7.1% -13.0% 728 -7.1% 6 -25.0%
241 Bucharest BBU 5,645 40.0% 54.7% 644 23.1% 3 0.0%
242 Mostar OMO 5,113 89.0% 4.5% 133 90.0% 3 0.0%
243 Saint-Nazaire SNR 4,692 -19.1% -10.8% 414 -4.6% 4,463 -7.0%
244 Foggia FOG 33 -50.0% 3 0.0% 3 0.0%
245 Taranto TAR 25 -59.7% 60 0.0% 1,830 6.4%
246 Istanbul ISL
-62.5%
47.1%
4,265 -96.1% 179,986 -46.6%
Page 23
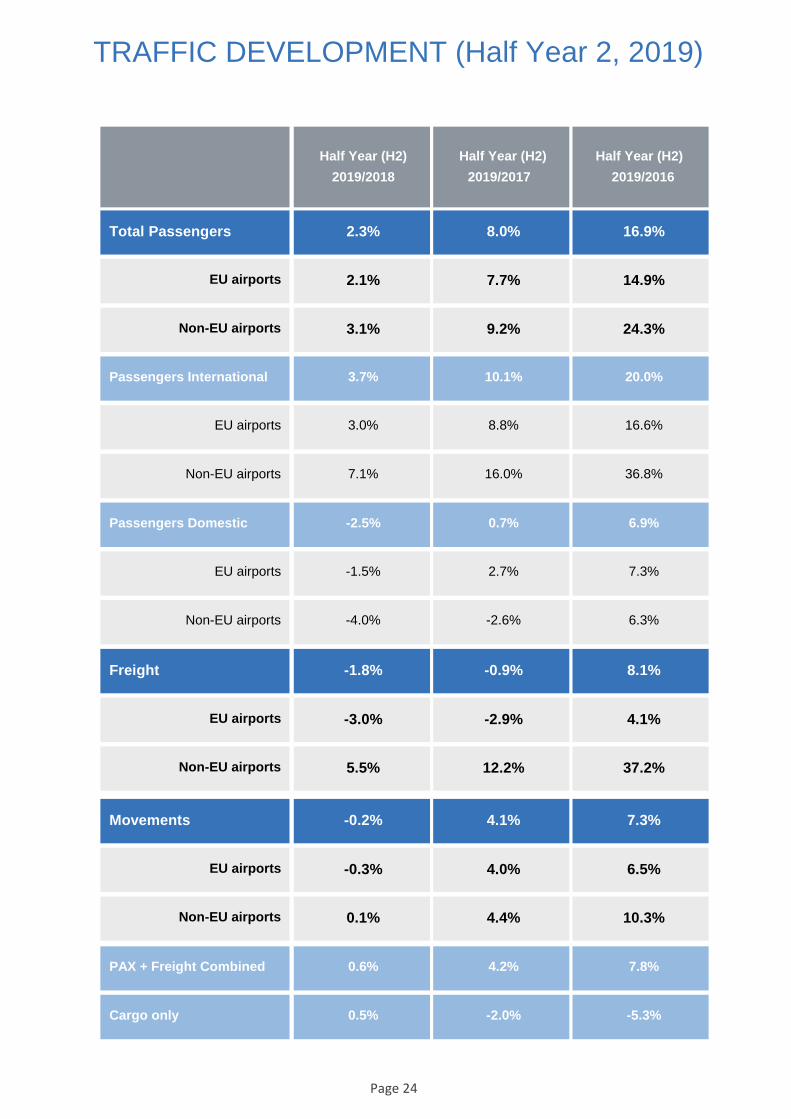
TRAFFIC DEVELOPMENT (Half Year 2, 2019)
Total Passengers
Non-EU airports
EU airports
Passengers International
Non-EU airports
EU airports
Passengers Domestic
Non-EU airports
EU airports
Freight
Non-EU airports
EU airports
Movements
Non-EU airports
EU airports
PAX + Freight Combined
Cargo only
2.3% 8.0% 16.9%
2.1% 7.7% 14.9%
3.1% 9.2% 24.3%
3.7% 10.1% 20.0%
3.0% 8.8% 16.6%
7.1% 16.0% 36.8%
-2.5% 0.7% 6.9%
-1.5% 2.7% 7.3%
-4.0% -2.6% 6.3%
-1.8% -0.9% 8.1%
-3.0% -2.9% 4.1%
5.5% 12.2% 37.2%
-0.2% 4.1% 7.3%
-0.3% 4.0% 6.5%
0.1% 4.4% 10.3%
0.6% 4.2% 7.8%
0.5% -2.0% -5.3%
Half Year (H2)
2019/2018 2019/2017 2019/2016
Half Year (H2) Half Year (H2)
Page 24
Iceland
-30.7%
Finland
4.4%
Sweden
-3.8%
Norway
0.4%
Ireland
2.9% UK
0.0% Netherlands
1.1%
Belgium3.1%
France
2.3%
Portugal
6.7%
Spain
3.3%
Italy
3.3%
Switzerland
0.8%
Luxembourg
9.9%
Germany
-0.6%
Poland
9.0%
Czech Republic
6.0%
Austria10.2%
Slovenia-12.1%
Croatia7.5%
Bosnia & Herz.11.9%
Albania14.9%
Malta
8.3%
Greece
1.3%
North Macedonia16.2%
Montenegro8.2%
Serbia
13.5%
Hungary
9.9%
Slovakia-3.3%
Romania
5.0%
Bulgaria
-4.2%
Cyprus
2.6%
Turkey
1.9%
Israel
9.4%
Georgia
-7.4%
Ukraine
23.7%
Russian Federation
4.1%
Moldova
5.3%
Estonia
7.0%
Latvia
11.3%
Lithuania
3.4%
Denmark
0.5%
PASSENGER DEVELOPMENT EUROPEAN COUNTRIES (Half Year 2, 2019 YoY)
Half Year 2, 2019 YoY
Belarus
12.2%
Armenia
13.4%
Page 25
GROUP 1
2019/2018
Over 25million pax
2019/2017
GROUP 2
2019/2018
Between 10 and 25million pax
2019/2017
GROUP 3
2019/2018
Between 5 and 10million pax
2019/2017
GROUP 4
2019/2018
Less than 5 million pax
2019/2017
2.2% 7.6% 3.2% 10.4% 2.7% 8.7% 0.9% 7.3%
PASSENGER TRAFFIC GROWTH BY TRAFFIC CATEGORY (Half Year 2, 2019)
Half Year 2 Half Year 2 Half Year 2
2019/18 2019/18 2019/182019/17
PASSENGERSCOMMERCIAL
MOVEMENTSFREIGHT
CITY CODE
1 London LHR 42,135,495 0.2% 3.1% 240,502 -0.6% 781,429 -7.4%
2 Paris CDG 39,812,657 3.9% 9.0% 257,143 2.0% 956,741 -5.3%
3 Amsterdam AMS 37,169,671 0.4% 2.6% 254,719 -0.9% 802,769 -7.9%
4 Frankfurt FRA 36,912,139 0.2% 6.9% 255,822 -1.4% 999,806 -5.4%
5 Istanbul IST 36,232,725 1.7% 3.2% 224,112 -2.3% 374,825 -41.4%
6 Madrid MAD 32,434,950 6.7% 15.8% 210,828 3.9% 296,160 9.9%
7 Barcelona BCN 27,852,337 4.6% 10.6% 172,643 2.3% 93,593 2.0%
8 Moscow SVO 26,529,152 4.7% 20.9% 194,354 3.0% 140,782 9.7%
9 Munich MUC 25,196,628 2.7% 7.5% 201,753 -0.6% 169,032 -5.5%
10 London LGW 24,348,335 -0.3% 0.9% 145,581 -1.4% 56,887 -5.6%
11 Rome FCO 22,981,710 0.4% 5.6% 157,567 -2.0% 98,651 -6.2%
12 Antalya AYT 22,320,387 12.4% 34.3% 120,913 9.3% 4,681 28.2%
13 Istanbul SAW 18,720,133 4.8% 16.8% 119,959 2.3% 29,248 -4.0%
14 Dublin DUB 17,362,655 3.2% 10.1% 118,053 1.3% 74,732 6.6%
15 Palma De Mallorca PMI 17,133,822 -0.4% 3.2% 114,135 -4.9% 4,500 -9.5%
16 Vienna VIE 16,995,934 11.8% 29.1% 138,128 6.7% 106,887 -4.9%
17 Zürich ZRH 16,564,924 0.3% 5.8% 131,425 -2.9% 168,418 -8.7%
18 Lisbon LIS 16,560,897 8.0% 14.0% 113,372 1.6% 75,588 18.3%
19 Milan MXP 16,278,534 22.1% 36.6% 127,633 26.0% 281,422 2.1%
20 Paris ORY 15,869,670 -7.3% -3.7% 107,613 -9.0% 46,004 1.5%
21 Copenhagen CPH 15,788,221 -0.2% 4.3% 130,818 -1.3% 6 0.0%
22 Manchester MAN 15,784,034 2.3% 4.6% 101,765 0.2% 56,268 -6.7%
23 Moscow DME 15,504,461 -1.6% -7.6% 109,621 -4.2% 57,091 -7.7%
24 Oslo OSL 14,750,908 0.2% 4.2% 124,816 -2.0% 84,682 0.9%
25 London STN 14,604,154 -2.4% 6.1% 93,003 -3.4% 121,278 6.6%
26 Athens ATH 14,305,590 4.6% 16.2% 113,330 2.0% 43,688 3.3%
27 Brussels BRU 14,059,899 3.4% 6.4% 113,574 0.8% 247,909 -5.8%
28 Tel-Aviv TLV 13,981,943 9.4% 18.6% 75,422 8.6% 137,173 0.8%
29 Düsseldorf DUS 13,535,222 0.7% 5.3% 110,001 -1.1% 33,554 -11.9%
30 Moscow VKO 13,279,700 10.1% 52.8% 83,451 -2.8% 25,673 -19.6%
31 Stockholm ARN 13,234,703 -4.1% -4.5% 113,062 -3.6% 36,240 4.2%
32 Berlin TXL 12,435,625 -1.1% 20.1% 93,928 -6.2% 11,502 -20.1%
33 Helsinki HEL 11,238,200 4.7% 14.0% 95,990 -0.1% 110,781 10.6%
Page 26
Half Year 2 Half Year 2 Half Year 2
2019/18 2019/18 2019/182019/17
PASSENGERSCOMMERCIAL
MOVEMENTSFREIGHT
CITY CODE
34 St Petersburg LED 10,813,489 6.3% 20.4% 87,540 -0.3% 15,394 3.5%
35 Málaga AGP 10,624,338 2.7% 3.9% 70,260 0.1% 1,798 12.9%
36 Warsaw WAW 10,267,263 5.3% 17.0% 96,017 2.4% 53,090 7.7%
37 Prague PRG 9,963,035 6.8% 15.2% 75,295 0.0% 40,185 6.1%
38 London LTN 9,481,419 7.0% 13.9% 59,537 5.8% 19,201 25.8%
39 Hamburg HAM 9,063,847 -1.2% -3.5% 71,881 -3.0% 11,883 -13.3%
40 Geneva GVA 8,808,692 1.6% 3.5% 70,839 -1.4% 23,852 -26.2%
41 Budapest BUD 8,788,612 9.9% 23.5% 60,556 6.8% 47,058 -7.4%
42 Kyiv KBP 8,559,917 21.8% 46.6% 57,909 15.2% 23,259 8.8%
43 Alicante ALC 8,198,150 7.1% 9.2% 53,178 4.2% 2,104 4.6%
44 Bucharest OTP 7,852,593 4.8% 14.0% 62,425 -1.1% 17,988 -1.2%
45 Nice NCE 7,819,564 3.6% 6.7% 90,037 1.8% 6,518 -13.7%
46 Edinburgh EDI 7,727,585 -0.1% 7.6% 65,724 0.5% 9,917 -6.5%
47 Milan BGY 7,383,359 8.9% 13.5% 48,549 8.1% 59,163 -2.6%
48 Porto OPO 6,951,879 9.6% 20.5% 50,924 5.0% 19,744 11.5%
49 Stuttgart STR 6,916,396 6.1% 15.1% 61,107 2.6% 12,733 -1.7%
50 Cologne CGN 6,755,432 -4.5% 0.0% 69,405 -1.5% 403,237 -5.9%
51 Birmingham BHX 6,738,612 0.2% -2.8% 52,214 -3.3% 15,383 -11.3%
52 Ankara ESB 6,715,118 -16.3% -25.5% 43,778 -16.4% 6,442 30.2%
53 Gran Canaria LPA 6,632,969 -4.1% -2.7% 59,632 -4.8% 10,618 7.2%
54 Izmir ADB 6,558,076 -5.7% -8.9% 40,667 -6.4% 18,655 155.1%
55 Venice VCE 6,273,449 1.0% 9.2% 47,672 -3.1% 26,721 -8.2%
56 Lyon LYS 6,050,658 4.4% 12.0% 57,169 -0.1% 29,379 -2.4%
57 Naples NAP 5,902,019 8.2% 18.3% 41,667 6.6% 4,579 13.8%
58 Berlin SXF 5,754,461 -12.2% -14.0% 40,294 -13.6% 6,207 5.5%
59 Catania CTA 5,559,672 1.6% 10.6% 38,483 -2.0% 745 -61.1%
60 Tenerife TFS 5,513,664 -2.1% -2.9% 32,701 -3.9% 1,031 -18.8%
61 Marseille MRS 5,410,984 7.9% 12.2% 50,326 2.7% 29,990 4.7%
62 Heraklion HER 5,168,778 -2.4% 2.9% 6 0.0% 6 0.0%
63 Faro FAO 5,035,912 1.4% 1.4% 32,362 -0.5% 41 -10.9%
64 Ibiza IBZ 4,971,488 0.1% -0.4% 36,822 -2.4% 729 -13.0%
65 Bologna BLQ 4,954,384 10.8% 13.5% 37,664 7.2% 18,577 -9.0%
66 Larnaca LCA 4,895,807 2.1% 4.5% 33,322 -3.0% 15,142 -1.2%
67 Toulouse TLS 4,888,103 -0.7% 2.2% 43,970 -1.3% 31,716 0.6%
68 Bristol BRS 4,812,113 2.5% 11.7% 28,731 -4.7% 6 0.0%
69 Glasgow GLA 4,669,002 -8.7% -11.9% 40,520 -6.1% 6,543 -24.2%
70 Krakow KRK 4,603,397 28.7% 47.3% 31,503 22.1% 614 -3.0%
71 Valencia VLC 4,507,900 7.7% 19.7% 34,410 4.1% 7,091 -3.0%
72 Charleroi CRL 4,286,005 2.3% 4.6% 25,648 1.6% 261 -13.9%
73 Riga RIX 4,241,204 11.3% 26.6% 43,360 4.3% 7,566 -6.7%
74 Bordeaux BOD 4,218,499 14.4% 28.0% 35,332 9.3% 5,483 0.6%
75 Malta MLA 4,062,756 8.3% 19.9% 28,271 6.8% 8,554 8.0%
76 Nantes NTE 3,861,175 15.3% 29.0% 29,642 -4.0% 4,564 9.7%
77 Thessaloniki SKG 3,841,247 -0.3% 9.6% 6 0.0% 6 0.0%
78 Palermo PMO 3,824,013 4.6% 18.3% 27,441 3.6% 233 33.1%
79 Sevilla SVQ 3,823,000 15.4% 42.0% 27,626 15.7% 5,251 -5.0%
80 Keflavik KEF 3,774,582 -30.7% -24.2% 24,445 -27.8% 25,933 -0.1%
81 Sochi AER 3,748,710 3.7% 15.5% 28,598 4.3% 2,823 1.9%
82 Lanzarote ACE 3,701,148 -2.6% -5.2% 29,197 -2.8% 599 -27.0%
Page 27
Half Year 2 Half Year 2 Half Year 2
2019/18 2019/18 2019/182019/17
PASSENGERSCOMMERCIAL
MOVEMENTSFREIGHT
CITY CODE
83 Rhodes RHO 3,654,145 0.0% 2.9% 6 0.0% 6 0.0%
84 Sofia SOF 3,644,135 1.8% 8.6% 27,827 0.4% 11,150 10.8%
85 Belgrade BEG 3,549,178 11.8% 17.0% 34,183 9.1% 8,554 -30.7%
86 Eindhoven EIN 3,535,036 8.6% 18.7% 20,492 7.6% 6 0.0%
87 Hanover HAJ 3,511,729 -1.5% 6.1% 29,555 -2.1% 7,538 103.8%
88 Göteborg GOT 3,492,063 -1.7% -1.8% 32,488 -3.1% 9,702 18.1%
89 Bergen BGO 3,369,139 2.4% 6.4% 44,151 2.3% 2,354 0.0%
90 Bilbao BIO 3,125,554 7.1% 18.4% 24,576 2.1% 476 -28.0%
91 Tenerife TFN 3,084,019 6.1% 19.0% 36,633 2.5% 5,746 -8.7%
92 Bari BRI 3,037,676 8.1% 19.1% 21,302 5.9% 144 26.3%
93 Rome CIA 2,974,677 0.9% 1.1% 17,724 0.5% 9,367 1.4%
94 Pisa PSA 2,931,990 -1.7% 3.8% 20,511 -1.8% 6,486 12.5%
95 Fuerteventura FUE 2,891,282 -8.0% -9.7% 23,413 -8.2% 374 -17.6%
96 Minsk MSQ 2,889,983 12.2% 25.1% 28,655 8.0% 6,442 28.7%
97 Newcastle NCL 2,854,427 -3.0% -3.0% 21,361 -3.8% 402 54.6%
98 Bodrum BJV 2,811,833 4.5% 21.9% 17,411 1.2% 74 111.4%
99 Cagliari CAG 2,726,184 8.4% 13.6% 19,915 10.5% 519 -34.3%
100 London LCY 2,653,265 6.0% 14.2% 38,963 2.1% 6 0.0%
101 Vilnius VNO 2,618,434 0.9% 48.5% 23,515 0.6% 6,265 13.7%
102 East Midlands EMA 2,569,663 -4.4% -4.2% 31,357 -1.9% 174,080 0.7%
103 Adana ADA 2,554,688 -7.9% -13.4% 15,562 -10.8% 2,322 65.6%
104 Luxembourg LUX 2,357,152 9.9% 20.8% 35,916 3.9% 451,877 -0.7%
105 Nüremberg NUE 2,298,404 -7.8% -1.6% 22,716 -8.1% 2,576 -19.3%
106 Menorca MAH 2,234,503 0.4% 0.0% 17,991 -1.0% 651 2.2%
107 Trondheim TRD 2,211,929 -1.9% -0.5% 25,617 -2.2% 1,106 4.5%
108 Stavanger SVG 2,196,627 0.3% 2.8% 32,290 2.2% 6,374 17.8%
109 Split SPU 2,192,389 4.6% 13.0% 16,796 1.8% 138 -6.8%
110 Corfou CFU 2,179,977 -3.2% 8.6% 6 0.0% 6 0.0%
111 Bourgas BOJ 2,147,745 -11.1% -5.1% 13,340 -14.5% 1,883 -52.7%
112 Billund BLL 2,004,035 6.1% 7.7% 20,516 4.4% 38,501 2.6%
113 Trabzon TZX 1,938,345 -8.6% -18.4% 12,527 -4.3% 400 69.5%
114 Turin TRN 1,931,290 -5.7% -6.7% 16,505 -12.6% 91 -67.8%
115 Tirana TIA 1,926,668 14.9% 27.6% 15,026 14.2% 1,001 7.2%
116 Zagreb ZAG 1,897,879 1.9% 8.4% 21,438 1.4% 4,109 -19.8%
117 Wroclaw WRO 1,875,377 3.1% 22.3% 14,427 -0.2% 130 -23.5%
118 Chania CHQ 1,838,693 1.0% -1.0% 6 0.0% 6 0.0%
119 Dubrovnik DBV 1,836,543 12.2% 21.7% 13,828 7.6% 66 -25.8%
120 Tbilisi TBS 1,822,054 -14.6% -2.9% 17,458 -15.8% 13,841 -9.4%
121 Kos KGS 1,787,302 -0.9% 10.5% 6 0.0% 6 0.0%
122 Yerevan EVN 1,765,977 13.4% 27.3% 14,443 19.6% 11,524 17.4%
123 Tallinn TLL 1,749,771 7.0% 19.5% 20,600 -6.3% 4,023 -7.7%
124 Paphos PFO 1,733,717 4.1% 17.6% 10,483 3.1% 126 -18.2%
125 Chisinau KIV 1,651,632 5.3% 7.3% 14,177 -4.8% 1,428 1.6%
126 Funchal FNC 1,640,618 -0.6% -0.3% 11,976 -4.4% 2,165 28.0%
127 Treviso TSF 1,606,398 -5.5% 2.8% 9,306 -6.5% 6 0.0%
128 Cluj CLJ 1,586,245 6.6% 8.3% 12,949 4.1% 1,804 19.7%
129 Rostov ROV 1,581,077 -7.9% 5.9% 12,845 -9.1% 2,334 -7.3%
130 Aberdeen ABZ 1,535,384 -3.6% -3.7% 41,133 0.1% 3,066 -4.6%
131 Florence FLR 1,528,491 7.6% 8.6% 15,542 7.6% 21 -30.0%
Page 28
Half Year 2 Half Year 2 Half Year 2
2019/18 2019/18 2019/182019/17
PASSENGERSCOMMERCIAL
MOVEMENTSFREIGHT
CITY CODE
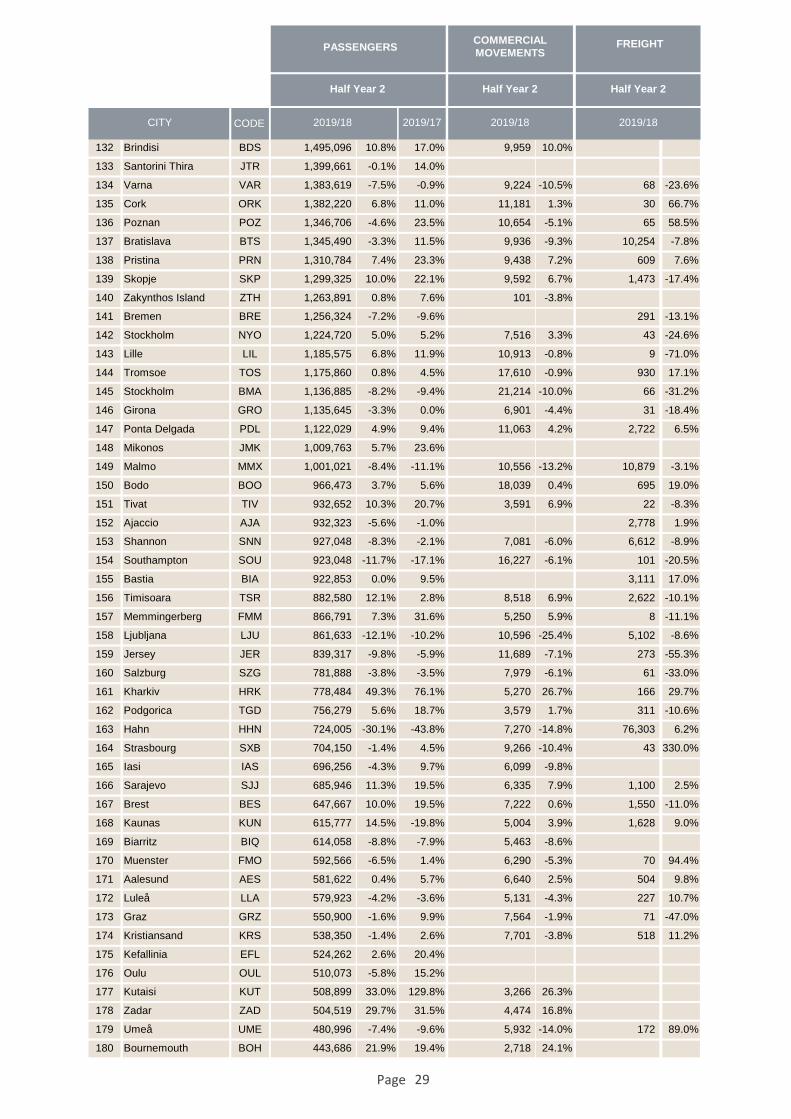
132 Brindisi BDS 1,495,096 10.8% 17.0% 9,959 10.0% 6 0.0%
133 Santorini Thira JTR 1,399,661 -0.1% 14.0% 6 0.0% 6 0.0%
134 Varna VAR 1,383,619 -7.5% -0.9% 9,224 -10.5% 68 -23.6%
135 Cork ORK 1,382,220 6.8% 11.0% 11,181 1.3% 30 66.7%
136 Poznan POZ 1,346,706 -4.6% 23.5% 10,654 -5.1% 65 58.5%
137 Bratislava BTS 1,345,490 -3.3% 11.5% 9,936 -9.3% 10,254 -7.8%
138 Pristina PRN 1,310,784 7.4% 23.3% 9,438 7.2% 609 7.6%
139 Skopje SKP 1,299,325 10.0% 22.1% 9,592 6.7% 1,473 -17.4%
140 Zakynthos Island ZTH 1,263,891 0.8% 7.6% 101 -3.8% 6 0.0%
141 Bremen BRE 1,256,324 -7.2% -9.6% 6 0.0% 291 -13.1%
142 Stockholm NYO 1,224,720 5.0% 5.2% 7,516 3.3% 43 -24.6%
143 Lille LIL 1,185,575 6.8% 11.9% 10,913 -0.8% 9 -71.0%
144 Tromsoe TOS 1,175,860 0.8% 4.5% 17,610 -0.9% 930 17.1%
145 Stockholm BMA 1,136,885 -8.2% -9.4% 21,214 -10.0% 66 -31.2%
146 Girona GRO 1,135,645 -3.3% 0.0% 6,901 -4.4% 31 -18.4%
147 Ponta Delgada PDL 1,122,029 4.9% 9.4% 11,063 4.2% 2,722 6.5%
148 Mikonos JMK 1,009,763 5.7% 23.6% 6 0.0% 6 0.0%
149 Malmo MMX 1,001,021 -8.4% -11.1% 10,556 -13.2% 10,879 -3.1%
150 Bodo BOO 966,473 3.7% 5.6% 18,039 0.4% 695 19.0%
151 Tivat TIV 932,652 10.3% 20.7% 3,591 6.9% 22 -8.3%
152 Ajaccio AJA 932,323 -5.6% -1.0% 6 0.0% 2,778 1.9%
153 Shannon SNN 927,048 -8.3% -2.1% 7,081 -6.0% 6,612 -8.9%
154 Southampton SOU 923,048 -11.7% -17.1% 16,227 -6.1% 101 -20.5%
155 Bastia BIA 922,853 0.0% 9.5% 6 0.0% 3,111 17.0%
156 Timisoara TSR 882,580 12.1% 2.8% 8,518 6.9% 2,622 -10.1%
157 Memmingerberg FMM 866,791 7.3% 31.6% 5,250 5.9% 8 -11.1%
158 Ljubljana LJU 861,633 -12.1% -10.2% 10,596 -25.4% 5,102 -8.6%
159 Jersey JER 839,317 -9.8% -5.9% 11,689 -7.1% 273 -55.3%
160 Salzburg SZG 781,888 -3.8% -3.5% 7,979 -6.1% 61 -33.0%
161 Kharkiv HRK 778,484 49.3% 76.1% 5,270 26.7% 166 29.7%
162 Podgorica TGD 756,279 5.6% 18.7% 3,579 1.7% 311 -10.6%
163 Hahn HHN 724,005 -30.1% -43.8% 7,270 -14.8% 76,303 6.2%
164 Strasbourg SXB 704,150 -1.4% 4.5% 9,266 -10.4% 43 330.0%
165 Iasi IAS 696,256 -4.3% 9.7% 6,099 -9.8% 6 0.0%
166 Sarajevo SJJ 685,946 11.3% 19.5% 6,335 7.9% 1,100 2.5%
167 Brest BES 647,667 10.0% 19.5% 7,222 0.6% 1,550 -11.0%
168 Kaunas KUN 615,777 14.5% -19.8% 5,004 3.9% 1,628 9.0%
169 Biarritz BIQ 614,058 -8.8% -7.9% 5,463 -8.6% 6 0.0%
170 Muenster FMO 592,566 -6.5% 1.4% 6,290 -5.3% 70 94.4%
171 Aalesund AES 581,622 0.4% 5.7% 6,640 2.5% 504 9.8%
172 Luleå LLA 579,923 -4.2% -3.6% 5,131 -4.3% 227 10.7%
173 Graz GRZ 550,900 -1.6% 9.9% 7,564 -1.9% 71 -47.0%
174 Kristiansand KRS 538,350 -1.4% 2.6% 7,701 -3.8% 518 11.2%
175 Kefallinia EFL 524,262 2.6% 20.4% 6 0.0% 6 0.0%
176 Oulu OUL 510,073 -5.8% 15.2% 6 0.0% 6 0.0%
177 Kutaisi KUT 508,899 33.0% 129.8% 3,266 26.3% 6 0.0%
178 Zadar ZAD 504,519 29.7% 31.5% 4,474 16.8% 6 -25.0%
179 Umeå UME 480,996 -7.4% -9.6% 5,932 -14.0% 172 89.0%
180 Bournemouth BOH 443,686 21.9% 19.4% 2,718 24.1% 6 0.0%
Page 29
Half Year 2 Half Year 2 Half Year 2
2019/18 2019/18 2019/182019/17
PASSENGERSCOMMERCIAL
MOVEMENTSFREIGHT
CITY CODE
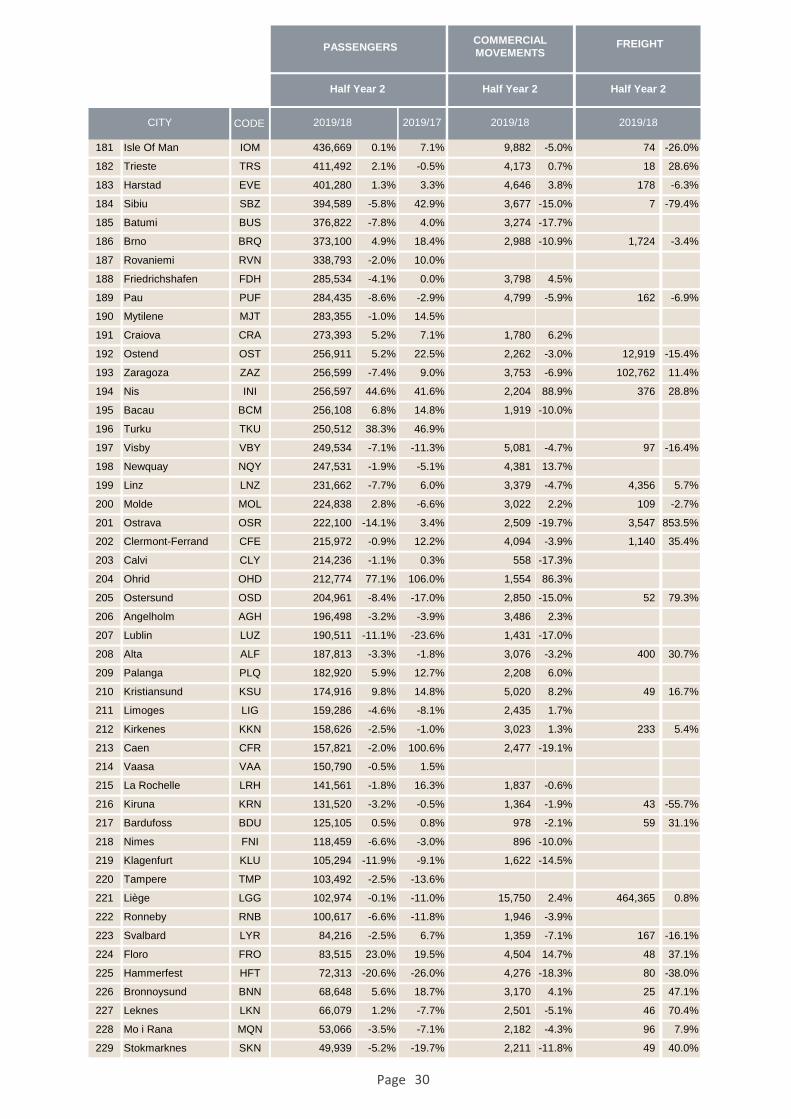
181 Isle Of Man IOM 436,669 0.1% 7.1% 9,882 -5.0% 74 -26.0%
182 Trieste TRS 411,492 2.1% -0.5% 4,173 0.7% 18 28.6%
183 Harstad EVE 401,280 1.3% 3.3% 4,646 3.8% 178 -6.3%
184 Sibiu SBZ 394,589 -5.8% 42.9% 3,677 -15.0% 7 -79.4%
185 Batumi BUS 376,822 -7.8% 4.0% 3,274 -17.7% 6 0.0%
186 Brno BRQ 373,100 4.9% 18.4% 2,988 -10.9% 1,724 -3.4%
187 Rovaniemi RVN 338,793 -2.0% 10.0% 6 0.0% 6 0.0%
188 Friedrichshafen FDH 285,534 -4.1% 0.0% 3,798 4.5% 6 0.0%
189 Pau PUF 284,435 -8.6% -2.9% 4,799 -5.9% 162 -6.9%
190 Mytilene MJT 283,355 -1.0% 14.5% 6 0.0% 6 0.0%
191 Craiova CRA 273,393 5.2% 7.1% 1,780 6.2% 6 0.0%
192 Ostend OST 256,911 5.2% 22.5% 2,262 -3.0% 12,919 -15.4%
193 Zaragoza ZAZ 256,599 -7.4% 9.0% 3,753 -6.9% 102,762 11.4%
194 Nis INI 256,597 44.6% 41.6% 2,204 88.9% 376 28.8%
195 Bacau BCM 256,108 6.8% 14.8% 1,919 -10.0% 6 0.0%
196 Turku TKU 250,512 38.3% 46.9% 6 0.0% 6 0.0%
197 Visby VBY 249,534 -7.1% -11.3% 5,081 -4.7% 97 -16.4%
198 Newquay NQY 247,531 -1.9% -5.1% 4,381 13.7% 6 0.0%
199 Linz LNZ 231,662 -7.7% 6.0% 3,379 -4.7% 4,356 5.7%
200 Molde MOL 224,838 2.8% -6.6% 3,022 2.2% 109 -2.7%
201 Ostrava OSR 222,100 -14.1% 3.4% 2,509 -19.7% 3,547 853.5%
202 Clermont-Ferrand CFE 215,972 -0.9% 12.2% 4,094 -3.9% 1,140 35.4%
203 Calvi CLY 214,236 -1.1% 0.3% 558 -17.3% 6 0.0%
204 Ohrid OHD 212,774 77.1% 106.0% 1,554 86.3% 6 0.0%
205 Ostersund OSD 204,961 -8.4% -17.0% 2,850 -15.0% 52 79.3%
206 Angelholm AGH 196,498 -3.2% -3.9% 3,486 2.3% 6 0.0%
207 Lublin LUZ 190,511 -11.1% -23.6% 1,431 -17.0% 6 0.0%
208 Alta ALF 187,813 -3.3% -1.8% 3,076 -3.2% 400 30.7%
209 Palanga PLQ 182,920 5.9% 12.7% 2,208 6.0% 6 0.0%
210 Kristiansund KSU 174,916 9.8% 14.8% 5,020 8.2% 49 16.7%
211 Limoges LIG 159,286 -4.6% -8.1% 2,435 1.7% 6 0.0%
212 Kirkenes KKN 158,626 -2.5% -1.0% 3,023 1.3% 233 5.4%
213 Caen CFR 157,821 -2.0% 100.6% 2,477 -19.1% 6 0.0%
214 Vaasa VAA 150,790 -0.5% 1.5% 6 0.0% 6 0.0%
215 La Rochelle LRH 141,561 -1.8% 16.3% 1,837 -0.6% 6 0.0%
216 Kiruna KRN 131,520 -3.2% -0.5% 1,364 -1.9% 43 -55.7%
217 Bardufoss BDU 125,105 0.5% 0.8% 978 -2.1% 59 31.1%
218 Nimes FNI 118,459 -6.6% -3.0% 896 -10.0% 6 0.0%
219 Klagenfurt KLU 105,294 -11.9% -9.1% 1,622 -14.5% 6 0.0%
220 Tampere TMP 103,492 -2.5% -13.6% 6 0.0% 6 0.0%
221 Liège LGG 102,974 -0.1% -11.0% 15,750 2.4% 464,365 0.8%
222 Ronneby RNB 100,617 -6.6% -11.8% 1,946 -3.9% 6 0.0%
223 Svalbard LYR 84,216 -2.5% 6.7% 1,359 -7.1% 167 -16.1%
224 Floro FRO 83,515 23.0% 19.5% 4,504 14.7% 48 37.1%
225 Hammerfest HFT 72,313 -20.6% -26.0% 4,276 -18.3% 80 -38.0%
226 Bronnoysund BNN 68,648 5.6% 18.7% 3,170 4.1% 25 47.1%
227 Leknes LKN 66,079 1.2% -7.7% 2,501 -5.1% 46 70.4%
228 Mo i Rana MQN 53,066 -3.5% -7.1% 2,182 -4.3% 96 7.9%
229 Stokmarknes SKN 49,939 -5.2% -19.7% 2,211 -11.8% 49 40.0%
Page 30
Half Year 2 Half Year 2 Half Year 2
2019/18 2019/18 2019/182019/17
PASSENGERSCOMMERCIAL
MOVEMENTSFREIGHT
CITY CODE
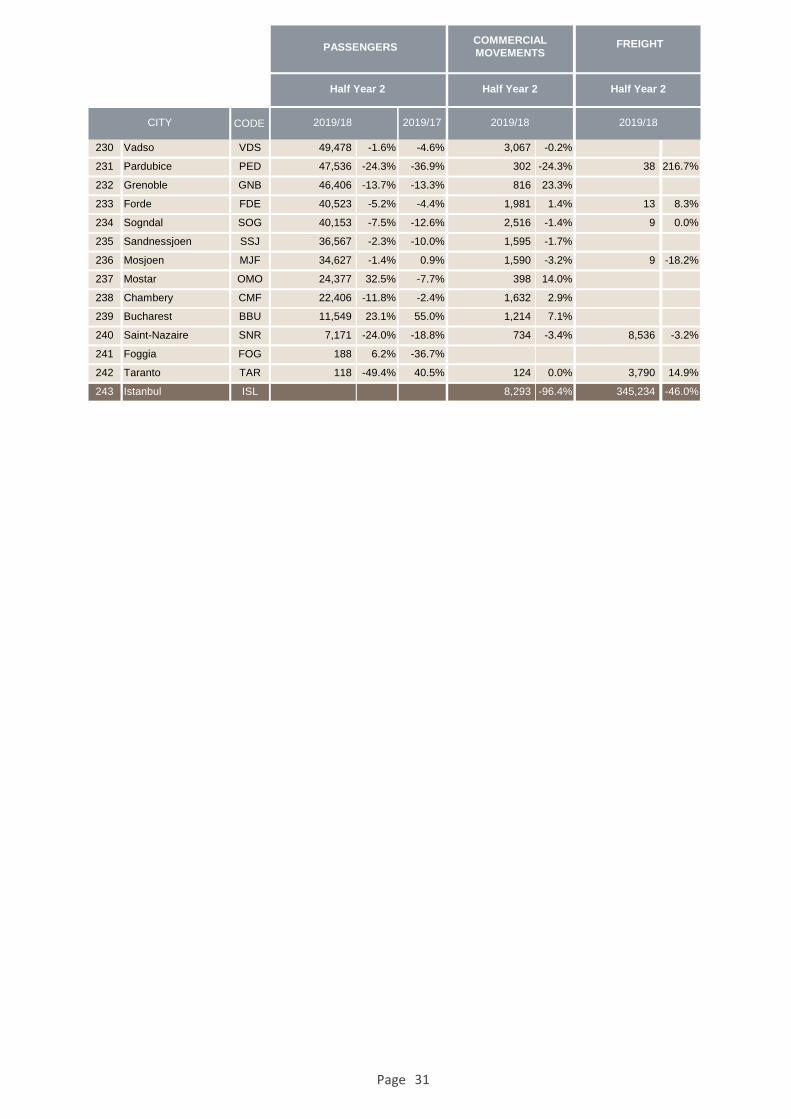
230 Vadso VDS 49,478 -1.6% -4.6% 3,067 -0.2% 6 0.0%
231 Pardubice PED 47,536 -24.3% -36.9% 302 -24.3% 38 216.7%
232 Grenoble GNB 46,406 -13.7% -13.3% 816 23.3% 6 0.0%
233 Forde FDE 40,523 -5.2% -4.4% 1,981 1.4% 13 8.3%
234 Sogndal SOG 40,153 -7.5% -12.6% 2,516 -1.4% 9 0.0%
235 Sandnessjoen SSJ 36,567 -2.3% -10.0% 1,595 -1.7% 6 0.0%
236 Mosjoen MJF 34,627 -1.4% 0.9% 1,590 -3.2% 9 -18.2%
237 Mostar OMO 24,377 32.5% -7.7% 398 14.0% 6 0.0%
238 Chambery CMF 22,406 -11.8% -2.4% 1,632 2.9% 6 0.0%
239 Bucharest BBU 11,549 23.1% 55.0% 1,214 7.1% 6 0.0%
240 Saint-Nazaire SNR 7,171 -24.0% -18.8% 734 -3.4% 8,536 -3.2%
241 Foggia FOG 188 6.2% -36.7% 6 0.0% 6 0.0%
242 Taranto TAR 118 -49.4% 40.5% 124 0.0% 3,790 14.9%
243 Istanbul ISL 8,293 -96.4% 345,234 -46.0%
Page 31
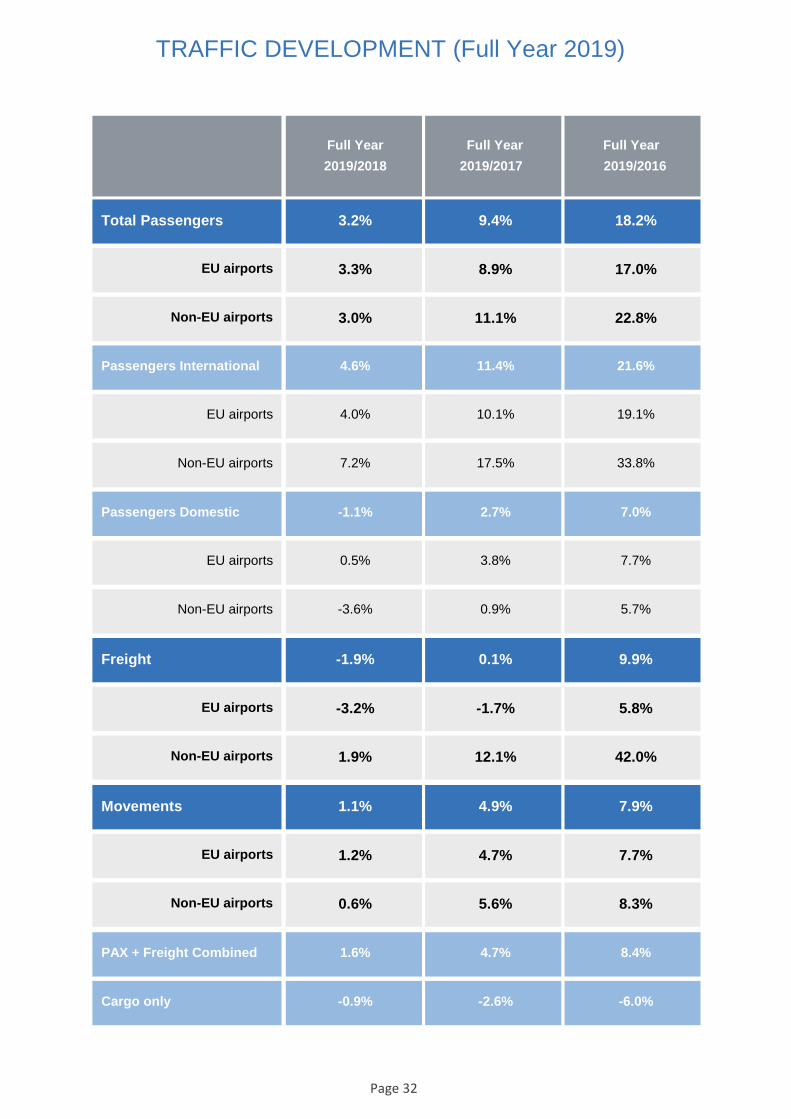
TRAFFIC DEVELOPMENT (Full Year 2019)
Total Passengers
Non-EU airports
EU airports
Passengers International
Non-EU airports
EU airports
Passengers Domestic
Non-EU airports
EU airports
Freight
Non-EU airports
EU airports
Movements
Non-EU airports
EU airports
PAX + Freight Combined
Cargo only
3.2% 9.4% 18.2%
3.3% 8.9% 17.0%
3.0% 11.1% 22.8%
4.6% 11.4% 21.6%
4.0% 10.1% 19.1%
7.2% 17.5% 33.8%
-1.1% 2.7% 7.0%
0.5% 3.8% 7.7%
-3.6% 0.9% 5.7%
-1.9% 0.1% 9.9%
-3.2% -1.7% 5.8%
1.9% 12.1% 42.0%
1.1% 4.9% 7.9%
1.2% 4.7% 7.7%
0.6% 5.6% 8.3%
1.6% 4.7% 8.4%
-0.9% -2.6% -6.0%
Full Year
2019/2018 2019/2017 2019/2016
Full Year Full Year
Page 32

Iceland
-26.1%
Finland
4.5%
Sweden
-4.0%
Norway
0.6%
Ireland
4.1% UK
1.4% Netherlands
1.5%
Belgium2.7%
France
3.9%
Portugal
6.9%
Spain
4.4%
Italy
4.0%
Switzerland
1.4%
Luxembourg
9.5%
Germany
1.9%
Poland
8.9%
Czech Republic
5.3%
Austria14.6%
Slovenia-5.0%
Croatia8.6%
Bosnia & Herz.9.5%
Albania13.3%
Malta
7.1%
Greece
2.4%
North Macedonia14.2%
Montenegro8.6%
Serbia
9.9%
Hungary
8.8%
Slovakia-0.1%
Romania
6.5%
Bulgaria
-3.5%
Cyprus
3.0%
Turkey
0.4%
Israel
8.1%
Georgia
3.3%
Ukraine
22.3%
Russian Federation
5.8%
Moldova
5.9%
Estonia
8.6%
Latvia
10.5%
Lithuania
4.0%
Denmark
0.4%
PASSENGER DEVELOPMENT EUROPEAN COUNTRIES (Full Year 2019 YoY)
Full Year 2019 YoY
Belarus
12.5%
Armenia
12.3%
Page 33
GROUP 1
2019/2018
Over 25million pax
3.0%
2019/2017
8.9%
GROUP 2
2019/2018
Between 10 and 25million pax
4.8%
2019/2017
11.6%
GROUP 3
2019/2018
Between 5 and 10million pax
3.0%
2019/2017
10.1%
GROUP 4
2019/2018
Less than 5 million pax
1.6%
2019/2017
8.4%
PASSENGER TRAFFIC GROWTH BY TRAFFIC CATEGORY (Full Year 2019)
Full Year 2019 Full Year 2019 Full Year 2019
2019/18 2019/18 2019/182019/17
PASSENGERSCOMMERCIAL
MOVEMENTSFREIGHT
CITY CODE
1 London LHR 80,888,637 1.0% 3.7% 475,861 0.0% 1,587,382 -5.8%
2 Paris CDG 76,171,198 5.5% 9.6% 498,170 3.6% 1,902,870 -3.7%
3 Amsterdam AMS 71,706,999 0.9% 4.7% 496,826 -0.5% 1,570,261 -8.2%
4 Frankfurt FRA 70,556,072 1.5% 9.4% 502,634 0.3% 2,004,746 -3.9%
5 Madrid MAD 61,704,993 6.6% 15.6% 409,338 4.1% 558,568 7.7%
6 Barcelona BCN 52,663,623 5.0% 11.4% 332,213 3.0% 177,272 2.5%
7 Istanbul IST 52,461,982 -23.1% -17.8% 326,679 -27.1% 600,554 -51.5%
8 Moscow SVO 49,932,752 8.9% 24.5% 379,140 8.4% 248,492 4.8%
9 Munich MUC 47,942,348 3.7% 7.5% 395,951 0.9% 331,614 -5.7%
10 London LGW 46,572,595 1.1% 2.2% 284,161 0.4% 110,398 -2.0%
11 Rome FCO 43,527,905 1.2% 6.2% 306,640 0.5% 186,483 -6.6%
12 Antalya AYT 35,990,054 12.8% 38.6% 199,512 9.9% 9,042 26.6%
13 Istanbul SAW 35,465,508 4.1% 16.5% 230,281 2.5% 58,131 -4.9%
14 Dublin DUB 32,909,209 4.5% 11.2% 228,792 2.7% 137,262 -4.4%
15 Paris ORY 31,854,336 -3.8% -0.6% 218,340 -4.7% 89,312 1.9%
16 Vienna VIE 31,662,189 17.1% 29.8% 264,964 10.7% 204,742 -5.2%
17 Zürich ZRH 31,463,915 1.3% 7.2% 258,142 -0.9% 334,648 -7.7%
18 Lisbon LIS 31,172,801 7.4% 16.9% 217,701 1.9% 141,650 14.1%
19 Copenhagen CPH 30,196,885 -0.2% 3.6% 256,435 -0.9% 0 -
20 Palma De Mallorca PMI 29,717,657 2.2% 6.3% 203,037 -1.4% 9,021 -10.0%
21 Manchester MAN 29,444,858 3.8% 5.5% 194,168 1.0% 108,533 -4.9%
22 Milan MXP 28,827,804 16.6% 30.1% 225,506 18.7% 544,977 -2.4%
23 Oslo OSL 28,388,874 0.3% 4.1% 244,366 -2.0% 166,540 1.9%
24 Moscow DME 28,252,337 -3.9% -7.8% 207,114 -6.8% 105,862 -12.0%
25 London STN 28,124,292 0.5% 8.6% 183,090 -0.4% 224,140 -0.9%
26 Brussels BRU 26,326,315 2.7% 6.4% 217,778 0.1% 489,106 -8.1%
27 Stockholm ARN 25,724,851 -4.4% -3.6% 225,193 -3.6% 50,698 -25.6%
28 Athens ATH 25,555,457 6.0% 17.7% 207,355 4.6% 85,759 1.4%
29 Düsseldorf DUS 25,507,566 5.0% 3.5% 214,594 3.9% 65,858 -11.4%
30 Tel-Aviv TLV 24,821,179 8.1% 19.4% 145,396 6.2% 301,427 -0.3%
31 Berlin TXL 24,227,570 10.1% 18.4% 187,883 3.8% 21,610 -22.4%
32 Moscow VKO 24,001,521 11.7% 54.4% 157,729 -0.6% 48,220 -22.0%
33 Helsinki HEL 21,858,690 4.9% 15.7% 190,213 1.2% 205,249 8.4%
Page 34
Full Year 2019 Full Year 2019 Full Year 2019
2019/18 2019/18 2019/182019/17
PASSENGERSCOMMERCIAL
MOVEMENTSFREIGHT
CITY CODE
34 Málaga AGP 19,824,403 4.4% 6.5% 133,256 3.1% 3,082 11.3%
35 St Petersburg LED 19,581,262 8.1% 21.2% 167,090 1.9% 27,592 0.3%
36 Warsaw WAW 18,864,476 6.2% 19.8% 184,250 4.4% 97,784 5.9%
37 London LTN 18,014,557 8.1% 13.3% 114,192 7.0% 36,648 38.4%
38 Geneva GVA 17,850,646 1.5% 3.4% 146,286 0.4% 53,066 -16.4%
39 Prague PRG 17,804,900 6.0% 15.5% 139,834 0.0% 74,231 1.7%
40 Hamburg HAM 17,308,773 0.4% -1.8% 140,753 -0.2% 24,871 -18.6%
41 Budapest BUD 16,158,980 8.8% 23.5% 113,953 6.3% 91,419 -5.1%
42 Istanbul ISL 16,045,928 133-76.5% 120,841 -73.0% 815,643 -34.1%
43 Kyiv KBP 15,260,281 21.1% 44.6% 107,371 14.3% 42,022 4.8%
44 Alicante ALC 15,042,380 7.7% 9.8% 99,133 5.5% 4,032 0.4%
45 Edinburgh EDI 14,747,949 3.1% 10.0% 127,020 2.0% 19,399 -4.5%
46 Bucharest OTP 14,702,671 6.4% 14.8% 119,683 0.2% 35,371 -2.9%
47 Nice NCE 14,485,713 4.6% 8.9% 166,788 1.8% 12,297 -19.9%
48 Milan BGY 13,853,189 7.1% 12.3% 91,352 5.5% 118,954 -3.3%
49 Ankara ESB 13,688,618 -18.5% -13.1% 90,220 -17.8% 11,317 6.2%
50 Gran Canaria LPA 13,247,411 -2.2% 1.3% 119,518 -2.7% 19,630 2.4%
51 Porto OPO 13,106,012 9.8% 21.5% 96,527 4.9% 37,353 4.2%
52 Stuttgart STR 12,720,855 7.6% 16.0% 117,011 5.3% 25,052 -5.5%
53 Birmingham BHX 12,640,061 1.6% -2.7% 101,472 -1.5% 30,196 -11.2%
54 Izmir ADB 12,399,169 -7.6% -4.7% 77,046 -7.3% 35,812 133.6%
55 Cologne CGN 12,368,519 -2.7% -0.1% 130,869 -0.9% 799,219 -5.4%
56 Lyon LYS 11,739,108 6.4% 14.2% 113,836 3.0% 57,256 -0.9%
57 Venice VCE 11,550,163 3.4% 11.5% 89,870 0.2% 51,997 -8.0%
58 Berlin SXF 11,417,435 -10.3% -11.3% 81,241 -11.2% 11,940 7.6%
59 Tenerife TFS 11,135,372 1.2% -0.7% 66,526 1.3% 2,188 -11.8%
60 Naples NAP 10,860,068 9.3% 26.6% 77,811 7.3% 8,651 9.5%
61 Catania CTA 10,216,658 2.9% 12.1% 72,834 2.0% 2,016 -48.3%
62 Marseille MRS 10,151,743 8.1% 12.8% 97,502 4.2% 59,693 5.3%
63 Toulouse TLS 9,622,037 -0.1% 3.9% 87,828 -1.2% 66,294 -1.2%
64 Bologna BLQ 9,397,308 10.6% 14.7% 72,949 8.0% 34,898 -6.7%
65 Faro FAO 9,009,601 3.7% 3.2% 58,788 2.5% 91 12.3%
66 Bristol BRS 8,959,243 3.2% 10.7% 58,363 -3.4% 15 25.0%
67 Glasgow GLA 8,850,468 -8.4% -10.6% 78,292 -6.8% 12,823 -17.1%
68 Valencia VLC 8,510,854 9.8% 26.4% 66,222 6.1% 14,515 0.1%
69 Krakow KRK 8,410,905 24.2% 44.1% 58,763 18.3% 1,196 8.3%
70 Larnaca LCA 8,315,737 1.9% 6.3% 59,274 -4.6% 29,616 0.3%
71 Charleroi CRL 8,214,000 2.4% 6.8% 49,743 2.3% 357 -18.5%
72 Ibiza IBZ 8,144,067 0.6% 3.2% 62,418 -1.4% 1,435 -11.1%
73 Heraklion HER 7,933,588 -2.1% 6.1% 0 - 0 -
74 Riga RIX 7,797,995 10.5% 27.9% 83,226 4.3% 15,144 -15.2%
75 Bordeaux BOD 7,703,153 13.3% 23.8% 66,798 9.3% 11,222 5.3%
76 Sevilla SVQ 7,541,990 18.3% 47.7% 54,243 17.2% 9,891 -21.3%
77 Malta MLA 7,320,928 7.1% 21.2% 52,295 5.6% 16,422 3.7%
78 Lanzarote ACE 7,292,232 -0.4% -1.3% 57,764 -0.6% 1,345 -16.2%
79 Keflavik KEF 7,247,820 -26.1% -17.2% 47,374 -23.8% 52,928 -2.8%
80 Nantes NTE 7,227,550 16.7% 31.7% 60,379 3.0% 8,788 4.4%
81 Sofia SOF 7,107,096 2.2% 9.5% 54,093 0.4% 21,749 8.4%
82 Palermo PMO 7,013,194 5.9% 21.6% 51,225 6.0% 408 22.9%
Page 35
Full Year 2019 Full Year 2019 Full Year 2019
2019/18 2019/18 2019/182019/17
PASSENGERSCOMMERCIAL
MOVEMENTSFREIGHT
CITY CODE
83 Thessaloniki SKG 6,871,319 2.7% 9.3% 0 - 0 -
84 Sochi AER 6,760,759 6.5% 18.7% 46,676 5.8% 4,062 3.2%
85 Eindhoven EIN 6,719,433 8.7% 18.9% 39,357 7.3% 0 -
86 Göteborg GOT 6,696,452 -2.0% -1.2% 64,452 -3.2% 12,659 11.5%
87 Bergen BGO 6,455,001 3.2% 6.7% 85,245 3.2% 4,585 2.5%
88 Hanover HAJ 6,301,366 -0.4% 7.3% 55,182 -1.4% 11,720 43.2%
89 Belgrade BEG 6,162,159 9.2% 15.2% 62,062 7.1% 17,340 -22.4%
90 Bilbao BIO 5,896,868 8.1% 18.8% 48,356 4.3% 980 -19.4%
91 Rome CIA 5,852,092 0.7% -0.1% 34,991 -0.1% 18,374 0.7%
92 Tenerife TFN 5,834,624 6.3% 24.1% 71,360 3.7% 12,596 -0.6%
93 Fuerteventura FUE 5,630,979 -7.7% -6.8% 45,741 -8.1% 732 -16.2%
94 Bari BRI 5,545,519 10.2% 18.3% 39,332 7.8% 262 10.5%
95 Rhodes RHO 5,495,457 -0.3% 5.1% 0 - 0 -
96 Pisa PSA 5,377,525 -1.4% 2.9% 38,096 -1.4% 12,685 14.1%
97 Newcastle NCL 5,251,399 -2.5% -0.8% 40,683 -3.7% 698 36.9%
98 Adana ADA 5,140,563 -8.9% -8.4% 31,936 -10.0% 3,873 19.1%
99 London LCY 5,110,015 6.8% 13.1% 78,209 3.1% 0 -
100 Minsk MSQ 5,080,071 12.5% 31.3% 53,745 8.9% 11,927 11.5%
101 Vilnius VNO 5,006,831 1.7% 33.1% 45,716 0.6% 11,479 11.2%
102 Cagliari CAG 4,743,578 8.7% 14.2% 34,415 11.2% 1,179 -31.2%
103 East Midlands EMA 4,688,970 -3.8% -3.9% 59,337 -2.1% 337,219 0.0%
104 Luxembourg LUX 4,408,080 9.5% 22.8% 69,637 2.7% 853,354 -4.6%
105 Bodrum BJV 4,352,178 3.8% 23.3% 27,639 2.6% 154 123.2%
106 Trondheim TRD 4,347,080 -1.3% -0.9% 50,362 -1.8% 2,150 4.4%
107 Stavanger SVG 4,278,969 1.1% 3.3% 63,514 3.9% 11,249 12.8%
108 Nüremberg NUE 4,099,074 -8.0% -1.8% 42,669 -8.0% 5,351 -17.8%
109 Turin TRN 3,943,439 -3.3% -5.4% 34,486 -8.3% 225 -47.3%
110 Billund BLL 3,713,754 5.7% 10.0% 39,574 4.7% 74,064 1.2%
111 Tbilisi TBS 3,692,150 -3.1% 16.7% 35,916 -5.5% 25,461 -4.2%
112 Trabzon TZX 3,606,643 -10.6% -12.9% 23,086 -8.4% 827 69.1%
113 Wroclaw WRO 3,499,653 6.1% 24.5% 27,717 3.0% 264 -60.1%
114 Menorca MAH 3,491,084 1.5% 1.7% 29,773 1.0% 1,239 1.5%
115 Zagreb ZAG 3,427,160 2.9% 11.0% 40,644 2.8% 8,178 -13.8%
116 Tirana TIA 3,338,147 13.3% 26.9% 27,128 11.1% 1,901 7.2%
117 Split SPU 3,290,519 5.7% 17.2% 26,642 3.6% 255 -8.3%
118 Tallinn TLL 3,265,962 8.6% 23.2% 40,346 -2.8% 7,954 -11.3%
119 Corfou CFU 3,260,402 -2.6% 12.6% 0 - 0 -
120 Treviso TSF 3,248,727 -1.7% 7.9% 19,071 -2.4% 0 -
121 Yerevan EVN 3,217,106 12.3% 31.6% 26,517 10.9% 20,333 11.6%
122 Funchal FNC 3,206,697 0.8% 0.1% 23,651 -2.0% 4,301 37.0%
123 Rostov ROV 3,059,126 -5.5% 12.3% 24,999 -7.3% 4,149 -15.5%
124 Paphos PFO 3,046,096 6.0% 20.8% 18,888 5.7% 244 -10.3%
125 Chisinau KIV 2,995,570 5.9% 9.1% 27,056 -3.1% 2,738 -15.6%
126 Aberdeen ABZ 2,964,891 -4.1% -3.6% 80,852 -0.6% 6,167 0.1%
127 Chania CHQ 2,952,771 -0.7% -2.1% 0 - 0 -
128 Cluj CLJ 2,923,848 4.9% 8.3% 24,462 2.6% 3,456 20.8%
129 Dubrovnik DBV 2,896,227 14.1% 24.8% 22,692 9.8% 126 -28.0%
130 Bourgas BOJ 2,885,776 -12.0% -3.2% 18,410 -15.0% 4,747 -43.7%
131 Florence FLR 2,861,714 5.7% 8.0% 29,195 5.7% 68 -1.4%
Page 36
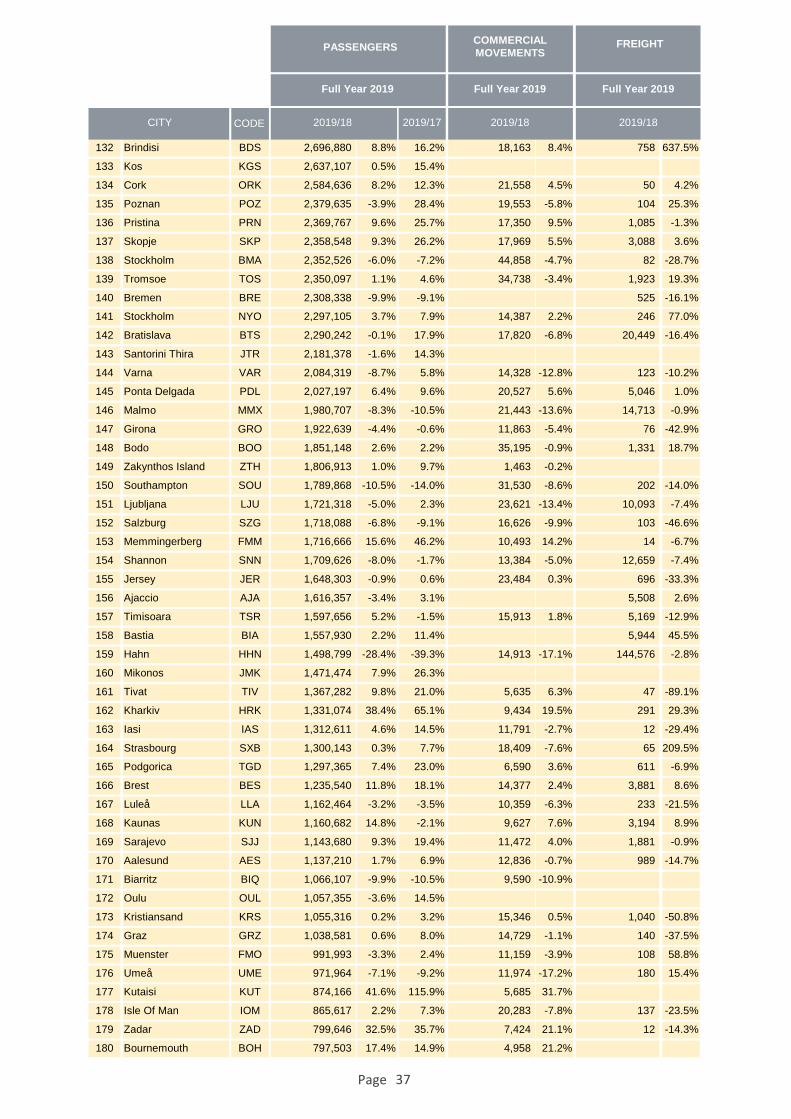
Full Year 2019 Full Year 2019 Full Year 2019
2019/18 2019/18 2019/182019/17
PASSENGERSCOMMERCIAL
MOVEMENTSFREIGHT
CITY CODE
132 Brindisi BDS 2,696,880 8.8% 16.2% 18,163 8.4% 7584637.5%
133 Kos KGS 2,637,107 0.5% 15.4% 0 - 0 -
134 Cork ORK 2,584,636 8.2% 12.3% 21,558 4.5% 50 4.2%
135 Poznan POZ 2,379,635 -3.9% 28.4% 19,553 -5.8% 104 25.3%
136 Pristina PRN 2,369,767 9.6% 25.7% 17,350 9.5% 1,085 -1.3%
137 Skopje SKP 2,358,548 9.3% 26.2% 17,969 5.5% 3,088 3.6%
138 Stockholm BMA 2,352,526 -6.0% -7.2% 44,858 -4.7% 82 -28.7%
139 Tromsoe TOS 2,350,097 1.1% 4.6% 34,738 -3.4% 1,923 19.3%
140 Bremen BRE 2,308,338 -9.9% -9.1% 0 - 525 -16.1%
141 Stockholm NYO 2,297,105 3.7% 7.9% 14,387 2.2% 246 77.0%
142 Bratislava BTS 2,290,242 -0.1% 17.9% 17,820 -6.8% 20,449 -16.4%
143 Santorini Thira JTR 2,181,378 -1.6% 14.3% 0 - 0 -
144 Varna VAR 2,084,319 -8.7% 5.8% 14,328 -12.8% 123 -10.2%
145 Ponta Delgada PDL 2,027,197 6.4% 9.6% 20,527 5.6% 5,046 1.0%
146 Malmo MMX 1,980,707 -8.3% -10.5% 21,443 -13.6% 14,713 -0.9%
147 Girona GRO 1,922,639 -4.4% -0.6% 11,863 -5.4% 76 -42.9%
148 Bodo BOO 1,851,148 2.6% 2.2% 35,195 -0.9% 1,331 18.7%
149 Zakynthos Island ZTH 1,806,913 1.0% 9.7% 1,463 -0.2% 0 -
150 Southampton SOU 1,789,868 -10.5% -14.0% 31,530 -8.6% 202 -14.0%
151 Ljubljana LJU 1,721,318 -5.0% 2.3% 23,621 -13.4% 10,093 -7.4%
152 Salzburg SZG 1,718,088 -6.8% -9.1% 16,626 -9.9% 103 -46.6%
153 Memmingerberg FMM 1,716,666 15.6% 46.2% 10,493 14.2% 14 -6.7%
154 Shannon SNN 1,709,626 -8.0% -1.7% 13,384 -5.0% 12,659 -7.4%
155 Jersey JER 1,648,303 -0.9% 0.6% 23,484 0.3% 696 -33.3%
156 Ajaccio AJA 1,616,357 -3.4% 3.1% 0 - 5,508 2.6%
157 Timisoara TSR 1,597,656 5.2% -1.5% 15,913 1.8% 5,169 -12.9%
158 Bastia BIA 1,557,930 2.2% 11.4% 0 - 5,944 45.5%
159 Hahn HHN 1,498,799 -28.4% -39.3% 14,913 -17.1% 144,576 -2.8%
160 Mikonos JMK 1,471,474 7.9% 26.3% 0 - 0 -
161 Tivat TIV 1,367,282 9.8% 21.0% 5,635 6.3% 47 -89.1%
162 Kharkiv HRK 1,331,074 38.4% 65.1% 9,434 19.5% 291 29.3%
163 Iasi IAS 1,312,611 4.6% 14.5% 11,791 -2.7% 12 -29.4%
164 Strasbourg SXB 1,300,143 0.3% 7.7% 18,409 -7.6% 65 209.5%
165 Podgorica TGD 1,297,365 7.4% 23.0% 6,590 3.6% 611 -6.9%
166 Brest BES 1,235,540 11.8% 18.1% 14,377 2.4% 3,881 8.6%
167 Luleå LLA 1,162,464 -3.2% -3.5% 10,359 -6.3% 233 -21.5%
168 Kaunas KUN 1,160,682 14.8% -2.1% 9,627 7.6% 3,194 8.9%
169 Sarajevo SJJ 1,143,680 9.3% 19.4% 11,472 4.0% 1,881 -0.9%
170 Aalesund AES 1,137,210 1.7% 6.9% 12,836 -0.7% 989 -14.7%
171 Biarritz BIQ 1,066,107 -9.9% -10.5% 9,590 -10.9% 0 -
172 Oulu OUL 1,057,355 -3.6% 14.5% 0 - 0 -
173 Kristiansand KRS 1,055,316 0.2% 3.2% 15,346 0.5% 1,040 -50.8%
174 Graz GRZ 1,038,581 0.6% 8.0% 14,729 -1.1% 140 -37.5%
175 Muenster FMO 991,993 -3.3% 2.4% 11,159 -3.9% 108 58.8%
176 Umeå UME 971,964 -7.1% -9.2% 11,974 -17.2% 180 15.4%
177 Kutaisi KUT 874,166 41.6% 115.9% 5,685 31.7% 0 -
178 Isle Of Man IOM 865,617 2.2% 7.3% 20,283 -7.8% 137 -23.5%
179 Zadar ZAD 799,646 32.5% 35.7% 7,424 21.1% 12 -14.3%
180 Bournemouth BOH 797,503 17.4% 14.9% 4,958 21.2% 0 -
Page 37
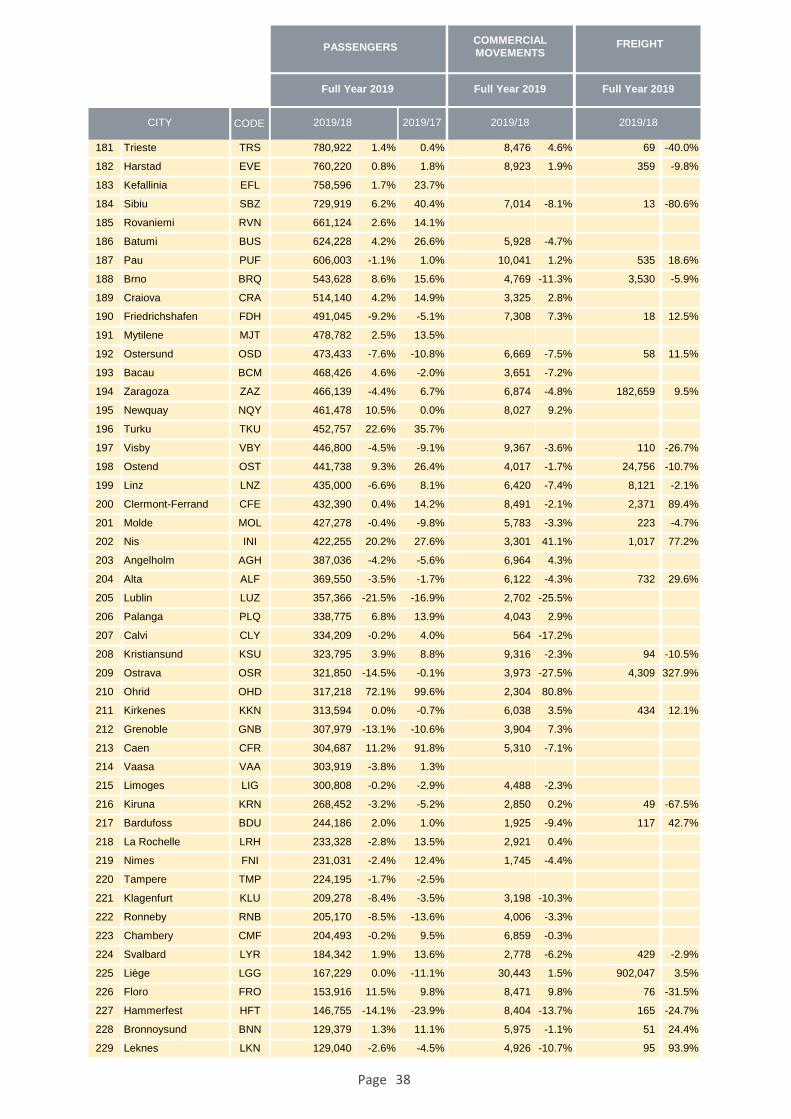
Full Year 2019 Full Year 2019 Full Year 2019
2019/18 2019/18 2019/182019/17
PASSENGERSCOMMERCIAL
MOVEMENTSFREIGHT
CITY CODE
181 Trieste TRS 780,922 1.4% 0.4% 8,476 4.6% 69 -40.0%
182 Harstad EVE 760,220 0.8% 1.8% 8,923 1.9% 359 -9.8%
183 Kefallinia EFL 758,596 1.7% 23.7% 0 - 0 -
184 Sibiu SBZ 729,919 6.2% 40.4% 7,014 -8.1% 13 -80.6%
185 Rovaniemi RVN 661,124 2.6% 14.1% 0 - 0 -
186 Batumi BUS 624,228 4.2% 26.6% 5,928 -4.7% 0 -
187 Pau PUF 606,003 -1.1% 1.0% 10,041 1.2% 535 18.6%
188 Brno BRQ 543,628 8.6% 15.6% 4,769 -11.3% 3,530 -5.9%
189 Craiova CRA 514,140 4.2% 14.9% 3,325 2.8% 0 -
190 Friedrichshafen FDH 491,045 -9.2% -5.1% 7,308 7.3% 18 12.5%
191 Mytilene MJT 478,782 2.5% 13.5% 0 - 0 -
192 Ostersund OSD 473,433 -7.6% -10.8% 6,669 -7.5% 58 11.5%
193 Bacau BCM 468,426 4.6% -2.0% 3,651 -7.2% 0 -
194 Zaragoza ZAZ 466,139 -4.4% 6.7% 6,874 -4.8% 182,659 9.5%
195 Newquay NQY 461,478 10.5% 0.0% 8,027 9.2% 0 -
196 Turku TKU 452,757 22.6% 35.7% 0 - 0 -
197 Visby VBY 446,800 -4.5% -9.1% 9,367 -3.6% 110 -26.7%
198 Ostend OST 441,738 9.3% 26.4% 4,017 -1.7% 24,756 -10.7%
199 Linz LNZ 435,000 -6.6% 8.1% 6,420 -7.4% 8,121 -2.1%
200 Clermont-Ferrand CFE 432,390 0.4% 14.2% 8,491 -2.1% 2,371 89.4%
201 Molde MOL 427,278 -0.4% -9.8% 5,783 -3.3% 223 -4.7%
202 Nis INI 422,255 20.2% 27.6% 3,301 41.1% 1,017 77.2%
203 Angelholm AGH 387,036 -4.2% -5.6% 6,964 4.3% 0 -
204 Alta ALF 369,550 -3.5% -1.7% 6,122 -4.3% 732 29.6%
205 Lublin LUZ 357,366 -21.5% -16.9% 2,702 -25.5% 0 -
206 Palanga PLQ 338,775 6.8% 13.9% 4,043 2.9% 0 -
207 Calvi CLY 334,209 -0.2% 4.0% 564 -17.2% 0 -
208 Kristiansund KSU 323,795 3.9% 8.8% 9,316 -2.3% 94 -10.5%
209 Ostrava OSR 321,850 -14.5% -0.1% 3,973 -27.5% 4,309 327.9%
210 Ohrid OHD 317,218 72.1% 99.6% 2,304 80.8% 0 -
211 Kirkenes KKN 313,594 0.0% -0.7% 6,038 3.5% 434 12.1%
212 Grenoble GNB 307,979 -13.1% -10.6% 3,904 7.3% 0 -
213 Caen CFR 304,687 11.2% 91.8% 5,310 -7.1% 0 -
214 Vaasa VAA 303,919 -3.8% 1.3% 0 - 0 -
215 Limoges LIG 300,808 -0.2% -2.9% 4,488 -2.3% 0 -
216 Kiruna KRN 268,452 -3.2% -5.2% 2,850 0.2% 49 -67.5%
217 Bardufoss BDU 244,186 2.0% 1.0% 1,925 -9.4% 117 42.7%
218 La Rochelle LRH 233,328 -2.8% 13.5% 2,921 0.4% 0 -
219 Nimes FNI 231,031 -2.4% 12.4% 1,745 -4.4% 0 -
220 Tampere TMP 224,195 -1.7% -2.5% 0 - 0 -
221 Klagenfurt KLU 209,278 -8.4% -3.5% 3,198 -10.3% 0 -
222 Ronneby RNB 205,170 -8.5% -13.6% 4,006 -3.3% 0 -
223 Chambery CMF 204,493 -0.2% 9.5% 6,859 -0.3% 0 -
224 Svalbard LYR 184,342 1.9% 13.6% 2,778 -6.2% 429 -2.9%
225 Liège LGG 167,229 0.0% -11.1% 30,443 1.5% 902,047 3.5%
226 Floro FRO 153,916 11.5% 9.8% 8,471 9.8% 76 -31.5%
227 Hammerfest HFT 146,755 -14.1% -23.9% 8,404 -13.7% 165 -24.7%
228 Bronnoysund BNN 129,379 1.3% 11.1% 5,975 -1.1% 51 24.4%
229 Leknes LKN 129,040 -2.6% -4.5% 4,926 -10.7% 95 93.9%
Page 38
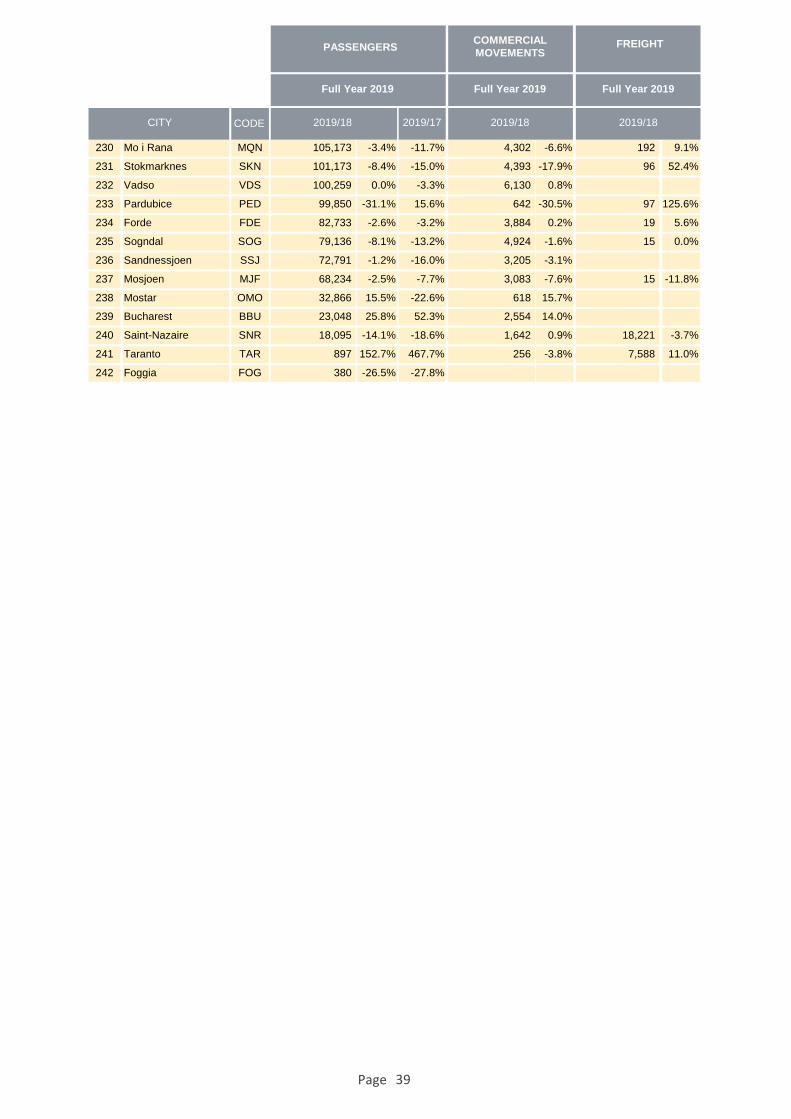
Full Year 2019 Full Year 2019 Full Year 2019
2019/18 2019/18 2019/182019/17
PASSENGERSCOMMERCIAL
MOVEMENTSFREIGHT
CITY CODE
230 Mo i Rana MQN 105,173 -3.4% -11.7% 4,302 -6.6% 192 9.1%
231 Stokmarknes SKN 101,173 -8.4% -15.0% 4,393 -17.9% 96 52.4%
232 Vadso VDS 100,259 0.0% -3.3% 6,130 0.8% 0 -
233 Pardubice PED 99,850 -31.1% 15.6% 642 -30.5% 97 125.6%
234 Forde FDE 82,733 -2.6% -3.2% 3,884 0.2% 19 5.6%
235 Sogndal SOG 79,136 -8.1% -13.2% 4,924 -1.6% 15 0.0%
236 Sandnessjoen SSJ 72,791 -1.2% -16.0% 3,205 -3.1% 0 -
237 Mosjoen MJF 68,234 -2.5% -7.7% 3,083 -7.6% 15 -11.8%
238 Mostar OMO 32,866 15.5% -22.6% 618 15.7% 0 -
239 Bucharest BBU 23,048 25.8% 52.3% 2,554 14.0% 0 -
240 Saint-Nazaire SNR 18,095 -14.1% -18.6% 1,642 0.9% 18,221 -3.7%
241 Taranto TAR 897 152.7% 467.7% 256 -3.8% 7,588 11.0%
242 Foggia FOG 380 -26.5% -27.8% 0 - 0 -
Page 39