decentralisation and education efficiency
TRANSCRIPT

The Effect of Organisational Structure on Education Efficiency: public-private provision and decentralisation
Miguel Castro Coelho1
Abstract
This paper investigates the effect of the organisational structure of primary and secondary education systems on their productive efficiency. We use stochastic frontier analysis to estimate efficiency for 18 OECD countries in 2000 and 2003. Organisational structure is explored through two analytical components: the share of public/private providers in the system and the degree of decentralisation of public providers. The share of public providers is found to exert a negative effect on efficiency whereas the degree of decentralisation of public providers is found to exert a positive effect on efficiency.
JEL: I21, I28, H52, C10, C14
KEYWORDS: expenditure and education, expenditure and efficiency, education and efficiency, organisation and education.
1 Institute of Local Government Studies – School of Public policy – The University of Birmingham, Edgbaston, B15 2TT, United Kingdom. Email: [email protected]
1. Introduction
Public policy can influence economic productivity through two different
channels: first, via productivity changes in the public sector itself, and second via the
effects of taxation, public spending and regulation on the private sector (European
Commission, 2004).
There is a growing body of empirical literature investigating the link between
government activity and the performance of economic systems via this second
channel2. This literature stresses the importance of some “core”, “essential”,
“productive” expenditure for economic growth. This type of expenditure is said to be
as important to growth as private capital and labour, acting directly upon the human
and physical capital stock and technical progress of the economy, or indirectly
through synergies with private activities3.
The production of human capital is the area of government activity for which
the clearest evidence of positive growth effects is available4. The economic rationale
for government intervention on education hinges on a combination of externalities,
economies of scale, other market failures, and redistribution motives (Hanushek,
2002). Empirical studies generally indicate that public spending on education can
improve on a pure market outcome.
Several econometric studies suggest that the relationship between government
expenditure and economic performance is non-linear, and that a negative correlation
between the two is likely to emerge when government expenditure expands beyond a
2 Hemming et. al, 2002; Romero de Avila and Strauch, 2003; Tanzi and Shuknecht, 2000, 2003; Tanzi and Zee, 2000; and Zagler and Durnecker, 2003. 3 See Afonso, Ebert, Schuknecht and Thone (2005) for a good review of this literature. 4 Englander and Gurney, 1994; De Gregorio, 1996; keefer and Knack, 1997; De la Fuente and Domenech, 2000; Bassanini and Scarpetta, 2001; Gemmell and Kneller, 2001; Heitger, 2001; and Buysse, 2002.

certain level (Barro, 1990; Heitger, 2001, Gwartney, Lawson and Holcombe, 1998).
An increase in public expenditure is expected to increase the marginal productivity of
capital, while an increase in taxes is likely to reduce it5. The first positive effect is
said to dominate when government is small, being offset by the tax effect when it
grows beyond a certain point. The overall result of the interaction between these two
effects is mediated by the efficiency of public spending.
There are a limited number of studies addressing the efficiency of education
systems at the international level (Clements, 1999, 2002; St. Aubyn, 2002; Gupta and
Verhoeven, 2001; Afonso and St. Aubyn, 2004, 2005). These studies follow a parallel
line of research to the traditional econometric estimation of education production
functions using cross-country data (Barro and Lee, 2001; Hanushek and Kimko, 2000;
Hanushek and Luque, 2003). In both approaches, socio-economic variables describing
students’ backgrounds such as parents’ education and wealth are the key variables
used to explain efficiency6. Whilst the importance of these variables cannot be
overstated, they are of little help to policymakers attempting to improve the outcomes
of education expenditure since, at least in the sort run, they are beyond government
control.
More interesting for policymakers is the effect of the organisational structure
of education systems on efficiency (something that can be changed by government).
In this paper organisational structure is explored in two dimensions: the share of
5 High levels of taxation tend to damage the general allocation of resources by distorting incentives to work, to invest and/or to save (Cashin, 1995; de la Fuente, 1997; Folster and Henrekson, 1999; Kneller, Bleaney and Gemmell, 1998). Growth is further impaired by high and sustained government deficits and growing debt (Tanzi and Chalk, 2000). 6 The literature focusing on the econometric estimation of education production functions does not explicitly acknowledge the concept of efficiency. Typically, qualitative measures of education outputs (results from international studies assessing students’ academic abilities) are regressed on a set of education system resources (financial and/or physical) and other environmental variables thought to affect the performance of the education system. However, since students’ socio-economic background (normally proxied by parents’ education and wealth) is often presented as a relevant environmental variable for explaining students’ performance, it is implicitly assumed that it interferes with the relationship between inputs and outputs, and thus with efficiency.

public providers and the degree of decentralisation of the public share of the system.
We estimate efficiency using stochastic frontier analysis and an unbalanced data panel
of 18 OECD countries in 2000 and 2003. The results from two OECD (2000, 2003)
tests of student’s mathematical, reading and scientific abilities are taken as the output
variable. The input variable is the cumulative expenditure per student in the course of
primary and secondary education. After controlling for the effect of students’ socio-
economic background, the share of public providers is found to be negatively
associated with efficiency whereas the degree of decentralisation of the public share
of the system is positively associated with efficiency.
This paper breaks new ground by estimating and explaining education
efficiency in a single-stage stochastic frontier model7, using data from two OECD
Programme for International Student Assessment (PISA 2000, 2003) reports. The
demonstration that organisational structure affects efficiency is also novel.
7 Most of the existing literature uses non-parametric methods such as Free Disposable Hull and Data Envelopment Analysis to estimate efficiency. The stochastic specification of the efficiency frontier has the advantage of explicitly acknowledging that some of the deviations from the maximum observed output may occur due to factors unrelated to inefficiency (e.g., inaccuracy in the measurement of output; exogenous shocks outside the control of the production system, etc).

2. Data
The traditional conceptualisation of the education production process is of the
following form (Hanushek and Taylor, 1990):
);;( εFSfA = (1)
A: a vector of variables measuring individual achievement;
S: a vector of variables measuring school inputs;
F: a vector of variables measuring students’ socio-economic background;
ε: a vector of unmeasured factors that contribute to individual achievement
(individual ability and random factors).
We expand this model to );;;( εOFSfA = , where O is a vector of variables
measuring organisational structure.
We use as a measure of student achievement the results of two OECD surveys
conducted in 2000 and 2003 which evaluate the mathematical, reading and scientific
ability of 15 year old students8.
School inputs are measured through the cumulative expenditure per student9
(CEPS) between the age of 6 and 15 in equivalent US dollars using purchasing power
parities10.
8 An arithmetic average of the mathematic, reading and science scores from the 2000 and 2003 Programme for International Student Assessment (PISA) surveys was considered. Since the reporting scales for mathematics are not directly comparable between 2000 and 2003, as the PISA 2003 mathematics assessment was more comprehensive than the one that took place in 2000, we drew on the two components of the 2003 mathematical results (space and shape and change and relationships) common to the 2000 survey. 9 Let n(0), n(1) and n(2) be the typical number of years spent by a student from the age of six up to the age of 15 years in primary, lower secondary and upper secondary education. Let E(0), E(1) and E(2) be

Students´ socio-economic background is proxied by the PISA’s index of
economic, social and cultural status (IESCS). This indicator captures various aspects
of students’ family and home background that are thought to be relevant for school
achievement11.
Organisational structure is expressed by two variables: the share of public
providers in the system (%PUBPROV), and the degree of decentralisation of public
providers (DEC). In the following we provide a brief discussion of the rationale for
including these variables.
Primary and secondary education is mainly a public enterprise. On average
across OECD countries only 4 per cent of 15-year-olds are enrolled in schools that are
∑=
=2
0
)(*)(i
iEinCE
the annual expenditure per student in US dollars converted using purchasing power parities in primary, lower secondary and upper secondary education, respectively. The cumulative expenditure is then calculated by multiplying current annual expenditure E by the typical duration of study n for each level of education i using the following formula, (OECD, 2004a):
10 Several different variables have been considered in the education efficiency literature to measure the school inputs contributing to student achievement. These have typically included financial indicators such as expenditure per student and physical indicators such as average class size, ratio of students to teaching staff, and number of instruction hours. Financial inputs were predominant in most of the pioneer studies on education efficiency. Recent studies have favoured the use of multiple physical inputs instead - often being alleged that financial inputs reflect to a large extent differences in costs between countries (mainly teachers’ salaries) causing significant distortions to the measurement of efficiency.
We employ a single financial indicator as the input variable for three different reasons. First, differences in costs underlying financial measures of inputs can be mitigated by the use of values converted at PPPs (although they are not totally eliminated as PPPs are calculated taking into account the average level of prices (the one that underlies the gross domestic product) and not the particular prices/costs of specific services like education). Second, some of these differences in cost actually reflect differences in the overall efficiency of the system that should be considered by our calculations. For example, the skill and ability of school managers to contract the best teachers at the best price, to put in place an incentive regime that ensures high labour productivity, or to outsource non-core activities in a cost effective manner, create differences in costs that should be reflected in a proper account of efficiency. Third, despite all the imperfections and flaws of international data on education expenditure, this still arguably remains the best available proxy for the entire set of resources that go into the production of education. Resources such as physical infrastructure (buildings, computers, etc) and policy administration (of schools and the education system as a whole) escape traditional physical input measures, but have a bearing on financial inputs. 11 IESCS is derived from the following variables (OECD, 2004a, p. 307): i) the highest international socio-economic index of occupational status of the father or mother; ii) the highest level of education of the father or mother converted into years of schooling; and iii) the number of books at home as well as access to home educational and cultural resources, obtained by asking students whether they had at their home: a desk to study at, a room of their own, a quiet place to study, a computer they can use for school work, educational software, a link to the Internet, their own calculator, classic literature, books of poetry, works of art (e.g., paintings), books to help with their school work, and a dictionary.

both privately managed and predominantly privately financed (OECD, 2004a).
However, publicly financed schools are not necessarily publicly managed, and in fact,
in the search for efficiency gains, governments are increasingly relying on the transfer
of public funds to privately managed schools to deliver education services.
Accordingly, schools that are privately managed but predominantly publicly
financed12 account for a more expressive average of 13 per cent of school enrolment
in OECD countries (OECD, 2004a).
Therefore, in contrast to previous studies that have tested (unsuccessfully) the
effect of the ratio of public-to-total expenditure on efficiency13, we argue that the
share of public providers (schools both funded and managed by the public sector)
offers a better account of the structural diversity of education systems and that its
effect on efficiency is the one that should be investigated.
Apart from the segmentation between public and private providers, a second
organizational feature of education systems whose impact on efficiency is worth
studying relates to the reforms that have been taking place throughout the last two
decades in terms of the way the public sector operates as a service provider. In
particular, while seeking to improve efficiency, many governments have opted for
devolving decision-making authority to schools and lower levels of governments.
This has been accomplished in the expectation it will enable downsizing of central
education administration; elimination of superfluous layers of bureaucracy; and
12 OECD (2004a) designates these as “government-dependent schools”. In PISA, public schools are defined as educational instructional institutions that are controlled and managed directly by a public education authority or agency; or controlled and managed either by a government agency directly or by a governing body (council, committee, etc.), most of whose members were either appointed by a public authority or elected by public franchise. Private schools are defined as educational instructional institutions that are controlled and managed by a nongovernmental organisation (e.g., a church, a trade union or a business enterprise) or if their governing board consisted mostly of members not selected by a public agency. 13 Afonso and St. Aubyn (2005) did not find a significant relationship between public-to-total education expenditure and efficiency. The authors argued that this was “probably because most spending in this level of education is essentially public and high for most countries” (p. 23).

improvement of chains of command in decision making, delivering a larger
proportion of financial and human resources directly to local governments, schools,
and students (Behrman, et al., 2002).
We examine the effect of decentralisation on efficiency using an indicator of
the distribution of educational decisions by specific levels of government in public
lower secondary education (OECD, 2004b)14.
Our model is estimated for an unbalanced panel of 18 OECD countries in
2000 and 200315. Data for all variables are presented in the statistical annex and
descriptive statistics are presented in table 1.
[Insert table I here]
14 The percentage of decisions taken at the “local” and “school” levels is taken as the appropriate indicator of decentralisation. Information on four different functional domains is considered: - Organisation of instruction: student admissions; student careers; instruction time; choice of textbooks; grouping students; additional support for students; teaching methods; regular day-to-day student assessment; - Personnel management: hiring and dismissal of teaching and non-teaching staff; duties and service conditions of staff; salary scales of staff; influence over the careers of staff; - Planning and structures: opening or closure of schools; creation or abolition of a grade level; design of programmes of study; selection of programmes of study taught in a particular school; choice of range of subjects taught in a particular school; definition of course content; setting of qualifying examinations for a certificate or diploma; credentialing (examination content, marking and administration); - Resources: allocation and use of resources for teaching staff, non-teaching staff, capital and operating expenditure. 15 Data on cumulative expenditure refers to 1998 and 2002 (deflated to 1998 prices). Data on decentralisation of public providers also refers to 1998 and 2003.

3. The Stochastic Production Function Model
This paper uses the Battese and Coelli (1995) model for a stochastic frontier
production function which is equivalent to the Kumbhakar, Ghosh and McGukin
(1991) specification, with the exception that allocative efficiency is imposed, the first-
order profit maximising conditions removed, and panel data is permitted. The model
may be expressed as:
Yit = Xitβ + (Vit - Uit) i=1,...,18; t=1,2 (2)
Yit is the logarithm of the PISA score of country i in period t;
Xit is the logarithm of cumulative expenditure per student of country i in period t;
β is a vector of unknown parameters;
t denotes the time period;
Vit are random variables assumed to be independent and identically distributed
N(0,σV2), and independent of Uit;
Uit are non-negative random variables assumed to account for technical inefficiency in
production and assumed to be independently distributed as truncations at zero of the
N(mit,σU2) distribution, where:
mit = Zitδ, (3)
Zit is a p×1 vector of variables deemed to influence the efficiency of country i in
period t; δ is an 1×p vector of parameters to be estimated.

Following Battese and Corra (1977), the likelihood function is parameterised
in terms of the variance ratio γ=σU2/(σV
2+σU2). Hence γ indicates the relative
magnitude of technical inefficiency variance to total variance in the model.
Six different specifications of equation (3) are tested:
Model a: mit = δ1IESCSit;
Model b: mit =δ0+δ1IESCSit+δ2ln(%PUBPROV);
Model c: mit =δ1IESCSit+δ2ln(DEC);
Model d: mit =δ1IESCSit+δ2ln(%PUBPROV)+δ3ln(DEC);
Model e: mit =δ1IESCSit+δ2ln(%PUBPROV)+δ3ln(%PUBPROV*DEC);
Model f16: mit =δ0+δ1IESCSit+δ2ln(DECINDEX)
Models “a”, “b”, and “c” test the isolated effect on efficiency of IESCS,
%PUBPROV and DEC, respectively17. Models “d”, “e” and “f” include
simultaneously the three variables and consider different specifications for
%PUBPROV and DEC. Model “d” treats the effects of %PUBPROV and DEC on the
general efficiency of education systems as being autonomous and independent from
each other. Model “e” considers that the effect of decentralisation on efficiency is
mediated by the share of public providers in the education system. Finally, model “f”
tests the effect on efficiency of an overall index of decentralisation that assumes
private schools correspond to a level of decentralisation of one and that public schools
are in this respect comparable to private schools, i.e. that ownership of is irrelevant. In
16 DECINDEX= 1-[%PUBPROV(1-DEC)]. This index assumes that private schools correspond to a level of decentralisation of 100 per cent. The index is equivalent to an average of the level of decentralisation of public and private schools, weighted by the share of public and private providers in the education system, respectively. 17 In these two later cases controlling for IESCS.
the different specifications an independent term was included when its estimate was
significant18.
4. Results and Concluding Remarks
Maximum likelihood estimates of the parameters in the production function
frontier and technical inefficiency effects for the different specifications are presented
in table 2. The efficiency ranking associated with model “e”19 is presented in table 3.
[Insert table II here]
[Insert table III here]
The results are consistent between the different models. Apart from the
expected positive effect of students’ socio-economic background on efficiency
(reflected in the negative estimate of the technical inefficiency coefficient), the share
of public providers is found to exert a negative effect on efficiency whereas
decentralisation is positively associated with efficiency (the technical inefficiency
parameters are positive and negative, respectively).
We tested the robustness of these results by performing a series of generalized
likelihood ratio tests. The likelihood ratio statistic is given by )ln(ln2 01 LL −=λ ,
where ln L0 and ln L1 are the maximum log-likelihood values under the null and
alternative hypotheses, H0 and H1, respectively. Under the null hypothesis this statistic
18 We performed generalized likelihood ratio tests to determine whether or not an independent term should be included. 19 The one that generated the highest log likelihood value.

is usually assumed to be asymptotically distributed as a chi-square random variable
with degrees of freedom equal to the number of restrictions involved in the test.
However, when the null hypothesis involves a restriction of the type γ=0 this statistic
can be shown to have an asymptotic non-standard mixed qui-square distribution with
degrees of freedom equal to the number of parameters restricted to zero under the null
hypothesis (Coelli et. al, 1998)20. The results of the likelihood ratio tests are presented
in table 4.
[insert table IV here]
The first set of null hypotheses in each model tests the individual and
combined significance of the organisational variables DEC and %PUBPROV. The
last null hypothesis tests the appropriateness of the stochastic frontier and technical
inefficiency effects specification by assessing the possibility of it being equivalent to
the average response function, which can be efficiently estimated by ordinary least
squares regression. These null hypotheses are clearly rejected21 and so we conclude
that the effects of our organisational variables are significant and that the stochastic
specification of the efficiency frontier is appropriate.
Over the last two decades major reforms have been attempted in various
public services across a range of jurisdictions. New modes of delivery and new
provider structures, mostly drawn from private sector practice, have been tested and
adapted to the political and institutional context in which public services operate.
20 We extracted the critical value for this statistic from Kodde and Palm (1986). 21 Except for the individual effect of DEC in model “c”. However, since we expect this effect to be influenced by %PUBPROV this lack of individual significance does not appear to be particularly meaningful.

In the field of education one of the most significant changes to the underlying
governing structure has been the shift from traditional bureaucratic modes of
coordination to decentralized governance mechanisms with increasing private sector
participation.
Governments are increasingly relying on private providers as a means of
defining institutional environments that induce efficient behaviour. At the same time,
the public sector itself is redefining the way it operates as a service provider – from a
traditional purely bureaucratic form of organisation to the constitution of effective
service agencies, highly decentralised, and operating along privately-inspired
management criteria. This paper suggests that both these practices have positive
impact on primary and secondary education efficiency.

References
Afonso, A. and St. Aubyn, M (2005), Cross-country Efficiency of Secondary Education Provision: a Semi-parametric Analysis with Non-discretionary Inputs, European Central Bank, Working Paper n. 494. Afonso, A. and St. Aubyn, M. (2004), Non-parametric Approaches to Public Education and Health Expenditure Efficiency in OECD countries, ISEG/UTL Technical University of Lisbon, Economics Department, Working Paper 1/2004/DE/CISEP/UECE. Afonso, A., Ebert, W., Schuknecht, L., and Thöne, M. (2005), Quality of public Finances and Growth, European Central Bank, Working Paper Series no. 438. Barro, R. and Lee, J-W. (2001), Schooling Quality in a Cross-Section of Countries, Economica¸ 68 (272), p. 465-488. Barro, R.J. (1990), Government spending in a simple model of endogenous growth, Journal of Political Economy, 98(5), p. 103-125. Bassanini, A. and Scarpetta, S. (2001), Does human capital matter for growth in OECD countries? Evidence from pooled mean-group estimates, OECD Economics Department Working Paper 282, Paris. Battese, G.E. and Coelli, T.J. (1995), A Model for Technical Inefficiency Effects in a Stochastic Frontier Production Function for Panel Data, Empirical Economics, 20, 325-332. Battese, G.E. and Corra, G.S. (1977), Estimation of a Production Frontier Model: With Application to the Pastoral Zone of Eastern Australia, Australian Journal of Agricultural Economics, 21, 169-179. Behrman, J.R., Deolalikar, A.B. and Soon, L-Y (2002), Conceptual Issues in the Role of Education Decentralization in Promoting Effective Schooling in Asian Developing Countries, ERD Working Paper Series No. 22, Asian Development Bank. Buysse, K. (2002), Human Capital and Growth in OECD Countries: the Role of Public Expenditure on Education, mimeo, paper presented at the 4th Public Finances Workshop of the Banca d’Italia. Cashin, P. (1995), Government spending, taxes and economic growth, IMF Staff Papers, Vol. 42, 237-269. Clements, B. (1999), The Efficiency of Education Expenditure in Portugal, IMF working paper nº 99/179. Clements, B. (2002), How Efficient is Education Spending in Europe?, European Review of Economics and Finance, 1 (1), 3-26.

De Gregorio, J. (1996), Inflation, Growth and Central Banks: Theory and Evidence, The World Bank, Working Paper 1575, Washington D.C. De la Fuente, A. (1997), Fiscal Policy and Growth in the OECD, CEPR Discussion De la Fuente, A. and Domenech, R. (2000), Human Capital in Growth Regressions: How Much Difference Does Data Quality Make?, OECD Economics Department Working Paper No. 262. Englander, S. and Gurney, A. (1994), Medium-term determinants of OECD Productivity, OECD Economic Studies, No. 22, Paris. European Commission (2004), European Competitiveness Report, Commission Staff Working Document, SEC(2004)1397. Fölster, S., Henrekson, M. (1999), Growth and the Public Sector: A Critique of the Critics, European Journal of Political Economy, Vol. 15, 337-358. Gemmell, N., Kneller, R. (2001), The impact of fiscal policy on long-run growth, European Economy No. 1-2001, 97-129. Gupta, S. and Verhoeven, M. (2001), The Efficiency of Government Expenditure – Experiences from Africa, Journal of Policy Modelling, 23, 433-467. Gwartney, J., Lawson, R. and Holcombe, R. (1998), The size and functions of government and economic growth, study prepared for the Joint Economic Committee of the US Congress, Washington, DC, April. Hanushek, E. and Kimko, D. (2000), Schooling, labor force quality, and economic Growth, American Economic Review, 90 (5), p. 1184-1208. Hanushek, E. and Luque, J. (2003), Efficiency and equity in schools around the World, Economics of Education Review, 22, p. 481-502. Hanushek, E. and Taylor, L. (1990), Alternative Assessments of the Performance of Schools, The Journal of Human Resources, 25(2), p. 179, 201. Hanushek, E.A. (2002), Publicly Provided Education, in Auerbach, A.J. and Feldstein, M. (eds.), Handbook of Public Economics, 4, North-Holland. Heitger, B. (2001), The Scope of Government and Its Impact on Economic Growth in OECD Countries, Kiel Working Paper No. 103, Kiel. Hemming, R., Kell, M. and Mahfouz, S. (2002), The Effectiveness of Fiscal Policy in Stimulating Economic Activity - A Review of the Literature, IMF Working Paper No. 02/208. Keefer, P., Knack, S. (1997), Why don’t poor countries catch up? A cross-country test of an institutional explanation, Economic Inquiry, Vol. 35, 590-602.

Kneller, R.; Bleaney, M. and Gemmell, N. (1998), Growth, Public Policy and the Government Budget Constraint: Evidence from OECD Countries, School of Economics, University of Nottingham, Discussion Paper No. 98/14, Nottingham. Kumbhakar, S.C., Ghosh, S. and McGukin, J.T. (1991), A Generalised Production Frontier Approach for Estimating Determinants of Inefficiency in U.S. Dairy Farms, Journal of Business and Economics Statistics, 9, 279-286. OECD (2001), Knowledge and Skills for Life: First Results from PISA 2000, OECD, Paris OECD (2004a), Learning from Tomorrow’s World – First Results from PISA 2003, OECD, Paris. OECD (2004b), Education at a Glance – OECD Indicators 2004, OECD, Paris. Romero de Avíla, D. and Strauch, R. (2003), Public Finances and Long-term Growth in Europe – Evidence from a Panel Data Analysis, ECB Working Paper n. 246. St. Aubyn, M. (2002), Evaluating Efficiency in the Portuguese Health and Education Sectors, paper presented to the conference "Desenvolvimento Económico Português no Espaço Europeu: Determinantes e Políticas", Banco de Portugal, May, Fundação Calouste Gulbenkian, Lisbon. Tanzi, V. and Chalk, N. (2000), Impact of Large Public Debt on Growth in the EU: A Discussion of Potential Channels, In European Economy 2/2000, 23–43. Tanzi, V. and Schuknecht, L. (2000), Public Spending in the 20th Century, London: Cambridge University Press. Tanzi, V. and Schuknecht, L. (2003), Public Finances and Economic Growth in European Countries, in Fostering Economic Growth in Europe, conference volume of the 31st Economics Conference of the Oestereichische Nationalbank, Vienna, 2003, 178-196. Tanzi, V. and Zee, H. (2000), Taxation and the Household Saving Rate: Evidence from OECD Countries, Banca Nazionale del Lavoro Quarterly Review 212. Zagler, M. and Durnecker, G. (2003), Fiscal Policy and economic growth, Journal of Economic Surveys, 17 (3), 397-418.

Table I: Descriptive statistics Variable Mean Std. Dev. Min. Max.
PISA scores 494.000 30.811 393.000 544.000 Cumulative expenditure per std 44148.406 18548.700 10480.545 73328.892 IESCS -0.020 0.359 -1.130 0.690 %PUBPROV 0.846 0.187 0.233 0.995 Dec 0.603 0.261 0.156 1
Table II: Maximum likelihood estimation results. Absolute t-ratios in parentheses Model a
Production function Technical inefficiency effects Variance parametersParameter Estimate Parameter Estimate Parameter EstimateConstant 6.100 IESCS -0.187 σ2 0.002
(30.787) (-4.253) (2.813) CEPS 0.012 Log Likelihood 52.274 γ 0.125
(0.686) 3.410 Model b
Production function Technical inefficiency effects Variance parametersParameter Estimate Parameter Estimate Parameter EstimateConstant 6.205 Constant 0.047 σ2 0.002
(3.871) (1.887) (4.132) CEPS 0.004 IESCS -0.180 γ 0.196
(0.257) (-4.538) (1.183) ln(%PUBPROV) 0.117 (1.997) Log Likelihood 56.366
Model c Production function Technical inefficiency effects Variance parametersParameter Estimate Parameter Estimate Parameter EstimateConstant 6.114 IESCS -0.143 σ2 0.002
(34.016) (-2.856) (3.215) CEPS 0.012 ln(DEC) -0.031 γ 0.258
(0.724) (-1.295) (0.828) Log Likelihood 53.113
Model d Production function Technical inefficiency effects Variance parametersParameter Estimate Parameter Estimate Parameter EstimateConstant 6.131 IESCS -0.140 σ2 0.002
(50.426) (-3.185) (4.521) CEPS 0.011 ln(%PUBPROV) 0.135 γ 0.391
(0.940) (2.469) (1.543) ln(DEC) -0.055 (-3.150)

Log Likelihood 57.667 Model e
Production function Technical inefficiency effects Variance parametersParameter Estimate Parameter Estimate Parameter EstimateConstant 6.128 IESCS -0.139 σ2 0.002
(42.047) (-3.152) (2.187) CEPS 0.011 ln(%PUBPROV) 0.176 γ 0.344
(0.809) (4.014) (0.923) ln(%PUBPROV*DEC) -0.055 (-2.816) Log Likelihood 57.780
Model f Production function Technical inefficiency effects Variance parametersParameter Estimate Parameter Estimate Parameter EstimateConstant 6.109 Constant -0.083 σ2 0.002
(32.700) (-1.615) (1.144) CEPS 0.012 IESCS -0.166 γ 0.248
(0.677) (-3.150) (0.316) ln(DECINDEX) -0.105 (-2.349) Log Likelihood 56.211
Table III: Efficiency ranking
Country Output Efficiency Country Output Efficiency 2000 2003
Finland 0.991 Netherlands 0.997 Norway 0.990 Korea 0.995 Denmark 0.990 Finland 0.994
Korea 0.989 Iceland 0.993 Hungary 0.976 Norway 0.991 Austria 0.974 Czech Republic 0.990
Czech Republic 0.973 Denmark 0.989 Germany 0.972 Sweden 0.989
Spain 0.952 Japan 0.989 Italy 0.925 Hungary 0.980
Greece 0.909 Germany 0.978 Portugal 0.872 Slovak Republic 0.971
Austria 0.971 Italy 0.948 Spain 0.942 Portugal 0.890 Greece 0.893
Average Efficiency 0.960 Mexico 0.792
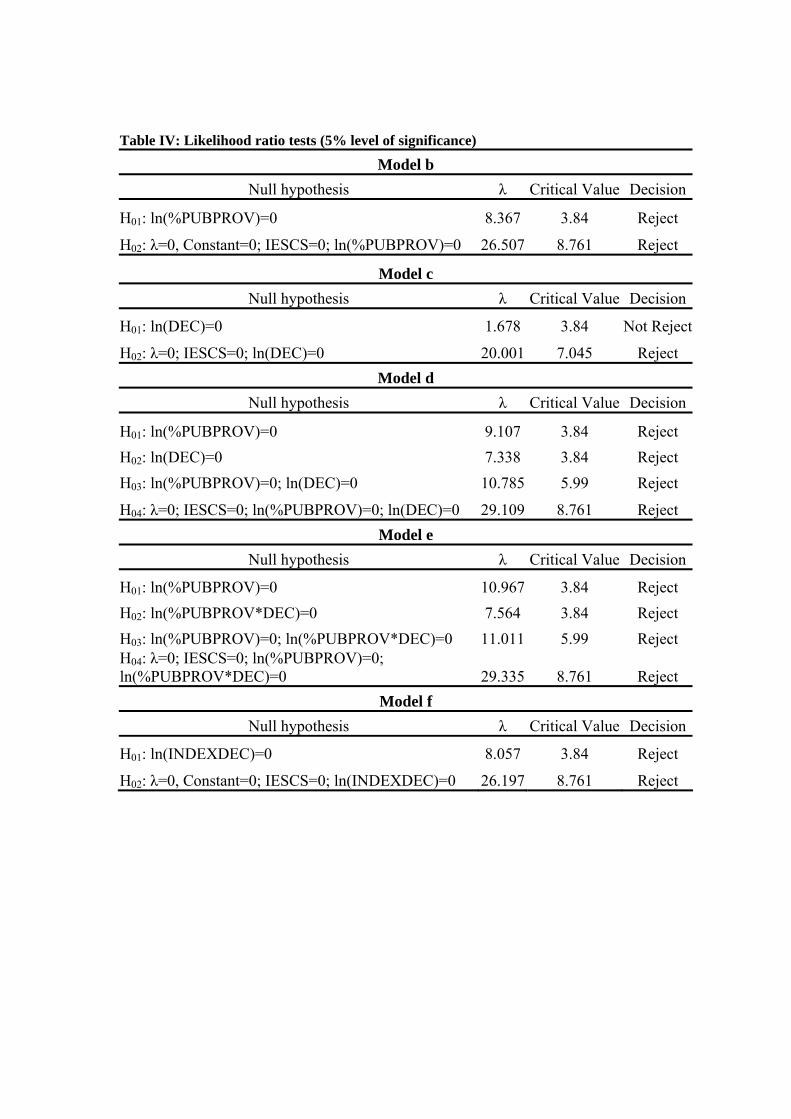
Table IV: Likelihood ratio tests (5% level of significance)
Model b Null hypothesis λ Critical Value Decision
H01: ln(%PUBPROV)=0 8.367 3.84 Reject
H02: λ=0, Constant=0; IESCS=0; ln(%PUBPROV)=0 26.507 8.761 Reject
Model c Null hypothesis λ Critical Value Decision
H01: ln(DEC)=0 1.678 3.84 Not Reject
H02: λ=0; IESCS=0; ln(DEC)=0 20.001 7.045 Reject Model d
Null hypothesis λ Critical Value Decision
H01: ln(%PUBPROV)=0 9.107 3.84 Reject H02: ln(DEC)=0 7.338 3.84 Reject H03: ln(%PUBPROV)=0; ln(DEC)=0 10.785 5.99 Reject
H04: λ=0; IESCS=0; ln(%PUBPROV)=0; ln(DEC)=0 29.109 8.761 Reject Model e
Null hypothesis λ Critical Value Decision
H01: ln(%PUBPROV)=0 10.967 3.84 Reject H02: ln(%PUBPROV*DEC)=0 7.564 3.84 Reject H03: ln(%PUBPROV)=0; ln(%PUBPROV*DEC)=0 11.011 5.99 Reject H04: λ=0; IESCS=0; ln(%PUBPROV)=0; ln(%PUBPROV*DEC)=0 29.335 8.761 Reject
Model f Null hypothesis λ Critical Value Decision
H01: ln(INDEXDEC)=0 8.057 3.84 Reject
H02: λ=0, Constant=0; IESCS=0; ln(INDEXDEC)=0 26.197 8.761 Reject

Statistical Annex – Data and Sources
Country Pisa
Average Score (1)
Cumulative expenditure
p/std (2)
Index of economic social and cultural
status (3)
%Decision-making at school and local
levels (4)
%Public providers
(5) Austria (2003) 496 73329 0.06 0.51 0.92
C.Republic (2003) 511 23144 0.16 0.92 0.93 Denmark (2003) 493 67037 0.20 0.81 0.78 Finland (2003) 544 50645 0.25 0.98 0.93
Germany (2003) 499 47660 0.16 0.49 0.92 Greece (2003) 463 28791 -0.15 0.16 0.97
Hungary (2003) 491 18190 -0.07 0.96 0.89 Iceland (2003) 498 54144 0.69 0.75 1.00
Italy (2003) 474 68939 -0.11 0.63 0.96 Japan (2003) 530 63351 -0.08 0.67 0.73 Korea (2003) 541 39017 -0.10 0.56 0.42
Mexico (2003) 393 10480 -1.13 0.22 0.87 Netherlands (2003) 525 48394 0.10 1.00 0.23
Norway (2003) 490 60193 0.61 0.68 0.99 Portugal (2003) 468 42048 -0.63 0.41 0.94
S.Republic (2003) 488 11893 -0.08 0.65 0.87 Spain (2003) 482 40424 -0.30 0.28 0.64
Sweden (2003) 507 56668 0.25 0.83 0.96 Austria (2000) 510 71387 0.01 0.47 0.89
C.Republic (2000) 500 21384 -0.04 0.62 0.94 Denmark (2000) 497 65794 0.20 0.74 0.76 Finland (2000) 538 45363 0.04 1.00 0.97
Germany (2000) 485 41978 0.16 0.53 0.96 Greece (2000) 458 27356 -0.08 0.23 0.96
Hungary (2000) 485 20277 -0.05 1.00 0.95 Italy (2000) 471 60824 -0.17 0.36 0.94
Korea (2000) 537 30844 -0.17 0.32 0.51 Norway (2000) 499 61677 0.49 0.65 0.99 Portugal (2000) 458 36521 -0.58 0.24 0.93
Spain (2000) 485 36699 -0.39 0.41 0.62 (1) Arithmetic average of PISA Mathematics (space and change; change and relationships), Reading and Science scores (OECD, 2004a, Tables 2.1c; 2.1d; 2.2c; 2.2d; 6.2; 6.6; OECD, 2001. Tables 3.3;2.3a;3.6). (2) Cumulative expenditure per student between 6 and 15 years-old in purchasing power parities (OECD, 2004a, Table 2.6 (values deflated to 1998); OECD, 2001, Table 3.6). (3) Mean Pisa Index of Economic and Social Status (OECD, 2004a, Tables 2.6;4.3b). (4) Percentage of decisions relating to public sector, lower secondary education, taken at each level of government (OECD, 2004b, Table D6.6). (5) Percentage of students enrolled in Public Schools (OECD 2004a, Table 5.19; OECD, 2001, Table 7.13).
