decision-cto - tctmd.com · decision-cto optimal medical therapy with or without stenting for...
TRANSCRIPT
DECISION-CTO
Optimal Medical Therapy With or Without
Stenting For Coronary Chronic Total Occlusion
Seung-Jung Park, MD., PhD.
Heart Institute, University of Ulsan College of Medicine
Asan Medical Center, Seoul, Korea
Background
• Benefits of successful CTO-PCI include reduced
angina frequency and improvements in quality of
life, left ventricular ejection fraction, or survival.
• However, CTO-PCI can lead to procedure-related
complications. In addition, the evidence for CTO-
PCI was obtained from observational studies, most
of which compared successful and failed CTO-PCI
without a control group receiving optimal medical
treatment.
DECISION CTO Trial
Design
• DESIGN: a prospective, open-label, randomized trial
• OBJECTIVE: To compare the outcomes of OMT alone
with PCI coupled with OMT in patients with CTO.
• PRINCIPAL INVESTIGATOR
Seung-Jung Park, MD, PhD,
Asan Medical Center, Seoul, Korea
Clinicaltrials.gov, Identifier: NCT01075051
Clinicaltrials.gov, Identifier: NCT01075051
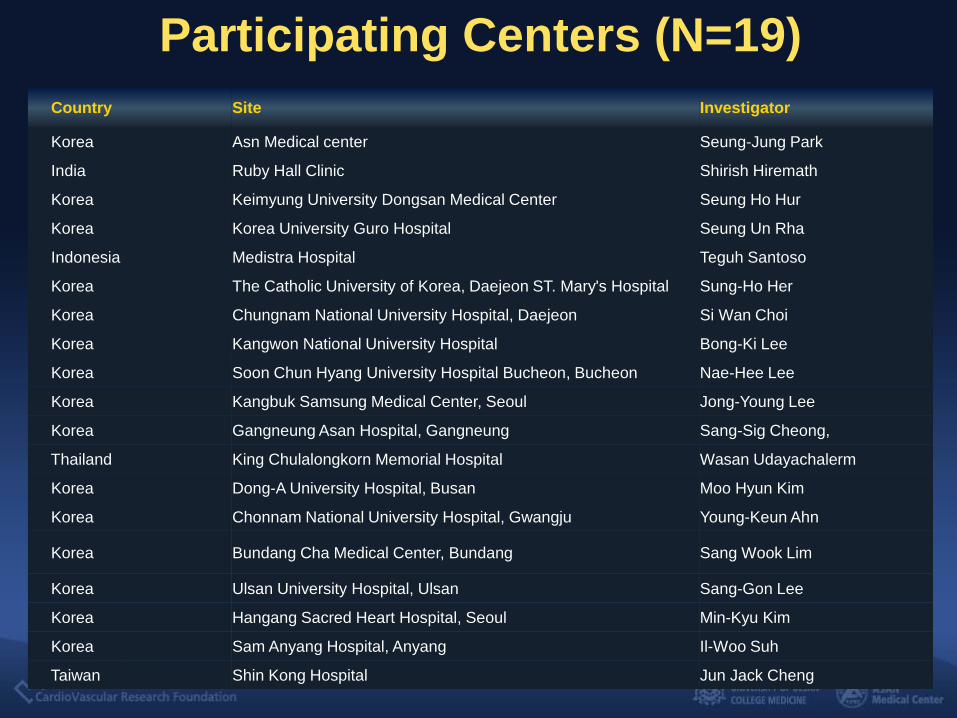
Participating Centers (N=19)
Country Site Investigator
Korea Asn Medical center Seung-Jung Park
India Ruby Hall Clinic Shirish Hiremath
Korea Keimyung University Dongsan Medical Center Seung Ho Hur
Korea Korea University Guro Hospital Seung Un Rha
Indonesia Medistra Hospital Teguh Santoso
Korea The Catholic University of Korea, Daejeon ST. Mary's Hospital Sung-Ho Her
Korea Chungnam National University Hospital, Daejeon Si Wan Choi
Korea Kangwon National University Hospital Bong-Ki Lee
Korea Soon Chun Hyang University Hospital Bucheon, Bucheon Nae-Hee Lee
Korea Kangbuk Samsung Medical Center, Seoul Jong-Young Lee
Korea Gangneung Asan Hospital, Gangneung Sang-Sig Cheong,
Thailand King Chulalongkorn Memorial Hospital Wasan Udayachalerm
Korea Dong-A University Hospital, Busan Moo Hyun Kim
Korea Chonnam National University Hospital, Gwangju Young-Keun Ahn
Korea Bundang Cha Medical Center, Bundang Sang Wook Lim
Korea Ulsan University Hospital, Ulsan Sang-Gon Lee
Korea Hangang Sacred Heart Hospital, Seoul Min-Kyu Kim
Korea Sam Anyang Hospital, Anyang Il-Woo Suh
Taiwan Shin Kong Hospital Jun Jack Cheng
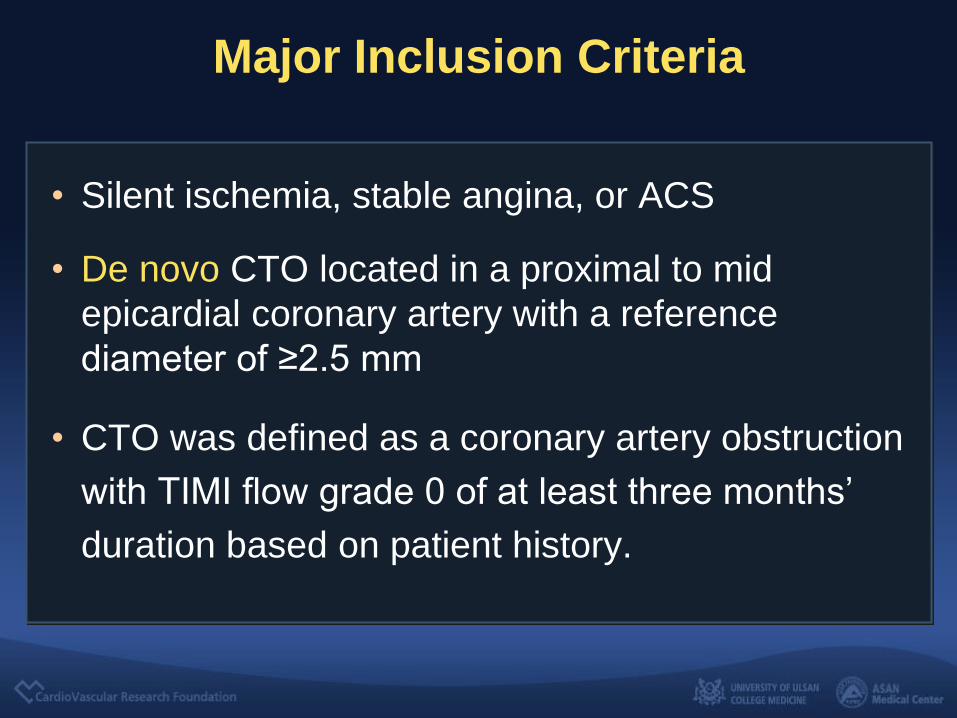
Major Inclusion Criteria
• Silent ischemia, stable angina, or ACS
• De novo CTO located in a proximal to mid
epicardial coronary artery with a reference
diameter of ≥2.5 mm
• CTO was defined as a coronary artery obstruction
with TIMI flow grade 0 of at least three months’
duration based on patient history.
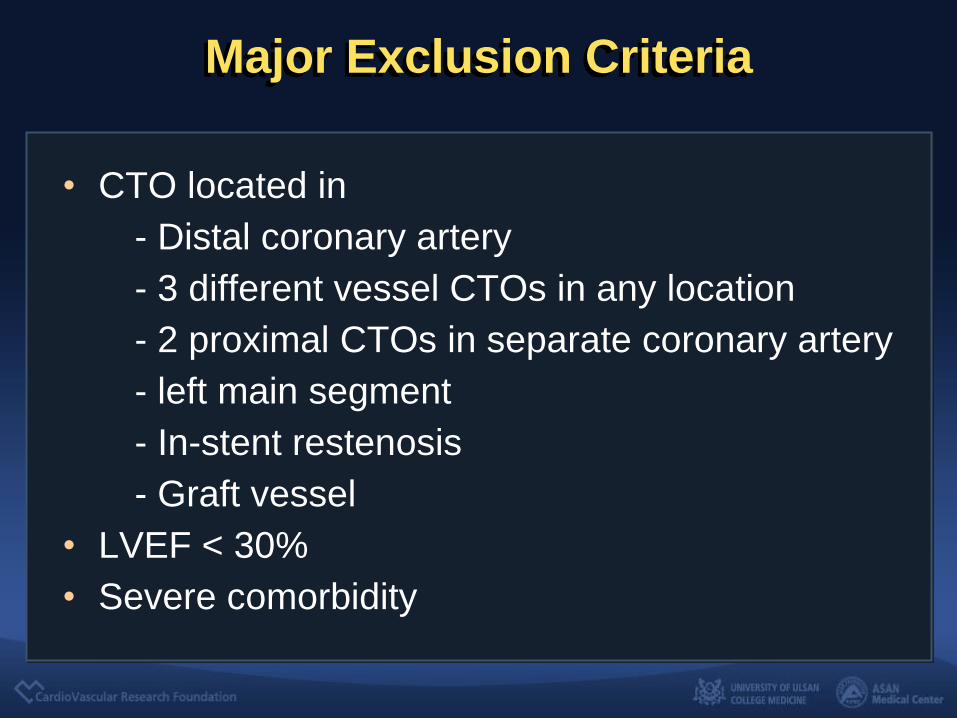
Major Exclusion Criteria
• CTO located in
- Distal coronary artery
- 3 different vessel CTOs in any location
- 2 proximal CTOs in separate coronary artery
- left main segment
- In-stent restenosis
- Graft vessel
• LVEF < 30%
• Severe comorbidity

Study Procedures (1)
• Patients who were assigned to PCIs underwent
CTO-PCI using DES within 30 days after
randomization using standard procedures.
• In cases of failed CTO-PCI, additional attempts
were allowed within 30 days after the index
procedure.
• The use of specialized devices or techniques, and
the choice of drug-eluting stent type were left to
the operator’s discretion.
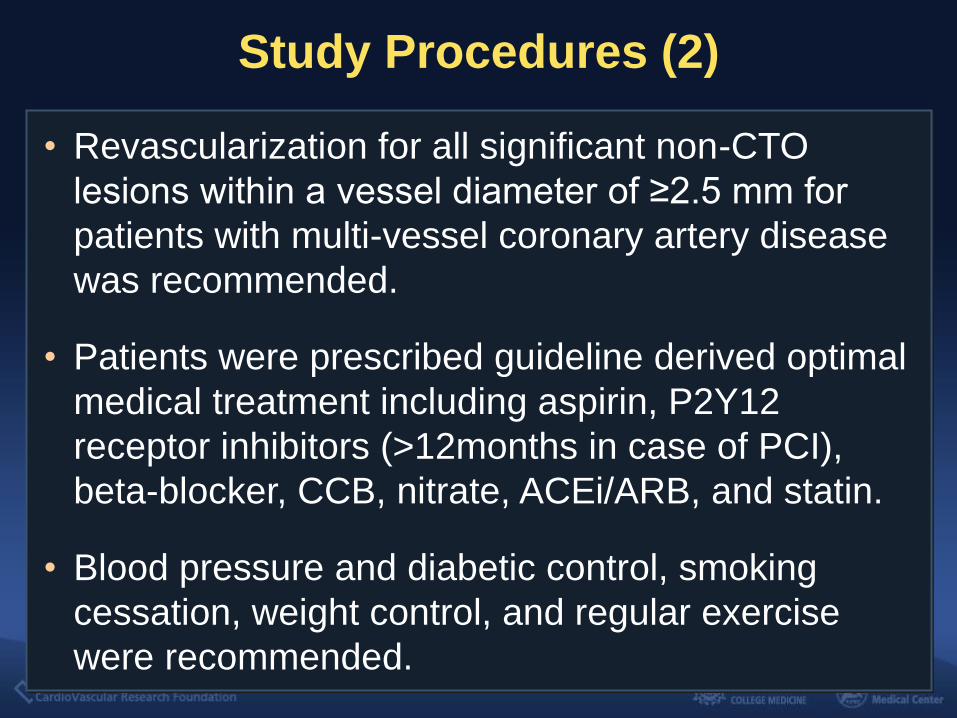
Study Procedures (2)
• Revascularization for all significant non-CTO
lesions within a vessel diameter of ≥2.5 mm for
patients with multi-vessel coronary artery disease
was recommended.
• Patients were prescribed guideline derived optimal
medical treatment including aspirin, P2Y12
receptor inhibitors (>12months in case of PCI),
beta-blocker, CCB, nitrate, ACEi/ARB, and statin.
• Blood pressure and diabetic control, smoking
cessation, weight control, and regular exercise
were recommended.

Primary End Point
At 3 year, a composite of
• Death from any cause
• Myocardial infarction
Periprocedural MI: CK-MB > 5 times UNL
Spontaneous MI: any cardiac enzyme elevation
• Stroke
• Any repeat revascularization

Original Power Calculation
• Assumed primary event rate: 17% at 3 years
• A noninferiority margin : event rate ratio 0.7
• A one-sided type I error rate : 0.025
• Power : 80%
• Dropout rate: 5%
• Assumed sample size: 1,284 patients
Non-inferiority Design for Primary Endpoint

Premature Termination of Trial
• Because enrollment was slower than anticipated,
enrollment was stopped in September 2016 as
recommended by the data and safety monitoring
board by which time 834 patients had been
enrolled.
• The sponsor and study leadership were unaware
of study results at the time of this decision.

Study Flow
834 patients randomized from 2010.3.22 to 2016.10.10
417 allocated to PCI 398 allocated to OMT
310 treated with OMT
72 treated with PCI: 72
5 treated with OMT after failed PCI
11 had incomplete data
346 treated with PCI
29 treated with OMT
36 treated with OMT after failed PCI
6 had incomplete data
1-year FU
348/357 (97.5%)
1-year FU
344/354 (97.2%)
3-year FU
215/231 (93.1%)
3-year FU
218/238 (91.6%)
5-year FU
87/99 (87.9%)
5-year FU
85/102 (83.3%)
19 withdrew consents
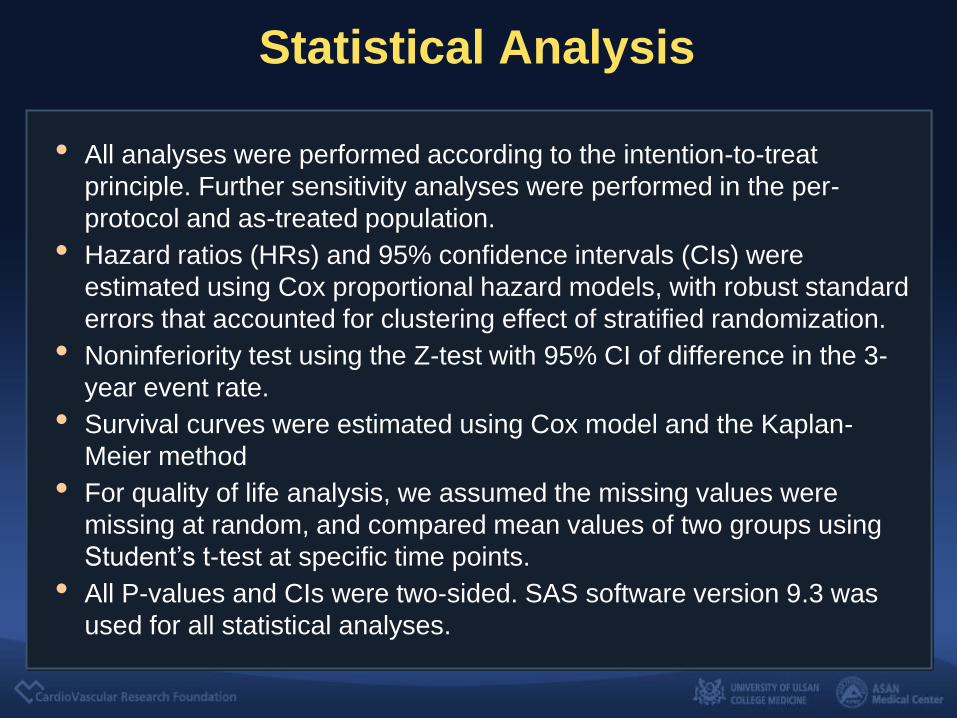
Statistical Analysis
• All analyses were performed according to the intention-to-treat
principle. Further sensitivity analyses were performed in the per-
protocol and as-treated population.
• Hazard ratios (HRs) and 95% confidence intervals (CIs) were
estimated using Cox proportional hazard models, with robust standard
errors that accounted for clustering effect of stratified randomization.
• Noninferiority test using the Z-test with 95% CI of difference in the 3-
year event rate.
• Survival curves were estimated using Cox model and the Kaplan-
Meier method
• For quality of life analysis, we assumed the missing values were
missing at random, and compared mean values of two groups using
Student’s t-test at specific time points.
• All P-values and CIs were two-sided. SAS software version 9.3 was
used for all statistical analyses.
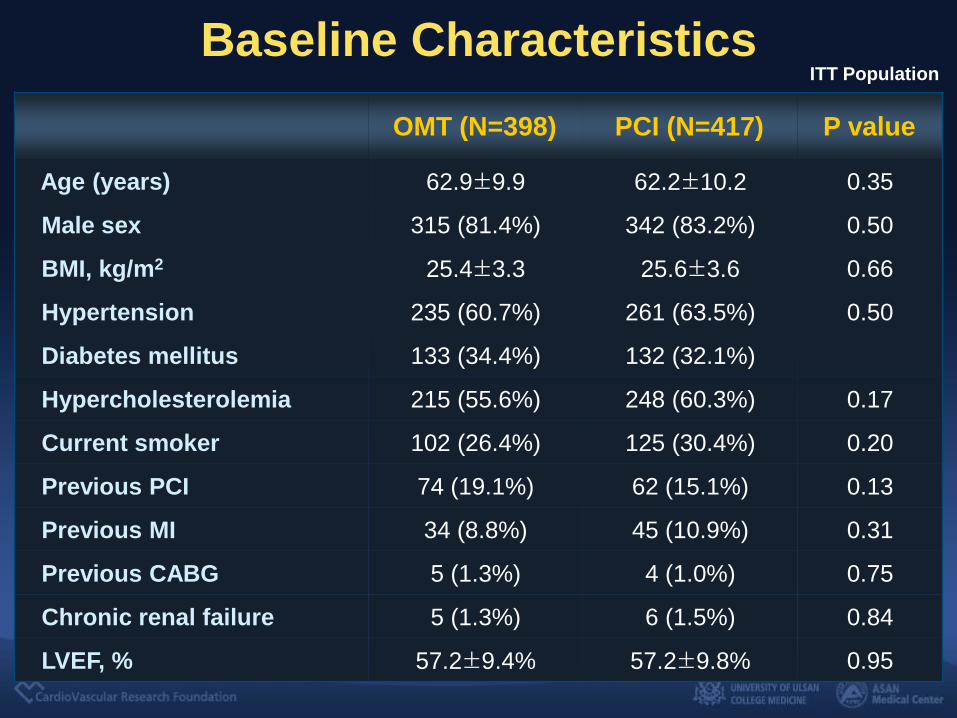
Baseline Characteristics
OMT (N=398) PCI (N=417) P value
Age (years) 62.9±9.9 62.2±10.2 0.35
Male sex 315 (81.4%) 342 (83.2%) 0.50
BMI, kg/m2 25.4±3.3 25.6±3.6 0.66
Hypertension 235 (60.7%) 261 (63.5%) 0.50
Diabetes mellitus 133 (34.4%) 132 (32.1%)
Hypercholesterolemia 215 (55.6%) 248 (60.3%) 0.17
Current smoker 102 (26.4%) 125 (30.4%) 0.20
Previous PCI 74 (19.1%) 62 (15.1%) 0.13
Previous MI 34 (8.8%) 45 (10.9%) 0.31
Previous CABG 5 (1.3%) 4 (1.0%) 0.75
Chronic renal failure 5 (1.3%) 6 (1.5%) 0.84
LVEF, % 57.2±9.4% 57.2±9.8% 0.95
ITT Population
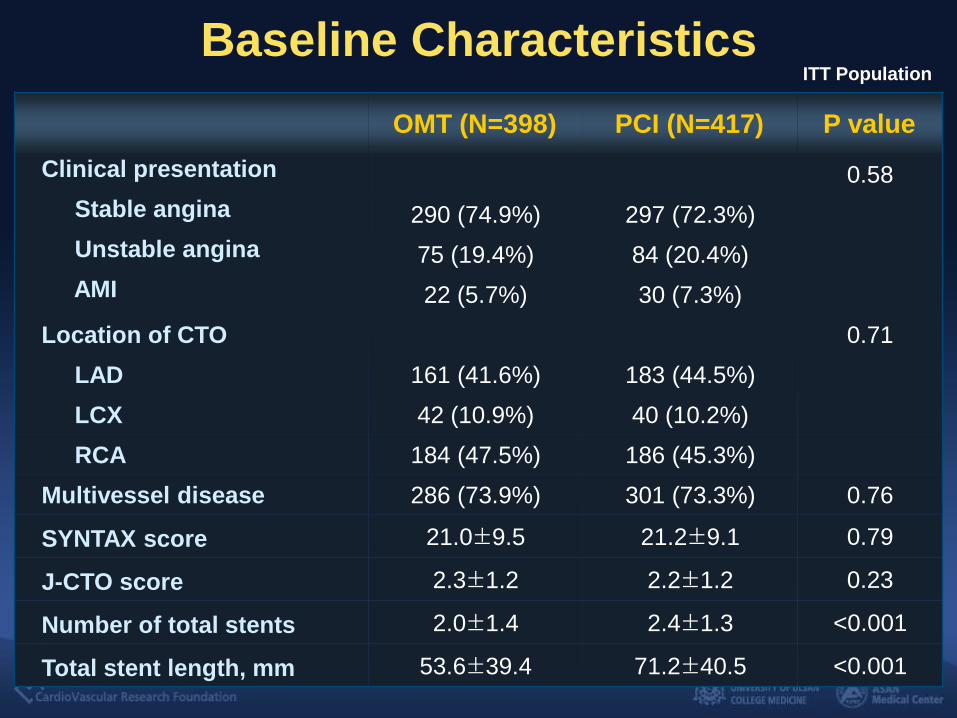
Baseline Characteristics
OMT (N=398) PCI (N=417) P value
Clinical presentation 0.58
Stable angina 290 (74.9%) 297 (72.3%)
Unstable angina 75 (19.4%) 84 (20.4%)
AMI 22 (5.7%) 30 (7.3%)
Location of CTO 0.71
LAD 161 (41.6%) 183 (44.5%)
LCX 42 (10.9%) 40 (10.2%)
RCA 184 (47.5%) 186 (45.3%)
Multivessel disease 286 (73.9%) 301 (73.3%) 0.76
SYNTAX score 21.0±9.5 21.2±9.1 0.79
J-CTO score 2.3±1.2 2.2±1.2 0.23
Number of total stents 2.0±1.4 2.4±1.3 <0.001
Total stent length, mm 53.6±39.4 71.2±40.5 <0.001
ITT Population
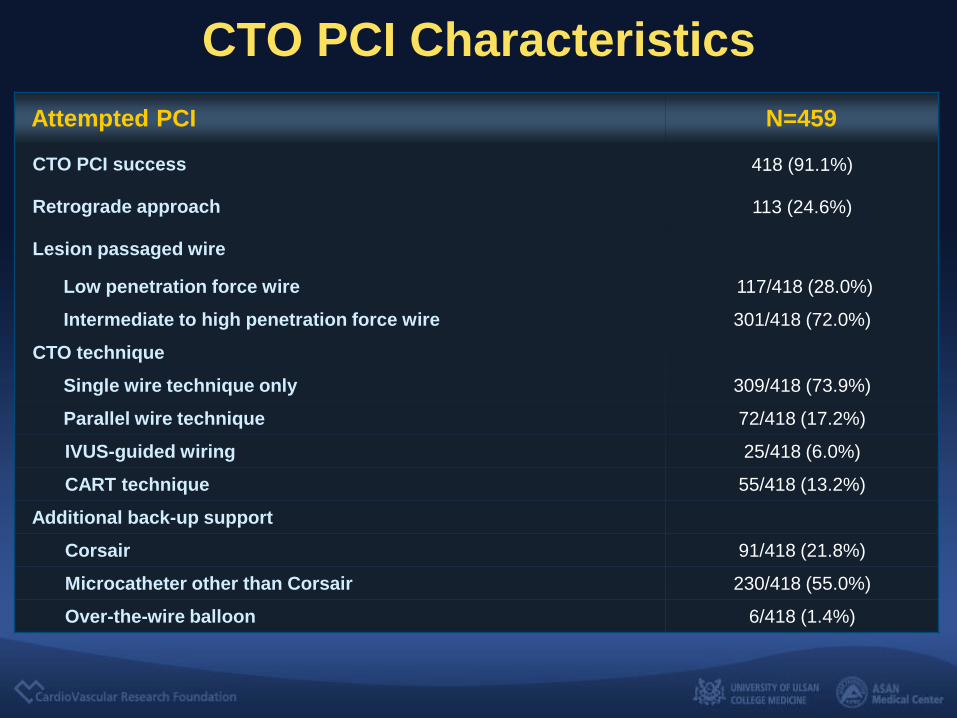
CTO PCI Characteristics
Attempted PCI N=459
CTO PCI success 418 (91.1%)
Retrograde approach 113 (24.6%)
Lesion passaged wire
Low penetration force wire 117/418 (28.0%)
Intermediate to high penetration force wire 301/418 (72.0%)
CTO technique
Single wire technique only 309/418 (73.9%)
Parallel wire technique 72/418 (17.2%)
IVUS-guided wiring 25/418 (6.0%)
CART technique 55/418 (13.2%)
Additional back-up support
Corsair 91/418 (21.8%)
Microcatheter other than Corsair 230/418 (55.0%)
Over-the-wire balloon 6/418 (1.4%)
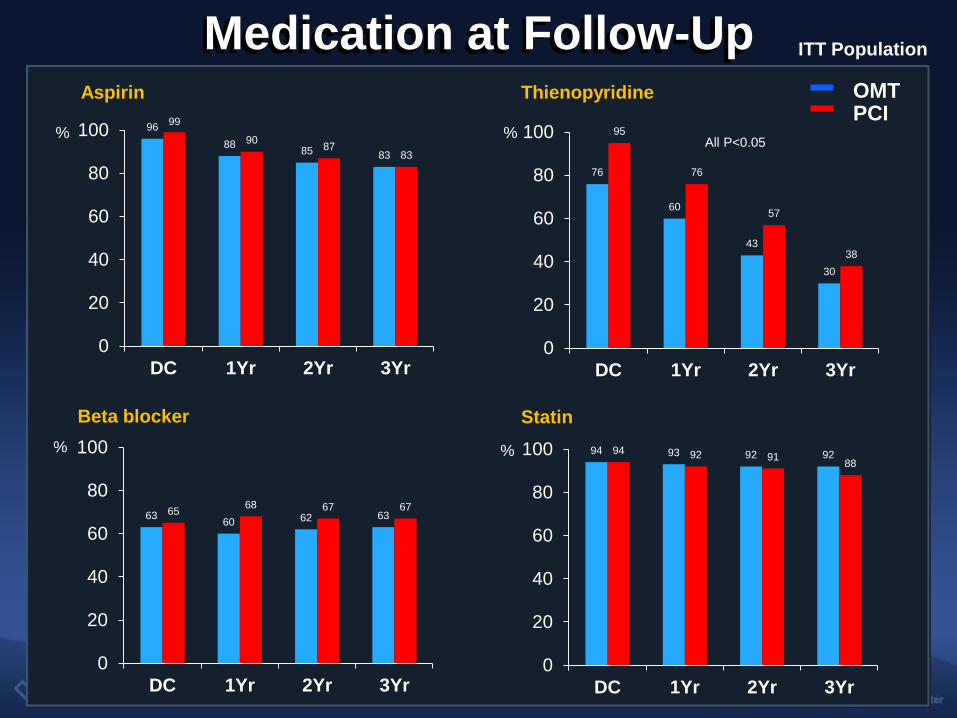
Aspirin Thienopyridine
Statin Beta blocker
Medication at Follow-Up
PCI OMT
96
88 85 83
99
90 87
83
0
20
40
60
80
100
DC 1Yr 2Yr 3Yr
76
60
43
30
95
76
57
38
0
20
40
60
80
100
DC 1Yr 2Yr 3Yr
63 60 62 63 65
68 67 67
0
20
40
60
80
100
DC 1Yr 2Yr 3Yr
94 93 92 92 94 92 91 88
0
20
40
60
80
100
DC 1Yr 2Yr 3Yr
%
% %
% All P<0.05
ITT Population
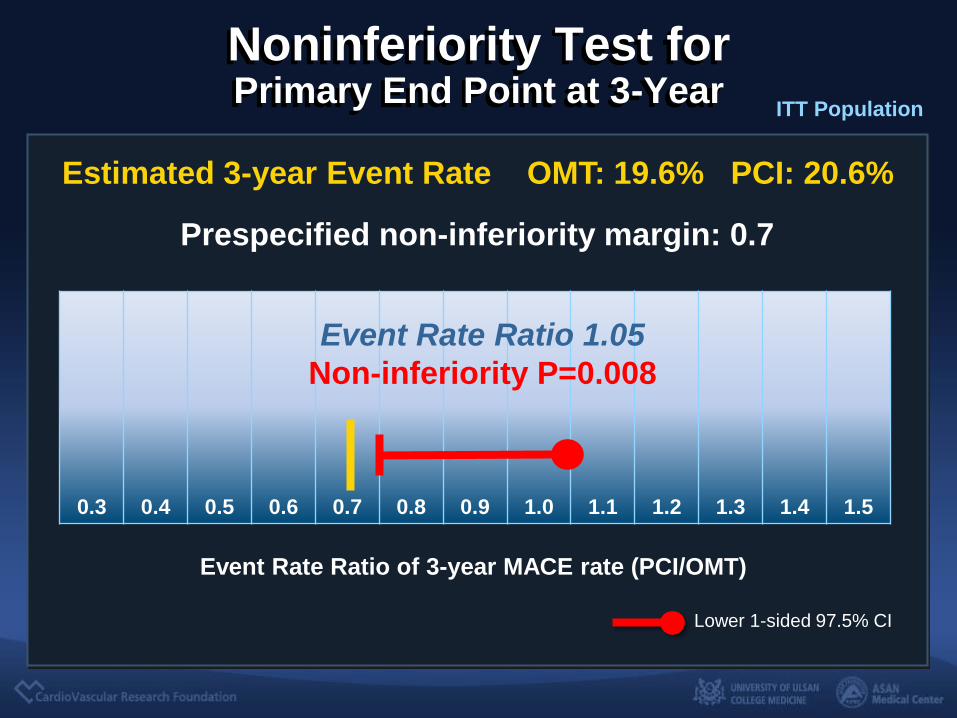
Noninferiority Test for Primary End Point at 3-Year
Prespecified non-inferiority margin: 0.7
Lower 1-sided 97.5% CI
0.3 0.4 0.5 0.6 0.7 0.8 0.9 1.0 1.1 1.2 1.3 1.4 1.5
Event Rate Ratio 1.05
Non-inferiority P=0.008
Estimated 3-year Event Rate OMT: 19.6% PCI: 20.6%
Event Rate Ratio of 3-year MACE rate (PCI/OMT)
ITT Population
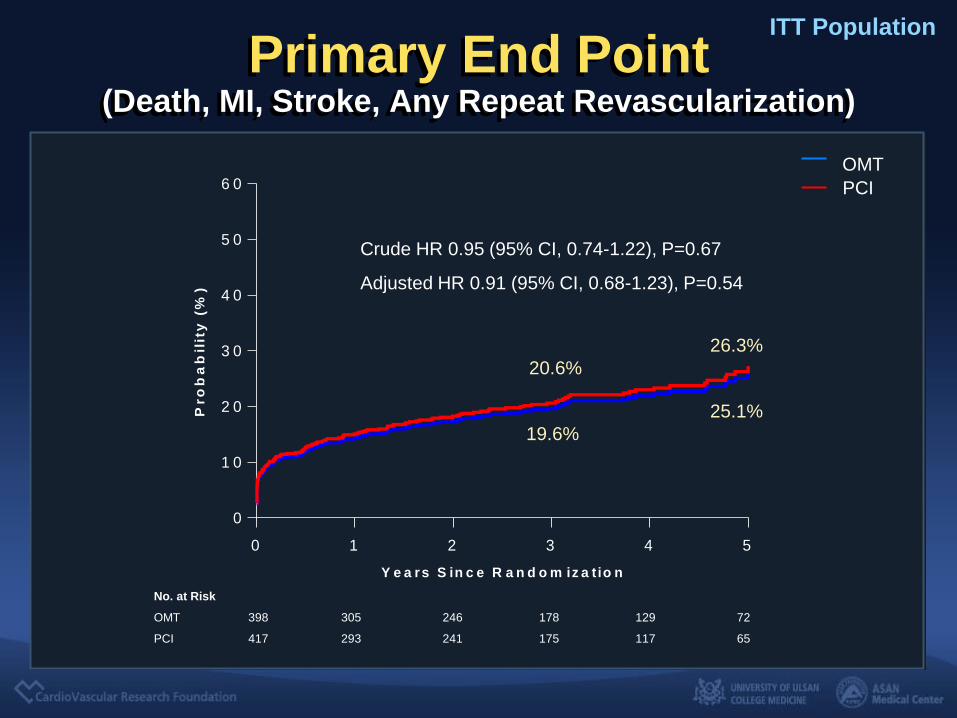
Primary End Point (Death, MI, Stroke, Any Repeat Revascularization)
ITT Population
No. at Risk
OMT 398 305 246 178 129 72
PCI 417 293 241 175 117 65
Y e a rs S in c e R a n d o m iz a t io n
Pro
ba
bil
ity
(%
)
0 1 2 3 4 5
0
1 0
2 0
3 0
4 0
5 0
6 0
Crude HR 0.95 (95% CI, 0.74-1.22), P=0.67
Adjusted HR 0.91 (95% CI, 0.68-1.23), P=0.54
20.6%
19.6%
25.1%
26.3%
PCI
OMT
0 1 2 3 4 5
0
1 0
2 0
3 0
4 0
5 0
6 0
Y e a r s s i n c e R a n d o m i z a t i o n
Pr
ob
ab
ilit
y (%
)
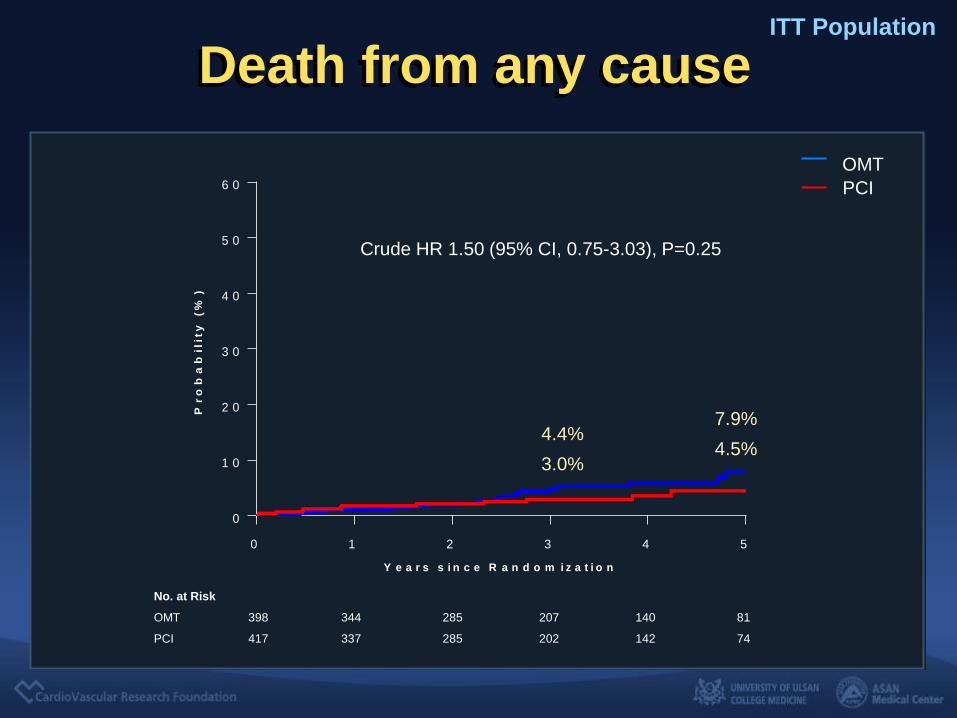
Death from any cause ITT Population
No. at Risk
OMT 398 344 285 207 140 81
PCI 417 337 285 202 142 74
Crude HR 1.50 (95% CI, 0.75-3.03), P=0.25
4.4%
3.0% 4.5%
7.9%
PCI
OMT
0 1 2 3 4 5
0
1 0
2 0
3 0
4 0
5 0
6 0
Y e a r s s i n c e R a n d o m i z a t i o n
Pr
ob
ab
ilit
y (%
)
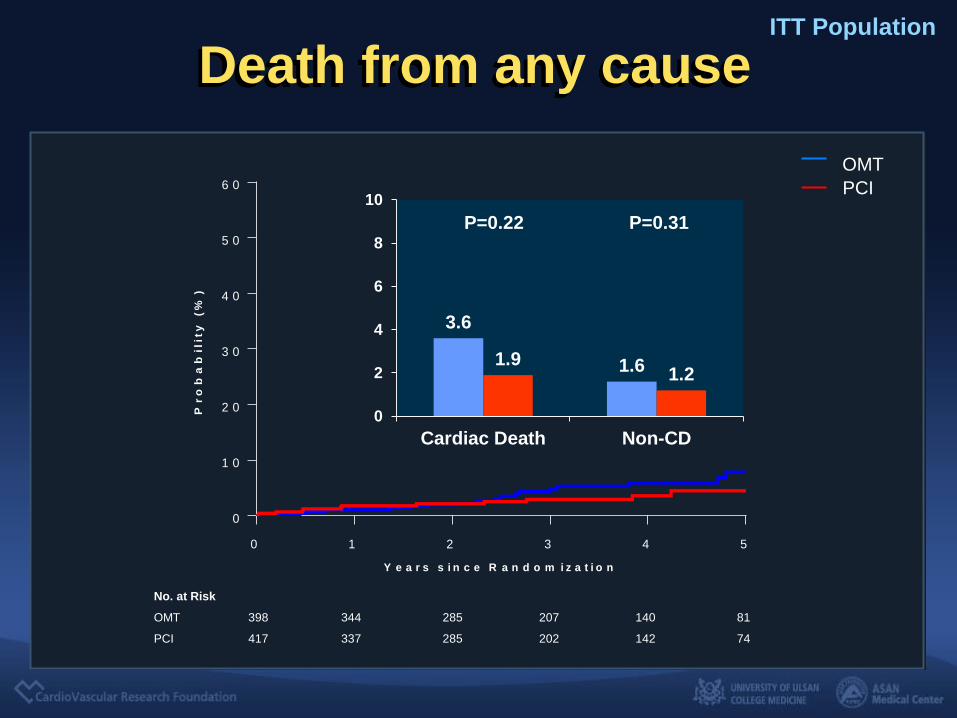
Death from any cause ITT Population
No. at Risk
OMT 398 344 285 207 140 81
PCI 417 337 285 202 142 74
PCI
OMT
3.6
1.6 1.9 1.2
0
2
4
6
8
10
Cardiac Death Non-CD
P=0.22 P=0.31

0 1 2 3 4 5
0
1 0
2 0
3 0
4 0
5 0
6 0
Y e a r s s i n c e R a n d o m i z a t i o n
Pr
ob
ab
ilit
y (%
)
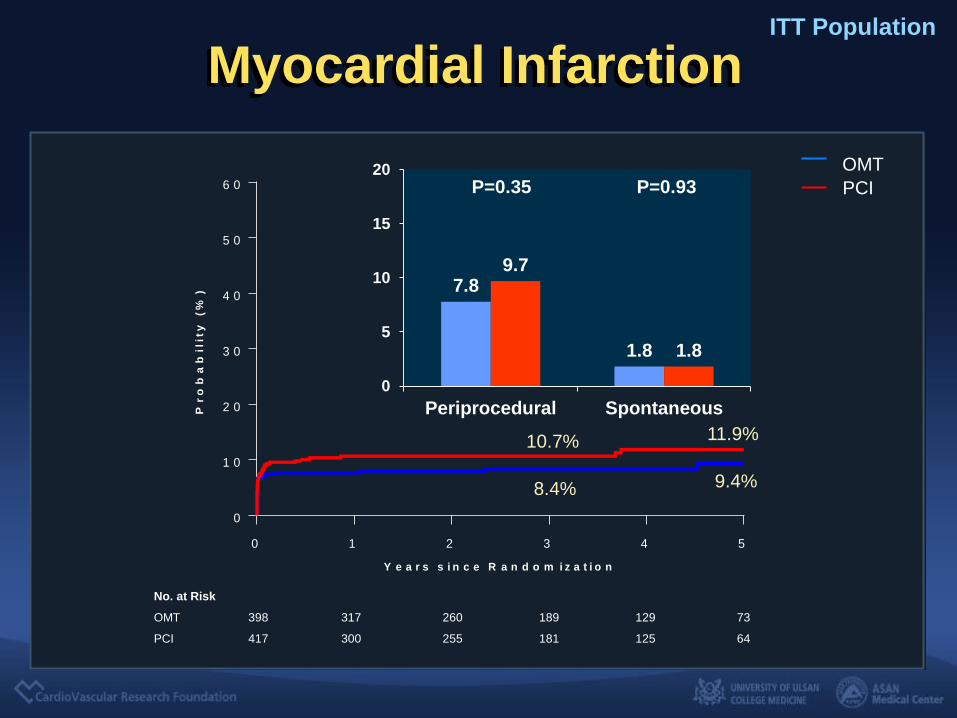
Myocardial Infarction ITT Population
No. at Risk
OMT 398 317 260 189 129 73
PCI 417 300 255 181 125 64
Crude HR 0.77 (95% CI, 0.49-1.19), P=0.24
10.7%
8.4% 9.4%
11.9%
PCI
OMT
0 1 2 3 4 5
0
1 0
2 0
3 0
4 0
5 0
6 0
Y e a r s s i n c e R a n d o m i z a t i o n
Pr
ob
ab
ilit
y (%
)
Myocardial Infarction ITT Population
No. at Risk
OMT 398 317 260 189 129 73
PCI 417 300 255 181 125 64
10.7%
8.4% 9.4%
11.9%
PCI
OMT
7.8
1.8
9.7
1.8
0
5
10
15
20
Periprocedural Spontaneous
P=0.35 P=0.93
0 1 2 3 4 5
0
1 0
2 0
3 0
4 0
5 0
6 0
Y e a r s s i n c e R a n d o m i z a t i o n
Pr
ob
ab
ilit
y (%
)
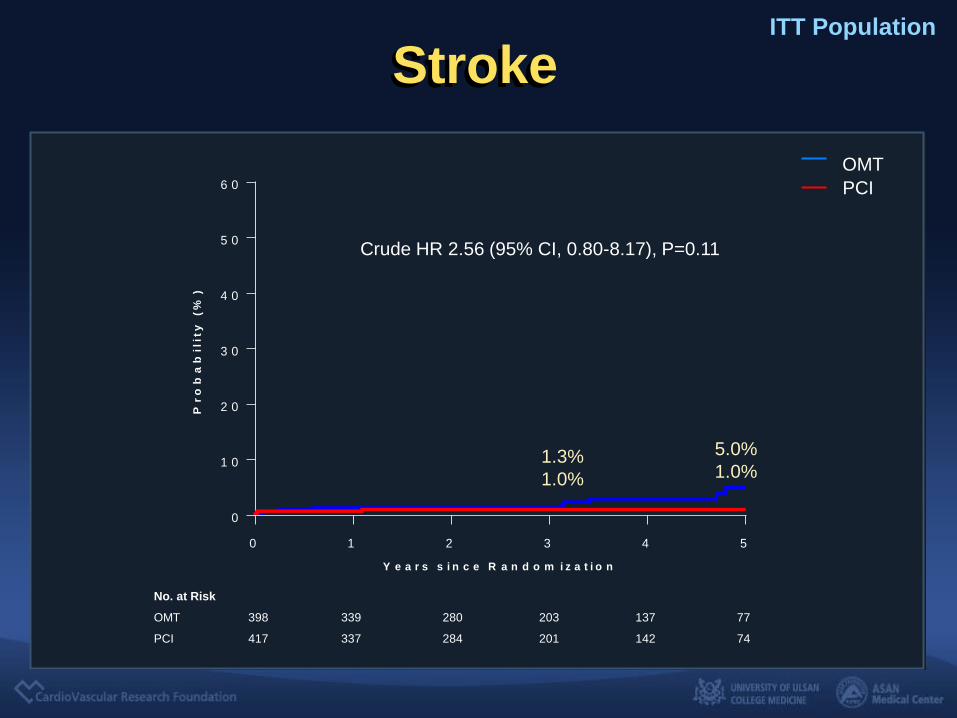
Stroke ITT Population
No. at Risk
OMT 398 339 280 203 137 77
PCI 417 337 284 201 142 74
Crude HR 2.56 (95% CI, 0.80-8.17), P=0.11
1.3%
1.0% 1.0%
5.0%
PCI
OMT
0 1 2 3 4 5
0
1 0
2 0
3 0
4 0
5 0
6 0
Y e a r s s i n c e R a n d o m i z a t i o n
Pr
ob
ab
ilit
y (%
)
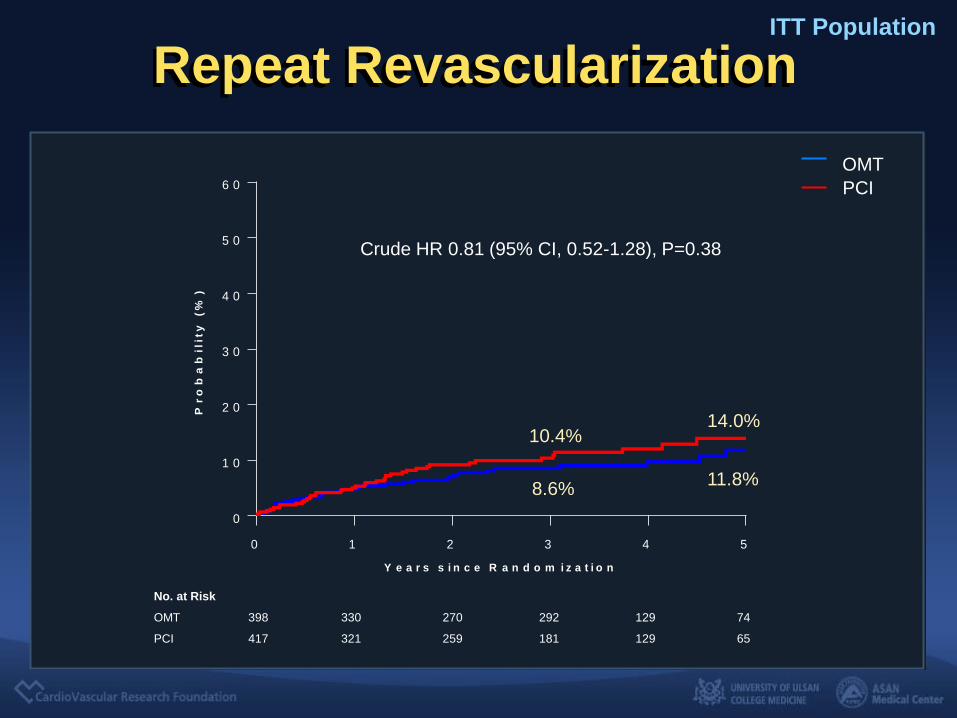
Repeat Revascularization ITT Population
No. at Risk
OMT 398 330 270 292 129 74
PCI 417 321 259 181 129 65
Crude HR 0.81 (95% CI, 0.52-1.28), P=0.38
10.4%
8.6% 11.8%
14.0%
PCI
OMT
0 1 2 3 4 5
0
1 0
2 0
3 0
4 0
5 0
6 0
Y e a r s s i n c e R a n d o m i z a t i o n
Pr
ob
ab
ilit
y (%
)
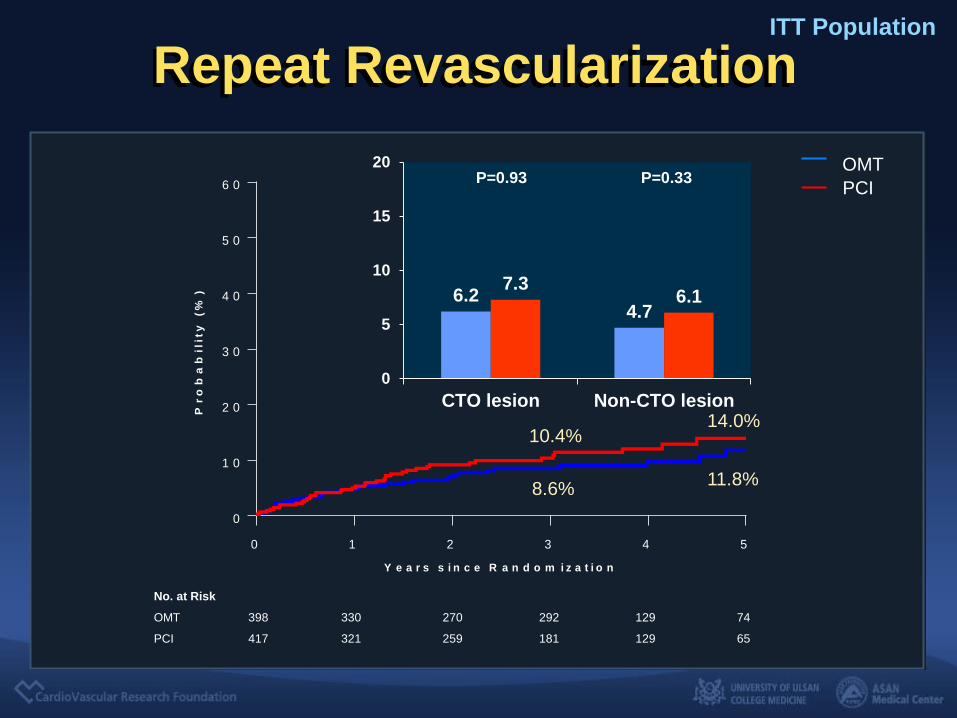
Repeat Revascularization ITT Population
No. at Risk
OMT 398 330 270 292 129 74
PCI 417 321 259 181 129 65
10.4%
8.6% 11.8%
14.0%
PCI
OMT
6.2 4.7
7.3 6.1
0
5
10
15
20
CTO lesion Non-CTO lesion
P=0.93 P=0.33
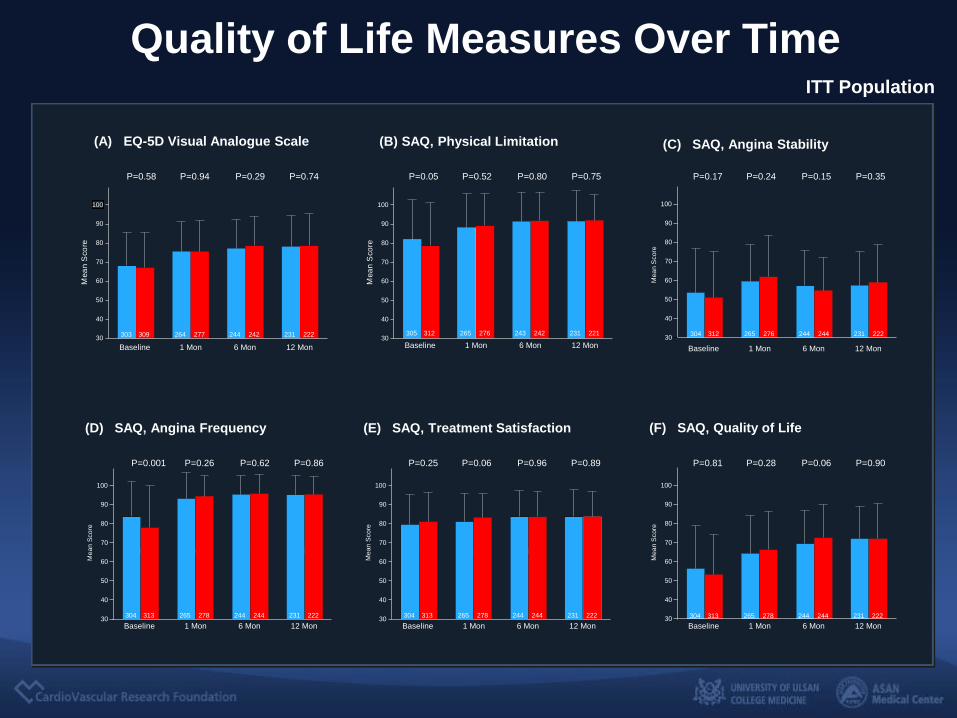
Quality of Life Measures Over Time
0.0 1.0 6.0 12.0
30
40
50
60
70
80
90
100
6 Mon
303 309
P=0.29 P=0.94 P=0.74
Baseline 12 Mon
244 242 231 222
1 Mon
P=0.58
264 277
(A) EQ-5D Visual Analogue Scale
M e
a n
S c
o r e
0.0 1.0 6.0 12.0
30
40
50
60
70
80
90
100
305 312
P=0.80 P=0.52 P=0.75
243 242 231 221
P=0.05
265 276
(B) SAQ, Physical Limitation
M e
a n
S c
o r e
6 Mon Baseline 12 Mon 1 Mon
6.0 12.0
30
40
50
60
70
80
90
100
304 312
P=0.15 P=0.24 P=0.35
244 244 231 222
P=0.17
265 276
(C) SAQ, Angina Stability
M e
a n
S c o
r e
6 Mon Baseline 12 Mon 1 Mon
30
40
50
60
70
80
90
100
304 313
P=0.62 P=0.26 P=0.86
244 244 231 222
P=0.001
265 278
(D) SAQ, Angina Frequency
M e
a n S
c o
r e
6 Mon Baseline 12 Mon 1 Mon 30
40
50
60
70
80
90
100
304 313
P=0.96 P=0.06 P=0.89
244 244 231 222
P=0.25
265 278
(E) SAQ, Treatment Satisfaction
M e
a n S
c o
r e
6 Mon Baseline 12 Mon 1 Mon 30
40
50
60
70
80
90
100
304 313
P=0.06 P=0.28 P=0.90
244 244 231 222
P=0.81
265 278
(F) SAQ, Quality of Life
M e
a n
S c o
r e
6 Mon Baseline 12 Mon 1 Mon
ITT Population

Subgroup Analysis
Sex
Acute coronary syndrome
Ejection fraction
Previous myocardial infarction
Multi-vessel disease
CTO located in the left anterior descending artery
Hazard ratio (95% CI)
0 .1 10PCI Better OMT Better
Typical chest pain
Yes
≥ 65 y
Subgroup
< 65 y
Age
Diabetes
Yes
No
Overall
Male
Female
No
Yes
No
≥ 50%
< 50%
Yes
No
Yes
No
Yes
No
0.85 (0.56−1.29)
1.05 (0.67−1.64)
p value for
Interaction
0.95 (0.70−1.28)
0.91 (0.65−1.28)
1.07 (0.54−2.13)
0.80 (0.48−1.32)
1.03 (0.70−1.50)
0.83 (0.30−2.34)
0.96 (0.70−1.32)
1.64 (0.88−3.05)
0.82 (0.57−1.19)
0.91 (0.64−1.30)
1.21 (0.67−2.19)
1.01 (0.72−1.41)
0.70 (0.33−1.47)
0.93 (0.57−1.53)
0.94 (0.64−1.38)
0.51
0.65
0.45
0.77
0.18
0.44
0.39
0.98
0.91 (0.64−1.29)
1.63 (0.85−3.11)
0.56
OMT
43/172 (25.0)
81/387 (20.9)
PCI
38/237 (16.0)
86/411 (20.9)
38/215 (17.7)
48/174 (27.6)
63/315 (20.0) 71/342 (20.8)
18/72 (25.0) 15/69 (21.7)
29/133 (21.8) 32/132 (24.2)
52/254 (20.5) 54/279 (19.4)
6/34 (17.6) 9/45 (20.0)
75/353 (21.2) 77/366 (21.0)
29/97 (29.9)
52/290 (17.9)
26/113 (23.0)
60/298 (20.1)
60/321 (18.7)
21/66 (31.8)
63/332 (19.0)
23/79 (29.1)
69/286 (24.1)
12/101 (11.9)
69/301 (22.9)
17/110 (15.5)
29/161 (18.0)
52/226 (23.0)
34/183 (18.6)
52/228 (22.8)
no. of patients with event/total no. (%)
65/278 (23.4)
16/109 (14.7)
64/311 (20.6)
22/100 (22.0)

Per Protocol Analysis
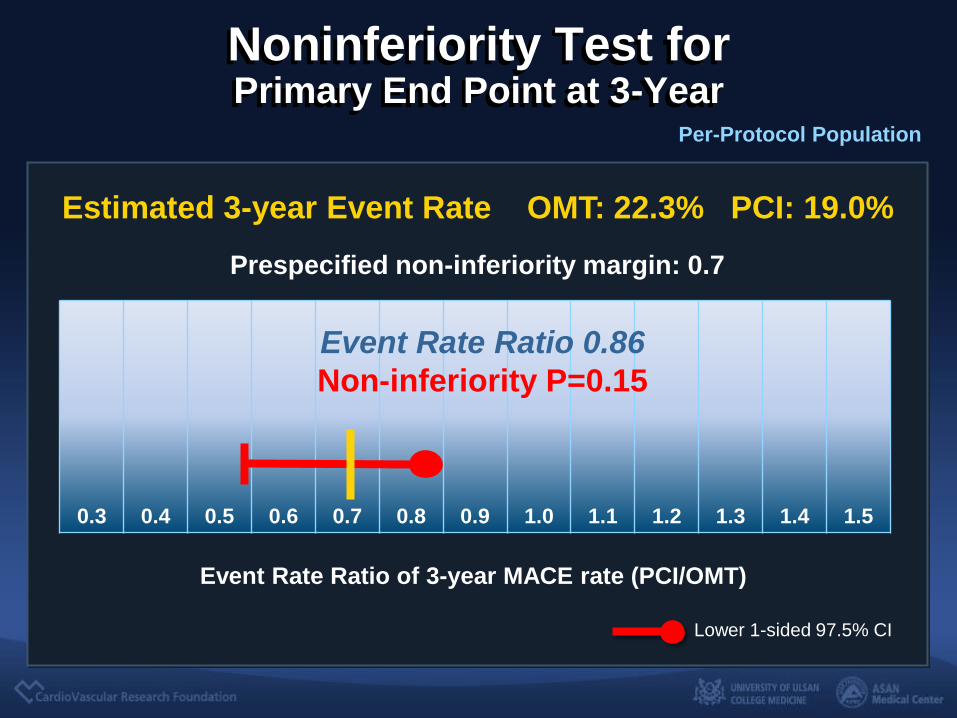
Noninferiority Test for Primary End Point at 3-Year
Prespecified non-inferiority margin: 0.7
Lower 1-sided 97.5% CI
0.3 0.4 0.5 0.6 0.7 0.8 0.9 1.0 1.1 1.2 1.3 1.4 1.5
Event Rate Ratio 0.86
Non-inferiority P=0.15
Event Rate Ratio of 3-year MACE rate (PCI/OMT)
Per-Protocol Population
Estimated 3-year Event Rate OMT: 22.3% PCI: 19.0%

Primary End Point (Death, MI, Stroke, Any Repeat Revascularization)
No. at Risk
OMT 310 241 190 131 95 54
PCI 346 250 209 150 98 52
Y e a rs S in c e R a n d o m iz a t io n
Pro
ba
bil
ity
(%
)
0 1 2 3 4 5
0
1 0
2 0
3 0
4 0
5 0
6 0
22.3%
19.0%
25.0%
29.0%
Crude HR 1.195 (95% CI, 0.86-1.66), P=0.30
Adjusted HR 1.08 (95% CI, 0.75-1.56), P=0.67
PCI
OMT

As Treated Analysis
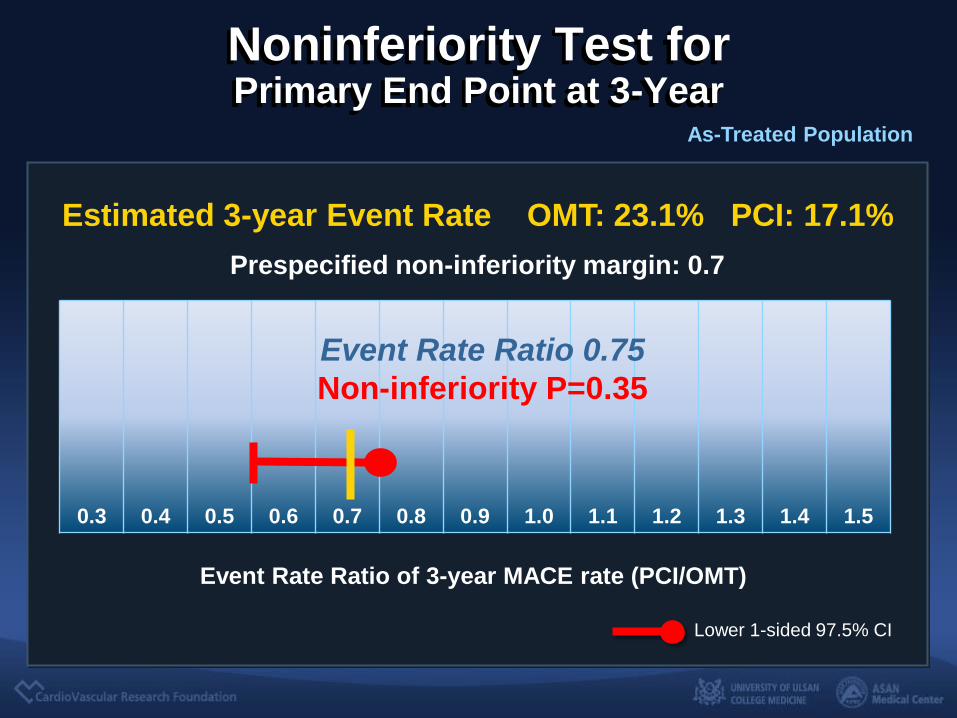
Noninferiority Test for Primary End Point at 3-Year
Prespecified non-inferiority margin: 0.7
Lower 1-sided 97.5% CI
0.3 0.4 0.5 0.6 0.7 0.8 0.9 1.0 1.1 1.2 1.3 1.4 1.5
Event Rate Ratio 0.75
Non-inferiority P=0.35
Event Rate Ratio of 3-year MACE rate (PCI/OMT)
As-Treated Population
Estimated 3-year Event Rate OMT: 23.1% PCI: 17.1%
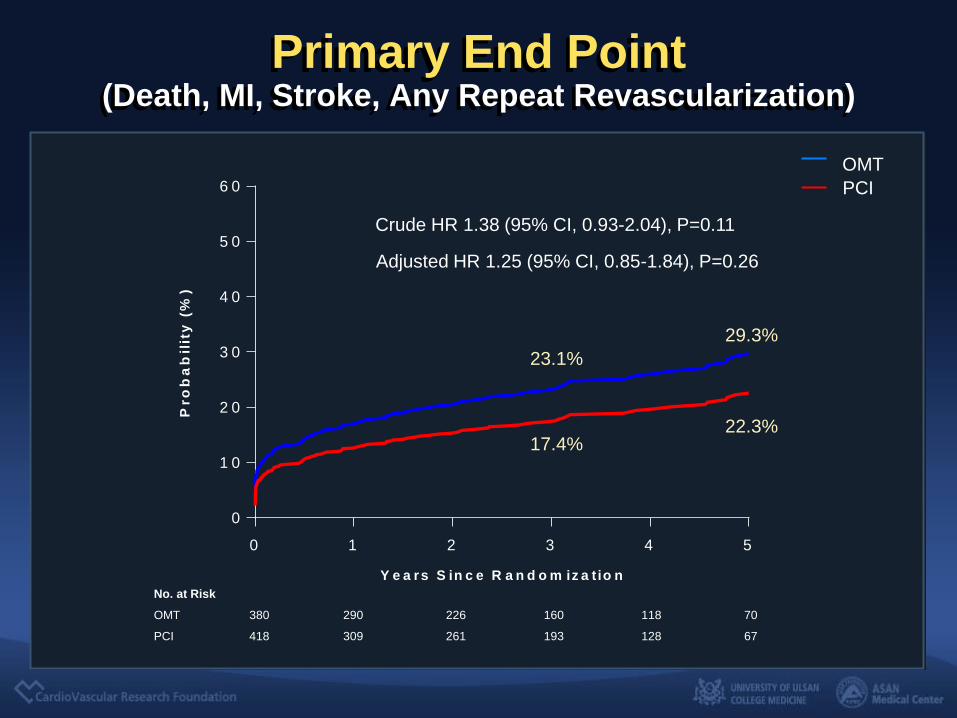
Primary End Point (Death, MI, Stroke, Any Repeat Revascularization)
PCI
OMT
No. at Risk
OMT 380 290 226 160 118 70
PCI 418 309 261 193 128 67
0 1 2 3 4 5
0
1 0
2 0
3 0
4 0
5 0
6 0
Y e a rs S in c e R a n d o m iz a t io n
Pro
ba
bil
ity
(%
)
23.1%
17.4% 22.3%
29.3%
Crude HR 1.38 (95% CI, 0.93-2.04), P=0.11
Adjusted HR 1.25 (95% CI, 0.85-1.84), P=0.26

The Assigned and Actually
Treated Strategies
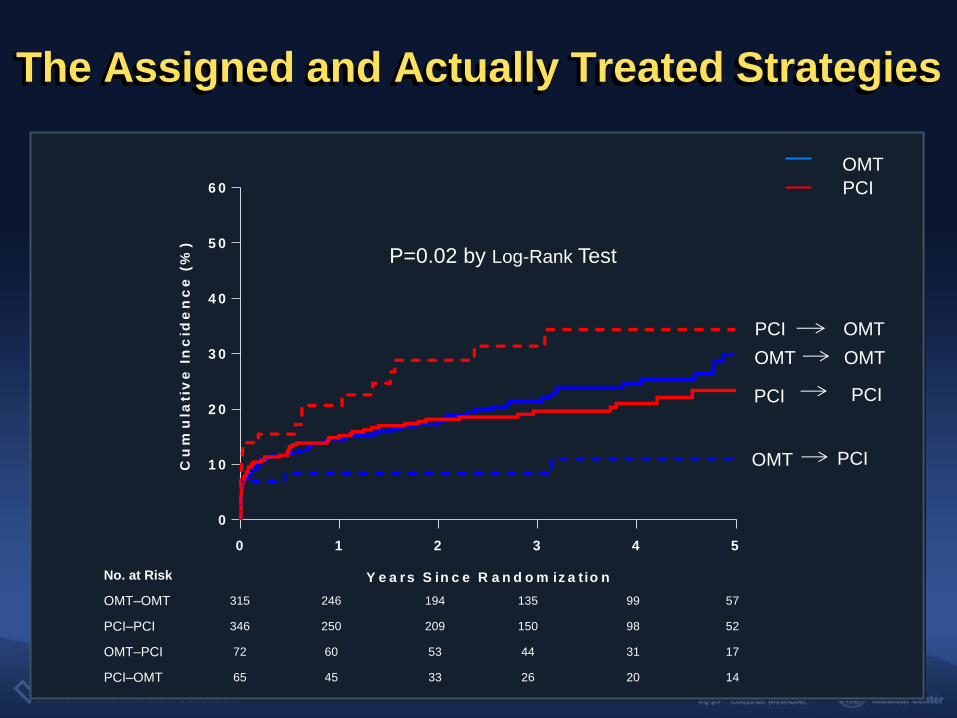
The Assigned and Actually Treated Strategies
0 1 2 3 4 5
0
1 0
2 0
3 0
4 0
5 0
6 0
Y e a rs S in c e R a n d o m iz a t io n
Cu
mu
lati
ve
In
cid
en
ce
(%
)
No. at Risk
OMT–OMT 315 246 194 135 99 57
PCI–PCI 346 250 209 150 98 52
OMT–PCI 72 60 53 44 31 17
PCI–OMT 65 45 33 26 20 14
P=0.02 by Log-Rank Test
OMT OMT
PCI PCI
OMT PCI
PCI OMT
PCI
OMT
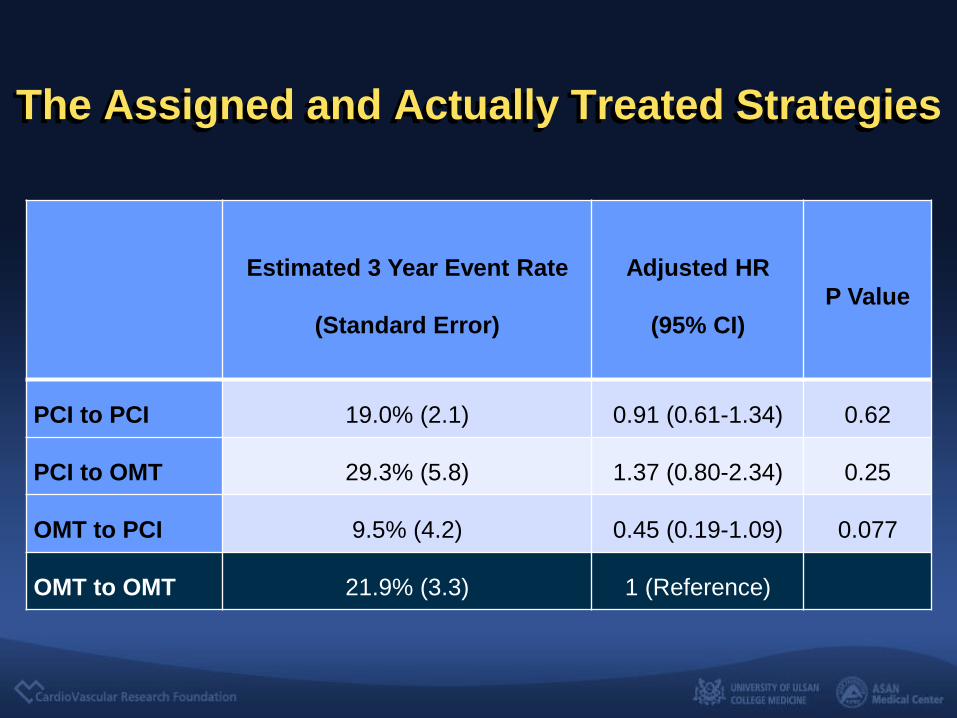
The Assigned and Actually Treated Strategies
Estimated 3 Year Event Rate
(Standard Error)
Adjusted HR
(95% CI)
P Value
PCI to PCI 19.0% (2.1) 0.91 (0.61-1.34) 0.62
PCI to OMT 29.3% (5.8) 1.37 (0.80-2.34) 0.25
OMT to PCI 9.5% (4.2) 0.45 (0.19-1.09) 0.077
OMT to OMT 21.9% (3.3) 1 (Reference)
Conclusion
• The DECISION-CTO trial is the first randomized
clinical trial to compare the strategy of OMT alone
with that of PCI in patients with coronary CTO.
• The ITT analysis showed that OMT as an initial
strategy was non-inferior to PCI with respect to the
primary endpoint of the composite of death, MI,
stroke, or any revascularization at 3 years.
• The measures of health-related quality of life in
the OMT and the PCI groups were comparable
throughout the follow-up period
Conclusion
• However, OMT did not meet the statistical criteria
for noninferiority compared with PCI in the
predefined per-protocol and as-treated
population-based analyses, although event rates
were not significantly different between groups at
3 years.
• This study suggested that OMT could be a
reasonable initial treatment strategy for coronary
CTO compared with CTO-PCI. Further
randomized clinical trials are necessary.

Thank You !!
summitMD.com