decision support & bpm - fisher college of business college of business decision support &...
TRANSCRIPT
CENTER FOR BUSINESS PERFORMANCE MANAGEMENT
Fisher College of Business
Decision Support & BPM
An Overview of Scorecards and Dashboards
Kalpesh Shah
MBA Candidate 2010
This paper is part of the requirement for the Center for Business Performance Management Certification
program at the Fisher College of Business.

Decision Support & BPM Kalpesh Shah
2
Table of Contents
Executive Summary ........................................................................................................................ 3
Abstract ........................................................................................................................................... 4
1. Introduction ................................................................................................................................. 5
1.1 Business Performance Management ..................................................................................... 5
1.2 Dashboards ............................................................................................................................ 6
1.3 Scorecards ............................................................................................................................. 6
2. Dashboard vs. Scorecard ............................................................................................................. 7
3. Reliability of scorecards and dashboards .................................................................................. 10
4. Briefing books ........................................................................................................................... 11
5. Market for BPM products & services5. Reliability of scorecards and dashboards .................. 12
6. Industry perspective on BPM.................................................................................................... 14
6.1 BPM in Services Industry ................................................................................................... 14
6.2 Benefits of BPM in services industry ................................................................................. 15
6.3 Risks of BPM in services industry ...................................................................................... 16
7. Summary ................................................................................................................................... 18
8. References ................................................................................................................................. 26
Research Reports ...................................................................................................................... 26

Decision Support & BPM Kalpesh Shah
3
Executive Summary
A detailed analysis of the business performance management industry indicates that
amongst the large number of organizations that have access to and utilize the tools available for
gathering Business Intelligence, only 20% of the firms actually effectively utilize the results to
make strategic decisions. Generally, the results of tools such as scorecards and dashboards have
an approximately 80% impact on the P&L of organizations. In spite of this huge impact of the
tools available in the market, it is seen that a large number of organizations don’t really
understand the importance of the tools in their workplace. Scorecards and dashboards fall in a
pool of decision making tools that are accessible to organizations and provide a large amount of
information to make strategic decisions. The future for these tools is geared towards increased
ability to predict future performance, conduct highly efficient forecasts and the ability to identify
key barriers to performance either at the department or organization level. The model given
below indicates different pieces of this industry (referenced on multiple occasions in this paper).
The focus of this paper is the decision piece that is critical and is utilized by managers to
help make strategic and operational decisions for the firm.
Focus

Decision Support & BPM Kalpesh Shah
4
Abstract
BPM is relevant to every organization, regardless of industry sector, because all
organizations need analytics (for example, profitability analysis and performance to financial
planning), as well as the management information (financial management reports, budgets and
statutory reports) to support the CFO and finance team, and to deliver management information
to the leadership team, which is one of the main areas of focus for Business Performance
Management. Recently the U.S. Securities and Exchange Commission (SEC) announced a
proposed move to International Financial Reporting Standards (IFRS) adoption by U.S. issuers.
IFRS is the adopted financial reporting standard used by more than 100 countries worldwide,
including all of Europe. It is anticipated that this move will provide another driver for
organizations to adopt BPM suites to provide their financial consolidation and reporting in
support of these standards.
The objective of this research paper is to further develop knowledge in the area of
Business Performance Management by focusing on a specific area of decision support. This
research paper focuses on measurement systems such as Scorecards and Dashboards. It would
also provide insights into the Briefing Books feature which provide a comprehensive view of
performance information for senior management. Specific research on scorecards for services
businesses is included along with informational interviews to be conducted with organizations
that currently implement such performance scorecards and dashboards to measure sustained
profitable growth. The paper will also make an ambitious attempt to question the reliability of
these measurement systems and how products such as Oracle Essbase, SAP Business Objects or
IBM Cognos utilize these measurement systems for analysis through industry research reports
and interviews.
This research paper is being done under the guidance of Mr. John Hemenway; Director,
Center for Business Performance Management at the Fisher College of Business.

Decision Support & BPM Kalpesh Shah
5
1. Introduction
1.1 Business Performance Management
Business Performance Management (BPM)/Corporate Performance Management (CPM)
is a set of management and analytic processes, supported by technology, that enable businesses
to define strategic goals and then measure and manage performance against those goals1. It
comprises of processes to manage strategy formulation, budgeting, planning and forecasting
(BP&F)2, financial reporting for senior executives, finance teams and corporate-level decision
makers. BPM applications are also crucial in linking strategy to operational execution where mid
level managers and operational personnel can utilize business intelligence (BI) for productivity
analysis, performance measurement and statistical reporting. Research indicates that one cannot
implement BPM or scorecards without a solid BI and data warehousing infrastructure to support
the system. As the markets change and evolve, organizations are continuously looking at using
new methods and tools to help them adapt, thrive in the current competitive environment, and
execute effectively and efficiently. For instance, since passage of the Sarbanes-Oxley Act7,
Board Of Directors in companies have entered a new "age of compliance" and are now required
to validate their decision-making actions. Being well informed is now the new norm, rather than
the exception. BPM tools can assist these senior executives to ensure that Sarbanes-Oxley
compliance requirements are followed in the financial reporting process of their firms.
Prior to the age of BPM, there was a complex relationship between data sources such as
SAP, ERP systems, Oracle, Siebel and data warehousing technologies in the market. At the same
time, these data-warehousing technologies were connected to destination end-users through
disparate systems that provided multiple interfaces over the web to connect the information
source to the end-user of this information. Refer Exhibit 1, a visual representation of this
complex relationship as portrayed by Hyperion. With developments in BPM and the associated
BI tools, some of these linkages were effectively organized by replacing the disparate systems
with Enterprise Applications and BI tools which provided a much consistent interface between
end users and the data-warehousing/ database systems. Refer Exhibit 2, which is another visual
representation that simplifies the transformation brought about by the introduction of BPM and
supporting technologies in the market.

Decision Support & BPM Kalpesh Shah
6
1.2 Dashboards
A dashboard is an application that allows users to see a comprehensive version of
business performance at-a-glance and explore results more deeply when necessary. Dashboards
employ visualization capabilities, such as maps, charts, and gauges, to translate metrics and key
performance indicators into a rich representation that users can easily understand. Dashboards3
aggregate and display metrics and key performance indicators (KPIs), enabling them to be
examined at a glance before further exploration via additional BI tools. KPIs are financial and
non-financial metrics used to quantify objectives that reflect strategic performance of an
organization. Based on the scope of the project and the target audience, dashboards can be
designed either at the department level or the corporate level.
1.3 Scorecards
A scorecard4 is a tool that can be used to ensure that actions taken across the organization
are in alignment with a clearly defined overall strategy. Chief strategists in corporations use
scorecards to define and measure performance and consistently track it against objectives. The
organization’s decision makers can analyze relationships between KPIs and defined business
objectives so that they can determine what needs to change and how to take action to meet the
strategic targets. From the data perspective, scorecards align actual recorded metrics with short-
term and long-term goals. They can also incorporate company and industry performance
benchmarks and risk factors. Scorecards are a useful tool for effective, enterprise wide
communication of performance. They are also referred as balanced scorecards when the KPIs are
a good mix of internal and external measures and are both financial and non-financial in nature.
A Balanced Scorecard6 monitors key performance indicators in four areas of the business:
financial, customer, internal processes, and learning and growth.
In summary, a dashboard is an application that allows users to see a comprehensive
version of business performance at-a-glance and explore results more deeply when necessary
using BI tools. Whereas scorecard is a tool that can be used to ensure that actions taken across
the organization are in alignment with a clearly defined overall strategy. Scorecards can be used
as a management reporting tool. We will explore the difference between a dashboard and
scorecard within an organization in more detail in the next section.

Decision Support & BPM Kalpesh Shah
7
2. Dashboard vs. Scorecard
The key difference between a dashboard and a scorecard is the audience to which they
cater and the information that they provide. Both are tools which are part of the BI10 solution.
Scorecards are mostly utilized by senior management to view the business performance in the
context of the strategic direction of the overall firm. It attempts to track how the different
business units are performing to achieve the overall goal of the firm. Dashboards are used mostly
by the operational managers to monitor the day-to-day firm operations through visualization. In
an ideal environment, scorecards will enable the organization to measure the performance of
their business and then look at the dashboard to see the current operational status of the problem
area5. Refer Table 1 for a more detailed comparison between Scorecard and Dashboard usage.
Due to relatively8 low barrier to entry in terms of both price and ease of deployment,
dashboards are more readily adopted than scorecards. Dashboards are often used to alert workers
to exceptional and unexpected performance results, and users can analyze business drivers and
trends – though not the cause – from the dashboard application. This explains the operational
aspect of dashboards in the industry. Scorecards8, on the other hand, are used to see beyond what
is happening throughout the organization into the cause-and-effect relationships between
performance and strategy to help define what must happen next and also how well aligned
current performance is with the organizations overall strategic objectives. Strategists can work
together to define and manage business strategy, actions and goal communication across the
organization. Scorecards are not only expensive to buy but also require complete system
information to implement within an organization. At the same time, every individual in the
organization would not have an identical scorecard; it should vary by department, area and
person9. All should be related and clearly drive toward achievement of the same strategic plan,
but each scorecard should reflect how that area or person individually contributes.
Considering the differences between dashboards and scorecards it can be concluded that:
dashboards support a reactive process by enabling any user to easily answer the question: Why
did I miss my goal? This is possible because it provides access to historic and current
performance metrics for each component of the business. However, by utilizing scorecards,
business performance is evaluated from a strategic standpoint by asking the question: How far
am I from achieving my firm’s strategic goals? This information if utilized effectively by
executives can help to drive the organization from ‘being reactive’ to ‘becoming proactive’ by

Decision Support & BPM Kalpesh Shah
8
clearing measuring performance against defined strategic goals and making suitable changes as
needed to focus on the target. If firms can make this shift, it will allow businesses to make the
right decisions when it really matters by using the wealth of information that is available through
the BPM tools.
Table 1: Scorecard vs. Dashboard5,11
Dashboard (Operational)
Scorecard (Strategic)
Business Use Monitor business operations Measure performance against objectives
Primary users Operations managers Senior executives
Utilized at Department/business unit
level
Corporate/organizational level
Level of Data High level of details. Used to
analyze financial/operational
performance of different
business units/departments.
Summarized data for executives with
KPI’s as they relate to strategy,
accountability and execution to make
long-term decisions.
Frequency of
data updates
Intra-day update to monitor
performance over a finer
time slice (hours/minutes)
Monthly/Quarterly/Annual update of
overall strategic position. Focus on data
over a longer time context
Display
technique used
Graphs, grids, gauges and a
variety of visualization
techniques to highlight the
operational data
KPI’s, symbols and icons that measure
progress towards a strategic firm
objective.
Always Remember to…
Choose indicators that will
inform an individual of
actions to take.
Ensure performance objectives really
align with the organizational objectives.

Decision Support & BPM Kalpesh Shah
9
Predictive capability in Scorecards and Dashboards:
In terms of increasing the relevance of scorecards and dashboards to make strategic
decisions in the future, it is important to move beyond the current utilization towards forecasting
based on the historic performance of the firm. Given the level and extent of information available
within these systems and the level of detail that can be retrieved, it makes intuitive sense to use
these tools as predictive mechanisms to predict how future performance is going to be relative to
the current scenario. Based on the drivers and metrics that the firm considers as crucial for
growth it is possible to use the scorecards and dashboards to come up with future performance
targets based on future cost drivers rather than historical information. Historical data may not be
the most accurate measure of firm performance in the future hence it makes more sense to use
these tools to track performance based on future goals and objectives.

Decision Support & BPM Kalpesh Shah
10
3. Reliability of scorecards and dashboards
If used effectively, dashboards and scorecards can add real value to businesses. The real
value of the business intelligence infrastructure (e.g., data warehouse and other foundation
systems) is realized only when a certain level of visualization is achieved through these
scorecards and dashboards19. Dashboards and scorecards provide a rapid and convenient way to
quickly assess how firms are doing with the business metrics critical to their place in the
industry. One still can and should rely on the tabular and graphical data to back up the
information portrayed in the dashboards and scorecards.
Valid KPI: Reliability of scorecards and dashboards can be highly influenced by the KPI’s
selected in designing these measurement tools. The broader KPI’s can be disseminated to other
layers of the organization with more specific metrics pertaining to that particular business unit.
For example, the corporate profit goal may be translated to the business unit with a KPI of
increasing the profit margin by X percent. These KPI’s and hence business unit performance are
measured by using dashboards and scorecards.
No. of indicators: A common threat19 with using dashboards in performance management
relates to the number of parameters/indicators used for measurement. These relate directly to the
KPI’s of the system. Care should be taken to include only the most critical indications, at least at
the top level. Too many gauges will deemphasize the really important parameters and reduce the
efficiency of performance monitoring. Scorecards on the other hand traditionally take more
effort to assemble and refine. It is also important that you have reliable and consistent
information in place to back up the indications on your scorecard. This is important because
scorecards use the information to generate trends showing the direction that the
organization/department is headed. In general, choosing the important and right number of
indicators is critical to the reliability of scorecards and dashboards.
Date validity: The validity19 of the data is also an important indicator to the reliability of
scorecards and dashboards which need to be fed with the real-time or near real-time information
through the data warehouse to allow firms to more rapidly react to deficiencies. Also, while
trying to extract information about KPI’s using the dashboard will not necessarily indicate the
current status of the KPI’s, scorecards do a much better job of elaborately explaining the current
status of system KPI’s.

Decision Support & BPM Kalpesh Shah
11
Software used: Finally, another important consideration in the reliability of scorecard and
dashboard is the software package used to implement the system. There are numerous software
packages on the market today. The best applications will encompass both dashboard and
scorecard technology and have a variety of visual aids that allow creation of those most attractive
to the organization, are also easy to integrate within the existing infrastructure. If these software
systems don’t have streamlined data connectivity and enhanced drill-down capability through
linked reports, OLAP, or other methodologies the reliability of information reflected by
dashboards and scorecards will again be questionable.
4. Briefing books
This paper will briefly introduce Briefing books and provide additional reference material
to gain further insights into this feature of BPM which is provided by several vendors in the
BPM space. Briefing Books12 allow users to measure all aspects of corporate performance from
the Board Of Directors to the operations manager by leveraging a book metaphor, with
individual chapters and pages devoted to specific business areas (risk management, strategy
development, etc.) and KPI metrics of interest to different interest groups in the organization. At
the executive level, where collaboration, document management and interactive analysis are key
activities, briefing books provide dynamic KPI7 tracking and issue resolution, document linking
capabilities and drill-down analysis options.
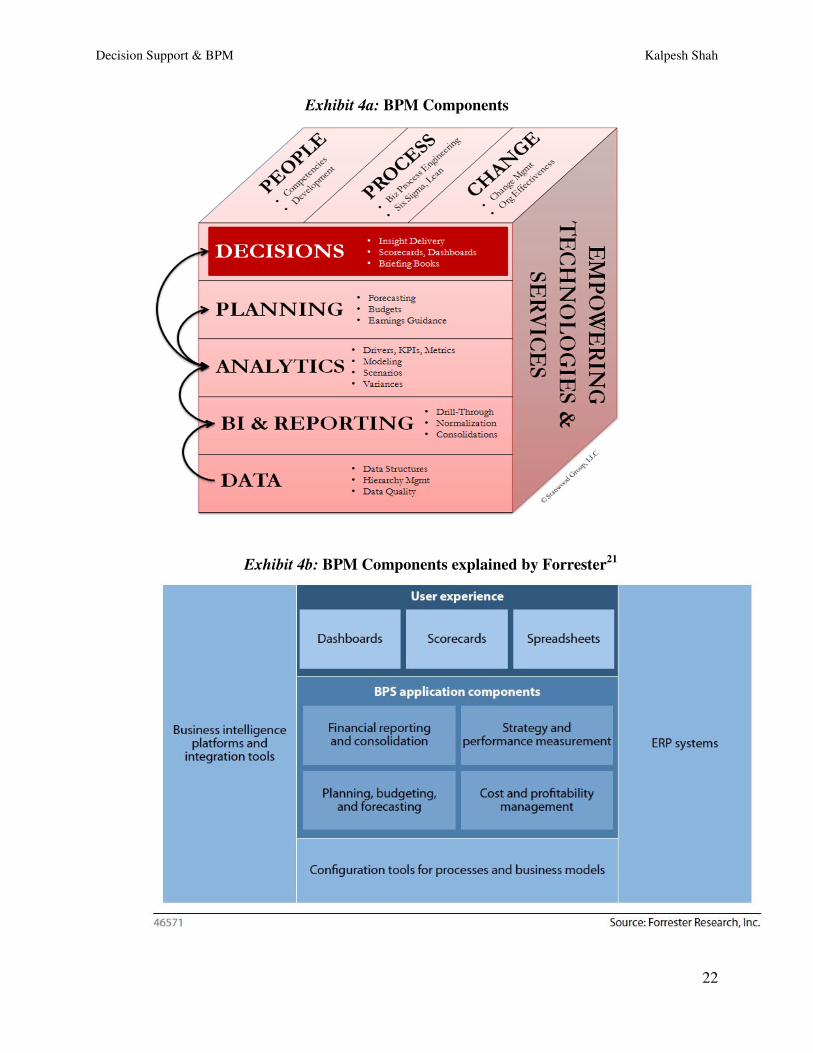
Briefing books can be easily created by integrating multiple component building blocks
such as descriptors, metrics and graphs for visibility at the appropriate business level. As shown
in Exhibit 4 briefing books are also included in the same level of BPM components as scorecards
and dashboards which enable decision making at different levels in the organization. This
decision making process is backed by analytical information and BI reporting tools that helps to
provide the relevant information. Another advantage is the ability to highlight (and track)
problem KPIs via color-coded hierarchical views and cascadation technology. The references
section provides additional sources for more information on briefing books and how they can be
created using different BPM products.

Decision Support & BPM Kalpesh Shah
12
5. Market for BPM products & services5. Reliability of scorecards and
dashboards
If used effectively, dashboards and scorecards can add real value to businesses. The real
value of the business intelligence infrastructure (e.g., data warehouse and other foundation
systems) is realized only when a certain level of visualization is achieved through these
scorecards and dashboards19. Dashboards and scorecards provide a rapid and convenient way to
quickly assess how firms are doing with the business metrics critical to their place in the
industry. One still can and should rely on the tabular and graphical data to back up the
information portrayed in the dashboards and scorecards.
Valid KPI: Reliability of scorecards and dashboards can be highly influenced by the KPI’s
selected in designing these measurement tools. The broader KPI’s can be disseminated to other
layers of the organization with more specific metrics pertaining to that particular business unit.
For example, the corporate profit goal may be translated to the business unit with a KPI of
increasing the profit margin by X percent. These KPI’s and hence business unit performance are
measured by using dashboards and scorecards.
No. of indicators: A common threat19 with using dashboards in performance management
relates to the number of parameters/indicators used for measurement. These relate directly to the
KPI’s of the system. Care should be taken to include only the most critical indications, at least at
the top level. Too many gauges will deemphasize the really important parameters and reduce the
efficiency of performance monitoring. Scorecards on the other hand traditionally take more
effort to assemble and refine. It is also important that you have reliable and consistent
information in place to back up the indications on your scorecard. This is important because
scorecards use the information to generate trends showing the direction that the
organization/department is headed. In general, choosing the important and right number of
indicators is critical to the reliability of scorecards and dashboards.
Date validity: The validity19 of the data is also an important indicator to the reliability of
scorecards and dashboards which need to be fed with the real-time or near real-time information
through the data warehouse to allow firms to more rapidly react to deficiencies. Also, while
trying to extract information about KPI’s using the dashboard will not necessarily indicate the

Decision Support & BPM Kalpesh Shah
13
current status of the KPI’s, scorecards do a much better job of elaborately explaining the current
status of system KPI’s.
Software used: Finally, another important consideration in the reliability of scorecard and
dashboard is the software package used to implement the system. There are numerous software
packages on the market today. The best applications will encompass both dashboard and
scorecard technology and have a variety of visual aids that allow creation of those most attractive
to the organization, are also easy to integrate within the existing infrastructure. If these software
systems don’t have streamlined data connectivity and enhanced drill-down capability through
linked reports, OLAP, or other methodologies the reliability of information reflected by
dashboards and scorecards will again be questionable.
The market landscape for corporate performance management (CPM) suites has changed
dramatically during the past two years as a result of vendor consolidation and, more recently,
portfolio rationalization. Vendor offerings from larger vendors and CPM specialists are rich in
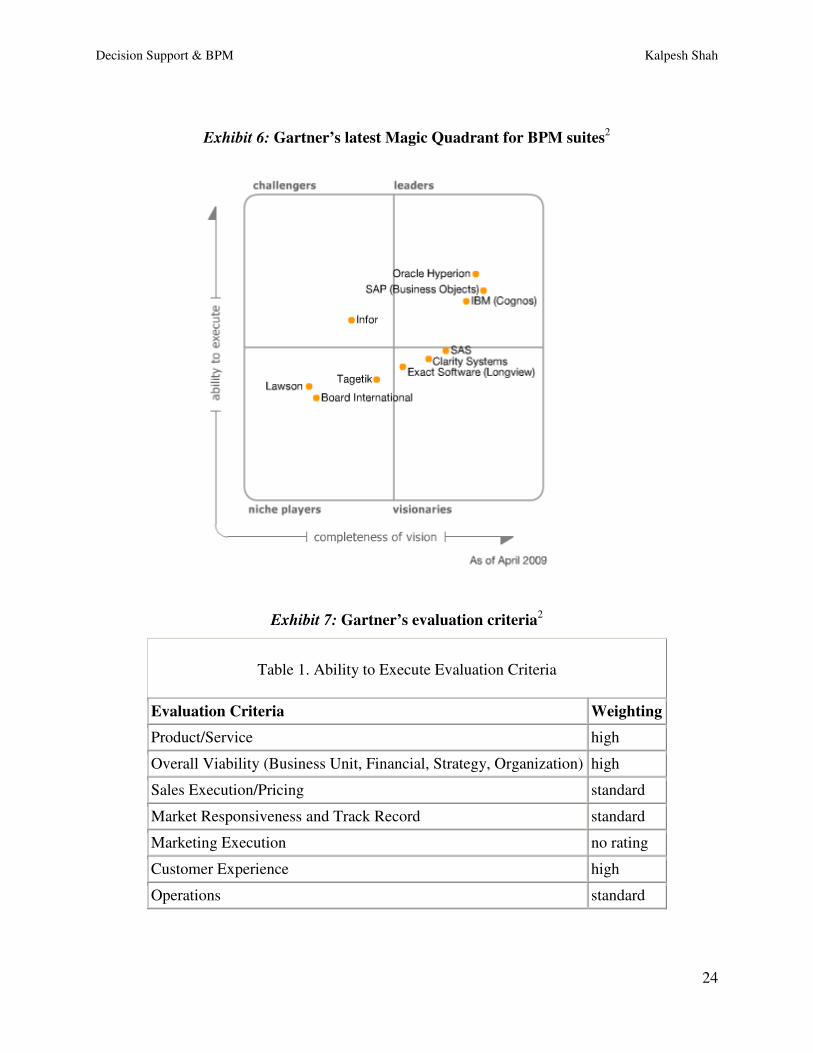
functionality, with many potential benefits. Gartner’s magic quadrant (refer Exhibit 6) does a
good job in segregating the different players in the market for CPM products. Users should
evaluate vendors carefully according to business needs and broader business intelligence and
performance management strategies2 of their firm. The current economic climate is driving
demands from the board of directors to minimize costs and maximize profits, and organizations
are increasingly deploying CPM applications to help management teams make the right strategic
decisions and also to stay in compliance with regulatory requirements. Gartner and Forrester20
also mention that the market for CPM suites and services continues to rapidly grow and mature,
topping $48 billion in license, software solutions and services revenue in 2007. The primary
driver for this growth is that users continue to replace spreadsheet-based applications with more-
robust analytic applications that add workflow and collaboration/control processes. Increasingly,
CPM is being adopted as an enterprise wide initiative and hence the use of scorecards,
dashboards and other reporting tools will continue to grow.
The CPM market is populated with many vendors, some offering a broad range of
solutions, while others have limited specific point applications. Among others, one of the key
criteria to evaluate competition in this market is the ability to execute (refer Exhibit 7).Oracle,
IBM and SAP are identified as leaders in the market. They can deliver breadth and depth of CPM
suite functionality, as well as provide enterprise wide implementations to support a broad CPM
Decision Support & BPM Kalpesh Shah
14
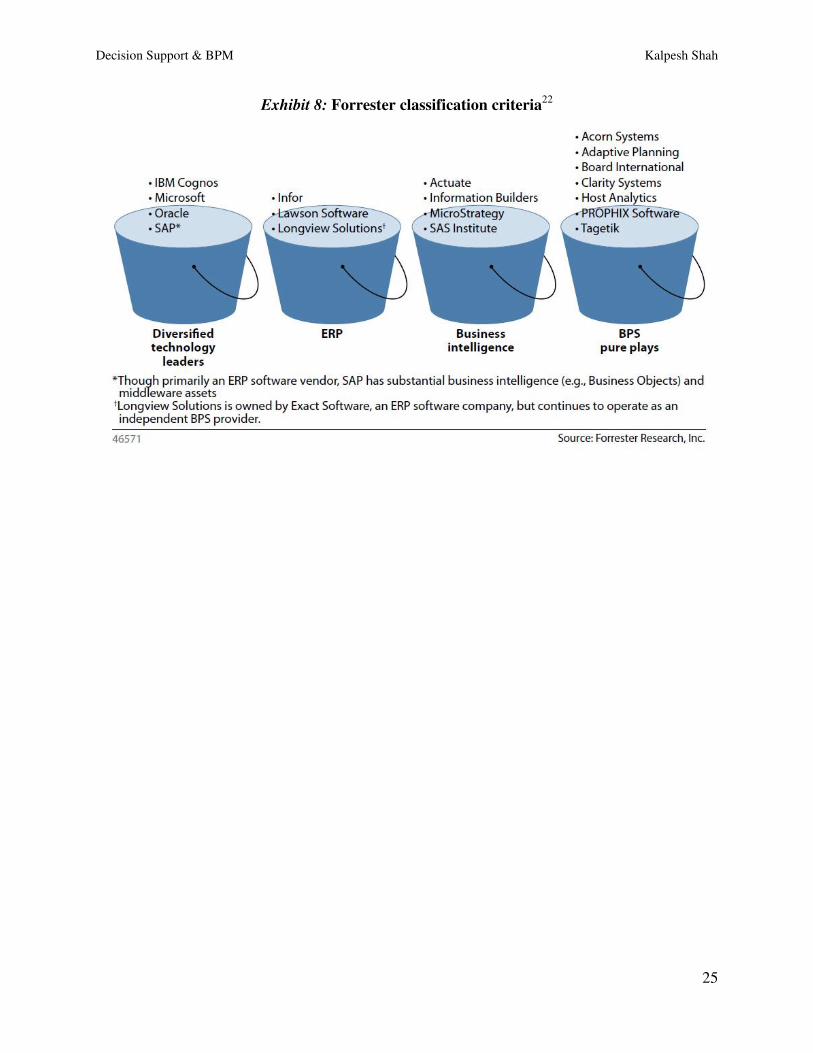
strategy. Likewise, there are several small players in the market that are considered niche in
terms of the services and solutions provided. Forrester does an effective job in classifying the
different players in the market as shown in Exhibit 8.
Scorecards and dashboards which were the main focus of this paper are but one
component of the complex BPM system. They are the tools that enable analysis and effective
reporting of large amount of complex data. They also provide the much needed forecasting
ability that allows firms to manage resources effectively and make adjustments to their
utilization based on the current economic scenario of their business. There are several additional
components that make up the BPM package and each user can perceive the offerings from BPM
in a different manner depending on their requirements. To get further detailed information on the
different vendors and their offerings please refer to the reference section which outlines some
latest reports from Forrester and Gartner that give industry insights into BPM.
The final section of this report will attempt to gain industry insight into the world of
Business Performance Management by conducting informational interviews with BPM vendors,
customers from diverse industries and academia to understand different perspectives about the
developments in this field.
6. Industry perspective on BPM
6.1 BPM in Services Industry
In the context of the US market, there are huge opportunities for BPM implementations
in the service industry. More than two-thirds of the U.S. gross domestic product has service
components16, but most performance measurement is focused on the manufacturing industry.
Thus, there is a huge market for utilizing the BPM methodology in the services domain.
However, the services industry is extremely challenging from a business performance
measurement standpoint due to the nature of services that comprise of transactions and a high
level of interaction that makes it difficult to measure performance (refer Exhibit 5). In a
manufacturing business, it is easy to track the number of turns, customer satisfaction through
order fulfillment, and/or asset utilization parameters. Service businesses, however, do not have
inventory levels, number of turns, or significant assets to measure utilization. The most critical
asset – human resources – is difficult to measure. Organizations attempt to resolve this challenge

Decision Support & BPM Kalpesh Shah
15
by measuring productivity in terms of revenue per employee, but doing so can have its own
drawbacks. If one measures revenue per employee, as a productivity measure, the only way to
improve productivity without any process improvement is to reduce head count or improve sales.
However, this decision would ignore the impact on performance that reduced head count would
have or the level of service that the larger customer pool would receive from the reduced work
force. These are some of the trade-offs that effect performance management in the services
industry and hence makes it very challenging to manage.
Beginning with the simple measurements of profit, growth, or customer satisfaction, to a
series of financial measurements, there has been a perceived continual need for more non-
financial measurements in the services industry. The need for measurements is increasing due to
the growing expectation of more process knowledge coupled with the lack of information about
the process for both profit and not-for-profit organizations in the services domain. Information is
amongst the key assets in this industry17 and if used effectively, can help enhance value for the
customers by identifying the KPI’s that align with business objectives. It creates a standardized
approach to enterprise planning and budgeting, and enables activity-based costing and analysis.
The most important benefit expected from BPM is to make people accountable for the part of the
business they manage. It allows making faster and better decisions using the information
gathered. As a result, BPM can help managers at all services business levels monitor
performance and expedite the planning process as well.
6.2 Benefits of BPM in services industry
Few firms today are using BPM only to manage purely financial benchmarks of business
health. Many are adding nonfinancial, or intangible, assets—such as employee skill levels,
customer satisfaction, brand awareness and alliances—into the measurement mix. Smart
management of these assets will be critical for all companies over the next five to 10 years. Some
advantages of visibility and management of non-financial assets are as follows17:
� An improved ability to compare actual performance to performance potential in order to
better use resources and manage assets.
� Better identification of new business opportunities found among untapped skills and
processes within the company.
� Improved judgment of the organization’s capacity to take on new projects through
improved forecasting abilities.

Decision Support & BPM Kalpesh Shah
16
� Better assessment of personnel skills and intellectual capital of the company which
enables efficient utilization of these resources.
� Improved schedules and cost quotes through better accounting of hidden assets.
� Availability of performance data can also be useful in measuring the overall risk
component in the business and allows the firm to suitably develop risk mitigation
measures to overcome potential threats to the business.
� Another key benefit of BPM is the ability to understand the customer requirement based
on historic trends as well as updated information gathered by the BI system. This allows
firms to focus their resources towards those products or services that are crucial to
profitability and customer satisfaction.
In order to reap the benefits of an effective BPM system, it is important for users to
develop their own requirements. Survey the vendor landscape to establish a short list of
candidates. Evaluate and score each finalist, and its customized proof of concepts, against your
prioritized requirements. Then, and only then, select the vendor that is the best fit. Following this
process in selecting a BPM solution to implement the system will help the firm avoid some of
the risks associated with a BPM system implementation as explained in the next section.
6.3 Risks of BPM in services industry
Alongside the benefits outlined above, the industry faces some critical roadblocks and
side-effects of BPM18. The current economic crises facing the world economy suggests that in
volatile business conditions it is important to accurately measure business performance by
identifying relevant metrics, accurate implementation and most importantly compliance with the
ever changing regulatory environment in which businesses operate today. Some of the apparently
observed challenges in this industry are as follows:
� BPM although being relevant to organizations of all sizes, can be a huge liability if the
firm does not identify the right assumptions and KPI’s for their business.
� Implementation of BPM systems can be an expensive idea if the performance
management system does not suit the needs of the business. There are several challenges
in actually designing and implementing a BPM software system because of the large
variety of vendors available in the market which makes it challenging to choose the right
fit for the business.
Decision Support & BPM Kalpesh Shah
17
� Companies fail to understand/predict the impact on firm culture due to the performance
measurement process. Companies that are extremely focused on a BPM implementation
may accidently ignore some management concerns which are a common occurrence in
any performance management project.
� Consolidation in the industry has led to big companies such as Oracle, SAP, IBM
leading the way in BPM. These BPM solution providers may not be the right fit for all
types of customers. They tend to be more complex and expensive compared to other
smaller known products in the market.
� The total cost of purchase and deployment of a BPM system — including software,
consulting, training, hardware, and internal resources18 — can reach into the millions of
dollars for a large implementation. Plus, a BPM application is likely to stay in place,
performing a critical corporate function, for five to seven years. Selecting the wrong
system is a high-visibility mistake.
The interview process as part of this research paper will question some of the leading
users of BPM technology about some of the direct risks and roadblocks associated with BPM. It
will also try to understand how BPM could be utilized more effectively to mitigate risks and to
learn some of the shortfalls of the technology that need to be overcome to use it more effectively.
Decision Support & BPM Kalpesh Shah
18
7. Summary
The world of Scorecards and Dashboards provide managers and operational personnel in
organizations with a high level or a detailed snapshot of performance. They give access to the
metrics that these individuals in different roles and capacity can leverage to make strategic
decisions. However, at the end of it what really matters is how efficiently this information is
utilized to make decisions that have a significant impact on performance.
This report has looked at the high level view of these tools as they are utilized across
different industries and functions. In order to gain broader perspective into these tools in the
BPM space it is recommended that organizations understand the scope and extent to which these
tools can be utilized to make decisions. These tools are not the solution to all the problems that
firms face in making decisions, but it does equip organizations with the information they need to
make the correct decisions.

Decision Support & BPM Kalpesh Shah
19
Exhibit 1: Life before Business Performance Management14
Exhibit 2: Business Performance Management (last 4 years)14

Decision Support & BPM Kalpesh Shah
20

Decision Support & BPM Kalpesh Shah
21
Exhibit 3: Scorecard vs. Dashboard5,11
Dashboard (Operational)
Scorecard (Strategic)
Business Use Monitor business operations Measure performance against objectives
Primary users Operations managers Senior executives
Utilized at Department/business unit
level
Corporate/organizational level
Level of Data High level of details. Used to
analyze financial/operational
performance of different
business units/departments.
Summarized data for executives with
KPI’s as they relate to strategy,
accountability and execution to make
long-term decisions.
Frequency of
data updates
Intra-day update to monitor
performance over a finer
time slice (hours/minutes)
Monthly/Quarterly/Annual update of
overall strategic position. Focus on data
over a longer time context
Display
technique used
Graphs, grids, gauges and a
variety of visualization
techniques to highlight the
operational data
KPI’s, symbols and icons that measure
progress towards a strategic firm
objective.
Always Remember to…
Choose indicators that will
inform an individual of
actions to take.
Ensure performance objectives really
align with the organizational objectives.
Decision Support & BPM Kalpesh Shah
22
Exhibit 4a: BPM Components
Exhibit 4b: BPM Components explained by Forrester21

Decision Support & BPM Kalpesh Shah
23
Exhibit 5: Service vs. Non-service business4
Business attributes Non Service Businesses Service Businesses
Customers Customers require tangible
outputs, measurable
performance and ability to get it
easily corrected. Customer is
less engaged from operations.
Customers require intangible
output, it is difficult to measure
performance and easier to
redeliver rather than repair.
Customer is involved in the
delivery operation.
Outputs Products, parts or systems
create experience
Customer experience creates the
output.
Processes Series of operations involving
machines, material, method and
people.
Series of activities involving
people, material, tools and
methods.
Inputs Tangible raw material Intangible information
Suppliers Many suppliers, depend upon
the complexity of the solution.
Fewer suppliers with stronger
relationship
Decision Support & BPM Kalpesh Shah
24
Exhibit 6: Gartner’s latest Magic Quadrant for BPM suites2
Exhibit 7: Gartner’s evaluation criteria2
Table 1. Ability to Execute Evaluation Criteria
Evaluation Criteria Weighting
Product/Service high
Overall Viability (Business Unit, Financial, Strategy, Organization) high
Sales Execution/Pricing standard
Market Responsiveness and Track Record standard
Marketing Execution no rating
Customer Experience high
Operations standard
Decision Support & BPM Kalpesh Shah
25
Exhibit 8: Forrester classification criteria22

Decision Support & BPM Kalpesh Shah
26
8. References
1. http://bpmmag.net/about/
2. Gartner report: Magic Quadrant for Corporate Performance Management Suites (April 2009)
3. www.BPMPartners.com - BPM 101: Dashboards (April 2007)
4. Performance Management and Scorecards – FT Press (July 2008)
5. Performance Dashboards: Measuring, Monitoring, and Managing Your Business, by Wayne
Eckerson(John Wiley & Sons), 2005.
6. Myths of BPM - http://www.tdwi.org/publications/display.aspx?ID=6819
7. The CPM Dashboard: The Framework (The Power of Metrics – Kent Bauer) April 2004.
8. Scorecards and Dashboards: Choosing the Right Solution Whitepaper
9. http://www.activestrategy.com/strategy_execution/what_a_balanced_scorecard_is_not.aspx
10. http://www.thebusinessintelligenceguide.com/bi_tools/Scorecards.php
11.http://www.datamanagementgroup.com/Resources/Articles/Article_WhatDoYouNeedToSee_
DashboardsVsScorecards.asp
12. Briefing books: http://www.infoworld.com/print/31531
13. Briefing books: http://www.information-management.com/issues/20040401/1000940-1.htm
14. Presentation: Hyperion Solutions BPM System Evolution Development Update (1/23/2009)
15. Create Briefing books: http://download.oracle.com/docs/cd/E12096_01/books/AnyUser/briefingbook.html
16. FT Press – Performance Management and Scorecards: by Rajesh Tyagi and Praveen Gupta
(July 7, 2008)
17. Made to measure: Corporate performance management in the financial services industry.
(March 2004)
18. Watch Your Step: The Potentially Perilous Route to BPM in 2008: Craig Schiff | Sep 1, 2008
19. Dashboards and Scorecards Aid in Performance Management and Monitoring: Bill Dagan
(Year 2007).
20. http://workflow.wordpress.com/2008/11/24/the-size-of-the-bpm-market/
Research Reports
21. The Forrester Wave™: Business Performance Solutions, Q4 2007
22. Business Performance Solutions: Clash Of The Titans (January 2009)