decisions, causality and all that… big data from knowing ‘what’ to understanding ‘why’?
TRANSCRIPT
Decisions, Causality and All That…
BIG DATAFrom knowing ‘what’ to understanding ‘why’?.

an important decision…
I think she is hot!
Hmm – so what should I write to her to get her number?

The word pretty is a perfect case study for our point. As an adjective, it’s a physical compliment, but as an adverb (as in, “I’m pretty good at sports.”) it is just another word.
On the other hand,
more general
compliments work
quite well.
Source: OK Trends
?

hardships of causality.
Beauty is Confounding
determines both the probability of getting the number and of the probability that James will say it
need to control for the actual beauty or it can appear that making compliments is a bad idea
“You are beautiful.”

causal analysis inonline display advertising.

The life of a browser process.
2. Use observed data to build list of prospects
3. Subsequently observe same browser surfing the web the next day
4. Browser visits a site where a display ad spot exists and bid requests are made
5. Auction is held for display spot
6. If auction is won display the ad
7. Observe browsers actionsafter displaying the ad
1. Observe people taking actions and visiting content

what do advertisers want?Conversions?
RETARGETIN
G
M6D
PROSPEC...
RETARGETIN
G
M6D
PROSPEC...
RETARGETIN
G
M6D
PROSPEC...
0%
2%
4%
6%
8%
10%
12%
14%
RELATIVE LIFT:EXPOSED VS. UNEXPOSED USERS
DID NOT SEE AD SAW AD
CO
NV
ER
SIO
N R
AT
E
1.05X
2.62X
1.11X
1.31X
0.92X2.26X
TELECOM COMPANY A
TELECOM COMPANY B
TELECOM COMPANY C
RETARGETIN
G
M6D
PROSPEC...
RETARGETIN
G
M6D
PROSPEC...
RETARGETIN
G
M6D
PROSPEC...
0%
2%
4%
6%
8%
10%
12%
14%
Conversion Rates
SAW AD
CO
NV
ER
SIO
N R
AT
E
TELECOM COMPANY A
TELECOM COMPANY B
TELECOM COMPANY C
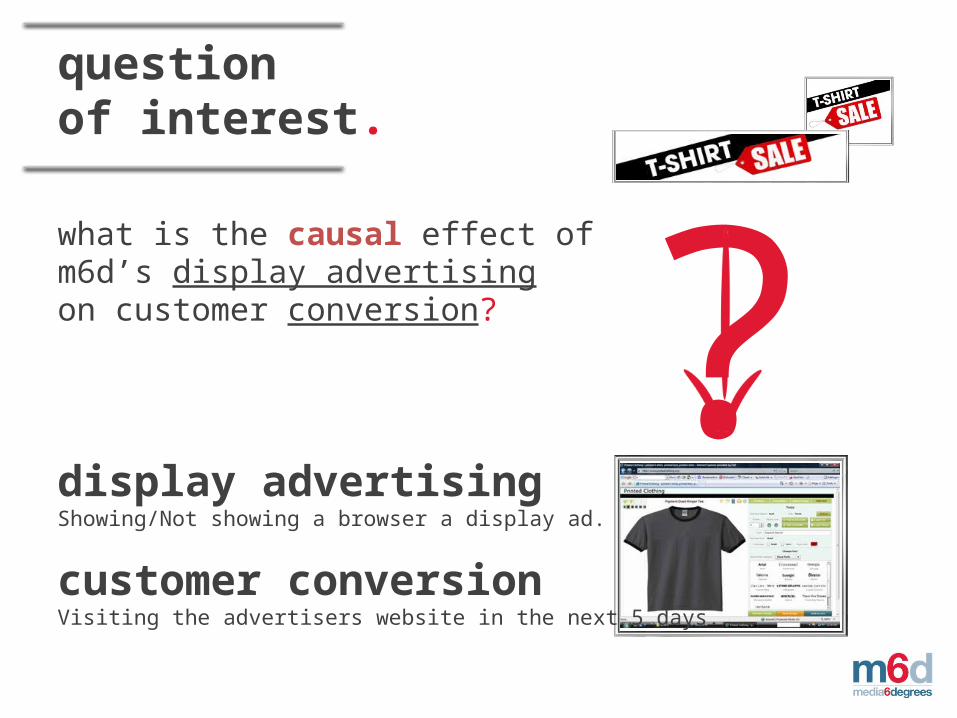
questionof interest.
what is the causal effect of m6d’s display advertisingon customer conversion?
?display advertisingShowing/Not showing a browser a display ad.
customer conversionVisiting the advertisers website in the next 5 days.

P
general approach.
?
Ψ(P)
1. Ask the right question
3. Translate question into a formal quantity
Ψ(Pn) 4. Try to estimate it
2. Understand/express the causal process
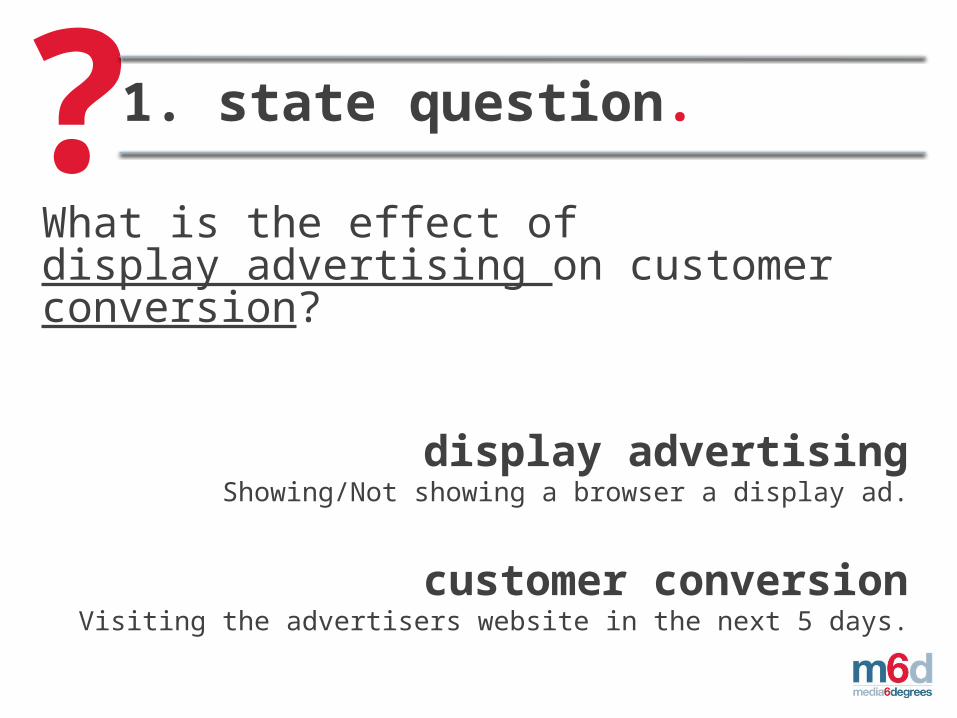
What is the effect ofdisplay advertising on customerconversion?
?1. state question.
display advertisingShowing/Not showing a browser a display ad.
customer conversionVisiting the advertisers website in the next 5 days.

P2. express causal process.
O = (W,A,Y) ~ P0
W – Baseline VariablesA – Binary Treatment
(Ad)Y – Binary Outcome
(Purchase)
“You are beautiful.”

data structure: our viewers.
CHARACTERISTICS(W)
TREATMENT(A)
CONVERSION(Y)
Color Sex HeadShape
Ad No Ad
No Yes

Ψ(P) 3. define quantity.
E[YA=ad] – E[YA=no ad]
E[YA=ad]/E[YA=no ad]
additive impact
relative impact

Ψ(Pn)4. estimate quantity.
1.A/B testing
2.Modeling Observational Data
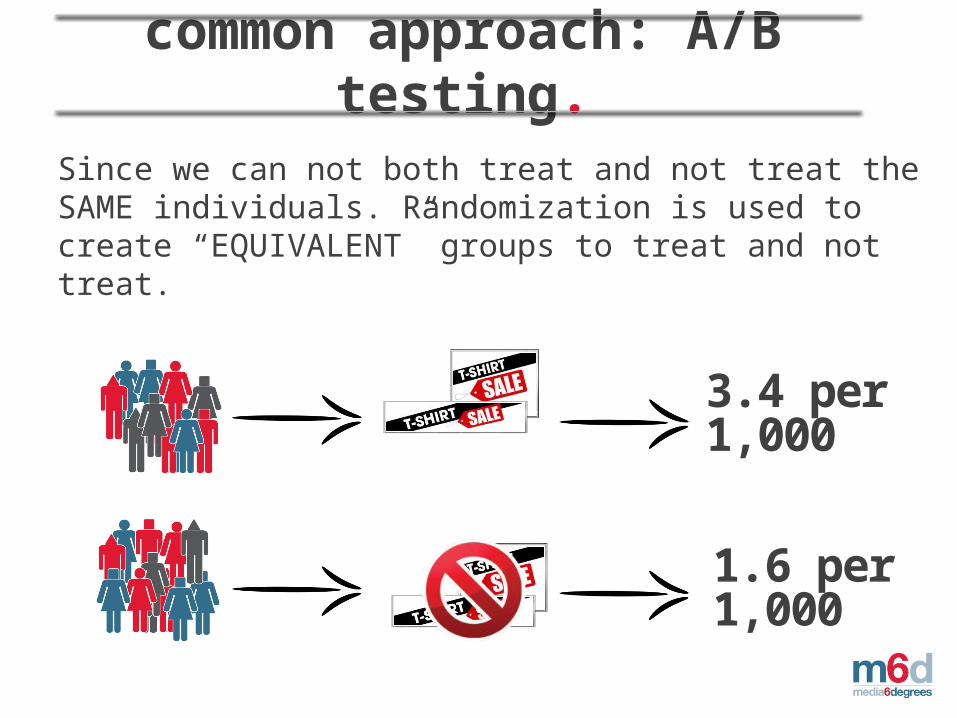
common approach: A/B testing.
Since we can not both treat and not treat the SAME individuals. Randomization is used to create “EQUIVALENT” groups to treat and not treat.
3.4 per 1,000
1.6 per 1,000

practical concerns.associated with doing A/B testing
1. Cost of displaying PSAs to the control (untreated group).
2. Overhead cost of implementing A/B test and ensuring that it is done CORRECTLY.
3. Wait time necessary to evaluate the results.
4. No way to analyze past or completed campaigns.
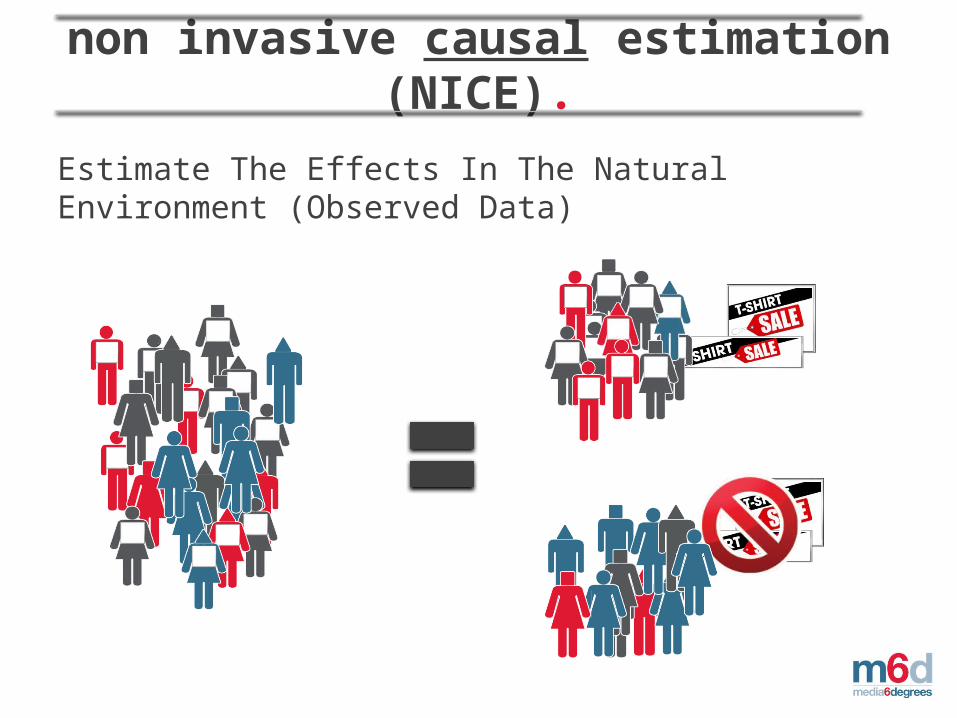
non invasive causal estimation (NICE).
Estimate The Effects In The Natural Environment (Observed Data)
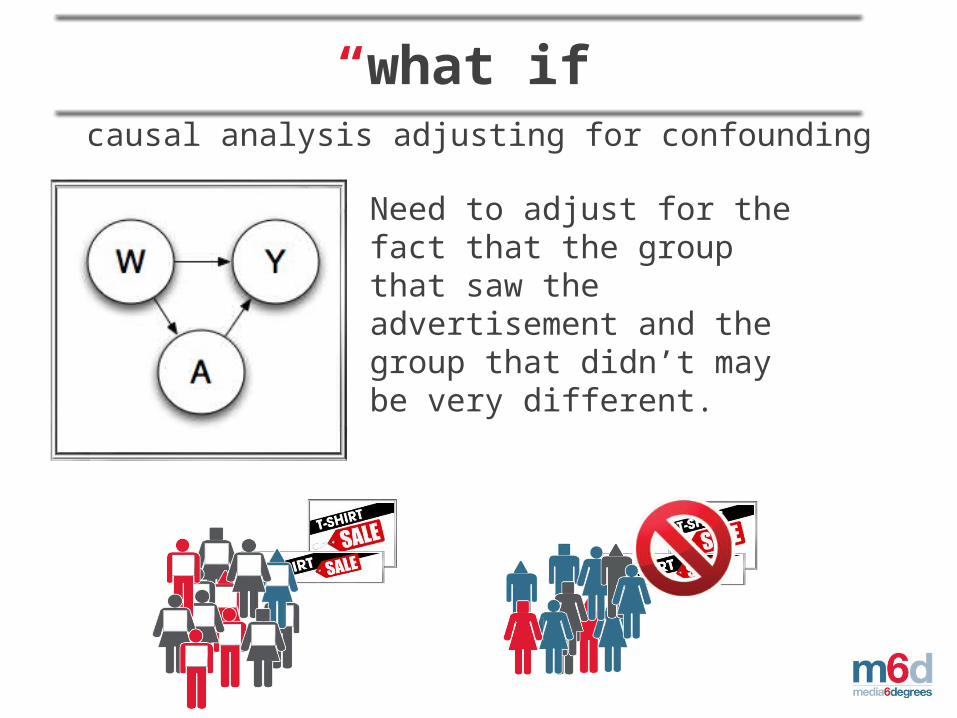
“what if”causal analysis adjusting for confounding
Need to adjust for the fact that the group that saw the advertisement and the group that didn’t may be very different.

estimation – a primer.1. When can we estimate it? Necessary conditions:
– no unmeasured confounding– experimental variability/positivity
2. Be VERY careful with data collection– Define cohorts and follow them over time
3. Estimation techniques – Unadjusted– Adjust through gA
– MLE estimate of QY
– Double robust combining gA and QY
– TMLE
4. Many tools exist for estimating binary conditional distributions
– Logistic regression, SVM, GAM, Regression Trees, etc.
P(W) P(A|W) P(Y|A,W)
QWQY
gA
TE
CH
NO
LOG
Y A
TR
AV
EL
A
B2B
A
TR
AV
EL
B
TE
LEC
OM
A
TR
AV
EL
C
TE
LEC
OM
B
TR
AV
EL
D
RE
TA
IL A
RE
TA
IL B
TR
AV
EL
E
ED
UC
AT
ION
A
TR
AV
EL
F
RE
ST
AU
RA
NT
A
AU
TO
A
RE
TA
IL C
RE
ST
AU
RA
NT
B
TR
AV
EL
G
ED
UC
AT
ION
B
TE
CH
NO
LOG
Y B
RE
TA
IL D
TE
LEC
OM
C
RE
TA
IL E
AU
TO
B
ED
UC
AT
ION
C
FIN
AN
CE
A
TR
AV
EL
H
B2B
B
RE
TA
IL F
TR
AV
EL
I
-100%
0%
100%
200%
300%
400%
500%
600%
700%
800%
-100%
0%
100%
200%
300%
400%
500%
600%
700%
800%
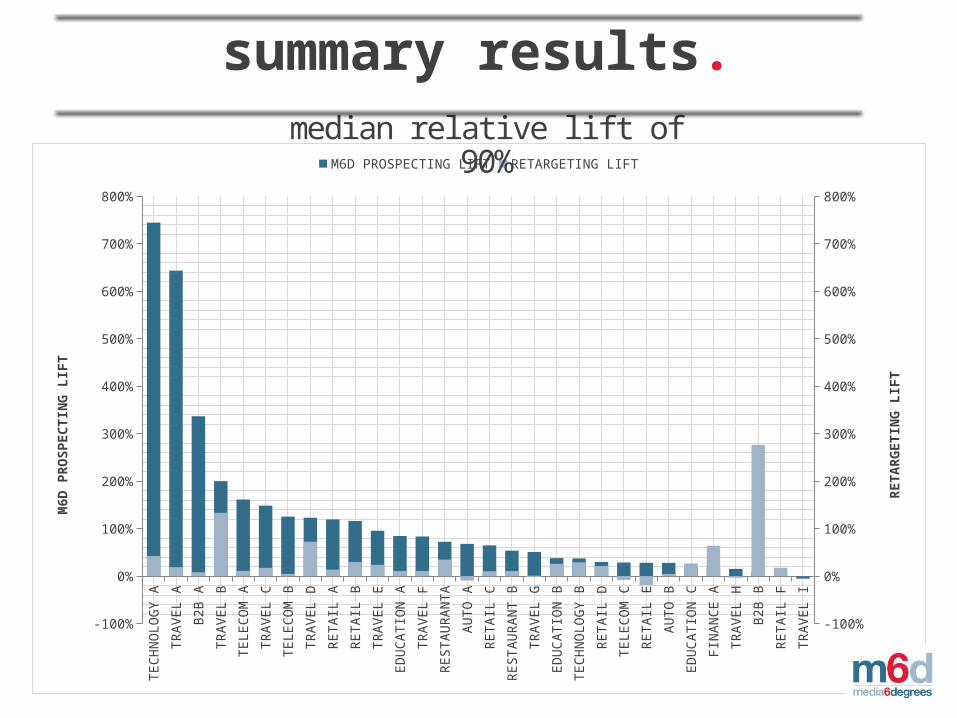
M6D PROSPECTING LIFT RETARGETING LIFT
M6D
PR
OS
PE
CT
ING
LIF
T
RE
TA
RG
ET
ING
LIF
T
summary results.median relative lift of 90%
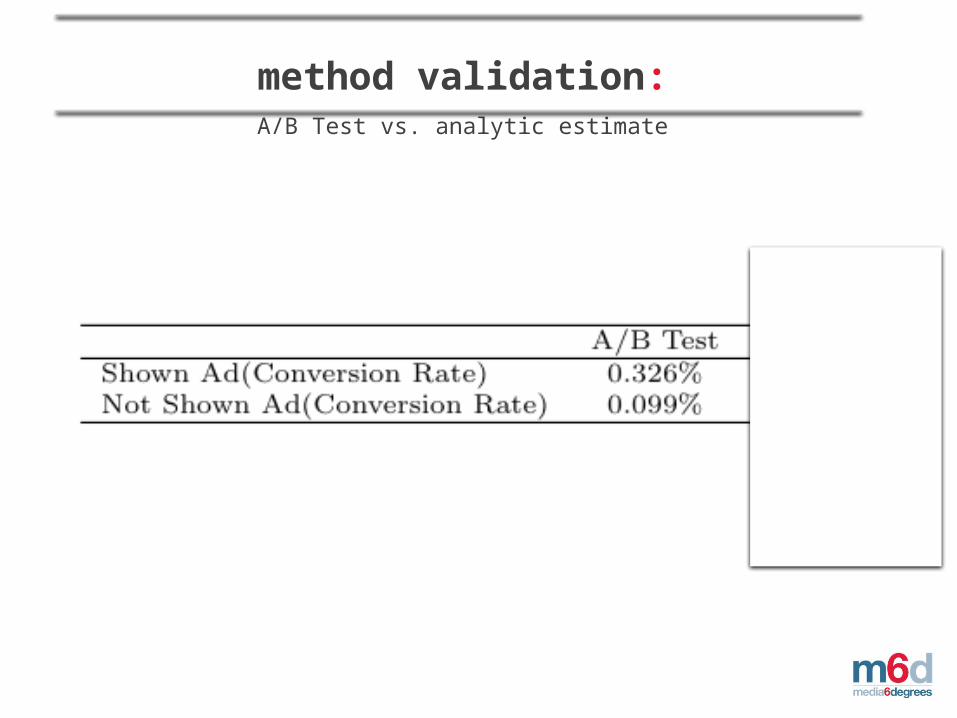
method validation:A/B Test vs. analytic estimate
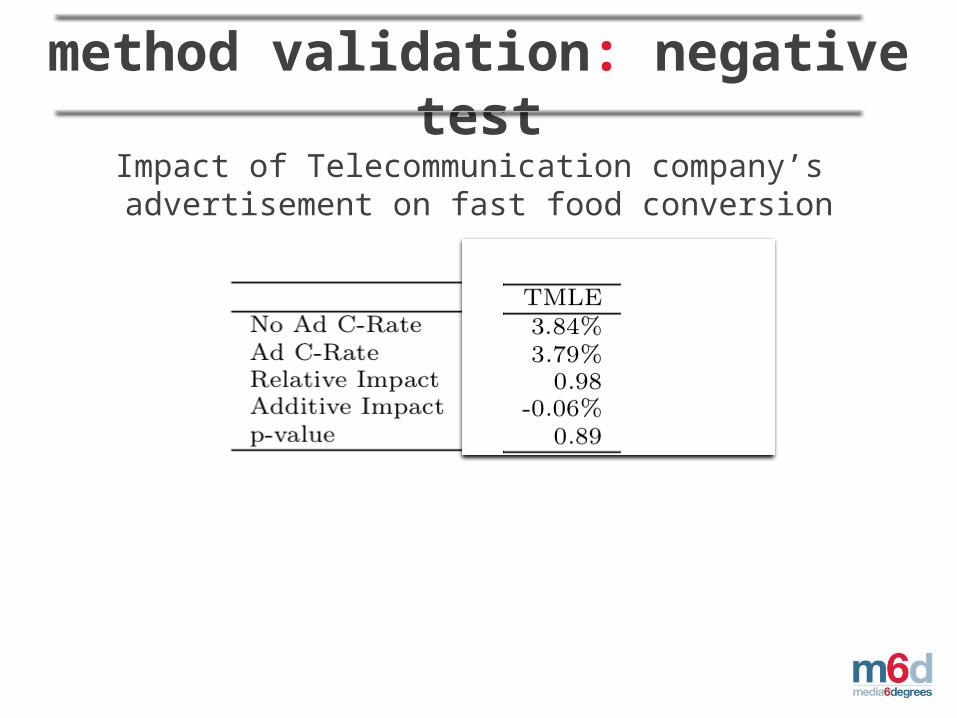
method validation: negative test
Impact of Telecommunication company’s advertisement on fast food conversion

gross conversion rates.
Additive Impact
RETARGETING
M6D
PROSPECTING
RETARGETING
M6D
PROSPECTING
RETARGETING
M6D
PROSPECTING
0.0%
0.1%
0.2%
0.3%
0.4%
0.5%
0.6%
0.7%
0.8%
0.9%
1.0%
0.5%
0.9%
0.1%
0.8%
0.7%
ADDITIVE IMPACT: EXPOSED VS. UNEXPOSED USERS
AD
DIT
IVE
IM
PA
CT
IN
CO
NV
ER
SIO
N R
AT
E
-0.2%
TELECOM COMPANY A
TELECOM COMPANY B
TELECOM COMPANY C
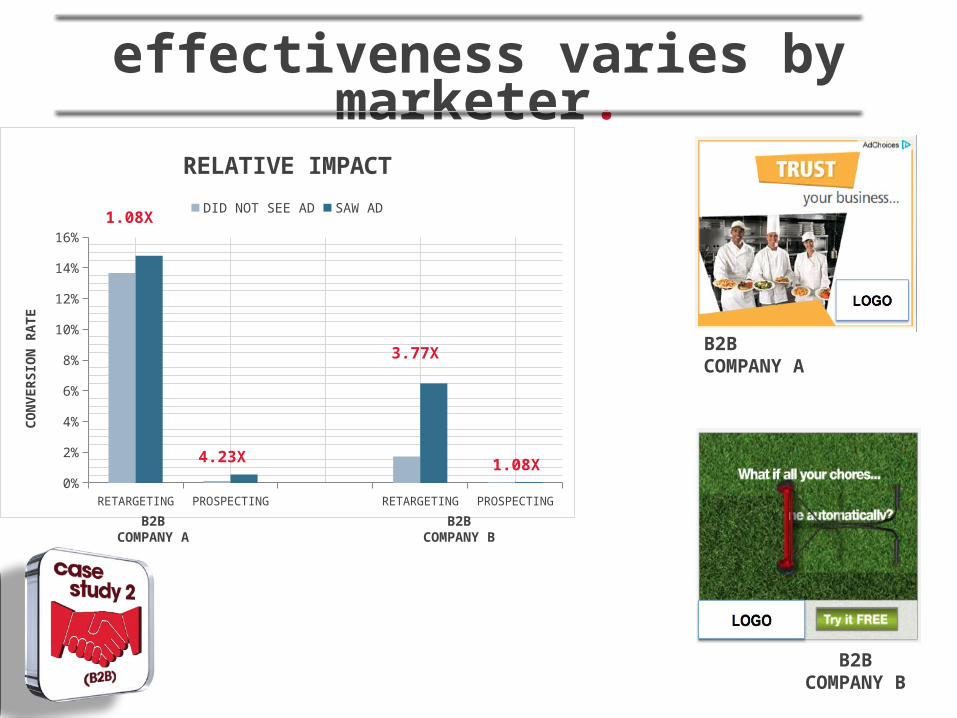
effectiveness varies by marketer.
RETARGETING PROSPECTING RETARGETING PROSPECTING0%
2%
4%
6%
8%
10%
12%
14%
16%
RELATIVE IMPACT
DID NOT SEE AD SAW AD
CO
NV
ER
SIO
N R
AT
E
B2B COMPANY
A
B2B COMPANY
B
1.08X
1.08X4.23X
3.77X B2B COMPANY A
B2B COMPANY B

RETARGETING PROSPECTING0.0%
0.5%
1.0%
1.5%
2.0%
2.5%
CONVERSION RATEDID NOT SEE AD SAW AD
CO
NV
ER
SIO
N R
AT
E
NO LIFT
NO LIFT
creative matters.
This campaign drove no significant lift from either retargeting or new customer
prospects, likely due to ineffective creative.
Brand is buried; sweepstakes, not the brand, is the primary message
Call to action is inconsistent with primary message
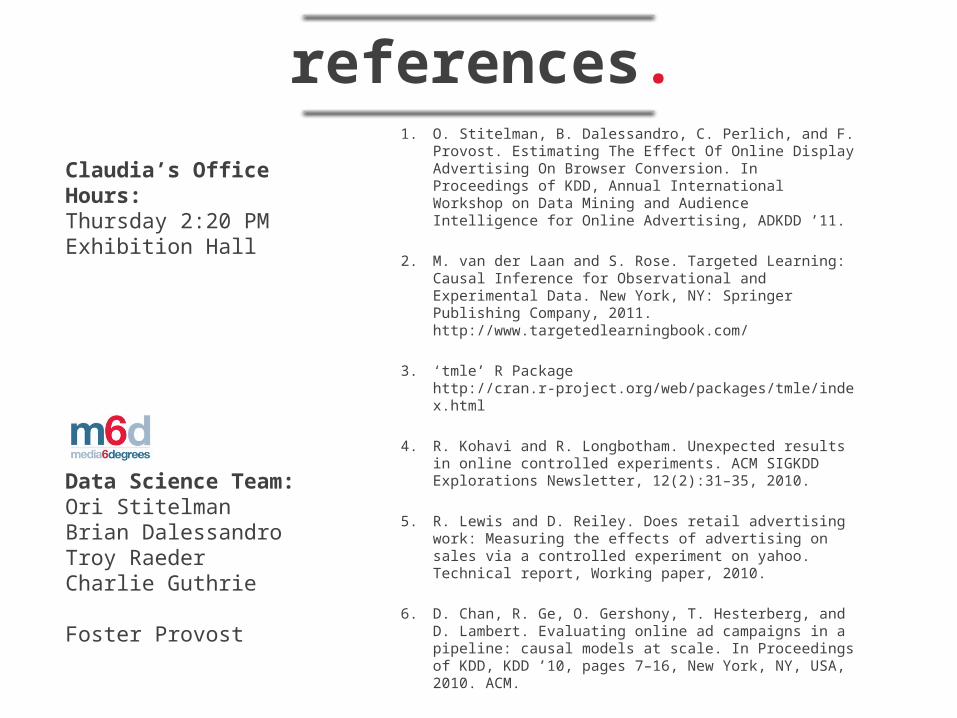
references.1. O. Stitelman, B. Dalessandro, C. Perlich, and F.
Provost. Estimating The Effect Of Online Display Advertising On Browser Conversion. In Proceedings of KDD, Annual International Workshop on Data Mining and Audience Intelligence for Online Advertising, ADKDD ’11.
2. M. van der Laan and S. Rose. Targeted Learning: Causal Inference for Observational and Experimental Data. New York, NY: Springer Publishing Company, 2011. http://www.targetedlearningbook.com/
3. ‘tmle’ R Package http://cran.r-project.org/web/packages/tmle/index.html
4. R. Kohavi and R. Longbotham. Unexpected results in online controlled experiments. ACM SIGKDD Explorations Newsletter, 12(2):31–35, 2010.
5. R. Lewis and D. Reiley. Does retail advertising work: Measuring the effects of advertising on sales via a controlled experiment on yahoo. Technical report, Working paper, 2010.
6. D. Chan, R. Ge, O. Gershony, T. Hesterberg, and D. Lambert. Evaluating online ad campaigns in a pipeline: causal models at scale. In Proceedings of KDD, KDD ’10, pages 7–16, New York, NY, USA, 2010. ACM.
Claudia’s Office Hours:Thursday 2:20 PMExhibition Hall
Data Science Team:Ori StitelmanBrian DalessandroTroy RaederCharlie Guthrie
Foster Provost