decommissioning plan addendumdecommissioning plan addendum tulsa facility tulsa, oklahoma volume i...
TRANSCRIPT
Decommissioning Plan Addendum
Tulsa FacilityTulsa, Oklahoma
Volume I of 2
Kaiser Aluminum & Chemical CorporationBaton Rouge, Louisiana
Project Nos. 5427K and 5427MMay 2002
Revised May 2003
Earth Sciences Consultants, Inc.One Triangle LaneExport, PA 15632
724/733-3000FAX: 724/325-3352
Table of Contents
Page
Volume 1 of 2
Acceptance Review Checklist
1.0 Executive Summary 1-1
2.0 Facility Operating History 2-12.1 Licensing Number/Status/Authorized Activities 2-12.2 License History 2-12.3 Site Development and Utilization 2-32.4 Previous Predecommissioning and Decommissioning Activities 2-32.5 Spills 2-42.6 Prior On-Site Burials 2-4
References 2-6
3.0 Facility Description 3-13.1 Site Location and Description 3-13.2 Population Distribution 3-23.3 Current/Future Land Use 3-23.4 Meteorology and Climatology 3-2
3.4.1 Wind 3-23.4.2 Temperature 3-33.4.3 Precipitation 3-33.4.4 Relative Humidity 3-33.4.5 Evapotranspiration 3-3
3.5 National Ambient Air Quality Standards Category 3-33.6 Geology and Seismology 3-3
3.6.1 Geology 3-33.6.2 Regional Geologic Structures and Tectonics 3-33.6.3 Seismology 3-3
3.7 Surface Water Hydrology 3-33.7.1 Flood Plan Data 3-3
3.8 Groundwater Hydrology 3-43.8.1 Groundwater Flow Data 3-4
3.8.8.1 Shallow Overburden/Dross Material 3-43.8.1.2 Deep Overburden 3-4
3.9 Natural Resources 3-43.10 Ecology/Endangered Species 3-4
3.10.1 Relative Abundance 3-4
References 3-5
(Rev. 5/03)

Table of Contents(Continued)
Page
Figures
Figure 3A-1 - Site Location Map (Dwg 5427039)Figure 3A-2 - Site Map (Dwg 5427A434)Figure 3A-3 - Former Operational Area (Dwg 5427A442)Figure 3A-4 - Subsurface Piping and Sewer Line Location May (Dwg 5427A448)
4.0 Radiological Status of Facility 4-14.1 Contaminated Structures 4-2
4.1.1 Radiological Contamination within Structures 4-34.1.1.1 North Extrusion Building 4-4
4.1.1.1.1 Survey Subunit 1 - North Extrusion Building,First Floor of Original Structure 4-4
4.1.1.1.2 Survey Subunit 2 - North Extrusion Building,Loft Area 4-5
4.1.1.1.3 Survey Subunit 3 - North Extrusion Building,Basement Level of Addition 4-6
4.1.1.1.4 Survey Subunit 4 - North Extrusion Building,First Floor of Addition 4-7
4.1.1.2 Maintenance Building 4-84.1.1.2.1 Survey Subunit 5 - Maintenance Building,
Main Structure 4-84.1.1.2.2 Survey Subunit 6 - Maintenance Building,
Scale House Addition 4-94.1.1.3 Office Building 4-10
4.1.1.3.1 Survey Subunit 7 - Office Building, First Floor 4-114.1.1.3.2 Survey Subunit 8 - Office Building, Second Floor 4-11
4.1.1.4 Warehouse Building 4-124.1.1.4.1 Survey Subunit 9 - Warehouse Building, Western
Section 4-134.1.1.4.2 Survey Subunit 10 - Warehouse Building, Central
Section 4-144.1.1.4.3 Survey Subunit 11 - Warehouse Building, Eastern
Section 4-154.1.1.5 Crusher Building (Survey Subunit 12) 4-154.1.1.6 Crusher Addition Building (Survey Subunit 13) 4-17
4.2 Contaminated Systems and Equipment 4-184.3 Surface and Subsurface Soil Contamination 4-18
4.3.1 Survey Unit 1 4-194.3.2 Survey Unit 2 4-204.3.3 Survey Unit 3 4-214.3.4 Survey Unit 4 4-224.3.5 Survey Unit 5 4-234.3.6 Survey Unit 6 4-254.3.7 Survey Unit 7 4-264.3.8 Survey Unit 8 4-274.3.9 Survey Unit 9 4-28
(Rev. 5/03)

iiiTable of Contents
(Continued)Page
4.4 Surface Water 4-294.5 Groundwater 4-29
References 4-30
Tables
Table 4-1 - Minimum Number of Sample Points per Survey Subunit, Extended Scoping Surveyof Structures
Table 4-2 - Statistical Analysis Summary, Gross Alpha Activity (dpm/100 cm2), ExtendedScoping Survey of Structures
Table 4-3 - Gamma Scan Survey Results, Characterization Survey of Land AreasTable 4-4 - Survey Unit 1 - Land Area Beneath the North Extrusion Building, Soil Core ScansTable 4-5 - Survey Unit 2 - Land Area North of the Maintenance Building and the North
Extrusion Building, Soil Core ScansTable 4-6 - Survey Unit 3 - Land Area North of the Office Building and South, Southwest of the
Maintenance Building, Soil Core ScansTable 4-7 - Survey Unit 4 - Land Area Beneath the Maintenance Building, Soil Core ScansTable 4-8 - Survey Unit 5 - Land Area North of the Warehouse Building, Soil Core ScansTable 4-9 - Survey Unit 6 - Land Area Around the Footprint of the Former Smelter Building, Soil
Core ScansTable 4-10 - Survey Unit 7 - Land Area Beneath the Warehouse Building, Soil Core ScansTable 4-11 - Survey Unit 8 - Land Area North and East of the Crusher Building, Soil Core ScansTable 4-12 - Survey Unit 9 - Land Area Beneath the Crusher and Crusher Addition Buildings,
Soil Core ScansTable 4-13 - Th-232 Analytical Results for Soil Core Samples, Characterization Survey of Land
AreasTable 4-14 - Thorium Concentrations of QA/QC Soil Samples, Characterization Survey of Land
Areas
Figures
Figure 4A-1 - Structural Surfaces Discrete Sample Points, North Extrusion Building Layout(Dwg 5427277)
Figure 4A-2 - Structural Surfaces Discrete Sample Points, Maintenance Building (Dwg 5427279)Figure 4A-3 - Structural Surfaces Discrete Sample Points, Office Building - First Floor
(Dwg 5427278)Figure 4A-4 - Structural Surfaces Discrete Sample Points, Office Building - Second Floor
(Dwg 5427283)Figure 4A-5 - Structural Surfaces Discrete Sample Points, Warehouse Building (Dwg 5427280)Figure 4A-6 - Structural Surfaces Discrete Sample Points, Crusher Building (Dwg 5427281)Figure 4A-7 - Structural Surfaces Discrete Sample Points, Crusher Addition Building
(Dwg 5427282)Figure 4A-8 - Survey Unit Delineation, Impacted Land Areas (Dwg 5427A443)Figure 4A-9 - Th-232 Analytical Results Soil Core Samples, Survey Unit 1 (Dwg 5427A263)Figure 4A-10 - Th-232 Analytical Results Soil Core Samples, Survey Unit 2 (Dwg 5427A283)Figure 4A-11 - Th-232 Analytical Results Soil Core Samples, Survey Unit 3 (Dwg 5427257)Figure 4A-12 - Th-232 Analytical Results Soil Core Samples, Survey Unit 4 (Dwg 5427A266)Figure 4A-13 - Th-232 Analytical Results Soil Core Samples, Survey Unit 5 (Dwg 5427A267)
(Rev. 5/03)

ivTable of Contents
(Continued)Page
Figure 4A-14 - Th-232 Analytical Results Soil Core Samples, Survey Unit 6 (Dwg 5427A268)Figure 4A-15 - Th-232 Analytical Results Soil Core Samples, Survey Unit 7 (Dwg 5427A269)Figure 4A-16 - Th-232 Analytical Results Soil Core Samples, Survey Unit 8 (Dwg 5427A284)Figure 4A-17 - Th-232 Analytical Results Soil Core Samples, Survey Unit 9 (Dwg 5427A270)
5.0 Dose Modeling Evaluations 5-15.1 Introduction 5-15.2 Unrestricted Release Using Site-Specific Information 5-1
5.2.1 Source Term 5-15.2.1.1 Principal Radionuclides 5-15.2.1.2 Geochemistry 5-15.2.1.3 Spatial Distribution and Volume Estimates 5-15.2.1.4 Chosen Remedial Action: Off-Site Disposal/Site Restoration 5-2
5.2.2 Critical Groups Scenarios and Pathway Identification and Selection 5-25.2.2.1 Scenario Identification 5-25.2.2.2 Critical Group Determination 5-25.2.2.3 Exposure Pathways 5-2
5.2.3 Conceptual Model 5-25.2.3.1 Affected Zone 5-25.2.3.2 Saturated Zone 5-25.2.3.3. Conceptual Model for a Dual Simulations Approach to Dose
Modeling 5-25.2.4 Calculations and Input Parameters 5-35.2.5 Uncertainty Analysis 5-35.2.6 Compliance with Radiological Criteria for License Termination 5-3
References 5-4
6.0 Alternatives Considered and Rationale for Chosen Alternative 6-16.1 Chosen Alternative 6-16.2 No-Action Alternative 6-1
Reference 6-2
7.0 ALARA Analysis 7-17.1 Quantitative Cost-Benefit Analysis 7-1
7.1.1 Benefit Calculation 7-17.1.2 Cost of Remediation 7-17.1.3 Regulatory Costs 7-17.1.4 Land Values 7-17.1.5 Esthetics 7-17.1.6 Reduction in Public Opposition 7-2
7.2 Summary of ALARA Analysis 7-2
References 7-3
8.0 Planned Decommissioning Activities 8-18.1 Predecommissioning Activities 8-28.2 Remediation Plan 8-2
(Rev. 5/03)

VTable of Contents
(Continued)Page
8.2.1 Summary of Remediation/Removal Activities 8-38.2.2 Site Preparation 8-48.2.3 Excavation 8-5
8.2.3.1 Water Handling 8-58.2.3.2 Excavation Support 8-5
8.2.4 Backfilling 8-58.2.5 Off-Site Disposal 8-58.2.6 Site Restoration 8-5
8.3 Decontamination Methods 8-68.4 Procedures and Controls 8-68.5 Schedule 8-7
Reference 8-9
Table
Table 8-1 - Excavation Volume Estimate, Decommissioning Plan Addendum
Figures
Figure 8A-1 - Excavation Plan, Former Operational Area (Dwg 5427A446)Figure 8A-2 - Conceptual Site Restoration Plan, Former Operational Area (Dwg 5427A447)
9.0 Project Management and Organization 9-19.1 Decommissioning Management Organization 9-19.2 Decommissioning Task Management 9-19.3 Decommissioning Management Positions and Qualifications 9-19.4 Training 9-19.5 Contractor Support 9-2
Reference 9-3
10.0 Health and Safety Plan 10-110.1 Radiation Safety Controls and Monitoring for Workers 10-1
10.1.1 Workplace Air Sampling Program 10-110.1.2 Respiratory Protection Program 10-110.1.3 Internal Exposure Determination 10-110.1.4 External Exposure Determination 10-110.1.5 Summation of Internal and External Exposures 10-110.1.6 Contamination Control Program 10-210.1.7 Instrumentation Program 10-210.1.8 Nuclear Criticality Safety 10-210.1.9 Health Physics Audits, Inspections, and Record Keeping Program 10-2
Reference 10-3
11.0 Environmental Monitoring and Control Program 11-111.1 Environmental ALARA Evaluation Program 11-111.2 Effluent Monitoring Program 11-1
(Rev. 5/03)

viTable of Contents
(Continued)Page
11.3 Effluent Control Program 11-2
Reference 11-3
12.0 Radioactive Waste Management 12-112.1 Solid Material 12-1
12.1.1 Volume Estimate of Thorium-Containing SoilDross - FormerOperational Area 12-1
12.1.2 Th-232 Activity Concentrations 12-112.1.3 Management of Thorium-Containing Soil/Dross 12-212.1.4 Management of Other Dry Active Waste 12-2
12.2 Liquid Waste Management 12-212.3 Radioactive Waste Disposal 12-2
12.3.1 Waste Classification 12-212.3.2 Waste Packaging, Transfer, and Storage 12-312.3.3 Waste Transportation 12-312.3.4 Waste Disposal 12-3
12.4 Mixed Waste 12-3
References 12-4
13.0 QA Program 13-113.1 Organization 13-113.2 QA Program 13-113.3 QC Requirements 13-113.4 Document Control 13-113.5 Control of Measuring and Testing Equipment 13-113.6 Corrective Action 13-113.7 QA Records 13-113.8 Audits and Surveillance 13-1
Reference 13-2
14.0 Facility Radiation Surveys 14-114.1 Release Criteria 14-1
14.1.1 Land Areas 14-214.1.2 Structures 14-3
14.2 Characterization Surveys 14-314.3 Remedial Action Support Surveys 14-414.4 Final Status Survey Design 14-414.5 Final Status Survey Report 14-4
References 14-5
15.0 Budgetary Cost Estimate 15-115.1 Mobilization 15-115.2 Concrete Slab Demolition 15-115.3 Excavation and Backfill 15-1
15.3.1 Contractor Daily Cost 15-1
(Rev. 5/03)

viiTable of Contents
(Continued)Page
15.3.2 Backfill Material 15-215.4 Transportation and Disposal 15-215.5 Vegetative Cover and Seeding 15-215.6 Demobilization 15-215.7 Engineering Oversight 15-315.8 Final Status Survey 15-315.9 Analytical 15-3
References 15-4
Table
Table 15-1 - Preliminary Cost Estimate, Decommissioning Plan Addendum
Volume 2 of 2
Appendices
Appendix A - Historical Site AssessmentAppendix B - Supporting Documentation, Extended Scoping Survey of Structures
Appendix B-1 - Survey Data Summary by Instrument and Date, Extended ScopingSurvey of Structures
Table B-1-1 - Instrument No. 138240Table B-1-2 - Instrument No. 145483Table B-1-3 - Instrument No. 168040Table B-1-4 - Instrument No. 168043Table B-1-5 - Instrument No. 168047Table B-1-6 - Instrument No. 170544
Appendix B-2 - Survey Data Summary by Survey Subunit, Extended Scoping Survey ofStructures
Table B-2-1 - Subunit 1Table B-2-2 - Subunit 2Table B-2-3 - Subunit 3Table B-2-4 - Subunit 4Table B-2-5 - Subunit 5Table B-2-6 - Subunit 6Table B-2-7 - Subunit 7Table B-2-8 - Subunit 8Table B-2-9 - Subunit 9Table B-2-10 - Subunit 10Table B-2-11 - Subunit 11Table B-2-12 - Subunit 12Table B-2-13 - Subunit 13Table B-2-14 - Background, Tile FloorTable B-2-15 - Background, CarpetTable B-2-16 - Background, ConcreteTable B-2-17 - Background, Wood Surface
(Rev. 5/03)

viiiTable of Contents
(Continued)Page
Appendix B-3 - Analytical Data Reports, Extended Scoping Survey of StructuresAppendix B-4 - QA/QC Documentation, Extended Scoping Survey of Structures
Appendix C - Supporting Documentation, Characterization Survey of Land AreasAppendix C-1 - Analytical Data Report, Characterization Survey of Land AreasAppendix C-2 - QA/QC Documentation, Characterization Survey of Land Areas
Appendix D - Derivation of Key MARSSIM Survey Design Parameters
5427m\dpa\toc
(Rev. 5/03)

APPENDIX A
ACCEPTANCE REVIEW CHECKLIST
In the following checklist, all items are applicable to Kaiser Phase 2 DP exceptthose marked with NA (NOT APPLICABLE)
May 2002 Decommissioning Plan Addendum
(Revised May 2003)
NMSS Decommissioning3RP - Appendix A - Rev 0 9/115/00

ACCEPTANCE REVIEW CHECKLIST
LICENSEE NAME: Kaiser AluminumLICENSE NUMBER: STB-472 (terminated) DOCKET NUMBER: 040-2377FACILITY: 7311 East 41St Street. Tulsa, OKDECOMMISSIONING PLAN DATEDNERSION: Phase 2 DP Addendum
Staff will review the decommissioning plan without assessing the technical accuracy orcompleteness of the information contained therein. The adequacy of this information will beassessed during the detailed technical review.
In most cases, licensees will not be required to submit all of the information in this checklist.Rather, the staff should use this checklist a basis for developing a site specific checklist for theindividual facility. Staff should use the checklist first during the initial meetings with licensees todiscuss the scope and content of the decommissioning plan for each site. The staff, inconjunction with the licensee, should determine what information should be submitted for thesite, based on the uses of radioactive material at the site, the extent and types of radioactivematerial contamination, the manner in which the licensee intends to decommissioning thefacility and other factors affecting the potential for increased risk to the public or workers fromthe decommissioning operations. This information should be documented by modifying theacceptance review checklist. Copies of the modified checklist should be provided to thelicensee and maintained by the Project Manager. When the decommissioning plan is submittedthe Project Manager should use the modified checklist to perform the acceptance review.
Staff will review the decommissioning plan table of contents and the individual decommissioningplan chapters or sections to ensure that the licensee or responsible party has included thisinformation in the decommissioning plan. Ii addition, the staff may use the guidance regardingformatting and suggested length of individual as a guide in determining if the level of detail ofthe information appears to be adequate for the staff to perform a detailed technical review.Staff should recognize that failure to supply an item included in the checklist does notnecessarily constitute grounds for rejecting the decommissioning plan. Rather, the staff shoulddetermine if the licensee can supply the information in a timely manner and if so communicatethe additional information needs to the licensee in a deficiency letter. Only in those caseswhere a detailed technical review cannot begin without the required information should the DPbe rejected. For example, if the licensee is requesting restricted release and has not obtainedthe appropriate input from community interests who could be affected by the decommissioning,the decommissioning plan should be rejected during the acceptance review. Questionsregarding whether to reject a decommissioning plan based on the results of the acceptancereview should be forwarded to the Decommissioning Branch, Division of Waste Management.
NMSS Decommissioning SRP - Appendix A - Rev 0 9/15/00

A2
EXECUTIVE SUMMARY
1.0 & 3. 1 the name and address of the licensee or owner of the site;1.0 &3.j the location and address of the site;
-- a brief description of the site and immediate environs;1 .0 & 2.2 a summary of the licensed activities that occurred at the site1.0 & 4.on the nature and extent of contamination at the site;
1 .0 the decommissioning objective proposed by the licensee (i.e., restricted or unrestricteduse);
1 .0 the DCGLs for the site, the corresponding doses from these DCGLs and the methodthat was use to determine the DCGLs;
Z.2 a summary of the ALARA evaluations performed to support the decommissioning;-- if the licensee or responsible party requests license termination under restricted
conditions, the restrictions the licensee intends to use to limit doses as required in 10CFR Part 20.1403 or 20.1404 and a summary of institutional controls, financialassurance.
-- if the licensee requests license termination under restricted conditions or using alternatecriteria a summary of the public participation activities undertaken by the licensee tocomply with 10 CFR Part 20.1 403(d) or 20.1404(a)(4);
1.0 the proposed initiation and completion dates of decommissioning;-- any post-remediation activities (such as groundwater monitoring) that the licensee
proposes to undertake prior to requesting license termination; andNA a statement that the licensee is requesting that its license be amended to incorporate
the decommissioning plan
FACILITY OPERATING HISTORY
LICENSE NUMBERISTATUS/ AUTHORIZED ACTIVITIES
2. & 22 the radionuclides and maximum activities of radionuclides authorized and used underthe former license;
2.1 & 2.2 the chemical forms of the radionuclides authorized and used under the former license;NA a detailed description of how the radionuclides are currently being used at the site;2.2 the location(s) of use and storage of the various radionuclides authorized under former
licenses; andNA a scale drawing or map of the site and environs showing the current locations of
radionuclide use at the site;NA a list of amendments to the license since the last license renewal.
LICENSE HISTORY
2.2 the radionuclides and maximum activities of radionuclides authorized and used under allprevious licenses;
2 - 2 the chemical forms of the radionuclides authorized and used under all previous licenses;
See notes at end of checklist.
NMSS Decommissioning SRP - Appendix A - Rev 0 9115/00

A3
2.12.2 & 4.1
Figure
3A-3
a detailed description of how the radionuclides were used at the site;the location(s) of use and storage of the various radionuclides authorized under allprevious licensesa scale drawing or map of the site, facilities and environs showing previous locations ofradionuclide use at the site
PREVIOUS DECOMMISSIONING ACTIVITIES
2.4 a list or summary of areas at the site that were remediated in the past,2 - 4 a summary of the types, forms, activities and concentrations of radionuclides that were
present in previously remediated areas;1 .0 & 40 the activities that caused the areas to become contaminated;
2.4 the procedures used to remediate the areas and the disposition of radioactive materialgenerated during the remediation;
2 -4 a summary of the results of the final radiological evaluation of the previously remediatedFigure area
2-4* a scale drawing or map of the site, facilities and environs showing the locations ofprevious reiedial activity
SPILLS (Kaiser will provide a summary statement)
2.5 a summary of areas at the site where spills (or uncontrolled releases) of radioactivematerial occurred in the past;
2.5 the types, forms, activities and concentrations of radionuclides involved in the spill oruncontrolled release, and;
2.5 a scale drawing or map of the site, facilities and environs showing the locations of spills
PRIOR ON-SITE BURIALS
2.62.6
Figure-2--*
a summary of areas at the site where radioactive material has been buried in the past;the types, forms, activities and concentrations of waste and radionuclides in the formerburial, and;a scale drawing or map of the site, facilities and environs showing the locations offormer burials.
FACILITY DESCRIPTION
SITE LOCATION AND DESCRIPTION
3.1 the size of the site in acres or square meters;3. the State and county in which the site is located;-- the names and distances to nearby communities, towns and cities;3.1 a description of the contours and features of the site;i - the elevation of the site;
See notes at end of checklist.
NMSS Decommissioning SRP - Appendix A - Rev 0 9115/00

A4
3.3 a description of property surrounding the site; including the location of all off-site wellsused by nearby communities or individuals;
3. 7 the location of the site relative to prominent features such as rivers and lakes.Figure 3A-2 a map that shows the detailed topography of the site using a contour interval
3.3 the location of the nearest residences and all significant facilities or activities near thesite
3. 1 a description of the facilities (buildings, parking lots, fixed equipment, etc.) at the site
POPULATION DISTRIBUTION
3.2 a summary of the current population in and around the site, by compass vectorsi a summary of the projected population in and around the site by compass vectors3.-2 a list of minority populations by compass vectors3.2 demographic data by census block group to identify minority or low-income populations
CURRENTIFUTURE LAND USE
3.3 a description of the current land uses in and around the site;3.3 a summary of anticipated land uses.
METROLOGY AND CLIMATOLOGY
3.4 a description of the general climate of the region3.4 seasonal and annual frequencies of severe weather phenomena-- weather-related radionuclide transmission parameters__ routine weather-related site deterioration parameters-- extreme weather-related site deterioration parameters3.4 a description of the local (site) meteorology3.5 the National Ambient Air Quality Stindards Category of the area in which the facility is
located and, if the facility is not in a Category 1 zone, the closest and first downwindCategory 1 Zone.
GEOLOGY AND SEISMOLOGY
3-6.1 a detailed description of the geologic characteristics of the site and the region aroundthe site
3.6.2 a discussion of the tectonic history of the region, regional geomorphology,Figure physiography, stratigraphy, and geochronology
3-5* a regional tectonic map showing the site location and its proximity to tectonic structures3 .6. a description of the structural geology of the region and its relationship to the site
geologic structure-- a description of any crustal tilting, subsidence, karst terrain, landsliding, and erosion.
3.6.1 a description of the surface and subsurface geologic characteristics of the site and itsvicinity
3.6.1 a description of the geomorphology of the site
See notes at end of checklist.
NMSS Decommissioning SRP - Appendix A - Rev 0 9/15100O

A5
3.6.2 a description of the location, attitude, and geometry of all known or inferred faults in thesite and vicinity
3.6.2 a discussion of the nature and rates of deformation-- a description of any man-made geologic features such as mines or quarries.
3.6.3 a description of the seismicity of the site and region3.6.3 a complete list of all historical earthquakes that have a magnitude of 3 or more or a
modified Mercalli intensity of IV or more within 200 miles of the site.
SURFACE WATER HYDROLOGY
3.7
Figure3A-2.3.7
3.7
Figure* 3A-2
Figure3.6*
8.2.2*
a description of site drainage and surrounding watershed fluvial featureswater resource data including maps, hydrographs, and stream records from otheragencies (e.g., U.S. Geological Survey and U.S. Army Corps of Engineers).topographic maps of the site that show natural drainages and man-made featuresa description of the surface water bodies at the site and surrounding areasa description of existing and proposed water control structures and diversions (bothupstream and downstream that may influence the site).flow-duration data that indicate minimum, maximum, and average historical observationsfor surface water bodies in the site areasmaps of the site and adjacent drainage areas identifying features such as drainageareas, surface gradients, and areas of flooding.an inventory of all existing and planned surface water users, whose intakes could beadversely affected by migration of radionuclides from the sitetopographic and/or aerial photographs that delineate the 1 00-year floodplain at the sitea description of any man-made changes to the surface water hydrologic system thatmay influence the potential for flooding at the site
GROUNDWATER HYDROLOGY
3.8 a description of the saturated zone3.8 descriptions of monitoring wells3.8 physical parameters
3. 8 1 a description of groundwater flow directions and velocities3.8 a description of the unsaturated zone3.8 information on all monitor stations including location and depth3.8 a description of physical parameters3.8 a description of the numerical analyses techniques used to characterize the unsaturated
and saturated zones3 - 8 the distribution coefficients of the radionuclides of interest at the site.
NATURAL RESOURCES
3.9 a description of the natural resources occurring at or near the site3.9 a description of potable, agricultural, or industrial ground or surface waters
See notes at end of checklist.
NMSS Decommissioning SRP - Appendix A - Rev 0 9/15/00

A6
3.9 a description of economic, marginally economic, or subeconomic known or identifiednatural resources as defined in U.S. Geological Survey Circular 831.
3 - 9 mineral, fuel, and hydrocarbon resources near and surrounding the site which, ifexploited, would effect the licensee' or responsible party's dose estimates
ECOLOGY/ENDANGERED SPECIES
3.10 a list of commercially or recreationally important invertebrate species known to occurwithin 5 km of the site
3 -10 a list of all commercially important floral species known to occur within 5 km of the site3-10 a list of commercially or recreationally important vertebrate animals known to occur
within 5 km of the site.3.10 estimates of the relative abundance of both commercially and recreationally important
game and nongame vertebrates3 10.1 a list of all endangered species at or within 5 km of the site
RADIOLOGICAL STATUS OF FACILITY
CONTAMINATED STRUCTURES
4 -1 a list or description of all structures at the facility where licensed activities occurred that4.1 & contain residual radioactive material in excess of site background levels;
Table 4-1 a summary of the structures and locations at the facility that the licensee or responsiblE
4.:Table
4.1.1&App.4.1.1&Tbl.4. 1.l&Tbl.
Figuresthrough
party has concluded have not been impacted by licensed operations and the rationale& for the conclusion;
4-1 a list or description of each room or work area within each of these structures;D-L a summary of the background levels used during scoping or characterization surveys;4-1 a summary of the locations of contamination in each room or work area4-2 a summary of the radionuclides present at each location, the maximum and average
radionulide activities in dpm/100cm2, and, if multiple radionuclides are present, theradionuclide ratios;
4.1 the mode of contamination for each surface (i.e., whether the radioactive material ispresent only on the surface of the material or if it has penetrated the material);
-- the maximum and average radiation levels in mremlhr in each room or work area; and4A-1 "a scale drawing or map of the rooms or work areas showing the locations of4A-7 radionuclide material contamination.
CONTAMINATED SYSTEMS AND EQUIPMENT
4.2 a list or description and the location of all systems or equipment at the facility thatcontain residual radioactive material in excess of site background levels;
NA a summary of the radionuclides present in each systems or on the equipment at eachlocation, the maximum and average radionulide activities in dpm/1OOcm2, and, ifmultiple radionuclides are present, the radionuclide ratios;
See notes at end of checklist.
NMSS Decommissioning SRP - Appendix A - Rev 0
II
915/00

A7
NA the maximum and average radiation levels in mrem/hr at the surface of each piece ofequipment;
NA a summary of the background levels used during scoping or characterization surveys;and,
NA a scale drawing or map of the rooms or work areas showing the locations of thecontaminated systems or equipment;
SURF)
Table 4-13 &4.3
Tabl 4-3 &4.3
4.3.1through 4.3.9
Figures 4A-9through 4A-17
ACE SOIL CONTAMINATION (Discussion of surface and subsurface soilContamination will be combined in one section)
a list or description of all locations at the facility where surface soil contains residualradioactive material in excess of site background levels;a summary of the background levels used during scoping or characterization surveysa summary of the radionuclides present at each location, the maximum, average, andvariability of radionuclide activities in pCVgm, and, if multiple radionuclides are present,the radionuclide ratios;the maximum and average radiation levels in mrem/hr at each location; anda scale drawing or map of the site showing the locations of radionuclide materialcontamination in surface soil;
SUBSURFACE SOIL CONTAMINATIONTable 4-13 &
4.3able 4-3 &
4.34.3.1 through
4.3.9
Table 4-13Figures 4A-9through 4A-17
a list or description of all locations at the facility where subsurface soil contains residualradioactive material in excess of site background levels;a summary of the background levels used during scoping or characterization surveysa summary of the radionuclides present at each location, the maximum, average, andvariability of radionulide activities in pCi/gm, and, if multiple radionuclides are present,the radionuclide ratios;the depth of the subsurface soil contamination at each location; anda scale drawing or map of the site showing the locations of subsurface soilcontamination.
SURFACE WATER
4.4 a list or description of all surface water bodies at the facility that contain residualradioactive material in excess of site background levels;
4.4 a summary of the background levels used during scoping or characterization surveys4.4 a summary of the radionuclides present in each surface water body and the maximum
and average radionuclide activities in pCi/I.
GROUNDWATER
4.5 a summary of the aquifer(s) at the facility that contain residual radioactive material inexcess of site background levels;
4.5 a summary of the background levels used during scoping or characterization surveys
See notes at end of checklist.
NMSS Decommissioning SRP - Appendix A - Rev 0 9/15100

Ag
4.5 a summary of the radionuclides present in each aquifer and the maximum and averageradionulide activities in pCVI
DOSE MODELING
UNRESTRICTED RELEASE USING SCREENING CRITERIA
Unrestricted release using screening criteria for building surface residual radioactivity
NA the general conceptual model (for both the source term and the building environment) ofthe site; and,
NA a summary of the screening method (i.e., running DandD or using the look-up.tables)used in the decommissioning plan.
Unrestricted release using screening criteria for surface soil residual radioactivity
(Kaiser will make a statement indicating that site specific information will be used)q5j justification on the appropriateness of using the screening approach (for both the source
term and the environment) at the site; and,5.1 a summary of the screening method (i.e., running DandD or using the look-up tables)
used in the decommissioning plan.
UNRESTRICTED RELEASE USING SITE-SPECIFIC INFORMATION
5.2.1 source term information including nuclides of interest, configuration of the source, arealvariability of the source, etc.
5.2.2 description of the exposure scenario including a description of the critical group.5.2.1 & 5.2.2 description of the conceptual model-of the site including the source term, physical
features important to modeling the transport pathways, and the critical group.5. 1 & 5.2.2.1 identification/description of the mathematical model used (e.g., hand calculations,
DandD Screen v1.0, RESRAD v5.81, etc.).Appendix D* description of the parameters used in the analysis.
5.2.5 discussion about the effect of uncertainty on the results.Appendices, B. input and output files or printouts, if a computer program was used.
C, D, & E*RESTRICTED RELEASE USING SITE-SPECIFIC INFORMATION(This section is applicable if Kaiser decides to a restricted release scenario)
-- source term information including nuclides of interest, configuration of the source, arealvariability of the source, and chemical forms;
-- a description of the exposure scenarios including a description of the critical group foreach scenario;
-- a description of the conceptual model(s) of the site that includes the source term,physical features important to modeling the transport pathways, and the critical group foreach scenario;
See notes at end of checklist.
NMSS Decommissioning SRP - Appendix A - Rev 0 9/1 5/00

A9
identification/description of the mathematical model(s) used (e.g., hand calculations,RESRAD v5.81, etc.);
-- a summary of parameters used in the analysis;-- a discussion about the effect of uncertainty on the results; and-- input and output files or printouts, if a computer program was used.
RELEASE INVOLVING ALTERNATE CRITERIA
NA source term information including nuclides of interest, configuration of the source, arealvariability of the source, and chemical forms;
NA a description of the exposure scenarios including a description of the critical group foreach scenario;
NA a description of the conceptual model(s) of the site that includes the source term,physical features important to modeling the transport pathways, and the critical group foreach scenario;
NA identification/description of the mathematical model(s) used (e.g., hand calculations,RESRAD v5.81, etc.);
NA a summary of parameters used in the analysis;NA a discussion about the effect of uncertainty on the results; andNA input and output files or printouts, if a computer program was used.
ALTERNATIVES CONSIDERED AND RATIONALE FOR CHOSEN ALTERNATIVE
ALTERNATIVES CONSIDEREDFgure 8A-2 &
8.2.6 a description of the facility if the alternative is employed;5.1 a summary of the health effects to adjacent communities if the alternative is employed;6.1 a summary of the impacts on community resources such as land use and property
values;5.0 a summary of the impacts on the geology, hydrology, air quality and ecology in and
around the site;6.1 a description of impacts to minority or low-income populations within a 0.6 mile radius of
the center of the facility (urban location) or within a 4 mile radius of the center of thefacility (rural location);
NA if appropriate, an assessment of the potential for criticality;8.0 a summary of the irreversible and irretrievable commitment of resources.6.0 an analysis of the proposed alternative and other alternatives as required by 10 CFR
51.45(c);** a list of the permits, licenses, approvals, and other entitlements and the discussion of
the status of compliance with these requirements required in 10 CFR 51.45(d)
RATIONALE FOR CHOSEN ALTERNATIVE
6.1 a description of why the licensee selected the preferred alternative described in thedecommissioning plan
See notes at end of checklist.
NMSS Decommissioning SRP - Appendix A - Rev 0 9115100

AIO
-- if the licensee has not selected the environmentally preferable alternative, anexplanation of why this alternative was not selected.
ALARA ANALYSIS
7.1 a description of how the licensee or responsible party will achieve a decommissioninggoal below the dose limit;
7.1 a quantitative cost benefit analysis;7.1 a description of how costs were estimated; and,7 .2 a demonstration that the doses to the average member of the critical group are ALARA
PLANNED DECOMMISSIONING ACTIVITIES
CONTAMINATED STRUCTURES
NA a summary of the remediation tasks planned for each room or area in the contaminatedstructure in the order in which they will occur;
NA a description of the remediation techniques that will be employed in each room or areaof the contaminated structure;
NA a summary of the radiation protection methods and control procedures that will beemployed in each room or area;
NA a summary of the procedures already authorized under the existing license and thosefor which approval is being requested in the decommissioning plan;
NA a commitment to conduct decommissioning activities in accordance with written,approved procedures;
NA a summary of any unique safety or remediation issues associated with remediating theroom or area; and,
NA for Part 70 licensees, a summary of how the licensee will ensure that the risksaddressed in the facilitys Integrated Safety Analysis will be addressed duringdecommissioning.
CONTAMINATED SYSTEMS AND EQUIPMENT
NA a summary of the remediation tasks planned for each system in the order in which theywill occur including which activities will be conducted by licensee staff and which will beperformed by a contractor;
NA a description of the techniques that will be employed to remediate each system in thefacility or site;
NA a description of the radiation protection methods and control procedures that will beemployed while remediating each system;
NA a summary of the equipment will be removed or decontaminated and how thedecontamination will be accomplished;
NA a summary of the procedures already authorized under the existing license and thosefor which approval is being requested in the decommissioning plan;
See notes at end of checklist.
NMSS Decommissioning SRP - Appendix A - Rev 0 9/15/00

All
NA a commitment to conduct decommissioning activities in accordance with written,approved procedures;
NA a summary of any unique safety or remediation issues associated with remediating anysystem or piece of equipment; and,
NA for Part 70 licensees, a summary of how the licensee will ensure that the risksaddressed in the facility's Integrated Safety Analysis will be addressed duringdecommissioning.
SOIL
8.2 a summary of the removaVremediation tasks planned for surface and subsurface soil atthe site in the order in which they will occur including which activities will be conductedby licensee staff and which will be performed by a contractor;
8.2.1 a description of the techniques that will be employed to remove or remediate surfaceand subsurface soil at the site;
8.2.1 a description of the radiation protection methods and control procedures that will beemployed during soil removalVremediation;
8.3 a summary of the procedures already authorized under the existing license and thosefor which approval is being requested in the decommissioning plan;
8- 3 a commitment to conduct decommissioning activities in accordance with written,approved procedures;
8.3 a summary of any unique safety or removaVremediation issues associated withremediating the soil; and,
NA for Part 70 licensees, a summary of how the licensee will ensure that the risksaddressed in the facility's Integrated Safety Analysis will be addressed duringdecommissioning.
SURFACE AND GROUNDWATER
NA a summary of the remediation tasks planned for ground and surface water in the orderin which they will occur, including which activities will be conducted by licensee staff andwhich will be performed by a contractor;
NA a description the remediation techniques that will be employed to remediate the groundor surface water;
NA a description of the radiation protection methods and control procedures that will beemployed during ground or surface water remediation
NA a summary of the procedures already authorized under the existing license and thosefor which approval is being requested in the decommissioning plan
NA a commitment to conduct decommissioning activities in accordance with written,approved procedures; and,
NA a summary of any unique safety or remediation issues associated with remediating theground or surface water.
SCHEDULES
Figure 88* a Gantt or PERT chart detailing the proposed remediation tasks in the order in whichthey will occur
<'See notes at end of checklist.
NMSS Decommissioning SRP - Appendix A - Rev 0 91100

A12
8 -5 a statement acknowledging that the dates in the schedule are contingent on NRCapproval of the decommissioning plan;
8.5 a statement acknowledging that circumstances can change during decommissioning,and, if the licensee determines that the decommissioning cannot be completed asoutlined in the schedule, the licensee or responsible party will provide an updatedschedule to NRC; and,
8.5 If the decommissioning is not expected to be completed within the timeframes outlinedin NRC regulations, a request for alternative schedule for completing thedecommissioning
PROJECT MANAGEMENT AND ORGANIZATION
DECOMMISSIONING MANAGEMENT ORGANIZATION
9.1 a description of the decommissioning organization9.1 a description of the responsibilities of each of these decommissioning project units;9.1 description of the reporting hierarchy within the decommissioning project management
organization9.1 a description of the responsibility and authority of each unit to ensure that
decommissioning activities are conducted in a safe manner and in accordance withapproved written procedures
DECOMMISSIONING TASK MANAGEMENT
9.2 a description of the manner in which the decommissioning tasks are managed9.2 a description of how individual decommissioning tasks are evaluated and how the SWPs
are developed for each task;9 2 a description of how the SWPs are reviewed and approved by the decommissioning
project management organization;9.2 - a description of how SWPs are managed throughout the decommissioning project9.2 a description of how individuals performing the decommissioning tasks are informed of
the procedures in the SWP
DECOMMISSiONING.MANAGEMENT POSITIONS AND QUALIFICATIONS
9.2 & 9.3 a description of the duties and responsibilities of each management position in thedecommissioning organization and the reporting responsibility of the position;
9.2 & 9.3 a description of the duties and responsibilities of each chemical, radiological, physicaland occupational safety-related position in the decommissioning organization and thereporting responsibility of the position;
9.2 & 9.3 a description of the duties and responsibilities of each engineering, quality assurance,and waste management position in the decommissioning organization and the reportingresponsibility of the position
9.3 the minimum qualifications for each of the positions describe above-- a description of all decommissioning and safety committees, provided Kaiser decides to
pursue a restricted release scenario
N,.See notes at end of checklist.
NMSS Decommissioning SRP - Appendix A - Rev 0 9115/00

A13
Radiation Safety Officer
-9.3 a description of the health physics and radiation safety education and experiencerequired for individuals acting as the licensee's or responsible party's RSO
9.1 a description of the responsibilities and duties of the RSO; and.9.1 a description of the specific authority of the RSO to implement and manage the
licensee's or responsible party' radiation protection program
TRAINING
9 4 a description of the radiation safety training that the licensee will provide to eachemployee
9.4 a description of any daily worker ijobside' or "tailgate" training that will be provided atthe beginning of each workday or job task to familiarize workers with job-specificprocedures or safety requirerients
9 4 a description of the documentation that will be maintained to demonstrate that trainingcommitments are being met.
CONTRACTOR SUPPORT
8.2 a summary of decommissioning tasks that will be performed by contractors9.1 a description of the management interfaces that will be in place between the licensee or
responsible party's management and on-site supervisors and contractor managementand on-site supervisors;
9.1 a description of the oversight responsibilities and authority that the licensee orresponsible party will exercise over contractor personnel;
9.3 & 9.4 a description of the training that will be provided to contractor personnel by the licenseeor responsible party and the training that will be provided by the contractor
9 * 5 a commitment that the contractor will comply with all radiation safety and licenserequirements at the facility.
HEALTH AND SAFETY PROGRAM DURING DECOMMISSIONING
RADIATION SAFETY CONTROLS AND MONITORING FOR WORKERS
Air Sampling Program
10.1 a description which demonstrates that the air sampling program is representative of theworkers breathing zones
10.1 a description of the criteria which demonstrates that air samplers with appropriatesensitivities will be used; and that samples will be collected at appropriate frequencies
10.v 1 a description of the conditions under which air monitors will be used10.1.1 a description of the criteria used to determine the frequency of calibration of the flow
meters on the air samplers10.1.1 a description of the action levels for air sampling results
\<See notes at end of checklist.
NMSS Decommissioning SRP - Appendix A - Rev 0 9/15100

A14
10. .I adescription of how minimum detectable activities [MDA] for each specific radionuclidethat may be collected in air samples are determined
Respiratory Protection Program
10.1.2 a description of the process controls, engineering controls or procedures to controlconcentrations of radioactive materials in air,
10.1 .2 a description of the evaluation which will be performed when it is not practical to applyengineering controls or procedures
10. 1.2 a description of the considerations used which demonstrates respiratory protectionequipment is appropriate for a specific task based on the guidance on assignedprotection factors;
10. 1.2 a description of the medical screening and fit testing required before workers will useany respirator that is assigned a protection factor;
10.1.2 a description of the written procedures maintained to address all the elements of therespiratory protection program;
10.1.2 a description of the use, maintenance, and storage of respiratory protection devices10.1 .2 a description of the respiratory equipment users training program;10.1 .2 a description of the considerations made when selecting respiratory protection
equipment
Internal Exposure Determination
10.1.3 a description of the monitoring to be performed to determine worker exposure10.1.3 a description of how worker intakes are determined using measurements of quantities of
radionuclides excreted from, or retained in the human body10.1 a description of how worker intakes are determined by measurements of the
concentrations of airborne radioactive materials in the workplace.10.1.5 a description of how worker intakes, for an adult, a minor, and a declared pregnant
woman are determined using any combination of the measurements above as may benecessary
10.1 a description of how worker intakes are converted into committed effective doseequivalent
External Exposure Determination
10.1.4 a description of the individual-monitoring devices which will be provided to workers-- a description of the type, range, sensitivity, and accuracy of each individual-monitoring
device;10.1.4 a description of the use of extremity and whole body monitors when the extemal
radiation field is non-uniform-- a description of when audible-alarm dosimeters and pocket dosimeters will be provided
10.1 a description of how extemal dose from airbome radioactive material is determined10.1.4 a description of the procedure to insure that surveys necessary to supplement personnel
monitoring are performed
See notes at end of checklist.
NMSS Decommissioning SRP - Appendix A - Rev 0 91100

pen
Appen
A15
10.1 a description of the action levels for worker's external exposure, and the technical basesand actions to be taken when they are exceeded.
Summation of Internal and External Exposures
10.1.5 a description of how the internal and external monitoring results are used to calculateTODE and TEDE doses to occupational workers;
-- a description of how internal doses to the embryo/fetus, which is based on the intake ofan occupationally-exposed, declared, pregnant woman will be determined;-
-- a description of the monitoring of the intake of a declared, pregnant woman ifdetermined to be necessary;
10.1 .8 a description of the program for the preparation, retention and reporting of records foroccupational radiation exposures;
Contamination Control Program
10.1 .6 a description of the written procedures to control access to, and stay time in,contaminated areas by workers if they are needed
10.1.6 a description of surveys to supplement personnel monitoring for workers during routineoperations, maintenance, clean-up activities, and special operations;
14.2 a description of the surveys which will be performed to determine the baseline ofbackground radiation levels and radioactivity from natural sources for areas wheredecommissioning activities will take place;
dix G* a description in matrix or tabular form which describes contamination action limits (thatis, actions taken to either decontaminate a person, place or area,. or restrict access, ormodify the type or frequency of radiological monitoring)
.dix G* a description (included in the matrix or table mentioned above) of proposed radiologicalcontamination guidelines for specifying and modifying the frequency for each type ofsurvey used to assess the reduction of total contamination
-- a description of the procedures used to test sealed sources, and to insure that sealedsources are leaked tested at appropriate intervals
Instrumentation Program
10 1 7 a description of the instruments to be used to support the health and safety program10.1 .7 a description of instrumentation storage, calibration and maintenance facilities for
instruments used in field surveys10 1 .1 a description of the method used to estimate the MDC or MDA (at the 95% confidence
level) for each type of radiation to be detected;10.1 .7 a description of the instrument calibration and quality assurance procedures;
a description of the methods used to estimate uncertainty bounds for each type ofinstrumental measurement;
10. 1 .7 a description of air sampling calibration procedures or a statement that the instrumentswill be calibrated by a qualified service provider.
See notes at end of checklist.
NMSS Decommissioning SRP - Appendix A - Rev 0 9/1 500

A16
Nuclear Criticality Safety
NA a description of how the NCS functions, including management responsibilities andtechnical qualifications of safety personnel, shall be maintained when neededthroughout the decommissioning process;
NA a description of how an awareness of procedures and other items relied on for safetyshall be maintained throughout decommissioning among all personnel with access tosystems that may contain fissionable material in sufficient amounts for criticality;
NA a summary of the review of NCSA's or the ISA indicating either that the process needsno new safety procedures or requirements, or that new requirements or analysis havebeen performed; and
NA a summary of any generic NCS requirements to be applied to general decommissioning,decontamination, or dismantlement operations, including those dealing with systems.that may unexpectedly contain fissionable material.
Health Physics Audits, Inspections and Record-Keeping Program.
10.L.9 a general description of the annual program review conducted by management10.1.9 a description of the records to be maintained of the annual program review and
management audits-10.1.9 a description of the types and frequencies of surveys and audits to be performed by the
RSO and RSO staff10.1 9 a description of the process used in evaluating and dealing with violations of NRC
requirements or license commitments identified during audits10.1.9 a description of the records maintained of RSO audits
ENVIRONMENTAL MONITORING AND CONTROL PROGRAM
ENVIRONMENTAL ALARA EVALUATION PROGRAM
11.1 a description of ALARA goals for effluent control;11.1 a description of the procedures, engineering controls, and process controls to maintain
doses ALARA11.1 a description of the ALARA reviews and reports to management.
EFFLUENT MONITORING PROGRAM
11.1 a demonstration that background and baseline concentrations of radionuclides inenvironmental media have been established through appropriate sampling and analysis;
11.1 a description of the known or. expected concentrations of radionuclides in effluents;11.1 a description of the physical and chemical characteristics of radionuclides in effluents;11.2 a summary or diagram of all effluent discharge locations;11 .2 a demonstration that samples will be representative of actual releases;11 .2 a summary of the sample collection and analysis procedures
See notes at end of checklist.
NMSS Decommissioning SRP - Appendix A - Rev 0 9/15/00

A17
11.211.211.2
a summary of the sample collection frequencies;a description of the environmental monitoring recording and reporting procedures; anda description of the quality assurance program to be established and implemented forthe effluent monitoring program
EFFLUENT CONTROL PROGRAM
11. 3 a description of the controls that will be used to minimize releases of radioactive materialto the environment;
11. 3 a summary of the action levels and description of the actions to be taken should a limitbe exceeded;
11. 3 a description of the leak detection systems for ponds, lagoons, and tanks;11. 3 a description of the procedures to ensure that releases to sewer systems are controlled
and maintained to meet the requirements of 10 CFR 20.2003, and11.1 a summary of the estimates of doses to the public from effluents and a description of
the method used to estimate public dose.
RADIOACTIVE WASTE MANAGEMENT PROGRAM
SOLID RADWASTE
12.1 a summary of the types of solid radwaste that are expected to be generated duringdecommissioning operations
12.1.1 a summary of the estimated volume, in cubic feet, of each solid radwaste typesummarized under bullet 1 above;
12.1- a summary of the radionuclides (including the estimated activity of each radionuclide) ineach estimated solid radwaste type summarized under bullet I above;
12.3.1.. a summary of the volumes of Class A, B, C and Greater-than-Class-C solid radwastethat wll be generated by decommissioning operations;
12.1.3 a description of how and where each of the solid radwaste summarized under bullet Iabove, will be stored on-site prior to shipment for disposal;
& 12.3.2 a description of how the each of the solid radwastes summarized under bullet 1 above,will be treated and packaged to meet disposal site acceptance criteria prior to shipmentfor disposal;
& 12-3-2 if appropriate, how the licensee or responsible party intends to manage volumetricallycontaminated material;
12.3.2 a description of how the licensee or responsible party will prevent contaminated soil, orother loose solid radwaste, from being re-disbursed after exhumation and collection; and
12.1.3 the name and location of the disposal facility that the licensee intends to use for eachsolid radwaste type summarized under bullet I above
LIQUID RADWASTE
12.2 a summary of the types of liquid radwaste that are expected to be generated duringdecommissioning operations
See notes at end of checklist.
NMSS Decommissioning SRP - Appendix A - Rev 0
12.1 &
12.1.3
12.1.3
9/15/00

A18
12.2 a summary of the estimated volume, in liters, of each liquid radwaste type summarizedunder bullet 1 above;
12.2 a summary of the radionuclides (including the estimated activity of each radionuclide) ineach liquid radwaste type summarized under bullet I above;
12.2 a summary of the estimated volumes of Class A, B, C and Greater-than-Class-C liquidradwaste that will be generated by decommissioning operations;
12.2 a description of how and where each of the liquid radwastes summarized under bullet 1above, will be stored on-site prior to shipment for disposal;
12.2 a description of how the each of the liquid radwastes summarized under bullet 1 above,will be treated and packaged to meet disposal site acceptance criteria prior to shipmentfor disposal;
12.2 the name and location of the disposal facility that the licensee intends to use for eachliquid radwaste type summarized under bullet 1 above
MIXED WASTE
12.4 a summary of the types of solid and liquid mixed waste that are expected to begenerated during decommissioning operations;
12.4 a summary of the estimated volumes, in cubic feet of each solid mixed waste typesummarized under bullet 1 above and in liters for each liquid mixed waste;
12.4 a summary of the radionuclides (including the estimated activity of each radionuclide) ineach type of mixed waste type summarized under bullet 1 above;
12.4 a summary of the estimated volumes of Class A, B, C and Greater-than-Class-C mixedwaste that will be generated by decommissioning operations;
12.4 a description of how and where each of the mixed wastes summarized under bullet 1above, will be stored on-site prior to shipment for disposal;
12 .4 a description of how the each of the mixed wastes summarized under bullet I above,will be treated and packaged to meet disposal site acceptance criteria prior to shipmentfor disposal;
12.4 the name and location of the disposal facility that the licensee intends to use for eachmixed waste type summarized under bullet 1 above;
12 -4 a discussion of the requirements of all other regulatory agencies having jurisdiction overthe mixed waste; and,
12.4 a demonstration the that the licensee possess the appropriate EPA or State permits togenerate, store and/or treat the mixed wastes;
QUALITY ASSURANCE PROGRAM
ORGANIZAION
13.1 a description of the QA program management organization,13. 1 a description of the duties responsibilities of each unit within the organization and how
delegation of responsibilities is managed within the decommissioning program13.2 a description of how work performance is evaluated;
See notes at end of checklist.NMSS Decommissioning SRP - Appendix A - Rev 0 9115100

A19
<__/ 13.1
Figure 9-1*
a description of the authority of each unit within the QA programan organization chart of the QA program organization
QUALITY ASSURANCE PROGRAM
13.2 a commitment that activities affecting the quality of site decommissioning will be subjectto the applicable controls of the QA program and activities covered by the QA programare identified on program defining documents;
13.1 a brief summary of the company's corporate QA policies;13.2 a description of provisions to ensure that technical and quality assurance procedures
required to implement the QA program are consistent with regulatory, licensing, and QAprogram requirements and are properly documented and controlled;
13.2 a description of the management reviews, including the documentation of concurrencein these quality-affecting procedures;
13.2 a description of the quality-affecting procedural controls of the principal contractors-- a description of how NRC will be notified of changes (a) for review and acceptance in
the accepted description of the QA program as presented or referenced in the DPbefore implementation and (b) in organizational elements within 30 days after theannouncement of the changes
13.7 a description is provided of how management regularly assesses the scope, status,adequacy, and compliance of the QA program;
13.7 & 9.4 a description of the instruction provided to personnel responsible for performingactivities affecting quality
9.4 a description of the training and qualifications of personnel verifying activities9.4 for formal training and qualification programs, documentation includes the objectives
and content of the program, attendees, and date of attendance;13.7 a description of the self-assessment program to confirm that activities affecting quality
comply with the QA program;13.1 a commitment that persons performing self-assessment activities are not to have direct
responsibilities in the area they are assessing;13.7 a description -of the organizational responsibilities for ensuring that activities affecting
quality are (a) prescribed by documented instructions, procedures, and drawings; and,(b) accomplished through implementation of these documents; and,
13.7 a description of the procedures to ensure that instructions, procedures, and drawingsinclude quantitative acceptance criteria and qualitative acceptance criteria fordetermining that important activities have been satisfactorily performed.
DOCUMENT CONTROL
13.413.4
a summary of the types of QA documents that are included in the programa description of how the licensee or responsible party develops, issues, revises andretires QA documents
See notes at end of checklist.
NMSS Decommissioning SRP - Appendix A - Rev 0 9115100

A20
CONTROL OF MEASURING AND TEST EQUIPMENT
13-5 a summary of the test and measurement equipment used in the program13.5 description of how and at what frequency the equipment will be calibrated;13.5 a description of the daily calibration checks that will be performed on each piece of test
or measurement equipment;13-5 a description of the documentation that will be maintained to demonstrate that only
properly calibrated and maintained equipment was used during the decommissioning
CORRECTIVE ACTION
13.6 a description of the corrective action procedures for the facility, including a description ofhow the corrective action is determined to be adequate;
13. 6 a description of the documentation maintained for each corrective action and anyfollowup activities by the QA organization after the corrective action is implemented;
QUALITY ASSURANCE RECORDS
13. 7 a description of the manner in which the QA records will be managed13. 7 a desciiption of the responsibilities of the QA organization13. 7 a description of the QA records storage facility.
AUDITS AND SURVEILLANCES
13. 8 a description of the audit program13. 8 a description of the records and documentation generated during the audits and the
manner in which the documents are managed13. 8 a description of all followup activities associated with audits or surveillances13. 8 a description of the trending/tracking that will be performed on the results of audits and
surveillances
FACILITY RADIATION SURVEYS
RELEASE CRITERIA
14.1 a summary table or list of the DCGLW for each radionuclide and impacted media ofconcern;
14.1 if Class 1 survey units are present, a summary table or list of area factors that will beused for determining a DCGLEMC for each radionuclide and media of concem;
14.1 if Class 1 survey units are present, the DCGLEMCS for each radionuclide and mediumof concern;
14. 1 if multiple radionuclides are present, the appropriate DCGLW for the survey method tobe used.
,See notes at end of checklist.
NMSS Decommissioning SRP - Appendix A - Rev 0 9/15/00

A21
CHARACTERIZATION SURVEYS
4.0 & 14.24.0 & 14.2
4.0 & 14.2
4.0 & 14.2
4.0 & 14.2
4.0 & 14.2
4.0 & 14.2
4.0 & 14.2
4.0 & 14.2
a description and justification of the survey measurements for impacted mediadescription of the field instruments and methods that were used for measuringconcentrations and the sensitivities of those instruments and methods;a description of the laboratory instruments and methods that were used for measuringconcentrations and the sensitivities of those instruments and methods;the survey results including tables or charts of the concentrations of residualradioactivity measured;maps or drawings of the site, area, or building showing areas classified as non-impactedor impactedjustification for considering areas to be non-impacted;a discussion of why the. licensee considers the characterization survey to be adequate todemonstrate that it is unlikely that significant quantities of residual radioactivity havegone undetected;for areas and surfaces that are inaccessible or not readily accessible, a discussion ofhow they were surveyed or why they did not need to be surveyed;for sites, areas, or buildings with multiple radionuclides, a discussion justifying the ratiosof radionuclides that will be assumed in the final status survey or an indication that nofixed ratio exists and each radionuclide will be measured separately.
REMEDIAL ACTION SUPPORT SURVEYS
14.314.3
a description of field screening methods and instrumentation;a demonstration that field screening should be capable of detecting residual radioactivityat the DCGL;
FINAL STATUS SURVEY DESIGN
14.4 a brief overview describing the final status survey design.14.4 a description and map or drawing of impacted areas of the site, area, or building
classified by residual radioactivity levels (Class 1; Class 2, or Class 3) and divided intosurvey units with an explanation of the basis for division into survey units.
14.4 a description of the background reference areas and materials, if they will be used, anda justification for their selection.
14.4 a summary of the statistical tests that will be used to evaluate the survey results,14.4 a description of scanning instruments, methods, calibration, operational checks,
coverage, and sensitivity for each media and radionuclide.14.4 for in-situ sample measurements made by field instruments, a description of the
instruments, calibration, operational checks, sensitivity, and sampling methods with a14.4 demonstration that the instruments and methods have adequate sensitivity.14.4 a description of the analytical instruments for measuring samples in the laboratory,
calibration, sensitivity, and methods with a demonstration that the instruments andmethods have adequate sensitivity;
See notes at end of checklist.
NMSS Decommissioning SRP - Appendix A - Rev 0 9/15/00

A22
14.4 a description of how the samples to be analyzed in the laboratory will be collected,controlled, and handled;
14.4 a description of the final status survey investigation levels and how they weredetermined
14.4 a summary of any significant additional residual radioactivity that was not accounted forduring site characterization;
14-4 a summary of direct measurement results and/or soil concentration levels in units thatare comparable to the DCGL and if data is used to estimate or update the survey unit;
14.*4 a summary of the direct measurements or sample data used to both evaluate thesuccess of remediation and to estimate the survey unit variance.
FINAL STATUS SURVEY REPORT
14.5 an overview of the results of the final status survey.14.5 a discussion of any changes that were made in the final status survey from what was
proposed in the Decommissioning Plan or other prior submittals.14.5 a description of the method by which the number of samples was determined for each
survey unit;14-5 a summary of the values used to determine the numbers of sample and a justification
for these values;14.5 the survey results for each survey unit include:
14.5 the number of samples taken for the survey unit;14.5 a map or drawing of the survey unit showing the reference system and random
start systematic sample locations for Class 1 and 2 survey units and randomlocations shown for Class 3 survey units and reference areas;
14.5 the measured sample concentrations;14.5 the statistical evaluation of the measured concentrations;1A.5 judgmental and miscellaneous sample data sets reported separately from the
those samples collected for performing the statistical evaluation;14.5 a discussion of anomalous data including any areas of elevated direct radiation
detected during scanning that exceeded the investigation level or measurementlocations in excess of DCGLW.
14.5 a statement that a given survey unit satisfied the DCGL, and the elevatedmeasurement comparison if any sample points exceeded the DCGLW.
14.5 a description of any changes in initial survey unit assumptions relative to the extent ofresidual radioactivity
14.5 if a survey unit fails, a description of the investigation conducted to ascertain the reasonfor the failure and a discussion of the impact that the failure has on the conclusion thatthe facility is ready for final radiological surveys; and
14.5 if a survey unit fails, a discussion of the impact that the reason for the failure has onother survey unit information.
See notes at end of checklist.
NMSS Decommissioning SRP - Appendix A - Rev 0 9/15/00

A23
FINANCIAL ASSURANCE
COST ESTIMATETable
15-1 a cost estimate that appears to be based on documented and reasonable assumptions;
CERTIFICATION STATEMENT
NA the certification statement is based on the licensed possession limits and the applicablequantities specified in 10 CFR 30.35, 40.36, or 70.25
NA licensee is eligible to use a certification of financial assurance and, if eligible, that thecertification amount is appropriate.
FINANCIAL MECHANISM(Kaiser will prepare and submit financial cost estimates for remediation alternatives considered)
NA the financial assurance mechanism supplied by the licensee or responsible partyconsists of one or more of the following instruments:
trust fund;escrow account;government fund;certificate of deposit;deposit of government securities;surety bond;letter of credit;line of credit;insurance policy;parent company guarantee;self guarantee;external sinking fund;statement of intent; orby special arrangements with a government entity assuming custody orownership of the site
NA the financial assurance mechanism is an originally signed duplicate.NA the wording of the financial assurance mechanism is identical to the recommended
wording provided in Appendix F,NA for a licensee regulated under 10 CFR Part 72, a means is identified in the
decommissioning plan for adjustirig the financial assurance funding level over anystorage and surveillance period;
NA the amount of financial assurance coverage provided by the licensee for site control andmaintenance is at least as great as that calculated using the formula provided in thisSRP
See notes at end of checklist.
NMSS Decommissioning SRP - Appendix A - Rev 0 9115/00

A24
RESTRICTED USE/ALTERNATE CRITERIA(This section not required unless Kaiser proposes a restricted release scenario)
RESTRICTED USE
ELIGIBILITY DEMONSTRATION
-- a demonstration that the benefits of dose reduction are less than the cost of doses,injuries and fatalities; or
-_ a demonstration that the proposed residual radioactivity levels at the site are ALARA
INSTITUTIONAL CONTROLS
-- a description of the legally enforceable institutional control(s) and an explanation of how*- the institutional control is a legally enforceable mechanism;
a description of any detriments associated with the maintenance of theinstitutional control(s);
-- a description of the restrictions on present and future landowners;-- a description of the entities enforcing, and their authority to enforce, the
institutional control(s);-- a discussion of the durability of the institutional control(s);-- a description of the activities that the entity with the authority to enforce the institutional
controls may undertake to enforce the institutional control(s)tJ -- the manner in which the entity with the authority to enforce the institutional control(s) will
be replaced if that entity is no longer willing or able to enforce theinstitutional control(s) (this may not be needed for Federal or State entities);
-- a description of the duration of the institutional control(s), the basis for the duration, theconditions that will end the institutional control(s) and the activities that will beundertaken to end the institutional control(s);
- a description of the plans for corrective actions that may be undertaken in the event theinstitutional control(s) fail; and
-- a description of the records pertaining to the institutional controls, how and where willthey will be maintained, and how the public will have access to the records.
SITE MAINTENANCE & FINANCIAL ASSURANCE
-- a demonstration that an appropriately qualified entity has been provided to control andmaintain the site;
-- a description of the site maintenance and control program and the basis for concludingthat the program is adequate to control and maintain the site;a description of the arrangement or contract with the entity charged with carrying out theactions necessary to maintain control at the site;
-- a demonstration that the contract or arrangement will remain in effect for as long asfeasible, and include provisions for renewing or replacing the contract;
-- a description of the manner in which independent oversight of the entity charged withmaintaining the site will be conducted and what entity will conduct the oversight;
See notes at end of checklist.
NMSS Decommissioning SRP - Appendix A - Rev 0 9/15/00

A25
-- a demonstration that the entity providing the oversight has the authority to replace theentity charged with maintaining the site;a description of the authority granted to the third party to perform, or have performed,any necessary maintenance activities;
-- unless the entity is a government entity, a demonstration that the third party is not theentity holding the financial assurance mechanism;
-- a demonstration that sufficient records evidencing to official actions and financialpayments made by the third party are open to public inspection;a description of the periodic site inspections that will be performed by the third party,including the frequency of the inspections.
* - a copy of the financial assurance mechanism provided by the licensee or responsibleparty; and,
-- a demonstration that the amount of financial assurance provided is sufficient to allow anindependent third party to carry.out any necessary control and maintenance activities2.
OBTAINING PUBLIC ADVICE
a description of how individuals and institutions that may be affected by thedecommissioning were identified and informed of the opportunity to provide advice tothe licensee or responsible party;a description of the manner in which the licensee obtained advice from these individualsor institutions;a description of how the licensee provided for participation by a broad cross-section ofcommunity interests in obtaining the advice;a description of how the licensee provided for a comprehensive, collective discussion onthe issues by the participants represented;a copy of the publicly available summary of the results of discussions, includingindividual viewpoints of the participants on the issues and the extent of agreement anddisagreement among the participants;a description of how this summary has been made available to the public;a description of how the licensee evaluated the advice, and the rationale forincorporating, or not incorporating, the advice from affected members of the communityinto the decommissioning plan.
DOSE MODELING AND ALARA DEMONSTRATION
a summary of the dose to the average member of the critical group when radionuclidelevels are at the DCGL with institutional controls in place, as well as the estimated dosesif they are no longer in place;a summary of the evaluation performed pursuant to Section 7 of this SRP demonstratingthat these doses are ALARA;if the estimated dose to the average member of the critical group could exceed 100mrem/yr (but would be less than 500 mrem/yr) when the radionuclide levels are at theDCGL, a demonstration that the criteria in 10 CFR 20.1403(e) have been met
See notes at end of checklist.
NMSS Decommissioning SRP - Appendix A - Rev 0 91100

A26
ALTERNATE CRITERIA
a summary of the dose in TEDE(s) to the average member of the critical group when theradionuclide levels are at the DCGL (considering all man-made sources other thanmedical);a summary of the evaluation performed pursuant to Section 7 of this SRP demonstratingthat these doses are ALARA;an analysis of all possible sources of exposure to radiation at the site and a discussionof why it is unlikely that the doses from all man-made sources, other than medical, willbe more than 1 mSv/yr (100 mrem/yr);a description of the legally enforceable institutional control(s) and an explanation of howthe institutional control is a legally enforceable mechanism;a description of any detriments associated with the maintenance of theinstitutional control(s);a description of the restrictions on present and future landowners;a description of the entities enforcing and their authority to enforce theinstitutional control(s);a discussion of the durability of the institutional control(s);a description of the activities that the party with the authority to enforce the institutionalcontrols will undertake to enforce the institutional control(s)a description of the manner in which the entity with the authority to enforce theinstitutional control(s) will be replaced if that entity is no longer willing or able to enforcethe institutional control(s)a description of the duration of the institutional control(s), the basis for the duration, theconditions that will end the institutional control(s) and the activities that will beundertaken to end the institutional control(s);a description of the corrective actions that will be undertaken in the event theinstitutional control(s) fail; and -a description of the records pertaining to the institutional controls, how and where theywill be maintained, and how the public will have access to the records.a description of how individuals and institutions that may be affected by thedecommissioning were identified and informed of the opportunity to provide advice tothe licensee or responsible party;a description of the manner in which the licensee obtained advice from affectedindividuals or institutions;a description of how the licensee provided for participation by a broad cross-section ofcommunity interests in obtaining the advice;a description of how the licensee provided for a comprehensive, collective discussion onthe issues by the participants represented;a copy of the publicly available summary 6f the results of discussions, includingindividual viewpoints of the participants on the issues and the extent of agreement anddisagreement among the participants;a description of how this summary has been made available to the public; and,
See notes at end checklist.
NMSS Decommissioning SRP - Appendix A - Rev 0 915/00

A27
-- a description of how the licensee evaluated advice from individuals and institutions thatcould be affected by the decommissioning and the manner in which the advice wasaddressed.
Notes: * = Refer to the June 2001 Decommissioning Plan for the Tulsa facility.** = Item referenced in various sections throughout the Decommissioning Plan.
(Kaiser will obtain necessary permits based on final design considerations.)
NMSS Decommissioning SRP - Appendix A - Rev 0 9/15/00

Table of Contents
Page
1.0 Executive Summary 1-1
(Rev. 5/03)

1.0 Executive Summary
This Decommissioning Plan Addendum (DPA) was prepared by Earth Sciences Consultants, Inc. (Earth
Sciences) on behalf of Kaiser Aluminum & Chemical Corporation (Kaiser) to present a description of the
planned remediation activities for the former Kaiser Aluminum Specialty Products facility located in
Tulsa, Oklahoma. This document has been prepared as an addendum to Earth Sciences' June 2001
(Revised May 2003) Decommissioning Plan for the Tulsa facility, which addressed the remediation of the
affected portions of the 14-acre "pond parcel" at the facility. The DPA focuses on an approximate 3.5-
acre land area of the facility known as the former "operational area." The former operational area of the
facility is defined as the triangular parcel of land north of 41st Street and south of the Union Pacific Rail-
road right-of-way in which plant processes and operations occurred. The former operational area cur-
rently houses several structures including the North Extrusion, Office, Maintenance, Warehouse, Crusher,
and Crusher Addition buildings. The Flux Building, located to the northeast of the triangular parcel, is
also included as part of the former operational area. The land areas of the former operational area consist
mainly of land beneath concrete pavement.
The Kaiser plant in Tulsa, Oklahoma was built by the Standard Magnesium Corporation (SMC) in the
early to mid-1950s to manufacture magnesium products. Kaiser purchased the facility in 1964. SMC
received a source materials license (C-4012) from the Atomic Energy Commission (AEC) in March 1958
to receive possession and title to magnesium-thorium alloy (a thorium metal) with up to 4 percent thorium
content for processing. Historical operations at the facility included the smelting of scrap magnesium
alloy for the production of anodes. Scrap magnesium-thorium alloy was smelted, along with other mag-
nesium materials, to recover the magnesium. Thorium alloy material comprised a small fraction of the
total magnesium refined on site. Licensed operations involving the recovery of magnesium-thorium alloy
began in 1958 and continued through 1970. Magnesium refining operations continued at the facility until
approximately 1985. Aluminum replaced magnesium in smelting and anode manufacture, and the plant
continued operating until the 1997-1998 time frame.
The scrap magnesium alloy refining process consisted of placing the material into large melting pots,
heating the material until molten, and then siphoning off the pure magnesium. Impurities from the mix-
ture, including thorium, separated from the magnesium. This residue material was removed, allowed to
cool, and crushed. The crushed material was returned to the heating pots for a second recovery process.
Once refined, the metallic dross residue material was crushed and disposed on site.
(Rev. 5/03)

1-2
The June 2001 (Revised May 2003) Decommissioning Plan identified the potential for radioactive mate-
rial beneath several currently paved areas and building floor surfaces of the former operational area, based
upon an interpretation of historical data and/or observations made during the Adjacent Land Remediation
Project (ALRP). As a result, a limited Additional Site Characterization Activities (ASCA) effort was
conducted in the former operational area during mid-2001. The objective of the ASCA was to determine
if thorium-bearing dross/radioactive material was present beneath these areas of concern. Soil quality
data obtained during the ASCA indicated the presence of residual radioactive material beneath several
concrete-paved surfaces and structures at relatively shallow depths. The presence of this material beneath
the structures and concrete paving is most likely the result of historical grading activities.
A Historical Site Assessment (HSA) was performed during late 2001 for the operational area of the for-
mer Kaiser Aluminum Specialty Products facility. The HSA was conducted as the first step toward
decommissioning the former operational area at the facility. The objective of the HSA was to compile as
much historical information as possible for the facility and, using the Multi-Agency Radiation Survey and
Site Investigation Manual (MARSSIM) guidelines, categorize the land areas and structures of the former
operational area of the facility as either impacted or nonimpacted. Presently, none of the original build-
ings in which magnesium-thorium alloy processing occurred exist on site. With the exception of the Flux
Building, there are no buildings in the former operational area of the facility classified as impacted in the
HSA. The Flux Building was initially classified as an impacted structure due to past and current uses of
the building to house and process soil core and surface samples. Land areas initially classified as
impacted included the land areas beneath the Maintenance Building, the Crusher Building, the Crusher
Addition Building, the North Extrusion Building, the Warehouse Building, and the former Smelter
Building, as well as concrete paved areas completed post-1958.
The results of the HSA (Appendix A of this DPA) were used to design radiological survey efforts for the
structures and land areas of the former operational area. The recommended radiological extended scoping
(nonimpacted structures) and characterization (impacted land areas) survey efforts were described in a
work plan prepared by Earth Sciences (December 2001). The primary objectives of the extended scoping
survey of the six structures was to verify their initial classification of "nonimpacted" during the HSA.
The primary objectives of the characterization survey of the "impacted" land areas were to determine the
nature and extent of residual radioactive materials within the former operational area and collect sufficient
data to support evaluation of remedial alternatives and technologies for the impacted land areas of the
(Rev. 5/03)

1-3
former operational area. The radiological survey efforts were completed during the months of January
and February 2002. Results of the radiological survey efforts are presented in Chapter 4.0 of the DPA.
Based on the results of the survey effort, select land areas of the former operational area were identified
for remediation. These areas include the following:
* A portion of the land area beneath the Warehouse Building (Characterization SurveyUnit 7);
* A portion of the land area beneath the Crusher Building (Characterization Survey Unit 9);
* The land area beneath a "built-up" dock area located immediately west of the CrusherBuilding (Characterization Survey Unit 5);
* The land area beneath a built-up dock area located immediately west of the MaintenanceBuilding (Characterization Survey Unit 3);
* A portion of the land area beneath a paved concrete surface situated northwest of theMaintenance Building, northeast of the North Extrusion Building, and south of the UnionPacific Railroad right-of-way (Characterization Survey Unit 2);
* A portion of the land area along a concrete retaining wall situated at the southeastern cornerof the Maintenance Building (Survey Unit 5);
* A portion of the land area beneath a paved concrete surface situated to the north of theWarehouse Building (Characterization Survey Units 5 and 6); and
* A portion of the land area beneath a paved concrete surface situated north of 41st Street andthe current Crusher Building, south of the Union Pacific Railroad right-of-way, and west ofthe areas remediated during the ALRP (Survey Unit 8).
The purpose of the June 2001 Decommissioning Plan (Revised May 2003) and this DPA is to decommis-
sion the facility safely and meet the Nuclear Regulatory Commission's (NRC) requirements for unre-
stricted use: residual radioactivity distinguishable from background will not result in a total effective
dose equivalent (TEDE) to an average member of a critical group that exceeds 25 millirems per year
(mrem/yr). Additionally, implementation of the June 2001 Decommissioning Plan (Revised May 2003)
and this DPA will reduce residual radioactivity to levels that are as low as reasonable achievable
(ALARA).
The decommissioning alternative chosen for implementation closely mirrors that presented in the June
2001 Decommissioning Plan (Revised May 2003). The planned remediation for the former operational
(Rev. 5/03)

14
area requires excavating material with a net thorium-232 (Th-232) activity concentration greater than the
established Derived Concentration Guideline Level (DCGLW) of 3.0 picocuries per gram (pCi/g), based
on a dose limit criterion of 25 mrem/yr. The excavated material will be transported to the pond parcel.
Material with Th-232 activity concentrations greater than 31.1 pCi/g will be segregated and disposed off
site as either exempt or nonexempt material at a permitted facility. Material with activity concentrations
less than 31.1 pCilg Th-232 will be placed in the pond parcel excavation as backfill.
Kaiser anticipates completing select predecommissioning activities prior to undertaking the remediation
project described in this DPA. The most significant predecommissioning activity relates to the likely
demolition of several nonimpacted site structures to facilitate excavation of affected material beneath
floor slabs.
During remediation, select land areas of the former operational area will be excavated to depths up to
8 feet and an average depth estimated at 2 feet. Once the former operational area is remediated to accept-
able levels, it will be cleared through a MARSSIM-directed final status survey. Most likely, this will be
conducted in stages where certain survey units will be cleared and backfilled as excavation occurs in other
areas.
Approximately 60,000 cubic feet (ft3) of clean off-site soil will be used to backfill the excavations in the
former operational area. The site will be graded and vegetated to minimize soil erosion and promote
positive drainage.
Upon approval of the June 2001 Decommissioning Plan (Revised May 2003) and this DPA by the NRC,
Kaiser will undertake preparation of designs and specifications. Subsequently, a construction contractor
will be selected. Kaiser may choose to develop performance specifications and require the contractor to
develop design details. Alternatively, Kaiser may opt to develop detailed designs/specifications. In either
case, preconstruction activities for both the June 2001 Decommissioning Plan (Revised May 2003) and
this DPA are expected to take approximately 9 months.
Construction activities will probably not be conducted during the months of December through February.
Therefore, remediation is anticipated to begin in March following completion of the design/contractor
selection tasks and extend over a period of approximately 3 years. A detailed schedule will be prepared
subsequent to NRC approval of the June 2001 Decommissioning Plan (Revised May 2003) and this DPA.
This schedule will be updated as circumstances dictate.
(Rev. 5/03)

1-5
Kaiser is seeking approval of this DPA to authorize the activities described herein and NRC concurrence
that, if this plan is implemented as described, will result in the property being suitable for unrestricted use.
However, this remediation plan is premised on current knowledge of site conditions, regulatory guidance,
and disposal market factors. If unforeseen circumstances result in significant changes in the economics or
feasibility of implementation of the proposed remedial action, Kaiser may find it necessary to consider
other alternatives.
5427M\dpa\chapter1
(Rev. 5/03)

Table of Contents
Page
2.0 Facility Operating History2.1 Licensing Number/Status/Authorized Activities2.2 License History2.3 Site Development and Utilization2.4 Previous Predecommissioning and Decommissioning Activities2.5 Spills2.6 Prior On-Site Burials
References
2-12-12-12-32-32-42-4
2-6
(Rev. 5103)

2.0 Facility Operating History
This DPA was prepared and submitted to specifically address the approximate 3.5-acre land area of the
Tulsa facility known as the Former Operation Area. The former "operational area" of the facility is
defined as the triangular parcel of land north of 41st Street and south of the Union Pacific Railroad right-
of-way in which plant processes and operations occurred (Figure 3A-3). The former operational area cur-
rently houses several structures including the North Extrusion, Office, Maintenance, Warehouse, Crusher,
and Crusher Addition buildings. The Flux Building, located to the northeast of the triangular parcel, is
also included as part of the former operational area. The "land areas" of the former operational area con-
sist mainly of land beneath concrete pavement.
An HSA was performed during late 2001 for the former operational area of the Kaiser Aluminum Spe-
cialty Products facility. The HSA was conducted as the first step toward decommissioning the former
operational area at the facility. The objective of the HSA was to compile as much historical information
as possible for the facility and, using the MARSSIM guidelines, categorize the land areas and structures
of the former operational area of the facility as either impacted or nonimpacted. A copy of the HSA is
provided in Appendix A of this DPA. Appropriate sections of the HSA and/or June 2001 Decommis-
sioning Plan (Revised May 2003) for the Tulsa facility are either referenced or summarized below.
2.1 Licensing Number/Status/Authorized Activities
Refer to Section 2.1 of the June 2001 Decommissioning Plan (Revised May 2003) for the Tulsa facility.
2.2 License History
Historical operations at the facility included the smelting of scrap magnesium alloy for the production of
anodes. Scrap magnesium-thorium alloy was smelted, along with other magnesium materials, to recover
the magnesium. Thorium alloy material comprised a small fraction of the total magnesium refined on
site. licensed operations involving the recovery of magnesium-thorium alloy began in 1958 and contin-
ued through 1970. Magnesium refining operations continued at the facility until approximately 1985.
Aluminum replaced magnesium in smelting and anode manufacture, and the plant continued operating
until the 1997-1998 timeframe.
The scrap magnesium alloy refining process consisted of placing the material into large melting pots,
heating the material until molten, and then siphoning off the pure magnesium. Impurities from the mix-
ture, including thorium, separated from the magnesium. This residue material was removed, allowed to
(Rev. 5/03)

2-2
cool, and crushed. The crushed material was returned to the heating pots for a second recovery process.
Once refined, the metallic dross residue material was crushed and disposed on site.
The quantity of material SMC and later Kaiser were authorized to possess at one time was amended from
time to time, but generally was limited to 30,000 pounds of magnesium-thorium alloy containing no more
than 4 percent thorium. There appears to be no records indicating the actual quantity of material that was
on site at any give time. A thorium percentage by weight of approximately 4 would equal approximately
4,400 pCi/g. One biased sample of a unique dross material (wrapped in plastic) taken in the area of the
original Smelter Building during radiological characterization survey activities in February 2002 con-
tained a Th-232 concentration of 6,429 pCilg. This elevated concentration is most likely the result of the
magnesium recovery process, which removed magnesium mass from the scrap feed material. The
removal of magnesium during the process would have decreased the mass of the material, thereby
increasing the concentration of Th-232 in the dross residue. Consequently, Th-232 concentrations in
dross could have been increased above the 4 percent by weight limit for the scrap feed material. How-
ever, thorium alloy material only comprised a small fraction of the total magnesium refined, and records
indicate that thorium-bearing materials were generally only a small fraction (5 percent) of each produc-
tion batch; consequently, it is not surprising that most samples were found to have concentrations well
below 4 percent by weight. As indicated in Table A-2, 95 percent of the material on site has a concentra-
tion of Th-232 between 3.1 and 120 pCi/g.
Structures known to have been used to process thorium-bearing materials included the Smelter Building,
the Crusher Building, and the Slag Storage Building. The smelting of magnesium alloy for purification
occurred in the Smelter Building resulting in a thoriated metallic "dross" residue material. The Smelter
Building was demolished in October 2000, following completion of survey activities which indicated no
detectable contamination within the building. Operations conducted within the Crusher Building included
the crushing of the dross/slag residue material from the smelting operations in a second magnesium
recovery step and/or prior to disposal. Waste dross was conveyed to disposal ponds (Retention and
Reserve ponds) north of the manufacturing complex. The Crusher Building was razed and rebuilt in the
early 1970s to accommodate aluminum smelting operations at the facility. The current structure identi-
fied as the Crusher Building was not used to process thoriated material. The Slag Storage Building, con-
structed circa 1964, was used for the storage of dross/slag residue materials prior to the second magne-
sium recovery step. The building was removed in 1977. From about 1977 until plant shutdown, the
Crusher Building was utilized for smelting aluminum. Instrument surveys indicate the absence of radio-
active contamination.
(Rev. 5/03)

2-3
Available information does not indicate the use of subsurface piping systems or the sanitary sewer for the
conveyance of radioactive material. The pumping station structure identified near the Retention Pond
was used to convey noncontact cooling water used in plant operations. Sections 3.1 and 4.2 of this DPA
present information on the limited amount of sanitary sewer lines, subsurface piping, and culverts which
exists within the former operational area of the Tulsa facility. Figure 3A-4 shows a layout of the subsur-
face piping and the sanitary sewer for the Tulsa facility. As shown in that figure, several sections of
storm drain/subsurface water piping and plant process piping (associated with the pumping station) were
encountered and removed during the ALRP.
Additional information regarding the license history of the facility is provided in Section 2.2 of the June
2001 Decommissioning Plan (Revised May 2003).
2.3 Site Development and Utilization
Refer to Section 2.3 of the June 2001 Decommissioning Plan (Revised May 2003) for the Tulsa facility.
2.4 Previous Predecommissioning and Decommissioning Activities
As mentioned in Section 2.2, the Smelter Building was demolished in October 2000. During the period
of August 28 through August 31, 2000, a radiological survey of the building was performed in prepara-
tion of deconstruction activities. The building was constructed mostly of concrete floors and concrete
block walls. The roof of the structure was constructed of tin sheeting. Exposure rate surveys of the
building did not indicate PR/hr levels greater than 4 [tR/hr above background. Strucfural surveys of the
building did not indicate the presence of residual radiological contamination greater than the limits speci-
fied in the following table:
Derived c/min per 100 cm2
Average 298Maximum 903Removable 65
The derived limits that are in the above table were calculated by multiplying the accepted release limits
for the Kaiser facility by 1.29 to account for the beta particles emitted by the more abundant Th-230 beta
emitting progeny. An instrument efficiency of 16 percent was taken into account when determining the
1.29 multiple. Building materials from deconstruction activities were placed within the buildings'
(Rev. 5/03)

2-4
footprint and covered with soil. No radiological survey data were available for the other structures known
to have been used to process thorium-bearing materials.
As discussed in the June 2001 Decommissioning Plan (Revised May 2003), Kaiser completed the adja-
cent land remediation project during late 2000 through mid-2001. Kaiser prepared and submitted to the
NRC an ALRP which was approved on April 4, 2000. Kaiser conducted adjacent land remediation
activities and subsequent final status surveys from October 2, 2000 through May 30, 2001. Contamina-
tion of the adjacent properties was found to occur at the ground level to depths of up to 15 feet with con-
tamination levels ranging from less than minimum detectable activity to approximately 365 pCi/g Th-232.
More than 91 percent of the samples obtained during characterization activities for the ALRP contained
less than 10 pCi/g Th-232 and 95 percent of the samples contained less than 20 pCi/g Th-232. Contami-
nated materials that were encountered during the remediation process consisted mostly of soil and soil-
like materials. In addition to the soil and soil-like materials, impacted piping, drainage channels, and cul-
verts were encountered during the ALRP project (Section 3, Figure 3A-4).
Remediation was performed in the adjacent land areas to achieve unrestricted release. Field surveys were
performed to guide remediation activities that, in this case, primarily involved excavating affected soil
(and piping, culverts, etc.) and moving it onto Kaiser's property. A final status survey was performed
following completion of remediation/excavation in each discrete affected survey grid to demonstrate that
radiological conditions satisfy criteria for unrestricted release. Following successful remediation, exca-
vations were backfilled.
A Final Status Survey Report (FSSR) was prepared and submitted to the NRC. Calculations indicated
that the total residual Th-232 activity above the average background in soil postremediation for the adja-
cent land area is approximately 3.27 x 10¹⁰ pCi. In a letter dated March 7, 2002, the NRC provided Kaiser
with a determination that the remediated adjacent properties met the criteria for unrestricted release.
Further details concerning the ALRP project are contained in the FSSR for the Tulsa facility.
2.5 Spills
Refer to Section 2.5 of the June 2001 Decommissioning Plan (Revised May 2003) for the Tulsa facility.
2.6 Prior On-Site Burials
The June 2001 Decommissioning Plan identified the potential for radioactive material beneath several
currently paved areas and building floor surfaces of the former operational area, based upon an
(Rev. 5/03)
2-5
interpretation of historical data and/or observations made during the ALRP. As a result, a limited ASCA
effort was conducted in the former operational area during mid-2001. The objective of the ASCA was to
determine if thorium-bearing dross/radioactive material was present beneath these areas of concerm. Soil
quality data obtained during the ASCA indicated the presence of residual radioactive material beneath
several concrete-paved surfaces and structures at relatively shallow depths. The presence of this material
beneath the structures and concrete paving is most likely the result of historical grading activities.
The results of the HSA conducted in late 2001 were used to design a characterization survey effort for the
impacted land areas of the former operational area. The recommended radiological characterization sur-
vey effort was described in a work plan prepared by Earth Sciences (December 2001). The primary
objectives of the characterization survey were to determine the nature and extent of residual radioactive
materials within the former operational area and collect sufficient data to support evaluation of remedial
alternatives and technologies for the impacted land areas of the former operational area. The characteri-
zation survey effort was completed during the months of January and February 2002. Results of the sur-
vey activities are presented in Chapter 4.0 of this DPA. Information regarding the on-site disposal of
metallic dross residue material at the facility's pond parcel is provided in Section 2.6 of the June 2001
Decommissioning Plan (Revised May 2003). Based on the HSA as documented in Appendix A, it
appears that early disposal of licensed materials in the Reserve Pond was performed under the guidance of
10 Code of Federal Regulations (CFR) Part 20.304. These materials will be excavated, segregated, and
processed during the planned decommissioning activities. Records do not indicate that licensed material
was handled under the provisions of either 10 CFR Part 20.302 or NUREG 1101.
(Rev. 5/03)

2-6
References
1. Earth Sciences, February 2002, Final Status Survey Report, Adjacent Land Area, Tulsa, OklahomaFacility, Kaiser Aluminum & Chemical Corporation, Baton Rouge, Louisiana.
2. Earth Sciences, December 2001, Historical Site Assessment, Operational Area, Former Kaiser Alumi-num Specialty Products Facility, Tulsa, Oklahoma, Kaiser Aluminum & Chemical Corporation,Baton Rouge, Louisiana.
3. Earth Sciences, December 2001, Work Plan, Characterization Survey of the Operational Area, For-mer Kaiser Aluminum Specialty Products Facility, Tulsa, Oklahoma, Kaiser Aluminum & ChemicalCorporation, Baton Rouge, Louisiana.
4. Earth Sciences, October 2001, Additional Site Characterization Activities, Former Kaiser AluminumSpecialty Products Facility, Tulsa, Oklahoma, Kaiser Aluminum & Chemical Corporation, BatonRouge, Louisiana.
5. Earth Sciences, June 2001, Revised May 2003, Decommissioning Plan, Tulsa Facility, Tulsa, Okla-homa, Kaiser Aluminum & Chemical Corporation, Baton Rouge, Louisiana.
6. NUREG/CR-1575, August 2000, MARSSIM, Rev. 1.
5427M\dpa\chapter2
(Rev. 5/03)

Table of Contents
Page
3.0 Facility Description 3-13.1 Site Location and Description 3-13.2 Population Distribution 3-23.3 Current/Future Land Use 3-23.4 Meteorology and Climatology 3-2
3.4.1 Wind 3-23.4.2 Temperature 3-33.4.3 Precipitation 3-33.4.4 Relative Humidity 3-33.4.5 Evapotranspiration 3-3
3.5 National Ambient Air Quality Standards Category 3-33.6 Geology and Seismology 3-3
3.6.1 Geology 3-33.6.2 Regional Geologic Structures and Tectonics 3-33.6.3 Seismology 3-3
3.7 Surface Water Hydrology 3.33.7.1 Flood Plan Data 3.3
3.8 Groundwater Hydrology 3-43.8.1 Groundwater Flow Data 3-4
3.8.1.1 Shallow Overburden/Dross Material 3-43.8.1.2 Deep Overburden 3-4
3.9 Natural Resources 3-43.10 Ecology/Endangered Species 3-4
3.10.1 Relative Abundance 3-4
References 3-5
Figures
Figure 3A-1 - Site Location Map (Dwg 5427039)Figure 3A-2 - Site Map (Dwg 5427A434)Figure 3A-3 - Former Operational Area (Dwg 5427A442)Figure 3A-4 - Subsurface Piping and Sewer Line Location May (Dwg 5427A448)

3.0 Facility Desciption
A description of the former Kaiser Aluminum Specialty Products facility was provided in the June 2001
Decommissioning Plan (Revised May 2003). Appropriate sections of the June 2001 Decommissioning
Plan (Revised May 2003) are referenced or summarized below. Supplemental information relative to the
former operational area of the facility is provided in the following sections, where appropriate.
3.1 Site Location and Description
The former Kaiser Aluminum Specialty Products facility is located at 7311 East 41st Street in Tulsa,
Oklahoma (Figure 3A-1). It is situated in Tulsa County, Oklahoma, about 5 miles southeast of the
downtown center of the City of Tulsa. The site initially occupied approximately 23 acres of land on both
sides of 41st Street. Currently, a 3-acre parcel south of 41st Street contains an active aluminum extrusion
and fabrication facility. North of East 41st Street are several parcels of land previously devoted to refin-
ing, processing, and waste disposal functions (Figure 3A-2). This acreage is split by the Union Pacific
Railroad right-of-way. An approximate 3.5-acre parcel south of the railroad (known as the former opera-
tional area) houses an active office building and several inactive industrial structures (Figure 3A-3). An
approximate 14.0-acre land area (known as the pond parcel) located north of the railroad contains a
Retention Pond, former Freshwater Pond area, a former Reserve Pond area, and the Flux Building area.
Extensive site characterization activities have been conducted since 1994 within the 14.0-acre land area of
the facility known as the pond parcel. These characterization activities have indicated the presence of
residual radioactive material within a 10-acre portion of the pond parcel. The radioactive material identi-
fied within this portion of land is a thorium-bearing dross containing the isotopes Th-232, thorium-230
(Th-230), and thorium-228 (Th-228). The affected portion of the parcel contains the Retention Pond, the
former Reserve Pond area, and the Flux Building area. The unaffected portion of the pond parcel con-
tains a former Freshwater Pond area. A plan was prepared to address the decommissioning of the pond
parcel land area. The decommissioning plan was submitted in June 2001 to the NRC and subsequently
revised in May 2003.
This DPA focuses on the former operational area of the facility, which was not fully addressed in the June
2001 Decommissioning Plan (Revised May 2003). The former operational area of facility, with the
exception of the Flux Building, is bounded to the north by the Union Pacific Railroad, to the south by 41st
Street, to the east by a small parcel of Kaiser property, and to the west by the Smalley Equipment prop-
erty. The railroad right-of-way, 41st Street right-of-way, and small parcel of Kaiser property located to
3-2
the east of the former operational area were addressed during the ALRP. The former operational area cur-
rently houses several structures including the North Extrusion, Office, Maintenance, Warehouse, Crusher,
and Crusher Addition buildings. The Flux Building is located to the northeast of the triangular parcel.
The land areas of the former operational area consist mainly of land beneath concrete pavement.
As shown in Figure 3A-4, sanitary sewer lines, subsurface piping, and culverts exist within the former
operational area of the facility. On-site sanitary sewer lines associated with rest rooms and employee
shower facilities located within nonimpacted structures (Office, Maintenance, and Warehouse buildings)
discharge to the main sanitary line traversing easterly along East 41st Street. A surface water storm drain
and associated culvert are located near the northeastern corner of the North Extrusion Building. Subsur-
face piping associated with a storm drain and an air compressor cooling unit originates from the Ware-
house Building and surface discharges at a location immediately north of the former operational area.
Subsurface piping associated with drains originating from the Crusher Building surface discharge at loca-
tions immediately north of the building.
The pumping station structure identified near the Retention Pond was used to convey noncontact cooling
water used in plant operations. Figure 3A-4 of the DPA shows a layout of the subsurface piping and the
sanitary sewer for the Tulsa facility. As shown in that figure, several sections of storm drain/subsurface
water piping and plant process piping (associated with the pumping station) were encountered and
removed during the ALRP. Storm water drainage systems and subsurface piping located within the pond
parcel are addressed in Chapter 3.0 of the June 2001 Decommissioning Plan (Revised May 2003). These
features are also shown in Figure 3A-4.
3.2 Population Distribution
Refer to Section 3.2 of the June 2001 Decommissioning Plan (Revised May 2003) for the Tulsa facility.
3.3 Current/Future Land Use
Refer to Section 3.3 of the June 2001 Decommissioning Plan (Revised May 2003) for the Tulsa facility.
3.4 Meteorology and Climatology
Refer to Section 3.4 of the June 2001 Decommissioning Plan (Revised May 2003) for the Tulsa facility.
3.4.1 Wind
Refer to Section 3.4.1 of the June 2001 Decommissioning Plan (Revised May 2003) for the Tulsa facility.

3-3
3.4.2 Temperature
Refer to Section 3.4.2 of the June 2001 Decommissioning Plan (Revised May 2003) for the Tulsa.facility.
3.4.3 Precipitation
Refer to Section 3.4.3 of the June 2001 Decommissioning Plan (Revised May 2003) for the Tulsa facility.
3.4.4 Relative Humidity
Refer to Section 3.4.4 of the June 2001 Decommissioning Plan (Revised May 2003) for the Tulsa facility.
3.4.5 Evapotranspiration
Refer to Section 3.4.5 of the June 2001 Decommissioning Plan (Revised May 2003) for the Tulsa facility.
3.5 National Ambient Air Quality Standards Category
Refer to Section 3.5 of the June 2001 Decommissioning Plan (Revised May 2003) for the Tulsa facility.
3.6 Geology and Seismology
3.6.1 Geology
Refer to Section 3.6.1 of the June 2001 Decommissioning Plan (Revised May 2003) for the Tulsa facility.
3.6.2 Regional Geologic Structures and Tectonics
Refer to Section 3.6.2 of the June 2001 Decommissioning Plan (Revised May 2003) for the Tulsa facility.
3.6.3 Seismology
Refer to Section 3.6.3 of the June 2001 Decommissioning Plan (Revised May 2003) for the Tulsa facility.
3.7 Surface Water Hydrology
Refer to Section 3.7 of the June 2001 Decommissioning Plan (Revised May 2003) for the Tulsa facility.
3.7.1 Flood Plan Data
Refer to Section 3.7.1 of the June 2001 Decommissioning Plan (Revised May 2003) for the Tulsa facility.

3-4
3.8 Groundwater Hydrolog
Refer to Section 3.8 of the June 2001 Decommissioning Plan (Revised May 2003) for the Tulsa facility.
3.8.1 Groundwater Flow Data
Refer to Section 3.8.1 of the June 2001 Decommissioning Plan (Revised May 2003) for the Tulsa facility.
3.8.1.1 Shallow Overburden/Dross Material
Refer to Section 3.8.1.1 of the June 2001 Decommissioning Plan (Revised May 2003) for the Tulsa
facility.
3.8.1.2 Deep Overburden
Refer to Section 3.8.1.2 of the June 2001 Decommissioning Plan (Revised May 2003) for the Tulsa
facility.
3.9 Natural Resources
Refer to Section 3.9 of the June 2001 Decommissioning Plan (Revised May 2003) for the Tulsa facility.
3.10 Ecology/Endangered Species
Refer to Section 3.10 of the June 2001 Decommissioning Plan (Revised May 2003) for the Tulsa facility.
3.10.1 Relative Abundance
Refer to Section 3.10.1 of the June 2001 Decommissioning Plan (Revised May 2003) for the Tulsa
facility.

3-5
References
1. Earth Sciences, December 2001, Historical Site Assessment, Operational Area, Former Kaiser Alumi-num Specialty Products Facility, Tulsa, Oklahoma, Kaiser Aluminum & Chemical Corporation,Baton Rouge, Louisiana.
2. Earth Sciences, June 2001, Revised May 2003, Decommissioning Plan, Tulsa Facility, Tulsa, Okla-homa, Kaiser Aluminum & Chemical Corporation, Baton Rouge, Louisiana.
5427M\dpa\chapter3

Figures

It "-
SITE LOCATION:7311 EAST 41st STREETTULSA, OKLAHOMA
N
FIGURE 3A-1SITE LOCATION MAP
FORMER KAISER ALUMINUMSPECIALTY PRODUCTS FACILITY
TULSA, OKLAHOMAPREPARED FOR
KAISER ALUMINUM & CHEMICAL CORPORATIONBATON ROUGE, LOUISIANA
ADDMIR d Fr7 a I IS I I
.a
SCALE - FEET
0 2000
REFERENCEUSGS 7.5-MIN TOPOGRAPHIC QUADRANGLEJENKS. OKLAHOMADATED 1952. PHOTOREVISED 1982
I

THIS PAGE IS ANOVERSIZED DRAWING
OR FIGURETHAT CAN BE- VIEWED AT
THE RECORD TITLED:
DWG. NO. 5427A434"FIGURE 3A-2 SITE MAP FORMERKAISER ALUMINUM SPECIALTY
PRODUCTS FACILITY TULSA,OKLAHOMA "
WITHIN THIS PACKAGE...OR,BY SEARCHING USING THE
DRAWING NUMBER:5427A434
NOTE: Because of this page's large file size, it may be more convenient tocopy the file to a local drive and use the Imaging (Wang) viewer, which can beaccessed from the Programs/Accessories menu.
D-1

THIS PAGE IS ANOVERSIZED DRAWING
OR FIGURE,THAT CAN BE VIEWED AT
THE RECORD TITLED:DWG. NO. - 5427A442
FIGURE 3A-3"FORMER OPERATIONAL AREA
FORMER KAISER ALUMINUMSPECIALTY PRODUCTS FACILITY
TULSA, OKLAHOMA"WITHIN THIS PACKAGE...OR,BY SEARCHING USING THE
DRAWING NUMBER:5427A442
NOTE: Because of this page's large file size, it may be more convenient tocopy the file to a local drive and use the Imaging (Wang) viewer, which can beaccessed from the Programs/Accessories menu.
D-2

THIS PAGE IS ANOVERSIZED DRAWING
OR FIGURE,THAT CAN BE VIEWED AT
THE RECORD TITLED:DWG. NO. 5427A448
FIGURE 3A-4"SUBSURFACE PIPING AND SEWER
LINE LOCATION MAP FORMERKAISER ALUMINUM SPECIALTY
PRODUCTS FACILITY TULSA,OKLAHOMA"
WITHIN THIS PACKAGE...OR,BY SEARCHING USING THE
DRAWING NUMBER:5427A448
NOTE: Because of this page's large file size, it may be more convenient tocopy the file to a local drive and use the Imaging (Wang) viewer, which can beaccessed from the Programs/Accessories menu.
D-3
Table of Contents
Page
4.0 Radiological Status of Facility 4-14.1 Contaminated Structures 4-2
4.1.1 Radiological Contamination within Structures 4-34.1.1.1 North Extrusion Building 4-4
4.1.1.1.1 Survey Subunit 1 - North Extrusion Building, FirstFloor of Original Structure 4-4
4.1.1.1.2 Survey Subunit 2 - North Extrusion Building, LoftArea 4-5
4.1.1.1.3 Survey Subunit 3 - North Extrusion Building,Basement Level of Addition 4-6
4.1.1.1.4 Survey Subunit 4 - North Extrusion Building, FirstFloor of Addition 4-7
4.1.1.2 Maintenance Building 4-84.1.1.2.1 Survey Subunit 5 - Maintenance Building, Main
Structure 4-84.1.1.2.2 Survey Subunit 6 - Maintenance Building, Scale
House Addition 4-94.1.1.3 Office Building 4-10
4.1.1.3.1 Survey Subunit 7 - Office Building, First Floor 4-114.1.1.3.2 Survey Subunit 8 - Office Building, Second Floor 4-11
4.1.1.4 Warehouse Building 4-124.1.1.4.1 Survey Subunit 9 - Warehouse Building, Western
Section 4-134.1.1.4.2 Survey Subunit 10 - Warehouse Building, Central
Section 4-144.1.1.4.3 Survey Subunit 11 - Warehouse Building, Eastern
Section 4-154.1.1.5 Crusher Building (Survey Subunit 12) 4-154.1.1.6 Crusher Addition Building (Survey Subunit 13) 4-17
4.2 Contaminated Systems and Equipment 4-184.3 Surface and Subsurface Soil Contamination 4-18
4.3.1 Survey Unit 1 4-194.3.2 Survey Unit 2 4-204.3.3 Survey Unit 3 4-214.3.4 Survey Unit 4 4-224.3.5 Survey Unit 5 4-234.3.6 Survey Unit 6 4-254.3.7 Survey Unit 7 4-264.3.8 Survey Unit 8 4-274.3.9 Survey Unit 9 4-28
4.4 Surface Water 4-294.5 Groundwater 4-29
References 4-30
(Rev. 5/03)
Table of Contents(Continued)
Tables
Table 4-1 - Minimum Number of Sample Points per Survey Subunit, Extended ScopingSurvey of Structures
Table 4-2 - Statistical Analysis Summary, Gross Alpha Activity (dpm/100 cm2), ExtendedSurvey Scoping of Structures
Table 4-3 - Gamma Scan Survey Results, Characterization Survey of Land AreasTable 4-4 - Survey Unit 1 - Land Area Beneath the North Extrusion Building, Soil Core ScansTable 4-5 - Survey Unit 2 - Land Area North of the Maintenance Building and the North Extru-
sion Building, Soil Core ScansTable 4-6 - Survey Unit 3 - Land Area North of the Office Building and South, Southwest of the
Maintenance Building, Soil Core ScansTable 4-7 - Survey Unit 4 - Land Area Beneath the Maintenance Building, Soil Core ScansTable 4-8 - Survey Unit 5 - Land Area North of the Warehouse Building, Soil Core ScansTable 4-9 - Survey Unit 6 - Land Area Around the Footprint of the Former Smelter Building, Soil
Core ScansTable 4-10 - Survey Unit 7 - Land Area Beneath the Warehouse Building, Soil Core ScansTable 4-11 - Survey Unit 8 - Land Area North and East of the Crusher Building, Soil Core ScansTable 4-12 - Survey Unit 9 - Land Area Beneath the Crusher and Crusher Addition Buildings,
Soil Core ScansTable 4-13 - Th-232 Analytical Results for Soil Core Samples, Characterization Survey of Land
AreasTable 4-14 - Thorium Concentrations of QA/QC Soil Samples, Characterization Survey of Land
Areas
Figures
Figure 4A-1 - Structural Surfaces Discrete Sample Points, North Extrusion Building Layout(Dwg 5427277)
Figure 4A-2 - Structural Surfaces Discrete Sample Points, Maintenance Building (Dwg 5427279)Figure 4A-3 - Structural Surfaces Discrete Sample Points, Office Building - First Floor
(Dwg 5427278)Figure 4A-4 - Structural Surfaces Discrete Sample Points, Office Building - Second Floor
(Dwg 5427283)Figure 4A-5 - Structural Surfaces Discrete Sample Points, Warehouse Building (Dwg 5427280)Figure 4A-6 - Structural Surfaces Discrete Sample Points, Crusher Building (Dwg 5427281)Figure 4A-7 - Structural Surfaces Discrete Sample Points, Crusher Addition Building
(Dwg 5427282)Figure 4A-8 - Survey Unit Delineation, Impacted Land Areas (Dwg 5427A443)Figure 4A-9 - Th-232 Analytical Results Soil Core Samples, Survey Unit 1 (Dwg 5427A263)Figure 4A-10 - Th-232 Analytical Results Soil Core Samples, Survey Unit 2 (Dwg 5427A283)Figure 4A-11 - Th-232 Analytical Results Soil Core Samples, Survey Unit 3 (Dwg 5427257)Figure 4A-12 - Th-232 Analytical Results Soil Core Samples, Survey Unit 4 (Dwg 5427A266)Figure 4A-13 - Th-232 Analytical Results Soil Core Samples, Survey Unit 5 (Dwg 5427A267)Figure 4A-14 - Th-232 Analytical Results Soil Core Samples, Survey Unit 6 (Dwg 5427A268)Figure 4A-15 - Th-232 Analytical Results Soil Core Samples, Survey Unit 7 (Dwg 5427A269)
(Rev. 5/03)

iii
Table of Contents(Continued)
Figure 4A-16 - Th-232 Analytical Results Soil Core Samples, Survey Unit 8 (Dwg 5427A284)Figure 4A-17 - Th-232 Analytical Results Soil Core Samples, Survey Unit 9 (Dwg 5427A270)
(Rev. 5/03)

4.0 Radiological Status of Facility
A description of the radiological status for the Tulsa facility relative to the pond parcel is presented in
Chapter 4.0 of the June 2001 (Revised May 2003) Decommissioning Plan. This DPA chapter focuses on
the radiological status of the approximate 3.5-acre land area of the facility known as the former opera-
tional area. The former operational area of the facility is defined as the triangular parcel of land north of
41st Street and south of the Union Pacific Railroad right-of-way in which plant processes and operations
occurred.
The former operational area of the facility currently houses six structures including the North Extrusion,
Office, Maintenance, Warehouse, Crusher, and Crusher Addition buildings. The Flux Building, located
to the northeast of the triangular parcel, is also included as part of the former operational area. The land
areas of the former operational area consist mainly of land beneath concrete pavement.
The June 2001 Decommissioning Plan identified the potential for radioactive material beneath several
currently paved areas and building floor surfaces of the former operational area, based upon an interpre-
tation of historical data and/or observations made during the ALRP. As a result, a limited ASCA effort
was conducted in the former operational area during mid-2001. The objective of the ASCA was to
determine if thorium-bearing dross/radioactive material was present beneath these areas of concern. The
characterization approach that was utilized for the ASCA combined a review of aerial photographs stereo
pairs for changes in site topography and building structures, the advancement and analytical testing of soil
cores, and the excavation and evaluation of test trenches. Soil quality data obtained during the ASCA
indicated the presence of residual radioactive material beneath several concrete-paved surfaces and
structures at relatively shallow depths. The presence of this material beneath the concrete paving and
structures is most likely the result of historical grading and construction infilling activities. The presence
of this material beneath the concrete paving and structures within the former "operational area" is most
likely the result of historical grading and construction in-filling activities. Consequently, the soil con-
tamination distribution within the former "operational area" may be unlike the distribution elsewhere on
the site, and future survey design will need to be adjusted appropriately. Detailed information collected
as a result of the ASCA is presented in Earth Sciences' October 2001 Technical Report (see Reference 5).
Analytical results for the ASCA conducted in the former operational areas are included in Section 4.3 of
this DPA.
(Rev. 5/03)

4-2
As previously discussed, an HSA was performed during late 2001 for the former operational area of the
former Kaiser Aluminum Specialty Products facility. The HSA was conducted as the first step toward
decommissioning the former operational area at the facility. The objective of the HSA was to compile as
much historical information as possible for the facility and, using MARSSIM guidelines, categorize the
land areas and structures of the former operational area of the facility as either impacted or nonimpacted.
The results of the HSA were used to design radiological survey efforts for the structures and land areas of
the former operational area. The recommended radiological extended scoping (nonimpacted structures)
and characterization (impacted land areas) survey efforts were described in a work plan prepared by Earth
Sciences (December 2001). The primary objective of the extended scoping survey of the six structures
located in the former operational area was to verify their initial classification of "nonimpacted" during the
HSA. No final status survey activities are planned for these six structures. An overview of the available
record/documentation of past building demolition is presented in the HSA. No other records exist. The
primary objectives of the characterization survey of the "impacted" land areas were to determine the
nature and extent of residual radioactive materials within the former operational area and collect sufficient
data to support evaluation of remedial alternatives and technologies for the impacted land areas of the
former operational area. The radiological survey efforts were completed during the months of January
and February 2002. Results of the radiological survey efforts are presented below. Supporting docu-
mentation is provided in Appendices A and B.
4.1 Contaminated Structures
Presently, none of the original buildings in which magnesium-thorium alloy processing occurred exist on
site. Structures known to have been used to process thorium-bearing materials included the Smelter
Building, the Crusher Building, and the Slag Storage Building. The smelting of magnesium alloy for
purification occurred in the Smelter Building. The Smelter Building was demolished in October 2000,
following completion of survey activities that indicated no detectable contamination within the building
(refer to Section 2.4 of this DPA). Operations conducted within the Crusher Building included the
crushing of the dross/slag residue material from the smelting operations. The Crusher Building was razed
and rebuilt in the early 1970s to accommodate aluminum smelting operations at the facility. The current
structure identified as the Crusher Building was not used to process thoriated material. The Slag Storage
Building, constructed circa 1964, was used for the storage of dross/slag residue materials prior to the sec-
ond magnesium recovery step. The building was removed in 1977.
(Rev. 5/03)

4-3
With the exception of the Flux Building, there were no buildings in the former operational area of the
facility classified as impacted in the HSA. The Flux Building was initially classified as an impacted
structure due to past and current uses of the building to house and process soil core and surface samples.
4.1.1 Radiological Contamination within Structures
Upon completion of decommissioning activities at the site, the Flux Building will be addressed as a
Class 1 survey unit. The remaining six site structures were surveyed as one Class 3 survey unit for the
purpose of verifying their initial classification of nonimpacted during the HSA. The Class 3 survey unit
was subdivided into 13 subunits consisting of floor surfaces of the structures. The minimum number of
sample points (N) and the scan Minimum Detectable Concentration (MDC) required were calculated
using the guidance provided in MARSSIM. The minimum number of sample points per survey unit,
based on alpha and beta errors of 0.05 (95 percent confidence level) was 18.
From the radionuclide-specific values and the activity ratios of the radionuclides established for the site, a
Gross Activity DCGL (GA-DCGL) was calculated using the formula Number 4-4 provided in MARS-
SIM. The calculated GA-DCGL value is 21.5 disintegrations per minute (dpm)/100 square centimeters
(cm2) for average total surface contamination and 2.15 dpm/100 cm2 for removable contamination. Refer
to the calculation brief contained in Appendix D of this DPA for a derivation of these GA-DCGL values.
Since the calculated scan MDC (425 dpm/100 cm2) exceeded the GA-DCGL value (21.5 dpm/100 cm2),
the minimum number of samples (N) was increased to 200, in accordance with MARSSIM. The scan
MDC was based on the detection of alpha particles emitted from the established site radionuclide mix.
The total floor surface area for the Class 3 survey unit is 6,805 m2. Based on the fraction of this total area
represented by each subunit, the minimum number of sample points that were required per survey subunit
was determined (see Table 4-1). Accordingly, the triangular grid spacing pattern (L) for the calculated
number of sample points was determined based on MARSSIM guidance.
Extended scoping survey activities performed include scans and fixed-count time measurements of the
structural surfaces with the appropriate instrumentation, as well as the collection and analysis of remov-
able contamination (smear) samples for each survey subunit. Ambient background radiological condi-
tions were established for each survey subunit surveyed and each time (at least daily) that a survey was
performed (by instrument). A background count time of 60 minutes was used to ensure that the back-
ground count rate was statistically significant. Background values were also established for structural
(Rev. 5/03)

4-4
materials that were encountered during survey activities. These background values were established on
like materials that were known to be nonimpacted. Appendix B-1 contains the ambient background val-
ues established for each survey subunit during survey activities as well as background values established
for structural surface materials encountered during survey activities.
A description of each structure and survey subunit is provided below. An overview of the extended
scoping survey strategy and a summary of results are also provided in the following sections by survey
subunit.
4.1.1.1 North Extrusion Building
The North Extrusion Building was not at any time part of the magnesium refining process. The building
served as a storage facility for purified magnesium billets and an anode extrusion facility. A layout of the
North Extrusion Building is presented in Figure 4A-1. Building dimensions and construction material
types are also shown in this figure. The North Extrusion Building consists of the following levels:
* First Floor of Original Building - Approximately 605 M2 of floor area
* Loft Area - Approximately 160 m2 of floor area located above the first-floor level officearea of the original building
* Basement of Building Addition - Approximately 945 rn2 of floor area
* First Floor of Building Addition - Approximately 1,325 M2 of floor area
The total floor area for this building, inclusive of first floor and loft area of the original building, the
basement level of the addition, and the first floor level of the addition, is approximately 3,035 m2 .
4.1.1.1.1 Survey Subunit 1 - North Extrusion Building, First Floor of Original Structure
Survey Subunit 1 consists of floor surface for the first-floor level of the North Extrusion Building (Fig-
ure 4A-1). The surface area of this survey subunit is approximately 605 m2 .
(Rev. 5/03)

4-5
Specific extended scoping survey activities conducted for this subunit included the following:
* Layout of 18 triangular grid systematic sample points.
* Performance of gross alpha activity scan surveys of the floor surfaces within a 1-m 2 gridarea for each triangular grid sample point and adjacent (1 m in width) to the two garagedoors located on the south wall of the subunit.
* Performance of a gross alpha static-count measurement at each sample point.
* Collection of a smear sample (representing a surface area of 100 cm2) at each static-countmeasurement sample point location for removable alpha activity determination.
Results of these specific extended scoping survey activities are as follows:
* Gross alpha activity scan surveys did not indicate the presence of elevated direct radiationabove the calculated MDC of 425 dpm/100 cm2.
* None of the gross alpha static-count measurements for total surface activity were identifiedat activity levels above the GA-DCGL value of 21.5 dpm/100 cm2. The maximum static-count measurement was 21.4 dpm/100 cm2 and the median measurement value of the dataset was 11.7 dpm/lOO cm2.
* None of the gross alpha smear sample determinations for removable surface activity wereidentified at activity levels above the GA-DCGL value of 2.15 dpmlO0 cm2. The maxi-mum removable activity level was 0.61 dpm/100 cm2 and the median value of the data setwas 0.07 dpm/100 cm2.
A statistical analysis summary of the total surface and removable surface gross alpha activity levels by
survey subunit is presented in Table 4-2. A tabular summary of the extended scoping survey data for this
subunit is provided in Appendix B-2, Table B-2-1, analytical data reports are provided in Appendix B-3,
and quality assurance/quality control (QA/QC) materials are provided in Appendix B-4.
4.1.1.1.2 Survey Subunit 2 - North Extrusion Building. Loft Area
Survey Subunit 2 consists of the floor surface for the loft area of the North Extrusion Building (Fig-
ure 4A-1). The surface area of this survey subunit is approximately 160 m2 .
Specific extended scoping survey activities conducted for this subunit included the following:
* Layout of four triangular grid systematic sample points.
(Rev. 5/03)

4-6
* Performance of gross alpha activity scan surveys of the floor surfaces within a 1-m2 gridarea for each triangular grid sample point and the top of the loft stairway (1 m in width).
* Performance of a gross alpha static-count measurement at each sample point.
* Collection of a smear sample (representing a surface area of 100 cm2) at each static-countmeasurement sample point location for removable alpha activity determination.
Results of these specific extended scoping survey activities are as follows:
* Gross alpha activity scan surveys did not indicate the presence of elevated direct radiationabove the calculated MDC of 425 dpm/lOOcm 2.
* None of the gross alpha static-count measurements for total surface activity were identifiedat activity levels above the GA-DCGL value of 21.5 dpm/100 cm2. The maximum static-count measurement was 17.6 dpm/100 cm2 and the median measurement value of the dataset was 16.4 dpm/100 cm2.
* None of the gross alpha smear sample determinations for removable surface activity wereidentified at activity levels above the GA-DCGL value of 2.15 dpm/100 cm2. The maxi-mum removable activity level was 0.61 dpm/100 cm2 and the median value of the data set
2was 0.07 dpm/100 cm.
A statistical analysis summary of the total surface and removable surface gross alpha activity levels by
survey subunit is presented in Table 4-2. A tabular summary of the extended scoping survey data for this
subunit is provided in Appendix B-2, Table B-2-2, analytical data reports are provided in Appendix B-3,
and QA/QC materials are provided in Appendix B-4.
4.1.1.1.3 Survey Subunit 3 - North Extrusion Building, Basement Level of Addition
Survey Subunit 3 consists of the floor surface of the North Extrusion Building basement level addition
(Figure 4A-1). The surface area of this survey subunit is approximately 945 m2 .
Specific extended scoping survey activities conducted for this subunit included the following:
* Layout of 28 triangular grid systematic sample points.
* Performance of gross alpha activity scan surveys of the floor surfaces within a 1-in2 gridarea for each triangular grid sample point and adjacent (1 m in width) to the garage doorlocated on the east wall of the subunit.
* Performance of a gross alpha static-count measurement at each sample point.
(Rev. 5/03)

4-7
* Collection of a smear sample (representing a surface area of 100 cm2) at each static-countmeasurement sample point location for removable alpha activity determination.
Results of these specific extended scoping survey activities are as follows:
* Gross alpha activity scan surveys did not indicate the presence of elevated direct radiationabove the calculated MDC of 425 dpm/100 cm2.
* None of the gross alpha static-count measurements for total surface activity were identifiedat activity levels above the GA-DCGL value of 21.5 dpm/100 cm2. The maximum static-count measurement was 20.0 dpm/100 cm2 and the median value of the data set was17.5 dpm/100 cm2.
* None of the gross alpha smear sample determinations for removable surface activity wereidentified at activity levels above the GA-DCGL value of 2.15 dpm/100 cm2. The maxi-mum removable activity level was 1.70 dpm/100 cm2 and the median value of the data setwas 0.34 dpm/100 cm.
A statistical analysis summary of the total surface and removable surface gross alpha activity levels by
survey subunit is presented in Table 4-2. A tabular summary of the extended scoping survey data for this
subunit is provided in Appendix B-2, Table B-2-3, analytical data reports are provided in Appendix B-3,
and QA/QC materials are provided in Appendix B-4.
4.1.1.1.4 Survey Subunit 4 - North Extrusion Building, First Floor of Addition
Survey Subunit 4 consists of the floor surface of the North Extrusion Building first floor addition (Figure
4A-1). The surface area of this survey subunit is approximately 1,325 i 2 .
Specific extended scoping survey activities conducted for this subunit included the following:
* Layout of 39 triangular grid systematic sample points.
* Performance of gross alpha activity scan surveys of the floor surfaces within a 1-m2 gridarea for each triangular grid sample point and adjacent (1 m in width) to the garage doorslocated on the north, east, and south walls of the subunit.
* Performance of a gross alpha static-count measurement at each sample point.
* Collection of a smear sample (representing a surface area of 100 cm2) at each static-countmeasurement sample point location for removable alpha activity determination.
(Rev. 5/03)

4-8
Results of these specific extended scoping survey activities are as follows:
* Gross alpha activity scan surveys did not indicate the presence of elevated direct radiationabove the calculated MDC of 425 dpm/100 cm2.
* None of the gross alpha static-count measurements for total surface activity were identifiedat activity levels above the GA-DCGL value of 21.5 dpm/100 cm2. The maximum static-count measurement was 20.0 dpmIlOO cm2 and the median value of the data set was17.0 dpm/100 cm2.
* None of the gross alpha smear sample determinations for removable surface activity wereidentified at activity levels above the GA-DCGL value of 2.15 dpm/100 cm2. The maxi-mum removable activity level was 0.89 dpm/100cm2 and the median value of the data setwas 0.07 dpm/100 cm2.
A statistical analysis summary of the total surface and removable surface gross alpha activity levels by
survey subunit is presented in Table 4-2. A tabular summary of the extended scoping survey data for this
subunit is provided in Appendix B-2, Table B-2-4, analytical data reports are provided in Appendix B-3,
and QA/QC materials are provided in Appendix B-4.
4.1.1.2 Maintenance Building
Although currently referred to as the Maintenance Building, this structure's original function was for the
manufacturing of underground anodes. Maintenance activities for the plant were moved to this area
around 1985. Neither of these activities required the handling or storage of radioactive materials. A lay-
out of the Maintenance Building is presented in Figure 4A-2. Building dimensions and construction
material types are also shown in this figure. The Maintenance Building consists of the following single-
story areas:
* Main Building - Approximately 760 m2 of floor area* Building Addition - Approximately 35 m2 of floor area
The total floor area for the main building and the building addition is approximately 795 in2 .
4.1.1.2.1 Survey Subunit 5 - Maintenance Building. Main Structure
Survey Subunit 5 consists of the floor surface of the Maintenance Building (Figure 4A-2). The surface
area of this survey subunit is approximately 760 in.
(Rev. 5/03)

4-9
Specific extended scoping survey activities conducted for this subunit included the following:
* Layout of 23 triangular grid systematic sample points.
* Performance of gross alpha activity scan surveys of the floor surfaces within a -m2 gridarea for each triangular grid sample point and adjacent (1 m in width) to the garage doorslocated on the north, east, and west walls of the subunit.
* Performance of a gross alpha static-count measurement at each sample point.
* Collection of a smear sample (representing a surface area of 100 cm2) at each static-countmeasurement sample point location for removable alpha activity determination.
Results of these specific extended scoping survey activities are as follows:
* Gross alpha activity scan surveys did not indicate the presence of elevated direct radiationabove the calculated MDC of 425 dpm/100 cm2.
* None of the gross alpha static-count measurements for total surface activity were identifiedat activity levels above the GA-DCGL value of 21.5 dpm/100 cm2. The maximum static-count measurement was 21.3 dpm/100 cm2 and the median value of the data set was6.8 dpm/100 cm2.
* None of the gross alpha smear sample determinations for removable surface activity wereidentified at activity levels above the GA-DCGL value of 2.15 dpm/100 cm2. The maxi-mum removable activity level was 0.61 dpm/100 cm2 and the median value of the data setwas 0.07 dpm/100 cm2.
A statistical analysis summary of the total surface and removable surface gross alpha activity levels by
survey subunit is presented in Table 4-2. A tabular summary of the extended scoping survey data for this
subunit is provided in Appendix B-2, Table B-2-5, analytical data reports are provided in Appendix B-3,
and QA/QC materials are provided in Appendix B-4.
4.1.1.2.2 Survey Subunit 6 - Maintenance Building. Scale House Addition
Survey Subunit 6 consists of the floor surface for the Maintenance Building, Scale House Addition (Fig-
ure 4A-2). The surface area of this survey subunit is approximately 35 m2.
Specific extended scoping survey activities conducted for this subunit included the following:
(Rev. 5/03)

4-10
* Layout of three sample points.
* Performance of gross alpha activity scan surveys of the floor surfaces within a -M2 gridarea for each triangular grid sample point and adjacent (1 m in width) to the main doors forthis subunit.
* Performance of a gross alpha static-count measurement at each sample point.
* Collection of a smear sample (representing a surface area of 100 cm2) at each static-countmeasurement sample point location for removable alpha activity determination.
Results of these specific extended scoping survey activities are as follows:
* Gross alpha activity scan surveys did not indicate the presence of elevated direct radiationabove the calculated MDC of 425 dpm/100 cm2.
* None of the gross alpha static-count measurements for total surface activity were identifiedat activity levels above the GA-DCGL value of 21.5 dpm/100 cm2. The maximum static-count measurement was 12.0 dpm/100 cm2 and the median value of the data set was7.3 dpm/100 cm2.
* None of the gross alpha smear sample determinations for removable surface activity wereidentified at activity levels above the GA-DCGL value of 2.15 dpm/100 cm2. The maxi-mum removable activity level was 0.61 dpm/100 cm2 and the median value of the data setwas 0.34 dpm/100 cm2.
A statistical analysis summary of the total surface and removable surface gross alpha activity levels by
survey subunit is presented in Table 4-2. A tabular summary of the extended scoping survey data for this
subunit is provided in Appendix B-2, Table B-2-6, analytical data reports are provided in Appendix B-3,
and QA/QC materials are provided in Appendix B-4.
4.1.1.3 Office Building
The Office Building is an original facility structure separate from the operational buildings. Available
records indicate that this building has been utilized for administrative purposes exclusively. A layout of
the Office Building is presented in Figures 4A-3 and 4A-4. Building dimensions and construction mate-
rial types are also shown in these figures. The Office Building consists of the following levels:
* First Floor - Approximately 310 m2 of floor area* Second Floor-Approximately 310 m2 of floor area
The total floor area for this building is approximately 620 m2 .
(Rev. 5/03)

4-11
4.1.1.3.1 Survey Subunit 7 - Office Building, First Floor
Survey Subunit 7 consists of the floor surface for the first floor of the Office Building (Figure 4A-3). The
surface area of this survey subunit is approximately 310 i 2 .
Specific extended scoping survey activities conducted for this subunit included the following:
* Layout of nine triangular grid systematic sample points.
* Performance of gross alpha activity scan surveys of the floor surfaces within a -M2 gridarea for each triangular grid sample point.
* Performance of a gross alpha static-count measurement at each sample point.
* Collection of a smear sample (representing a surface area of 100 cm2) at each static-countmeasurement sample point location for removable alpha activity determination.
Results of these extended scoping survey activities are as follows:
* Gross alpha activity scan surveys did not indicate the presence of elevated direct radiationcalculated above the MDC of 425 dpm/100 cm2.
* None of the gross alpha static-count measurements for total surface activity were identifiedat activity levels above the GA-DCGL value of 21.5 dpm/100 cm2. The maximum static-count measurement was 10.2 dpm/100 cm2 and the median value of the data set was3.7 dpm/100 cm2.
* None of the gross alpha smear sample determinations for removable surface activity wereidentified at activity levels above the GA-DCGL value of 2.15 dpm/100 cm2. The maxi-mum removable activity level was 0.34 dpm/100 cm2 and the median value of the data setwas -0.20 dpmIl00 cm2.
A statistical analysis summary of the total surface and removable surface gross alpha activity levels by
survey subunit is presented in Table 4-2. A tabular summary of the extended scoping survey data for this
subunit is provided in Appendix B-2, Table B-2-7, analytical data reports are provided in Appendix B-3,
and QA/QC materials are provided in Appendix B-4.
4.1.1.3.2 Survey Subunit 8 - Office Building, Second Floor
Survey Subunit 8 consists of the floor surface for the second floor of the Office Building (Figure 4A-4).
The surface area of this survey subunit is approximately 310 m2 .
(Rev. 5/03)

4-12
Specific extended scoping survey activities conducted for this subunit included the following:
* Layout of nine triangular grid systematic sample points.
* Performance of gross alpha activity scan surveys of the floor surfaces within a 1-M 2 gridarea for each triangular grid sample point.
* Performance of a gross alpha static-count measurement at each sample point.
* Collection of a smear sample (representing a surface area of 100 cm2) at each static-countmeasurement sample point location for removable alpha activity determination.
Results of these specific extended scoping survey activities are as follows:
* Gross alpha activity scan surveys did not indicate the presence of elevated direct radiationabove the calculated DCGL of 425 dpm/100 cm2.
* None of the gross alpha static-count measurements for total surface activity were identifiedat activity levels above the GA-DCGL value of 21.5 dpm/100 cm2. The maximum static-count measurement was 9.4 dpm/100 cm2 and the median value of the data set was-0.9 dpm/100 cm2.
* None of the gross alpha smear sample determinations for removable surface activity wereidentified at activity levels above the GA-DCGL value of 2.15 dpm/100 cm2. The maxi-mum removable activity level was 0.34 dpm/100 cm2 and the median value of the data setwas 0.07 dpm/100 cm2.
A statistical analysis summary of the total surface and removable surface gross alpha activity levels by
survey subunit is presented in Table 4-2. A tabular summary of the extended scoping survey data for this
subunit is provided in Appendix B-2, Table B-2-8, analytical data reports are provided in Appendix B-3,
and QA/QC materials are provided in Appendix B-4.
4.1.1.4 Warehouse Building
The Warehouse Building has been renovated several times including a major renovation between 1958
and 1964. Available information indicates that this building has served as a storage facility for finished
products. A layout of the Warehouse Building is presented in Figure 4A-5. Building dimensions and
construction material types are also shown in this figure. The Warehouse Building consists of a single-
story structure divided into three main sections:
(Rev. 5/03)

4-13
* Western Section - Approximately 695 M2 of floor area* Central Section - Approximately 405 m2 of floor area* Eastern Section - Approximately 215 M2 of floor area
The total floor area of the three main building sections is approximately 1,315 m2.
4.1.1.4.1 Survey Subunit 9 - Warehouse Building, Western Section
Survey Subunit 9 consists of the floor surface for the Warehouse Building, Western Section (Fig-
ure .4A-5). The surface area of this survey subunit is approximately 695 M2 .
Specific extended scoping survey activities conducted for this subunit included the following:
* Layout of 20 triangular grid systematic sample points.
* Performance of gross alpha activity scan surveys of the floor surfaces within a 1-M2 gridarea for each triangular grid sample point and adjacent (1 m in width) to the garage doorslocated on the north and east walls of the subunit.
* Perforrnance of a gross alpha static-count measurement at each sample point.
* Collection of a smear sample (representing a surface area of 100 cm2) at each static-countmeasurement sample point location for removable alpha activity determination.
Results of these specific extended scoping survey activities are as follows:
* Gross alpha activity scan surveys did not indicate the presence of elevated direct radiationabove the calculated MDC of 425 dpm/100 cm2 .
* None of the gross alpha static-count measurements for total surface activity were identifiedat activity levels above the GA-DCGL value of 21.5 dpm/100 cm2. The maximum static-count measurement was 20.5 dpm/100 cm2 and the median value of the data set was8.6 dpm/100 cm2.
* None of the gross alpha smear sample determinations for removable surface activity wereidentified at activity levels above the GA-DCGL value of 2.15 dpm/100 cm2. The maxi-mum removable activity level was 0.89 dpm/100 cm2 and the median value of the data setwas 0.07 dpm/100 cm2.
A statistical analysis summary of the total surface and removable surface gross alpha activity levels by
survey subunit is presented in Table 4-2. A tabular summary of the extended scoping survey data for this
(Rev. 5103)

4-14
subunit is provided in Appendix B-2, Table B-2-9, analytical data reports are provided in Appendix B-3,
and QA/QC materials are provided in Appendix B-4.
4.1.1.4.2 Survey Subunit 10 - Warehouse Building, Central Section
Survey Subunit 10 consists of the floor surface for the Warehouse Building, Central Section (Fig-
ure 4A-5). The surface area of this survey subunit is approximately 405 i 2.
Specific extended scoping survey activities conducted for this subunit included the following:
* Layout of 12 triangular grid systematic sample points.
* Performance of gross alpha activity scan surveys of the floor surfaces within a -M 2 gridarea for each triangular grid sample point and adjacent (1 m in width) to the garage doorslocated on the north, east, and west walls of the subunit.
* Performance of a gross alpha static-count measurement at each sample point.
* Collection of a smear sample (representing a surface area of 100 cm2) at each static-countmeasurement sample point location for removable alpha activity determination.
Results of these specific extended scoping survey activities are as follows:
* Gross alpha activity scan surveys did not indicate the presence of elevated direct radiationabove the calculated MDC of 425 dpm/100 cm2.
* None of the gross alpha static-count measurements for total surface activity were identifiedat activity levels above the GA-DCGL value of 21.5 dpm/100 cm2. The maximum static-count measurement was 9.3 dpm/100 cm2 and the median value of the data set was4.0 dpm/100 cm2.
* None of the gross alpha smear sample determinations for removable surface activity wereidentified at activity levels above the GA-DCGL value of 2.15 dpm/100 cm 2. The maxi-mum removable activity level was 0.34 dpm/100 cm2 and the median value of the data setwas -0.20 dpm/100 cm2.
A statistical analysis summary of the total surface and removable surface gross alpha activity levels by
survey subunit is presented in Table 4-2. A tabular summary of the extended scoping survey data for this
subunit is provided in Appendix B-2, Table B-2-10, analytical data reports are provided in Appendix B-3,
and QA/QC materials are provided in Appendix B-4.
(Rev. 5/03)

4-15
4.1.1.4.3 Survey Subunit 11 - Warehouse Building. Eastern Section
Survey Subunit 11 consists of the floor surface for the Warehouse Building, Eastern Section (Fig-
ure 4A-5). The surface area of this survey subunit is approximately 215 M2 .
Specific extended scoping survey activities conducted for this subunit included the following:
* Layout of six triangular grid systematic sample points.
v Performance of gross alpha activity scan surveys of the floor surfaces within a -m2 gridarea for each triangular grid sample point and adjacent (1 m in width) to the garage doorslocated on the east and west walls of the subunit.
* Performance of a gross alpha static-count measurement at each sample point.
* Collection of a smear sample (representing a surface area of 100 cm2) at each static-countmeasurement sample point location for removable alpha activity determination.
Results of these specific extended scoping survey activities are as follows:
* Gross alpha activity scan surveys did not indicate the presence of elevated direct radiationabove the calculated MDC of 425 dpm/100 cm 2.
* None of the gross alpha static-count measurements for total surface activity were identifiedat activity levels above the GA-DCGL value of 21.5 dpm/100 cm2. The maximum static-count measurement was 20.0 dpm/100 cm2 and the median value of the data set was7.2 dpm/100 cm2.
* None of the gross alpha smear sample determinations for removable surface activity wereidentified at activity levels above the GA-DCGL value of 2.15 dpm/100 cm2. The maxi-mum removable activity level was 0.34 dpm/100 cm2 and the median value of the data setwas 0.21 dpm/100 cm2.
A statistical analysis summary of the total surface and removable surface gross alpha activity levels by
survey subunit is presented in Table 4-2. A tabular summary of the extended scoping survey data for this
subunit is provided in Appendix B-2, Table B-2-11, analytical data reports are provided in Appendix B-3,
and QA/QC materials are provided in Appendix B-4.
4.1.1.5 Crusher Building (Survey Subunit 12)
Available information collected on the Crusher Building indicates that the building was rebuilt after tho-
rium-magnesium alloy processing had ceased at the facility to accommodate the processing of aluminum.
(Rev. 5/03)

4-16
A layout of the Crusher Building is presented in Figure 4A-6. Building dimensions and construction
material types are also shown in this figure. The Crusher Building consists of a single-story structure
with a main floor area of approximately 500 M2 . This building also contains two aluminum furnaces, a
casting pit area, a two-tier stair well, and an exterior concrete pad.
Specific extended scoping survey activities conducted for this subunit included the following:
* Layout of 15 triangular grid systematic sample points.
* Performance of gross alpha activity scan surveys of the floor surfaces within a 1-M2 gridarea for each triangular grid sample point and adjacent (1 m in width) to the doorwayslocated along the southern and western walls of the subunit.
* Performance of a gross alpha static-count measurement at each sample point.
* Collection of a smear sample (representing a surface area of 100 cm2) at each static-countmeasurement sample point location for removable alpha activity determination.
Results of these specific extended scoping survey activities are as follows:
* Gross alpha activity scan surveys did not indicate the presence of elevated direct radiationabove the calculated MDC of 425 dpm/100 cm2.
* None of the gross alpha static-count measurements for total surface activity were identifiedat activity levels above the GA-DCGL value of 21.5 dpm/lOO cm2. The maximum static-count measurement was 17.9 dpm/100 cm2 and the median value of the data set was4.0 dpm/100 cm2.
* None of the gross alpha smear sample determinations for removable surface activity wereidentified at activity levels above the GA-DCGL value of 2.15 dpmtlOO cm2. The maxi-mum removable activity level was 0.89 dpm/100 cm2 and the median value of the data setwas 0.07 dpm/100 cm2.
A statistical analysis summary of the total surface and removable surface gross alpha activity levels by
survey subunit is presented in Table 4-2. A tabular summary of the extended scoping survey data for this
subunit is provided in Appendix B-2, Table B-2-12, analytical data reports are provided in Appendix B-3,
and QA/QC materials are provided in Appendix B-4.
(Rev. 5/03)
4-17
4.1.1.6 Crusher Addition Building (Survey Subunit 13)
Available information collected on the Crusher Addition Building indicates that the building was rebuilt
after thorium-magnesium alloy processing had ceased at the facility to accommodate the processing of
aluminum. A layout of the Crusher Addition Building is presented in Figure 4A-7. Building dimensions
and construction material types are also shown in this figure. The Crusher Addition Building consists of
a single-story structure with a main floor area of approximately 540 m2. This building also contains a
casting pit, an aluminum tilting furnace, an aluminum smelter, and a preheat furnace.
Specific extended scoping survey activities conducted for this subunit included the following:
* Layout of 16 triangular grid systematic sample points.
* Performance of gross alpha activity scan surveys of the floor surfaces within a 1-m2 gridarea for each triangular grid sample point and adjacent (1 m in width) to the doorwayslocated on the north, south, and west walls of the subunit.
* Performance of a gross alpha static-count measurement at each sample point.
* Collection of a smear sample (representing a surface area of 100 cm2) at each static-countmeasurement sample point location for removable alpha activity determination.
Results of these specific extended scoping survey activities are as follows:
* Gross alpha activity scan surveys did not indicate the presence of elevated direct radiationabove the calculated MDC of 425 dpm/100 cm2.
* None of the gross alpha static-count measurements for total surface activity were identifiedat activity levels above the GA-DCGL value of 21.5 dpm/100 cm2. The maximum static-count measurement was 21.4 dpm/100 cm2 and the median value' of the data set was13.7 dpm/100 cm2.
* None of the gross alpha smear sample determinations for removable surface activity wereidentified at activity levels above the GA-DCGL value of 2.15 dpm/100 m2. The maximumremovable activit7' level was 0.61 dpm/100 cm2 and the median value of the data set was0.07 dpm/100 cm .
A statistical analysis summary of the total surface and removable surface gross alpha activity levels by
survey subunit is presented in Table 4-2. A tabular summary of the extended scoping survey data for this
subunit is provided in Appendix B-2, Table B-2-13, analytical data reports are provided in Appendix B-3,
and QA/QC materials are provided in Appendix B-4.
(Rev. 5103)
4-18
4.2 Contaminated Systems and Equipment
Smelting of magnesium-thorium alloy was discontinued prior to 1971. Subsequently, nonthoriated mag-
nesium and then aluminum were smelted at the plant. Instrument scans indicated that no contaminated
equipment exists at the facility.
As discussed in Chapter 3.0 of this DPA, a limited amount of subsurface piping and associated culverts
exist within the former operational area of the facility (Figure 3A-4). A surface water storm drain and
associated culvert are located near the northeastern corner of the North Extrusion Building. Subsurface
piping associated with a storm drain and an air compressor cooling unit originates from the Warehouse
Building and surface discharges at a location immediately north of the former operational area. Subsur-
face piping associated with drains originating from the Crusher Building surface discharge at locations
immediately north of the building. These systems are not expected to contain radiological contamination.
Information gathered during an HSA performed during late 2001 does not indicate the use of subsurface
piping systems or the sanitary sewer for the conveyance of radioactive material. The pumping station
structure identified near the Retention Pond was used to convey noncontact cooling water used in plant
operations. These systems are not expected to contain radiological contamination. Their radiological
status will be confirmed when they are encountered during remediation activities to determine the proper
disposition.
4.3 Surface and Subsurface Soil Contamination
Land areas initially classified as impacted included the land areas beneath the Maintenance Building, the
Crusher Building, the Crusher Addition Building, the North Extrusion Building, the Warehouse Building,
and the former Smelter Building, as well as concrete-paved areas completed post-1958. These areas of
concern were delineated into nine survey units for characterization purposes (Figure 4A-8).
Characterization survey activities performed for each survey unit (with the exception of Survey Unit 6)
included gamma scan walk over surveys, surface and subsurface soil sampling, and sample field gamma
scanning and laboratory analysis. Ambient background radiological conditions were established for each
survey unit grid area prior to performing a gamma scan walk over survey. Ambient background radio-
logical conditions were also established, prior to the scanning of soil core samples on site. A background
count time of 1 minute was used in both cases to ensure that the background count rate was statistically
significant. Table 4-3 contains the ambient background values established for each survey unit grid area.
(Rev. 5/03)
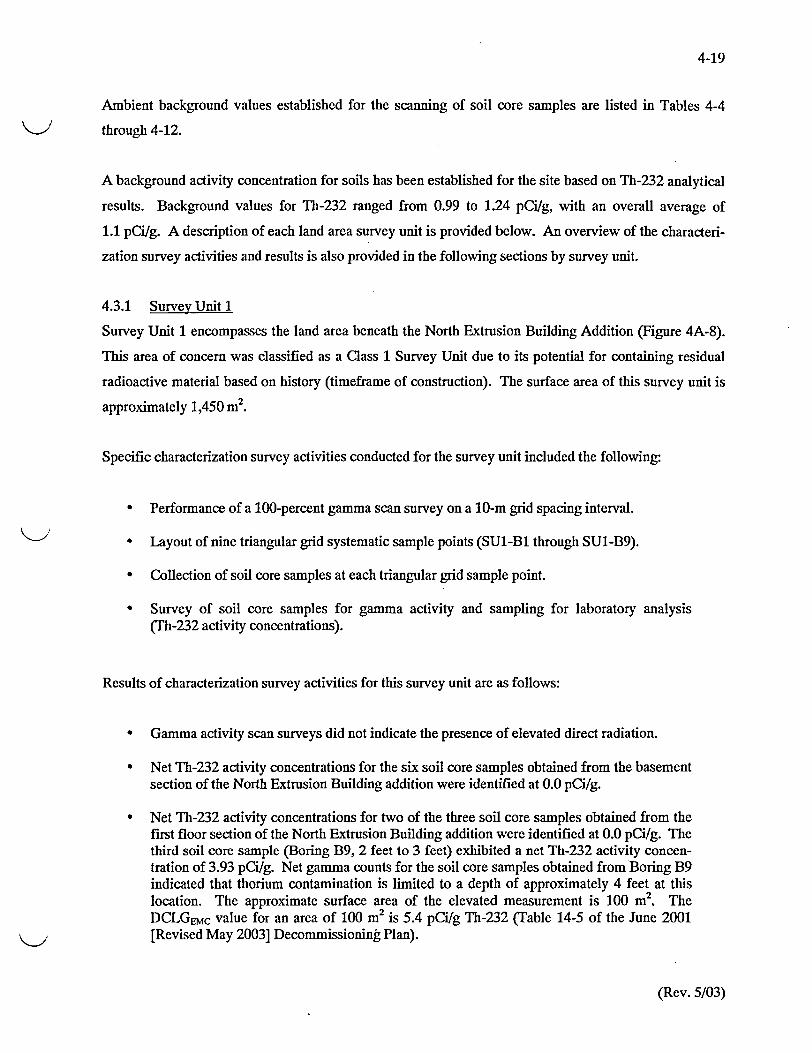
4-19
Ambient background values established for the scanning of soil core samples are listed in Tables 4-4
through 4-12.
A background activity concentration for soils has been established for the site based on Th-232 analytical
results. Background values for Th-232 ranged from 0.99 to 1.24 pCi/g, with an overall average of
1.1 pCi/g. A description of each land area survey unit is provided below. An overview of the characteri-
zation survey activities and results is also provided in the following sections by survey unit.
4.3.1 Survey Unit 1
Survey Unit 1 encompasses the land area beneath the North Extrusion Building Addition (Figure 4A-8).
This area of concern was classified as a Class 1 Survey Unit due to its potential for containing residual
radioactive material based on history (timeframe of construction). The surface area of this survey unit is
approximately 1,450 M2 .
Specific characterization survey activities conducted for the survey unit included the following:
* Performance of a 100-percent gamma scan survey on a 10-m grid spacing interval.
* Layout of nine triangular grid systematic sample points (SUl-Bl through SUI-B9).
* Collection of soil core samples at each triangular grid sample point.
* Survey of soil core samples for gamma activity and sampling for laboratory analysis(Th-232 activity concentrations).
Results of characterization survey activities for this survey unit are as follows:
* Gamma activity scan surveys did not indicate the presence of elevated direct radiation.
* Net Th-232 activity concentrations for the six soil core samples obtained from the basementsection of the North Extrusion Building addition were identified at 0.0 pCi/g.
* Net Th-232 activity concentrations for two of the three soil core samples obtained from thefirst floor section of the North Extrusion Building addition were identified at 0.0 pCi/g. Thethird soil core sample (Boring B9, 2 feet to 3 feet) exhibited a net Th-232 activity concen-tration of 3.93 pCi/g. Net gamma counts for the soil core samples obtained from Boring B9indicated that thorium contamination is limited to a depth of approximately 4 feet at thislocation. The approximate surface area of the elevated measurement is 100 m2 . TheDCLGEMC value for an area of 100 M2 is 5.4 pCi/g Th-232 (able 14-5 of the June 2001[Revised May 2003] Decommissioning Plan).
(Rev. 5/03)

4-20
A summary of the gamma scan survey results (gross and net maximum, minimum, and average values)
for this survey unit is presented in Table 4-3. The results of the soil core scans (net gamma counts) for
Survey Unit 1 are summarized in Table 4-4. Th-232 analytical results for select soil core samples are
summarized in Table 4-13 and presented in Figure 4A-9. Analytical data reports are contained in Appen-
dix C-1. QA/QC records are contained in Appendix C-2.
4.3.2 Survey Unit 2
Survey Unit 2 consists of the land area beneath a paved concrete surface situated northwest of the Main-
tenance Building, northeast of the North Extrusion Building, and south of the Union Pacific Railroad
right-of-way (Figure 4A-8). This area of concern was classified as a Class 1 Survey Unit due to the pres-
ence of residual radioactive material (above the DCGL) as identified during the ASCA. The surface area
of this survey unit is. approximately 450 m2.
Specific characterization survey activities conducted for each survey unit included the following:
* Performance of a 100-percent gamma scan survey on a 10-m grid spacing interval.
* Layout of nine triangular grid systematic sample points (SU2-B1 through SU2-B9).
* Collection of soil core samples at each triangular grid sample point.
Survey of soil core samples for gamma activity and sampling for laboratory analysis(Th-232 activity concentrations).
* Excavation of an exploratory test trench (T-SU2-1) in the westem half of the survey unit.Materials encountered during trenching were visually inspected and scanned for the pres-ence of radioactive material.
Results of characterization survey activities for this survey unit are as follows:
* Gamma activity scan surveys indicated the presence of elevated direct radiation in the west-ern half of the survey unit.
* Net Th-232 activity concentrations for the nine triangular grid soil core samples wereidentified at 0.0 to 0.57 pCig.
* A surface soil sample (ASCA-25, 0 foot to 0.5 foot) collected during the ASCA exhibited anet Th-232 activity concentration of 7.37 pCi/g. This sample was collected from the west-em half of the survey unit.
(Rev. 5/03)

4-21
* Exploratory test trenching revealed the presence of pockets of thorium-bearing drossthroughout the western half of the survey unit. Scan data acquired during test trench activi-ties revealed isolated pockets of residual radioactive materials. Scan data ranged from6,000 cpm net to 12,000 cpm net in the test trench area. The average scan result of theexcavation was approximately 10,000 cpm net. Background for the area was measured at10,000 to 11,000 cpm. The depth of the thorium contamination appears to be limited toapproximately 6 feet in this area. The approximate surface area of the radiological con-tamination is 2,214 ft2. No samples were acquired for this test trench.
A summary of the gamma scan survey results (gross and net maximum, minimum, and average values)
for this survey unit is presented in Table 4-3. The results of the soil core scans (net gamma counts) for
Survey Unit 2 are summarized in Table 4-5. Th-232 analytical results for select soil core samples are
summarized in Table 4-13 and presented in Figure 4A-10. Analytical data reports are contained in
Appendix C-1. QA/QC records are contained in Appendix C-2.
4.3.3 Survey Unit 3
Survey Unit 3 consists of the land area beneath a paved concrete surface situated north of the Office
Building, east of the North Extrusion Building, south of Survey Unit 2, and west of the Maintenance
Building (Figure 4A-8). This area of concem was classified as a Class 1 Survey Unit due to the presence
of residual radioactive material (above the DCGL), as identified during the ASCA. The surface area of
this survey unit is approximately 1,750 i 2 .
Specific characterization survey activities conducted for the survey unit included the following:
* Performance of a 100-percent gamma scan survey on a 10-m grid spacing interval.
* Layout of nine triangular grid systematic sample points (SU3-B1 through SU3-B9).
* Collection of soil core samples at each triangular grid sample point.
* Collection of soil core samples at three points of elevated surface activity (SU3-A1,SU3-A2, and SU3-C1).
* Survey of soil core samples for gamma activity and sampling for laboratory analysis(Th-232 activity concentrations).
* Excavation of an exploratory test trench (T-SU3-1) in the built-up concrete-surfaced ramparea located immediately west of the Maintenance Building. Materials encountered duringtrenching were visually inspected and scanned for the presence of radioactive material.
(Rev. 5/03)

4-22
Results of characterization survey activities for this survey unit are as follows:
* Gamma activity scan surveys indicated the presence of elevated direct radiation in threesmall areas of the survey unit.
* Net Th-232 activity concentrations for the nine triangular grid soil core samples and thethree points of elevated surface activity were identified at 0.0 to 0.41 pCi/g.
* A surface soil sample (ASCA-24A, 0 foot to 2 feet) collected during the ASCA exhibited anet Th-232 activity concentration of 8.47 pCi/g. This sample was collected from the built-up concrete-surfaced ramp located immediately west of the Maintenance Building.
* Exploratory test trenching revealed the presence of thorium-bearing dross in the built-upramp area located immediately west of the maintenance building. Scan data acquired dur-ing test trench activities revealed large areas of residual radioactive materials. Scan dataranged from 20,000 cpm net to 250,000 cpm net in the test trench area. The average scanresult for this excavation was approximately 50,000 cpm net. Background for the excava-tion was measured at 9,000 to 10,000 cpm. The depth of the thorium-contaminationappears to be limited to approximately 4 feet in this area. The approximate surface area ofthe radiological contamination is 800 ft2.
* A biased soil sample (highest scan cpm) collected from the test trench revealed a Th-232activity concentration of 143.9 pCi/g net.
A summary of the gamma scan survey results (gross and net maximum, minimum, and average values)
for this survey unit is presented in Table 4-3. The results of the soil core scans (net gamma counts) for
Survey Unit 3 are summarized in Table 4-6. Th-232 analytical results for select soil core samples are
summarized in Table 4-13 and presented in Figure 4A-11. Analytical data reports are contained in
Appendix C-1. QA/QC records are contained in Appendix C-2.
4.3.4 Survey Unit 4
Survey Unit 4 encompasses the land area beneath the Maintenance Building, Scale House Addition (Fig-
ure 4A-8). This area of concern was classified as a Class 1 Survey Unit due to its potential for containing
residual radioactive material based on history (timeframe of construction). The surface area of this survey
unit is approximately 850 m2.
Specific characterization survey activities conducted for each survey unit included the following:
* Performance of a 100-percent gamma scan survey on a 10-m grid spacing interval.
* Layout of nine triangular grid systematic sample points (SU4-B1 through SU4-B9).
(Rev. 5/03)

4-23
* Collection of soil core samples at each triangular grid sample point.
* Survey of soil core samples for gamma activity and sampling for laboratory analysis(Th-232 activity concentrations).
Results of characterization survey activities for this survey unit are as follows:
* Gamma activity scan surveys did not indicate the presence of elevated direct radiation.
* Net Th-232 activity concentrations for the nine triangular grid soil core samples obtainedduring this characterization event were identified at 0.0 pCi/g.
A summary of the gamma scan survey results (gross and net maximum, minimum, and average values)
for this survey unit is presented in Table 4-3. The results of the soil core scans (net gamma counts) for
Survey Unit 4 are summarized in Table 4-7. Th-232 analytical results for select soil core samples are
summarized in Table 4-13 and presented in Figure 4A-12. Analytical data reports are contained in
Appendix C-1. QA/QC records are contained in Appendix C-2.
4.3.5 Survey Unit 5
Survey Unit 5 consists of the land area beneath a paved concrete surface situated north of the Warehouse
Building, east of the Maintenance Building, south of the Union Pacific Railroad right-of-way, and west of
the current Crusher Building (Figure 4A-8). This area of concern was classified as a Class 1 Survey Unit
due to its potential for containing residual radioactive material based on operational history (the area of
the original Smelter Building). The surface area of this survey unit is approximately 1,850 M2 .
Specific-characterization survey activities conducted for the survey unit included the following:
* Performance of a 100-percent gamma scan survey on a 10-m grid spacing interval.
* Layout of nine triangular grid systematic sample points (SU5-B1 through SU5-B9).
* Collection of soil core samples at each triangular grid sample point.
* Collection of soil core samples at four points of elevated surface activity (SU5-A2,SU5-D2, SU5-G1, and SU5-I1).
* Survey of soil core samples for gamma activity and sampling for laboratory analysis(Th-232 activity concentrations).
(Rev. 5/03)

4-24
* Excavation of an exploratory test trench (T-SU5-1) along the backfilled side of a concreteretaining wall situated at the southeastern corner of the Maintenance Building. Materialsencountered during trenching were visually inspected and scanned for the presence ofradioactive material.
Results of characterization survey activities for this survey unit are as follows:
* Gamma activity scan surveys indicated the presence of elevated direct radiation in theeasternmost section of the survey unit.
* Net Th-232 activity concentrations for the nine triangular grid soil core samples and twobiased soil core samples (Borings D2 and G1) obtained during this characterization eventwere identified at 0.0 to 0.01 pCi/g.
* Two biased soil core samples (Boring A2, 1 foot to 2 feet and Boring I1, 3 feet to 4 feet)collected during this characterization event exhibited net Th-232 activity concentrations of73.3 and 80.7 pCi/g. Net gamma counts for the soil core samples obtained from Boring A2indicated that thorium contamination is limited to a depth of approximately 2 feet at thislocation. Net gamma counts for the soil core samples obtained from Boring I indicatedthat thorium contamination is limited to a depth of approximately 4 feet at this location.
* Exploratory test trenching revealed the presence of thorium-bearing dross along the back-filled side of the concrete retaining wall situated at the southeastern corner of the Mainte-nance Building. Scan data acquired during test trench activities revealed large areas of re-sidual radioactive materials. Scan data ranged from 30,000 cpm net to 1,000,000 cpm net inthe test trench area. The average scan result of this excavation was approximately 40,000cpm net. Background for the excavation was measured at 10,000 to 11,000 cpm. The depthof the thorium contamination appears to be limited to approximately 4 feet in this area. Theapproximate surface area of the radiological contamination is 496 ft2. One small elevatedarea (1,000,000 cpm) of a unique dross material (wrapped in plastic) was identified in thisexcavation. Sampling of this isolated pocket of dross material removed the majority of thematerial at this location.
* A biased soil sample (highest scan cpm area) revealed a Th-232 activity contamination of6,428.9 pCi/g net.
A summary of the gamma scan survey results (gross and net maximum, minimum, and average values)
for this survey unit is presented in Table 4-3. The results of the soil core scans (net gamma counts) for
Survey Unit 5 are summarized in Table 4-8. Th-232 analytical results for select soil core samples are
summarized in Table 4-13 and presented in Figure 4A-13. Analytical data reports are contained in
Appendix C-1. QAIQC records are contained in Appendix C-2.
(Rev. 5/03)

4-25
4.3.6 Survey Unit 6
Survey Unit 6 encompasses the land area beneath the floor area of the former Smelter Building No. 5
(Figure 4A-8). The Smelter Building was demolished in October 2000, following completion of survey
activities that indicated no contamination within the building. Approximately 2 to 10 feet of clean fill
was then placed over the former building's concrete slab floor for site grading purposes. This area of
concern was classified as a Class 1 Survey Unit due to its potential for containing residual radioactive
material based on history (timeframe of construction). The surface area of this survey unit is approxi-
mately 650 m2 .
A separate sampling strategy was developed for the land area beneath the former Smelter Building No. 5.
The sampling strategy for this survey unit was designed based on its current surface topographical condi-
tion and the configuration of the former Smelter Building. Based on the former building's configuration,
two areas within the survey unit exist with a maximum potential for containing residual radioactive mate-
rial. These include the area at ground level to the east (immediately adjacent to areas remediated during
the ALRP) and the exterior area immediately abutting the lower walls of the westem and southern por-
tions of the former structure. Prior to initiating any surveys or sampling in this survey unit, an approxi-
mate 10-m-by-10-m area in the northeasternmost corner of the former building's foot print was cleared of
cover to the concrete floor slab. Once cleared of cover, the following specific characterization survey
activities were conducted:
* Performance of a 100-percent gamma scan survey of the cleared 10-m-by-10-m area.
* Layout of four systematic sample points in the cleared area (SU6-B6 through SU6-B9) andfive sample points along the perimeter of the former structure's foundation (SU6-B1through SU6-B5).
* Collection of soil core samples at each sample point.
* Survey of soil core samples for gamma activity and sampling for laboratory analysis(Th-232 activity concentrations).
Net Th-232 activity concentrations for eight of the nine soil core samples were identified at 0.0 to
1.88 pCi/g. The soil core sample collected from Boring B3, 7 feet to 8 feet, exhibited a net Th-232 activ-
ity concentration of 20.7 pCi/g. Net gamma counts for the soil core samples obtained from Boring B3
indicated that thorium contamination is limited to a depth of approximately 8 feet at this location.
(Rev. 5/03)

4-26
A summary of the gamma scan survey results (gross and net maximum, minimum, and average values)
for this survey unit is presented in Table 4-3. The results of the soil core scans (net gamma counts) for
Survey Unit 6 are summarized in Table 4-9. Th-232 analytical results for select soil core samples are
summarized in Table 4-13 and presented in Figure 4A-14. Analytical data reports are contained in
Appendix C-1. QAIQC records are contained in Appendix C-2.
4.3.7 Survey Unit 7
Survey Unit 7 encompasses the land area beneath the Warehouse Building (Figure 4A-8). This area of
concern was classified as a Class 1 Survey Unit due to the presence of residual radioactive material
(above the DCGL) as identified during the ASCA. The surface area of this survey unit is approximately
1,500 M2.
Specific characterization survey activities conducted for the survey unit included the following:
* Performance of a 100-percent gamma scan survey on a 10-m grid spacing interval.
* Layout of nine triangular grid systematic sample points (SU7-B1 through SU7-B9).
* Collection of soil core samples at each triangular grid sample point.
* Collection of soil core samples at five points of elevated surface activity (SU7-C1, SU7-D2,SU7-F2, SU7-H1, and SU7-112).
* Survey of soil core samples for gamma activity and sampling for laboratory analysis(Th-232 activity concentrations).
Results of characterization survey activities for this survey unit are as follows:
* Gross gamma activity scan surveys indicated the presence of elevated direct radiation in sixareas of the survey unit (concentrated to the central and northeastern corner).
* Net Th-232 activity concentrations for eight of the nine triangular grid soil core samplesand two biased soil core samples (Borings D2 and Hi) obtained during this characterizationevent were identified at 0.0 to 2.69 pCi/g. The soil core sample collected from Boring B3, 0foot to 1 foot, exhibited a net Th-232 activity concentration of 64.4 pCi/g. Net gammacounts for the soil core samples obtained from Boring B3 indicated that Th-contamination islimited to a depth of approximately 2 feet at this location. The final location for Boring B3was biased based on the results of the gamma activity scan survey.
* Three biased soil core samples (Boring Cl, 0 foot to 1 foot, Boring F2, 5 feet to 6 feet, andBoring H2, 0 foot to 1 foot) collected exhibited net Th-232 activity concentrations ranging
(Rev. 5/03)

4-27
from 13.2 to 56.8 pCi/g. Net gamma counts for the soil core samples obtained from Bor-ings Cl and H2 indicated that thorium contamination is limited to a depth of approximately2 feet at these locations. Net gamma counts for the soil core samples obtained from BoringF2 indicated that thorium contamination is limited to a depth of approximately 6 feet at thislocation.
One soil sample (ASCA-22, 0 foot to 2 feet) collected from this survey unit during theASCA also exhibited a net Th-232 activity concentration in excess of 3.0 pCi/g (theDCGL).
A summary of the gamma scan survey results (gross and net maximum, minimum, and average values)
for this survey unit is presented in Table 4-3. The results of the soil core scans (net gamma counts) for
Survey Unit 7 are summarized in Table 4-10. Th-232 analytical results for select soil core samples are
summarized in Table 4-13 and presented in Figure 4A-15. Analytical data reports are contained in
Appendix C-1. QA/QC records are contained in Appendix C-2.
4.3.8 Survey Unit 8
Survey Unit 8 consists of the land area beneath a paved concrete surface situated north of 41st Street and
the current Crusher Building, east of Survey Unit 5, south of the Union Pacific Railroad right-of-way, and
west of areas remedeated during the ALRP (Figure 4A-8). This area of concern was classified as a
Class 1 survey unit due to the presence of residual radioactive material (above the DCGL) as identified
during the ASCA. The surface area of this survey unit is approximately 1,350 m2 .
Specific characterization survey activities conducted for the survey unit included the following:
* Performance of a 100-percent gamma scan survey on a 10-m grid spacing interval.
* Layout of nine triangular grid systematic sample points (SU8-B1 through SU8-B9).
* Collection of soil core samples at each triangular grid sample point.
* Collection of soil core samples at three points of elevated surface activity (SU8-F1,SU8-F2, and SU8-F3).
* Survey of soil core samples for gamma activity and sampling for laboratory analysis(Th-232 activity concentrations).
Results of characterization survey activities for this survey unit are as follows:
(Rev. 5/03)

4-28
* Gamma activity scan surveys indicated the presence of elevated direct radiation in thenortheastern section of the survey unit.
* Net Th-232 activity concentrations for seven of the nine triangular grid soil core sampleswere identified at 0.0 to 1.81 pCilg. The soil core sample collected from Boring B3, 1 footto 2 feet, exhibited a net Th-232 activity concentration of 21.6 pCi/g. Net gamma countsfor the soil core samples obtained from Boring B3 indicated that thorium contamination islimited to a depth of approximately 2 feet at this location. The soil core sample collectedfrom Boring B5, 1 foot to 2 feet, exhibited a net Th-232 activity concentration of 41.5pCi/g. Net gamma counts for the soil core samples obtained from Boring B5 indicated thatthorium contamination is limited to a depth of approximately 2 feet at this location.
* Three biased soil core samples (Boring Fl, 0 foot to 1 foot, Boring F2, 0 foot to 1 foot, andBoring F3, 0 foot to 1 foot) collected during this characterization event exhibited netTh-232 activity concentrations ranging from 10.8 to 131.9 pCilg. Net gamma counts for thesoil core samples obtained from these borings indicated that thorium contamination is lim-ited to a depth of approximately 2 feet at these locations.
* Three soil samples (ASCA-14, 0 foot to 1 foot, ASCA-15, 1 foot to 2 feet, and ASCA-19, 4feet to 5 feet) collected from this survey unit during the ASCA also exhibited net Th-232activity concentration in excess of 3.0 pCi/g (the DCGL).
A summary of the gamma scan survey results (gross and net maximum, minimum, and average values)
for this survey unit is presented in Table 4-3. The results of the soil core scans (net gamma counts) for
Survey Unit 8 are summarized in Table 4-11. Th-232 analytical results for select soil core samples are
summarized in Table 4-13 and presented in Figure 4A-16. Analytical data reports are contained in
Appendix C-1. QAIQC records are contained in Appendix C-2.
4.3.9 Survey Unit 9
Survey Unit 9 includes the land area beneath the current Crusher and Crusher Addition buildings (Fig-
ure 4A-8). This area of concern was classified as a Class 1 Survey Unit due to the presence of residual
radioactive material (above the DCGL), as identified during the ASCA effort. The surface area of this
survey unit is approximately 1,200 m2 .
Specific characterization survey activities conducted for the survey unit included the following:
* Performance of a 100-percent gamma scan survey on a 10-m grid spacing interval.
* Layout of nine triangular grid systematic sample points (SU9-B1 through SU9-B9).
* Collection of soil core samples at each triangular grid sample points.
(Rev. 5/03)

4-29
* Survey of soil core samples for gamma activity and sampling for laboratory analysis(Th-232 activity concentrations).
Results of characterization survey activities for this survey unit are as follows:
* Gamma activity scan surveys did not indicate the presence of elevated direct radiation.
* Net Th-232 activity concentrations for seven of the nine triangular grid soil core samplesobtained during this characterization event were identified at 0.0 to 1.07 pCi/g. The soilcore sample collected from Boring B3, 1 foot to 2 feet exhibited a net Th-232 activity con-centration of 30.9 pCi/g. Net gamma counts for the soil core samples obtained from BoringB3 indicated that thorium contamination is limited to a depth of approximately 2 feet at thislocation. The soil core sample collected from Boring B5, 1 foot to 2 feet, exhibited a netTh-232 activity concentration of 48.7 pCi/g. Net gamma counts for the soil core samplesobtained from Boring B5 indicated that thorium contamination is limited to a depth ofapproximately 2 feet at this location. The final location for Boring B5 was biased based onthe results of the gamma activity scan survey.
* One soil sample (ASCA-23, 1 foot to 2 feet) collected from this survey unit during theASCA also exhibited a net Th-232 activity concentration in excess of 3.0 pCi/g (theDCGL).
A summary of the gamma scan survey results (gross and net maximum, minimum, and average values)
for this survey unit is presented in Table 4-3. The results of the soil core scans (net gamma counts) for
Survey Unit 9 are summarized in Table 4-12. Th-232 analytical results for select soil core samples are
summarized in Table 4-13 and presented in Figure 4A-17. Analytical data reports are contained in
Appendix C-1. QA/QC records are contained in Appendix C-2.
4.4 Surface Water
Refer to Section 4.4 of the June 2001 (Revised May 2003) Decommissioning Plan for the Tulsa facility.
4.5 Groundwater
Refer to Section 4.5 of the June 2001 (Revised May 2003) Decommissioning Plan for the Tulsa facility.
(Rev. 5/03)

4-30
References
(1) Earth Sciences, June 2001, Revised May 2003, Decommissioning Plan, Tulsa Facility, Tulsa, Okla-homa, Kaiser Aluminum & Chemical Corporation, Baton Rouge, Louisiana.
(2) Earth Sciences, October 2001, Additional Site Characterization Activities, Former Kaiser AluminumSpecialty Products Facility, Tulsa, Oklahoma, Kaiser Aluminum & Chemical Corporation, BatonRouge, Louisiana.
(3) Earth Sciences, December 2001, Historical Site Assessment, Operational Area, Former Kaiser Alumi-num Specialty Products Facility, Tulsa, Oklahoma, Kaiser Aluminum & Chemical Corporation,Baton Rouge, Louisiana.
(4) Earth Sciences, December 2001, Work Plan, Characterization Survey of the Operational Area, For-mer Kaiser Aluminum Specialty Products Facility, Tulsa, Oklahoma, Kaiser Aluminum & ChemicalCorporation, Baton Rouge, Louisiana.
(5) Earth Sciences, February 2002, Final Status Survey Report, Adjacent Land Area, Tulsa, OklahomaFacility, Kaiser Aluminum & Chemical Corporation, Baton Rouge, Louisiana.
(6) Earth Sciences, March 2002, Work Plan Addendum, Test Trench Activities, Characterization Surveyof the Operational Area, Former Kaiser Aluminum Specialty Products Facility, Tulsa, Oklahoma,Kaiser Aluminum & Chemical Corporation, Baton Rouge, Louisiana.
(7) NUREG/CR-1575, August 2000, MARSSIM, Rev. 1.
5427M\dpa\chapter4
(Rev. 5/03)

Tables
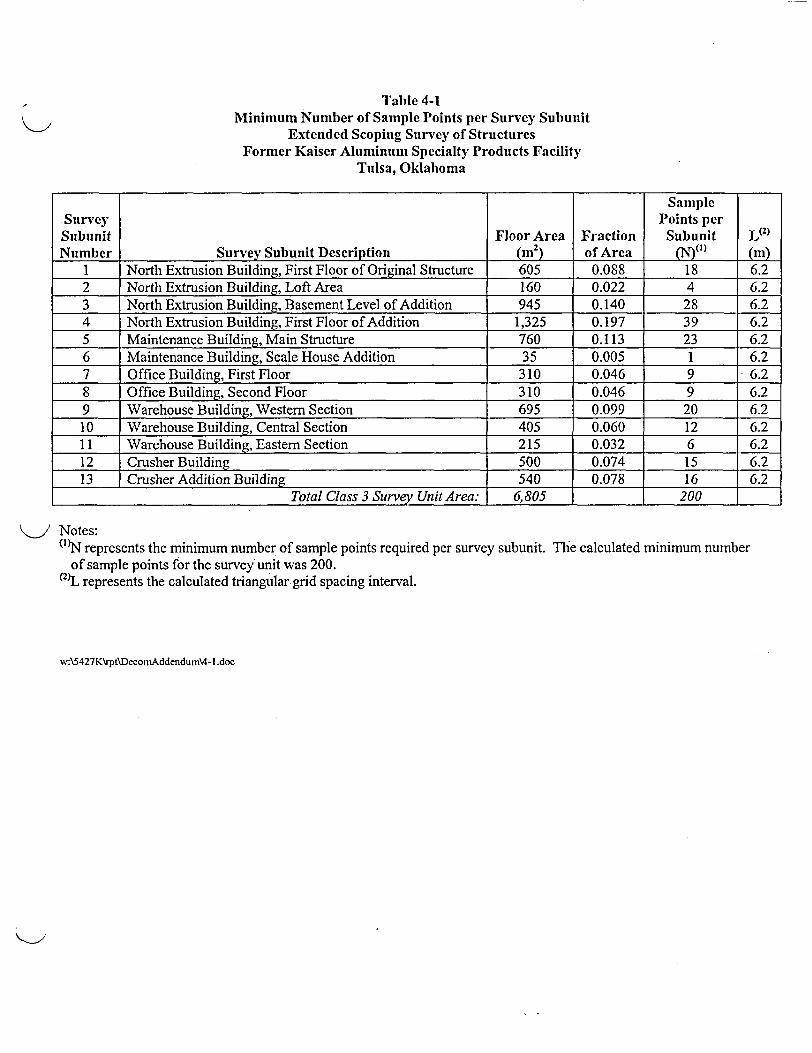
Table 4-1Minimum Number of Sample Points per Survey Subunit
Extended Scoping Survey of StructuresFormer Kaiser Aluminum Specialty Products Facility
Tulsa, Oklahoma
Sample.Survey Points perSubunit Floor Area Fraction Subunit L(2)Number Survey Subunit Description (m2) of Area (N)(1) (m)
1 North Extrusion Building, First Floor of Original Structure 605 0.088 18 6.22 North Extrusion Building, Loft Area 160 0.022 4 6.23 North Extrusion Building, Basement Level of Addition 945 0.140 28 6.24 North Extrusion Building, First Floor of Addition 1,325 0.197 39 6.25 Maintenance Building, Main Structure 760 0.113 23 6.26 Maintenance Building, Scale House Addition 35 0.005 1 6.27 Office Building, First Floor 310 0.046 9 6.28 Office Building, Second Floor 310 0.046 9 6.29 Warehouse Building, Western Section 695 0.099 20 6.210 Warehouse Building, Central Section 405 0.060 12 6.211 Warehouse Building, Eastern Section 215 0.032 6 6.212 Crusher Building 500 0.074 15 6.213 Crusher Addition Building 540 0.078 16 6.2
Total Class 3 Survey Unit Area: 6,805 200
' -Notes:('"N represents the minimum number of sample points required per survey subunit. The calculated minimum number
of sample points for the survey unit was 200.(2)L represents the calculated triangular grid spacing interval.
w:\5427K\rpt\DecomAddendum\4-1 .doc

Table 4-2Statistical Analysis Summary
Gross Alpha Activity (dpm/100 cm2)Extended Scoping Survey of Structures
Former Kaiser Aluminum Specialty Products FacilityTtulsa, Oklahoma
('
Total Surface Activity Levels
Survey Subunit
Statistics SSI SS2 SS3 SS4 SS5 SS6 SS7 SS8 SS9 SSio SSII SS12 SS13
Average 10.2 14.0 16.8 16.3 7.3 6.7 4.0 -0.9 8.7 4.2 10.6 5.4 13.0
Standard Deviation 8.1 5.7 1.6 2.8 7.2 5.6 4.1 5.8 6.6 2.8 6.6 8.2 5.6
Minimum -2.3 5.5 15.0 11.0 -8.1 0.8 -3.1 -9.4 -4.6 -0.5 5.4 -5.8 3.1
Maximum 21.4 17.6 20.0 20.0 21.3 12.0 10.2 9.4 20.5 9.3 20.0 17.9 21.4
Median 11.7 16.4 17.5 17.0 6.8 7.3 3.7 -0.9 8.6 4.0 7.2 4.0 13.7
|GA-DCGL 21.5 21.5 21.5 21.5 21.5 21.5 21.5 21.5 21.5 21.5 21.5 21.5 21.5
Removable Surface Activity Levels
Survey Subunit I
Statistics SSI SS2 *SS3 SS4 SS5 SS6 SS7 SS8 SS9 SSI0 SSII SS12 SS13
Averagc 0.06 0.14 0.42 0.20 0.08 0.34 -0.08 0.04 0.12 -0.02 0.12 0.16 0.05
Standard Deviation 0.27 0.34 0.51 0.31 0.28 0.27 0.20 0.21 0.32 0.24 0.27 0.32 0.27
Minimum -0.20 -0.20 -0.21 -0.20 -0.20 0.07 -0.20 -0.20 -0.20 -0.20 | -0.20 -0.20 -0.20
Maximum 0.61 0.61 1.70 0.89 0.61 0.61 0.34 0.34 0.89 0.34 0.34 0.89 0.61
Median 0.07 0.07 0.34 0.07 0.07 0.34 -0.20 0.07 0.07 -0.20 0.21 0.07 0.07
GA-DCGL 2.15 2.15 2.15 2.15 2.15 2.15 1 2.15 1 2.15 1 2.15 2.15 2.15 2.15 2.15
Note:Supporting information presented in Appendix B-2.
w:\5427k\pt\DecomAddendum\B2Tables.xls
C

CTable 4-3
Gamma Scan Survey ResultsCharacterization Survey of Land Areas
Former Kaiser Aluminum Specialty Products FacilityTulsa, Oklahoma
Instrument IDetector Serial lkg. Count Rate Scan of the Area (gross cpm) Scan of the Area (net cpm)Survey Area Serial Number Number (cpm) Maximum Minimum Average Maximum Minimum Avera eJ
Survey Unit ISUI-Al 102034 105942 6967 9200 5700 6900 2233 -1267 -67SUI-A2 102034 105942 6568 8100 5700 6800 1532 -868 232SUI-A3 102034 105942 8353 9400 7000 8700 1047 -1353 347SUI-A4 102034 105942 8203 9200 6600 7500 997 -1603 -703SUI-BI 86312 181297 6613 7300 6000 6500 687 -613 -113SUI1-B2 86312 181297 7708 9200 6800 8300 1492 -908 592SUI-B3 86312 181297 7758 9200 6400 7900 1442 -1358 142SUI-B4 86312 181297 7604 9400 6500 8400 1796 -1104 796SUI-CI 86312 181297 6425 9100 5100 7200 2675 -1325 775SUI-C2 102034 105942 6197 7100 5500 6200 903 -697 3SUI-C3 86312 181297 7544 9000 6700 7900 1456 -844 356SUI-C4 102034 105942 8084 9300 6400 8200 1216 -1684 116
Survey Unit 2SU2-A 102034 105942 9700 62000 8000 20000 52300 -1700 | 10300SU2-B 102034 105942 9815 50000 8000 15000 40185 -1815 5185SU2-C 102034 105942 8317 15000 7000 8500 6683 -1317 183SU2-D 102034 105942 8455 12500 8000 9500 4045 -455 1045SU2-E 102034 105942 8729 1 13000 7000 1 10000 4271 -1729 1271
Survey Unit 3SU3-AI/A-1 86312 181297 8239 11500 6200 8400 3261 -2039 161
SU3-A2 86312 181297 7906 12400 6800 7900 4494 -1106 -6SU3-A3 97799 533 8256 11056 6900 9100 2800 -1356 844
SU3-A4/AS 86312 181297 7862 9300 6200 8100 1438 -1662 238SU3-BI/B-1 86312 181297 8028 10400 6400 7100 2372 -1628 -928
SU3-B2 97799 533 8215 10200 7000 8500 1985 -1215 285SU3-B3 97799 533 8116 34463 6500 8800 26347 -1616 684SU3-B4 86312 181297 7791 10500 5800 7700 2709 -1991 -91
SU3-CI/C-1 102034 105942 8071 12000 7000 8100 3929 -1071 29SU3-C2 97799 533 8329 9900 6500 8600 1571 -1829 271SU3-C3 97799 533 8391 15500 7100 9000 7109 -1291 609SU3-C4 86312 181297 8185 9400 6300 7800 1215 -1885 -385SU3-D-1 97799 533 8314 9900 7200 8700 1586 -1114 386
SU3-DI/D2 97799 533 8547 9800 7400 8800 1253 -1147 253SU3-EI 97799 533 8417 9600 6400 8500 1183 -2017 83SU3-FI 86312 181297 7427 90001 6000 8200 1573 -1427 773SU3-F-1 86312 | 181297 9520 | 10700 | 6400 | 7300 | 1180 -3120 -2220
w:\5427k\rpt\Deco nAdden du m\T4-3.xis
C C
Page I o4

CTable 4-3
Gamma Scan Survey ResultsCharacterization Survey of Land Areas
Former Kaiser Aluminum Specialty Products FacilityTulsa, Oklahoma
w:\5427k\rpt\DecomAddendum\T4-3.xls
(7 (
Instrument Detector Serial Bkg. Count Rate Scan of the Area (gross cpm) Scan of the Area (net cpm)Survey Area Serial Number Number I (cpm) I Maximum Minimum Avera e Maximum Minimum Avera e
Survey Unit 4SU4-AI 86312 181297 7265 10600 5100 7000 3335 -2165 -265SU4-A2 86312 181297 6506 7400 5500 6300 894 -1006 -206SU4-B1 86312 181297 6430 7900 5200 6500 1470 -1230 70SU4-B2 86312 181297 6054 8000 5800 7000 1946 -254 946SU4-C1 102034 105942 7011 8200 5500 7300 1189 -1511 289SU4-C2 102034 105942 5970 8300 5200 6800 2330 -770 830SU4-DI 102034 105942 11547 12200 5900 8500 653 -5647 -3047SU4-D2 102034 105942 6095 9100 5800 6300 3005 -295 205
Survey Unit5SU5-AI/A-1 97799 533 8523 11500 7900 9100 2977 -623 577SU5-A2 86312 181297 8077 10300 6900 10000 2223 -1177 1923SU5-A3 97799 533 9645 11900 8900 10000 2255 -745 355SU5-BI 102034 105942 8127 10000 7900 8400 1873 -227 273SU5-B-1 102034 105942 9731 10000 9500 9800 269 -231 69SU5-B2 86312 181297 8961 10700 800 10100 1739 -8161 1139SU5-133 97799 533 9763 11800 8600 9800 2037 -1163 37SU5-CI 102034 105942 10198 11000 9700 10300 802 -498 102SU5-C-1 97799 533 9816 10200 8100 9600 384 -1716 -216SU5-C2 86312 181297 9640 11000 9400 10300 1360 -240 660SU5-DI 97799 533 10673 13700 8900 9800 3027 -1773 -873SU5-D-1 86312 181297 8522 10200 6400 8300 1678 -2122 -222SU5-D2 86312 181297 9439 14400 8300 9900 4961 -1139 461SU5-EI 102034 105942 9813 10500 9000 10000 687 -813 187SU5-E-1 86312 181297 10141 10500 8400 9200 359 -1741 -941SU5-F-1 86312 181297 9478 11300 7900 8800 1822 -1578 -678SU5--1 102034 105942 10402 14500 10000 125000 114598 -402 4098SU5-H-1 86312 181297 11001 12300 9900 10400 1299 -1101 -601SU5-1-1 102034 105942 11321 22000 10000 12600 114679 -1321 10679
Page 2 f4

Ta(.e 4-3Gamma Scan Survey Results
Characterization Survey of Land AreasFormer Kaiser Aluminum Specialty Products Facility
Tulsa, Oklalhoma
Instrument Detector Serial kg. Count Rate Scan of the Area (gross cpm) Scan of the Area (net cpm)Survey Area Serial Number Number (cpm) Maximum Minimum Average Naximuim Ninimum Avera e
Survey Unit 6SU6 I 102034 I 105942 I 15166 I 13000 I 15400 I 14700 I -2166 I 234 I -466
Survey Unit 7SU7-AI 86312 181297 6988 8700 6900 7800 1712 -88 812SU7-A2 86312 181297 6859 7800 6000 7600 941 -859 741SU7-131 86312 181297 7008 8800 6300 7500 1792 -708 492SU7-132 102034 105942 7823 9200 6900 7900 1377 -923 77SU7-CI 86312 181297 7346 9400 7100 8900 2054 -246 1554SU7-C2 102034 105942 7562 9800 6300 8800 2238 -1262 1238SU7-DI 86312 181297 7948 8600 5600 8300 652 -2348 352SU7-D2 102034 105942 8547 15300 6800 9200 6753 -1747 653SU7-EI 86312 181297 7824 9300 6900 8700 1476 -924 876SU7-E2 102034 105942 8669 29300 6900 9400 20631 -1769 731SU7-FI 86312 181297 7203 9300 6800 7900 2097 -403 697SU7-F2 102034 105942 8103 36000 6200 9800 27897 -1903 1697SU7-GI 86312 181297 7835 9100 5700 7800 1265 -2135 -35SU7-G2 102034 105942 9807 12300 5700 10800 2493 -4107 993SU7-H1I 86312 181297 7559 8500 6300 7800 941 -1259 241SU7-H2 102034 105942 9133 18400 6900 10500 9267 -2233 1367
Survey Unit 8SU8-AI 102034 105942 15997 17000 15500 16300 1003 -497 303SU8-131 102034 105942 16847 175000 16000 16850 158153 -847 3
SU8-CI/C-1 86312 181297 13274 14900 9900 11600 1626 -3374 -1674SU8-DI/D-1 102034 105942 16448 17000 15000 16300 552 -1448 -148SU8-E-I/EI 86312 181297 12391 15800 9100 12300 3409 -3291 -91SU8-F-I/FI 86312 181297 13757 17900 11200 14100 4143 -2557 343
SU8-F-2 86312 181297 11879 25200 8700 11400 13321 -3179 -479SU8-F-3 102034 105942 12999 13500 12000 13000 501 -999 1
SU8-G-2/G-1 86312 181297 12051 15000 10000 12700 2949 -2051 649SU8-G-3 102034 105942 13725 14200 13500 13700 475 -225 -25
SU8-11-2/H-1 86312 181297 12522 16800 10700 12500 4278 -1822 -22SU8-H-3 102034 105942 13314 21000 10000 15000 7686 -3314 1686SU8-1-2 102034 105942 16512 30000 14900 22000 13488 -1612 5488SU8-1-3 86312 181297 10146 25500 10100 15200 15354 -46 5054SU8-J-2 102034 105942 14260 15000 11000 14500 740 -3260 240
w:\54271k\rpt\DecomAddendum\T4.3 .xds
(7 C
Page 3 oN

CTable 4-3
Gamma Scan Survey ResultsCharacterization Survey of Land Areas
Former Kaiser Alumintim Specialty Products FacilityTulsa, Oklahoma
Note:2,500 cpm above background was the field limit used to designate areas of possible subsurface contamination.
w:\5427k\rpt\DecomAddendum\T4-3.xls
( C
Instrument Detector Serial Bkg. Count Rate Scan of the Area (gross cpm) Scan of the Area (net cpm)Survey Area Serial Number Number (cipm) Maximum Minimum Average Maximuim linimum Avcrat e
Survey Unit 9SU9-AI 102034 105942 8879 9700 8300 9200 821 -579 321SU9-A2 102034 105942 8953 10300 8900 9400 1347 -53 447SU9-BI 86312 181297 8844 10500 8200 9600 1656 -644 756SU9-B2 86312 181297 9572 10200 7600 9600 628 -1972 28SU9-133 86312 181297 8357 20300 7100 8300 11943 -1257 -57SU9-CI 102034 105942 9233 10100 7300 9400 867 -1933 167SU9-C2 102034 105942 9018 11800 5900 10400 2782 -3118 1382SU9-C3 86312 181297 8322 10800 5900 8900 2478 -2422 578SU9-DI 86312 181297 9341 11100 7900 9500 1759 -1441 159SU9-D2 86312 181297 9185 11100 5600 9800 1915 -3585 615SU9-A3 86312 181297 9835 11800 7500 10700 1965 -2335 865
Page 4 o4

(
Notes:Background was determined to be 4,382 cpm using soil known to be nonimpacted.Bold numbers represent the segment of the sample that was sent to the laboratory for analytical analysis.Instrumentation used for core scans was Ludlum 2221 (SN 117370) with Ludlum 44-10 detector (SN 0551).
w:\5427k\'pt\DecomAddendum\SoilCores.xls
(
Table 4-4
Survey Unit I - Land Area Beneath the North Extrusion Building
Soil Core Scans, Net Gamma Count
(cpm)
Depth Sample Point| Sample Point Sample Point Sample Point Sample Point Sample Point Sample Point Sample Point| Sample Poini
(ft) | Bi | B2 B3 J B4 B5 B6 | B7 | B8 _ B9
(0-1) 628 318 -82 -82 118 318 318 118 218
(1-2) 618 118 -182 118 318 218 418 318 -182
(2-3) 218 118 118 18 218 618 318 118 618
(3-4) 318 -82 318 418 438 118 18 318 418
(4-5) 518 118 18 118 318 218 -282 218
(5-6) 118 118 118 418 -182 118 118
(6-7) -82 218 318 -282 18
(7-8) 218 418 518 518 518
(8-9) -82
(9-10) 618
(10-11) 318

(
Notes:Background was determined to be 4,382 cpm using soil known to be nonimpacted.Bold numbers represent the segment of the sample that was sent to the laboratory for analytical analysis.Instrumentation used for core scans was Ludlum 2221 (SN 117370) with Ludlum 44-10 detector (SN 0551).
w:\5427k\rpt\DecomAddendum\SoilCores.xls
C
Table 4-5
Survey Unit 2 - Land Area North of the Maintenance Building and the North Extrusion Building
Soil Core Scans, Net Gamma Count(tnmI
Depth Sample Point Sample Point Sample Point Sample Point Sample Point Sample Point Sample Point Sample Point Sample Point
(ft) B I B2 B3 B4 B5 B6 B7 B8 B9
(0-1) 541 -159 141 141 541 341 -59 341 241
(1-2) 141 141 -59 241 341 -59 -259 421 341
(2-3) 41 141 541 41 -459 341 441 351 -359
(3-4) 141 -259 -59 -459 441 41 141 141 41
(4-5) 541 -159 -59 -359 -59 421
(5-6) 141 41 341 341 241 -59
(6-7) 241 141 641 141 424
(7-8) 141 441 241 341 41
(8-9) -59 -359
(9-10) 41 -4559
(10-11) -459 _ . -4559

(I
Notes:Background was determined to be 4,382 cpm using soil known to be nonimpacted.Bold numbers represent the segment of the sample that was sent to the laboratory for analytical analysis.Instrumentation used for core scans was Ludlum 2221 (SN 117370) with Ludlum44-10 detector (SN 0551).
w:\5427k\rpt\DecomAddendum\SoilCores.xls
(7
Table 4-6
Survey Unit 3 - Land Area North of the Office Building and Soutl, Southwest of the Maintenance Building
Soil Core Scans, Net Gamma Count
(cpm)Depth Sample Point Sample Pointi Sample Point Sample Point Sample Point Sample Point Sample Point Sample Point Sample Point Sample Point Sample Point Sample Point
(ft) BI B2 B3 B4 B5 B6 B7 B8 B9 Al A2 C1
(0-1) -559 231 -59 41 141 41 -159 641 341 341 -159 241
(1-2) 141 -159 141 541 541 41 341 41 -259 241 301
(2-3) 441 41 241 41 241 -159 141 441 271 231
(3-4) 141 441 291 41 141 211 701 641 141
(4-5) 141 141 241 641 -559 41
(5-6) 341 -359 141 41 671 641
(6-7) . 341 -459 241 -159
(7-8) -59 . 341

(
Notes:Background was determined to be 4,382 cpm using soil known to be nonimpacted.Bold numbers represent the segment of the sample that was sent to the laboratory for analytical analysis.Instrumentation used for core scans was Ludlum 2221 (SN 117370) with Ludlum44-10 detector (SN 0551).
w:\5427k\rpt\DecomAddendum\SoilCores.xls
( (
Table 4-7
Survey Unit 4 - Land Area Beneath the Maintenance Building
Soil Core Scans, Net Gamma Count
(cpm)Depth 1 Sample Point Sample Point Sample Point| Sample Point Sample Point Sample Point Sample Point| Sample Point Sample Point
(ft) | Bl B 1IB2 B3 B4 B5 B6 B7 l B8 B9
(0-1) -159 141 -159 -159 651 -59 41 341 -259(1-2) 361 121 141 41 -159 241 171 -59 -59
(2-3) 401 341 341 -559 321 -159 -259 41
(3-4) -35 141 41 -59 341 41 141

C (
Notes:Background was determined to be 4,382 cpm using soil known to be nonimpacted.Bold numbers represent the segment of the sample that was sent to the laboratory for analytical analysis.Instrumentation used for core scans was Ludlum 2221 (SN 117370) with Ludlum 44-10 detector (SN 0551).
w:\5 427k\Vpt\DecomAddendum\SoilCores.xls
(7
Table 4-8Survey Unit 5 - Land Area North of the Warehouse Building
Soil Core Scans, Net Gamma Count
(cpm)
Depth |Sample Point1 Sample Point Sample Point|Sample Point|Sample Point|Sample Point1Sample Point Sample Point Sample Point Sample Point Sample Point[Sample Point Sample Point(ft) | Bl B2 B3 | B4 135 6 | B7 | BS B9 | A2 | D2 | GI 11
(0-1) -459 -159 -159 261 371 211 -59 781 -59 3221 141 741 41(1-2) 161 501 41 311 -159 421 41 -89 561 5661 272 241 321
(2-3) 11 141 211 -159 -159 -159 241 -59 191 601 -159 1441
(3-4) -39 941 141 461 241 141 191 441 341 241 3941(4-5) 311 341 421 141 241 741 141 591 141 -159 741(5-6) 341 441 411 241 241 641 671 511 41(6-7) 481 -59 -359 461 141 641 941 341
(7-8) 141 378 -359 41 241 141 341(8-9) -59 141 41 341(9-10) 241 141 241 141
(10-11) 441 -159 -109
(11-12) . . 441

(
Table 4-9Survey Unit 6 - Land Area Around the Footprint of the Former Smelter Building
Soil Core Scans, Net Gamma Count
(cpm)
|Depth |Sample Point Sample Poin t| Sample Point| Sample Point| Sample Point Sample Point Sample Point| Sample Point| Sample point(ft) | B1 B2 j B3 B4 B5 B6 B7 B8 B9
(0-1) 174 274 424 324 -26 -226 344 694 44
(1-2) 604 -126 374 194 634 134 474 274 264
(2-3) 674 344 74 434 734 -26 374 434 574
(3-4) 344 964 174 174 344 524 744
(4-5) 174 474 534 1064
(5-6) -126 174 264 574
(6-7) 474 574 514(7-8) 174 274 2354
(8-9) -26 674 754
(9-10) 174 574 724
(10-11) 774 174 674(11-12) 74 224
(12-13) 324 464
(13-14) 174 804(14-15) 274 .
Notes:Background was determined to be 4,382 cpm using soil known to be nonimpacted.Bold numbers represent the segment of the sample that was sent to the laboratory for analytical analysis.Instrumentation used for core scans was Ludlum 2221 (SN 117370) with Ludlum 44-10 detector (SN 0551).
w:\5427k\rpt\DecomAddendum\SoilCores.xls
C (

(I (
Notes:Background was determined to be 4,382 cpm using soil known to be nonimpacted.Bold numbers represent the segment of the sample that was sent to the laboratory for analytical analysis.Instrumentation used for core scans was Ludlum 2221 (SN 117370) with Ludlum 44-10 detector (SN 0551).
w:\5427k\rpt\DecomAddendum\SoilCores.xls
(
Table 4-10
Survey Unit 7 - Land Area Beneath the Warehouse Building
Soil Core Scans, Net Gamma Count(enmi
Depth |Sample Point Sample Point Sample Point Sample Point Sample Point Sample Point Sample Point Sample Point Sample Point Sample Point Sample Point Sample Point| Sample Point Sample Point
(.) Bi B2 B3 B4 B5 B6 B7 B8 B9 Cl D2 F2 Hi H2
(0-1) -126 594 4874 344 24 374 174 -126 174 1974 74 374 74 1974
(1-2) 274 374 844 234 544 274 -26 334 734 574 474 434 854
(2-3) 44 474 164 374 374 -26 -126 544 574 464 274 364 374
(3-4) 224 274 -26 624 414 474 174 364 374 174 274 -126
(4-5) 404 274 474 644 74 174 524 574 734 174 374
(5-6) 504 634 674 674 174 464 274 774 374 774 274
(6-7) 674 474 974 -26 -226 274 874 374 -26 174
(7-8) -226 254 424 844 474 574 174
(8-9) 274 424 -156 374
(9-10) 274 74 314 -26
(10-11) 694 374
(11-12) 224
(12-13) -146 _

(
Notes:Background was determined to be 4,382 cpm using soil known to be nonimpacted.Bold numbers represent the segment of the sample that was sent to the laboratory for analytical analysis.Instrumentation used for core scans was Ludlum 2221 (SN 117370) with Ludlum 44-10 detector (SN 0551).
w:\5427k\rpt\DecomAddendum\SoilCores.xis
c
Table 4-11
Survey Unit 8 - Land Area North and East of the Crusher Building
Soil Core Scans, Net Gamma Count
(cpm)Depth |Sample Point Sample Point Sample Point Sample Point Sample PointSample Point Sample Point Sample Point Sample Point Sample Point Sample Point Sample Point
(ift) | B|l B2 j B3 B4 | B5 J B6 j B7 J B8 J B9 Fl | F2 J F3
(0-1) 374 344 1144 374 874 624 174 174 174 16124 1734 1564
(1-2) 274 374 2204 374 2174 374 274 274 274 2624 374 374
(2-3) 434 74 424 354 474 614 864 394 74 274 274 474
(3-4) 274 424 274 -26 274 474 74 174 374 2574 594 374
(4-5) 374 594 664 504 274 174 474 74 674 974 654 -226
(5-6) 694 744 94 374 604 374 274 174 74 374 274
(6-7) 174 174 74 174 1104 474 174 374 474
(7-8) 374 554 374
(8-9) 574
(9-10) 74
(10-11) 274

(
Notes:Background was determined to be 4,382 cpm using soil known to be nonimpacted.Bold numbers represent the segment of the sample that was sent to the laboratory for analytical analysis.Instrumentation used for core scans was Ludlum 2221 (SN 117370) with Ludlum 44-10 detector (SN 0551).
w:\5427k\rpt\DecomAddendum\SoilCores.xls
(
Table 4-12
Survey Unit 9 - Land Area Beneath the Crusher and Crusher Addition Buildings
Soil Core Scans, Net Gamma Count
(cpm)
Depth Sample Point| Sample Point| Sample Point Sample Pointj Sample Point Sample Point Sample Point Sample Pointi Sample Poin
(_ft) B I B2 B3 B4 B5 B6 I B7 B8 t B9
(0-1) 174 274 374 274 2174 514 374 374 474
(1-2) -326 474 2374 184 2614 734 174 274 -226
(2-3) 474 764 1134 224 374 174 74
(3-4) 784 374 274 474 364 464 504
(4-5) 694 694 274 -226 74 274
(5-6) 74 -426 354 -26 74 494
(6-7) 894 174 504 624 374
(7-8) 574 174 474 574
(8-9) -126 334 374
(9-10) 774 274
(10-11) 174 614

Table 4-13Th-232 Analytical Results for Soil Core Samples
Characterization Survey of Land AreasFormer Kaiser Aluminum Specialty Products Facility
Tulsa, Oklahoma
I AnalyticalResults Gr-ss Net Cone. Detection
Sarple Depth Conc. Th-232 Th-232 Uncert. LirnitSaniple Location (ft) (pCilg) (pCig) (+/- pCi/f) (pCi/)
SU - Land Area Beneath the North Extrusion Building1 0-1 5.67E-01 0.OOE+00 3.30E-02 1.03E-012 7-8 2.23E-01 0.OOE+00 2.60E-02 7.20E-023 9-10 7.83E-01 0.OOE+00 8.20E-02 2.80E-014 3-4 1.06E+O0 O.OOE+00 8.20E-02 2.60E-015 3-4 1.03E+00 0.OOE+00 1.02E-01 2.91E-016 2-3 2.10E-01 0.OOE+00 1.80E-02 2.40E-027 7-8 1.03E+00 0.OOE+00 4.1OE-02 1.76E-018 3-4 8.15E-01 0.OOE+00 1.02E-01 3.53E-019 2-3 5.03E+00 3.93E+00 3.32E-01 7.56E-01
Average 1.19E+00 4.37E-O1Std. Deviation 1.47E+00 1.3 1E+00
Min 2.1OE-01 0.OOE+00Max 5.03E+00 3.93E+00
Median 8.1SE-O1 0.OOE+00
SU2 - Land Area North of the laintenance Building and the North Extrusion BuildingI 0-1 1.67E+00 5.70E-01 2.29E-10l 5.16E-012 1-2 9.92E-01 0.00E+00 7.80E-02 3.19E-013 2-3 8.79E-O1 0.00E+00 1.21E-01 5.84E-01
4 1-2 1.30E+00 2.00E-01 2.35E-01 2.94E-015 6-7 7.79E-O1 O.OOE+00 1.21E-01 5.06E-016 0-1 9.95E-O1 O.OOE+00 1.12E-01 4.23E-017 2-3 7.01E-01 0.001E+00 1.00E-O1 4.64E-018 1-2 8.56E-01 0.00E+00 1.61E-01 5.17E-019 6-7 9.24E-O1 O.OOE+00 9.70E-02 4.39E-01
*25 0-1 8.47E+00 7.37E+00 3.84E-01 7.45E-OlAverage 1.76E+00 8.14E-01
Std. Deviation 2.38E+00 2.31E+00Min | 7.01E-01 0.001E+00Max 8.47E+00 7.37E+00
Median 9.58E-01 0.OOE+|00
SU3 - Land Area East of the North Extrusion Building and North of the Off ce Bulding Area1 2-3 8.89E-01 0.OOE+|00 1.87E-01 5.37E-O12 3-4 9.08E-O1 0.OOE+|00 1.49E-01 5.10E-O13 3-4 1.25E+00 1.50E-O1 1.96E-01 5.59E-014 1-2 1.27E+00 1.70E-01 1.56E-01 4.17E-015 1-2 8.22E-O1 O.OOE+00 1.04E-01 3.53E-016 2-3 9.12E-O1 O.OOE+00 1.44E-01 5.58E-017 1-2 8.10E-01 0.00E+00 1. 19E-0l 3.50E-018 0-1 | 8.93E-01 0.OOE+|00 1.35E-O1 3.53E-019 0-1 1.51E+00 4.10E-01 1.04E-01 2.93E-O1
Page 1 of 4

Table 4-13Th-232 Analytical Results for Soil Core Samples
Characterization Survey of Land AreasFormer Kaiser Aluminum Specialty Products Facility
Tulsa, Oklahoma
Analytical
Results Gross Net Conc. DetectionSample Depth Conc. Th-232 Th-232 Uncert. Limit
Sample Location (ft) (pCi/g) (pCi/g) (+/- pCi/g) (pCi/g)
Al 34 | 9.20E-01 0.OOE+00 1.36E-01 3.75E-01A2 _ 34 4 7.37E-01 | O.OOE+00 | 9.7013-02 4.34E-01
C1 5-6 7.36E-01 O.OOE+00 1.15E-01 3.88E-1I*24 0-2 9.57E+00 8.47E+00 1.67E+00 1.30E+00
Average 1.63E+00 4.03E-01Std. Deviation 2.40E+00 2.34E+00
Min 7.36E-01 O.OOE+00Max 9.57E+00 8.47E+00
Median 9.08E-01 O.OOE+00
SU4 -Land Area Beneath the Maintenance Building1 2-3 8.47E-01 O.OOE+00 1.38E-01 4.74E-012 2-3 7.18E-01 O.OOE+00 9.00E-02 3.OOE-013 1-2 8.43E-01 O.OOE+00 1.20E-01 4.86E-014 2-3 7.85E-01 O.OOE+00 1.15E-01 5.09E-015 0-1 5.46E-01 O.OOE+00 5.30E-02 2.16E-016 2-3 8.20E-01 O.OOE+00 8.30E-02 3.8813-017 3-4 9.21E-01 O.OOE+00 8.10E-02 4.9213-01
8 0-1 1.03E+00 O.OOE+00 1.82E-01 5.76E-019 3-4 8.56E-01 O.OOE+00 1.41E-01 5.25E-01
Average 8.18E-01 O.OOE+00Std. Deviation 1.34E-01 O.OOE+00
Min 5.46E-01 O.OOE+00Max 1.03E+00 O.OOE+00
Median 8.43E-01 O.OOE+00
SU5 - Land Area North of the Warehouse Building1 1-2 BDL O.OOE+00 BDL 5.13E-012 1-2 8.95E-01 |O.OOE+00 1.03E-01 5.65E-013 3-4 8.40E-01 O.OOE+00 1.15E-01 5.55E-014 4-5 6.20E-01 O.OOE+00 1.22E-01 4.68E-015 3-4 1.03E+00 O.OOE+00 7.50E-02 4.41E-01
6 11-12 7.54E-01 O.OOE+00 1.OE-01 5.2313-017 4-5 7.63E-01 0.003+00 1.42E-01 3.80E-018 0-1 BDL 0.0013+00 BDL 4.50E-019 4-5 | .11E+00 1.OOE-02 1.46E-01 3.41E-01
A2 1-2 7.44E+01 7.33E+01 1.51E+00 2.21E+00D2 1-2 BDL |O.OOE+00 BDL 4.56E-01GI 0-1 7.20E-01 0.001E+00 1.30E-01 5.34E-01II 3-4 8.11E+01 8.00E+01 1.46E+00 1.50E+00
Average 1.62E+01 1.53E+01Std. Deviation 3.25E+01 3.24E+01
Min 6.20E-01 O.OOE+00Max 8.11E+01 8.00E+01
Median 8.68E-01 0.0013+00
Page 2 of 4

Table 4-13Th-232 Analytical Results for Soil Core Samples
Characterization Survey of Land AreasFormer Kaiser Aluminum Specialty Products Facility
Tulsa, Oklahoma
AnalyticalResults Gross Net Conc. Detection
Sample Depth Conc. Th-232 Th-232 Uncert. Limit
Sample Location (ft) (pCi/g) (pCi/g) (+1- pCi/g) (pCi/g)
SU6-Land Area Around the Footprint of the Former Smelter BuildingI 10-11 1.01E+00 0.OOE+O0 1.27E-01 5.40E-012 34 1.25E+00 1.50E-01 1.22E-01 4.60E-0 13 7-8 2.18E+01 2.07E+01 6.39E-01 1.14E+O00
4 2-3 2.98E+00 1.88E+00 2.03E-01 5.07E-015 4-5 8.30E-01 O.OOE+O0 9.90E-02 2.87E-1O|6 3-4 9.49E-01 O.OOE+00 7.70E-02 4.93E-017 3-4 8.10E-O1 O.OOE+00 1.73E-01 4.80E-01
8 3-4 7.73E01 O.OOE+00 1.05E-01 4.95E-019 2-3 1.55E+00 4.50E-O1 1.1OE-O1 4.7SE-Ol
Average 3.55E+00 2.58E+00Std Deviation 6.88E+00 6.82E+00
Min 7.73E-01 O.OOE+O0Max 2.18E+01 2.07E+01
Median 1.0 1E+O0 O.OOE+O0
SU7 - Land Area Beneath the Warehouse Building1 10-11 7.96E-01 O.OOE+00 9.90E-02 4.22E-0 1
2 5-6 7.87E-1 0.OOE+00 1.20E-01 4.30E-013 0-1 6.SSE+01 6.44E+01 I.45E+00 1.84E+04 5-6 1.19E+00 9.00E-02 1.46E-01 5.61E-015 1-2 3.79E+00 2.69E+00 2.39E-01 7.3213-01
6 3-4 7.58E-O1 0.0013+00 1.22E-01 3.62E-017 3-4 ND 0.OOE+00 ND 4.15E-018 7-8 8.98E-01 0.OOE+O0 1.2413-01 3.96E-019 1-2 1.0213+00 0.OOE+O0 2.17E-01 6.86E-01
C1 0-1 1.92E+01 1.8113+01 5.09E-01 1.0913+00D2 4-5 8.27E-01 O.OOE+00 1.211-01 5.09E-01F2 5-6 5.79E+01 5.68E+01 1.21E+00 1.50E+00H 1 1-2 7.40E-01 0.00E+00 1.19E-01 3.7213-01H2 0-1 IA13E+01 1.32E+01 5.00E-01 8.67E-01*22 0-2 6.11E+00 5.01E+00 2.55E-01 3.34E-01
Average 1.24E+01 1.1 4E+0 1Std. Deviation 2.1713+0I 2.1613+0I
Min 7.40E-01 0.OOE+00Max 6.55E+01 6.4413+01
Median 1.1113+00 4.50E-02
SU8 - Land Area North and East of the Crusher Building1 2-3 1.OOE+00 0.001+00 1.35E-01 5.39E-012 5-6 7.70E-01 0.00E+O0 1.0613-01 4.48E-O13 1-2 2.2713+01 2.1613+01 6.67E-01 1.1713+004 4-5 BDL O.OOE+00 BDL 4.83E-015 1-2 4.26E+01 4.15E+01 8.85E-01 7.92E-016 6-7 1.28E+00 1.80E-01 1.73E-01 5.96E-017 2-3 2.91E+00 1.81E+00 1.95E-01 4.48E-018 7-8 8.8213-01 0.00E+00 1.13E1-01 3.82-01
Page 3 of 4

Table 4-13Th-232 Analytical Results for Soil Core Samples
Characterization Survey of Land AreasFormer Kaiser Aluminum Specialty Products Facility
Tulsa, Oklahoma
AnalyticalResults Gross Net Conc. Detection
SampleDepth Conc. Th-232 Th-232 Uncert. LimitSample Location (ft) (pCi/g) (pCi/g) (+/- pCi/g) (pCi/g)
9 4-5 1.03E+00 0.00E+00 1.19E-01 3.97E-01Fl 0-1 1.33E+02 1.32E+02 2.61E+00 3.02E+00F2 0-1 1.64E+01 1.53E+01 4.51E-01 6.10E-01F3 0-1 1.19E+01 1.08E+01 4.91E-01 6.51E-01*13 1-2 8.63E-01 O.OOE+O0 1.1E-01 2.56E-O1*14 0-1 6.26E+00 5.16E+00 2.5 6E-01 4.60E-0l*15 1-2 1.1lE+0l l .OOE+0l 4.83E-01 6.05E-0l*17 2-3 6.74E-01 0.OOE+0O 1.11E-0l 2.70E-0l*18 0-1 1.33E+00 2.30E-01 8.60E-02 2.01E-O1*19 4-5 5.63E+00 4.53E+00 2.46E-01 5.29E-Ol
Average 1.45E+01 1.35E+01Std. Deviation 3.15E+01 3.14E+01
Min 1.28E-01 O.OOE+00Max 1.33E+02 1.32E+02
Median 2.12E+00 1.02E+00
SU9 - Land Area Beneath the Crusher and the Crusher Addition Buildings1 0-1 5.25E-01 O.OOE+00 1.11E-0l 4.41E-012 6-7 2.17E+00 1.07E+00 1.98E-01 4.28E-013 1-2 3.20E+01 3.09E+01 6.49E-01 5.84E-014 0-1 1.32E+00 2.20E-01 1.59E-01 5.OOE-015 1-2 4.98E+01 4.87E+01 1.22E+00 1.33E+006 1-2 l.00E+00 O.OOE+00 1.41E-01 5.15E-017 6-7 7.90E-01 0.00E+00 1.19E-01 4.23E-018 6-7 5.42E-01 |O.OOE+00 9.20E-02 4.89E-01 9 3-4 7.24E-01 O.OOE+00 9.80E-02 4.61E-01
*16 4-5 6.59E-01 0.OOE+00 6.80E-02 2.82E-01*20 0-2 2.83E-01 O.OOE+00 8.50E-02 3.52E-01*21 0-2 2.69E+00 1.59E+00 1.22E-01 3.98E-01*23 1-2 4.57E+01 4.46E+01 8.51E-01 7.11E-01
Average 1.06E+01 9.78E+00Std. Deviation 1.86E+01 1.84E+01
Min | 2.83E-01 0.001+00Max 4.98E+01 4.87E+01
Median 1.001+00 0.001+00
Notes:1. Background established for the site is 1.1 pCi/g Th-232.2. Sample locations which are denoted with an (*) are samples that were collected during the Additional
Site Characterization Activities dated November 2001.
w:\5427kbpt\decomaddendum\t4-13.xls
Page 4 of 4

Table 4-14Thorium Concentrations of QAIQC Soil Samples
Characterization Survey of Land AreasFormer Kaiser Aluminum Specialty Products Facility
Tulsa, Oklahoma
AnalyticalResults Gross Net Cone. Detection
Sample Depth Cone. Th-232 Th-232 Uncert. Limit
Sample Location (fl) (pCilg) (pCi/g) (+1- pCi/g) (pCi/g)
Background Soil Sam les (1)
Bkg - 001 0-1 7.44E-O1 NIA 9.10E-02 2.95E-01Bkg - 002 1-2 8.97E-01 N/A 1.54E-01 4.70E-01Bkg - 003 2-3 1.24E+00 N/A . 1.34E-01 5.10E-01l
Average 9.60E-0lStd. Deviation 2.54E-01
Min 7.44E-01Max 1.24E+00
Median 8.97E-01
Spike Soil Samples (2)RTP - 001 0-1 5.72E+01 5.61E+01 1.11E+00 9.23E-01RTP -002 0-1 5.98E+01 5.87E+01 1.38E+00 1.67E+00
RTP - 003 0-1 5.92E+01 5.81E+01 1.32E+00 1.13E+00
Average 5.87E+01 5.76E+01
Std. Deviation 1.36E+00 1.36E+00Min 5.72E+01 5.61E+0lMax 5.98E+01 5.87E+01
Median 5.92E+01 5.81E+01
Duplicate Soil Samples (3)(Original #1) PD -004 0-1 5.46E+01 5.35E+01 1.47E+00 1.06E+00
(Duplicate#l)RTP- 001 0-1 5.72E+01 5.61E+O1 1.11E+00 9.23E-01(Original #2) PD -005 0-1 5.92E+O1 5.81E+01 1.66E+00 1.14E+00
(Duplicate #2) RTP -002 0-1 5-98E+01 5.87E+01 1.38E+00 1.67E+00
(Original #3) PD - 006 0-1 5.49E+01 5.38E+01 1.49E+00 1.53E+00(Duplicate #3) RTP - 003 0-1 5.92E+01 5.81E+01 1.32E+00 1.13E+00
Average 575E+01 5.64E+01Std. Deviation 2.29E+ 00 2.29E+00
Min 5.46E+01 5.35E+01Max 5.98E+01 5.872+01
Median 5.82E+01 5.71E+01
Composite Soil Sample Th-232 (4)Com- 001 N/A I 8.03E+00 I 6.93E+00 | 3.68E-01 I 9.43E-1l
Page 1 of 2

Table 4-14Thorium Concentrations of QA/QC Soil Samples
Characterization Survey of Land AreasFormer Kaiser Aluminum Specialty Products Facility
Tulsa, Oklahoma
Composite Soil Sample Ti-230 (4)
AnalyticalResults Gross Net Conc. Detection
Sample Depth Conc. Th-230 Th-230 Uncert. Liit
Sample Location (ft) R(pCi/) (pCi/) (+/- pCi/g) (pci/g)
Com- 001 I N/A I 3.67E+01 I 3.32E+01 I 1.33E+00 | 5.18E-01
Notes:1. Background soil samples were collected from a core sample collected from the nonimpacted land area
in front of the Office Building Area.2. Spike samples were collected from the impacted Retention Pond Area.3. The spike samples that were submitted for analysis were samples that were previously submitted under
the Adjacent Land Remediation Plan.4. The composite sample that was submitted for analysis was comprised of a teaspoon of soil from all of
the core samples that were submitted for analysis under this project.
w:\5427k\zpt'decomaddendum\t4-14.xls
Page 2 of 2