decomposition and accumulation of organic matter in soil
TRANSCRIPT

Uitloop 0 lijn 0 195 mm0 15 mm 0 84 mm10 mm 15 mm 20 mm 5 mm
P de WilligenBH JanssenHIM HeesmansJG ConijnGJ VelthofWJ Chardon
Alterra-rapport 1726 ISSN 1566-7197
Decomposition and accumulation of organic matter in soil comparison of some models
Decomposition and accumulation of organic matter in soil comparison of some models
2 Alterra-rapport 1726
Project code [BO-01-004]
Decomposition and accumulation of organic matter in soil comparison of some models P de Willigen BH Janssen HIM Heesmans JG Conijn GJ Velthof WJ Chardon
Alterra-rapport 1726 Alterra Wageningen 2008
4 Alterra-rapport 1726
ABSTRACT De Willigen P BH Janssen HIM Heesmans JG Conijn GJ Velthof amp WJ Chardon 2008 Decomposition and accumulation of organic matter in soil Comparison of some models Wageningen Alterra Alterra-rapport 1726 73 blz 18 figs 7 tables 67 refs The goal of this report is to present an inventory of models on organic matter transformation as inuse on the WUR institutes Alterra and Plant Research International and to compare the modelswith respect to their basic equations response to environmental conditions and the dynamics ofaccumulation of organic matter Effects on organic matter accumulation by changing temperatureand supply of organic materials are discussed Keywords Animo Century Cesar Minip Nucsam Recafs wheat straw green manure responseto temperature response to water content mean residence time mineralization rate ISSN 1566-7197 This report is available in digital format at wwwalterrawurnl A printed version of the report like all other Alterra publications is available from Cereales Publishersin Wageningen (tel +31 (0) 317 466666) For information about conditions prices and the quickest way of ordering see wwwboombladnlrapportenservice
copy 2008 Alterra PO Box 47 6700 AA Wageningen The Netherlands
Phone + 31 317 480700 fax +31 317 419000 e-mail infoalterrawurnl No part of this publication may be reproduced or published in any form or by any means or storedin a database or retrieval system without the written permission of Alterra Alterra assumes no liability for any losses resulting from the use of the research results orrecommendations in this report [Alterra-rapport 1726082008]
Contents
Preface 7
Summary 9
1 Introduction 11
2 Model description 13 21 Introduction 13 22 Mono-component models 14
221 General description 14 222 MINIPa 14 223 MINIPb 15
23 Multicomponent models 16 231 General description 16 232 CESAR 17 233 The organic matter routine as used in RECAFS and CNGRAS 19 234 ANIMO 20 235 NUCSAM 22 236 CENTURY 23
3 Response to environmental conditions 27 31 Introduction 27 32 Response as calculated by the different models 27
321 MINIPa 27 322 MINIPb 29 323 CESAR 30 324 RECAFS 30 325 ANIMO 32 326 NUCSAM 33 327 CENTURY 33
33 Comparison of response to environmental conditions 34
4 Quantitative comparison of the models 37 41 Introduction 37 42 Parameter values 37
421 MINIPa 37 422 MINIPb 37 423 CESAR 37 424 RECAFS 37 425 ANIMO 38 426 NUCSAM 38 427 CENTURY 39
43 The time course of the overall mineralization coefficient 39 44 Equilibrium values for constant continuous supply of organic matter 40
6 Alterra-rapport 1726
45 Mean residence time 42 46 Time course of organic matter in case of constant continuous supply under
constant conditions 43 47 Change of organic matter supply 43 48 Change of temperature 44
5 Discussion and conclusions 47 51 Plausibility of the models 47 52 Mineralization rates and mean residence time 47 53 Current SOM content in arable land and calculated equilibrium SOM 50 54 Factors affecting SOM content and MRT 52
541 Land-use history 52 542 SOM and soil texture 54
55 Expected changes in SOM 55 56 Conclusions 57
Literature 59
Appendix 1 Application of the Laplace Transformation on a system of linear differential equations 65
Appendix 2 Accumulation of carbon in the soil for constant continous application of one unit of C in fresh organic material 67
Appendix 3 Accumulation of organic matter with time dependent supply Calculations with CENTURY 73
Alterra-rapport 1726 7
Preface
This report was written within the framework of the project ldquoCarbon in soilrdquo (project no 5230985) The project deals with monitoring of the stock of carbon in the soil in the Netherlands One of the goals of the project is to study the changes of soil organic matter content with the help of simulation models and making an inventory of simulation models available as done in this report is a first step to choose an appropriate model Thanks are due to Dr Caroline van de Salm Dr Luc Bonten and Dr Marc van Wijk for their critical and helpful comments
Alterra-rapport 1726 9
Summary
This report presents a comparison of seven models (MINIPa MINIPb CESAR RECAFS ANIMO NUCSAM and CENTURY) of transformation of organic matter added to the soil The models discussed are all in use at Alterra and the Plant Research Institute Except for the CENTURY model all models were developed at WUR The models were classified in two groups mono-component models and mult-component models The basic equations of the models are shown as well as the response to environmental conditions particularly soil temperature and moisture content The build up of soil organic matter (SOM) under constant conditions (temperature 9 ordmC and optimum moisture content) is presented for two types of organic material applied (wheat straw and green manure) The equilibrium values of SOM were calculated except for the model MINIPa which does not reach an equilibrium The ratio equilibrium valueannual supply ranged in case of wheat straw from 27 (ANIMO) to 151 (CENTURY) and in case of green manure from 17 (NUCSAM) to 132 (CENTURY) The half time to reach equilibrium from zero ranged from 7 (NUCSAM) to 64 years (RECAFS) The equilibrium value is proportional to the annual supply and to the reciprocal value of the relative decomposition rate As the latter increases exponentially with temperature the equilibrium value decreases exponentially with temperature The plausibility of the models is judged by comparing the model outcome with data on mean residence time (MRT) and SOM mentioned in literature MRT as calculated by the models was much smaller than values mentioned in literature for five models Only CENTURY and MINIPb have the potential to reach a MRT of 1000 years Some causes of the discrepancy between model and experimental results are discussed The differences can mainly be ascribed to factors that have had an effect on the mineralization rates The major factors are land-use nutrient availability pH and drainage in the past and soil texture Sub-optimum levels of nutrients pH and drainage bring down the mineralization rate Texture plays a dominant role in determining the build up of SOM Clay offers protection of organic matter against decomposition and this probably is one of the most important causes of development of high SOM contents In the Netherlands SOM may increase by about 1 g kg-1 per percent increase of clay Two of the models (CENTURY and RECAFS) take effects of texture into account and CENTURY was able to reproduce the effect of texture quantitatively
Alterra-rapport 1726 11
1 Introduction
Organic matter is an important soil quality indicator and affects biological chemical and physical properties of the soil Therefore it may also strongly affect crop yield (Bauer amp Black 1994) Currently there is a lot of attention for soil organic matter in agricultural and environmental policies in the Netherlands and European Union such as the manure climate and soil policies These policies demand for predictions of changes in soil organic matter contents in the near future at different scenarios The Dutch manure policy (fertilizer act) aims at decreasing the inputs of nitrogen and phosphorus to soils via fertilizer and manure in order to comply with the targets of the Nitrates Directive (Directive 91676EEG) and Water Framework Directive (Directive 200060EC) of the European Union (EU) A consequence of the decreasing inputs of fertilizer and manure is that the input of organic matter to agricultural soils also decreases On the other hand less input of nitrogen may result in smaller crop yields and thereby in less crop residues Insight is required in the effect of the manure policy on the soil organic matter content (Velthof 2005) Serious impact of the current manure policy may be expected on arable land on mineral soils because organic matter contents of these soils are most vulnerable to changes in inputs of fertilizer and manure Grasslands and peat soils have relatively high organic matter contents and are less vulnerable to decreasing inputs of organic matter The time horizon for the manure policy is on a relatively short period of 5 to 10 years Soils are an important stock of carbon Changes in the soil carbon stocks affect the emission of CO2 to the atmosphere Therefore quantitative knowledge about changes in carbon stocks in soils is important for climate policy (httpunfcccint Kuikman et al 2002) Sequestration of carbon in soils has also been promoted as strategy to mitigate greenhouse gases emission in the atmosphere (Janzen 2004) In contrast to the manure policy in the climate policy the focus is not only on arable land but also on grassland peat soils and natural soils The time horizon is longer than that of the manure policy (several decades) The reference year for the climate policy (Kyoto protocol) is the year 1990 Thus changes in carbon stocks in soils must be related to the year 1990 The European Union aims at the protection of soils One of the topics of the Soil Thematic Strategy is the maintenance of soil organic matter (httpeceuropaeuenvironmentsoilindexhtm) It is important to get insight in predicted trends of organic matter in the future at current policy and after implementation of a policy aiming at protecting or increasing soil organic matter contents Models that predict the effect of policy actions on organic matter contents are indispensable The number of existing long-term field experiments is very limited (eg Jenkinson amp Rayner 1977 Wadman amp De Haan 1997) Setting up new
12 Alterra-rapport 1726
experiments is costly and results can only be obtained after a long time (years to decades) Analyses of long-term data of soil analyses of practical farms (Reijneveld amp Oenema 2008) may also provide insight in changes in soil organic matter contents but these data-sets are less useful for predictions for the future especially if management in the future differs from that in the past A number of organic matter models are used in Wageningen University and Research Centre including CESAR (Vleeshouwers amp Verhagen 2001 Vleeshouwers amp Verhagen 2002) MINIP a (Janssen 1984 Janssen 1986) MINIP b (Yang 1996 Yang amp Janssen 2000) ANIMO (Groenendijk et al 2005) NUCSAM (Kros 2002) and RECAFS (Conijn 1995) All models are used for studies to underpin certain policies However it is not known if these models provide similar results and conclusions The times scales of the models are not always the same On the one hand there is the model RECAFS which is meant for one or a couple of growing seasons On the other hand the model CESAR was developed to make predictions on the long run (several decades) The other models are supposed to be valid for periods of 5 to 50 years and they may therefore be considered as most suited for the above mentioned time horizons of 5-10 years (manure policy) up to several decades (climate policy) A study was conducted to describe and compare a few of commonly used organic matter models of WUR The widely used CENTURY model was also tested keeping in mind that this model is meant for longer periods of some centuries as the name already indicates The objectives of the study were (i) to provide a reference for those who are supposed to analyze and predict the possible consequences of EU environmental policies and (ii) to explore model outcomes and to explain the differences among them and (iii) to account for possible differences between model outcomes and reality
Alterra-rapport 1726 13
2 Model description
21 Introduction
The models involved are in use at the institutes Alterra and PRI as a reference we also included a well-known and much used US model CENTURY in the comparison Most of the models mentioned below consider not only C- and N-transformations They are meant for calculations of crop growth leaching and uptake of nutrients acidification of forests soils etc We will discuss here only the part of the models dealing with dynamics of organic matter For convenience the name of the integral model will be used The models involved are 1) MINIP a (Janssen 1984 Janssen 1986) 2) MINIP b (Yang 1996 Yang amp Janssen 2000) 3) CESAR (Vleeshouwers amp Verhagen 2001 Vleeshouwers amp Verhagen 2002) 4) ANIMO (Groenendijk et al 2005) 5) NUCSAM (Kros 2002) 6) RECAFS (Conijn 1995) 7) CENTURY (Parton 1996) The first two can be considered as mono-component models as they distinguish just one organic component The next five are multi-component models where organic matter is supposed to exist of different pools decomposing and transforming each in its own specific way Before starting the discussion it seems good to clarify some of the terms we will use frequently We will employ the terminology given by Baldock(2007) rdquohellipdecomposition refers to the removal of a given carbon substrate and is the sum of mineralisation assimilation and alteration Mineralisation is the release of carbon dioxide from biological respiration Assimilation refers to the retention of substrate carbon by decomposer organisms as they synthesize cellular materials during growth Alteration occurs when the chemical composition of an organic substrate is changed so that the remaining organic carbon is no longer identical to that present in the initial substraterdquo In this report assimilation and alteration usually are combined we use the term adaptation for this combination The decomposition rate coefficients will be denoted with only a numerical subscript ie ki for the i-th component For mineralization and adaptation the subscripts M and A are used respectively so kMi and kAi respectively In Sections 22 and 23 the course of C in organic materials is described upon a single application Section 44 deals with the formation of soil organic carbon (SOC) upon continuous supply of organic materials
14 Alterra-rapport 1726
22 Mono-component models
221 General description
This type of models considers one pool consisting of the material applied and the humusbiomass generated from it The mineralisation of the pool is given by
tCtkdt
dCM ( 1)
where C denotes the carbon in the single pool and kM(t) the mineralisation coefficient which generally is a function of time (t) The solution of (1) with initial condition 00 CCt reads
t
M dxxkCtC0
0 exp (2)
Figure 1 present schematically the decomposition of the organic matter in these type of models
Figure 1 Scheme of transformations within the models MINIPa and MINIPb 222 MINIPa
The model MINIPa is based on the method developed by Janssen (1984 1986) for the calculation of build up of ldquoyoungrdquo soil organic matter where ldquoyoungrdquo means not more than 25 years The attractiveness of the model is that it requires only one input parameter a (the so-called apparent initial age) to characterize the organic material that is added to the soil The time-dependent mineralisation coefficient kM(t) is described as follows
1 mM tabmtk (3)
Substrate Biomass
CO2
Substrate Biomass
CO2
Alterra-rapport 1726 15
where b and m are constants with b = 47 ym and m = 061 and a is the parameter dependent on type of organic matter Substitution of (3) in (2) yields after evaluation of the integral
mm batabCtC exp0 (4) Equation (4) describes the course of C in the applied material and that of the microbial biomass formed The initial age is in the range of 1-16 year for crop residues for organic matter in manure it amounts to 2 - 25 year (Janssen 1984 1986) for compost to 4 year and for humus to 15 - 25 year (Janssen 2002) Equation (4) implies a non-decomposable rest with size
mrest baCC exp0 (5)
In the range of a-values of 1 ndash 25 year this rest amounts to 1 ndash 50 of the initial value This also implies that for a constant annual application no equilibrium value will be reached According to Janssen (2002) MINIPa is meant for periods of 40 to 50 years maximally 223 MINIPb
Yang (1996) showed that fixing b = 47 and m = 06 made MINIPa too rigid Therefore he developed a more flexible equation for the mineralization of different materials and found it could be described quite well by
SRtCC 10 exp (6)
where R (tS-1) and S (dimensionless) denote parameters dependent on type of material and soil There is a good relation between the two parameters R increases with increasing S It holds 0 le S le 1 For S = 0 equation (6) becomes an exponential function (in form identical to CESAR) and for S = 1 C is constant For 0 le S lt 1 there is no non-decomposable rest in contrast to MINIPa So for constant applications and conditions eventually an equilibrium value for the carbon in soil is reached From (6) follows the relative rate of mineralisation
SM tSRtk 1 (7)
1 Note that here we will give all parameters and constants positive values Accordingly m is taken to be positive here
16 Alterra-rapport 1726
MINIPb was calibrated for plant materials with data derived from experiments lasting between 3 months and 20 years It could successfully be applied to analyze the result of farming practices in China over periods of some centuries (Yang 1996 Yang and Janssen 1997) The models MINIPa and MINIPb have in common that log(kM(t)) is linearly related to log(t) as follows from Equations (3) and (7) 23 Multicomponent models
231 General description
Multicomponent models distribute added andor organic matter in the soil over different components each with its own specific decomposition rate The models discussed here all assume first-order decomposition with a constant relative rate coefficient given constant environmental conditions Products of decomposition are carbon dioxide and other components Decomposition mineralization alteration and assimilation can be generally described as follows (Heinen amp De Willigen 2001) If n components are considered then the following differential equation holds for the ith component
nnniiiiiiii CkCkCkCk
dt
dC 1222111 (8)
where ki is the decomposition coefficient of Ci and ji the fraction of the
decomposition of component j which is transferred to component i The adaptation
rate coefficient is thus given by
n
jijiiA kk
1 and the mineralization coefficient by
i
n
jijiAiiM kkkk
1 1
The system of equations can be most concisely written in matrix
notation CkC
dt
d (9)
Here C is the vector with n components and k the matrix of coefficients eg for n=3
333223113
332222112
331221111
1
1
1
kkk
kkk
kkk
k (10)
As kDi and ij are only a function of environmental conditions the differential
equations in (10) are linear These can be solved with the help of the Laplace transformation (Churchill 1972) Details can be found in Appendix 1
Alterra-rapport 1726 17
232 CESAR
This model (Vleeshouwers and Verhagen 2001) is meant for calculations on the long run (several decades) It is essentially a two component model in which two types of organic matter are distinguished fresh organic material (C1) and humusbiomass (C2) For an application of a unit of fresh organic matter the time course is given by
022011
22112
111
0conditions initial With
CCCCt
CkCkdt
dC
Ckdt
dC
MA
(11)
where t is time in years 1k the decomposition rate constant of the fresh material
1Ak the adaptation rate constant of the fresh material and 2Mk the mineralization
rate constant of the humus Figure 2 present schematically the decomposition of the organic matter in CESAR The solution of the system (11) is
tkC
kk
tktkCkC
tkCC
MM
MA202
21
120112
1011
expexpexp
exp
(12)
The fraction of fresh organic material which transforms into humus in one year is called the humification coefficient ch so
1
11
1
011
exp1
orexp
k
khk
htkk
cA
cA
(13)
Figure 2 Scheme of decomposition of organic matter in CESAR The component C1 denotes fresh organic matter C2 the humusbiomass complex
11Ck
111 Ckk A
11 CkA
22C k
2 2 C kM
11Ck
111 Ckk A
11 CkA
22C k
2 2 C kM
18 Alterra-rapport 1726
As it is assumed that the fresh organic material is converted in either carbon dioxide or in humus within one year the value of the decomposition constant should be chosen such that (virtually) all fresh material has disappeared within one year a value of eg 1k = 5 y-1 would do The denominator 1exp1 k in (13) then asymp 1 and
ccA hkhk 511 Figure 3 gives an illustration of the time course of the two
components after an addition of one unit of fresh organic matter It should be mentioned that the description of the model given here is not exactly the same as given by Vleeshouwers and Verhagen (2001) the equations are slightly changed so that these fit in the general equation system (8) The mineralisation coefficient 2Mk is estimated by fitting data pertaining to time
course of organic matter content in fallow fields of three long-term experiments in the Netherlands (Kortleven1963) England (Jenkinson 1977) and Denmark (Dam Kofoed 1982) to the model of Yang The value of the mineralisation coefficient in the second year was considered to be representative for the course of mineralisation after the second year To quote Vleeshouwers en Verhagen (2001)rdquoIn CESAR organic material in the soil older than one year is considered soil organic matter In the second year all age classes of soil organic matter are present without the decomposition rate being affected by the presence of easily decomposable crop
0
01
02
03
04
05
06
07
08
09
1
0 1 2 3 4 5
Time year
C1
C2
Cto
t
C1 C2 Ctot Figure 3 Time course of the fractions C1 C2 and Ctot according to CESAR Parameters k1= 5 y-1 kA2 = 156 a-1 C10 = 1 C20 =0 kM2 = 0027 y-1 (at 9oC)
residues which remain in the soil shorter than one year The value in the second year was considered most apt rdquo The reference value was taken to be the average value of the fit of the three experiments its value amounts to 0029 y-1 (at 10 ordm C) The values for the humification coefficient were taken from literature For crop residues for instance these are in the range 021-033
Alterra-rapport 1726 19
233 The organic matter routine as used in RECAFS and CNGRAS
This sub-model is based on the theory and concepts as described by Berendse et al (1987 1989) Conijn (1995) implemented the module in RECAFS a model meant to describe the nutrient cycle and competition for nutrients in agroforestry systems More recently it is also a part of a grassland management model (CNGRAS Conijn 2005) We will for convenience address the module with the name RECAFS In the module the organic matter in soil is distributed over three components Each component contains dead and living (microbial) biomass There is no exchange of organic matter between the three components Within a component there is conversion of dead organic material into microbial biomass and carbon dioxide only analogous to the way MINIPa and MINIPb deal with transformation So the matrix of coefficientsrsquo reads
333
222
111
100
010
001
k
k
k
k (14)
11Ck
11111 Ck
1111 Ck
Figure 4 Decompostion scheme of organic matter in RECAFS
20 Alterra-rapport 1726
Figure 5 Distribution of added organic matter over the three fractions in RECAFS as a function of the NC ratio of the material
At reference temperature (11 ˚C) and moisture status (water filled pore space is 06) the values of the coefficients k1 k2 and k3 are 365 299 and 0031 y-1 respectively and those of the efficiencies ε11 = ε22 = 03 en ε33 = 035 Any addition of organic matter (eg plant residue manure) is distributed over the three components on basis of their NC ratio as shown in Figure 5 For a given initial distribution and constant conditions the time course of component i is given by
tkCC iiiii 1exp0 (15)
and that of the total carbon by
3
10 1exp
iiiiitot tkCC (16)
234 ANIMO
ANIMO (Groenendijk et al 2005) as the majority of models discussed here is a model which deals with nutrient cycles in general it accordingly contains modules on nutrient uptake plant growth soil chemistry and biology etc We will discuss here only the organic matter module and denote it by the name ANIMO In ANIMO the organic matter added to the soil is assumed to consist of two fractions which partly change into carbon dioxide and partly into humusbiomass
0
02
04
06
08
1
0 004 008 012 016 02
NC
Fra
ctio
ns
f1
f2
f3
Alterra-rapport 1726 21
1113 Ck
2223 Ck
11Ck
11131 Ck
22Ck
22231 Ck
33 CkM
1113 Ck
2223 Ck
11Ck
11131 Ck
22Ck
22231 Ck
33 CkM
Figure 6 Decompostion scheme of organic matter in ANIMO
The matrix of coefficients reads
3223113
2
1
00
00
Mkkk
k
k
k (17)
and the corresponding decomposition scheme is found in Figure 6 The values of the parameters are calculated with MINIPa For a particular material characterized by an apparent age a a data set is produced by using equation(7) and by fitting the parameters of the relevant equation (equation (67) in Groenendijk et al 2005) and in a slightly different form given in section 61) to this data set The values of the coefficients k1 k2 k3 are fixed at 2 02 en 002 y-1 respectively and it is assumed that ε13= ε23= ε so it suffices to fit p (the fraction of the first component) and ε only In doing so it was found that a good relation exists between p and ε and the apparent age a
07050109600673000660
4767169040139400105023
23
aaa
aaap
(18)
For a given initial distribution the time course of each fraction is found as
23
32022
13
310113033
2022
1011
expexp
expexpexp
expexp
kk
tktkCkkk
tktkCktkCC
tkCCtkCC
M
M
M
MM
(19)
22 Alterra-rapport 1726
235 NUCSAM
NUCSAM (Kros 2002) is a mechanistic model meant for application on plot scale (eg 100 x100 m2) for relative short time The model was designed to calculate the nutrient cycle and soil acidification caused by nitrogen deposition in forests The organic matter module is a small but important part of the model which is mainly aimed at a quantitative description of bio-geochemical processes The organic matter module distinguishes three fractions in soil litter (L) fermented material (F) and humus (H) It is possible (Groenenberg et al 1998) contrary to the fractions postulated in the other multi-component models discussed to determine the fractions experimentally The litter fraction is decomposed into carbon dioxide and organic solutes transformed into fermented material and replenished by dead leaves and roots The fermented fraction is converted to carbon dioxide and humus The last fraction is only mineralized into carbon dioxide So where in ANIMO there are two parallel connected transformations in NUCSAM the transformations are connected in series The rate equations read in their original form
HkFkdt
dH
FkFkLkdt
dF
LkLkdt
dL
HmiFtr
FtrFmiLtr
LtrLmi
(20)
where ktr en kmi are alteration and mineralisation constants in the notation of Kros (2002) The decomposition constants read in the notation of (8)
humiM
fmtrfmmi
lttrltmi
kkk
kkkkkk
33
2
1
where subscripts lt fm and hu refer to litter fermented material and humus respectively
Thus 0ii ltmilttr
lttr
kk
k
12 and
fmmifmtr
fmtr
kk
k
23
The matrix of coefficients for NUCSAM accordingly is
3223
2112
1
0
0
00
kk
kk
k
k (21)
Alterra-rapport 1726 23
The decomposition scheme is depicted in Figure 7
11Ck
11121 Ck
1112 Ck22Ck
22231 Ck
2223 Ck 33Ck11Ck
11121 Ck
1112 Ck22Ck
22231 Ck
2223 Ck 33Ck
Figure 7 Decomposition scheme of organic matter in NUCSAM
Kros (2002) found the following values of the parameters by calibration of the total model on data kmiL = 029 y-1 ktrL = 037 y-1 kmiF = 0046 y-1 ktrF = 0013 y-1 kmiH = 0005 y-1 It follows that k1 = 066 y-1 k2 = 0059 y-1 k3 = 0005 y-1 ε12 = 056 ε23 = 022 The values for the mineralisation coefficients apply to a temperature of 10ordm C a pH of 6 and optimum moisture status For a given initial distribution the time course of each fraction is found as
2313
3
3212
2
3121
101232121
23
32022323033
12
21011212022
1011
expexpexp
expexpexp
expexpexp
exp
kkkk
t-k
kkkk
t-k
kkkk
t-kCkk
kk
t-k - t-kCk t-kC C
kk
t-k - t-kCk t-kC C
t-k CC
(22)
236 CENTURY
CENTURY is a model for simulation of organic matter in soil (Parton et al 1987) It simulates the dynamics of C N P and S on a time scale of centuries to millennia Soil organic matter is distributed over three components active (A) slow (S) and passive (P) Fresh organic matter (plant residue manure) is added to the surface andor below ground and consists of a structural and a metabolic fraction The size of the metabolic fraction is a function of the ligninnitrogen content of the material
NLfM 0180850 (23) where fM is the fraction metabolic and LN the ligninnitrogen ratio
24 Alterra-rapport 1726
Table 1 Components of organic matter in CENTURY
Plant residue
Structural Lignin Rest Metabolic
C1
C2
C3
Soil Organic matter Active Slow Passive
C4
C5
C6 In total there are seven components (surface structural surface metabolic below ground structural below ground metabolic and active slow and passive soil organic matter) and thus seven conversion coefficients In our discussion we will leave out the organic matter in the surface layer as in the other models such a distinction has not been made This reduces the system to five components and five conversion coefficients The component lsquostructuralrsquo consists of two fractions lignin and rest Both are decomposed with the same relative rate but the lignin is transferred to the slow pool and the rest to the active pool For convenience we will consider lignin and the rest as two different components so ldquostructuralrdquo is not a component as such and there are six components in total Table 1 gives a survey The matrix of coefficients reads
6565464
5454151
6465454343242
3
2
1
000
000
0
00000
00000
00000
kkk
kkk
kkkkk
k
k
k
(24)
The actual values of the coefficients k1 and k2 depend on the fraction lignin in the structural material
sref Lkk 3exp11 (25)
where k1 is the actual value and LS is the fraction lignin in the structural material The correction of k2 is done in an identical way The flow of C in the model is shown in Figure 8
Alterra-rapport 1726 25
Figure 8 Flow of C in Century For explanation see text sections 236 and 427
Alterra-rapport 1726 27
3 Response to environmental conditions
31 Introduction
All microbial activities are influenced by environmental conditions Of these temperature and moisture content play the most important role but also other factors eg oxygen availability soil texture influence the rates of conversion In the models discussed here the relative rate coefficients are multiplied by dimensionless variables each of which is a function of a certain environmental variable Interaction between factors is assumed to be multiplicative So in general a relative rate coefficient is related to its value at reference conditions by
n
iirefact ekk
1
(26)
All of the models consider temperature and moisture response we will therefore focus on temperature and moisture effects but also will give attention to effect of soil texture where it is taken into account in the case of RECAFS and CENTURY 32 Response as calculated by the different models
321 MINIPa
In MINIPa the rate coefficient kM decreases over time this has consequences for the ratio of the rates at different temperatures Janssen (1986 1996) proposed to correct the time with a factor fT depending on temperature
))((exp0mm
T atfabCC (27) In this way care is taken that the amount of mineralization at time t at the reference temperature (where fT is 1) is also obtained at time tfT for other temperatures It follows that the rate coefficient kM(t) at any temperature is given by
1 mTTM tfabmftk (28)
Or
TmT
m
m
mTT
refM
MT f
tfa
ta
ta
tfaf
tk
tke
1
1
1
1
(29)
where kMref(t) is the rate coefficient when eT is 1 ie at the reference temperature of 9 ordmC So the ratio between the rate coefficient at any temperature and that at reference temperature depends on time and via the parameter a on the type of material
28 Alterra-rapport 1726
001
01
1
10
0 2 4 6 8 10 12 14
Time year
k M
T = 4
T = 9
T = 18
Figure 9 Time course of KM at three temperatures Note the ordinate has logarithmic scale to better show the differences between the curves
Equation (28) is graphically presented in Figure 9 It shows that kM(t) decreases faster with time at high than at low temperature As a consequence eT increases over time at low temperature and decreases over time at high temperature The relation between the correction factor (fT ) and temperature is given by (Yang 1996)
T
T
TT
T
f TT
C 274
C 27C 92
C 9 C 110
1C 10
0
0099
00
0
(31)
The function for fT between 9 and 270C was derived from decomposition experiments with ryegrass carried out in England as well as in Nigeria (Jenkinson and Ayanaba 1977) The period considered was 25 years in Nigeria and 10 years in England The decomposition constant in Nigeria (261 0C) was four times as high as the decomposition constant in England (890C) So eT for MINIPa would be simply equal to fT if kM(t) measured over a period of (fT times t) would be compared with kMref measured over a period t From Jenkinson and Ayanabe (1977) it follows that at those points in (mineralization) time the remaining substrates have a same composition and an equal resistance to decomposition at both temperatures
Alterra-rapport 1726 29
Because eT of MINIPa depends on time it is not useful to compare this eT with eT values of other models The correction factor for moisture content eW has the form (BH Janssen pers comm)
WFPSWFPS
WFPS
WFPSWFPSWFPS
WFPSWFPS
WFPSWFPSWFPS
WFPS
e wpwp
wp
wpwp
w
07110701
701
70051
50050150
050
050
(32)
WFPS denotes the ldquowater filled pore spacerdquo the ratio between actual and saturated moisture content
satWFPS
(33)
The values of eW as given above are derived from Alexander (1961) but these have never been put to the test In case the values of both ew and eT deviate from 1 the best option likely is to multiply the two but again no experimental evidence is available (BH Janssen pers comm) 322 MINIPb
Here the time is corrected in a similar way as in MINIPa viz by multiplication by a temperature dependent factor
ST tfRCC 1
0 exp (34) The relation between the correction factor (fT) and temperature is the same as shown for MINIPa The rate coefficient now is
SSTTM tRfSftk 1 (35)
or
ST
refM
MT f
tk
tke 1
(35)
30 Alterra-rapport 1726
So contrary to the situation in MINIPa the ratio is independent of time but still a function (via S) of the material The correction for moisture content is dealt with in the same way as in MINIPa 323 CESAR
Here only the influence of temperature and moisture content are taken into account
mTrefact eekk (36)
where the temperature response eT increases or decreases by a factor two with a temperature change of 10 degrees with respect to the reference temperature (10 ordmC)
102
refTT
Te (37) The response to moisture content is given by
2
1
fcwpcr
crwpwpcr
wpw
crw
e
e
(38)
where θ is the moisture content θwp the moisture content at wilting point and θfc the moisture content at field capacity 324 RECAFS
As in the preceding models the rate coefficients are a function of temperature and moisture content
Alterra-rapport 1726 31
00
05
10
15
20
25
30
35
40
45
50
0 5 10 15 20
Temperature C
e Ti
Fraction 1 Fraction 2 Fraction3 Figure 10 Temperature response for the three fractions distinguished in RECAFS
The temperature response is of the form (Bril et al 1994)
4
2
3
1
1 a
a
TTa
Tae
(39)
The parameters ai have different values for the three fractions distinguished Figure 10 shows the response for the three fractions The responses are quite similar up to a temperature of 15 ordmC The reaction to the moistureaeration status is governed by the water filled pore space and is in contrast to the temperature response identical for the three fractions RECAFS takes the influence of texture into account the parameters k2 and k3 decrease with increasing clay content as depicted in Figure 11
32 Alterra-rapport 1726
0
01
02
03
04
05
06
07
08
09
1
0 20 40 60 80
clay
ec
lay
k2
k3
Figure 11 Influence of clay content on the rate constants of RECAFS
325 ANIMO
In this model the rate coefficients are corrected for a series of environmental factors reflecting the effect of aeration (eae) moisture content (eθ) temperature (eT) and pH (epH) and in case of humus also a factor which depends on depth (eZ)
refZpHTae keeeeek (40)
There are two options to calculate the aeration factor The first (original) is quite complicated and will not be considered here Details can be found in Groenendijk et al (2005) page 75-82 The second uses the water filled pore space to calculate eae in the following fashion
crit
critae
WFPSWFPSWFPSaWFPSaa
WFPSWFPSWFPS
WFPSe
2210
4
2
91
6 (41)
where WFPScrit is a critical value The parameters a0 ndash a2 are calculated by requiring that eae and its derivative with respect to WFPS are continuous for WFPS = WFPScrit
A third condition is the requirement that at the point WFPS = 1 (water saturated soil) eae equals the relative decomposition rate of organic matter at saturation (kanae)
Alterra-rapport 1726 33
anaekaaa 210 (42) The value of kanae is in the range 0001 ndash 01 (Groenendijk pers Comm) The temperature response is described with an Arrhenius equation
273
1
273
10009-exp
refT TT
e (43)
326 NUCSAM
The rate coefficients are corrected for temperature moisture and pH effect The temperature response is
1010
refTT
T Qe
(44) where Q10 (value 16)is the relative increase at a temperature rise of 10 degrees and Tref a reference temperature (10 ordmC) Effect of moisture availability is given as a function of the mean ground water table in spring (MSW in m)
521524504log
250250
MSWMSWMSW
MSWew (45)
327 CENTURY
Here only temperature and moisture effects are dealt with The calculation of the temperature response depends on the time step considered When the calculation is done for a time step of one day then
4150310arctan729
7511
30
TTg
g
TgeT
(46)
For a time step of one month
]070exp[1250 TeT (47)
34 Alterra-rapport 1726
The relative moisture content determines the response to moisture status It is defined as
WPFC
WPwr
(48)
where θ is the actual moisture content θWP that at wilting point and θFC that at field capacity The moisture response is given by
ww r
e6exp41
1
(49)
33 Comparison of response to environmental conditions
As all models consider a temperature and a moisture content response these can be compared Figure 12 gives the comparison of the response to temperature of the models As said before the MINIPa response of temperature (eT) depends on time (Section 321) Hence it only makes sense to compare it with the eT of the other models at equal mineralized fractions The form of the curves is more or less similar but the actual values differ considerably as Table 2 shows The responses of Cesar and Century almost coincide This can be explained by rewriting the response of Cesar and remembering that refT is 10 C
2
0690exp
2lnexp
2ln10
exp2ln
10exp2 10 T
TTT
e ref
TT
T
ref
Comparing this expression with (29) one sees that both are almost identical when the response is divided by that at a temperature of 9 C as then the constant factor (12 and 0125 respectively) cancels in both equations
Alterra-rapport 1726 35
0
05
1
15
2
25
3
35
4
0 5 10 15 20
Temperature ˚C
eT
CESAR MINIPa MINIP-b ANIMO NUCSAM CENTURY RECAFS
Figure 12 Temperature response of the different models The results for MINIPa are obtained for equal mineralized fractions)
Table 2 Values of the temperature response for three temperatures The results for MINIPa and MINIPb pertain to wheat straw
MINIPa 1 MINIPb CESAR RECAFS ANIMO NUCSAM CENTURY
T=5ordmC 06 084 0756 036 063 083 0756
T=10ordmC 108 103 107 120 112 105 107
T=15ordmC 159 117 152 238 194 133 152
1 At equal mineralized fractions (Section 321)
36 Alterra-rapport 1726
Figure 13 compares the response to soil moisture content the model NUCSAM is an exception as it calculates the response from the mean ground water table depth in spring (see Eq 49) so its response is absent from Figure 13 The value of the relative decomposition rate at saturation (kanae) in the figure is 01 The calculations of Figure 13 pertain to a sandy soil (Sand B1) from the Staring series (Woumlsten et al 2001) Field capacity was taken as the water content at a pressure head -100 cm and wilting point that at -16000 cm The corresponding values for the water content were 0255 and 003 respectively Table 3 gives the response for three values of water content
0
01
02
03
04
05
06
07
08
09
1
000 005 010 015 020 025 030 035 040 045
Moisture content
e w
CESAR MINIP-a and -b RECAFS ANIMO CENTURY
Figure 13 Response to moisture content for the different models
Table 3 Values of the moisture content response for three moisture contents
MINIP ab CESAR RECAFS ANIMO CENTURY
θ = 005 0153 018 0091 008 0300
θ = 01 0409 062 0398 0316 0618
θ = 015 0666 100 0673 0644 086
At high water content decomposition of organic substrates is not limited by lack of water but by lack of aeration The models MINIPa and b RECAFS and ANIMO take this into account implicitly ie the moisture response decreases with water content after an optimum value (see Eq 36 and figure 3) For ANIMO WFPScrit was given the value 08 (Piet Groenendijk pers comm) and kanae the value 020
Alterra-rapport 1726 37
4 Quantitative comparison of the models
41 Introduction
We will discuss here different aspects of the development of organic matter in soil according to the different models In doing so we restrict ourselves to two types of plant residue viz wheat straw and green manure The conditions are constant temperature is 9 ordmC and other environmental parameters are at their optimum value The calculations pertain to a soil with texture sand 42 silt 50 and clay 8 A soil with this texture is in the Dutch system of soil classification positioned on the boundary between sandy and loamy soils We will use here the term ldquosandy soilrdquo The model MINIPa is not included in the comparison sections 44 45 and 46 as the emphasis here is on equilibrium which is not reached by MINIPa Moreover long term development will be discussed and MINIPa is should not be used when for when the term (a + t) gt 25 year 42 Parameter values
421 MINIPa
This model has only one parameter the apparent age a see Equation (5) According to Velthof (pers comm) a of straw amounts to 126 y and of green manure 113 y 422 MINIPb
This model has two parameters R and S According to Yang (1996 Table 61) for straw R = 111 y-034 S = 066 and for green manure R = 139 y-036 S = 064 423 CESAR
Vleeshouwers amp Verhagen (2001) assume one value for kM2 independent of type of material kM2 (T=9˚C) = 0027 y1 The coefficient of humification in case of straw amounts to 031 They do not mention a value for green manure here it is assumed that the coefficient of humification of green manure equals that of vegetables 023 424 RECAFS
The values of the coefficients of decomposition k1 k2 en k3 at a temperature of 9 ˚C amount to 393 302 and 00214 y1 respectively The clay content of 8 leads to a
38 Alterra-rapport 1726
eclay of 0877 for k2 and 0755 for k3 The final values are thus found as 393 265 and 00162 The distribution of the added carbon over the three fractions postulated in this model depends on the NC ratio (see Figure 2) For straw with a CN ratio of 47 and hence a NC of 0022 (Velthof pers comm) the fractional distribution is 0141 0784 0075 and for green manure (CN = 11 NC = 0091) 0390 0558 00511 The efficiencies are independent of the type of material ε11 = ε22 = 03 en ε33 = 035 425 ANIMO
As mentioned before the values of the coefficients k1 k2 k3 are fixed at 2 02 en 002 y1 respectively Moreover the two efficiencies are assumed to be identical The added material consists of two components The fraction assigned to the first component and the efficiency are both functions of the apparent age of the material as used in MINIPa (see paragraph 422) Substitution of the two values 126 (straw) and 113 (green manure) in Equation (21) yields p = 0807 and ε = 0026 for straw and p = 0859 and ε = 0023 for green manure 426 NUCSAM
This model is designed for forest soils and the parameter values hold for these soils So the values cannot be applied as such for the materials (straw and green manure) used here We therefore constructed a data set of time course of the decomposition of straw and green manure with MINIPb and fitted Equation (25) MINIPb was used for this purpose because its parameter values for straw and green manure had been derived from a great number of observations (Yang 1996 Table 61) The parameters obtained for NUCSAM are found in Table 4
Table 4 Fitted values for the parameters of the NUCSAM model
Parameter Value Dimension STRAW
k1 489 y-1 k2 0492 y-1 k3 00680 y-1 ε12 0406 - ε23 0360 -
GREEN MANURE
k1 540 y-1
k2 0603 y-1
k3 0103 y-1
ε12 0338 -
ε23 0282 -
Alterra-rapport 1726 39
427 CENTURY
According to Paustian et al (1992) the lignin content (p1) of wheat straw is 015 and its N-content 0012 so the ratio LN = 125 According to (26) the fraction metabolic (p3) is 0625 and the fraction rest (p2) is 1 ndash 015 ndash 0625 = 0225 To calculate the effect of lignin on the rate coefficient (k1 ) of structural material the lignin content with respect to structural material should be used this ratio is 015(1 ndash 0625) = 04 The rate coefficient should thus be corrected with a factor exp(-3004) = 03 For green manure the lignin content is 006 and the nitrogen content 0036 so by a similar calculation as above one finds p2 = 012 and p3 = 082 whereas the lignin content of the structural material is found as 006(1 ndash 082) = 033 which leads to a correction factor of 0368 Some of the parameters (k4 ε45 ε46 ε54 ε56) depend on the sand and clay content of the soil (see Heesmans and de Willigen for more details) The parameter values are found in Table 5 As a reference the standard values are also given these pertain to a temperature of 9 ordm C and a soil consisting of pure sand
Table 5 Parameter values of CENTURY for straw and green manure
Parameter Straw Green manure Standard values Dimensionk1 0346 0423 115 y-1
k3 434 434 434 y-1 k4 0968 0968 171 y-1 k5 00470 00470 00469 y-1 k6 000106 000106 000106 y-1 ε15 07 07 - ε24 045 045 045 - ε34 045 045 045 - ε45 0539 0539 0147 - ε46 00056 00056 0003 - ε54 045 045 045 - ε56 0003 0003 0003 - ε64 045 045 045 - p1 0150 006 p2 0225 012 p3 0625 082 43 The time course of the overall mineralization coefficient
Organic matter consists of a continuum of materials each with its own resistance against microbial attack (Jenkinson and Rayner 1977) To approximate the overall mineralisation rate one approach is to assume that the mineralisation coefficient is changing (decreasing) with time as done in the models MINIPa and MINIPb A more common approach is to assume that the material consists of various components each decomposing with a constant relative decomposition rate The overall rate then changes because the composition of the material changes
40 Alterra-rapport 1726
The relative rate is for a material with n components calculated as
n
iin
ii
M Cdt
d
Ck
1
1
1 (50)
In Figure 14 the time course of the overall relative mineralization rate of wheat straw at 9oC is shown
0001
001
01
1
10
0 2 4 6 8 10 12 14 16 18 20
Time years
k M y
-1
MINIP-a MINIP-b CESAR RECAFS ANIMO NUCSAM CENTURY Figure 14 The time course of relative mineralization rate of total organic C (wheat straw) for the different models Note the logarithmic ordinate
44 Equilibrium values for constant continuous supply of organic
matter
Equilibrium values (CE) of accumulated organic carbon for a continuous supply of wheat straw and green manure have been calculated for the considered models with the formulas given in Appendix 2 and the parameters mentioned in section 42 In all cases the temperature was set at at 9oC The results are given in Table 6 The values are expressed with respect to the annual input eg in case of the model CESAR the ultimate value of carbon in the soil is 118 times the annual input of wheat straw and 88 times that of green manure (Table 6) It may be questioned whether the models can be used for the calculation of CE Only the models CESAR and CENTURY have been developed for longer periods (Section 1) The parameters of the other models have been calibrated over periods of not more than 25 years The consequence likely is that the values of CE in Table 6 are too low This point is further discussed in Section 53
Alterra-rapport 1726 41
Table 6 Equilibrium values (CE) (with respect to annual supply) found with the models the soil texture was 42 sand 8 clay and 50 silt (only relevant for CENTURY and RECAFS) The meaning of C(1) SOC1a kM1a and MRT1a are explained in Section 52
Model Material Fraction CE C(1) SOC1a kM1a MRT1a
MINIPa na MINIP-b Straw 410 0448 365 0122 816 Green Manure 183 0375 145 0258 388 CESAR Straw 118 0446 1131 0039 25 Green Manure 877 0382 8394 0045 22 RECAFS Straw 1 0005 2 037 3 539 Total 755 0442 711 0062 161 Green Manure 1 0014 2 0263 3 367 Total 517 0323 485 0067 150 ANIMO Straw 1 0404 2 0964 3 130 Total 267 0536 213 0251 398 Green Manure 1 0430 2 0703 3 1153 Total 229 0510 178 0287 348 NUCSAM Straw 1 0204 2 0825 3 215 Total 318 0488 269 0181 551 Green Manure 1 0560 2 0928 3 0185 Total 167 0416 126 0331 302 CENTURY Straw 1 055 2 060 3 0158 4 0589 5 878 6 445 Total 151 0656 145 0045 221 Green Manure 1 0149 2 0277 3 0191 4 0605 5 762 6 435 Total 132 0591 126 0046 213
42 Alterra-rapport 1726
45 Mean residence time
In Section 52 the mean residence time (MRT) as measured in soil samples is compared with the CE values calculated in Table 6 Mean residence time (MRT) is defined as the time to replace the equilibrium amount of soil C (CE) by the (annual) supply (A) So if A is expressed in g m-2 y-1 and CE is expressed in g m-2 the residence time is given by MRT = CEA expressed in a (years) Because in Table 6 the equilibrium value CE is given with respect to unit supply rate MRT is numerically equal to this CE value One can also express MRT in terms of the overall k value corresponding to the equilibrium value According to (50)
n
iiM
n
ii CkC
dt
d
11
So that at equilibrium
MEEM
n
iEiM k
ACACkCk
or
1 which leads to
MRT = 1 Mk
0
2
4
6
8
10
12
14
16
18
0 20 40 60 80 100
Time year
SO
C g
kg
-1
MINIP-a MINIP-b CESAR RECAFS ANIMO NUCSAM CENTURY
Figure 15 Time course of soil organic C (SOC) for a continuous supply of 147 g kg-1 y-1 of C in wheat straw Temperature 9ordmC texture 42 sand 8 clay 50 silt
Alterra-rapport 1726 43
46 Time course of organic matter in case of constant continuous supply under constant conditions
In appendix 2 the solutions for this case are given The time course of organic C is given in Figure 15 Initial value of organic C-components were set at zero The supply is 8500 kg ha-1 y-1 of dry organic matter ie the residues of a winter wheat crop (Velthof pers Comm) With a plow layer of 20 cm and a bulk density of 1300 kg m-3 this means a supply rate of 327 g kg-1 y-1 Given a C fraction of 045 in straw organic matte the supply rate of wheat C is 147 g kg-1 y-1 If this value is multiplied by the value for total in Table 6 one obtains the absolute values in g C per kg soil For clarity these are given in Table 7 There appears considerable difference between the models reflecting the differences in the overall relative decomposition coefficient discussed in section 43 and shown in Figure 9 The time course can be characterized by a half-value time ie the time required to reach half of the equilibrium value These are given in Table 7
Table 7 Values of half time and EC of the models Wheat straw is annually supplied at a rate of 8500 kg ha-1 Temperature is 9oC texture 42 sand 8 clay 50 silt
Model Half time (year) Equilibrium g C per kg soilMINIP-b 12 603 CESAR 26 174 RECAFS 64 121 ANIMO 8 392 NUCSAM 7 468 CENTURY 46 222 Figure 14 shows that k of total C decreases much sharper in Recafs than in the other models which explains why the half life time of RECAFS has such an extreme position in Table 7 47 Change of organic matter supply
When the supply of organic C is changed the equilibrium value changes proportional to the new supply ie if the supply is halved the new equilibrium value is half the old value Figure 1 shows the time course of soil organic matter (SOM) in the soil for the situation that there is no more supply of organic matter after the equilibrium value has been reached for MINIPb and CENTURY The three fractions of soil organic matter of the latter model decrease as governed by their decomposition constants So the active fraction (almost) disappears first followed by the slow fraction whereas the passive fraction decreases very slowly The time to reach half of the initial value of the total C (tfrac12) is (Table 7) 46 year tfrac14 is 185 years and t⅛ more than 500 years The half time for the passive fraction is ndashln(05)0001 = 690 years The half time of the total C will tend to this value in due course So the alarming initial rapid decrease of soil organic matter is followed by a much slower decline thereafter For MINIPb the half time is 12 years tfrac14 is 40 years t⅛ 50 ndash 60 years so organic matter is disappearing
44 Alterra-rapport 1726
in a relatively much faster rate The absolute losses of SOC (in g kg-1) however as calculated by CENTURY are greater than as calculated by MINIPb
0
2
4
6
8
10
12
14
16
18
20
0 100 200 300 400 500
Time years
SO
C g
kg
-1
Active Slow Passive Ctot MINIPb
Figure 16 Decrease of SOC of the three components of CENTURY and the single component of MINIPb when after reaching equilibrium input of carbon is zero Temperature is 9oC texture 42 sand 8 clay 50 silt
48 Change of temperature
In chapter 3 the response to environmental conditions has been discussed In general at least within the temperature range considered here the values of the decomposition rate coefficients change in an exponential fashion with increase of temperature (Figure 12) This obviously has consequences for the time dynamics of the development of organic C in the soil as well as for the equilibrium values To start with the latter for the multi-component models the equilibrium values are proportional to the reciprocal values of the decomposition coefficients (eg see Equation (A2-19 a-f) so they decrease with temperature in an exponential fashion For MINIPb the effect of temperature on equilibrium value can be found as
SS
f
AR
SS
RfACT
SSS
TE
11
1
11
11
1
1
11
So it appears that in the case of MINIPb equilibrium is also proportional to the reciprocal value of the temperature response
Alterra-rapport 1726 45
When the supply is halved the half time to reach the new equilibrium value decreases with higher temperature In case of CENTURY for instance this time amounts to 40 years at a temperature of 11 ordmC compared to 46 years (Table 7) at 9 ordmC
Alterra-rapport 1726 47
5 Discussion and conclusions
51 Plausibility of the models
There are obviously several ways to compare models One way is to run the models for a given data set and compare their performance with respect to the estimation of the experimental output data This has been done by eg De Willigen and Neeteson 1985 (six models) De Willigen 1991 (fourteen models) Diekkruumlger et al 1995 (nineteen models) Kersebaum et al 2005 (eighteen models) Here we decided to focus on comparison of the way the models describe quantitatively the fate of organic carbon added to the soil The comparison was based on the prediction of the model outcomes under constant conditions and their relation to organic carbon measured in agricultural soils rather than on comparison with detailed data from field experiments Nevertheless it is possible to make some comments on the plausibility of the models In Section 52 the model outcomes are compared with measured Mean Residence times (MRTs) In Section 53 it is calculated how much organic materials must have been applied to get the measured actual SOC levels Section 54 discusses factors that may help to understand the causes of the discrepancy between reality and model calculations In Section 55 the possible effects of lower applications of organic matter and climate change are considered Finally in Section 56 the major conclusions are presented of this study on decomposition an accumulation of organic matter in soil 52 Mineralization rates and mean residence time
Of the seven models discussed in this report the model MINIPa is considered to be unsuitable for long-term predictions of changes in carbon content As explained in Section 222 the model implies a non-mineralizable rest That makes it impossible to calculate equilibrium levels (CE) The model was meant for periods not longer than 40-50 years (Janssen 2002) but in view of the results in this report it is recommended to limit the use of MINIPa to even shorter periods say not more than 25 years about equal to the period of calibration Figure 15 and Table 6 show that the calculated SOC levels decrease in the order CENTURY gt CESAR gt RECAFS gt MINIPbgt NUCSAM gt ANIMO The high CE levels found with CESAR are a result of the assumption that applied organic matter behaves after one year as soil organic matter with a constant kM of 0027 y-1 Vleeshouwers and Verhagen (2002) based this assumption on three long-term experiments in which soil organic matter was measured at regular times These experiments however do not refer to recently applied organic material but to soil organic matter The assumptions they made are similar to those of Kortleven (1963) which have been shown to be invalid Since that time a tremendous amount of evidence has been obtained (compiled by eg Kolenbrander 1974 Yang 1995) showing that the mineralization rate constants of applied organic materials are still strongly affected after one year by the characteristics of the original materials and for all materials much higher than the mineralization rate constant of SOM
48 Alterra-rapport 1726
The high SOC values obtained with CENTURY can be understood by allocation of a part of organic matter to the slow and passive pool The reciprocals of the equilibrium values (CE) of Table 6 represent the mean relative mineralization rates (kM y-1) of soil organic matter they vary from 0084 (CESAR) to 0375 (ANIMO) for straw and from 0114(CESAR) to 0599 (NUCSAM) for green manure in case the total quantity of organic material is considered Because A was set at 1 the equilibrium values of Table 6 are equal to the mean residence times of CE including the C from newly added organic materials These newly added organic materials decompose very easily and hence have a small MRT Measured MRTs as given in literature however refer to SOM without newly added organic materials as these materials are removed from the soil sample before the chemical analysis is done It is difficult to indicate at what time after its application added organic material can be considered as soil organic matter In the Netherlands the boundary was set at 1 year (Kortleven 1963) Taking into account that farmers applied animal manure once a year in springtime it had also practical advantages to assume that after one year added organic material was ldquohumifiedrdquo Crop residues are also added to the soil once a year Most important however is that soil samples are taken just before and not just after the addition of animal manure Hence the analyzed SOC represents SOC1a rather than CE as calculated in the models For the comparison of model outcomes to measured SOC data it is therefore better to consider SOC1a than CE The equilibrium values of soil organic carbon that is at least for one year in the soil (henceforth denoted by SOC1a) can be found as
1SOC1a CC E (56) where C(1) is soil carbon built up at the end of Year 1 C(1) also represents the annual addition to SOC1a Hence in equilibrium it holds (see section 45)
aMk
C
11a
1SOC and the overall mineralization rate of SOC1a can be found as
1a
1 SOC
1Ck aM (57)
The mean residence times of SOC1a denoted by MRT1a would then be 1kM1a In Table 6 the values for C(1) SOC1a kM1a and MRT1a are shown In BOX 1 the mean residence time of organic matter which is more than 1 year in the soil is calculated The values of MRT1a in Table 6 vary from 3 to 25 years and are far below MRT measured with 14C varying from hundreds to thousands of years (Wattel-Koekkoek et al 2003 Buurman and Jongmans 2005) Buurman (personal communication) has some data on 4C age (which is MRT) in podzols in The Netherlands In well drained soils he found 4C ages of 1290-2390 and of 2370-2590 years in the horizons Bh1 and Bh2 respectively In hydromorphic soils these values were 2170-3650 and 3860 (only one sample) years respectively Buurman (personal communication) ascribes these high values to low pH and low chemical soil fertility of the examined podzols (see also Section 54) It may be questioned whether surface soils do contain such old organic matter OrsquoBrien and Stout (1978) arrived at the conclusion that 16 of SOC in a grassland soil was very old (7000 years) and distributed over the whole profile the remaining
Alterra-rapport 1726 49
part was lsquomodernrsquo and less than 100 years old On average SOC till a depth of 94 cm was 1490 years old Also they conclude that part of SOC must already have been in the soil before the present form of land-use started In the Netherlands Roumlmkens et al (1998) found MRT values of SOM in surface soils (0-30 cm) of arable land of 42 years and of grassland of 444 years in sub-soils (60-80 cm) these values were 1625 and 2456 years respectively Depending on the SOM fraction analyzed MRT varied between 2 and 2000 years in the surface soil and between 2 and 3500 years in the sub-soil The very high MRT values were of SOM connected to fine soil particles The half times for the mineralization of topsoil SOM varied between 7 and 39 years (Roumlmkens et al1999) which is in agreement with our data in Table 7 In conclusion most of the calculated mineralization rates cannot explain the measured longevity of SOM The relative mineralization rate of the most resistant pool of ANIMO is 002 y-1 that of RECAFS (calculated as (1-ε)k) amounts to 001134 and the corresponding MRTs are 50 and 88 years CENTURY has 0001 for k and 000058 for kM for the passive pool in the soil corresponding to a MRT of 1720 years According to MINIPb it takes 8021 and 16507 years before kM of the oldest portions of continuously applied straw and green manure respectively have reached the value of 0001 So under optimum mineralization conditions only MINIPb and CENTURY have the potential to reach a MRT of 1000 years Under sub-optimal conditions however mineralization rates may be considerably lower than assumed in the model calculations and as a result the corresponding MRT values may be considerably higher On the other hand the contents of SOM would have been much higher than they are (see Section 53) if MRTs were that high and applications of organic materials were as assumed below The explanation why SOM is not so high is that most of the very old SOM is found somewhere in the soil profile where mineralization is retarded and new addition of organic material does not or hardly occur The difference between measured and calculated MRT must therefore mainly be ascribed to factors that have had an effect on the mineralization rates The major factors are land-use nutrient availability pH and drainage in the past and soil texture (See Section 54)
BOX 1 Equilibrium values of SOC of MINIP-b and CENTURY for application of various type of organic materials Considering annual applications of 1700 2000 and 750 kg C per ha with respectively 3800 kg green manure 6350 kg wheat organic residue and straw and 10 tons of FYM as realistic the expected equilibrium SOC would be according to MINIPb 183 1700 + 41 2000 + 81 750 = 17386 kg ha-1 or 668 g kg-1 C This is about 11 g kg-1 SOM The corresponding average kM of total SOM would then be (1700+2000+750)17386 = 0256 For CENTURY the equilibrium is calculated as 1321700 + 1512000 + 183750 = 66365 kg ha-1 or 22 g kg-1 C corresponding to 38 g kg-1 SOM
50 Alterra-rapport 1726
53 Current SOM content in arable land and calculated equilibrium SOM
According to data of the former Stichting voor Bodemkartering cited by Janssen et al (1990) SOM may vary from less than 10 g kg-1 (drifting sands) to more than 900 g kg-1 (peaty soils) in the Netherlands In mineral surface soils of arable land the variation is from 20 to 60 g kg-1 In the calculations below we set the fraction of carbon in SOM at 058 and that in plant residue at 045 The mass of the topsoil is 26 million kg per ha (see Section 46) and hence 20 g kg-1 SOM corresponds to 200582600 = 30160 say 30 ton C per ha The amounts of straw or green manure required to maintain SOM at 20 g kg-
1 can be calculated using the equilibrium values (CE) in Table 6 We take the greatest CE that was calculated ie 15 by CENTURY for a sandy soil with 42 sand 50 silt and 8 lutum This requires annual additions of 3015 or 2 tons C in straw or (rounded) 44 tons of straw organic matter per ha per year The organic residue of winter-wheat is about 5200 kg ha-1 and 8500 kg ha-1 if straw is included (Ministerie van Landbouw en Visserij 1980) This is considerably more than the required supply of 44 tons to maintain a SOM content of 20 g kg-1 The amount of residue mentioned corresponds to the yields obtained in the last decennia of the 20th century According to FAOstat the yield of winter-wheat increased from an average of 4000 kg ha-1 in 1961 to 8900 kg ha-1 in 2004 a doubling time of 40 years (see also Figure 17) If we assume that the same doubling time applies to the period before 1961 and that the harvest index did not change this implies the amount of organic residue including straw added annually to the soil around the year 1920 would have been 2125 kg ha-1 which corresponds to an annual addition of 037 g C per kg The equilibrium value for this addition is (Table 6) 15 times as high or 56 g C per kg
0
1000
2000
3000
4000
5000
6000
7000
8000
9000
10000
1900 1920 1940 1960 1980 2000
year
yiel
d k
g h
a-1
Figure 17 Development of wheat grain yields in the Netherlands Data collected by Oenema (Pers comm)
Alterra-rapport 1726 51
If we assume that the yield increase (and the concomitant increase in residue left) after 1920 proceeds in an exponential fashion with a doubling time of 40 years the annual addition is time dependent A = A0exp(αt) where α = ln(2)40 = 00173 y-1 and A0 the addition in 1920 is 037 g C per kg it can be calculated (according to the procedure given in Appendix 3) that after 80 years ie in 2000 SOC has increased to 126 g C per kg or about 22 g SOM per kg This value is within the range found for arable land An often applied organic material that decomposes more slowly than straw is farmyard manure (FYM) Using the Model MINIPb equation A2-6 and taking 07059 and 06023 as values for the R and S parameters for FYM (Ten Berge et al 2007) the equilibrium SOC or CE is calculated as 81 This comes down to annual additions of 3016081 or 3723 kg C per ha to maintain SOM at 20 gkg FYM contains 75 kg C per ton so the required annual additions of animal manure are around 50 tons per ha to keep SOM at 20 gkg It is unlikely the farmers have supplied such quantities during 5000 years Calculations with CENTURY setting the lignin content of FYM at 025 and the N- content at 0023 yielded an equilibrium value of 183 about 23 times that calculated with MINIP-b So the required annual addition of FYM to keep SOM at 20 gkg would be 30160183 or 1648 kg C corresponding to 22 ton per ha Such an addition is quite realistic if it takes place once in a rotation of say 4 years but it is still not realistic to assume that farmers could annually apply these quantities during several centuries Common practice is to apply various types of organic matter eg green manure straw and FYM For realistic application rates of green manure wheat straw and farmyard manure equilibrium values for MINIPb and CENTURY are found as 11 and 38 g kg-
1 SOM respectively (see BOX 2 for explanation of the calculation) The equilibrium value found with MINIPb is about half of the lowest value of the mentioned range of 20-60 g kg-1 that of CENTURY on the other hand is well within the range for arable soils In conclusion the equilibrium SOM contents as calculated by most models are much lower than the present SOM levels in arable soils Only results by CENTURY are in the same range as the measured SOM contents This outcome is not a surprise as only CENTURY and CESAR were developed for the calculation of equilibrium SOM The other models are more appropriate to calculate how much SOM can be built in say 25 years Figure 15 shows a great difference between the models CESAR and CENTURY on the one hand and MINIP RECAFS ANIMO and NUCSAM on the other hand In view of methods applied for parameter calibration MINIPb and RECAFS likely are most reliable for the short run and CENTURY for the long run
52 Alterra-rapport 1726
54 Factors affecting SOM content and MRT
541 Land-use history
In general SOM contents decrease in the order grassland (steppe) gt forestgt arable land Under steppe the organic material annually added to the soil is 2-4 times as high as under forest (Kononova 1975) Although the steppe material decomposes more easily than the forest material the overall effect is that steppe soils have higher SOM contents than forest soils In the Netherlands climate is and was too wet for steppes but natural or permanent grasslands behave at least partly similar as steppe vegetation The low SOM in arable land is caused by the removal of the major part of organic materials produced above-ground and the stimulation of decomposition by tillage Van Hove (1969) gave the following average SOM contents in topsoils (0-30 cm) in Belgium grassland 46 forest 42 arable land 27 gkg A similar pattern was found by Velthof (2003) on loumlss soils but not or not always on sandy soils Velthof ascribes this to the biased distribution in his study of arable land to deep man-made soils Apart from the inappropriateness of most models several other reasons may be put forward to explain why the actual SOM contents are higher than those calculated in 513 A special situation is found in man-made soils lsquoeerdgrond (NL) plaggen epipedon (soil taxonomy)rsquo These have been formed by additions of farmyard manure from deep litter houses A rough proxy is that the ratio of the area of arable land to the area of non-arable land (heat and grassland) was 1 10 (Edelman 1960)
BOX 2 SOC1a values and corresponding MRT To find the content of SOC1a standing for SOC that is at least one year in the soil Section 521) the organic carbon that is built up during the first year after application (C(1) in Table 6) has to be subtracted from equilibrium SOC (CE) as shown in Equation 56 For MINIPb in case of FYM C(1) is estimated at 061The expected equilibrium of SOC1a would be according to MINIPb (183- 0375) 1700 + (41-0448) 2000 + (81- 061) 750 = 15331 kg ha-1 or 590 g kg-1 C which corresponds to SOM1a of about 102 g kg-1 These calculations indicate that lsquonormalrsquo use of arable land on sandy loams would result in 1 SOM1a according to MINIPb and about thrice as much or 3 according to CENTURY after at least 500 years SOM1a would be around 08 according to the models ANIMO and NUCSAM and between 1 and 3 according to CESAR and RECAFS In equilibrium the annual decomposition of SOC1a is equal to the annual addition (C(1)) being 0375 1700 + 0448 2000 + 061 750 or 1991 kg C ha-1 y-1 and the corresponding MINIPb kM is 199115331 = 013 y-1 The corresponding MRT is 77 years much lower than those mentioned in Section 521 According to CENTURY CE values are about thrice the values found with MINIPb and k would be 0133 = 0043 and the corresponding MRT 23 years still far below the measured MRTs
Alterra-rapport 1726 53
Every year heather was brought to the deep litter houses where it got mixed with animal droppings In spring the mixture was used as manure for the arable land This process has been continued for centuries On average the thickness of the thus formed soil with high SOM contents (50 -100 gkg) increased 10 cm per century (Edelman 1960 page 23) Especially man-made soils may contain charcoal which decomposes slowly (see van Minnen 2008) and thus contributes to high SOM and MRT values Another type of difference in land-use between the past and the present situation in the Netherlands is found in former sea and lake bottoms Here a subdivision of SOM in two parts can be made the remainders of the original SOM in the sediments and the newly formed SOM A well-known example is the situation in the in the Noordoostpolder The polder was reclaimed in 1944 In 1951 three experimental farms were established with three different organic matter management scenarios (Grootenhuis 1976) In 1976 SOM in the topsoil consisted of 72 tons of old SOM and (depending on the organic matter scenario) 6-15 tons of SOM formed in 25 years of agricultural land-use (Janssen 1984 Janssen and Van Reuler 1986) The values of kM were calculated to be 0007 and 012 for the old and the newly formed SOM corresponding to MRTs of 143 and 8 years respectively Also in other reclaimed lake bottoms a distinction into old and new SOM proved the key to understand the present mineralization characteristics of SOM (Janssen personal communication) In a similar way SOM in former peaty land such as in the ldquoVeenkolonieumlnrdquo can be subdivided into two parts the remainders of the original peaty material and the newly formed SOM Poor drainage in the past has resulted in the formation of peat a poor quality SOM as reflected in high CN low CEC and low mineralization rate The newly formed SOM has a ldquonormalrdquo CN around 10-12 and a ldquonormalrdquo mineralization rate (Van Dijk 1968 Janssen 2002) Once drainage has been improved mineralization rate sharply increases Buurman (2008) found higher MRT-values in hydromorphic soils than in well-drained soils In natural ecosystems being the historic land-use of most soils lack of N and sometimes lack of P have retarded the decomposition of added organics This is reflected in high CN and high CP ratios of SOM Van Hove (1969) found CN to be higher in sandy than in clayey soils In soils with 50 sand CN was 22 under pine forest 16 under deciduous forest and 11 in agricultural land The higher SOM under forest than in agricultural land mentioned above is probably at least partly caused by N deficiency suffered by the decomposing microorganisms In a study by Van Dijk (1968) CN varied from 24 in soils with 170 g SOM kg-1 to 11 in soils with 33 g SOM kg-1 again suggesting that N deficiency was a partial cause of slow decomposition Podzols and some man-made soils (ldquozwarte enkeerd- and gooreerdgrondenrdquo) have CN between 17 and 23 (Janssen et al 1990 Velthof 2003) reflecting the origin of heather and the possible presence of charcoal They point to poor N supply and hence slow mineralization in the past thus contributing to still rather high SOM levels Related to lack of nutrients is low pH In general SOM is higher at high pH than at low pH which is ascribed to higher plant production at high pH Rates of decomposition however are also higher at high pH with an optimum at pH 7-8 The relation between SOM and pH may therefore show a minimum
54 Alterra-rapport 1726
The MRT studies by Buurman (2008) refer to natural ecosystems He has observed that levels of SOM with a high MRT may decrease once the soil receives lime and fertilizers facilitating the decomposition of SOM 542 SOM and soil texture
Protection of organic material against decomposition on clayey soils probably is one of the most important causes of high SOM contents SOM may increase by 07 to 11 gkg per increase in clay as can be derived from Kortleven (1963) Janssen et al (1990) Hassink (1995) In his studies Hassink introduced the concept of saturation of the protective capacity of a soil and he found that the protective capacity could be described by Y = 407 + 037 x where y = C (gkg) in fraction lt 20 mu and x = particles () lt 20 mu Soils with a lsquosaturation deficitrsquo have lower decomposition rates than soils saturated with organic matter Once soils have become saturated by organic matter addition in the past newly added organic material cannot be protected anymore The high decomposition rates calculated with the models used in the present report refer to situations of non-protected organic matter as found in sandy soils and in clayey soils without a saturation deficit Only CENTURY and RECAFS take soil texture into account Figure 18 shows results of a calculation with CENTURY of the role of clay content in accumulation of carbon In this calculation annually 382 C per m2 (corresponding to 8500 kg wheat straw per ha) was applied The equilibrium values are expressed in g C per kg by using the soil bulk densities as calculated by CENTURY where soil bulk density is a function of clay content The increase of SOM (roughly 2 times the value of SOC shown in the figure) per increase in clay is about 15 g kg-1 As equilibrium values are proportional to annual supply a supply of 23 of 382 g m-2 would lead to a slope of 1 g (kg clay)-1 Wattel et al (2003) assessed MRTrsquos of organic matter in the clay-size fractions average values were 357 and 1089 years in case the clay mineral was kaolinite and smectite respectively For soils in the Netherlands where illite is the main clay mineral MRT may be estimated to be around 700 years The corresponding k is 00014
Alterra-rapport 1726 55
y = 07918x + 21609
R2 = 09708
00
100
200
300
400
500
600
700
800
900
1000
0 20 40 60 80 100
Percentage clay
Eq
uili
bri
um
SO
C g
kg
-1
Figure 18 Equilibrium values of soil organic C (SOC) as a function of clay content according to CENTURY Annual supply rate 382 g m-2
55 Expected changes in SOM
The fact that the current SOM content only partially reflects the present land-use poses a major problem to understand and predict the behavior of SOM as a response to a reduction of FYM according to European regulations or as a response to climate change According to the tested models (Section 53) present land-use on arable soils would result in SOM1a levels between 8 and 30 g kg-1 in sandy soils The rest of SOM is a heritage of the past and related to clay and fine-silt particles Poor drainage and low nutrient status may have retarded the decomposition of organic matter resulting in higher levels of SOM and MRT than are found in limed and fertilized arable land In some cases high SOM contents have been created on manmade soils (eerdgronden soils with a plaggen epipedon) where during centuries large quantities of organic materials have been applied Reducing the present application levels of organic materials by 50 may lead to losses of 4 and 15 g kg-1 of SOM at infinity The half life times (Table 7 Section 47) vary from 7 to 45 years implying SOM losses of 2 to 8 g kg-1 during such periods Figure 16 shows the expected course according to CENTURY and MINIPb The figure refers to situations where the present SOM has been formed by the present land-use and where nutritional drainage or draught conditions are not limitating to decomposition of SOM and no protection by clay particles are found
56 Alterra-rapport 1726
Some questions are still to be answered - How can we find the portion of SOM that is not related to the present
land-use - How can we find the portion of SOM that is related to clay and silt
particles - How does a change in annual additions of organic matter affect the
decomposition of SOM that is not related to the present land-use - How does a change in annual additions of organic matter affect the
decomposition of SOM that is related to clay and silt particles
For the first two questions no suitable methods of chemical analysis do exist and some ldquotricksrdquo are needed The answer to the first question may be found making use of the fact that SOM formed under the present conditions of highly fertile arable land must have a CN ratio of 8 to 10 while SOM formed under poor conditions has a CN considerably higher than 10 The study by Van Dijk (1968) followed this line for reclaimed peat soils (Veenkoloniale gronden) For instance a soil contained 6 SOM with a CN ratio of 17 Indicating the content of SOM formed under the present landuse by X and assuming that peat remainders have CN of 25 it follows from X 10 + (6 ndash X) 25 = 6 17 and that X = 32 So the 6 of SOM could be split in 32 formed recently and 28 from former peat particles Of course the outcome heavily depends on the assumed CN The assumption of a CN of 20 of SOM formed in the past under poor conditions would result in X = 18 in that case 42 SOM would be remnants from the past Circumstantial information may help to assign a correct CN to old SOM A similar approach can be followed to find the portion of SOM connected with the fine soil particles SOM connected with these particles usually has CN of 10 (eg Chichester 1969) Further the relations developed by Hassink (1995) for C and N associated with the fraction of particles lt 20 mu may be used C (g kg-1) = 409 + 037 particleslt 20 mu and N (g kg-1) = 040 + 0037 particleslt 20 mu These relations also point to CN of 10 in the fine particles The questions how changes in annual applications of organic matter influence SOM that is not related to the present land-use and SOM that is connected with clay and silt particles are even more difficult to answer SOM with a high MRT decomposed slowly in the past but perhaps decomposes at similar rates as lsquomodernrsquo SOM once the external conditions of pH and nutrient supply have been improved From incubation experiments in the study by Van Dijk (1968) with reclaimed peat soils it is derived however that lsquomodernrsquo SOM mineralized two to four times as fast as SOM from former peat From field trials it was estimated that the relative mineralization rate of lsquomodernrsquo SOM (25 years in this study) was about 18 times the relative mineralization rate of old SOM from the former sea bottom (Janssen 1984) Ten Berge et al (2007 Bijlage 3) applying model MINIPb arrived at the conclusion that kM of soil organic matter built up during 25 years by green manure straw FYM or compost is 9 to 16 times the kM of original SOM that did not receive any new organic material during those 25 years and 2 to 3 times as high the kM of original SOM that continuously received
Alterra-rapport 1726 57
new organic material As a practical first proxy kM of ldquooldrdquo SOM may be set at one tenth of kM of SOM developed recently ie under the present land-use during at least 25 years According to literature (Chichester 1969 Hassink 1995) conflicting results have also been obtained as far as it concerns decomposition rates of organic C and N associated with fine particles This is certainly true for N mineralization Possible retardation of C mineralization compared to C mineralization of not-protected SOM does not necessarily result in retarded N mineralization because SOM connected with fine particles has a lower CN and therefore more N mineralized per unit of C mineralized Again formulating a practical first proxy kM of ldquoprotectedrdquo SOM may be set at half the kM of not-protected SOM It is obvious that the here suggested proxies require more experimental evidence Unfortunately long-term field experiments have low priority among research-funding agencies these days Given the supposed differences in kM of modern and old SOM a change in temperature would mainly affect SOM developed during the last decades An increase of 1oC speeds up decomposition by a factor of 103 to 120 (Table 2) The equilibrium SOM would decrease by the reciprocal values so at infinity SOM would be 097 to 083 times the present value See also Section 47 56 Conclusions
The models discussed in our study are ndash at least originally - meant for predictions at different time scales CESAR MINIPa and MINIPb were used for forecasts over several decennia RECAFS and ANIMO are designed for use for a couple of growing seasons though ANIMO now is part of the chain of models called STONE (Schoumans et al 2002) which is used to explore the effects of different scenarios on leaching and eutrofication for a period of 30-50 years NUCSAM as applied here is also meant to be used for short periods but it has been scaled up to models which could be used for larger time and spatial scales CENTURY is specifically meant for use on large time scales (indeed for centuries) which explains that its results are especially for this scale more in agreement with empirical data of SOM content than the outcomes of the other models The predictions of SOM content by CENTURY are in the range expected for arable soils The distribution over the components however is such that the resulting MRT of SOM developed in pure sand is far too low The fraction of SOM in the component ldquoslowrdquo is about twice of that in the component ldquopassiverdquo this leads to a MRT of about 20 years and to a loss of 23 of the SOM within 100 years as shown in Figure 16 A major problem encountered when comparing model outcomes and actual SOM contents is that actual SOM contents are only partly the result of the present conditions Former land-use poor drainage the absence of fertilizer use and liming practices must have retarded the decomposition rate of SOM in the past say before 1900 and by that caused accumulation of organic matter On the other hand crop yields and hence quantities of crop residues that could be worked into the soil were lower than at present resulting in lower SOM levels than expected on the basis of
58 Alterra-rapport 1726
the present applications of organic matter Another complication is the effect of the fine soil particles Generally accepted rules of thumb to take soil texture into account are not at hand Despite the uncertainties in the assumptions and thus in the predictions it is estimated that halving the applications rates of organic materials may lead to absolute SOM losses of 2 to 8 g per kg within about 20 years This comes down to changes in SOM contents from 20 to 18 g kg-1 or from 60 to 52 g kg-1 An increase in temperature of 1oC would render SOM contents 097 to 083 times the values at present temperature It may be questioned whether such a decrease would harm soil structure and effect yields The lowest level of 18 g kg-1 is still above threshold values of 6 to 10 g kg-1 mentioned in literature (Loveland and Webb 2003 Janssen and De Willigen 2006) According to Pieri (1989) there is little risk of physical degradation if SOM is at least 007 times (clay + silt) In extremely heavy soils containing no sand fraction at all 70 g kg-1 of SOM would be required but in light soils with less than 100 g kg-1 of (clay + silt) 7 g kg-1 of SOM would suffice Droeven et al (1982) have shown in a 20-years field experiment dealing with different organic manure treatments that yields kept increasing although soil structure decreased over time Hoogerkamp (1973) clearly demonstrated that the effect of SOM on yield merely was an effect of N In his experiments lasting 9 years none so-called ldquoadditionalrdquo effects could be found and fertilizer N could compensate for yield reduction on soils with lower SOM contents So the risk of yield reduction and severe damage to soil structure is considered very small but the mentioned decrease in SOM of 2 to 8 g kg-1 may result in a decrease in N mineralization which is estimated at of 30 to 50 kg N per ha per year In principle yields remain at the same level provided extra fertilizer N additions compensate for the lower mineralization After the first 20 years it will take some hundreds of years to lose another 2 to 8 g SOM per kg soil That loss likely has less effect on N mineralization than the SOM lost in the first 20 years because the lost SOM after 20 years has a lower relative mineralization rate For calculations about expected changes in 5 to 25 years probably models as MINIPb and RECAFS are more suited than the others
Alterra-rapport 1726 59
Literature
Alexander MA 1961 Introduction to soil microbiology John Wiley amp Sons New York Baldock JA 2006 Composition and cycling of organic carbon in soil In Marschner P amp Z Rengel (eds) Nutrient cycling in terrestrial ecosystems 1-27 Springer-Verlag 397 pps Bauer A Black AL 1994 Quantification of the effect of soil organic matter content on soil productivity Soil Science Society of America Journal 58 185-193 Berendse FB B Berg amp E Bosatta 1987 The effect of lignin and nitrogen on the decomposition of litter in nutrient-poor ecosystems a theoretical approach Canadian Journal of Botany 651116-1120 Berendse FB R Bobbink amp G Rouwenhorst 1989 A comparative study on nutrient cycling in wet heathland systems II litter decomposition and nutrient mineralization Oecologia 78 338-348 Bril J HG van Faassen amp H Klein Gunnewiek 1994 Modelling N2O emssion from grazed grassland Report 24 DLO Research Institute for Agrobiology and Soil Fertlity Haren the Netherlands Buurman P 2008 Nieuwe inzichten in de theorie van podzolvorming Presentation at Symposium Vegetatiesuccessie en Bodemontwikkeling op de Veluwe Netherlands Soil Science Society 8 May 2008 Buurman P and AG Jongmans 2005 Podzolisation and soil organic matter dynamics Geoderma 125 71-83 Chicester FW 1969 Nitrogen in organo-mineral sedimentation fractions Soil Science 107356-363 Churchill RV 1972 Operational mathematics McGraw-Hill Kogakusha LTD Tokyo etc 481 pp Conijn JG 1995 RECAFS a model for resource competition and cycling in agroforstry systems Model description and user manual Report PSS 12 DLO Research Institute for Agrobiology and Soil Fertility Wageningen 101 pp Conijn JG 2005 CNGRAS A dynamic simulation model for grassland management and C and N flows at field scale Report 107 Plant Research International BV Wageningen 58 pp
60 Alterra-rapport 1726
Dam Kofoed A 1982 Humus in long term experiments in Denmark In D Boels DB Davies AE Johnston (Eds) Soil degradadtion Proceedings of the Land Use Serminar on Soil Degradation Wageningen Rotterdam AA Balkema pp 241-258 De Willigen P (1991) Nitrogen turn-over in the soil-crop system comparison of fourteen simulation models Fertil Res 27141ndash149 De Willigen P JJ Neeteson (1985) Comparison of six simulation models for the nitrogen cycle in the soil Fert Res 8157-171 Diekkruumlger B D Soumlndgerath KC Kersebaum CW McVoy (1995) Validity of agroecosystem models ndash a comparison of results of different models applied to the same data set Ecol Model 81 3-29 Droeven G L Rixhon A Crohain and Y Raimond 1982 Long term effects of different systems of organic matter supply on the humus content and on the structural stability of soils with regard to the crop yields in loamy soils In Boels D DB Davies and AE Johnston (Eds) Soil degradation Balkema Rotterdam 203-222 Edelman CH 1960 Inleiding tot de bodemkunde van Nederland Noord-Hollandsche Uitgeversmaatschappij 2e druk p188 FAOstat httpfaostatfaoorgsite408DesktopDefaultaspxPageID=408 (July 2008) Groenenberg JE W de Vries amp J Kros 1998 Simulation of the long-term carbon and nitrogen dynamics in Dutch forest soils under Scots pine Hydrol Earth System Sci 2439-449 Groenendijk P LV Renaud en JRoelsma 2005 Prediction of nitrogen and phosphorus leaching to groundwater and surface waters Process descriptions of the ANIM40 model Wageningen Alterra-Report 983 114 pp Grootenhuis JA 1976 Excursiegids 1976 van de Drie Organische-Stof-Bedrijven in de Noordoostpolder Inst Bodemvruchtbaarheid Haren The Netherlands 17 pp Hassink J 1995 Organic matter dynamics and N mineralization in grassland soils PhD thesis Wageningen Heinen M amp P De Willigen 2001 FUSSIM version 5 New features and updated userrsquos guide Wageningen Alterra Alterra-rapport 363 164 pp Hoogerkamp M 1973 Accumulation of organic matter under grassland and its effects on grassland and arable crops Agric Res Reports 806 24 pp Janssen BH 1984 A simple method for calculating decomposition and accumulation of lsquoyoungrsquo soil organic matter Plant and Soil 76 297-304
Alterra-rapport 1726 61
Janssen BH 1986 Een eacuteeacuten-parametermodel voor de berekening van de decompositie van organisch materiaal Vakblad voor Biologen 66(20) 433-436 Janssen BH 1996 Nitrogen mineralization in relation to CN ratio and decomposability of organic materials Plant and Soil 181 39-45 Janssen BH 2002 Organic matter and soil fertility Wageningen Agricultural University Dept Environmental Sciences Sub-department Soil Quality 248 pp Janssen BH en H van Reuler 1986 Het effect van de toediening van organisch materiaal aan de grond In Organische stof in de akkerbouw PAGV en CAD AGV Lelystad Themaboekje 7 7-19 Janssen BH P van der Sluijs amp HR Ukkerman 1990 Organische stof In Locher WP en H de Bakker (Red) Bodemkunde van Nederland deel 1 Algemene Bodemkunde (Tweede druk) Malmberg Den Bosch 109-127 Janssen BH amp De Willigen P 2006 Ideal and saturated soil fertility as bench marks in nutrient management II Interpretation of chemical soil tests in relation to ideal and saturated soil fertility Agriculture Ecosystems and Environment116 147-155 Janzen HH 2004 Carbon cycling in earth systemsmdasha soil science perspective Agriculture Ecosystems amp Environment 104 399-417 Jenkinson DS 1977 Studies on the decomposition of plant material in soil V The effects of plant cover and soil type on the loss of carbon from 14C labelled ryegrass decomposing under field conditions Journal of Soil Science 28424-434 Jenkinson DS amp A Ayanabe 1977 Decomposition of carbon-14 labeled plant material under tropical conditions Soil Science Soc America J 41 912-915 Jenkinson DS amp JHRayner 1977 The turnover of soil organic matter in some of the Rothamsted classical experiments Soil Science 123 298-305 Kersebaum KC J-M Hecker W Mirschel amp M Wegehenkel 2007 Modelling water and nutrient dynamics in soil-crop systems a comparison of simulation models applied on common data sets In Modelling water and nutrient dynamics in soil-crop systems Applications of different models to common data sets Proceedings of a workshop held June 2004 in Muumlncheberg Germany Kersebaum KC J-M Hecker W Mirschel M Wegehenkel (Eds) 2007 VIII 272 p Hardcover ISBN 978-1-4020-4478-6 Kononova MM 1975 Humus of virgin and cultivated soils In Gieseking JE (Ed) Soil components Volume I Organic components 475-526 Kortleven J 1963 Kwantitatieve aspecten van humusopbouw en humusafbraak Verslagen van landbouwkundige onderzoekingen Nr 691 PUDOC Wageningen 109 pp
62 Alterra-rapport 1726
Kros J 2002 Evaluation of biogeochemical models at local and regional scale PhD Thesis Wageningen University Wageningen 284 pp Kolenbrander GJ 1974 Efficiency of organic manure in increasing soil organic matter content Trans 10th Int Congr Soil Sci MoscowVol 2 129-136 Kortleven J 1963 Kwantitatieve aspecten van humusopbouw en humusafbraak PhD Thesis Wageningen University Kuikman PJ WJM de Groot RFA Hendriks J Verhagen amp F de Vries (2002) Stocks of C in Soils and emissions of CO2 from agricultural soils in the Netherlands Alterra report 561 Alterra Wageningen 39 p Parton W J 1996 The CENTURY model In D S Powlson P Smith and J U Smith (eds) Evaluation of Soil Organic Matter Models 283-291 Springer-Verlag Berlin Paustian K WJ Parton amp J Persson 1992 Modeling soil organic matter in organic-amended an nitrogen-fertilized long-term plots Soil Sci Soc Am J 56476-488 Pieri C 1989 Fertiliteacute des terres de savanes Bilan de trente ans recherche et de deacuteveloppement agricoles au sud du Sahara Ministegravere de la Coopeacuteration et CIRAD-IRAT Paris 444 pp Loveland P amp J Webb 2003 Is there a critical level of organic matter in the agricultural soils of temperate reasons Soil amp Tillage Research 70 1-18 Reijneveld A J van Wensem amp O Oenema (2008) Trends in soil organic carbon contents of agricultural land in the Netherlands between 1984 and 2004 Submitted to Geoderma Roumlmkens PFAM J Hassink amp J van der Plicht 1998 Soil organic 14C dynamics effects of pasture installation on arable land Radiocarbon vol 401023-1031 Roumlmkens PFAM J van der Plicht amp J Hassink 1999 Soil organic matter dynamics after the conversion of arable land to pasture Biol Fertil Soils 28 277-284 Schoumans OF J Roelsma HPOosterom P Groenendijk J Wolf HVan Zeijts GJ Van den Born S Van Tol HFM Ten Berge HG Van der Meer FK Van Evert (2002) Nutrient emission from agricultural land to ground and surface waters for different nutrient surpluses Model Calculations with STONE 20 Cluster report 4 part 1 (in Dutch) ALTERRARIVMPlant Research International WageningenBilthoven the Netherlands Schroumlder JJ AG Jansen amp GJ Hilhorst 2005 Long-term nitrogen supply from cattle slurry Soil Use and Management 21 196-204 Van Dijk H 1968 Das CN Verhaumlltnis im A2(p) _Horizont von kultivierten Sandboumlden im mit Kohlenstoff- und Stickstoffmineralisierung Nitrogen 12 89-96
Alterra-rapport 1726 63
Van Hove J 1969 Variatie van het gehalte aan organisch material en van de CN verhouding in de oppervlakte-horizonten van de bodems van Laag en Midden-Belgieuml Ph D thesis Gent Van Minnen JG 2008 The terrestrial carbon cycle on the regional and global scale Modeling uncertainties and policy relevance PhD Thesis Wageningen University Wageningen 237 pp Velthof GL 2003 Relaties tussen mineralisatie denitrificatie en indicatoren voor bodemkwaliteit in landbouwgronden Alterra rapport 769 38 pp Velthof GL 2005 Input of organic matter to agricultural soils (in Dutch) Bodem 1 11-13 Vleeshouwers LM amp A Verhagen 2001 CESAR a model for carbon emission and sequestration by agricultural land use Wageningen Plant Research International Report 36 27 pp Vleeshouwers LM amp A Verhagen 2002 Carbon emission and sequestration by agricultural land use a model study in Europe Global Change Biology 8 519-530 Wadman WP amp S de Haan (1997) Decomposition of organic matter from 36 soils in a long-term pot experiment Plant and Soil 189 289-301 Wattel-Koekkoek EJW P Buurman J van der Plicht E Wattel and N van Breemen 2003 Mean residence time of soil organic matter associated with kaolonite and smectite European J of Soil Science 54 269-278 Wolf J CT de Wit amp H van Keulen 1989 Modelling long-term crop response to fertilizer adn soil nitrogen I The model Plant and Soil 120 11-22 Woumlsten JHM GJ Veerman WJM de Groot and J Stolte 2001 Water retention and hydraulic conductivity characteristics of top and subsoils in the Netherlands the Staring series Updated edition 2001 Alterra report 153 (in Dutch) Yang HS 1996 Modelling organic matter and exploring options for organic matter in arable farming in northern China PhD Thesis Wageningen University Wageningen Yang HS amp BH Janssen 1997 Analysis of impact of farming practices on dynamics of soil organic matter in northern China European Journal of Agronomy 7 211-219 Yang HS amp BH Janssen 2000 A mono-component model of carbon mineralization with a dynamic rate constant European Journal of Soil Science 51 517-529 Yang HS amp BH Janssen 2002 Relationship between substrate initial reactivity and residue ageing speed in carbon mineralization Plant and Soil 239 215-224
Alterra-rapport 1726 65
Appendix 1 Application of the Laplace Transformation on a system of linear differential equations
The system of equations in matrix form was in gievn in the main tezt Equation (12)
CkC
dt
d (A2-1)
If the vector of initial values is denoted by C0 the Laplace transformed version of (A2-1) reads
UkCUI 0 s (A2-2) where s is the Laplace parameter I the identity matrix and U the Laplace transformed C-vector So that
01 CkIU s (A2-3)
Then U can be transformed back into C by well-known technmiques or as is done here with the help of a formula-manipulation program like Mathematica
Alterra-rapport 1726 67
Appendix 2 Accumulation of carbon in the soil for constant continous application of one unit of C in fresh organic material
MINIP-a and -b For the mono component models MINIP-a and ndashb is is not possible to solve the rate equation as each addition has to be followed in time The solution can be given however as an integral
t
dxxfAtC0
(A2-1)
MINIP-a
Substitution of f(x) = mm baxab exp into (A2-1) does not lead to a solution in terms of known functions the integral has to be evaluated numerically MINIP-b
The substitution of f(x) = SRt 1exp into (A2-4) and integration leads to
1
11
1
1
exp
1
1
1
0
1
SS
RtS
ARdxRxAtC
S
St
S (A2-2)
where the incomplete gamma function is defined as
z
ta dtetza 1 and the
complete gamma function as
0
1 tz etz By taking the limit as t rarrinfin of (A2-2)
the equilibrium value is found as
SS
RAC
S
E
11
11
1
(A2-3)
CESAR When there is a continous supply of A (for instance in g m-2 a-1) the rate equation reads
22112
111
CkCkhdt
dC
ACkdt
dC
MDc
D
(A2-4)
68 Alterra-rapport 1726
With initial conditions 022011 0 CCCCt the solution of (A2-4) is
tkkkktkkAh
CkkktkCkhtkCkkh
kkkC
k
tkCktkAC
DMMDMDc
MDmMDcDMDc
MDm
D
DDD
122121
02212201110121
2122
1
101111
expexp(
expexp1
exp1exp
(A2-5) The equilibrium value can be obtained by either taking the limit as t rarrinfin of (A2-5) or by setting dCdt =0 in (A2-4) One finds
k
AhC c
E (A2-6)
RECAFS For this model the rate equations and solutions are analogous to that for CESAR for the ith component the rate equation is
ApCkdt
dCiiiii
i 1 (A2-7)
The solution is
tkCtkk
AptC iiiiiii
iii
ii
1exp1exp1
1 0 (A2-8)
And the total amount of carbon is thus
3
10
3
1
expexp11i
iiiiii
i
ii tkCtk
k
AptCtY
(A2-9)
Equilibriumvalues are found from (A2-7) for the ith component
iii
iEi k
ApC
1 (A2-10)
ANIMO The rate equation for the two fractions of the added organic matter is again analogous to that given for CESAR but that for humus differs
)(
)(1
)(
3322113
222
111
cCkCkCkdt
dC
bApCkdt
dC
apACkdt
dC
(A2-11)
The solution for C1 and C2 is similar to that given in (A2-2) that for C3(t) is in symbolics quite long for convenience we write tkutkutku 332211 expexpexp
Alterra-rapport 1726 69
It is found
3
32313
31302232301121313230
232
0221
31
011
33
20222
2
10111
1
)(1
)(11
)(
)(1)(
ukkkkk
kkkCkkkkCkkkpkkkkAC
cukk
CkpAu
kk
CkpA
k
AtC
buCuk
AptC
auCuk
pAtC
(A2-12)
Equilibrium values for the first two components are found from (A2-11a-b)
)(
1
)(
22
11
bk
ApC
ak
pAC
E
E
(A2-13)
and for the last component from (A2-12)c bearing in mind that 0limlimlim 321
uuu
ttt is
33 k
AC E
(A2-13 c)
NUCSAM The rate equations are now
)(
)(
)(
3322233
2211122
111
cCkCkdt
dC
bCkCkdt
dC
aACkdt
dC
(A2-14)
with solutions using the notation given above
)(
)(11
)(1
323133
10311213203
232122
10211212202
13121
10212
32
2312
2323303
122
2112121021122202
1
11101
c
ukkkkk
CkAkkkCk
ukkkkk
CkAkkkCk
ukkkk
CkA
kk
A
kuCtC
bkkk
ukukAuuCkkuCtC
ak
uAuCtC
(A2-15)
70 Alterra-rapport 1726
The equilibrium value of the first component is found from (A2-14a)
11 k
AC E (A2-16a)
Substituting this result in the right hand side of (A2-14b) and equating the result to zero gives
2
122 k
AC E
(A2-16b)
Finally doing like wise with (A2-16b) and (A2-14c) it is found
3
23123 k
AC E
(A22-16c)
CENTURY The rate equations are
)(
)(
)(
)(
)(
)(
66565546446
55454415115
6466545544343324224
3333
2222
1111
fCkCkCkdt
dC
eCkCkCkdt
dC
dCkCkCkCkCkdt
dC
cApCkdt
dC
bApCkdt
dC
aApCkdt
dC
(A2-17)
The solutions for the (A2-12 a-c) are similar to that for CESAR
)(1
)(1
)(1
33
33031
22
22022
11
11011
cuk
ApuCC
buk
ApuCC
auk
ApuCC
(A2-18)
Alterra-rapport 1726 71
These solutions can be substituted in (A2-12 d-f) and the resulting equations are in principle solvable the solutions however are very long and complicated It was chosen to first substitue the values of the parameters and then solving the equations Equilibrium values for the three components of the residue are found as before with results
)(
)(
)(
3
33
2
22
1
11
ck
ApC
bk
ApC
ak
ApC
E
E
E
(A2-19)
Substitution of (A2-19a-c) into (A2-17e-f) together with the requirement of zero change yields three linear equations in the three unknowns C4 C5 and C6 These can be solved with known techniques we used the routine Solve from Mathematica obtaining
)(
1
)(1
1
)(1
6546456456446
4656453434656452425654461516
5546456456446
6446151453432425
4546456456446
5464561513432424
fk
ApppC
ek
ApppC
dk
ApppC
E
E
E
(A2-19)
Alterra-rapport 1726 73
Appendix 3 Accumulation of organic matter with time dependent supply Calculations with CENTURY
The rate equations for the components of added organic matter are
tApCktApCkdt
dCiiiiii
i exp0 (A3-1)
for i = 123 For the components of soil organic matter they are the same as given in (A3-17 d-f) The solution of (A3-1) with initial condition 00 ii CCt is
i
iiii k
tAptkCC
1expexp 0
0 (A3-2)
Like before the equations (A3-2-) are substituted in (A3-17 d-f) and the resulting system is solved with the help of the Laplace transformation
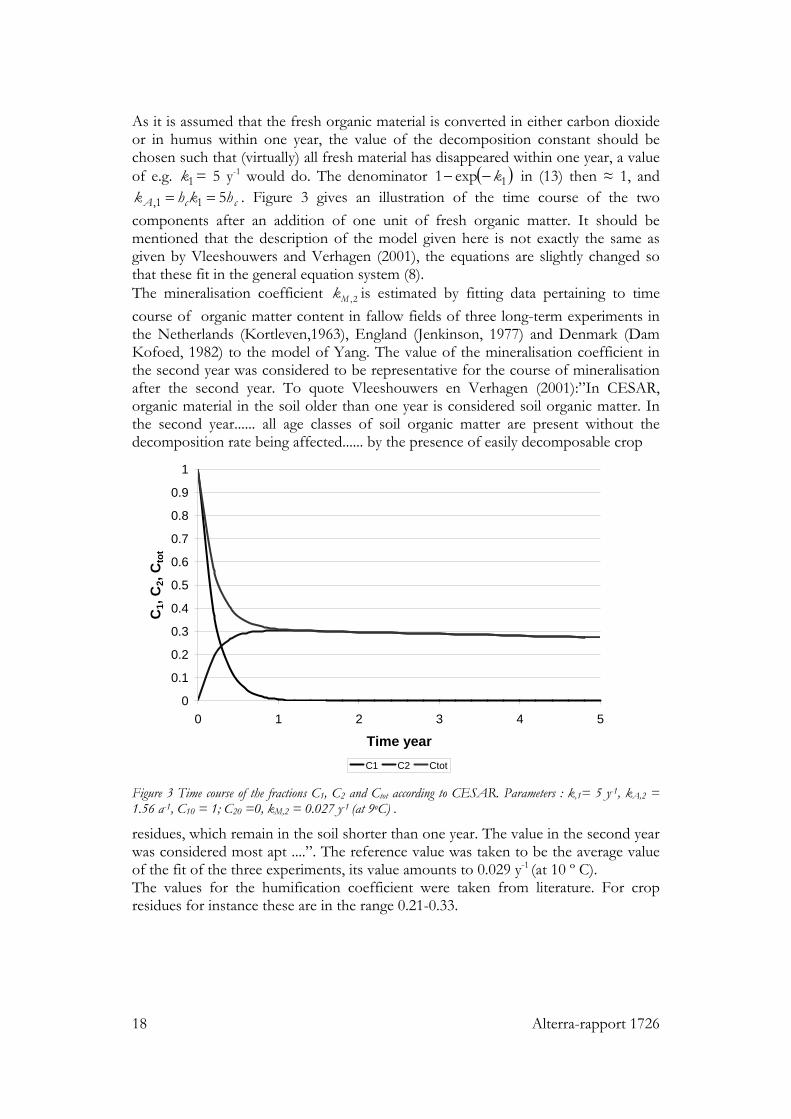