decomposition behaviour of kevlar 49 fibres: part i. at t = td
TRANSCRIPT

Bull. Mater. Sci., Vol. 22, No. 7, December 1999, pp. 1013-1023. © Indian Academy of Sciences.
Decompos i t ion behaviour of Kevlar 49 fibres: Part I. At T = Td
R V IYER and K A L Y A N I V I J A Y A N *
Materials Science Division, National Aerospace Laboratories, Bangalore 560 017, India
MS received 5 February 1999; revised 8 July 1999
Abstract. The structural changes which accompany decomposition of Kevlar 49 fibres at T = 500°C and 550°C, respectively, have been elucidated. At both these temperatures, cumulative thermal exposures of specific durations, teem(T), are required to result in decomposition. The conspicuous features which characterize isothermal decomposition of the fibres are: (i) progressive reduction and an eventual total loss in fibre crystallinity, (ii) progressive loss in weight, (iii) introduction of surface damages, (iv) introduction of hollow- ness, and (v) deterioration in tensile proptrties.
Keywords. Kevlar 49; decomposition; crystallinity; weight loss; hollowness; surface damages.
1. Introduct ion
As is well known, Kevlar 49 fibres are recommended for high temperature applications. It is mentioned that they could be used continuously at 300°C in air for 0.5 h (DuPont 1974). The exceptional tensile properties of Kevlar fibres have evoked tremendous interest, and ex- tensive research has been carried out in the past to understand the properties and behaviour of this light- weight aramid. It is however interesting to note that very little work has been done to understand the decomposition behaviour of Kevlar, especially from a structural point of view. Kevlar 49 fibres are reported to decompose at Td = 500/550°C (Tadokoro 1979; Yang 1989). The earlier work of Kalashnik et al (1978) concerns chemical decom- position of poly p-phenylene terephthalamide (PPTA), the polymer of which Kevlar is made of (Meredith 1975). Penn and Larson (1979) have observed the decomposition to be exothermic in air and endothermic in nitrogen. The high temperature investigations of Hindeleh and Abdo (1989) and Iyer and Vijayan (1994) throw light on the crystal structural changes which accompany thermal ageing, over a wide range of temperatures > 150°C. These studies however do not indicate whether the changes continue up to decomposition at the same rate. The present investigation is intended to decipher the structural changes both crystallographic and macro features--which precede and persist up to total decomposition of Kevlar 49~ fibres. Data from X-ray diffraction analysis, scanning electron and optical microscopy, tensile testing and weight analysis have been utilized to understand the decomposition behaviour.
*Author for correspondence
2. Experimental
The samples used in this study were Kevlar 49 fibres made commercially available by DuPont Inc., USA. Un- constrained bundles, = 2 mm thick and 50 mm long, were heated in air using a tubular resistance furnace in which the temperature was controlled and maintained to an accuracy of + 2°C by a PID controller. The temperatures (T) selected were the reported Td'S, viz. 500°C and 550°C. Fibres placed inside a quartz tube were slid into the furnace to occupy the central region of the constant temperature zone which extended to = 50 mm on either side of the centre of the furnace. At various stages of thermal exposures, fibres were removed from the furnace, air-cooled and characterized, after which the respective thermal exposures were continued. The procedure was repeated until total decomposition was identified on the basis of X-ray data, the details of which will be described in the next section.
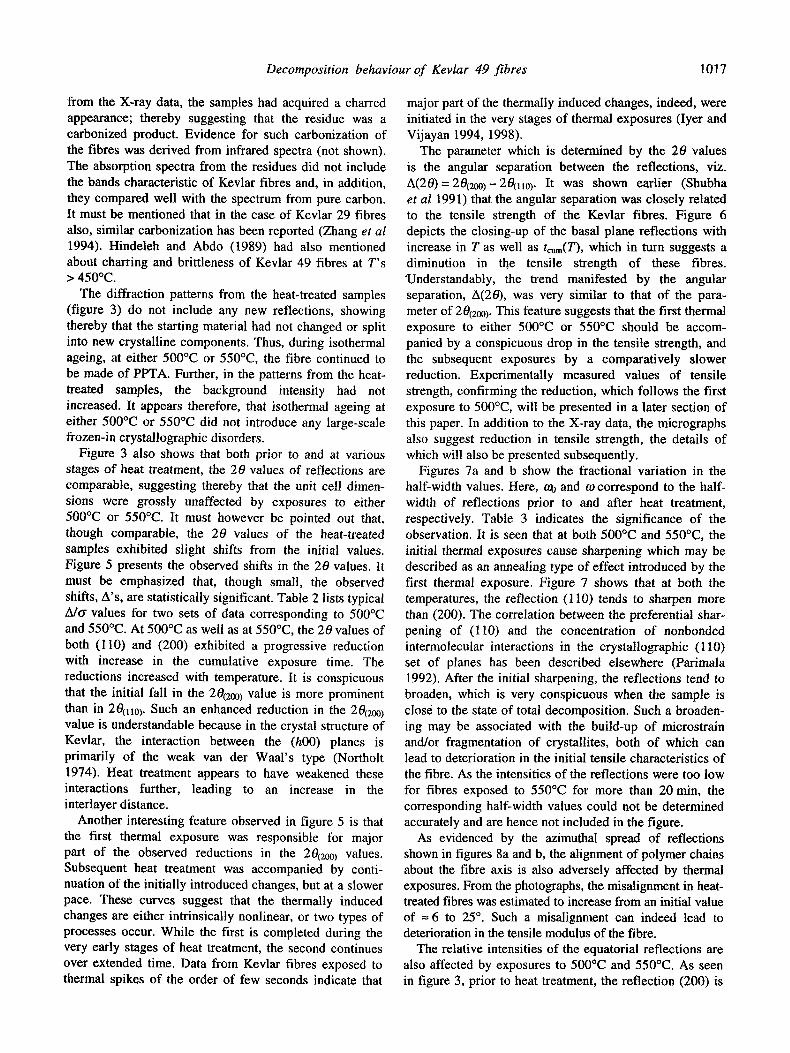
Equatorial X-ray diffraction patterns, both prior to and at various stages of heat-treatment, were recorded using a Philips powder diffractometer with a proportional counter and a graphite monochromator in the diffracted beam. CuKt~ radiation was employed. It must be mentioned that in the diffraction pattern from Kevlar, the equatorial reflections (110) and (200) occurring at 20=20 .5 and 22.9 ° respectively, were the two most intense reflections. As the analysis was based primarily on these two reflec- tions, recording of the diffractometer patterns was con- fined to the 20 range, 15 to 27 ° . The parameters esti- mated from the diffraction profiles were the integrated intensity I, 20max, and the half-width o9. The integrated intensity was determined from the area under the profiles, using a digitizer with an Autocad system. Values of 20max were determined by the mid-point chord extrapolation method (Bearden 1933). Half-widths (co) of reflections
1013

1014 R V lyer and Kalyani Vijayan
were estimated manually from the diffraction patterns using a scale. It must be mentioned that in the diffracto- meter patterns from Kevlar 49 fibres, a slight overlap occurred between the reflections (110) and (200). As the present study concerns identification of only relative variations of parameters, no attempt was made to separate the overlap. In order to estimate the errors (both instru- mental and human) associated with the estimation of the 20 and 09 values, measurements were made on 50 inde- pendent diffraction patterns all of which were recorded from the same sample; however at various points of time. Table 1 lists the standard deviations (tr) thus derived. In addition to the diffractometer recordings, transmission Laue photographs were also recorded for some of the fibres. The azimuthal spreads, fl, of the equatorial reflec- tions were estimated from the photographs. The angle, 2fl, subtended by the arcs at the centre of the photograph, was estimated manually (figure 1). The ends of arcs were identified as those regions where the diffraction intensity merged with the background. Weights of fibres, both prior to and at various stages of heating, were measured using a Sartorius analytical balance capable of reading up to 0.0001 g. For the weight analyses, for each of the chosen ageing conditions, at least three samples were examined. Hence, the data points presented in the subsequent section represent the average behaviour of the three samples. A Jeol scanning electron microscope (SEM) was used to examine the surface as well as the cross-section of fibres fractured in tension. For each experimental condition, at least five filaments were examined under the microscope. A stretching device, of the type shown in figure 2a, was used for effecting the tensile fracture. Single fila- ments mounted centrally in the rectangular slot cut in a -- 0.2 mm thin cardboard were held at both ends by means
T a b l e 1. Average values of 17 for 20 and 09.
17 Parameters (o)
20(2(m) 0-027 200 Io) 0-020 O~ao0) (20 scale) 0.05 o~lH)) 0.05
of screws and plates (a and b in figure 2a). Before applying the load, the outer frame of the cardboard was cut to enable transfer of load to the fibre. By moving the lead screw S, filaments could be pulled in tension and stretching was continued until the filaments fractured. In order to minimize loss of details of the fractured ends, a water medium was used for stretching and fracturing. The device in figure 2a, with the filament, was lowered into a glass dish containing water, and the lead screw S was moved until the filament fractured. Both the pieces of the fractured filament were then recovered from the stretching device, dried on filter papers and viewed under SEM. In the case of heat-treated fibres, the above-mentioned procedure could not be followed for the reason that the fibres had turned too brittle and while mounting them on the device they tended to break easily and often into more than two pieces, with the pieces getting scattered and lost. Also, with the water medium, it was nearly impossible to recover the broken pieces. Hence for the heat-treated fibres, fracturing was done in air. It must be mentioned that even in air, the success rate of fracturing the fibre into just two pieces on the stretching device (figure 2a) and recovering the free ends was only -- 10%.
In the case of fibres exposed to 550°C, a slightly different procedure was followed. Individual fibres were mounted on a double-sided adhesive tape fixed onto the vertical face of a brass stub (figure 2b). The end of the filament, projecting in air, was held lightly by a pair
a
screw S spring cardboard fibre aluminium device
Background
Portion ofthe b seen under SE
• Double sided adhesive tape
Brass stub
Figure 1. Schematic representation of the azimuthal spread of Figure 2. a. Stretching device used for tensile fracture; b. stub arc-like reflections, used for brittle specimens.

Decomposition behaviour of Kevlar 49 fibres 1015
of tweezers and pulled outwards gently to fracture the fibre. This operation was carried out under an optical microscope. Prior to examination under the electron microscope, all the fibres were coated with gold.
Tensile testing of single filaments was carried out both prior to and after 5 min of exposure to 500°C, using a Zwick universal testing machine. Single filaments with a gauge length of 25 mm were pulled at the rate of 2.5 mm/min. The chart speed was 60 mm/min. For each set, 50 filaments were examined, and the average value of strength and modulus were evaluated. It must be men- tioned that attempts were made to measure the strength and modulus of fibres which were exposed for more than 5 min to 500°C, but to no avail. They were too brittle to be handled for such tests.
A
J
a
f
27 15 20(*) ~
(mh0
6O
45
30
15
A s ~
Infrared absorption spectra were recorded from fibres prior to and after exposure to 500°C and 550°C for 75 min each, respectively, using a Bruker IFS48 FT spectrometer. Minutely chopped fibres were pelletized with KBr powder. For the sake of comparison, the spectrum from carbon powder was also recorded.
3. Results and discussion
As mentioned earlier; two values of To viz. 500 and 550°C, have been reported for Kevlar 49 fibres, by Tadokoro (1979) and Yang (1989), respectively. The difference in the Td values was perhaps due to variations, though slight, in the processing conditions and the consequent differences in the initial characteristics of the fibre. It must be emphasized that the results presented in this paper pertain to fibres from the same spool and hence variations of the type mentioned above are not expected.
Decomposition, by definition, is the breaking up of a material by physical or chemical means during which process, the starting material can split, gaseous compo- nents can evolve, char can form, etc. This well known definition of decomposition suggests that prior to total decomposition of any material, changes in the initial structural characteristics should be introduced. Conse- quently, X-ray diffraction patterns should manifest the concomitant changes. In the case of isothermally decom- posed Kevlar fibres, X-ray and other data provide evidence for the introduction of such changes, the details of which are presented below.
3. I X-ray analysis
Analysis of heat-treated samples indicated that the fibres did not decompose instantaneously at either 500°C or
t,,a~tn~a)
4O
35
3O
20
As mc~ted
b
Figure 3. various stages of exposure to a. 500°C; and b. 550°C.
1 !
50O C
- 0 27 15
2e(*) . 0 15 30 45 60
teum (T) (rain) Equatorial diffraction profiles prior to and at
Figure 4. Variation in residual crystallinity, K.

1016 R V lyer and Kalyani Vijayan
550°C. Finite exposures of the order of an hour were required to complete the decomposition. Here, the com- pletion of decomposition was identified as that stage of heat treatment where the diffraction intensities, charac- teristic of the initial sample, were completely lost.
Figures 3a and b present the diffraction patterns recor- ded prior to as well as at various stages of exposures to 500°C and 550°C, respectively. The parameter tc,m(T) represents the duration of the cumulative exposure to temperature T. The most conspicuous feature of the diffraction patterns was the progressive diminution in the diffraction intensities with increase in te,m(T). The corre- lation between diffraction intensity and crystallinity of the sample is well known (Wakelin et al 1959). Hence, in the discussions to follow, the parameter K = AIAo, where A0 and A correspond to the integrated intensities of the equatorial reflections before and after heat treatment, 23 ,
22.8
22.6
22.4
22.2
22 I I
0 20 40 60 • 500 C
0 10 20 30 • 550
tcum(T) (rain)
21
(I 10)
20.8
0.6
20.4
20.2
20 ' '
Figure 5.
b
0 20 40 60 * 500 C
0 10 20 30 ,,, 550
tcum(T) (rain)
a-b. Observed shifts in the 20 values.
respectively, is used synonymously with the residual crystallinity of the heat-treated sample. Figure 4 depicts the variation in residual crystallinity with tern(T), esti- mated from the integrated intensities. It was found that ageing at both 500°C and 550°C caused progressive reduction, followed by an eventual total loss in the residual crystallinity of the sample. I t was also observed that the two parameters, viz. T and team(T) controlled the reduction in the K value. For any chosen value of teum, higher the temperature, more was the reduction in crystallinity. In a similar fashion, for a chosen value of T, the residual crystallinity decreased with increase in the to,re(T) value.
X-ray data thus suggests that when the fibres were left at either 500°C or 550°C, the crystalline fraction available for diffraction, diminished progressively. As the tempe- ratures selected for ageing were = Td, it appears appro- priate to assume that the diminution in the crystalline fraction was due to progressive decomposition of the sample. Applying the criterion of vanishing intensities of reflections to the data in figure 3, it may be concluded that = 60 min at 500°C and --- 40 min at 550°C led to total decomposition of the fibre, i.e. the residence time was more for the lower of the two temperatures. These obser- vations strongly suggest the non-singular character of the decomposition temperature. Kevlar fibres belonging to the same batch were observed to decompose at either 500°C or 550°C, the controlling factor was the duration of the cumulative exposure. The reduction in the tern(T) value to complete decomposition at 550°C can also be associated with the difference in the rate of decomposition. The difference in the slopes of the curves in figure 4 lends support to this view. At this juncture, it must also be pointed out that the 'unobservables' in figure 3 could very well be reflections with very low intensities and which could be detected or 'observed' if a more sensitive detector system was employed. It is therefore very likely that the values of &nm(T) needed for completing the isothermal decomposition, as derived from the present set of X-ray data, have been slightly underestimated.
Though not surprising, it may be mentioned that at the end of the decomposition phenomenon, as identified
Table 2. Typical example of the A/o" values.
20(2(x)) (°) 20(.0) (°)
T to,re(T) A = 20oefore heating A = 20oefore heating
(°C) (min) -- 20after heating A/O" -- 20after heating ~ / O "
500
550
15 0.4625 12.2 0.0875 3.1 30 0-4750 12.6 0.1625 5.8 45 0-4750 12.6 0-1875 6.7
5 0-4875 12.9 0 - 10 0.425 11.2 0.075 2-7 15 0.575 15.2 0-225 8-1 20 0-55 14.6 0.15 5.4
Decomposition behaviour of Kevlar 49 fibres 1017
from the X-ray data, the samples had acquired a charred appearance; thereby suggesting that the residue was a carbonized product. Evidence for such carbonization of the fibres was derived from infrared spectra (not shown). The absorption spectra from the residues did not include the bands characteristic of Kevlar fibres and, in addition, they compared well with the spectrum from pure carbon. It must be mentioned that in the case of Kevlar 29 fibres also, similar carbonization has been reported (Zhang et al 1994). Hindeleh and Abdo (1989) had also mentioned about charring and brittleness of Kevlar 49 fibres at T's > 450°C.
The diffraction patterns from the heat-treated samples (figure 3) do not include any new reflections, showing thereby that the starting material had not changed or split into new crystalline components. Thus, during isothermal ageing, at either 500°C or 550°C, the fibre continued to be made of PPTA. Further, in the patterns from the heat- treated samples, the background intensity had not increased. It appears therefore, that isothermal ageing at either 500°C or 550°C did not introduce any large-scale frozen-in crystallographic disorders.
Figure 3 also shows that both prior to and at various stages of heat treatment, the 20 values of reflections are comparable, suggesting thereby that the unit cell dimen- sions were grossly unaffected by exposures to either 500°C or 550°C. It must however be pointed out that, though comparable, the 20 values of the heat-treated samples exhibited slight shifts from the initial values. Figure 5 presents the observed shifts in the 20 values. It must be emphasized that, though small, the observed shifts, A's, are statistically significant. Table 2 lists typical A/tr values for two sets of data corresponding to 500°C and 550°C. At 500°C as well as at 550°C, the 20 values of both (110) and (200) exhibited a progressive reduction with increase in the cumulative exposure time. The reductions increased with temperature. It is conspicuous that the initial fail in the 20(2oo) value is more prominent than in 20(11o). Such an enhanced reduction in the 20(200) value is understandable because in the crystal structure of Kevlar, the interaction between the (h00) planes is primarily of the weak van der Waal's type (Northolt 1974). Heat treatment appears to have weakened these interactions further, leading to an increase in the interlayer distance.
Another interesting feature observed in figure 5 is that the first thermal exposure was responsible for major part of the observed reductions in the 20(2oo) values. Subsequent heat treatment was accompanied by conti- nuation of the initially introduced changes, but at a slower pace. These curves suggest that the thermally induced changes are either intrinsically nonlinear, or two types of processes occur. While the first is completed during the very early stages of heat treatment, the second continues over extended time. Data from Kevlar fibres exposed to thermal spikes of the order of few seconds indicate that
major part of the thermally induced changes, indeed, were initiated in the very stages of thermal exposures (Iyer and Vijayan 1994, 1998).
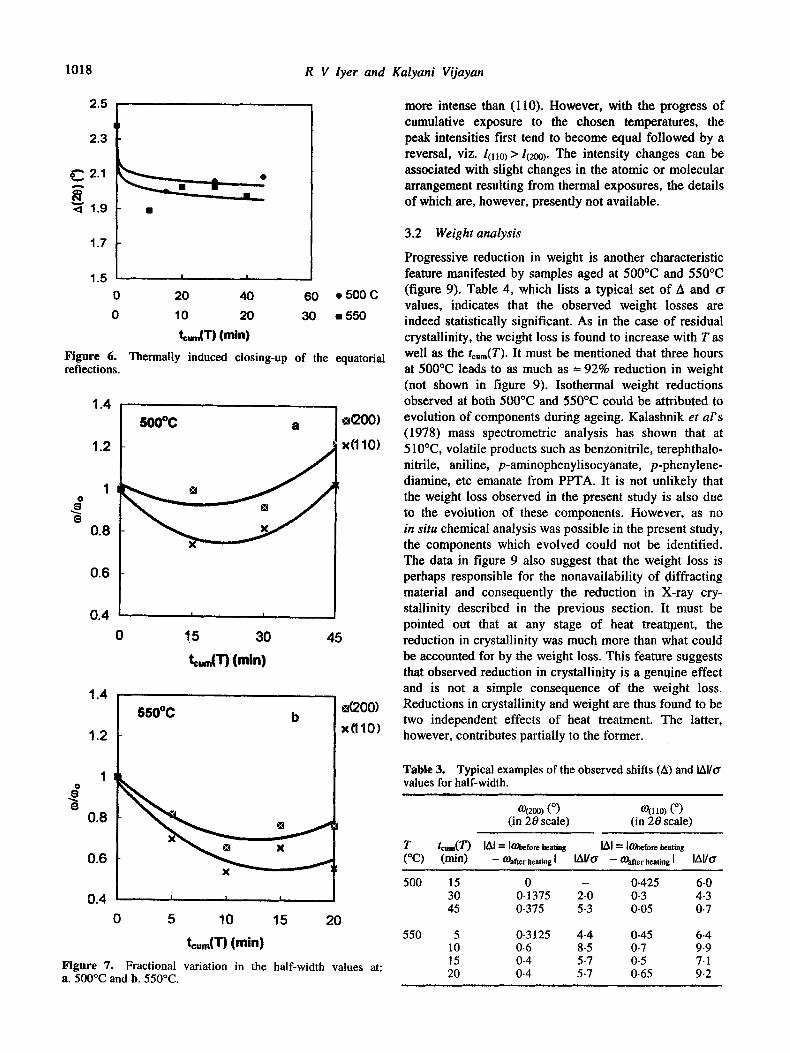
The parameter which is determined by the 20 values is the angular separation between the reflections, viz. A(20)=20(2oo)-20(110). It was shown earlier (Shubha et al 1991) that the angular separation was closely related to the tensile strength of the Kevlar fibres. Figure 6 depicts the closing-up of the basal plane reflections with increase in T as well as tcum(T), which in turn suggests a diminution in the tensile strength of these fibres. "Understandably, the trend manifested by the angular separation, A(20), was very similar to that of the para- meter of 20(200). This feature suggests that the first thermal exposure to either 500°C or 550°C should be accom- panied by a conspicuous drop in the tensile strength, and the subsequent exposures by a comparatively slower reduction. Experimentally measured values of tensile strength, confirming the reduction, which follows the first exposure to 500°C, will be presented in a later section of this paper. In addition to the X-ray data, the micrographs also suggest reduction in tensile strength, the details of which will also be presented subsequently.
Figures 7a and b show the fractional variation in the half-width values. Here, too and 09 correspond to the half- width of reflections prior to and after heat treatment, respectively. Table 3 indicates the significance of the observation. It is seen that at both 500°C and 550°C, the initial thermal exposures cause sharpening which may be described as an annealing type of effect introduced by the first thermal exposure. Figure 7 shows that at both the temperatures, the reflection (110) tends to sharpen more than (200). The correlation between the preferential shar- pening of (110) and the concentration of nonbonded intermolecular interactions in the crystallographic (110) set of planes has been described elsewhere (Parimala 1992). After the initial sharpening, the reflections tend to broaden, which is very conspicuous when the sample is close to the state of total decomposition. Such a broaden- ing may be associated with the build-up of microstrain and/or fragmentation of crystallites, both of which can lead to deterioration in the initial tensile characteristics of the fibre. As the intensities of the reflections were too low for fibres exposed to 550°C for more than 20 min, the corresponding half-width values could not be determined accurately and are hence not included in the figure.
As evidenced by the azimuthal spread of reflections shown in figures 8a and b, the alignment of polymer chains about the fibre axis is also adversely affected by thermal exposures. From the photographs, the misalignment in heat- treated fibres was estimated to increase from an initial value of = 6 to 25 °. Such a misalignment can indeed lead to deterioration in the tensile modulus of the fibre.
The relative intensities of the equatorial reflections are also affected by exposures to 500°C and 550°C. As seen in figure 3, prior to heat treatment, the reflection (200) is
1018 R V lyer and Kalyani Vijayan
2.5 ~ ,
2.3
C. 2.1
< 1.9
1.7
1.5 0
! !
Figure 6. reflections.
20 40 60 • 500 C 10 20 30 • 550 tm.(T) (rain)
Thermally induced closing-up of the equatorial
'.'[ ,oooc . ].ooo, 1.21 ~ x ( 1 1 0 )
0 . 8
Oer 1 0 . 4 ' '
0 !5 30 45 t=.m(T) (rain)
1.4 550°C b
1.2
1 i
0.8
0.6
0.4
,z(200) x(110)
0 5 10 15 20 tcum('r) ( r a i n )
Figure 7. Fractional variation in the half-width values at: a. 500°C and b. 550°C.
more intense than (110). However, with the progress of cumulative exposure to the chosen temperatures, the peak intensities first tend to become equal followed by a reversal, viz. I(110)> 1(200). The intensity changes can be associated with slight changes in the atomic or molecular arrangement resulting from thermal exposures, the details of which are, however, presently not available.
3.2 Weight analysis
Progressive reduction in weight is another characteristic feature manifested by samples aged at 500°C and 550°C (figure 9). Table 4, which lists a typical set of A and cr values, indicates that the observed weight losses are indeed statistically significant. As in the case of residual crystallinity, the weight loss is found to increase with T as well as the te,m(T). It must be mentioned that three hours at 500°C leads to as much as = 92% reduction in weight (not shown in figure 9). Isothermal weight reductions observed at both 500°C and 550°C could be attributed to evolution of components during ageing. Kalashnik et al's (1978) mass spectrometric analysis has shown that at 510°C, volatile products such as benzonitrile, terephthalo- nitrile, aniline, p-aminophenylisocyanate, p-phenylene- diamine, etc emanate from PPTA. It is not unlikely that the weight loss observed in the present study is also due to the evolution of these components. However, as no in situ chemical analysis was possible in the present study, the components which evolved could not be identified. The data in figure 9 also suggest that the weight loss is perhaps responsible for the nonavailability of diffracting material and consequently the reduction in X-ray cry- stallinity described in the previous section. It must be pointed out that at any stage of heat treat0lent, the reduction in crystallinity was much more than what could be accounted for by the weight loss. This feature suggests that observed reduction in crystallinity is a genqine effect and is not a simple consequence of the weight loss. Reductions in crystallinity and weight are thus found to be two independent effects of heat treatment. The latter, however, contributes partially to the former.
Table 3. Typical examples of the observed shifts (A) and IAI/cr values for half-width.
0)(200 ) (o) 0)(110 ) (o) (in 20 scale) (in 20 scale)
T teem(T) IA[ = ]OJhef~re heating [~1 = [OJhefore heating ( ° C ) (mi l l ) -- O)afier heating [ [/~VO" -- O)after heating [ [A~/O "
500
550
15 0 - 0.425 6.0 30 0.1375 2.0 0.3 4.3 45 0.375 5.3 0.05 0-7
5 0-3125 4-4 0-45 6.4 10 0.6 8.5 0.7 9-9 15 0.4 5.7 0.5 7.1 20 0.4 5.7 0-65 9.2

Decomposition behaviour of Kevlar 49 fibres 1019
]t must be pointed out that although the above men- tioned weight loss during heat treatment has a semblance to a thermogravimetric analysis (TGA), it is indeed very different. In a TGA, the sample is heated through a wide range of temperatures, rather fast, and as such the sample 'sees ' any temperature in the chosen range for very short time durations. In contrast, in the present study, the sample 'stays' at a chosen temperature for comparatively long durations and the change in weight as a function of time has been determined.
3.3 Microscopy
In addition to the changes introduced at the level of the crystal lattice and weight loss, isothermally aged Kevlar fibres manifest changes in the microstructural charac- teristics also. In order to appreciate the effects of heat treatment, fibres prior to heat treatment were first exa- mined. Figure 10a shows the surface features. Excluding the presence of few impurities (Vijayan 1987), the surface of the fibre is quite featureless. Figure 10b depicts the characteristics of an untreated filament fractured in tension. As has been observed earlier (Konopasek and Hearle 1977), the fibre fractures by longitudinal splitting.
The micrographs in figures 10c-f are from the fibres exposed to 500°C and 550°C, respectively. The most striking feature is that exposures to both 500°C and 550°C render the fibre hollow (figures 10c, e, f). It appears that thermal degradation leading to material loss, initiates near the central portion of the fibre. Kevlar fibres which are initially = 12 pm thick, are known to possess a skin-core structure, the skin being 0.1-0-6 pm thin (Morgan et al 1983). Combining the information on the size of the skin with the present observation on hollowness, it is clear that
60
thermal exposures do not remove the entire core. The micrographs indicate that the thermally induced material loss initiates in the innermost part of the core. Such a preferential material loss near the core further suggests that structural arrangement in this part of the fibre is distinct and perhaps thermally less stable than in the exterior of the fibre. Similar structural differentiation between the core and the skin has been proposed by Morgan et al (1983) and Panar et al (1983). According to the model proposed by Mot'gan et al, the skin has an improved structural integrity and continuity along the longitudinal direction of the fibre and this feature is attributed to the difference in the arrangement of the chain ends in the core and the skin of the fibre. The chain-end model of Morgan et al was proposed to explain the deformation mechanism, fracture behaviour and tensile strength of Kevlar fibres. Although it is not directly connected with the thermal behaviour of the core, the model supports the present observation on the lowered stability of the core. In the latter case of Panar et al, the core of the fibre was preferentially degraded by exposing the ends of fibres to plasma. In contrast with the partial hollowness characterizing the heat-treated fibres, in the case of plasma treated fibres, the entire core was removed, leaving behind only the husk of a skin. This difference in behaviour could be attributed to the higher temperature of the plasma.
Another interesting consequence of exposures to 500°C and 550°C is the introduction of extensive surface damages. Comparison of the micrographs in figures 10a, c, d show that heat treatment has introduced large number of arc- like openings on the surface of the fibre. Conspicuously, all the arcs assume an enveloping juxtaposition. It is also found that in samples exposed to 550°C, the openings are longer as well as deeper (figure 10d) than in fibres exposed to 500°C (figure 10c). It appears therefore that
50
• 500 C
= 550
A
40
o 30 r , ,
._~ • 20
10
0 20 40 60 80
tcum(T) (min) Figure 8. Azimuthal spreads of the equatorial reflections a. prior to and b. after exposure to 500°C. Figure 9. Weight loss at 500°C and 550°C.

1020 R V Iyer and Kalyani Vijayan
Fi~,ure 10. SEM depicting: a. Surf~ve le~tures of untre,Lted libre~, b. untreated filament fractured in tension: c. hollowness introduced in fibres exposed to 500"C for 90 rain, showinF appearance of arc-like openings on the surface: d. enhanced surface damage introduced at 550°C. where arrow indicates the line ¢~I macro slip; e. another view of the macro slip; f. effect or tc~(T) at 500°C, showing enhancement of surface damases.

Decomposition behaviour of Kevlar 49 fibres 1021
the severity of the thermally induced surface damages increases with increase in temperature. The influence of tcum(T) on the surface damages can also be seen from the micrographs recorded from samples exposed to 500°C. The fibres which have stayed at 500°C for 3 h exhibit more damage than those exposed for only 90 min (figures 10f and c).
Introduction of hollowness and the above-mentioned surface openings during heat treatment may be attributed to possible evolution of components from within the fibre. Such a correlation is in keeping with the weight loss, the details of which were described in the previous section. It is likely that the thermally induced openings on the surface of the fibres represent the outlets through which the volatile components have evolved. The enhanced surface damage in fibres exposed to 550°C suggests that the evolution is turning more violent/turbulent with increase in temperature.
Introduction of hollowness as well as surface features may be associated with some of the factors connected with the fabrication of fibres. It is well known that Kevlar fibres are formed from a solution of PPTA in sulphuric acid and the skin develops during the process of spinning. It is likely that during the process of fibre formation, water and few other impurities get occluded. Diffusion of these trapped components to the outside medium could be slowed down by the presence of the skin. However, in the initial stages of heat treatment, water could be desorbed. In addition, some of the acid induced cleavage of the polymer could give out volatile products in the interior of the fibre causing the generation of a hollow structure. Similarly, other surface characteristics described above can also be associated with the escape of such volatiles. It must be mentioned that similar surface characteristics have been observed in fibres aged at temperatures far below Td, viz. at 250°C, 300°C, etc. It appears therefore that irrespective of the temperature chosen for ageing, isothermal decomposition is always preceded by similar types of thermally induced changes. Further details of these observations will be described in a subsequent publication dealing with isothermal ageing of Kevlar 49 fibres at T < Td.
Fibres exposed to 550°C exhibit another conspicuous axial characteristic. The micrograph in figure 10e shows a wrinkle running along the length of the fibre. This wrinkle may be described as a 'macro slip' introduced on the surface, during heat treatment. Figure 10d is another view in which the 'macro slip' is seen as a darkish line running along the length of the fibre. Examination of these fibres under an optical microscope revealed that the 'macro slip' is not quite parallel to the fibre axis but is slightly inclined.
The above-mentioned axial slip seems to have an interesting influence on the subsequent fracture behaviour of the fibre. Fibres exposed to 550°C were fractured in air, using the arrangement shown in figure 2b and the
procedure described therein. The micrograph in figure 11 shows that the fibre has fractured at two places along the length, marked as 'A' and 'B ' , respectively. The region marked 'A ' represents the tweezer-end and the fracture here is of the brittle type. Further down along the length of the fibre, at 'B ' also, the fracture is brittle. Introduction of brittle fracture is not surprising because this is indeed what could be expected from fibres exposed to T 's as high as 500°C and 550°C, which have suffered weight loss, surface damage, etc. What is interesting is, however, the longitudinal splitting in the region which bridges 'A ' and 'B' . The micrograph shows that in between 'A ' and 'B' , the fibre has split open--very much like a banana slit through with a knife--along the axial line of the 'macro slip'. The line of 'macro slip' can be seen in figure 11 also. The ease of axial splitting of the fibre along this line thus suggests that the 'macro slip' represents a region of poor structural integrity introduced during ageing.
It must be pointed out that although the fibre was meant to be broken only at 'A ' (figure 11), it broke unexpectedly at 'B ' also. Introduction of double or multiple fractures could be correlated with the thermally induced ring-like feature which were found to engulf partially, the circum- ference of the fibre (figure 10e). When the fibre is broken at one end, it is not uncommon that the shock of breaking is felt a little distance along the fibre, away from the broken end. In fact, when Kevlar is broken in tension, the energy associated with the recoil of the broken tips is known to cause axial compression (Allen 1987). When structurally damaged and consequently weak regions are present in the neighbourhood of the broken tip, as in the
Figure 11. SEM from filament exposed at 550°C and fractured.

1022 R V lyer and
case of the ring-like damages in figure 10e, the shock of breaking the fibre could be expected to lead to additional fractures in these already weak regions. The fracture observed at 'B ' appears to be one such example of the transmission of the effect of fracture at the free end, down the length of the fibre.
The heat-treated fibre exhibits a reduction in the average value of thickness (figure 12). In the case of fibres exposed to 500°C for 3 h the diameter is reduced to 10.11(19) l am (not shown in figure 12). It must be emphasized that the observed reduction does not corres- pond to uniform thinning of the fibre. It is an averaged out effect arising primarily from the thermally induced, localised surface damages. Also, when the fibre turns hollow--as has been seen in the present study--it is likely that the regions surrounding the hollow centre tend to collapse towards the core and thus cause an overall radial shrinkage of the fibre. Evidence for such a collapse is shown in the micrograph in figure 10c where the process of material falling into the hollow central region has been registered. At this juncture, attention may also be drawn to the difference in the hollowness of fibres exposed to 500°C and 550°C respectively. Despite the lower value of the temperature, the former (figure 10c) is more hollow than the latter (figure 10e). The hole in the latter is also conspicuously, not circular in shape. The anomalous reduction in the hollowness of fibres exposed to a higher temperature, may be correlated with an enhanced collapse of material into the central, hollow region. When the inward collapse of material is not isotropic, the hollow section can also lose the circular character. Such aniso- tropic shrinkage can also lead to wrinkles or 'macro slips' on the skin of the fibre (figure 10e). The proposed anisotropic shrinkage further suggests that the radially oriented pleated structure which characterizes Kevlar
14
13 A
E 12 ....=
11
10
~ O
• 500 C • 550
I I I 0 20 40 60 80
tcum (T) {min)
Figure 12. Thermally induced reduction in the fibre diameter with standard deviations ranging from 0.19 to 0.39 Jam.
Kalyani Vijayan
fibres (Dobb et al 1977), is likely to get affected during the inward collapse of material.
3.4 Tensile characteristics
Introduction of hollowness and various other surface damages can lead to deterioration in the tensile strength of the fibre. As mentioned earlier, on account of their brittleness, tensile testing could not be carried out for all the heat-treated fibres. Table 5, however compares the tensile strength and modulus of fibres exposed for five min to 500°C with the values prior to heat treatment. The reductions, especially in tensile strength, conform
Table 4. Typical examples of the A/tr values for weight loss.
A -- Wbefore heating
tc,~,(T) (rain) - Wafter heating T = 500°C (%) o- A/o-
15 6-31 0.12 52 30 9.99 0.56 17-8 45 15.2 0.56 27.3
Starting material with crystallinity Kt
Isothermal I ageing at T m Td
Evolution of volatile
components leading to
prog~ssive loss in weight
carbonized fraction
Residue
I
(This f r a c t i ~
carbonized end product
t crystalline fraction
with erystallinity
K2 < Ki
(This fraction
decreases with
ageing)
Figure 13. Schematic representation of the macro changes accompanying isothermal decomposition of Kevlar 49 fibres at T= Td.

Decomposition behaviour of Kevlar 49 fibres 1023
Table 5. Comparison of tensile properties.
Tensile strength Tensile modulus Sample (GPa) (GPa)
As received 3-25 (16) 107 (6) 500°C, 5 min 0.98 (42) 94 (9)
Table 6. Thermally induced effects and their possible influ- ence on tensile properties.
Possible effect on tensile Observations properties
strain and misalignment of polymer chains about the fibre axis. The macro as well as the crystallographic structural changes suggest deterioration in tensile properties which has indeed been confirmed experimentally.
Acknowledgements
Reduction in crystallinity Closing-up of equatorial reflections
Sharpening of reflections in the initial stages of thermal ageing
Broadening of reflections close to decomposition
Increase in azimuthal spread-- misalignment of polymer chains about the fibres axis Weight loss
Introduction of hollowness and extensive surface damages
Reduction in modulus Reduction in strength
Improvement in modulus
Deterioration in modulus
Reduction in modulus
Reduction in strength
Reduction in both strength and modulus
well with the results derived from X-ray, SEM and weight analysis, though in a qualitative manner.
Figure 13 and table 6 summarize the results presented thus far in this paper. The figure is a schematic repre- sentation of the macro changes which have been found to accompany isothermal decomposition of Kevlar fibres, derived from X-ray diffraction, weight analysis, micro- scopy and infrared data. The table lists the major obser- vations and their possible influence on the initial tensile properties.
4. Conclusion
Decomposition of Kevlar 49 fibres is controlled by two parameters, viz. T and teum(T ). Isothermal decomposition at T ~- Ta of 500/550°C is preceded by several structural changes. At the macro level, the fibres manifest a conspicuous reduction in weight, possibly, due to evolu- tion of components from within. Introduction of extensive surface damages support such evolution through the surface. The fibres are also characterized by loss of material near the core. In addition to the macro features, changes at the level of the crystal lattice are also introduced. Prominent among these are the progressive diminution and the eventual total loss in crystallinity, increase in the inter layer distance in the crystal structure, changes in crystallite size and/or introduction of micro-
The authors are grateful to the Aeronautical Research and Development Board of India for the sanction of a project under which the work reported in this paper was carried out. One of us (RVI) thanks the CSIR for the award of the senior research fellowship. The authors sincerely acknow- ledge the useful comments from the referee. They wish to express their thanks to Dr T A Bhaskaran and Mr M A Venkatswamy for their help in recording the scanning electron micrographs, Mr M A Parameswara for his help in recording the optical micrographs, Drs R M V G K Rao and A Padma for recording the IR patterns, and Dr A K Singh for the encouragement and support.
References
Allen S R 1987 J. Mater. Sci. 22 853 Bearden J A 1933 Phys. Rev. 43 92 Dobb M G and Robson R M 1990 J. Mater. Sci. 25 459 Dobb M G, Johnson D J and Saville B P 1977 J. Polym. Sci.
Polym. Phys. Ed. 15 2201 DuPont Bulletin 1974 K-1 Hindeleh A M and Abdo sh M 1989 Polymer 30 218 Iyer R V and Vijayan K 1994 in Polymer science: Recent
advances 1 (ed) I S Bhardwaj (New Delhi: Allied) p. 362 Iyer R V and Vijayan K 1998 J. Mater. Sci. (communicated) Kalashnik A T, Panikarova N P, Dovbh Ye V, Kozhina G V,
Kalmykova V D and Papkov S P 1978 Polym. Sci. USSR 19 3173 Konopasek L and Hearle J W S 1977 J. Appl. Polym. Sci. 21
2791 Meredith R 1975 Text. Progr. 7 No. 4 Morgan R J, Pruneda C O and Steele W J 1983 J. Polym. Sci.
Polym. Phys. Ed. 21 1757 Northolt M G 1974 Eur. Polym. J. 10 799 Panar M, Avakian A, Blume R C, Gardner K H, Gierke T D and
Yang H H 1983 J. Polym. Sci. Polym. Phys. Ed. 21 1955 Parimala H V 1992 Some investigations on the properties and
behaviour of Kevlar fibres, M.Phil. Thesis, Mangalore Uni- versity, Mangalore
Penn L and Larson F 1979 J. Appl. Polym. Sci. 23 59 Shubha M, Parimala H V and Vijayan K 1991 J. Mater. Sci.
Lett. 10 1377 Tadokoro H 1979 in Structure of crystalline polymers (New
York: Wiley) p. 397 Vijayan K 1987 Curr. Sci. 56 1055 Wakelin J H, Virgin H S and Crystal E 1959 J. Appl. Phys. 30
1654 Yang H H 1989 in Aromatic high strength fibres (New York:
Wiley) p. 191 Zhang Q, Liang Y and Warner S B 1994 J. Polym. Sci. Polym.
Phys. Ed. 32 2207