deconstructing automobile messaging: clues to brand strategy
TRANSCRIPT
upon what one thinks and feels about it.Positioning can be used both for tacticsand for long-term competitive advantageagainst direct and indirect competitors.1
One key approach analyses what isalready known about a product orservice in order to create a profile foroptimum positioning. The conventionalresearch exercise profiles one or severalproducts on a large array ofcharacteristics to create a product‘signature’. The signature is presumed to
INTRODUCTION
Messaging as a key tounderstanding the brandIn today’s world the consumer is awashwith advertising and promotion designedto generate both immediate purchase andto create a favourable positioning for thelonger term. Delivery on performance isvital, but positioning is critical as well.Positioning is the predisposition topurchase a product or service, based
200 Journal of Database Marketing Vol. 10, 3, 200–218 � Henry Stewart Publications 1479-182X (2003)
Deconstructing automobilemessaging: Clues tobrand strategyReceived (in revised form) 28th January, 2003
Howard Moskowitzis president and chief executive of Moskowitz Jacobs Inc., a firm he founded in 1981. He is an experimental psychologist inthe field of psychophysics and an inventor of market research technology.
Barbara Ittyjoined Moskowitz Jacobs (MJI) in 2000 as an international coordinator and soon after became a brand coordinator fori-novation Inc., the web-based sister company of MJI.
Carly Finkgraduated with honours from Lafayette College in 2001 and was awarded the Fredrick Knecht Detwiller prize for excellence infine art and art history. Currently she is working towards her masters in advertising and applied research at Boston UniversityCollege of Communications.
Jeffrey Ewaldis President of the Optimization Group, Inc., Michigan. He learned classical marketing at General Mills, Campbell Soup and J.Walter Thompson. At Optimization Group, Jeff applies measurement and continuous improvement priniciples to help clientsimprove the effectiveness of their marketing expenditures.
Abstract This paper looks at the messages conveyed by six different automobilemodels in order to identify the type of strategy adopted by the manufacturer of eachmodel. A sampling of current messages yielded 150 different elements, edited into shortdeclarative statements. These elements were combined into new combinations and thecombinations were rated on interest. Conjoint analysis showed the relative importanceof different elements as acceptance drivers, with none standing out as having strongacceptance drivers. Four segments emerged, with each model appealing to thesegments, but to different degrees. Deconstruction helps one to understand and dissectthe brand strategy by a quantitative analysis of its messaging.
Howard MoskowitzMoskowitz Jacobs Inc,1025 Westchester Avenue,White Plains, NY 1064,USA.
Tel: �1 914 421 7400e-mail: [email protected]
Respondents do not necessarily knowthat the stimuli to which they areexposed comprise already-existingmessages. Rather, they simply arepresented with a set of stimuli andinstructed to respond. Thus, it becomespossible to interweave current and newmessages in a format resemblingconventional advertising and concepttesting and, where appropriate, tomeasure the impact of a wide variety ofexisting messages. Furthermore, advancesin conjoint analysis make it even morefeasible to test a wide variety of differentmessages. Whereas studies limited to tento 20 elements may not be particularlyinteresting, because such a range cannothope to cover the array of messages,studies of 100–300 elements becomemore interesting and instructive. Themarketer and researcher can deconstructa fuller array of competitor messages.
Deconstructing messagingThe sequence of deconstruction andstimulus preparation is fairlystraightforward, as outlined in Table 1,based upon approaches previouslydeveloped.5 Deconstruction works withphrases as raw material obtained from thecompetitive frame, but without brandnames. All of the communications for acar model are fair game as inputs becausethey represent what could be said. It isimportant to deconstruct elements frommutually substitutable car models, makingthe elements created consistent with eachother.
Segmenting consumers and theproblem of direct applicabilityThe principle of segmentation is widelyused by marketers, and forms much ofthe strategy in the automotive industry.Demographics for marketing researchhelp to define, identify and segment a
be somehow isomorphic with theposition in the mind. To the degree thatthe consumer can accurately profile twoproducts and to the degree that theseproducts differ on key attributes, themarketer gets a prima facie sense ofknowing how these products truly differfrom each other. The market researchermerely needs to create the properresearch instrument (a long checklist orprofile questionnaire), validate thequestionnaire and then proceed with theresearch. Everything else becomesstatistical analysis and summarisation.
An alternative way of understandingthe positioning of a brand through itsmessages uses the research procedureknown as conjoint analysis. This methodreduces systematically designed stimuli bymeans of regression analysis.Experimental design generatescombinations of features. The researcherpresents these new ideas to consumers,who then react to these as concepts,much as they would react toconventional concepts.2 The researcherthen discovers what elements drivestrong positive responses versus strongnegative responses. Conjointmeasurement, or tradeoff analysis, thusbecomes a strong development tool. Ithas primarily been used with limitednumbers of elements, because of theneed to test various combinations.3 Morerecent applications of conjoint analysis,however, have expanded its scope tohundreds of elements opening up newvistas of application.4
Conjoint measurement has found anadditional use, namely in the analysis ofcurrent messages. Since conjoint analysisprovides a measure of utility for thedifferent messages, one can use it as aretrospective, rather than as a prospective,tool. Rather than looking at the promiseof different messages for future productsand services, one can look at the impactor efficacy of current messages.
� Henry Stewart Publications 1479-182X (2003) Vol. 10, 3, 200–218 Journal of Database Marketing 201
Deconstructing automobile messaging: Clues to brand strategy

by three criteria: the measurementinstrument used, the type of behaviourcriteria studied and the situation inwhich the behaviour occurred.8
One could create different segmentsbased upon the patterns of responses to avariety of questions in a large survey.Indeed, this type of segmentation led tooverarching segmentation systems,encompassing lifestyles.9 Thissegmentation groups people who havesimilar behaviour and characteristics,which could be advantageous inidentifying a specific population in atarget market. Through the segmentation,those specific factors that group togethervariables with the same common sourceof variation can be identified.10 Theoverarching segments, in turn, areattractive from a popular point of view.
customer base. Lifestyle segmentationwith demographic mapping helps toidentify potential customers. Lifestylesegmentation uses demographic andaggregated consumer demand data toclassify consumers into market segments.These segments share similar interests,purchasing behaviour, financial behaviourand demand for specific services.6 Whathas been problematic, however, is thenature of the segmentation. Originally,segmentation was done on the basis ofgeodemographic variables, but iteventually became rather obvious thatindividuals in the same geodemographicclass did not necessarily share the samemind set. As a consequence, marketersturned to segmentation on the basis ofpsychological factors.7 Studies have beencreated to evaluate attitude measurement
202 Journal of Database Marketing Vol. 10, 3, 200–218 � Henry Stewart Publications 1479-182X (2003)
Moskowitz, Itty, Fink and Ewald
Table 1: Strategy for deconstruction studies
Gather ‘in-market’ ads as raw material. Focus on mutually substitutable car models, so that the rawmaterial is fairly homogeneous.
Deconstruct ads to elements. Where possible make these elements into standalone, declarative phrases.
Cull the set of elements to reduce obvious redundancies. If the deconstruction study is to be run on theinternet, then cull the elements to a total of 150 or fewer. If the deconstruction study is to be run on a PC,with a personal interview (computer aided personal interview), then cull the full set of elements to no morethan 300.
Classify the elements into categories. A category comprises a set of related elements. The classificationapproach is simply a bookkeeping device that ensures that a single concept will comprise no more thanone element from a category. In this way it becomes possible to have a single category comprise a varietyof different ideas. Since there is only one element per category in any concept, there is no chance that twomutually contradictory ideas from the same category could ever appear.
Dimensionalise the elements by locating each element on a set of four to eight non-evaluative semanticscales (eg, for males versus for females). Dimensionalisation will be used for data imputation of missingutility values in the conjoint task, for concept-response segmentation and for the creation of newautomobile concepts.
Restrict pairs of elements from appearing, if they comprise contradictory elements.
Mix/match and test combinations of elements. Use experimental design to create these combinations. Ifpossible use a single design structure, but have the actual elements fleshing out that design structuredifferently from one respondent to another. In that way, ensure that there will be no repeat concepts, andtherefore the probability of bias will be reduced substantially.
Invite respondents to participate on an internet-based interview.
Estimate part-worth element utilities and impacts, using dummy-variable regression analysis.
Segment customers on the basis of impact patterns to create new subgroups.
Optimise new concepts embodying product and/or positioning.
optimum sensory levels fall into the samecluster or segment. The approach wasshown to yield very powerfulsegmentations with radically differentproducts appealing to the differentsegments,12,13 and was used to createproducts as different as coffee, credit cardsand orange juice. On a practical level,products such as Vlasic Zesty pickle andthe line of Vlasic pickles, as well asTropicana Grovestand Orange Juice, werecreated according to this organisingprinciple.
The segmentation method can beextended to conjoint analysis resultsrather straightforwardly. The elementutilities replace the product liking scores.The locations on the non-evaluativesemantic scales replace the productsensory characteristics. The sameapproach, that is, identifying theoptimum level where a person’s likingpeaked, can be done for the conceptelements, only this time the optimum isthe maximum utility score. Rather thanfinding the sensory level correspondingto this maximum liking, the semanticdifferential value corresponding to themaximum utility is then identified. Theresults generate a profile of semanticlevels corresponding to optimum utilityvalues. This profile is generated on anindividual-by-individual basis.
Applying this approach to conceptelements generates different groups ofrespondents, showing different locationson the semantic differential scales wheretheir utilities maximise. Rather thanclustering individuals on the basis of thesize of their utility values (which is scaledependent and, thus, possibly subject toartifacts), the approach clusters individualson profiles in the semantic profiledomain. Individuals falling into differentsegments show different peaks of‘meaning’ where their utilities maximise.This segmentation has been done forconcepts about products such as coffee
Segments have publicity value as wellas strategic value. They are good for‘sound bites’. Segments make interestingstories for popular magazines, and canchange the way people think about theproduct and service categories. What isdifficult, however, is the mapping ofgeneral category membership to thespecific action that one should take witha particular brand. For cars, knowing thata person seeks modern technology doesnot particularly identify what features andmessaging would work for that segment.Would every statement about technologywork? It is relatively easy to eliminatecertain obvious incompatibilities, such asemotional talk to an individual fallinginto the rational, fact-oriented,technology-sensitive segment. But, whatspecific message does the individual needto hear to create a positive response?Beyond the segmentation it is often still‘hit or miss’, albeit played out in anarrower framework.
For deconstruction work it is importantto be able to apply segmentationprinciples to the large number of stimulusinputs.11 The method of IdeaMap, usedhere, also enables the researcher and themarketer to use this wide array of stimulias inputs to the segmentation. Rather thanlimiting the focus to the 20–40 elementsand thus having a segmentation that isbased upon a limited range of input, theIdeaMap-based segmentation works witha larger set of 100� elements.Furthermore, rather than segmenting onthe basis of the magnitude of utility valuesalone, the segmentation approach usedhere is based on an organising principlefirst used in psychophysics (a branch ofexperimental psychology) and in productresearch. The principle states that as asensory attribute increases, liking firstincreases, peaks and then drops down.Each individual respondent generates aprofile of optimal sensory levels for aproduct. Individuals showing similar
� Henry Stewart Publications 1479-182X (2003) Vol. 10, 3, 200–218 Journal of Database Marketing 203
Deconstructing automobile messaging: Clues to brand strategy

Malibu, Saturn L100 and Honda Civic).These models are, in general, reasonablysimilar and at the same time provide asubstantial amount of printed informationfrom which the elements can beextracted. Examples of the raw materialappear in Table 2. The table shows thecategory into which the element wasplaced, the model and the actual text.
DimensionalisationFrom the authors’ experience, arespondent can only assess a limitednumber of concept elements, usually20–40, embedded in approximately 60concepts. Beyond that number therespondent must be paid to participate,but even so a typical respondent canonly assess about 100 concepts beforecomplaining of fatigue. That limitednumber is adequate if the goal of theresearch is to identify the features of anew product. Through pre-work, onecan narrow down the number of possibleelements to the restricted limit of 20–40.For deconstruction analysis, however, the
and credit cards.14 In deconstructionwork the segmentation has been appliedto functional foods15 and energy. Thispaper presents the deconstruction methodcoupled with segmentation as a way tocreate new sub-groups for automobilecommunication.
What is important about theabove-mentioned segmentation,combined with conjoint analysis, is itsimmediate applicability to the problem athand. The segmentation does not claimto be general. However, if across studieswith different products and services onediscovers the same segments repeating,then this commonality across categoriessuggests a likely general segmentationtranscending any particular study.
METHOD
StimuliThe elements for this study were createdusing the current in-market messagingfrom six models (Ford Contour, Mazda626, Oldsmobile Alero, Chevrolet
204 Journal of Database Marketing Vol. 10, 3, 200–218 � Henry Stewart Publications 1479-182X (2003)
Moskowitz, Itty, Fink and Ewald
Table 2: Example of elements, including category, model from which the element was sourced and the textof the element (where necessary the text was slightly altered to create a simple declarative statement)
Category Model Text
ExteriorExterior
Exterior
InteriorInteriorInteriorPerformancePerformancePerformanceSafetySafety
SafetyTaglinesTaglinesTaglinesTaglines
Ford ContourMazda 626
Oldsmobile Alero
Chevrolet MalibuFord ContourSaturn LSChevrolet MalibuFord ContourHonda CivicFord ContourSaturn L100
Saturn L100Mazda 626Mazda 626Oldsmobile AleroOldsmobile Alero
Comes with fog lampsFree-surface reflector halogen headlights with automatic shut-offfeatureFour-wheel independent suspension — each wheel respondsindependently to uneven road surfaces providing a smoother,more controlled rideAvailable with rear seat heat ductsRear seat compartment heat ductsRear seatbacks can be folded to expand cargoFront independent strut suspension with anti-roll barA 2.5L six-cylinder engine w/four-speed automatic transaxleNew double-wishbone suspension systemSecuriLockTM passive anti-theft systemWith energy-absorbing knee bolsters for driver and frontpassengerBuilt with safety tempered side and rear window glassBeautiful and versatileSafety is a high priorityV-6 200 lb–ft of torque generates good getawayPowerful all-disc braking system includes standard ABS
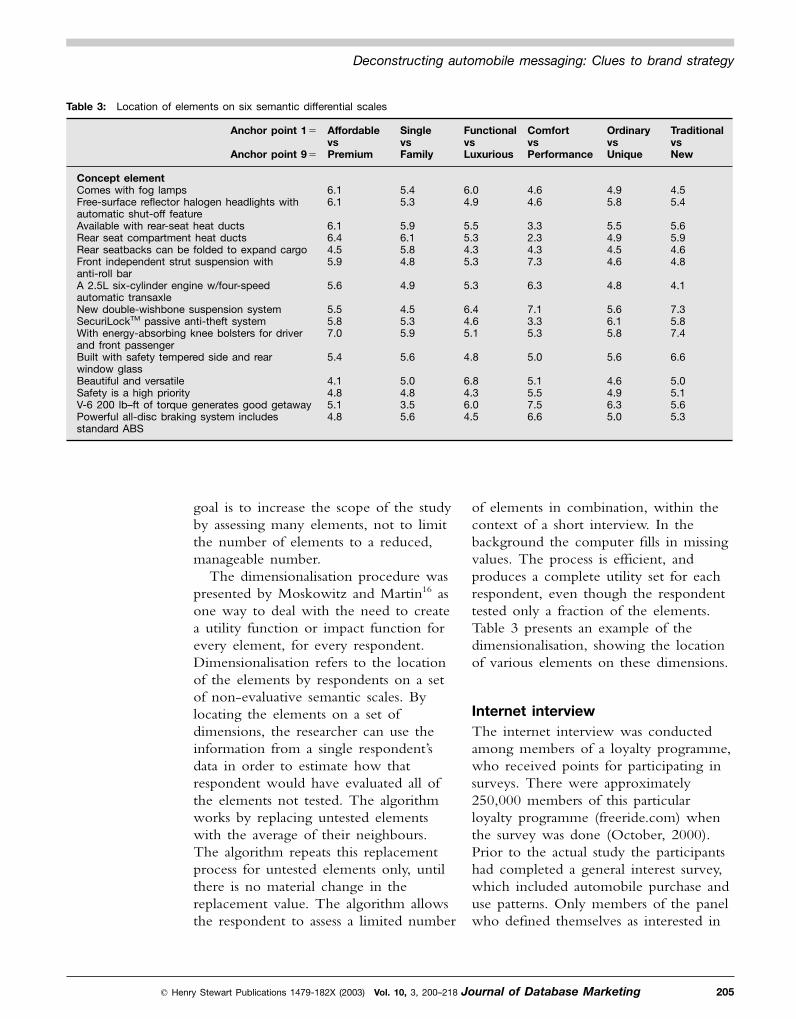
of elements in combination, within thecontext of a short interview. In thebackground the computer fills in missingvalues. The process is efficient, andproduces a complete utility set for eachrespondent, even though the respondenttested only a fraction of the elements.Table 3 presents an example of thedimensionalisation, showing the locationof various elements on these dimensions.
Internet interviewThe internet interview was conductedamong members of a loyalty programme,who received points for participating insurveys. There were approximately250,000 members of this particularloyalty programme (freeride.com) whenthe survey was done (October, 2000).Prior to the actual study the participantshad completed a general interest survey,which included automobile purchase anduse patterns. Only members of the panelwho defined themselves as interested in
goal is to increase the scope of the studyby assessing many elements, not to limitthe number of elements to a reduced,manageable number.
The dimensionalisation procedure waspresented by Moskowitz and Martin16 asone way to deal with the need to createa utility function or impact function forevery element, for every respondent.Dimensionalisation refers to the locationof the elements by respondents on a setof non-evaluative semantic scales. Bylocating the elements on a set ofdimensions, the researcher can use theinformation from a single respondent’sdata in order to estimate how thatrespondent would have evaluated all ofthe elements not tested. The algorithmworks by replacing untested elementswith the average of their neighbours.The algorithm repeats this replacementprocess for untested elements only, untilthere is no material change in thereplacement value. The algorithm allowsthe respondent to assess a limited number
� Henry Stewart Publications 1479-182X (2003) Vol. 10, 3, 200–218 Journal of Database Marketing 205
Deconstructing automobile messaging: Clues to brand strategy
Table 3: Location of elements on six semantic differential scales
Anchor point 1� Affordablevs
Anchor point 9� Premium
SinglevsFamily
FunctionalvsLuxurious
ComfortvsPerformance
OrdinaryvsUnique
TraditionalvsNew
Concept elementComes with fog lampsFree-surface reflector halogen headlights withautomatic shut-off featureAvailable with rear-seat heat ductsRear seat compartment heat ductsRear seatbacks can be folded to expand cargoFront independent strut suspension withanti-roll barA 2.5L six-cylinder engine w/four-speedautomatic transaxleNew double-wishbone suspension systemSecuriLockTM passive anti-theft systemWith energy-absorbing knee bolsters for driverand front passengerBuilt with safety tempered side and rearwindow glassBeautiful and versatileSafety is a high priorityV-6 200 lb–ft of torque generates good getawayPowerful all-disc braking system includesstandard ABS
6.16.1
6.16.44.55.9
5.6
5.55.87.0
5.4
4.14.85.14.8
5.45.3
5.96.15.84.8
4.9
4.55.35.9
5.6
5.04.83.55.6
6.04.9
5.55.34.35.3
5.3
6.44.65.1
4.8
6.84.36.04.5
4.64.6
3.32.34.37.3
6.3
7.13.35.3
5.0
5.15.57.56.6
4.95.8
5.54.94.54.6
4.8
5.66.15.8
5.6
4.64.96.35.0
4.55.4
5.65.94.64.8
4.1
7.35.87.4
6.6
5.05.15.65.3
research into new products and intotracking studies, such stringent criterianeed not be applied for a firstdeconstruction study. The goal here is tofind automobile users, look at theirindividual utility functions, divide therespondents by their classification scores,and then see how closely the sub-groupsagree with each other in their response tothe current positioning. Afterwards, itmakes sense to apply the most expensivecriteria so commonly used in the industryfor screening and qualifying respondents.
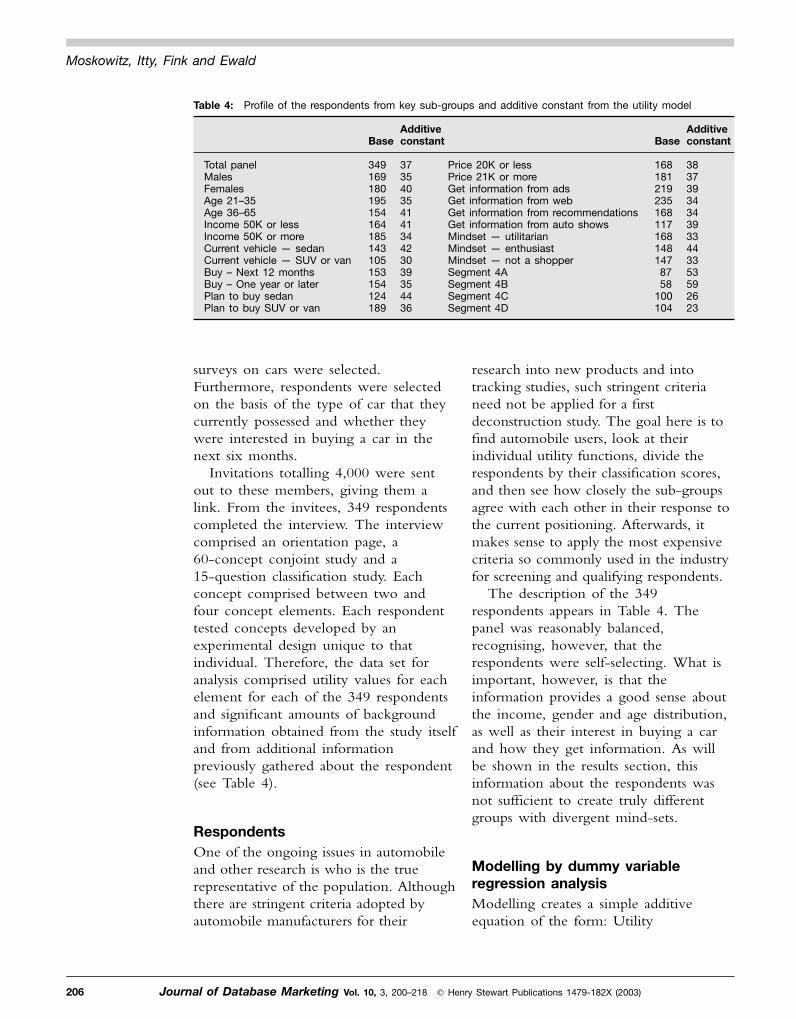
The description of the 349respondents appears in Table 4. Thepanel was reasonably balanced,recognising, however, that therespondents were self-selecting. What isimportant, however, is that theinformation provides a good sense aboutthe income, gender and age distribution,as well as their interest in buying a carand how they get information. As willbe shown in the results section, thisinformation about the respondents wasnot sufficient to create truly differentgroups with divergent mind-sets.
Modelling by dummy variableregression analysisModelling creates a simple additiveequation of the form: Utility
surveys on cars were selected.Furthermore, respondents were selectedon the basis of the type of car that theycurrently possessed and whether theywere interested in buying a car in thenext six months.
Invitations totalling 4,000 were sentout to these members, giving them alink. From the invitees, 349 respondentscompleted the interview. The interviewcomprised an orientation page, a60-concept conjoint study and a15-question classification study. Eachconcept comprised between two andfour concept elements. Each respondenttested concepts developed by anexperimental design unique to thatindividual. Therefore, the data set foranalysis comprised utility values for eachelement for each of the 349 respondentsand significant amounts of backgroundinformation obtained from the study itselfand from additional informationpreviously gathered about the respondent(see Table 4).
RespondentsOne of the ongoing issues in automobileand other research is who is the truerepresentative of the population. Althoughthere are stringent criteria adopted byautomobile manufacturers for their
206 Journal of Database Marketing Vol. 10, 3, 200–218 � Henry Stewart Publications 1479-182X (2003)
Moskowitz, Itty, Fink and Ewald
Table 4: Profile of the respondents from key sub-groups and additive constant from the utility model
BaseAdditiveconstant Base
Additiveconstant
Total panelMalesFemalesAge 21–35Age 36–65Income 50K or lessIncome 50K or moreCurrent vehicle — sedanCurrent vehicle — SUV or vanBuy – Next 12 monthsBuy – One year or laterPlan to buy sedanPlan to buy SUV or van
349169180195154164185143105153154124189
37354035414134423039354436
Price 20K or lessPrice 21K or moreGet information from adsGet information from webGet information from recommendationsGet information from auto showsMindset — utilitarianMindset — enthusiastMindset — not a shopperSegment 4ASegment 4BSegment 4CSegment 4D
1681812192351681171681481478758
100104
38373934343933443353592623
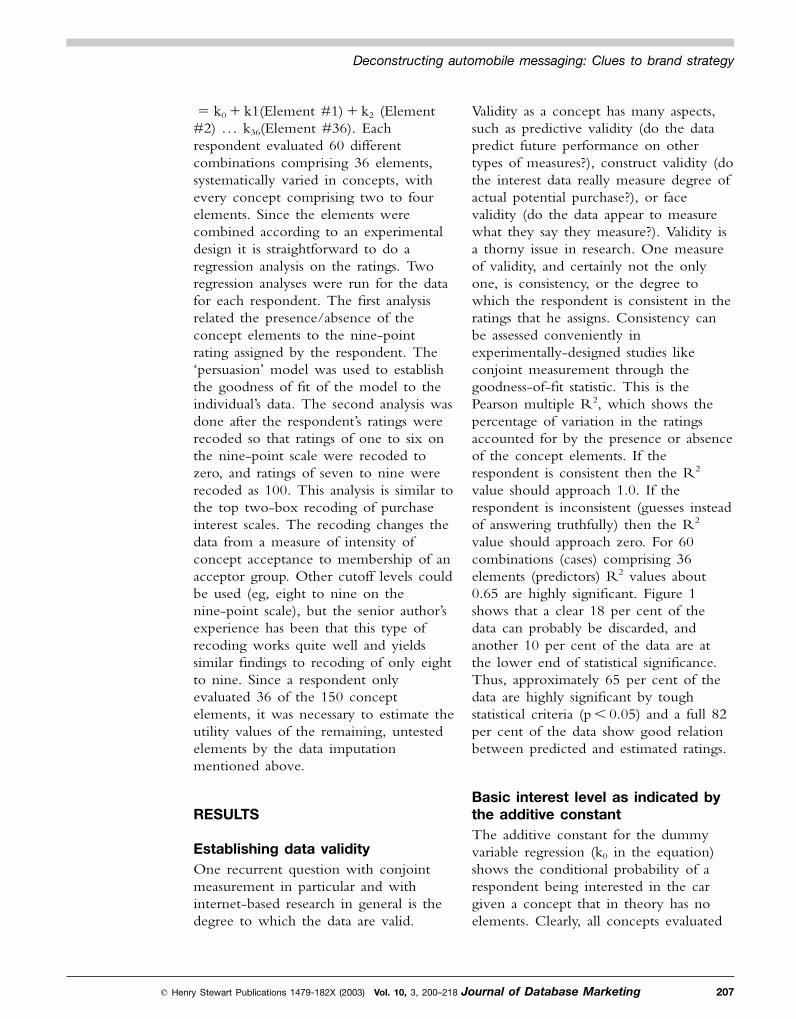
Validity as a concept has many aspects,such as predictive validity (do the datapredict future performance on othertypes of measures?), construct validity (dothe interest data really measure degree ofactual potential purchase?), or facevalidity (do the data appear to measurewhat they say they measure?). Validity isa thorny issue in research. One measureof validity, and certainly not the onlyone, is consistency, or the degree towhich the respondent is consistent in theratings that he assigns. Consistency canbe assessed conveniently inexperimentally-designed studies likeconjoint measurement through thegoodness-of-fit statistic. This is thePearson multiple R2, which shows thepercentage of variation in the ratingsaccounted for by the presence or absenceof the concept elements. If therespondent is consistent then the R2
value should approach 1.0. If therespondent is inconsistent (guesses insteadof answering truthfully) then the R2
value should approach zero. For 60combinations (cases) comprising 36elements (predictors) R2 values about0.65 are highly significant. Figure 1shows that a clear 18 per cent of thedata can probably be discarded, andanother 10 per cent of the data are atthe lower end of statistical significance.Thus, approximately 65 per cent of thedata are highly significant by toughstatistical criteria (p � 0.05) and a full 82per cent of the data show good relationbetween predicted and estimated ratings.
Basic interest level as indicated bythe additive constantThe additive constant for the dummyvariable regression (k0 in the equation)shows the conditional probability of arespondent being interested in the cargiven a concept that in theory has noelements. Clearly, all concepts evaluated
� k0 � k1(Element #1) � k2 (Element#2) . . . k36(Element #36). Eachrespondent evaluated 60 differentcombinations comprising 36 elements,systematically varied in concepts, withevery concept comprising two to fourelements. Since the elements werecombined according to an experimentaldesign it is straightforward to do aregression analysis on the ratings. Tworegression analyses were run for the datafor each respondent. The first analysisrelated the presence/absence of theconcept elements to the nine-pointrating assigned by the respondent. The‘persuasion’ model was used to establishthe goodness of fit of the model to theindividual’s data. The second analysis wasdone after the respondent’s ratings wererecoded so that ratings of one to six onthe nine-point scale were recoded tozero, and ratings of seven to nine wererecoded as 100. This analysis is similar tothe top two-box recoding of purchaseinterest scales. The recoding changes thedata from a measure of intensity ofconcept acceptance to membership of anacceptor group. Other cutoff levels couldbe used (eg, eight to nine on thenine-point scale), but the senior author’sexperience has been that this type ofrecoding works quite well and yieldssimilar findings to recoding of only eightto nine. Since a respondent onlyevaluated 36 of the 150 conceptelements, it was necessary to estimate theutility values of the remaining, untestedelements by the data imputationmentioned above.
RESULTS
Establishing data validityOne recurrent question with conjointmeasurement in particular and withinternet-based research in general is thedegree to which the data are valid.
� Henry Stewart Publications 1479-182X (2003) Vol. 10, 3, 200–218 Journal of Database Marketing 207
Deconstructing automobile messaging: Clues to brand strategy
— lower income respondents showhigher constants than higher incomepeople
— sedan owners show much higherconstants than SUV owners
— respondents likely to buy in the nextsix months show higher constantsthan respondents likely to buy later
— price of car does not affect theconstant
— those who find out about cars fromauto shows or who are self-describedauto enthusiasts show higherconstants.
Total panel — What wins? Whatloses? Who gets it right?The utility value of an element showsthe additional conditional probability thata person will rate the concept asinteresting (seven to nine) if the elementis inserted into the concept. One can
by any single respondent comprised someelements, so that the additive constant isa purely computed parameter inregression analysis. Nonetheless, theconstant can be interpreted as the basicinterest, and therefore as a baseline value.The additive model comes from thedummy variable regression in which theratings on the nine-point interest scalewere transformed to zero (not interested)or 100 (interested). Table 4 shows thevalues for a variety of groups. Whatemerges quite clearly is the similarity ofthese values for the different sub-groups.All constants lie around 35–45,suggesting a modest level of basicinterest. There are some differencesamong sub-groups:
— females show higher constants thanmales
— older respondents show higherconstants than younger respondents
208 Journal of Database Marketing Vol. 10, 3, 200–218 � Henry Stewart Publications 1479-182X (2003)
Moskowitz, Itty, Fink and Ewald
NB Good data are defined as a model that describes the results (R2 � 0.05) and highly significant results arethose showing goodness of fit statistics with R2 � 0.65 (p � 0.05)
Figure 1: Goodness of fit of the 349 individual utility functions
Poor data Good data
0.0 0.2 0.4 0.6 0.8 1.0
R-squared value for respondents
287 out of 349 (82%) show high discrimination (ie good data)
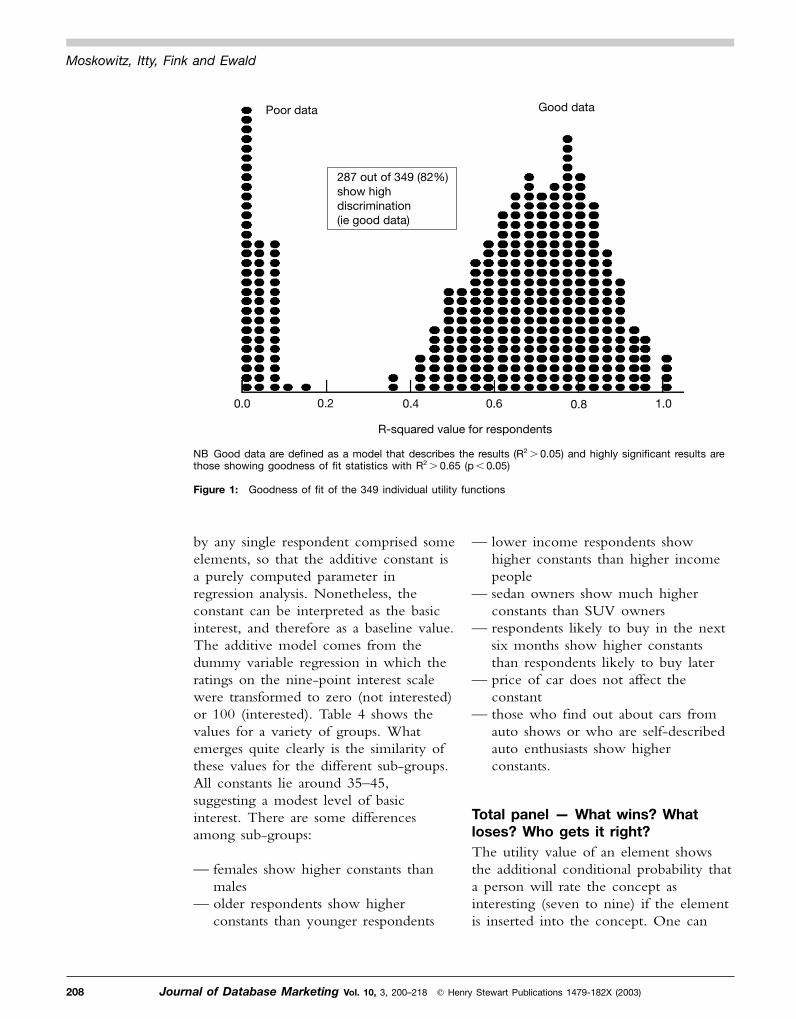
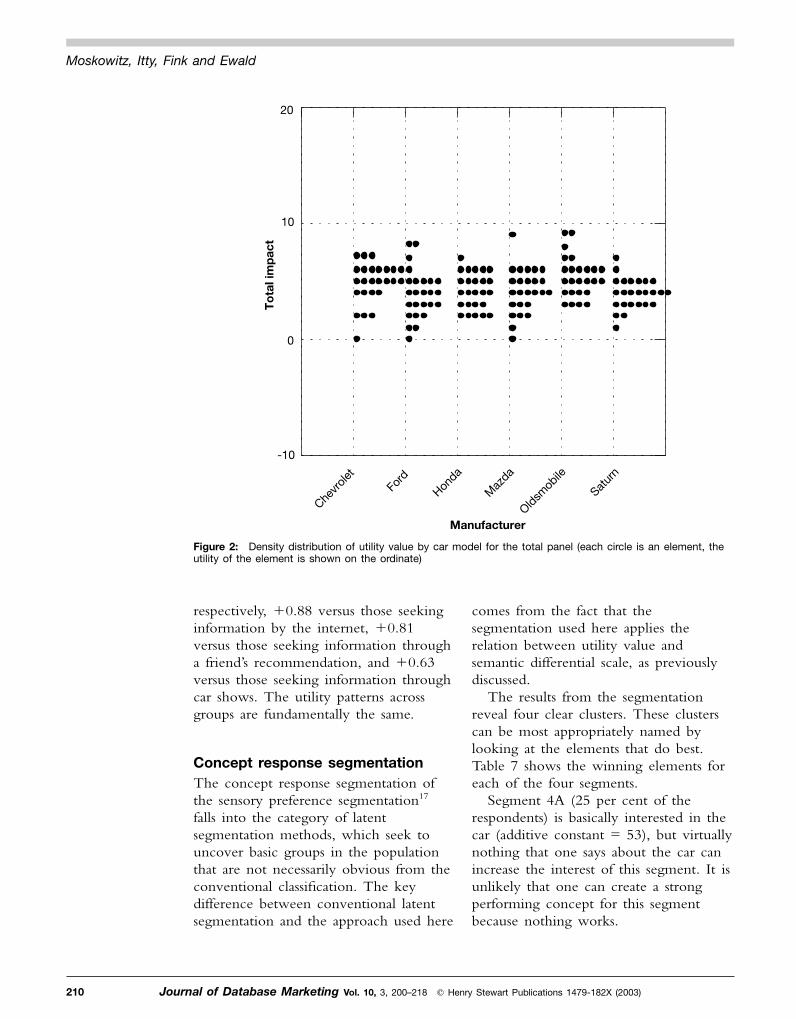
narrow ranges for the utility values.None are negative, meaning that theprocess of screening the messages does aneffective job of eliminating clearly poormessages, at least for the entire panel.On the other hand, this screening alsoeliminates elements that might havescored better than the highest valueachieved (�9). Representative resultsappear in Table 5.
Does self-description make adifference?One interesting way to divide therespondents is by self-stated interest incars. Respondents described themselvesby one of three categories: utilitarian,enthusiast or non-shopper. Table 6 showsvirtually no major differences in theutility patterns. The differences areslightly quantitative (eg, whereas onesegment might show a utility value of�10 for an element, another segmentmight show a utility value of �7). Thissimilarity of self-description, only one ofseveral such similar results found bysegmenting through self-description,means that conventional ways to dividethe population may be easy to do, butdo not generate much new insight. Thesame type of high correlation amongelements occurs for respondents seekinginformation about cars in different ways.For example, the correlation of utilityvalues for those seeking informationabout cars through advertisements is,
create concepts by beginning with theadditive model, and then put in two tofour elements to create the combination.The sum of the utilities and additiveconstant shows the estimated interest andconditional probability of the conceptachieving a rating of seven to nine.Norms for the elements are as follows,based on over 1,000 of these studies inthe commercial sector:
— utility � 16� extremely importantelement
— utility � 11–15 very importantelement
— utility � 6–10 significant and relevant— utility � 0–5 adds, but probably very
little— utility � 0 subtracts from interest.
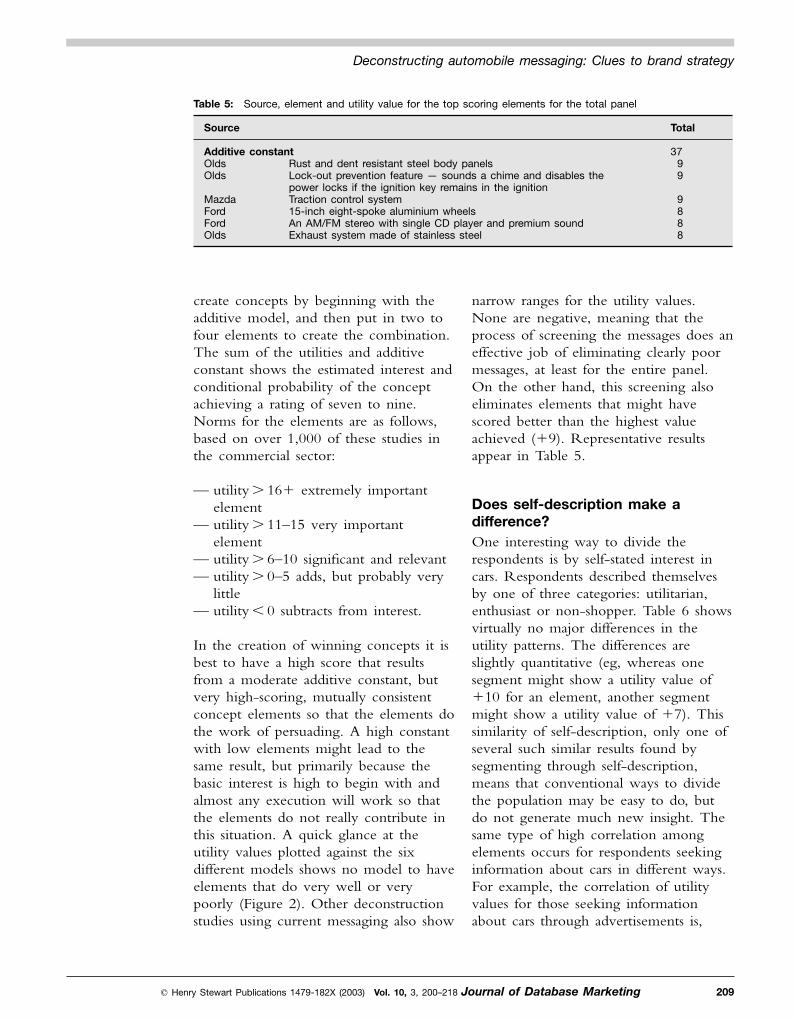
In the creation of winning concepts it isbest to have a high score that resultsfrom a moderate additive constant, butvery high-scoring, mutually consistentconcept elements so that the elements dothe work of persuading. A high constantwith low elements might lead to thesame result, but primarily because thebasic interest is high to begin with andalmost any execution will work so thatthe elements do not really contribute inthis situation. A quick glance at theutility values plotted against the sixdifferent models shows no model to haveelements that do very well or verypoorly (Figure 2). Other deconstructionstudies using current messaging also show
� Henry Stewart Publications 1479-182X (2003) Vol. 10, 3, 200–218 Journal of Database Marketing 209
Deconstructing automobile messaging: Clues to brand strategy
Table 5: Source, element and utility value for the top scoring elements for the total panel
Source Total
Additive constant 37OldsOlds
MazdaFordFordOlds
Rust and dent resistant steel body panelsLock-out prevention feature — sounds a chime and disables thepower locks if the ignition key remains in the ignitionTraction control system15-inch eight-spoke aluminium wheelsAn AM/FM stereo with single CD player and premium soundExhaust system made of stainless steel
99
9888
comes from the fact that thesegmentation used here applies therelation between utility value andsemantic differential scale, as previouslydiscussed.
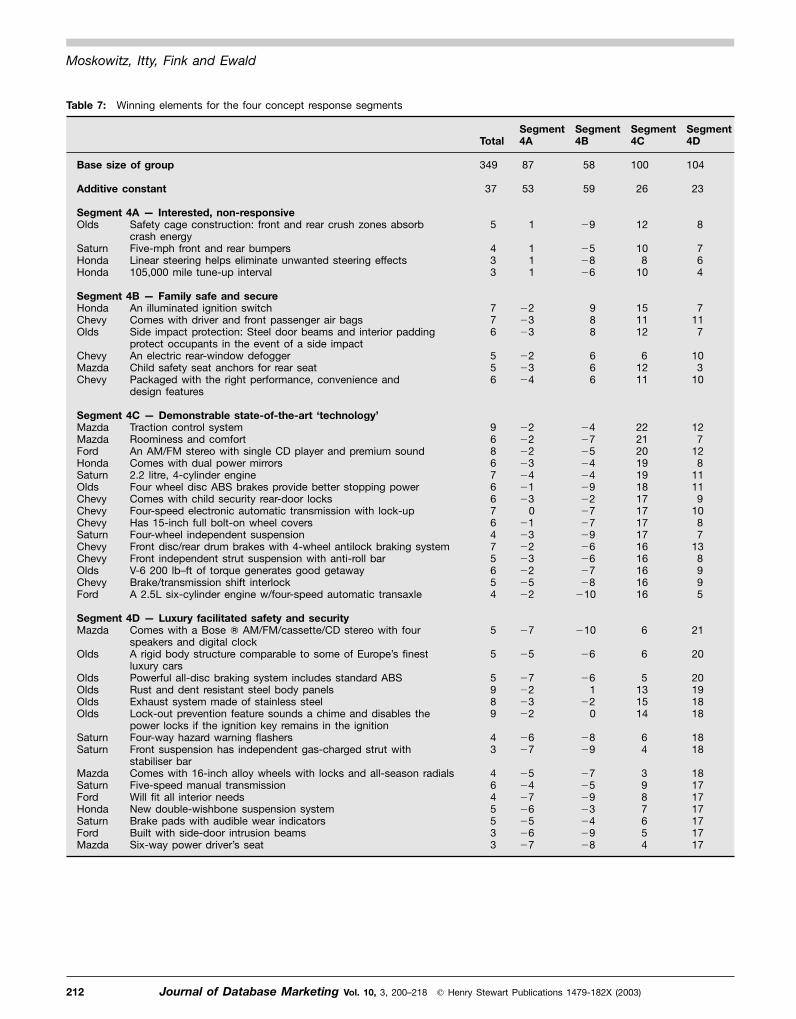
The results from the segmentationreveal four clear clusters. These clusterscan be most appropriately named bylooking at the elements that do best.Table 7 shows the winning elements foreach of the four segments.
Segment 4A (25 per cent of therespondents) is basically interested in thecar (additive constant = 53), but virtuallynothing that one says about the car canincrease the interest of this segment. It isunlikely that one can create a strongperforming concept for this segmentbecause nothing works.
respectively, �0.88 versus those seekinginformation by the internet, �0.81versus those seeking information througha friend’s recommendation, and �0.63versus those seeking information throughcar shows. The utility patterns acrossgroups are fundamentally the same.
Concept response segmentationThe concept response segmentation ofthe sensory preference segmentation17
falls into the category of latentsegmentation methods, which seek touncover basic groups in the populationthat are not necessarily obvious from theconventional classification. The keydifference between conventional latentsegmentation and the approach used here
210 Journal of Database Marketing Vol. 10, 3, 200–218 � Henry Stewart Publications 1479-182X (2003)
Moskowitz, Itty, Fink and Ewald
Figure 2: Density distribution of utility value by car model for the total panel (each circle is an element, theutility of the element is shown on the ordinate)
Chevr
olet
Ford
Honda
Maz
da
Oldsmob
ile
Satur
n
-10
0
10
20
To
tal i
mp
act
Manufacturer
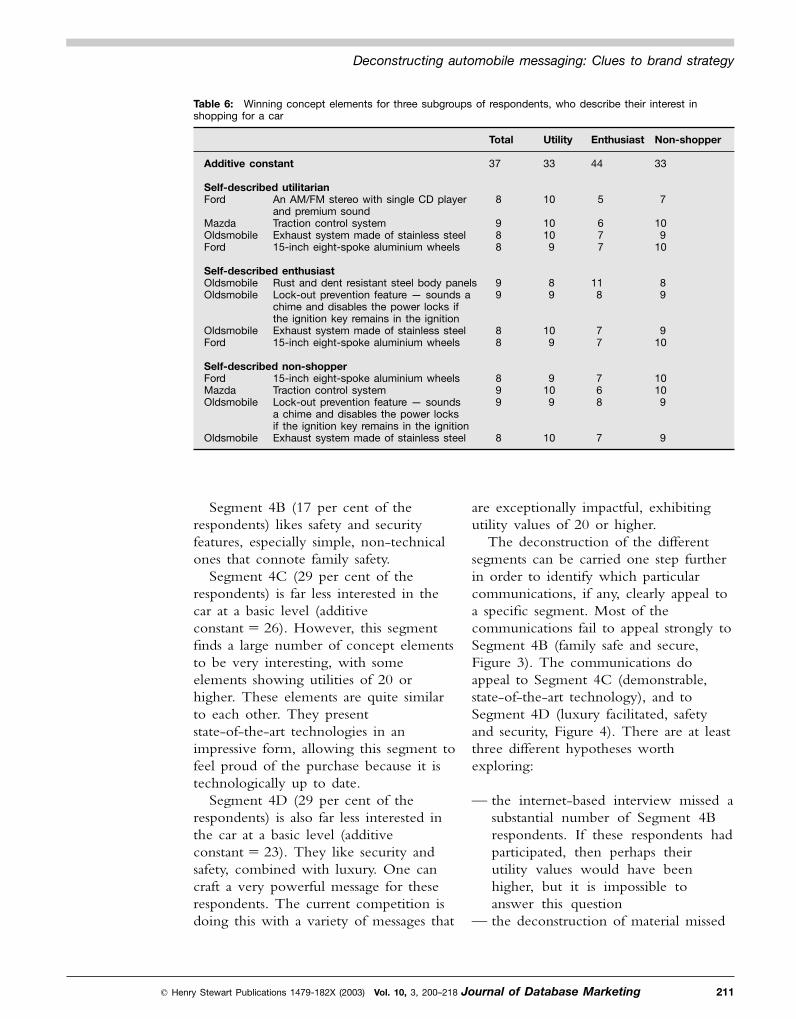
are exceptionally impactful, exhibitingutility values of 20 or higher.
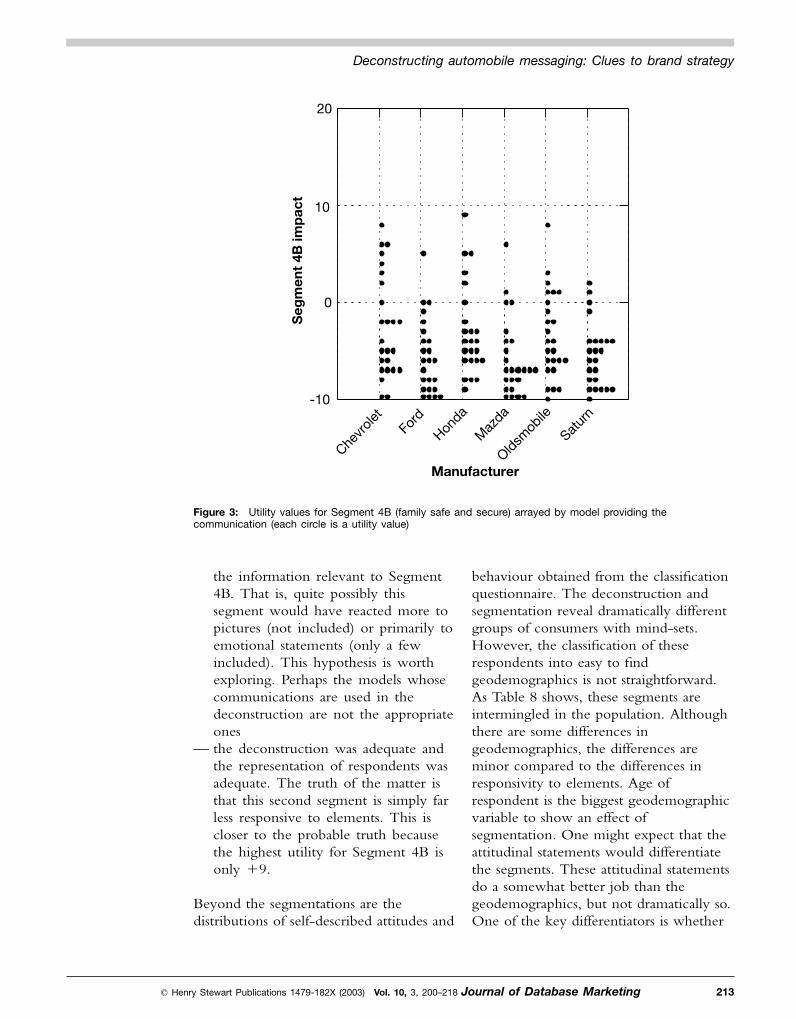
The deconstruction of the differentsegments can be carried one step furtherin order to identify which particularcommunications, if any, clearly appeal toa specific segment. Most of thecommunications fail to appeal strongly toSegment 4B (family safe and secure,Figure 3). The communications doappeal to Segment 4C (demonstrable,state-of-the-art technology), and toSegment 4D (luxury facilitated, safetyand security, Figure 4). There are at leastthree different hypotheses worthexploring:
— the internet-based interview missed asubstantial number of Segment 4Brespondents. If these respondents hadparticipated, then perhaps theirutility values would have beenhigher, but it is impossible toanswer this question
— the deconstruction of material missed
Segment 4B (17 per cent of therespondents) likes safety and securityfeatures, especially simple, non-technicalones that connote family safety.
Segment 4C (29 per cent of therespondents) is far less interested in thecar at a basic level (additiveconstant � 26). However, this segmentfinds a large number of concept elementsto be very interesting, with someelements showing utilities of 20 orhigher. These elements are quite similarto each other. They presentstate-of-the-art technologies in animpressive form, allowing this segment tofeel proud of the purchase because it istechnologically up to date.
Segment 4D (29 per cent of therespondents) is also far less interested inthe car at a basic level (additiveconstant � 23). They like security andsafety, combined with luxury. One cancraft a very powerful message for theserespondents. The current competition isdoing this with a variety of messages that
� Henry Stewart Publications 1479-182X (2003) Vol. 10, 3, 200–218 Journal of Database Marketing 211
Deconstructing automobile messaging: Clues to brand strategy
Table 6: Winning concept elements for three subgroups of respondents, who describe their interest inshopping for a car
Total Utility Enthusiast Non-shopper
Additive constant 37 33 44 33
Self-described utilitarianFord
MazdaOldsmobileFord
An AM/FM stereo with single CD playerand premium soundTraction control systemExhaust system made of stainless steel15-inch eight-spoke aluminium wheels
8
988
10
10109
5
677
7
109
10
Self-described enthusiastOldsmobileOldsmobile
OldsmobileFord
Rust and dent resistant steel body panelsLock-out prevention feature — sounds achime and disables the power locks ifthe ignition key remains in the ignitionExhaust system made of stainless steel15-inch eight-spoke aluminium wheels
99
88
89
109
118
77
89
910
Self-described non-shopperFordMazdaOldsmobile
Oldsmobile
15-inch eight-spoke aluminium wheelsTraction control systemLock-out prevention feature — soundsa chime and disables the power locksif the ignition key remains in the ignitionExhaust system made of stainless steel
899
8
9109
10
768
7
10109
9
212 Journal of Database Marketing Vol. 10, 3, 200–218 � Henry Stewart Publications 1479-182X (2003)
Moskowitz, Itty, Fink and Ewald
Table 7: Winning elements for the four concept response segments
TotalSegment4A
Segment4B
Segment4C
Segment4D
Base size of group 349 87 58 100 104
Additive constant 37 53 59 26 23
Segment 4A — Interested, non-responsiveOlds
SaturnHondaHonda
Safety cage construction: front and rear crush zones absorbcrash energyFive-mph front and rear bumpersLinear steering helps eliminate unwanted steering effects105,000 mile tune-up interval
5
433
1
111
�9
�5�8�6
12
108
10
8
764
Segment 4B — Family safe and secureHondaChevyOlds
ChevyMazdaChevy
An illuminated ignition switchComes with driver and front passenger air bagsSide impact protection: Steel door beams and interior paddingprotect occupants in the event of a side impactAn electric rear-window defoggerChild safety seat anchors for rear seatPackaged with the right performance, convenience anddesign features
776
556
�2�3�3
�2�3�4
988
666
151112
61211
7117
103
10
Segment 4C — Demonstrable state-of-the-art ‘technology’MazdaMazdaFordHondaSaturnOldsChevyChevyChevySaturnChevyChevyOldsChevyFord
Traction control systemRoominess and comfortAn AM/FM stereo with single CD player and premium soundComes with dual power mirrors2.2 litre, 4-cylinder engineFour wheel disc ABS brakes provide better stopping powerComes with child security rear-door locksFour-speed electronic automatic transmission with lock-upHas 15-inch full bolt-on wheel coversFour-wheel independent suspensionFront disc/rear drum brakes with 4-wheel antilock braking systemFront independent strut suspension with anti-roll barV-6 200 lb–ft of torque generates good getawayBrake/transmission shift interlockA 2.5L six-cylinder engine w/four-speed automatic transaxle
968676676475654
�2�2�2�3�4�1�3
0�1�3�2�3�2�5�2
�4�7�5�4�4�9�2�7�7�9�6�6�7�8
�10
222120191918171717171616161616
127
128
11119
1087
138995
Segment 4D — Luxury facilitated safety and securityMazda
Olds
OldsOldsOldsOlds
SaturnSaturn
MazdaSaturnFordHondaSaturnFordMazda
Comes with a Bose � AM/FM/cassette/CD stereo with fourspeakers and digital clockA rigid body structure comparable to some of Europe’s finestluxury carsPowerful all-disc braking system includes standard ABSRust and dent resistant steel body panelsExhaust system made of stainless steelLock-out prevention feature sounds a chime and disables thepower locks if the ignition key remains in the ignitionFour-way hazard warning flashersFront suspension has independent gas-charged strut withstabiliser barComes with 16-inch alloy wheels with locks and all-season radialsFive-speed manual transmissionWill fit all interior needsNew double-wishbone suspension systemBrake pads with audible wear indicatorsBuilt with side-door intrusion beamsSix-way power driver’s seat
5
5
5989
43
4645533
�7
�5
�7�2�3�2
�6�7
�5�4�7�6�5�6�7
�10
�6
�61
�20
�8�9
�7�5�9�3�4�9�8
6
6
5131514
64
3987654
21
20
20191818
1818
18171717171717
behaviour obtained from the classificationquestionnaire. The deconstruction andsegmentation reveal dramatically differentgroups of consumers with mind-sets.However, the classification of theserespondents into easy to findgeodemographics is not straightforward.As Table 8 shows, these segments areintermingled in the population. Althoughthere are some differences ingeodemographics, the differences areminor compared to the differences inresponsivity to elements. Age ofrespondent is the biggest geodemographicvariable to show an effect ofsegmentation. One might expect that theattitudinal statements would differentiatethe segments. These attitudinal statementsdo a somewhat better job than thegeodemographics, but not dramatically so.One of the key differentiators is whether
the information relevant to Segment4B. That is, quite possibly thissegment would have reacted more topictures (not included) or primarily toemotional statements (only a fewincluded). This hypothesis is worthexploring. Perhaps the models whosecommunications are used in thedeconstruction are not the appropriateones
— the deconstruction was adequate andthe representation of respondents wasadequate. The truth of the matter isthat this second segment is simply farless responsive to elements. This iscloser to the probable truth becausethe highest utility for Segment 4B isonly �9.
Beyond the segmentations are thedistributions of self-described attitudes and
� Henry Stewart Publications 1479-182X (2003) Vol. 10, 3, 200–218 Journal of Database Marketing 213
Deconstructing automobile messaging: Clues to brand strategy
Figure 3: Utility values for Segment 4B (family safe and secure) arrayed by model providing thecommunication (each circle is a utility value)
Chevr
olet
Ford
Honda
Maz
da
Oldsmob
ile
Satur
n
Manufacturer
-10
0
10
20
Seg
men
t 4B
imp
act
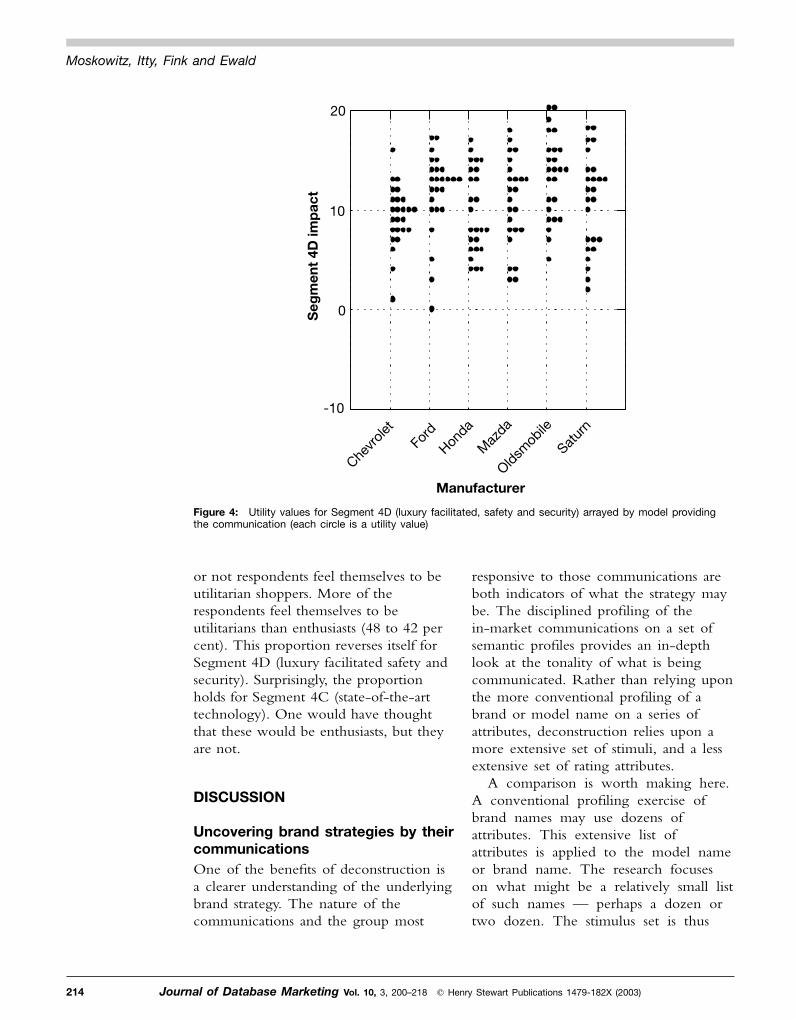
responsive to those communications areboth indicators of what the strategy maybe. The disciplined profiling of thein-market communications on a set ofsemantic profiles provides an in-depthlook at the tonality of what is beingcommunicated. Rather than relying uponthe more conventional profiling of abrand or model name on a series ofattributes, deconstruction relies upon amore extensive set of stimuli, and a lessextensive set of rating attributes.
A comparison is worth making here.A conventional profiling exercise ofbrand names may use dozens ofattributes. This extensive list ofattributes is applied to the model nameor brand name. The research focuseson what might be a relatively small listof such names — perhaps a dozen ortwo dozen. The stimulus set is thus
or not respondents feel themselves to beutilitarian shoppers. More of therespondents feel themselves to beutilitarians than enthusiasts (48 to 42 percent). This proportion reverses itself forSegment 4D (luxury facilitated safety andsecurity). Surprisingly, the proportionholds for Segment 4C (state-of-the-arttechnology). One would have thoughtthat these would be enthusiasts, but theyare not.
DISCUSSION
Uncovering brand strategies by theircommunicationsOne of the benefits of deconstruction isa clearer understanding of the underlyingbrand strategy. The nature of thecommunications and the group most
214 Journal of Database Marketing Vol. 10, 3, 200–218 � Henry Stewart Publications 1479-182X (2003)
Moskowitz, Itty, Fink and Ewald
Figure 4: Utility values for Segment 4D (luxury facilitated, safety and security) arrayed by model providingthe communication (each circle is a utility value)
Chevr
olet
Ford
Honda
Maz
da
Oldsmob
ile
Satur
n
Manufacturer
-10
0
10
20
Seg
men
t 4D
imp
act

— what the brands communicate in theiractual message
— whether the different communicationsof a single brand or model show aconsistent direction, or whether thecommunication is unfocused. Lack offocus means either tonality ofmeaning (location on the semanticscale) or attractiveness to the target. Alack of focused attractiveness meansthat some messages communicatemore for one group (egmale-oriented or expensive-oriented),and other messages communicatemore for an opposing group (egfemale-oriented orinexpensive-oriented). This is neithergood nor bad, but just a measure ofthe degree to which the messagesappeal to specific sub-groups
— the potential ‘white space’ or anattractive semantic profile that is notbeing occupied by an existingautomobile model.
limited, but the array of responses isenormous. The researcher typically thenworks with an arsenal of data analysistools in order to reduce the attributerating list to a manageable set, andlocates the limited set of brands ormodels on that reduced set. The resultis a set of profiles and possibly ageometric representation.
The current approach stands inmoderate opposition to thisconventional approach. The currentapproach uses a wide array ofcommunications provided by thedifferent models. The information is inthe test stimuli, not in the ratingattributes. The stimuli are rated on amore manageable set of attributes (eg,six as was used here, but it could beas many as 12). The researcher canthen look at the distribution of asingle brand, in all its communicationson the list of descriptor scales. Theoutcome reveals:
� Henry Stewart Publications 1479-182X (2003) Vol. 10, 3, 200–218 Journal of Database Marketing 215
Deconstructing automobile messaging: Clues to brand strategy
Table 8: Classification of respondents into the four concept response segments
Total%
Segment 4AInterested, notresponsive%
Segment 4BFamily safeand secure%
Segment 4CState-of-the-arttechnology%
Segment 4DLuxuryfacilitatedsafety andsecurity%
Total sampleMalesFemalesAge 21–35Age 36�Income up to $50KIncome $50K�Primary sedanPrimary SUV/minivanBuy within 12 monthsBuy within 12–18 monthsPlan to buy sedanPlan to buy SUV/minivanPrice � $20KPrice $20K�Information from adsInformation from webInformation from
recommendationInformation from car showsShop — utilitarianShop — enthusiast
1004852564447534130444436544852636748
344842
1004951524853473131434926595347626445
374941
1003664435736644333434138434753676740
315336
1005050554548524432494138555149607654
394941
1005347673347534526404439564258636250
274348

himself or herself, the approach looks atthe responses to the different messages,and then segments the respondents basedupon those messages. In a sense theapproach is far more behavioural(looking at respondents) and far moreconcrete (looking at specific elementsdealing with the car itself).
Jump-starting the creativity processThe remarkably ‘flat’ performance of theconcept elements for the total panel andthe clear differences among elements forthe segments suggests that it will be hardto improve these elements if the strategyinvolves either the total panel, orconventionally defined subgroups(self-stated attitudes or behaviours fromthe classification questionnaire). The totalpanel, generating a narrow range ofelement utilities and no negativeelements, shows clearly that the materialbeing communicated by the models hasalready been combed over in order toremove anything that could be apotential negative to the consumer. Atthe same time, the very low range ofutilities means that either all of therespondents agree with each other aboutthese modestly performing elements, orthere exist segments in the populationthat disagree with each other. Thesesegments counteract each other, so that,while one segment likes another segmentit may be either actively disliked, ormodestly disliked in return. The resultsare a low utility value for the total panelfor the elements.
The high-scoring elements in thesegments, which do not show up asstrongly positive in the total panel, meanthat the biggest opportunity for creativityexists with the segments. Thedeconstructed elements can be used asthe source of the new material. It isimportant, however, that the creativitygroups are set up to be relatively
Latent segments in the populationAlthough there are various methods forsegmenting respondents, most marketersopt for the easy-to-find segments. Themarketer’s job is to prepare the marketso that there is a demand for theproduct. It is critical for the marketer toidentify individuals as belonging to aspecific segment because once thatidentification is made the marketer canthen target the individual with the rightmessages. It is quite easy to identifyindividuals with specific profiles, such asgeodemographic groups, and then assumethese to be homogeneous. To the degreethat different geodemographic groupsexhibit diverse preferences incommunications, the marketing effortwill be successful.
The deconstruction analysis indicatesthat there are at least four clearly definedsegments in the population, and at leastthree segments that show strong reactionsto different types of elements. Thesegments cannot be easily identified bytheir geodemographics. Yet, these clearlyrespond in different ways to the samemessages. Furthermore, self-explicatedattitudes do not work particularly well tocreate these radically different segments.Certainly there are some differences inresponse patterns from individuals whoclassify themselves in terms of shoppingbehaviour (utilitarian versus enthusiast),but whatever differences exist are minor.The same generally positive relationshipexists among the different groupsshowing diverse ways of obtaininginformation about a car (from ads, fromfriends’ recommendation, from carshows, etc).
The concept-response segmentsdeveloped by relating utilities to semanticdifferential values may be more powerfulbecause they create segments directlyfrom the response of consumers tomessages germane to automobiles. Ratherthan asking the respondent to classify
216 Journal of Database Marketing Vol. 10, 3, 200–218 � Henry Stewart Publications 1479-182X (2003)
Moskowitz, Itty, Fink and Ewald

semantic scale into four discrete,non-overlapping segments (one tothree, three to five, five to seven andseven to nine, respectively) and callthese locations Q, R, S and T,respectively.
— create a grid of all possiblecombinations. There are six semanticscale, of four segments each or 64
combinations, this totals 46,656combinations
— search through each of these grids bycomputer, determine whether thereare elements in this space or in thesurrounding, neighbouring space, andestimate how well the elementsperform within the target segment
— a promising ‘white space’ correspondsto a location in the space that has fewelements (little existingcommunication), but what exists inthat location performs well with thatsegment.
Methodology — Use of internetresearch and validation issuesAn ongoing issue in research is theutility and validity of internet-basedinterviews. Several years ago, when theinternet was just achieving prominence,many meetings were devoted to issues ofinternet-based research. The Net Effectsmeetings, sponsored by ESOMAR(European Society of Market Research)debated the merits of such research.However, the increasing penetration ofthe internet in society, worldwide, andthe ease of obtaining data means that theinternet will not go away as a researchvenue. Comparative studies of internetand central location pre-recruit studiesshow that the data results are the samefor conjoint measurement.19 There is stillthe problem of finding and incentivisingthe hard-to-find respondents, but this is aproblem of research in general, ratherthan of the internet in particular. It is
homogeneous. With homogeneousgroups it is likely that the ideas of onerespondent will spark new ideas in themind of a like-minded individual. Incontrast, creativity may not flow as wellwhen the respondents in the creativesession are of different minds. There maybe new ideas flowing, but individuals ineach group may have a mind-set thatedits the elements subconsciously.Respondents in a creative group tend toput forward ideas that they deemimportant and interesting. If the otherindividuals in the group belong to adifferent segment, then it is likely thatthese new ideas put forward may gonowhere because they need to sparkcreativity in individuals with a differentmind-set. As a consequence the creativitystep may be aborted, simply because ofthe differences in mind-sets.
Identifying ‘white space’ in thecompetitive frame — somesuggestions for possible next stepsDeconstruction of the competitive framealso looks at where there are noelements for a particular product, andthen creates a new product idea for thatopportunity.18 The words ‘white space’refer colloquially to areas that have notbeen taken advantage of. White space bydefinition is open and, therefore, noelements are there, or perhaps nocomplete concepts. Deconstruction datamight, however, allow for some initialforays into filling that white space, ifthese five steps are followed:
— locate the elements on the semanticscale
— identify ‘empty’ areas in the semanticspace. This identification may simplyrequire a brute-force search throughthe geometric space, using some sortof simple enumeration algorithm. Forexample, one might divide each
� Henry Stewart Publications 1479-182X (2003) Vol. 10, 3, 200–218 Journal of Database Marketing 217
Deconstructing automobile messaging: Clues to brand strategy
6 Piccillo, S. (1999) ‘How marketers benefit frommapping demos’, Marketing News, Vol. 33, No.12, pp. 15–16.
7 Wells, W. D. (1975) ‘Psychographics, A criticalreview’, Journal of Marketing Research, Vol. 12, pp.196–213.
8 Tittle, C. and Hill, R. (1967) ‘Attitudemeasurement and prediction of behavior: Anevaluation of conditions and measurementtechniques’, Sociometry, Vol. 30, No. 2, pp.199–213.
9 Mitchell, A. (1983) The Nine American Lifestyles,MacMillan, New York.
10 Magidson J. and Vermunt, J. (2002) ‘Latent classmodels’, www.statisticalinnovations.com.
11 Green, P. E. and Krieger, A. M. (1991)‘Segmenting markets with conjoint analysis’,Journal of Marketing, Vol. 55, pp. 20–31.
12 Moskowitz, H. R. (1996) ‘Segmenting consumersworldwide: An application of multiple mediaconjoint methods’, Proceedings of the 49thESOMAR Congress, Istanbul, Turkey, pp.535–552.
13 Moskowitz, H. R. (1996) ‘Segmenting consumerson the basis of their response to conceptelements: An approach derived from productresearch’, Canadian Journal of Market Research, Vol.15, pp. 38–54.
14 Moskowitz, H. R., Cohen, D., Krieger, B. andRabino, S. (2001) ‘Interest and reaction timeanalysis to credit card offers: Managerialimplications of high level research procedures’,Journal of Financial Services Marketing, Vol. 6, pp.172–189.
15 Moskowitz, H. R. and Itty, B. (2002) ‘Identifyingconsumer needs for functional foods from analysisof current communications on the Internet’,Appetite, in review.
16 Moskowitz and Martin (1993) op. cit.17 Moskowitz, H. R., Jacobs, B. E. and Lazar, N.
(1985) ‘Product response segmentation and theanalysis of individual differences in liking’, Journalof Food Quality, Vol. 8, pp. 168–191.
18 Newell, S. M. (2001) ‘Distortion of ‘‘FastClockspeed’’ Product Development: UsingWeb-based Conjoint Analysis, ClockspeedAnalysis and Technology Strategy for anAutomotive Telematics System’, thesis, MIT, MITPress, Cambridge, MA.
19 Moskowitz, H. R., Gofman, A., Tungaturthy, P.,Manchaiah, M. and Cohen, D. (2000) ‘Research,politics and the Internet can mix: Considerations,experiences, trials, tribulations in adaptingconjoint measurement to optimizing a politicalplatform as if it were a consumer product’,Proceedings of Net Effects, conference held inDublin, 10–12th April, ESOMAR, pp. 109–130.
just that with the internet becoming sopopular for research, old problems arenow again rearing their heads.
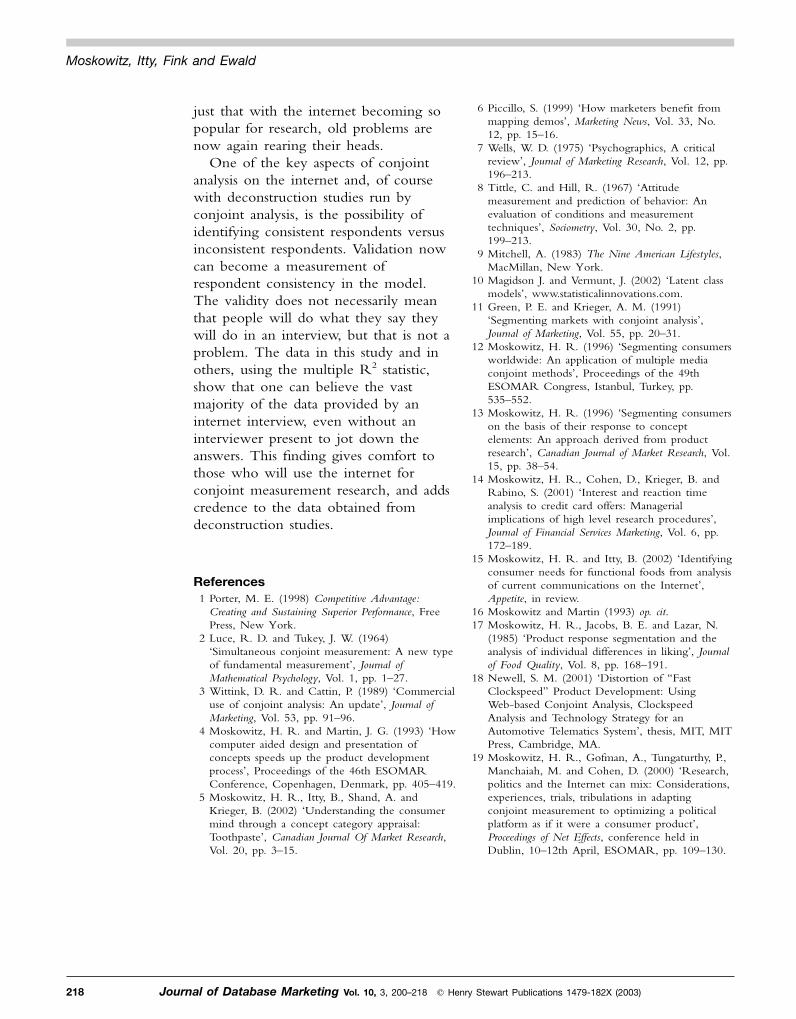
One of the key aspects of conjointanalysis on the internet and, of coursewith deconstruction studies run byconjoint analysis, is the possibility ofidentifying consistent respondents versusinconsistent respondents. Validation nowcan become a measurement ofrespondent consistency in the model.The validity does not necessarily meanthat people will do what they say theywill do in an interview, but that is not aproblem. The data in this study and inothers, using the multiple R2 statistic,show that one can believe the vastmajority of the data provided by aninternet interview, even without aninterviewer present to jot down theanswers. This finding gives comfort tothose who will use the internet forconjoint measurement research, and addscredence to the data obtained fromdeconstruction studies.
References1 Porter, M. E. (1998) Competitive Advantage:
Creating and Sustaining Superior Performance, FreePress, New York.
2 Luce, R. D. and Tukey, J. W. (1964)‘Simultaneous conjoint measurement: A new typeof fundamental measurement’, Journal ofMathematical Psychology, Vol. 1, pp. 1–27.
3 Wittink, D. R. and Cattin, P. (1989) ‘Commercialuse of conjoint analysis: An update’, Journal ofMarketing, Vol. 53, pp. 91–96.
4 Moskowitz, H. R. and Martin, J. G. (1993) ‘Howcomputer aided design and presentation ofconcepts speeds up the product developmentprocess’, Proceedings of the 46th ESOMARConference, Copenhagen, Denmark, pp. 405–419.
5 Moskowitz, H. R., Itty, B., Shand, A. andKrieger, B. (2002) ‘Understanding the consumermind through a concept category appraisal:Toothpaste’, Canadian Journal Of Market Research,Vol. 20, pp. 3–15.
218 Journal of Database Marketing Vol. 10, 3, 200–218 � Henry Stewart Publications 1479-182X (2003)
Moskowitz, Itty, Fink and Ewald