decreasing primary-care-related emergency department
TRANSCRIPT

Walden UniversityScholarWorks
Walden Dissertations and Doctoral Studies Walden Dissertations and Doctoral StudiesCollection
2017
Decreasing Primary-Care-Related EmergencyDepartment Visits in the Hispanic PopulationUsing Patient NavigatorsArthur Dominguez Jr.Walden University
Follow this and additional works at: https://scholarworks.waldenu.edu/dissertations
Part of the Nursing Commons, and the Public Health Education and Promotion Commons
This Dissertation is brought to you for free and open access by the Walden Dissertations and Doctoral Studies Collection at ScholarWorks. It has beenaccepted for inclusion in Walden Dissertations and Doctoral Studies by an authorized administrator of ScholarWorks. For more information, pleasecontact [email protected].

Walden University
College of Health Sciences
This is to certify that the doctoral study by
Arthur Dominguez Jr.
has been found to be complete and satisfactory in all respects, and that any and all revisions required by the review committee have been made.
Review Committee Dr. Linda Matheson, Committee Chairperson, Nursing Faculty
Dr. Cheryl Holly, Committee Member, Nursing Faculty Dr. Mirella Brooks, University Reviewer, Nursing Faculty
Chief Academic Officer Eric Riedel, Ph.D.
Walden University 2017

Abstract
Decreasing Primary-Care-Related Emergency Department Visits
in the Hispanic Population Using Patient Navigators
by
Arthur Dominguez, Jr.
MSN, Walden University, 2012
ADN, College of the Desert, 2006
AA, Riverside Community College, 2004
Project Submitted in Partial Fulfillment
of the Requirements for the Degree of
Doctor of Nursing Practice
Walden University
November 2017

Abstract
Primary-care-related emergency department (PCR-ED) visits by Hispanic patients
enrolled in a not-for-profit Medi-Cal and Medicare health plan resulted in longer wait
times in the emergency department (ED) at a regional medical center in Southern
California. This congestion decreased access for those with true emergencies, created
capacity issues, increased ED length of stay, and resulted in potential safety risks. This
project focused on decreasing PCR-ED visits in the Hispanic population using patient
navigators in Southern California. Applying the health belief model and Lippitt’s theory
of change, this doctoral project involved the creation and implementation of a culturally
appropriate, population-specific patient navigator model for the Hispanic population.
Evaluation of outcomes was accomplished using electronic health record (EHR) results,
which demonstrated a reduction of PCR-ED visits and revisits. The project exceeded the
goal of 10% reduction in PCR-ED visits and revisits in the target population and resulted
in a 14.31% reduction of PCR-ED visits and revisits within 1 month of implementation.
Emergency Severity Index levels, wait time associated with each Emergency Severity
Index level, and visits of the targeted Hispanic population enrolled in the health plan
were analyzed to evaluate the success of the program. This project may lead to
improvements in nursing practice and positive social change by supporting population
health management and continuum of care to a primary care physician through safe and
efficient patient navigation to treatment and care.

Decreasing Primary-Care-Related Emergency Department Visits
in the Hispanic Population Using Patient Navigators
by
Arthur Dominguez, Jr.
MSN, Walden University, 2012
ADN, College of the Desert, 2006
AA, Riverside Community College, 2004
Project Submitted in Partial Fulfillment
of the Requirements for the Degree of
Doctor of Nursing Practice
Walden University
November 2017

Dedication
To my mom, Gloria Dominguez, RN, for being a leading example; my dad,
Arthur Dominguez, Sr., for his ever-loving support; my partner, Gregory Hopkin, for
keeping me grounded and supporting my dreams; and my family and friends, both
personal and professional, who remained steadfast in their support and love.
Acknowledgments
Thank you to my mentor, Dr. Kristin Schmidt, who always pushed and led with
excellence and grace; Candice Carillo, hospital statistician, for ongoing support; Dr.
Matheson, for her ongoing patience and clear direction; Kimberly Roquemore, Director
of Lean Daily Management and Performance Improvement, for her expertise; and my
dear friend and second mother, Vicki Dippner-Robertson, RN, who taught me what it
means to be an educator, student, nurse, and lifelong-friend … May she rest in peace.

i
Table of Contents
List of Tables ..................................................................................................................... iv
List of Figures ......................................................................................................................v
Section 1: Nature of the Project ...........................................................................................1
Problem Statement .........................................................................................................2
Purpose Statement and Project Objectives ....................................................................5
Significance to Practice ..................................................................................................6
Project Question ...........................................................................................................10
Implications for Social Change in Practice ..................................................................12
Definitions of Terms ....................................................................................................14
Assumptions and Limitations ......................................................................................15
Section 2: Review of Scholarly Evidence ..........................................................................17
Specific Literature and General Literature ..................................................................17
Hispanic Population and Use of Emergency Departments ..........................................17
Primary-Care-Related Emergency Department Visits and Navigators .......................19
American-Acculturated Hispanics and Use of Health Care ........................................21
Affordable Care Act .....................................................................................................21
Emergency Department Overcrowding and Associated Risks ....................................23
Conceptual Model, Theory, and Framework ...............................................................24
Health Belief Model .............................................................................................. 24
Lippitt’s Model ..................................................................................................... 27
Summary ......................................................................................................................29

ii
Section 3: Approach ...........................................................................................................30
Project Design and Methods ........................................................................................30
Population ....................................................................................................................34
Data Collection, Data Analysis, and Project Evaluation Plan .....................................34
Sustainability................................................................................................................34
Summary ......................................................................................................................35
Section 4: Findings and Recommendations .......................................................................36
Introduction ..................................................................................................................36
Findings and Implications ............................................................................................36
Implications ..................................................................................................................39
Recommendations ........................................................................................................40
Strengths and Limitations of the Project ......................................................................41
Summary ......................................................................................................................42
Section 5: Dissemination Plan ...........................................................................................43
Dissemination ..............................................................................................................43
Analysis of Self ............................................................................................................43
Summary ......................................................................................................................44
References ..........................................................................................................................45
Appendix A: ESI Level 5 Patient Flow .............................................................................53
Appendix B: ESI Level 4 Patient Flow ..............................................................................54
Appendix C: ESI Level 5 Resource Cost ...........................................................................55
Appendix D: ESI Level 4 Resource Cost ..........................................................................56

iii
Appendix E: Expenses for 6-Month Trend ........................................................................57

iv
List of Tables
Table 1. Total ED Visits for Hispanic Patients Enrolled in a Not-For-Profit Medi-
Cal and Medicare Health Plan, 2009-2016 ..............................................................5
Table 2. Five-Level Triage ................................................................................................15
Table 3. Total ED Visits by ESI Level—September 5, 2016 through October 5,
2016, and September 5, 2017 through October 5, 2017 ........................................37
Table 4. Total Hispanic Not-for-Profit Medi-Cal and Medicare Health Plan ED
Visits—September 5, 2016 through October 5, 2016, and September 5,
2017 through October 5, 2017 ...............................................................................37
Table 5. Point-of-Service Cash Collections, Insured and Self-Pay—September 5,
2016 through October 5, 2016, and September 5, 2017 through October 5,
2017........................................................................................................................38
Table 6. Emergency Department Patient Satisfaction Scores—September 5, 2016
through October 5, 2016, and September 5, 2017 through October 5, 2017 .........39
Table 7. Total Patients Seen, ED Average Daily Census, Median ALOS, Median
DLOS, % LWBS, % LWOT, % LAMA, % Eloped, % Total Walkout—
September 5, 2016 through October 5, 2016, and September 5, 2017
through October 5, 2017 ........................................................................................39

v
List of Figures
Figure 1. Percentage of Hispanics in 2016 who were enrolled in a not-for-profit
Medi-Cal and Medicare health plan, by ESI level at a regional medical center
in Southern California……..…………………………….…………………..…….5
Figure 2. Revenue from cash pay vs. revenue from not-for-profit Medi-Cal and
Medicare health plan reimbursement…………………...…………………………8
Figure 3. Cash pay and contact costs for ESI Level 4 and 5 current and future states...….9
Figure 4. 2016 ESI Level 4 and 5 registration times by hour of day.……….…………...11
Figure 5. Start-up costs, future state savings contact, and future state revenue
generated………………………………………………………………………....12
Figure 6. Project mission, vision, goals, and objectives………...…………….................27
Figure 7. Program design …………………..……………………………………....……33

1
Section 1: Nature of the Project
Following the implementation of the Affordable Care Act (ACA) and the
resultant expansion of Medicaid in 2010, health care reform law changed, which directly
increased emergency department (ED) visits as an additional 20 million Americans
gained health insurance (Boerner, 2016). Many of these patients had chronic health
conditions and no primary care physician. Such patients often sought medical care and
treatment at EDs rather than at primary care physicians’ offices (Boerner, 2016).
Hospital system financial realities resulted in the preferential placement of
patients receiving elective surgeries to inpatient beds, which reduced inpatient bed
availability for ED admissions (Boerner, 2016). In addition, nursing shortages, loss of
inpatient beds to ED closures, and a steadily increasing volume of patients with ACA
coverage combined to create what an Institute of Medicine (IOM) report called
“inevitable ED overcrowding” (Boerner, 2016, p. 33). The problem with these changes
was that Americans now had to purchase health insurance unless their employers or some
other group plan covered them; a tax penalty was issued to those without insurance.
Although Medicaid expanded in only about half of the United States, the influx of those
with insurance coverage and patients seeking medical treatment resulted in increased
diagnosis detections and noted illnesses, which correlated with the increase of people
being seen by physicians (Whiteman, 2015). Although more people were insured overall,
this did not translate into access to health care that was affordable and cost-effective;
thus, some Americans still did not receive health care (Whiteman, 2015). In 2014, the
American College of Emergency Physicians (ACEP) reported that ED physicians noted

2
an increase in ED visits after the ACA was implemented, rather than the decrease that
had been promised by the government.
An increase in the number of patients with health insurance resulted in a higher
demand for doctors. However, there were not enough physicians to meet the demand. The
Association of American Medical Colleges estimates that by 2025, the United States will
need 46,000 to 90,000 more physicians to meet patient demand, not including specialists
(Whiteman, 2015). Additionally, a survey performed by the ACEP found that once the
ACA was passed in January 1, 2010, 46% of EDs experienced an influx of patients as
primary care physicians limited or refused to see Medicaid patients due to the low levels
of reimbursement provided by the ACA. Patients unable to access primary care began to
use the ED as a means of attaining primary-care-related services (LoGuirato, 2014).
This change in health care utilization impacted EDs across the country. For
instance, at a regional medical center in Southern California, patients visiting the ED
faced increased wait times as the amount of primary-care-related emergency department
(PCR-ED) visits and revisits resulted in overcrowding, which posed potential risks for
patients with true emergencies due to ED congestion. A potential solution was the use of
an ED patient navigator program to help patients manage the complex health care
situations in which they found themselves.
Problem Statement
The ACA resulted in EDs frequently being used as sources of primary care rather
than for true emergency care (Flores-Mateo, Violan-Fors, Carrillo-Santisteve, Peiró, &
Argimon, 2012). As a result, PCR-ED visits accounted for approximately a quarter (21%-

3
28%) of all ED visits in the United States (Flores-Mateo et al., 2012). This resulted in
longer wait times in the ED due to the congestion of lower acuity patients (Flores-Mateo
et al., 2012). The influx of PCR-ED visits decreased access for those with true
emergencies, created capacity issues, increased discharge length of stay, potentially
decreased patient satisfaction, and increased the potential for safety risks (Enard &
Ganelin, 2013).
From 2000 to 2014, the overall population in a valley in Southern California grew
from 309,530 to 443,401. The population was 40.8% White, 51.4% Hispanic, 3.5%
Asian, 2.5% African American, and 0.4% Native American (Coachella Valley Economic
Partnership, 2014). Within the Hispanic population in this area, 58.7% were enrolled in a
not-for-profit Medi-Cal and Medicare health plan. This group had a 50.1% recidivism
rate for PCR-ED visits. This caused delays in treatment for those with true emergencies.
It also created financial losses for the organization because the not-for-profit Medi-Cal
and Medicare health plan hospital contracted reimbursement rates were so low.
The ED at a regional medical center in Southern California used a 1-5 Emergency
Severity Index (ESI) triage system where 1 indicated resuscitation, 2 indicated emergent,
3 indicated urgent, 4 indicated less urgent, and 5 indicated nonurgent. Primary-care-
related ED visits were classified as ESI 4s and 5s. The recidivism rate of PCR-ED visits
from January 2014 through December 2016 accounted for 41% of the 221,288 patients
seen. Of the 41% PCR-ED visits in the ED, 47% involved the Hispanic population.
Therefore, this Doctor of Nursing Practice (DNP) project focused on decreasing PCR-ED

4
visits and revisits in a Hispanic population enrolled in a not-for-profit Medi-Cal and
Medicare health plan through the use of patient navigators.
Together, the business plan and strategic plan focused on the true north of where
the organization and project were headed and was supported and backed with a budget
for project success (Ricciardi, Moy, & Wilson, 2016). A business plan was executed by
determining resources needed for the program to be successful, such as personnel,
operations, value, fit for the customer, business model, research, goals, and finances, with
an ultimate outcome of a conceptual and tactical project that was feasible to attain
(Papadopoulos, Britten, Hatcher, & Rainville, 2013). The focus of the ED patient
navigator program at a regional medical center in Southern California was on Hispanics
enrolled in a not-for profit Medi-Cal and Medicare health plan who were ESI Level 4 and
5 patients (see Figure 1), who accounted for 57% of all Hispanic ED visits. Table 1
displays growth and opportunity for navigating ESI Level 4 and 5 patients combined,
whose visits were considered PCR-ED visits that could have been seen by a primary care,
urgent care, or other outpatient resource outside the ED. Based on this information, it
became evident that the Hispanic population enrolled in a not-for-profit Medi-Cal and
Medicare health plan was an appropriate target for a patient navigation effort.

5
0% 6%
37%
53%
4%
2016
ESI1 ESI2 ESI3 ESI4 ESI5
Figure 1. Percentage of Hispanics in 2016 who were enrolled in a not-for-profit Medi-Cal and Medicare health plan, by ESI level at a regional medical center in Southern California. Table 1 Total ED Visits for Hispanic Patients Enrolled in a Not-For-Profit Medi-Cal and Medicare Health Plan, 2009-2016 2009 2010 2011 2012 2013 2014 2015 2016 Total
ESI 1 2,997 2,993 1,310 1,602 20 50 52 47 9,071 ESI 2 3,349 2,795 3,287 3,494 263 506 781 797 15,272 ESI 3 98 93 26 483 2,209 3,182 4,462 5,062 15,615 ESI 4 362 326 145 1,014 4,510 6,002 6,935 7,088 26,382 ESI 5 559 407 646 852 756 900 695 534 5,349
Purpose Statement and Project Objectives
The purpose of this project was to to decrease ESI Level 4 and 5 visits and revisits
by 10% within 1 month of implementing a DNP project focused on the Hispanic

6
population enrolled in a not-for-profit Medi-Cal and Medicare health plan through the use
of patient navigators by ensuring that appropriate follow-up treatment and care were
attained. The project also had the potential to decrease discharge length of stay, lower the
number of patients who left without being treated or seen, and increase safety, patient
satisfaction, and capacity. The project objectives were to design a system of care that
improved health care for the Hispanic population presenting to the ED at a regional
hospital in Southern California and to lead the organization in the development of a
culturally relevant patient navigator system.
Significance to Practice
A patient navigator is crucial to nursing practice and may ensure that truly
emergent patients are seen in a safe and timely manner, which may result in decreased
ED overcrowding and increased patient satisfaction through the provision of population-
specific patient navigation to ensure that resources and linkage of care to a primary care
provider are offered. Researchers, policy-makers, health professionals, and patients
should work together to identify primary reasons for potentially avoidable visits and
return ED visits to improve future quality measurement initiatives, which this project
promoted (Rising, Victor, Hollander, & Carr, 2014). The importance of this project was
also supported by Healthy People 2020’s goal of attaining the highest level of health care
for all people, increasing access to culturally sensitive health care providers, and focusing
on assessment of health disparities by race and ethnicity (Healthy People 2020, 2016).
The implementation of a patient navigator program at the ED at a regional medical center
in Southern California assisted in decreasing ED congestion, promoted continuity of care,

7
assisted in decreasing organizational financial losses, and targeted a population with a
true need for navigation.
This regional medical center billed $423.16 for ESI Level 5 visits and $688.58 for
ESI Level 4 visits, but based on the hospital’s contract with the not-for-profit Medi-Cal
and Medicare health plan, the medical center was actually reimbursed $291.00 regardless
of ESI level. It was anticipated that there was a negative gain in all ESI levels, and with
57% of ESIs consisting of 4s and 5s, creating the greatest opportunity to decrease Medi-
Cal payer PCR-ED visits would increase capacity for cash or private-pay insurance.
Based on the regional medical center’s Medi-Cal and Medicare health plan volumes, it
had a potential loss of $132.16 per ESI Level 5 not-for-profit Medi-Cal and Medicare
health plan visit and $397.58 per ESI Level 4 visit (see Appendices A and B for ESI
patient flow). The amounts are based on a not-for-profit Medi-Cal and Medicare health
plan contract versus full potential cash or premium insurance payment. This quantified a
potential annual loss of $165,000 for ESI 5 patients, $5,642,455.36 for ESI Level 4
patients, and a grand total of 5,807,455.36 for ESI 4 and 5 combined. It was evident that
focused navigation for the Hispanic population might assist in decreasing ED congestion,
increasing linkage of care to primary care physicians for Hispanic patients, and reducing
organizational financial losses. Furthermore, there was potential to increase ED capacity
due to appropriate navigation of 10% of a not-for-profit Medi-Cal and Medicare health
plan’s Hispanic patients who were ESI 4s and 5s, which would increase the ability to
capture and increase cash-pay revenue by 10% through decreased ED congestion and
providing access to care for others (see Figure 2).

8
$174,600.00
$253,896.00
$2,063,772.00
$4,883,409.36
Not-ForProfitESI5
CASHESI5
Not-ForProfitESI4
CASHESI4
RevenueCashPayvsRevenueNot-ForProfitMedi-CalandMedicareHealthPlanReimbursement.YTD,MonthEnd,2016
HispanicVisits
Not-ForProfitESI5 CASHESI5 Not-ForProfitESI4 CASHESI4
Figure 2. Revenue from cash pay vs. revenue from not-for-profit Medi-Cal and Medicare health plan reimbursement.
In conclusion, there was potential gain in cash revenue of $158,592.00 annually
for ESI Level 5; $5,599,274.72 for ESI Level 4; and a total of $5,757,866.72 for ESI
Levels 4 and 5 combined.
The payback period, which was the length of time required to recover the cost of
the intervention and was defined as the time it took for the cumulative total of net
benefits to equal the original investment costs and measured breakeven, was short with
the DNP project. It was anticipated that it would be profitable by decreasing the targeted
population visits and revisits by 10%. Current and future states of program financial
interventions (see Figure 3) support extreme profitably with a 10% decrease in not-for-
profit Medi-Cal and Medicare health plan ESI 4 and 5 patients, which would result in the
ability to increase ESI 4 and 5 cash-paying patients by 10%, and decreased contact cost
resources for both ESI levels in the future state as the not-for-profit Medi-Cal and
Medicare health plan reimbursements were low with set contracted reimbursement rates.

9
$446,196.48
$4,883,409.36
34329.12
$253,896.00
$401,576.83
$5,371,750.30
30896.208
$279,285.60
$25,000.00 $1,025,000.00$2,025,000.00$3,025,000.00$4,025,000.00$5,025,000.00$6,025,000.00
ContactCosts(resources)ESILevel4
CashpayESIlevel4
ContactCosts(resources)ESILevel5
CashpayESIlevel5
FutureState
CurrentState
Figure 3. Cash pay and contact costs for ESI Level 4 and 5 current and future states.
The conclusion made in comparing cash pay and contact costs for a 10% increase
in cash pay was that ESI Level 5 cash pay could potentially have an annual increase of
$50,796 and ESI Level 4 cash pay could have an annual increase of $976,681.88, for an
annual total of $1,027,477.88. There was potential savings in contact/resource costs of
$6,865.82 for ESI Level 5 and $89,239.30 for ESI Level 4, for a total of $96,105.12
annually (see Appendices C and D).
Therefore, monies put into the patient navigator program could result in gains in
cost effectiveness, cost utility, and positive health outcomes for Hispanics enrolled in the
not-for-profit Medi-Cal and Medicare health plan. The use of a patient navigator in the
ED to decrease PCR-ED visits and revisits by ensuring that appropriate follow-up
treatment and care are attained has the potential to increase patient satisfaction, continuity

10
of care, linkage of patients to primary care providers, and education for the population on
available resources that are less expensive than an ED visit (Enard & Ganelin, 2013).
Project Question
This project addressed the following question: How will the implementation of a
DNP project for decreasing PCR-ED visits and revisits in the Hispanic population
enrolled in a not-for-profit Medi-Cal and Medicare health plan through the use of patient
navigators compare to no navigator in decreasing PCR-ED visits and revisits over a 1-
month period? A trained person (i.e., social worker, case manager, or registration
personnel) was in the ED Monday through Friday from 11:00 a.m.-11:00 p.m. (see Figure
4), when ED volumes were at peak, to facilitate linkages to primary care physicians,
resources, or clinics. No comparison group was used, and the desired outcome consisted
of decreases in ESI Level 4 and 5 visits to the ED, ED revisits, wait times for emergent
ESI 1, 2, and 3 patients, and DLOS, as well as increases in patient satisfaction and
linkage to a primary care provider or clinic. The timeframe, once implemented, was
reviewed after 30 days.
0
200
400
600
800
1000
1200
1400
1600
1800
01:00 02:00 03:00 04:00 05:00 06:00 07:00 08:00 09:00 10:00 11:00 12:00 13:00 14:00 15:00 16:00 17:00 18:00 19:00 20:00 21:00 22:00 23:00 24:00
Registra5onTimes
Total
Figure 4. 2016 ESI Level 4 and 5 registration times by hour of day.

11
Evidence-Based Significance of the Project
The use of an ED patient navigator decreased PCR-ED visits and revisits. Charles
(2012) found that the use of an ED patient navigator decreased ED visits and revisits by
65% after implementing an ED navigator who worked with transport and triage in
addition to scheduling same-day or next-day outpatient appointments for patients not
requiring emergency care. Enard and Ganelin (2013) found potential savings of $4.4
billion annually for the estimated 13%-27% of U.S. PCR-ED visits if patients were seen
at an outpatient clinic, a primary care provider office, or urgent care. The savings
surpassed spending needed to implement an ED patient navigator focusing on the
navigation of care for members of the Hispanic population who came to the ED. The
extreme upward trend line (see Figure 5) of start-up costs in correlation to future state
savings contact and future state revenue demonstrated that there would likely be a break-
even point at less than 5 months of implementation.
$61,880480,525.60
$5,651,035.90
($2,000,000)
($1,000,000)
$0
$1,000,000
$2,000,000
$3,000,000
$4,000,000
$5,000,000
$6,000,000
Startupcosts FutureStateSavingscontact
FutureStateRevenueGenerated
Series1
Linear(Series1)
Figure 5. Start-up costs, future state savings contact, and future state revenue generated.

12
Chaffin (2014) found that the vast majority of the population that came to the ED
were unaware of other resources available to them that were either lower in cost or free,
so use of an ED patient navigator who focused on scheduling appointments with primary
care physicians and/or clinics reduced the number of PCR-ED visits, ED congestion, and
wait times. The importance of this effort was also supported by Healthy People 2020’s
goal of attaining the highest level of health care for all people, increasing access to
culturally sensitive health care providers, and focusing on assessment of health disparities
by race and ethnicity (Healthy People 2020, 2016).
Implications for Social Change in Practice
Social change in practice may emerge from this project in relation to the cultural
diversity of the Hispanic population, human rights, and poverty. Allen and Cummings
(2016) conducted a study of Hispanic and non-Hispanic White adults aged 18-64 from
2011 to 2013 using cross-sectional data with logistic regression models to determine
urgent and nonurgent ED use. The sample consisted of immigrants who had been in the
United States for less than 5 years, for 5 years to 10 years, and for more than 10 years;
naturalized citizens; and U.S.-born citizens. Results indicated that 17.8% of Hispanic
individuals and 18.5% of non-Hispanic White individuals’ annually use the ED more
compared to U.S.-born non-Hispanic White individuals (Allen & Cummings, 2016, p.
454). The least acculturated Hispanic population, defined as immigrant Hispanics
residing in the United States for less than 5 years, are 14.4% (p < 0.001) less likely to use
the ED for any reason, 9.8% (p < 0.001) less likely to use it for a nonurgent reason, and
5.3% (p < 0.01) less likely to use it for an urgent reason (Allen & Cummings, 2016, p.

13
454). Allen and Cummings found that contrary to perception, the least acculturated
Hispanic individuals were less likely to use the ED, but as American acculturation rose,
so did the likelihood of ED use for PCR-ED visits. This proved evident with the influx of
Hispanics in a Southern California valley, which resulted in an influx of PCR-ED visits at
a regional medical center in Southern California so that social changes began to influence
behavioral patterns in the ED usage of American-acculturated Hispanics.
Services for the Hispanic population were more successful when the patient
navigator spoke Spanish. As Bagchi et al. (2011) found, the use of in-person interpreters
significantly increased both patient and health providers’ satisfaction and understanding
while communicating care and after care in the ED. The Hispanic population specifically
focused on for this project used a trained ED patient navigator for those enrolled in a not-
for-profit Medi-Cal and Medicare health plan. The health plan, which was fueled by the
ACA, covered more than a million people out of the nearly 4 million who lived in the
Southern California region (McSherry, 2015). This was of no surprise to the health plan
as two-thirds of enrollees became eligible because of the ACA. Because residents of the
Southern California region were relatively poor and more likely to be unemployed
compared to residents of the rest of the state, this region had the second-largest Medi-Cal
health plan in California (McSherry, 2015), which further supported the need for an ED
patient navigator program. Social change can happen for this group of people through the
promotion of a patient-centered service delivery model to educate the population on
facilitation of a healthy lifestyle through education, patient advocacy, and navigation.
Through such interventions, knowledge can be gained, and appropriate care and

14
treatment can be attained in the right place, at the right time (and sometimes for the first
time) by this population.
Definitions of Terms
Primary-care-related emergency department (PCR-ED) visits: ED visits
classified as ESI 4s and 5s, which are generally primary-care-related ED visits that could
have been seen by an urgent care facility, primary care physician, or other outpatient
resource. For example, ESI 4 patients are stable, with only one type of resource
anticipated, and ESI 5 patients are stable, with no resources anticipated except for oral or
topical medications or prescriptions.
Discharge length of stay (DLOS): Time from patient registration in the ED to
discharge from the ED. This is generally referred to as time to discharge or door-to-door
time in the ED.
Revisit: Classified as a return visit to the ED within 3 days of an initial ED visit.
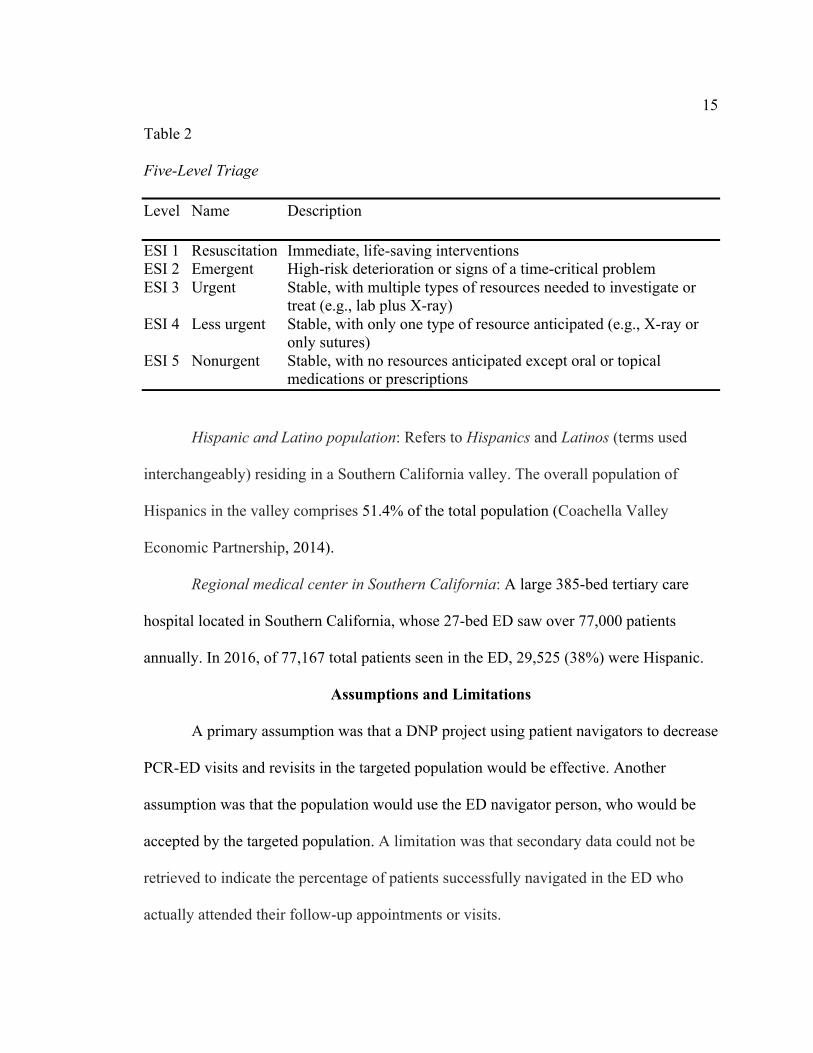
Emergency Severity Index (ESI): A valid and reliable five-level triage instrument
used to predict ED resource consumption (Gimbel, Tanabe, Yarnold, & Adams, 2004).
Refer to Table 2 for ESI five-level triage description.
15
Table 2 Five-Level Triage Level Name Description
ESI 1 Resuscitation Immediate, life-saving interventions ESI 2 Emergent High-risk deterioration or signs of a time-critical problem ESI 3 Urgent Stable, with multiple types of resources needed to investigate or
treat (e.g., lab plus X-ray) ESI 4 Less urgent Stable, with only one type of resource anticipated (e.g., X-ray or
only sutures) ESI 5 Nonurgent Stable, with no resources anticipated except oral or topical
medications or prescriptions
Hispanic and Latino population: Refers to Hispanics and Latinos (terms used
interchangeably) residing in a Southern California valley. The overall population of
Hispanics in the valley comprises 51.4% of the total population (Coachella Valley
Economic Partnership, 2014).
Regional medical center in Southern California: A large 385-bed tertiary care
hospital located in Southern California, whose 27-bed ED saw over 77,000 patients
annually. In 2016, of 77,167 total patients seen in the ED, 29,525 (38%) were Hispanic.
Assumptions and Limitations
A primary assumption was that a DNP project using patient navigators to decrease
PCR-ED visits and revisits in the targeted population would be effective. Another
assumption was that the population would use the ED navigator person, who would be
accepted by the targeted population. A limitation was that secondary data could not be
retrieved to indicate the percentage of patients successfully navigated in the ED who
actually attended their follow-up appointments or visits.

16
Summary
In summary, by implementing an ED patient navigator job role to focus on the
Hispanic population at a regional medical center in Southern California, an effort was
made to decrease ED decongestion, decrease wait times, increase the number of patients
seeing primary care physicians, increase throughput efficiencies, and reduce potential
safety risks by ensuring that care was not delayed for those with true emergencies. It is
imperative for health care leaders to think of new ways to decrease potentially avoidable
visits to the ED and promote visits to primary care physicians (Wuerz, 2011). The
implementation of an ED patient navigator supported the recommended promotion of
patient navigation found in articles and research.

17
Section 2: Review of Scholarly Evidence
Specific Literature and General Literature
A literature review was completed on the following topics: Hispanic populations’
use of EDs, ED patient navigators, American-acculturated Hispanics and use of health
care, and primary-care-related ED visits and revisits. A general search was completed on
the ACA, ED overcrowding, increases in ED visits and the need for more physicians, and
risks associated with overcrowded EDs. These were selected as key areas of interest
based on their relevance and influence on the project. The search was conducted using
nursing and health databases of CINAHL, MEDLINE, and ProQuest Nursing and Allied
Health Source. Search modes and expanders were Boolean phrases, and results were
limited to full text, published later than 2010, scholarly, peer reviewed, journals, and in
English. Key words used were Hispanics, Affordable Care Act, ED visits and revisits,
not-for-profit Medi-Cal and Medicare health plan, primary-care-related ED visits, and
patient navigator. I reviewed abstracts prior to reading full texts to ensure the sources’
relevance to the project. Themes that evolved from the literature review were the
Hispanic population and use of emergency departments, primary-care-related ED visits
and revisits and the use of ED patient navigators, American-acculturated Hispanics and
the use of health care, Affordable Care Act, ED overcrowding and associated risks, and
increases in ED visits indicating a need for more physicians.
Hispanic Population and Use of Emergency Departments
Hispanic patients with Medicaid have been disproportionately represented among
racial and ethnic minority groups that have faced barriers in accessing primary care

18
resulting in PCR-ED visits and preventable hospitalizations (Wright, Potter, & Trivedi,
2015). A study by Fair Health Consumer (2015) found that Latino consumers were nearly
twice as likely as the general population to go to the ED for nonemergency care (39%
Latino vs. 21% total population). Garcia, Bernstein, and Bush (2010) found that with
decreases in the number of EDs and higher numbers of ED visits, overcrowding was
inevitable, and persons with Medicaid were more likely to report at least one ED visit and
multiple ED visits in a 12-month period than those with private coverage or those who
were uninsured. Hong, Baumann, and Boudreaux (2007) found that Hispanics were more
likely to choose to be seen at an ED than elsewhere because Hispanics perceived that
they would receive better quality care in the ED. Hispanics were less likely to have
insurance, were more likely to have economic disadvantages, and rarely had access to
acute medical care outside the ED, which caused ED congestion (Hong, Baumann, &
Boudreaux, 2007). For this group, navigation to available resources outside the ED was
of pivotal importance. With proper use of ambulatory care health centers, Wright, Potter,
and Trivedi (2015) found a 12% decrease in hospitalizations and ED visits. Sarver,
Cydulka, and Baker (2002) found that patients who were dissatisfied with their usual
source of care or perceived access barriers to usual care were more likely to have
nonurgent ED visits. Glover, Purim-Shem-Tov, Johnson, and Shah (2016) found that
Hispanic/Latino and African Americans were disproportionately represented among those
who used the ED for primary-care-related visits due to lack of knowledge of available
resources. Further intervention strategies were done to target the reduction of health
disparities through decreased use of ED services.

19
Primary-Care-Related Emergency Department Visits and Navigators
While the economy continued to struggle toward improvement during
implementation and adoption of the ACA, there was a direct impact on the healthcare
industry and its consumers. Hospitals struggled with reduced reimbursement and
mandatory pay-for-performance measures by the Centers for Medicare and Medicaid
Services (CMS), which included reduced payments for negative outcomes, poor quality,
low patient satisfaction scores, and certain readmissions (Madden, Carrick, & Manno,
2012). These issues, in combination with the increase in the number of people covered
under ACA, contributed to increased ED volumes, causing ED overcrowding that
resulted in a national ED average wait time of approximately four hours (Madden,
Carrick, & Manno, 2012).
Despite many efforts to increase equity in the United States healthcare system,
Americans have not been afforded equal access to healthcare or positive health outcomes
(Natale-Pereira, Enard, Nevarez, & Jones, 2011). Primary-care-related ED use, which
involves conditions that are treatable or preventable with appropriate primary care
services, has been directly associated with increased costs to the medical system and
decreased ED efficiency (Enard & Ganelin, 2013). Most patients who present to the ED
for PCR-ED reasons have experienced or perceived problems in accessing resources or
appropriate medical care, which led to their decision to go to the ED for care and
treatment (Enard & Ganelin, 2013).
To meet the needs of the Hispanic population and decrease PCR-ED visits and
revisits, a patient navigator was implemented to steer patients through the healthcare

20
system, to assist them in attaining follow-up healthcare services, and to connect them
with community resources and thus reduce the amount of ED visits and revisits (Madden,
Carrick, & Manno, 2012). To best serve the Hispanic population, the intervention was
facilitated with a bilingual Spanish trained employee who counseled medically
underserved patients and connected them with support services, increasing
communication and providing culturally sensitive care (Enard & Ganelin, 2013). The use
of a patient navigator not only improved healthcare access, but also addressed deep-
rooted issues related to distrust in providers and the healthcare system, which had led to
avoidance of health care problems and noncompliance with recommended treatments
(Natale-Pereira et al., 2011). By addressing cultural differences and language barriers that
made it difficult for patients to seek appropriate treatment or resources, the patient
navigators fostered trust with the population served, encouraging patients to trust the
healthcare system and empowering them to seek appropriate levels of care in order to
reduce ED visits (Natale-Pereira et al., 2011). Robie, Alexandru, and Bota (2011) found
that patient navigators, who focused on the Hispanic population, were useful in removing
barriers that limited access to health care for minorities, which also increased patient
satisfaction. Patient navigators had backgrounds as social workers, case managers, or
registration personnel. Patient navigators received training on communication with the
Hispanic population, which focused on culture, language, literacy, and ways to increase
trust that would assist with psychological factors, financial training on resources available
in the community for Hispanics enrolled in the not-for-profit Medi-Cal and Medicare
21
health plan, referral training, appointment scheduling, and care coordination (Enard &
Ganelin, 2013).
American-Acculturated Hispanics and Use of Health Care
Despite healthcare and community perception of the Hispanic population and the
use of the ED, Hispanics with increased American acculturation (i.e., U.S.-born
Hispanics, generally second or third generation) were found to use the ED for PCR-ED
visits and revisits more often than Hispanics who were less acculturated and immigrants
who had been in the United States for less than 5 years, resulting in an increase in
nonurgent ED visits (Allen & Cummings, 2016). In managed-care healthcare systems, the
burden of managing and negotiating health care shifted to the consumer, who had to
choose from a list of specific providers. In some cases, an approved provider might not
be available for months, resulting in PCR-ED visits (Cafferty & Engstrom, 2007).
Cafferty and Engstrom (2007) suggested that out of all of the populations included in
federal reports, nonacculturated Hispanics—immigrants who had been in the United
States for less than 5 years—were least likely to have a regular source of care (about
30%, or 8.4 million). Of the total Hispanic subgroup, Mexican Americans were the least
likely to have a primary care provider (Cafferty & Engstrom, 2007). Patients who do not
have a source of primary care are more likely to pursue ED visits. A patient navigator can
assist such patients in seeking care and resources to avoid future ED visits.
Affordable Care Act
The overall goal of the ACA was to increase accessibility of and access to health
insurance for Americans. Since its inception, the number of people covered by health

22
insurance in the United States has steadily increased (McMorrow, Long, Kenney, &
Anderson, 2015).
Furthermore, the ACA has narrowed insurance-coverage gaps for Black and
Hispanic adults; however, Hispanics have continued to have larger gaps in coverage in
comparison to other races (McMorrow et al., 2015). Data from the 2014 National Health
Interview Survey found that by the fourth quarter of 2014, the uninsured rate for Hispanic
adults, both citizens and noncitizens, had fallen to 31.8% from 40.1% in the third quarter
of 2013, which was immediately before ACA open enrollment (McMorrow et al.).
The ability for the ACA to reduce racial and ethnic disparities in health insurance
coverage was attributed to two factors. The first factor was that the Supreme Court ruling
in the National Federation of Independent Business v. Sebelius lawsuit resulted in
optional Medicaid expansion for states. As of July 2015, only 28 states and the District of
Columbia had implemented the ACA, which was a problem for those living in states who
did not implement the ACA, where there was a lack of insurance coverage (McMorrow et
al., 2015). The second reason was that undocumented immigrants were ineligible for
Medicaid and were unable to purchase subsidized coverage (McMorrow et al., 2015).
California implemented the option of the ACA, which increased the number of insured
Hispanics but also left them with a need for navigation of care because education,
cultural background, and financial constraints have made it difficult for this population to
attain appropriate care (Robie, Alexandru, & Bota, 2011).

23
Emergency Department Overcrowding and Associated Risks
With increased demand for health care and a deficit in available hospital and ED
beds, ED overcrowding has become an increasingly significant worldwide public health
problem within the last decade (Di Somma et al., 2015). Knapman and Bonner (2010)
found that extended wait times and overcrowding in EDs also increased the amount of
those patients who left without being seen (p < 0.05); in such cases, both the patient and
the organization were at risk. The increase in ED volumes not only negatively impacted
those who arrived as walk-ins, but also increased turnaround times for ambulances due to
longer wait times for ED beds (Lee, Shin, Lee, Cho, & Cha, 2015). Delays related to
transfer of care removed ambulances and crews from communities where they needed to
be, thus compromising response times for true emergencies (Lee et al., 2015).
A study specifically involving stroke patients found that ED overcrowding
resulted in delays in patients being transferred to appropriate specialty departments,
which led to an increase in complications, increased length of stay, slower recovery, and
increased risk for mortality (Akhtar et al., 2016). Schiff (2011) found that overcrowding
of U.S. EDs was a widely recognized and growing problem with 10 fundamental
components:
1. Variation and supply-demand mismatch
2. Shortage of primary care providers
3. Limited afterhours access
4. Admission throughput challenges
5. Clinical challenges related to discontinuity patients

24
6. Interruptions
7. Logistic testing challenges
8. Clinical challenges related to specialty needs
9. Suboptimal information systems
10. Fragmented health insurance system
Due to the difficulty of accurately forecasting demand in EDs, it became an urgent issue
for hospital administration to optimally manage patient flow, improve management
strategies, and ensure efficiency and safety for all patients visiting EDs (Kadri, Harrou,
Chaabane, &Tahon, 2014). A conclusion to be drawn from the studies is that a decrease
in ED congestion through implementation of a patient navigator program assisted in
decreasing ED overcrowding and risks associated with it.
Conceptual Model, Theory, and Framework
Conceptual models and theoretical frameworks serve as blueprints for project
design and implementation. In this project, the health belief model (HBM) was used in
relation to the Hispanic population, and Lippitt’s model of change was used to assist in
understanding organizational change. These two models blended well for the
implementation of an ED patient navigator to assist Hispanics and support the
organization through the process of change.
Health Belief Model
It is necessary to consider cultural fit when choosing a model relevant to a health
care problem. As one of the most popularly used models for health promotion and
education, the HBM was chosen for this project (Walsh, 1995). The Hispanic population

25
identified problem of PCR-ED visits, as its principles, was built upon to help change
Hispanic population behaviors with regard to healthcare navigation (Glanz, Rimer, &
Lewis, 2012). Research indicated that members of the Hispanic population from
immigrant families tended to know little about American health care beliefs, benefits, and
practices unless they were members of the second or third generation born in the United
States (Sanchez-Birkhead, Kennedy, Callister, & Miyamoto, 2011). In order to create
changes in process or practice for this population, it was necessary to establish further
understanding of their existing health beliefs, health promotion practices, past health
experiences, and transition to American health care. The HBM was used to help these
patients see that they could help themselves by providing education from trained staff
about their medical conditions (Sanchez-Birkhead et al., 2011).
The HBM indicates that individuals assess their susceptibility to ill health, risks
involved in illness, and benefits associated with a visit to an ED. The HBM may be used
to explain and predict health behaviors, particularly in regard to the uptake of health
services. Items considered through decision making are availability of care, cost of care,
failure or success of alternative home remedies, patient perception of a problem, and
perceptions of significant others in the patient’s life (Walsh, 1995). The underlying
concept is that health behavior is determined by personal perceptions about diseases,
personal beliefs, and strategies available to decrease or manage occurrences (Hochbaum,
1958).
There were four theoretical constructs in the original HBM: perceived
seriousness, perceived barriers, perceived benefits, and perceived susceptibility. Over

26
time, three more constructs were added: motivating factors, self-efficacy, and cues to
action (Hayden, 2009). People have to believe that they can change before they will
change; thus, the patient navigation project involved using the HBM to assist members of
the Hispanic population in believing that they could change their behaviors. The
behaviors of interest were related to health care, and individuals were assisted in making
behavioral change through linkage to care to a primary care provider or urgent care, or
navigation to a community resource rather than attaining PCR-ED treatments in the ED.
Jones et al. (2015) found that use of the HBM achieved optimal behavioral change with
successful targeting of perceived barriers, self-efficacy, benefits, and threats.
Eliciting representation of the Hispanic population in developing the goals and
objectives for the program was imperative as the embracing of stakeholders increased the
knowledge needed to make decisions and the outcomes for review (Saan et al., 2015). To
gain involvement from the Hispanic population in designing the program, the following
steps were taken: (a) reduced stakeholders’ distrust and fear of evaluation, (b) increased
stakeholder awareness, (c) adhered to recommendations of utilizing Spanish or primary
language to communicate, and (d) involved stakeholders in the planning and evaluation
process (CDC, 2012). Having Hispanic representatives on the patient family advisory
council facilitated additional feedback and increased the involvement of the Hispanic
population. This council, which focused on person-centered care and placed patients in
the center of discussions and decision making, consisted of patients, families, and friends
of patients who had direct involvement with the organization. Healthcare organizations
that embrace patient-and family-centered care at all levels of operation achieve quality

27
improvement, increased patient satisfaction, and customer focus (Halm, Sabo, & Rudiger,
2013). In order to ensure that the organization remained person centered, the mission,
goals, objectives, and activities (see Figure 6) were shared with the facility’s patient
family advisory council, which already included Hispanics and members of other races,
where they were agreed upon for successful planning and implementation of the ED
patient navigator program.
Figure 6. Project mission, vision, goals, and objectives.
Lippitt’s Model
Lippitt’s model of change was useful in implementing a patient navigator
program at the regional medical center in Southern California. It was the most
appropriate evidence-based model for the project as it focused on the role of the leader in
the change process, as a change agent, which was useful for non-nursing and nursing
leaders by following a seven-step process (White & Dudley-Brown, 2012). The seven
steps were as follows:

28
1. Developed the need for change by diagnosing the change.
2. Established change relationships and assessed the motivation and capacity
to change.
3. Clarified assessment for change and determined resources.
4. Established goals and interventions for an action plan.
5. Examined alternatives.
6. Transformed intentions into actual changes and maintained the change.
7. Generalized and stabilized change and ended the helping relationship of
the change agent (White & Dudley-Brown, 2012, p. 53).
Lippitt’s model of change was an appropriate model for nursing as it broadly
incorporated the familiar steps of the nursing process and could be applied in virtually
any nursing setting (Geraci, 1997). First, the nurse diagnosed an actual or potential
problem by assessing all parameters of the problem and the readiness of the environment
for change. The nurse then developed an action plan in collaboration with the members of
the team, which included objective goals with a timeline. Lastly, the plan was
implemented in progressive stages that included periodic evaluation of projected
outcomes at each stage and revision of the plan as necessary to meet overall goals
(Geraci, 1997). Since the organization didn’t know who was going to come to the ED,
Lippitt’s theory couldn’t prepare the Hispanic population for change but could prepare
the organization for change and applied to the patient navigator program, which was a
constant, and was helpful in expanding and clarifying how to manage planned change.
Mitchell (2013) found that using a framework, such as Lippitt’s, proactively versus

29
retrospectively assisted in eliminating potential problems, while addressing and acting on
others, resulted in organizational success of change. Furthermore, MacDonald (2013)
found that Lippitt’s model of change offered a similar process that closely aligned with
nursing process and was appropriate for change management in a variety of settings.
Summary
In summary, after conducting a general and specific literature review there was
opportunity to increase care for the Hispanic population who present to the ED. By
implementing a patient navigator program, utilizing the Health Belief Model, and
Lippitt’s model for change, the regional medical center in Southern California assisted in
navigating this vulnerable population. Project-deign and methods were based on
supportive research found.

30
Section 3: Approach
Project Design and Methods
This project was designed to decrease PCR-ED visits and revisits through the
creation and use of a patient navigator system. A conceptual model was created (see
Figure 7) to provide visual representation of the flow and utilization of a trained patient
navigator (i.e., social worker, case manager, or registration personnel) in the ED. The
patient navigator educated members of the Hispanic population, referred them to various
resources outside the ED, and assisted in scheduling care for them through these
resources. The project was developed in phases and was conceptualized after a review of
literature and best practices of other organizations. Consultation began with
administration, ED leadership, Hispanic patients, registration, case management, social
workers, and other support services. Training of ED registration personnel followed.
The following steps were completed to implement the patient navigator program:
1. Diagnosed the problem and planned for sustainability.
2. Assessed motivation, capacity for change, and need for a patient navigator
system; engaged key stakeholders.
3. Assessed resources; defined the scope, cost, and motivation of the change
agent; and enlisted support from departments/organizations involved in the
Hispanic patients’ care.
4. Defined progressive stages of change with goals and interventions.
5. Examined alternatives and evaluated potential obstacles.

31
6. Implemented strategy, scope, and patient navigator role; maintained the
change.
7. Trained patient navigators. Initially, I had planned for social workers or case
managers to serve in this role. I decided to use registration personnel instead
because these personnel were present 24 hours a day, in contrast to case
managers and social workers. The director of patient access, the director of the
ED, and the assistant chief nursing officer oversaw registration personnel.
8. Patient navigator implemented and coordinated the navigation system and
prepared, referred, and tracked the target population.
9. Gradually removed the change agent from the relationship as the change
became part of the organizational culture.
10. Assessed and reassessed program effectiveness to attain sustainability.
Engagement of key stakeholders is the basis and foundation for good corporation
governance yet is often underestimated or ignored (Sridharan et al., 2007). Engaging key
stakeholders (i.e., not-for profit Medi-Cal and Medicare health plan personnel, members
of the administration, management, hospital staff, local not-for-profit Medi-Cal and
Medicare health plan resources, and members enrolled in the not-for profit Medi-Cal and
Medicare health plan) supported and enabled the connection of stakeholders from both
upstream and downstream to meet and collaborate.
The patient navigator focused on members of the Hispanic population enrolled in
the not-for-profit Medi-Cal and Medicare health plan who enrolled as ESI Level 4 or 5
patients. Upon arrival to the ED at the regional medical center, members of the target

32
population registered, provided a chief complaint, were triaged by a registered nurse, had
a medical screening exam completed by a physician or midlevel provider, received care
and treatment, and once medically cleared, were provided discharge instructions and/or
prescriptions by a nurse and were referred to the trained registration personnel for
navigation. Registration personnel were ultimately used in this role because these staff
were available 24 hours a day, 7 days a week, and continued to provide navigation to care
even during off-peak hours. The ultimate objective was to decrease PCR-ED visits and
revisits by 10% within 1 month of implementation.
Resources used by the patient navigators as PCR-ED patients were discharged
included information on and referrals to other hospitals, specialists, labs, imaging,
primary care physicians, forms of therapy, and/or home health (for patients who had
primary care providers). The goal was to educate members of the Hispanic population to
ensure that they were aware of other resources available to them outside the ED while
supporting them in continuity of care and treatment received while in the ED. By
assisting Hispanic patients in differentiating situations in terms of the need for or use of
the ED and providing resources on other means of health care, a decrease in ED
congestion was achieved.

33
Figure 7. Program design.
Total projected expenses for 2 months were $28,060 (see Appendix E) to support
2.1 full-time-equivalent ED patient navigators (case managers or social workers) in the
ED 12 hours per day, 7 days per week, from 11:00 a.m.-11:00 p.m., when ED volumes
peaked for ESI Level 4 and 5 patients. Registration personnel were ultimately used for
navigation; these staff did not incur any additional overhead charges because they were
already available 24 hours a day, 7 days a week. The target population included
Hispanics enrolled in the not-for-profit Medi-Cal and Medicare health plan. Other

34
expenses included were supplies, marketing and media, cell phones, travel, food, and
miscellaneous overhead and contingency items.
Population
The target population for this project was Hispanic patients (with no limitations in
terms of age, sex, or sexual orientation) enrolled in the not-for profit Medi-Cal and
Medicare health plan who registered in the ED at the regional medical center in Southern
California for PCR-ED visits that were classified as ESI Level 4 and 5 from September 5,
2017 though October 5, 2017.
Data Collection, Data Analysis, and Project Evaluation Plan
Evaluation of outcomes, data collection, data analysis, and project evaluation
were accomplished with the use of electronic health records (EHR). The specific data
were analyzed using a quantitative research method, including Emergency Severity Index
levels and wait times associated with each, patient satisfaction scores, and tracking of
visits and revisits of the targeted population. A review of data was completed at the end
of the 30-day project from September 5 through October 5, which involved analysis of
data pre- and post intervention, same time, year over year, for 2016 and 2017. With the
transition from paper documentation to EHR, there has been a major shift in clinical
documentation and the ability to routinely collect essential demographic, clinical, and
meaningful data for evaluation and analysis (Cochran & Baus, 2015).
Sustainability
Consideration of sustainability was part of the initial planning phase for the
project. Sustainability can be attained for the ED patient navigation system by

35
collaborating with health care providers, ensuring a seamless continuum of care, and
ensuring that the organization provides financial support for the program on an ongoing
basis (Plochg, Delnoij, Hoogedoorn, & Klazinga, 2006). To further promote
sustainability, the key stakeholders—the Hispanic population and the regional medical
center in Southern California—must have equal involvement during the planning,
implementation, and re-evaluation phases to ensure that the needs of both parties are met
(Hanson, Salmoni, & Volpe, 2009). Fleiszer et al. (2015) suggested that persistent,
complementary, aligned, committed leaders of change further sustainability after program
implementation.
After successful project implementation, this project was turned over to the
director of the ED, who will continue to exercise oversight of it in partnership with the
director of patient access and the chief nursing officer. Their leadership will ensure that
ED congestion continues to decrease and that the specific needs of the Hispanic
population continue to be met while assuring sustainability.
Summary
In conclusion, laying the foundations for new approaches to practice is imperative
in the advancement of health care. To effectively and efficiently implement and promote
a positive change project, I spent time determining an area of opportunity, researching
EBP relevant to the opportunity, evaluating current research, and identifying a practice
and change model or theory. My research suggested that there was a need for ED patient
navigators, given patients’ lack of knowledge of available resources. The Hispanic
population benefitted from this project.

36
Section 4: Findings and Recommendations
Introduction
The purpose of this project was to decrease ESI Level 4 and 5 visits and revisits
classified as PCR-ED by 10% within 1 month of implementing a DNP project focusing
on the Hispanic population enrolled in a not-for-profit Medi-Cal and Medicare health
plan. This project involved the use of patient navigators to ensure that members of the
targeted population received appropriate follow-up treatment and care. Other outcomes
included improvements in DLOS, total ED walkout rates, patient satisfaction, ED copays
received, and capacity for higher acuity patients to be seen. The project was conducted
over a 30-day period, and comparison was done year over year for the same dates. The
dates of the project were September 5, 2017, through October 5, 2017; project data were
compared to data for September 5, 2016, through October 5, 2016.
Findings and Implications
Baseline results supported the implementation of an ED navigator for decreasing
PCR-ED visits and revisits (see Table 3). Although there was a 13.28% decrease in total
ED visits, there was a decrease in overall PCR-ED visits. Total ESI Level 4 patients
decreased by 17.38%, and ESI Level 5 patients decreased by 41%, which allowed for
increase in capacity for higher acuity growth of 46.94% of total ESI Level 1 patients
seen.

37
Table 3 Total ED Visits by ESI Level—September 5, 2016 through October 5, 2016, and September 5, 2017 through October 5, 2017 2016 2017 % increase or % decrease
ESI 1 49 72 46.94% increase ESI 2 702 708 0.85% increase ESI 3 2,652 2308 12.96% decrease ESI 4 2,083 1721 17.38% decrease ESI 5 184 108 41% decrease Total 5,670 4,917 13.28% decrease
Although there was a 17.47% decrease in Hispanics enrolled in the not-for-profit
Medi-Cal and Medicare health plan seen in the ED, there was a 9.06% decrease in ESI
Level 4 patients and a 66.67% decrease in ESI 5 patients. Combined PCR-ED visits and
revisits decreased by 14.31% in the target population. As a result, there was increase in
capacity and a 200% increase of ESI Level 1 Hispanic patients enrolled in the not-for-
profit Medi-Cal and Medicare health plan (see Table 4).
Table 4 Total Hispanic Not-for-Profit Medi-Cal and Medicare Health Plan ED Visits—September 5, 2016 through October 5, 2016, and September 5, 2017 through October 5, 2017 2016 2017 % increase or % decrease
ESI 1 3 9 200% increase ESI 2 69 58 15.94% decrease ESI 3 428 328 23.36% decrease ESI 4 508 462 9.06% decrease ESI 5 51 17 66.67% decrease Total 1,059 874 17.47% decrease

38
Further findings revealed a dramatic increase in point-of-service cash collection,
insured and self-pay, with use of registration personnel as patient navigators who were
able to support the ED 24 hours a day, 7 days a week. Year over year, there was an
increase of insured copays collected by 146.88% and an increase in self-pay by 92.73%
(see Table 5).
Table 5 Point-of-Service Cash Collections, Insured and Self-Pay—September 5, 2016 through October 5, 2016, and September 5, 2017 through October 5, 2017 2016 2017 % of increase
Insured $14,545 $35,908 146.88% Self-pay $7,980 $15,380 92.73%
Based on this information, it became evident that the use of ED registration personnel as
patient navigators increased point-of-service cash collections for both insured and self-
pay ED patients as they were able to facilitate navigation and collection of cash in the
same interaction, which would not have been possible if a case manager or social worker
had served as the patient navigator.
Additional significant findings reveal an increase in patient satisfaction and
experience scores with an increase year-over-year trend with the implantation of a patient
navigator. For 2017, during the project time frame, there were 31 surveys completed,
with 45-50 surveys anticipated to be turned in from September 5, 2017 through October
5, 2017. Based on surveys received thus far, there was a 25.88% increase in patient
satisfaction and experience scores, year over year, in the same time frame for 2016 and
2017 (see Table 6).

39
Table 6 Emergency Department Patient Satisfaction Scores—September 5, 2016 through October 5, 2016, and September 5, 2017 through October 5, 2017 Total patients surveyed 2016 2017 % of increase
n = 50 68.4 n = 31 86.1 25.88%
Further findings support the implementation of a patient navigator system, in that
navigators increased throughput and increased capacity. It became evident that the use of
ED registration personnel as patient navigators decreased median DLOS by 8%, which
increased capacity for patients with higher acuity. There was a decrease of 18% in the
total walkout rate, which also decreased risk for patients and the facility (see Table 7).
Table 7 Total Patients Seen, ED Average Daily Census, Median ALOS, Median DLOS, % LWBS, % LWOT, % LAMA, % Eloped, % Total Walkout—September 5, 2016 through October 5, 2016, and September 5, 2017 through October 5, 2017 Data points 2016 2017 % increase or % decrease
Total patients seen 5,670 4,917 13.28% decrease Median ALOS 300 minutes 317 minutes 5% increase Median DLOS 148 minutes 136 minutes 8% decrease % LWBS 0.7% 0.0% 100% decrease % LWOT 0.5% 0.7% 39% increase % LAMA 0.7% 0.6% 14% decrease % eloped 1.4% 1.4% 0% neutral % total walkout 3.3% 2.7% 18% decrease
Implications
The implications of this project were a decrease in ED congestion, a decrease in
PCR-ED visits and revisits, and an increase in capacity to care for those with true

40
emergencies. These implications are supportive of the findings of Charles (2012), who
reported that the use of ED patient navigators decreased ED visits and revisits for patients
not requiring emergency care. These patients would be classified as PCR-ED visits and
revisits. Originally, I planned for case managers or social workers to be used as patient
navigators during the peak hours of 11:00 a.m.-11:00 p.m., Monday through Friday, but I
decided to use ED registration personnel in this role because ED registration personnel
cost less to employ and were in the ED 24 hours a day, 7 days a week. The results
indicated that Hispanics enrolled in the not-for-profit Medi-Cal and Medicare health plan
benefited from patient navigators, in that results revealed increased patient satisfaction,
increased capacity, decreased DLOS, decreases PCR-ED visits and revisits, and
decreased total walkout rates.
Recommendations
The results of this project demonstrated that efforts to decrease PCR-ED visits
and revisits by using an ED patient navigator should continue and expand to all
populations that come to the ED. My recommendation would be to implement this
process at other hospitals in the Southern California valley because they serve the same
population and could benefit from increases in capacity to see critically ill patients,
decreases in DLOS, potential increases in patient satisfaction, and decreases in total
walkout rates. For this medical center to see any increase in point-of-service cash
collection (insured and self-pay), I would recommend that an additional member of the
registration personnel be placed in the ED from 11:00 a.m.-11:00 p.m. to assist with
patient navigation and collection of service cash at times of peak ED volume.
41
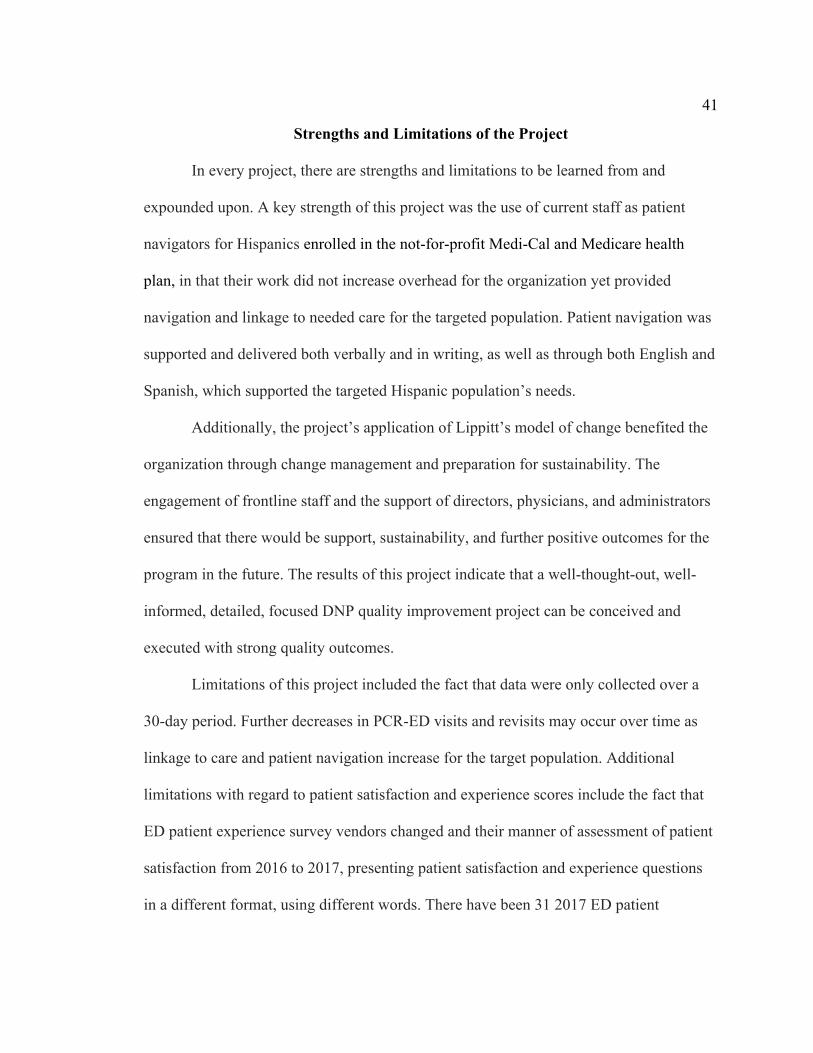
Strengths and Limitations of the Project
In every project, there are strengths and limitations to be learned from and
expounded upon. A key strength of this project was the use of current staff as patient
navigators for Hispanics enrolled in the not-for-profit Medi-Cal and Medicare health
plan, in that their work did not increase overhead for the organization yet provided
navigation and linkage to needed care for the targeted population. Patient navigation was
supported and delivered both verbally and in writing, as well as through both English and
Spanish, which supported the targeted Hispanic population’s needs.
Additionally, the project’s application of Lippitt’s model of change benefited the
organization through change management and preparation for sustainability. The
engagement of frontline staff and the support of directors, physicians, and administrators
ensured that there would be support, sustainability, and further positive outcomes for the
program in the future. The results of this project indicate that a well-thought-out, well-
informed, detailed, focused DNP quality improvement project can be conceived and
executed with strong quality outcomes.
Limitations of this project included the fact that data were only collected over a
30-day period. Further decreases in PCR-ED visits and revisits may occur over time as
linkage to care and patient navigation increase for the target population. Additional
limitations with regard to patient satisfaction and experience scores include the fact that
ED patient experience survey vendors changed and their manner of assessment of patient
satisfaction from 2016 to 2017, presenting patient satisfaction and experience questions
in a different format, using different words. There have been 31 2017 ED patient

42
satisfaction and experience surveys completed for the project time frame thus far, but an
average of 50 ED surveys are completed each month. Furthermore, the decrease in total
patients seen year over year for the same time period made it difficult to correlate and
quantify data to ensure that variation in statistical analysis was accurate.
Summary
The findings of this project support the use of a patient navigator system for
decreasing PCR-ED visits and revisits in the Hispanic population enrolled in a not-for-
profit Medi-Cal and Medicare health plan. The use of patient navigators decreased PCR-
ED visits and revisits and created capacity for higher acuity patients to be seen in the ED.
After project implementation, further positive outcomes were attained as well. The data
support the ongoing practice of patient navigation for Hispanics enrolled in the not-for
profit Medi-Cal and Medicare health plan and should be expanded to all populations in
the future.

43
Section 5: Dissemination Plan
Dissemination
Results of this DNP project were shared with the chief executive officer, chief
nursing officer, regional chief nursing officer, chief financial officer, DNP project
mentor, physicians, front line staff, and leadership within the organization with a
PowerPoint presentation. Statistical information on outcomes was shared with front line
staff, the ED team, registration, and other support services. Congratulations were given to
the teams that supported the project by providing great service to not only the target
population, but also all ED patients. The information was shared over a week and was
discussed during team huddles, sent via email, and discussed during department meetings
with interactive conversations and suggestions to ensure and attain sustainment.
Analysis of Self
The DNP project and curriculum provided the education, expertise, project
management, vision, strategy, research, and tools needed to increase my knowledge as a
change agent, leader, and mentor. The DNP essentials, specifically interprofessional
collaboration for improving patient and population outcomes, provided a true framework
for comprehensive knowledge and understanding, as well as for my growth into my
administrative role as chief nursing officer by supporting evidence-based practice,
applying peer-reviewed research in projects or initiatives, and supporting others in
attaining higher levels of education while practicing at the highest level possible, given
their license and education.

44
Another area of true growth for me in this project was work-life balance, in that I
had to trust and lean on my family, friends, and peers for support. My chairperson was of
pivotal importance and served as a beacon of light. The completion of this project, along
with my program coursework and the relationships I have formed in this process, have
catapulted me to the next level in my career as a chief nursing officer.
Summary
Lippitt’s model of change was useful in implementing a patient navigator at a
regional medical center in Southern California. It was the most appropriate evidence-
based model for the project because it focused on the role of the leader in the change
process as a change agent (White & Dudley-Brown, 2012). Furthermore, one of the most
popular models for health promotion and education, the HBM, was used for this project
because it best served the Hispanic population enrolled in a not-for profit Medi-Cal and
Medicare health plan (Walsh, 1995). The use of evidence-based practice, peer-reviewed
research articles, and detailed project management promoted positive outcomes for the
targeted population.

45
References
Akhtar, N., Kamran, S., Singh, R., Cameron, P., Bourke, P., Khan, R., & Shuaib, A.
(2016). Prolonged stay of stroke patients in the emergency department may lead
to an increased risk of complications, poor recovery, and increased mortality.
Journal of Stroke & Cerebrovascular Diseases, 25(3), 672-678.
doi:10.1016/j.jstrokecerebrovasdis.2015.10.018
Allen, L., & Cummings, J. (2016). Emergency department use among Hispanic adults:
The role of acculturation. Medical Care, 54(5), 449-456.
doi:10.1097/MLR.0000000000000511
Bagchi, A. D., Dale, S., Verbitsky-Savitz, N., Andrecheck, S., Zavotsky, K., &
Eisenstein, R. (2011). Examining effectiveness of medical interpreters in
emergency departments for Spanish-speaking patients with limited English
proficiency: Results of a randomized controlled trial. Annals of Emergency
Medicine, 57(3), 248-256. doi:10.1016/j.annemergmed.2010.05.032
Boerner, H. (2016). A “durable opportunity”: ED overcrowding in the ACA era.
Physician Leadership Journal, 3(3), 32-34.
Cafferty, P. S. J., & Engstrom, D. (2007). An agenda for the twenty-first century:
Hispanics in the United States. New Brunswick, NJ: Transaction.
Centers for Disease Control and Prevention. (2012). Engage stakeholders. Retrieved
from https://www.cdc.gov/std/program/pupestd/Step-1.txt

46
Chaffin, J. (2014). ED navigators help patients find a PCP. Hospital Case Management:
The Monthly Update on Hospital-Based Care Planning and Critical Paths, 22(1),
9-10.
Charles, B. (2012). ED navigators steer patients with social, financial, or behavioral
health needs to appropriate resources. ED Management: The Monthly Update on
Emergency Department Management, 24(12), 137-139.
Coachella Valley Economic Partnership. (2014). 2014 Annual Coachella Valley
economic report. Retrieved from http://cvep.com/content-files/CVEP_2014
_AnnualReport.pdf
Cochran, J., & Baus, A. (2015). Developing interventions for overweight and obese
children using electronic health records data. Online Journal of Nursing
Informatics, 19(1).
Di Somma, S., Paladino, L., Vaughan, L., Lalle, I., Magrini, L., & Magnanti, M. (2015).
Overcrowding in emergency department: An international issue. Internal and
Emergency Medicine, 10(2), 171-175. doi:10.1007/s11739-014-1154-8
Enard, K. R., & Ganelin, D. M. (2013). Reducing preventable emergency department
utilization and costs by using community health workers as patient navigators.
Journal of Healthcare Management, 58(6), 412-427.
Fair Health Consumer. (2015). FAIR Health Survey: Viewpoints about ER use for non-
emergency care vary significantly by race, age, education, and income. Anoyo
Afolobi, 1-3.

47
Fleiszer, A. R., Semenic, S. E., Ritchie, J. A., Richer, M., & Denis, J. (2015). An
organizational perspective on the long-term sustainability of a nursing best
practice guidelines program: A case study. BMC Health Services Research, 15,
535. doi:10.1186/s12913-015-1192-6
Flores-Mateo, G., Violan-Fors, C., Carrillo-Santisteve, P., Peiró, S., & Argimon, J.
(2012). Effectiveness of organizational interventions to reduce emergency
department utilization: A systematic review. Plus One, 7(5).
doi:10.1371/journal.pone.0035903
Garcia, T., Bernstein, A., & Bush, M. (2010). Emergency department visitors and visits:
Who used the emergency room in 2007? National Center for Health Statistics
Data Brief, 38, 1-8.
Geraci, E. (1997). Computers in home care: Application of change theory. Computers in
Nursing, 15(4), 199-203.
Gimbel, R., Tanabe, P., Yarnold, P., & Adams, J. (2004). The Emergency Severity Index
(Version 3) 5-level triage system scores predict ED resource consumption.
Journal of Emergency Nursing, 30(1), 22-102.
Glanz, K., Rimer, B. K., & Lewis, F.M. (2012). Health behavior and health education
(3rd ed.). San Francisco, CA: Jossey-Bass.
Glover, C. M., Purim-Shem-Tov, Y. A., Johnson, T. J., & Shah, S. C. (2016). Medicaid
beneficiaries who continue to use the ED: A focus on the Illinois Medical Home
Network. American Journal of Emergency Medicine, 34(2), 197-201.
doi:10.1016/j.ajem.2015.10.011

48
Hanson, H., Salmoni, A., & Volpe, R. (2009). Defining program sustainability: Differing
views of stakeholders. Canadian Journal of Public Health, 100(4), 304-309.
Hayden, J. (2009). Health belief model. Introduction to Health Behavior Theory.
Retrieved from
http://www.jblearning.com/samples/0763743836/chapter%204.pdf
Halm, M., Sabo, J., & Rudiger, M. (2013). Management. The patient-family advisory
council keeping a pulse on our customers. Critical Care Nurse, 26(5), 58-67.
Healthy People 2020. (2016). Disparities. Retrieved from
https://www.healthypeople.gov/2020/about/foundation-health-
measures/Disparities
Hochbaum, G. M. (1958). Public participation in medical screening programs: A socio-
psychological study (Public health service publication no. 572). Washington,
D.C.: Government printing office.
Hong, R., Baumann, B., & Boudreaux, D. (2007). The emergency department for routine
healthcare: Race/ethnicity, socioeconomic status, and perceptual factors. The
Journal of Emergency Medicine, 32(2), 149-158. doi:0736-467907
Jones, C. L., Jensen, J. D., Scherr, C. L., Brown, N. R., Christy, K., & Weaver, J. (2015).
The Health Belief Model as an explanatory framework in communication
research: Exploring parallel, serial, and moderated mediation. Health
Communication, 30(6), 566-576. doi:10.1080/10410236.2013.873363

49
Kadri, F., Harrou, F., Chaabane, S., & Tahon, C. (2014). Time series modeling and
forecasting of emergency department overcrowding. Journal of Medical Systems,
38(9), 107. doi:10.1007/s10916-014-0107-0
Knapman, M., & Bonner, A. (2010). Overcrowding in medium-volume emergency
departments: Effects of aged patients in emergency departments on wait times for
non-emergent triage-level patients. International Journal of Nursing Practice,
16(3), 310-317. doi:10.1111/j.1440-172X.2010.01846.x
Lee, Y. J., Shin, S. D., Lee, E. J., Cho, J. S., & Cha, W. C. (2015). Emergency
department overcrowding and ambulance turnaround time. Plus One, 10(6),
e0130758. doi:10.1371/journal.pone.0130758
LoGuirato, B. (2014). Doctors think emergency room visits are going to explode under
Obamacare. Retrieved from http://www.businessinsider.com/obamacare-
emergency-room-visits-study-2014-5
MacDonald, M. (2013). Enhancing orientation for graduate nurses to critical care through
the use of a wiki. Canadian Journal of Nursing Informatics, 8(1-2).
Madden, P. S., Carrick, L. A., & Manno, M. S. (2012). ED navigators: Steering patients
through the system. Nursing Management, 4342-48.
doi:10.1097/01.NUMA.0000413642.60397.4d
McMorrow, S., Long, S. K., Kenney, G. M., & Anderson, N. (2015). Uninsurance
disparities have narrowed for Black and Hispanic adults under the Affordable
Care Act. Health Affairs, 34(10), 1774-1778A.
doi:http://dx.doi.org/10.1377/hlthaff.2015.0757

50
McSherry, L. (2015). Inland Empire Health Plan tops one million, scurries to keep up
with growth. Retrieved from http://californiahealthline.org/news/inland-empire-
health-plan-tops-million-scurries-to-keep-up-with-growth/
Mitchell, G. (2013). Selecting the best theory to implement planned change. Nursing
Management (Harrow, London, England: 1994), 20(1), 32-37.
Natale-Pereira, A., Enard, K. R., Nevarez, L., & Jones, L. A. (2011). The role of patient
navigators in eliminating health disparities. Cancer, 117(15 Suppl), 3543-
3552.doi:10.1002/cncr.26264
Papadopoulos, A., Britten, N., Hatcher, M., & Rainville, K. (2013). Using business plan
development as a capstone project for MPH programs in Canada: Validation
through the student perspective. Journal of Community Health, 38(5), 791-798.
doi:10.1007/s10900-013-9698-5
Plochg, T., Delnoij, D. J., Hoogedoorn, N. C., & Klazinga, N. S. (2006). Collaborating
while competing? The sustainability of community-based integrated care
initiatives through a health partnership. BMC Health Services Research, 637.
Rising, K. L., Victor, T. W., Hollander, J. E., &Carr, B. G. (2014). Patient returns to the
emergency department: The time-to-return curve. Academic Emergency
Medicine21(8), 864-871. doi:10.1111/acem.12442
Ricciardi, R., Moy, E., & Wilson, N. J. (2016). Finding the true north: Lessons from the
National Healthcare Quality and Disparities Report. Journal of Nursing Care
Quality, 31(1), 9-12. doi:10.1097/NCQ.0000000000000164

51
Robie, L., Alexandru, D., & Bota, D. A. (2011). The use of patient navigators to improve
cancer care for Hispanic patients. Clinical Medicine Insights. Oncology, 51-7.
doi:10.4137/CMO.S6074
Saan, M. C., Boeije, H. R., Sattoe, J. T., Bal, M. I., Missler, M., & van Wesel, F. (2015).
Recording and accounting for stakeholder involvement in systematic reviews.
Health Information and Libraries Journal, 32(2), 95-106. doi:10.1111/hir.12099
Sanchez-Birkhead, A., Kennedy, H., Callister, L., & Miyamoto, T. (2011). Navigating a
new health culture: Experiences of immigrant Hispanic women. Journal of
Immigrant & Minority Health, 13(6), 1168-1174. doi:10.1007/s10903-010-9369-x
Sarver, J., Cydulka, R., & Baker, D. (2002). Usual source of care and non-urgent
emergency department use. Academic Emergency Medicine, 9(9), 916-923.
Schiff, G. D. (2011). System dynamics and dysfunctionalities: Levers for overcoming
emergency department overcrowding. Academic Emergency Medicine: Official
Journal of the Society for Academic Emergency Medicine, 18(12), 1255-1261.
doi:10.1111/j.1553-2712.2011.01225.x
Shaikh, S. B., Jerrard, D. A., Witting, M. D., Winters, M. E., & Brodeur, M. N. (2012).
How long are patients willing to wait in the emergency department before leaving
without being seen? Western Journal of Emergency Medicine, 13(6), 463-467.
doi:10.5811/westjem.2012.3.6895
Siddharthan, K., Nelson, A., & Weisenborn, G. (2005). A business case for patient care
ergonomic interventions. Nursing Administration Quarterly, 29(1), 63-71.

52
Sridharan, S., Go, S., Zinzow, H., Gray, A., & Barrett, M. G. (2007). Analysis of
strategic plans to assess planning for sustainability of comprehensive community
initiatives. Evaluation and Program Planning, 30(1), 105-113.White, K. M., & Dudley-Brown, S. (2012). Translation of evidence into nursing and
health care practice. New York, N.Y.: Springer.
Whiteman, E. (2015). Obamacare Anniversary: 5 ways the Affordable Care Act changed
health care. Retrieved from http://www.ibtimes.com/obamacare-anniversary-5-
ways-affordable-care-act-changed-health-care-1855630
Walsh, M. (1995). The health belief model and use of accident and emergency services
by the general public. Journal of Advanced Nursing, 22(4), 694-699.
doi:10.1046/j.1365-2648.1995.22040694.x
Wright, B., Potter, A. J., & Trivedi, A. (2015). Federally qualified health center use
among dual eligibles: Rates of hospitalizations and emergency department visits.
Health Affairs, 34(7), 1147-1155.doi:10.1377/hlthaff.2014.0823
Wuerz, R. (2011). Emergency severity index triage category is associated with six-month
survival. ESI Triage Study Group. Academic Emergency Medicine: Official
Journal of the Society for Academic Emergency Medicine, 8(1), 61-64.

53
Appendix A: ESI Level 5 Patient Flow
Admi%ng
TriageRN
MDorMid-Level
TreatmentRN
Registra8on
DischargeRN

54
Appendix B: ESI Level 4 Patient Flow
Admi%ng
TriageRN
MDorMid-Level
TreatmentRN
Labs,Radiology,
orDiagnos;cs
Registra;on
DischargeRN

55
Appendix C: ESI Level 5 Resource Cost
ESI5
Role/TitleAveragePay
Consequential
CostDuring
DirectPatient
Encounter
DirectTime
Spentin
Minutes
Admitting $18.00 $2.16 5
TriageRN $55.00 $6.60 5
MD/Mid-
Level$110.00 $13.20 5
Treatment
RN$55.00 $13.20 10
Registration $18.00 $2.16 5
Discharge
RN$55.00 $19.80 15
Total $311.00 $57.12 45

56
Appendix D: ESI Level 4 Resource Cost
ESI4Role/Title
AveragePay
ConsequentialCostDuringDirectPatientEncounter
DirectTimeSpentinMinutes
Admitting $18.00 $2.16 5TriageRN $55.00 $6.60 5MD/Mid-Level
$110.00 $13.20 5
TreatmentRN
$55.00 $13.20 10
Phlebotomist $18.00 $2.16 5Radiology/Diagnostic
Tech$30.00 $3.60 5
Registration $18.00 $2.16 5Discharge
RN$55.00 $19.80 15
Total $359.00 $62.88 55

57
Appendix E: Expenses for 6-Month Trend
Expenses January February March April May June Total
Salary/Wages/Benefitsfor2.1FTE'sat$30/hour
$10,080.00 $10,080.00 $10,080.00 $10,080.00 $10,080.00 $10,080.00 $60,480.00
Supplies $350.00 $350.00 $350.00 $350.00 $350.00 $350.00 $2,100.00Marketing/Media
$2,500.00 $1,500.00 $1,000.00 $500.00 $500.00 $500.00 $6,500.00
CellPhone $100.00 $100.00 $100.00 $100.00 $100.00 $100.00 $600.00Travel/Food $500.00 $500.00 $500.00 $500.00 $500.00 $500.00 $3,000.00
Misc.OverheadandContingency
$1,000.00 $1,000.00 $1,000.00 $1,000.00 $1,000.00 $1,000.00 $6,000.00
$14,530 $13,530 $13,030 $12,530 $12,530 $12,530 $78,680