dedza safety nets pilot project: learning leasons about ...snsbarah/dsnpp/dedza safety nets...
TRANSCRIPT

Dedza Safety Nets Pilot Project: learning lessons about direct welfare transfers
for Malawi’s National Safety Nets Strategy
Final Report
October 2002
by Sarah Levy (Calibre Consultants - Reading, UK)
Gerald Nyasulu and Jaynet Kuyeli
(Concern Universal - Dedza, Malawi)
with support from Carlos Barahona and Cathy Garlick, Statistical Services Centre
University of Reading, UK

2

3
Table of contents
Table of contents ............................................................................................................3 Table of figures...............................................................................................................6 Acknowledgements .........................................................................................................7 List of acronyms .............................................................................................................8 Chapter 1: Introduction ...................................................................................................9
1.1 Objectives.............................................................................................................9 1.2 Outputs ................................................................................................................9 1.3 Organisation of the work........................................................................................9
Chapter 2: Methodology ................................................................................................11 2.1 The M&E system .................................................................................................11 2.2 Intervention types and sampling scheme...............................................................12
2.2.1 Types of intervention ....................................................................................12 2.3 Sampling ............................................................................................................13 2.4 The surveys ........................................................................................................14
2.4.1 The baseline and final impact surveys.............................................................14 2.4.2 The quarterly monitoring surveys ...................................................................15 2.4.3 Control group ...............................................................................................16
2.5 The poverty index ...............................................................................................16 2.5.1 The assets dimension ....................................................................................16 2.5.2 The income dimension...................................................................................17 2.5.3 Composite assets and income index................................................................18
Chapter 3: Managing the benefit ....................................................................................19 3.1 Setting up and training the village committees .......................................................19
3.1.1 Setting up the village committees...................................................................19 3.1.2 Training .......................................................................................................19
3.2 Performance of “closely monitored” village committees...........................................20 3.3 Performance of “hands-off” village committees ......................................................20
3.3.1 Receipt of the benefit in “hands-off” villages ...................................................21 3.4 Comparison of experiences on receipt of benefit ....................................................23 3.5 Replacement of beneficiaries ................................................................................24 3.6 General management skills...................................................................................24 3.7 Problem solving...................................................................................................25 3.8 Conclusion ..........................................................................................................26
Chapter 4: Delivering the benefit ....................................................................................27 4.1 Logistics .............................................................................................................27
4.1.1 Cash ............................................................................................................27 4.1.2 Vouchers......................................................................................................27
4
4.1.3 In-kind transfers ...........................................................................................29 4.1.4 Comparison of logistics..................................................................................29
4.2 Cost of delivery ...................................................................................................30 4.2.1 Overheads, delivery and M&E costs ................................................................30 4.2.2 Monthly cost of delivering different types of transfers ......................................30
4.3 Security and other problems.................................................................................31 4.4 Conclusion ..........................................................................................................32
Chapter 5: Beneficiaries and use of the transfers .............................................................33 5.1 The beneficiary households ..................................................................................33 5.2 Use of the benefit................................................................................................33 5.3 Vouchers ............................................................................................................34 5.4 Conclusion ..........................................................................................................35
Chapter 6: Beneficiary well-being ...................................................................................36 6.1 Poverty...............................................................................................................36
6.1.1 The beneficiaries’ poverty profile ....................................................................36 6.1.2 Housing and basic facilities ............................................................................38 6.1.3 Economic activities and income ......................................................................38 6.1.4 Savings ........................................................................................................39 6.1.5 Assets..........................................................................................................39
6.2 Food security ......................................................................................................40 6.2.1 Comparison of beneficiary and non-beneficiary households...............................41 6.2.2 Why the DSNPP did not increase household food security.................................42 6.2.3 Did the DSNPP help to reduce hunger? ...........................................................43 6.2.4 Seasonal variations and type of transfer..........................................................45
6.3 Unmet needs ......................................................................................................46 6.3.1 Before and after the project...........................................................................46 6.3.2 Over the period of the project ........................................................................47
6.4 Conclusion ..........................................................................................................48 Chapter 7: Consumer demand and retailers.....................................................................49
7.1 Beneficiary household expenditure patterns ...........................................................49 7.2 Analysis of voucher receipts .................................................................................50
7.2.1 How the vouchers were spent ........................................................................51 7.2.2 What was purchased.....................................................................................54 7.2.3 Price increases..............................................................................................61
7.3 The impact on the retail sector .............................................................................61 7.4 Project expansion ................................................................................................62
Chapter 8: Main recommendations .................................................................................63 8.1 Type of transfer ..................................................................................................63 8.2 Type of committee ..............................................................................................63

5
8.3 Type of monitoring/supervision.............................................................................63 8.4 Flexibility ............................................................................................................63
Appendix 1: Interim Report Executive Summary ..............................................................64 Appendix 2: Guidelines, checklist and reporting form for visits to “hands-off” villages..........67 Appendix 3: Final impact survey questionnaires ...............................................................74 Appendix 4a: Beneficiary eating patterns (baseline and final impact surveys) ................... 105 Appendix 4b: Beneficiary eating patterns (all surveys).................................................... 113 Appendix 5a: Unmet needs findings (baseline and final impact surveys) .......................... 119 Appendix 5b: Unmet needs findings (all surveys) ........................................................... 125 Appendix 6: Household expenditure (all surveys) ........................................................... 128 Appendix 7: Costs ....................................................................................................... 142 Appendix 8: CU payments to retailers ........................................................................... 145 Appendix 9: Problems detected during data analysis ...................................................... 147 Appendix 10: List of villages in DSNPP .......................................................................... 151

6
Table of figures Table 2.1: Allocation of types of transfer to villages .........................................................14 Table 3.1: Proportion receiving the transfer in full at final impact survey............................21 Table 3.2: Proportion receiving the transfer in full at Q2 and Q3 .......................................24 Table 5.1: Household size ..............................................................................................33 Table 5.2: Economically active people.............................................................................33 Table 5.3: Proportion of households where the DP does the shopping ...............................33 Table 5.4: Sex of people doing the shopping ...................................................................34 Table 6.1: Change in poverty profile of beneficiary households .........................................36 Table 6.2: Poverty profiles of core group, dropouts and replacements ...............................37 Table 6.3: Change in poverty profile of beneficiary households by type of transfer..............37 Table 6.4: Housing........................................................................................................38 Table 6.5: Diversity of income sources ............................................................................38 Table 6.6: Sources of household income .........................................................................39 Table 6.7: Household savings.........................................................................................39 Table 6.8: Ownership of livestock ...................................................................................40 Table 6.9: Personal assets of disadvantaged people .........................................................40 Table 6.10: Food security profile of all DSNPP beneficiary households................................41 Table 6.11: Food security profile of poorest DSNPP beneficiary households* ......................42 Table 6.12: Food security profile of non-beneficiaries* .....................................................42 Table 6.13: Improvement in meals eaten by DP over period of project ..............................44 Table 6.14: Significant factors and interactions for meals eaten by DP...............................44 Table 6.15: Reduction in unmet needs over period of project............................................46 Table 6.16: Significant factors for unmet needs ...............................................................47 Table 7.1: Breakdown of total voucher expenditure for top 18 items* bought during ten distributions (September 2001-July 2002) .......................................................................55 Table 7.2: Average amounts spent at different stores at peak of hungry period* ................61 Appendix 7, Table 1: Main costs of DSNPP, May 2001 to August 2002 ............................. 142 Appendix 7, Table 2: Approximate cost per month including supervision system............... 143
7
Acknowledgements
The authors of this report would like to thank Samson Hailu, Andrew Neill and Senard Mwale of Concern Universal (CU) for their management support. We also extend our thanks to CU’s Data Entry Manager for the DSNPP, Felex Namaluweso, and CU’s Accountant, Ian Khwiya.
We thank Harry Potter, Mags Gaynor, Andrea Cook and Peter Evans of the UK Department for International Development (DFID), who have supported the pilot. The Final Report of the DSNPP is an output from a project funded by DFID. However, we would like to point out that the views expressed herein are not necessarily those of DFID.

8
List of acronyms
ADC Area Development Committee
CU Concern Universal
DFID Department for International Development (UK)
DP Disadvantaged Person (DWT beneficiary)
DSNPP Dedza Safety Nets Pilot Project
DWT Direct Welfare Transfer
EPA Extension Planning Area
FEWS Famine Early Warning System
M&E Monitoring and Evaluation
NSNS National Safety Nets Strategy
Q1 1st quarterly monitoring survey
Q2 2nd quarterly monitoring survey
Q3 3rd quarterly monitoring survey
SSC Statistical Services Centre
TA Traditional Authority
VDC Village Development Committee
VH Village Head

9
Chapter 1: Introduction
1.1 Objectives
The 2001-02 Dedza Safety Nets Pilot Project (DSNPP) was a pilot designed to test a system of direct welfare transfers (DWTs) to the work-constrained rural poor which could be implemented country-wide as part of the National Safety Nets Strategy (NSNS). The M&E component of the DSNPP was an integral part of the project, since the point was to learn lessons which would inform the design of a scaled-up DWT programme.
The pilot aimed to test and monitor:
1. community management structures and transfer mechanisms;
2. whether the benefits reach the beneficiaries; and
3. what use is made of the transfers.
It also aimed to evaluate:
4. the impact of the transfers on the well-being of beneficiaries.
1.2 Outputs The results of the DSNPP are expected to inform the design of a scaled-up programme of DWTs to the work-constrained poor. The DSNPP provides evidence on:
a) whether communities are able to manage the transfers (deliver the benefits), and which type of village committee is most effective;
b) what type of transfer has the greatest impact on beneficiaries’ well-being;
c) what level of outside management/logistical support is required to implement the project and how much this is likely to cost;
d) what is the pattern of consumer demand generated by the transfers; and
e) what level of monitoring is required to keep the project on track.
The Interim Report, published in March 2002, provided preliminary evidence on points a, b, c and d. It also provided evidence on whether retailers are capable of meeting the challenges of a voucher scheme and what is the impact of such a scheme on the retail sector.
The Final Report provides a complete picture, including evidence on point e, by comparing performance in “closely monitored” and “hands-off” villages (see Section 2.2). It does not, however, examine the selection of beneficiaries. This was addressed in the Interim Report and will be the subject of further research in the ‘extension phase’ of the DSNPP in 2002-03.
The Final Report is intended to be read in conjunction with the Interim Report. Although the main conclusions of the Interim Report are repeated here, as well as some background information, we do not repeat much of the detailed analysis of the Interim Report. Where appropriate, references to the Interim Report are included. A summary of the Interim Report findings is provided in Appendix 1.
1.3 Organisation of the work The pilot centred on distributions of DWTs to selected beneficiaries (see Interim Report, Section 1.3). The distributions were supposed to take place once a month between September 2001 and August 2002. However, in some cases there were gaps of six weeks due
10
to internal CU problems with funds. This was particularly the case in December-March and May-August.
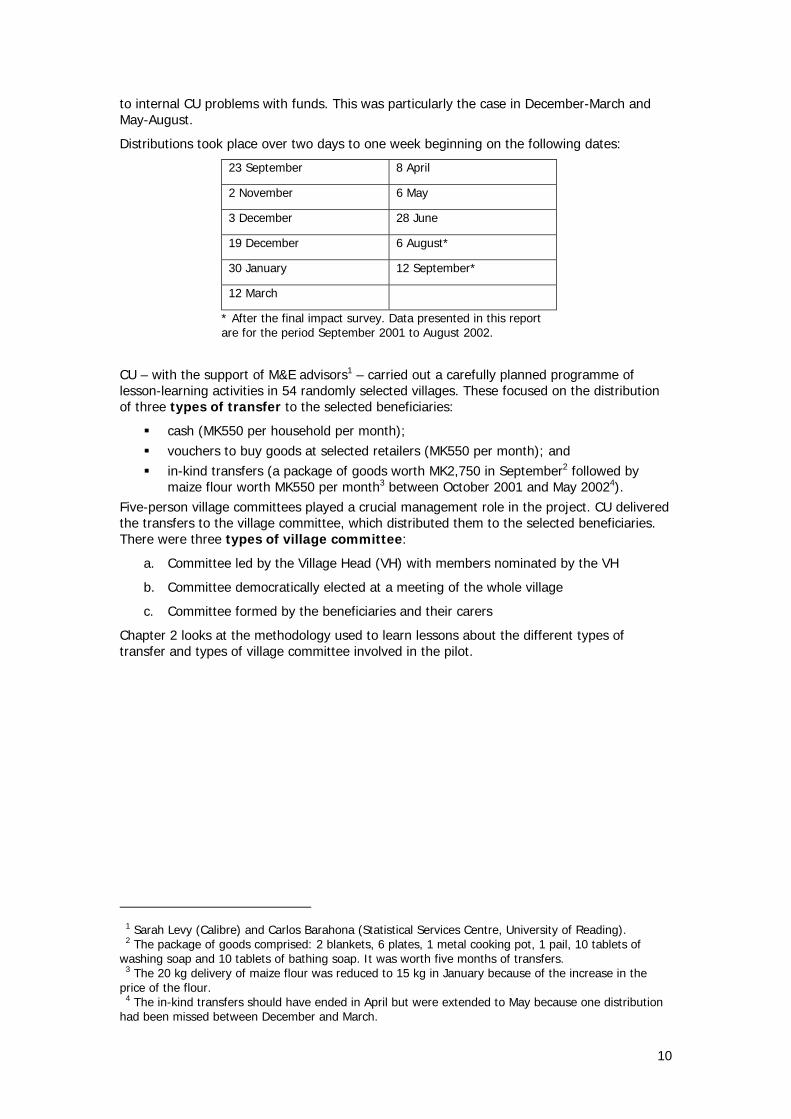
Distributions took place over two days to one week beginning on the following dates:
23 September 8 April
2 November 6 May
3 December 28 June
19 December 6 August*
30 January 12 September*
12 March
* After the final impact survey. Data presented in this report are for the period September 2001 to August 2002.
CU – with the support of M&E advisors1 – carried out a carefully planned programme of lesson-learning activities in 54 randomly selected villages. These focused on the distribution of three types of transfer to the selected beneficiaries:
! cash (MK550 per household per month); ! vouchers to buy goods at selected retailers (MK550 per month); and ! in-kind transfers (a package of goods worth MK2,750 in September2 followed by
maize flour worth MK550 per month3 between October 2001 and May 20024). Five-person village committees played a crucial management role in the project. CU delivered the transfers to the village committee, which distributed them to the selected beneficiaries. There were three types of village committee:
a. Committee led by the Village Head (VH) with members nominated by the VH
b. Committee democratically elected at a meeting of the whole village
c. Committee formed by the beneficiaries and their carers
Chapter 2 looks at the methodology used to learn lessons about the different types of transfer and types of village committee involved in the pilot.
1 Sarah Levy (Calibre) and Carlos Barahona (Statistical Services Centre, University of Reading). 2 The package of goods comprised: 2 blankets, 6 plates, 1 metal cooking pot, 1 pail, 10 tablets of
washing soap and 10 tablets of bathing soap. It was worth five months of transfers. 3 The 20 kg delivery of maize flour was reduced to 15 kg in January because of the increase in the
price of the flour. 4 The in-kind transfers should have ended in April but were extended to May because one distribution
had been missed between December and March.

11
Chapter 2: Methodology This chapter describes the approach used to collect the evidence presented in this report.
2.1 The M&E system
The original M&E programme covered four areas of interest:
1. The impact on BENEFICIARIES, assessed by a baseline and a final impact survey of all beneficiaries and by quarterly monitoring of a sample of beneficiaries, to find out a) whether the transfers reached the beneficiaries and what use was made of them; and b) what was the impact on the food security and other basic needs of the beneficiaries.
2. The process, as managed by the VILLAGE COMMITTEES, assessed by asking committee members to keep records of their decisions; how they solved any problems; their suggestions; reasons for registering new beneficiaries if any beneficiary households dropped out and needed replacing; and feedback from beneficiaries. In addition, special forms were provided to keep track of the transfers. These helped us to assess the management structures and mechanisms for handling transfers at the village level.
3. The logistics, as managed by CU. The Project Officers kept records of their interactions with village committees, retailers, suppliers, ADCs, etc. Particular attention was given to how any problems were solved and to any complaints received from beneficiaries5. CU also kept separate accounts for the project, with expenditure divided into budget categories in order to allow costs to be forecast for a scaled-up version of the project.
4. The expenditure pattern associated with the transfers. This was intended to provide policymakers with evidence on what would be the likely pattern of expenditure associated with a DWT programme, allowing us to inform retailers about probable patterns of consumer demand under a scaled-up DWT programme. Information about expenditure patterns comes from the surveys and from the analysis of voucher receipts6.
Two additional areas were added to the M&E system as the project evolved:
1. The impact of vouchers on the retail sector. The analysis is based on Project Officers’ notes about the behaviour of retailers participating in the voucher scheme, comments from retailers about the project’s impact on their businesses and voucher receipts.
2. Inter- and intra-household relations. Fieldwork with “hands-off” villages in June 2002 incorporated some questions about handling of transfers within beneficiary households and relations between beneficiary and non-beneficiary households. Further work on this topic is planned for the pilot’s ‘extension phase’ in 2002-03.
Studies on beneficiary preferences7 and beneficiary selection are also planned in March-April and May-July 2003 respectively as part of the extension phase.
The Statistical Services Centre (SSC) and Calibre Consultants provided support to CU on the M&E component. This involved advice on how to set up the M&E system; designing sampling
5 CU established a “complaints procedure” for beneficiaries. Records of any complaints received by CU
(either directly or through ADCs) were kept in the Project Officers’ notebooks, and entries included reports on how each complaint was handled by the Project Officers.
6 Retailers who agreed to accept vouchers had to keep receipts for goods purchased with the vouchers (see Section 4.1.2). Payment to retailers was made only if the total recorded in the receipt books matched the total value of vouchers returned to CU.
7 We conducted participatory workshops on beneficiary preferences during the June 2002 visits to “hands-off” villages, but we do not present the results here owing to problems with the fieldwork.

12
schemes for villages and for beneficiaries; designing data collection instruments (village committee forms, questionnaires etc); contributing to the manual for village committees; setting up a data management system; analysing quantitative data; structuring the work in the “hands-off” villages; and contributing to CU’s Interim and Final Reports.
2.2 Intervention types and sampling scheme
2.2.1 Types of intervention
The pilot tested three different factors of the DWT process:
1. Type of transfer 2. Type of village committee 3. Level of monitoring
Each of these factors took different forms (or ‘levels’) as follows:
1. Types of transfer
a. Cash b. Vouchers to spend at selected retailers c. Hand-outs of goods and food (in-kind transfers)
2. Types of village committee
a. Committee led by the village head with members nominated by the village head (VH committee)
b. Committee democratically elected at a meeting of the whole village (democratic committee)
c. Committee formed by the beneficiaries and their carers (beneficiary/carer committee)
3. Level of monitoring
We foresaw that the process of closely monitoring the management and use of the transfers would have an effect on the behaviour of village committees and beneficiaries. The presence of CU at village committee meetings and the quarterly monitoring surveys were likely to make the whole system work better than under non-pilot conditions. Therefore, we decided to examine what would happen with a “hands-off” approach, which would simulate an environment like the one that would be likely in a scaled-up version of the project. As a result, two levels of monitoring at village level were included in the pilot:
a. Close monitoring. This included a baseline survey of beneficiaries, regular presence of CU Project Officers at the village committee meetings at the beginning of the pilot and sporadically afterwards, three quarterly monitoring surveys of a panel of beneficiaries; and one final impact assessment survey at the end of the pilot.
b. “Hands-off” monitoring. This included a baseline survey of beneficiaries, one spot check on the village committee and beneficiaries in June 2002 and the final impact assessment survey. This simulated a situation in which village committees would be left to manage transfers on their own, with spot checks (or audits) by the implementing agency8 at approximately nine-month to one-year intervals.
These three factors generate a total of 18 interventions as shown in Figure 2.1.
8 We use the term ‘implementing agency’ to refer to the agency that implements the project, whether
it be CU, another NGO, local government, or a combination of these.

13
Figure 2.1: Combination of interventions
The pilot used a factorial design for the interventions. Such designs have the advantage that they make it possible to examine any differences between the levels of the factors (type of transfer, type of committee, level of monitoring) as well as any interactions between factors. For example, through the use of an Analysis of Variance it is possible to compare closely monitored versus “hands-off” villages and make comparisons between the impact of different types of transfer or of management by different types of village committee. The same Analysis of Variance allows us to assess interactions. For example, it is possible to assess whether the performance of the village committees is related to the type of transfer that they are handling or whether the monitoring regime and the type of committee have an effect on the performance of specific types of DWT.
Although the number of villages for each intervention was small, the use of a factorial structure (2x3x3 = 18 interventions) makes it possible to generalise our findings.
The types of intervention were allocated to villages at random to avoid bias. We selected 54 villages in Kabwazi and Linthipe EPAs to be part of the pilot9. We also worked in six ‘learning villages’. Transfers started in the learning villages in June 2001 with the purpose of helping us to develop the methodology for the main pilot study.
2.3 Sampling The sample of villages to be included in the pilot was drawn on 11 May 2001. In order to ensure that the sample was representative of the pilot area, the selection was made at random from all the villages in Kabwazi and Linthipe EPAs. In the random selection, the following constraints were imposed:
• Selection of villages to receive vouchers. The sample of villages for distribution of vouchers was a subset of all the villages in the two EPAs. These villages were located in a
9 The choice of Kabwazi and Linthipe EPAs was because they were considered to be the most
vulnerable of the EPAs in which CU was working in Dedza in 2000, when the project began.
14
radius of approximately 10 km around the two trading centres where retailers had been recruited to participate in the scheme (Chimbiya and Thete). The 10 km radius was imposed with the purpose of ensuring that beneficiaries did not have to travel very long distances to use the vouchers and ensuring a critical mass of voucher customers for the retailers that would make their participation in the scheme worthwhile.
• Selection of villages for cash and in-kind transfers. These villages were selected from all the villages in both EPAs after excluding villages that had already been selected for voucher transfers.
• Balance of work for the two Project Officers. Each Project Officer had responsibility for one EPA. In order to split the workload equally between the two officers, it was decided that each would work in 27 villages.
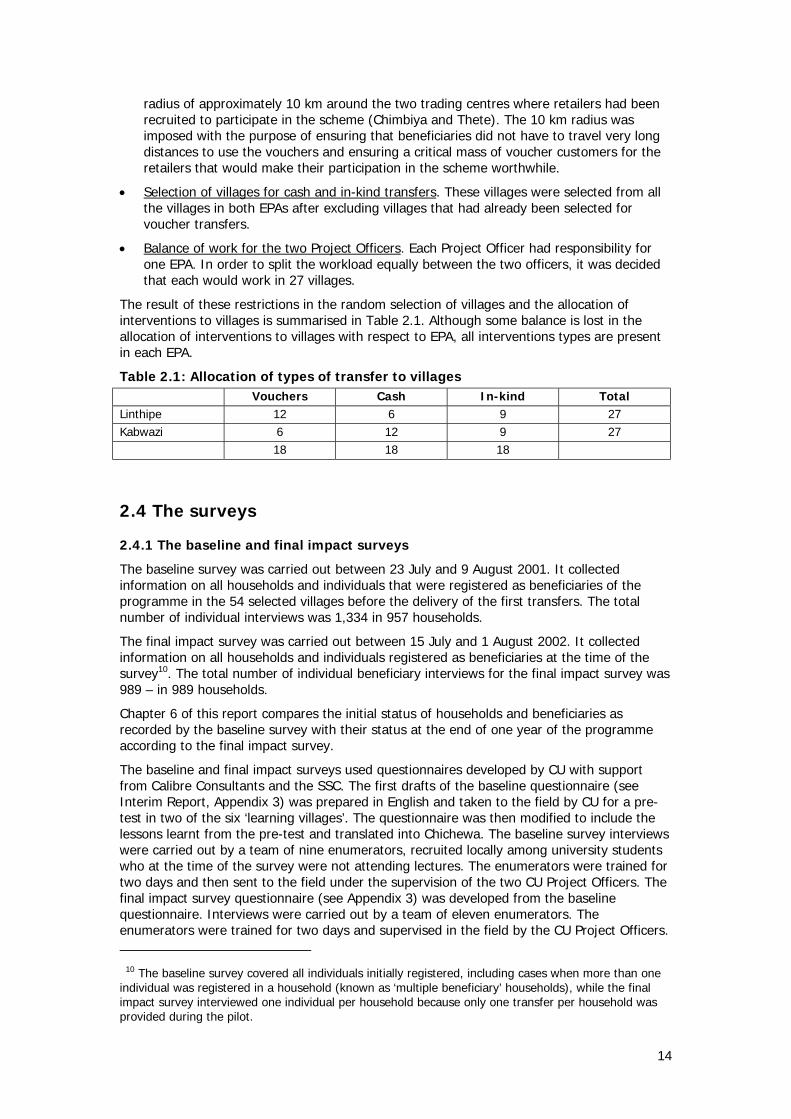
The result of these restrictions in the random selection of villages and the allocation of interventions to villages is summarised in Table 2.1. Although some balance is lost in the allocation of interventions to villages with respect to EPA, all interventions types are present in each EPA.
Table 2.1: Allocation of types of transfer to villages Vouchers Cash In-kind Total Linthipe 12 6 9 27 Kabwazi 6 12 9 27 18 18 18
2.4 The surveys
2.4.1 The baseline and final impact surveys
The baseline survey was carried out between 23 July and 9 August 2001. It collected information on all households and individuals that were registered as beneficiaries of the programme in the 54 selected villages before the delivery of the first transfers. The total number of individual interviews was 1,334 in 957 households.
The final impact survey was carried out between 15 July and 1 August 2002. It collected information on all households and individuals registered as beneficiaries at the time of the survey10. The total number of individual beneficiary interviews for the final impact survey was 989 – in 989 households.
Chapter 6 of this report compares the initial status of households and beneficiaries as recorded by the baseline survey with their status at the end of one year of the programme according to the final impact survey.
The baseline and final impact surveys used questionnaires developed by CU with support from Calibre Consultants and the SSC. The first drafts of the baseline questionnaire (see Interim Report, Appendix 3) was prepared in English and taken to the field by CU for a pre-test in two of the six ‘learning villages’. The questionnaire was then modified to include the lessons learnt from the pre-test and translated into Chichewa. The baseline survey interviews were carried out by a team of nine enumerators, recruited locally among university students who at the time of the survey were not attending lectures. The enumerators were trained for two days and then sent to the field under the supervision of the two CU Project Officers. The final impact survey questionnaire (see Appendix 3) was developed from the baseline questionnaire. Interviews were carried out by a team of eleven enumerators. The enumerators were trained for two days and supervised in the field by the CU Project Officers.
10 The baseline survey covered all individuals initially registered, including cases when more than one individual was registered in a household (known as ‘multiple beneficiary’ households), while the final impact survey interviewed one individual per household because only one transfer per household was provided during the pilot.
15
Data from the baseline survey was entered into a Microsoft Access database developed by the SSC for this task. Data entry for the baseline survey was the responsibility of one Data Entry Manager employed for this purpose by CU11. All questionnaires are archived in the offices of CU. Data from the final impact survey was entered into a Microsoft Access database developed by the SSC. Data entry was contracted out to an independent data entry manager who was in charge of a team of six data entry clerks and one data entry supervisor. This team carried out a double data entry exercise that ensured that the computer files contained identical information to that appearing on the questionnaires.
The data summaries from the baseline and final impact surveys presented in this Final Report were produced by the SSC using the data provided by CU.
2.4.2 The quarterly monitoring surveys
These surveys interviewed a subset of beneficiaries randomly selected from every closely monitored village. The main objectives were:
a. to find out whether the transfers reached the beneficiaries and what use was made of them (see Chapter 5); and
b. to keep track of the well-being of the beneficiary households (see Chapter 6) and to record their consumption patterns (see Chapter 7).
One questionnaire was prepared for beneficiaries receiving each type of transfer (see Interim Report, Appendix 4). A similar process of questionnaire design to the one followed in the baseline survey was used. This consisted of a first draft prepared in English, pre-testing in the field12, improvement of the questionnaires and translation into Chichewa. The interviews were carried out by a team of five enumerators.
Three quarterly monitoring surveys were run. The first took place on 15-26 November 2001, the second on 7-12 February 2002 and the third on 24-28 April 2002.
Double data entry was carried out by the Data Entry Manager at CU and both copies of the database were reconciled to ensure that the correct information was used for the analysis13.
The sample size for the quarterly monitoring surveys was designed to be as follows:
Type of village committee
Beneficiaries Democratic Village Head Total
Cash 44 36 33 113 In-kind 29 34 43 106
Type of transfer Vouchers 42 32 31 105 Total 115 102 107 324
Where information presented in this report includes data from the quarterly monitoring surveys (Q1, Q2 and Q3), the information consists of data collected only from the panel of beneficiaries that were interviewed in all five surveys: baseline, Q1, Q2, Q3 and final impact. The number of individuals that provided responses in all of these surveys is 220.
11 Due to the problems with data quality of the baseline survey found during the preparation of the
Interim Report, it was decided that the baseline survey was to be re-entered and re-analysed in full for this report. The re-entry was done by CU’s Data Entry Manager. The process included initial visual checks of the questionnaires for completeness by the CU Project Officers. Finally, checks on consistency of the re-entered data were run by the SSC.
12 Pre-testing was done for the Q1 questionnaire but not repeated for subsequent quarterly monitoring surveys as they used the same questionnaire with only minor modifications.
13 Queries on consistency were run by the SSC. The CU Data Entry Manager and Project Officers then checked the questionnaires and made amendments to the database.

16
2.4.3 Control group
The ethical issues involved in monitoring a group of non-participating disadvantaged people were carefully considered when designing the study. It was concluded that the establishment of a ‘control’ group would be unacceptable as it would imply deliberately excluding a group of disadvantaged people from receiving the benefits.
2.5 The poverty index A poverty index based on assets and reported income was used in the analysis of the results of the pilot. By using this poverty index it was possible to classify each beneficiary household into one of five poverty categories14 and to track changes in the poverty status of the households between the baseline survey (before the first transfer occurred) and the final impact survey.
The following sections describe how the poverty index is calculated.
2.5.1 The assets dimension
A combined assets index was calculated using the following information and corresponding weights:
Abbreviation Asset Weight a1 Chicken (number) 2 a2 Ducks (number) 2 a3 Guinea fowls (number) 2 a4 Doves (number) 2 a5 Pigs (number) 15 a6 Goats (number) 10 a7 Cattle (number) 100 a8 Radio ownership (yes = 1/ no = 0) 7 a9 Bicycle ownership (yes = 1/ no = 0) 20 a10 Oxcart ownership (yes = 1/ no = 0) 100
The assets index was then calculated by multiplying the assets by their weights for each household and then calculating the sum of these products. The formula used is as shown below:
Assets index = (a1 + a2 + a3 + a4)* 2 + a5*15 + a6*10 + a7*100 + a8*7 + a9*20 + a10*100
This assets index was then split into four categories:
Asset index Asset category Category label
less than 2 1 No assets
2 to 30 2 Few assets
31 to 70 3 Several assets
71 or higher 4 Many assets
14 This index is compatible with the poverty index used by the evaluation of the Targeted Inputs
Programme. It allows us classify rural households according to their level of wealth. However, we do not attempt to classify these households in relation to an absolute poverty line such as that of the IHS.

17
2.5.2 The income dimension
The income index was calculated taking into account the following types of income:
Abbreviation Income from i1 Main staple food crop sales (last harvest) i2 Main cash crop sales (last harvest) i3 Sale of dimba crops in the last month i4 Small business in the last month i5 Crafts or artisan work in the last month i6 Livestock sales in the last month i7 Remittances in the last month i8 Pension in the last month i9 Ganyu in the last weeding season i10 Salary in the last month i11 Sale of fish in the last month i12 Sale of charcoal or firewood i13 Sale of mushrooms/forest products in the last month i14 Sale of mice in the last month i15 Sale of fruit in the last month i16 Other income
The income index was calculated using the following formula:
Income index = ( i1 + i2 )/12 + i3 + i4 + i5 + i6 + i7 + i8 + i9 + i10 + i11 + i12 + i13 + i14 + i15 + i16
This income index was then split into four categories. At the time of the baseline survey these were:
Income index (MK) at time of baseline
Income category Category label
0 to 100 1 Up to MK 100 > 100 to 300 2 MK 101 to 300 > 300 to 800 3 MK 301 to 800 > 800 4 MK 800 plus
As a rough adjustment for inflation, the limits for the income categories were recalculated for the final impact survey using maize price inflation figures from Chimbiya trading centre obtained from the Famine Early Warning System (FEWS). The price of maize rose by 134% between June 2001 and June 2002. Thus, at the time of the final impact survey the categories were:
Income index (MK) at time of final impact survey
Income category Category label
0 to 234 1 Up to MK 234 > 234 to 702 2 MK 235 to 702 > 702 to 1872 3 MK 703 to 1872 > 1872 4 MK 1872 plus

18
2.5.3 Composite assets and income index
The poverty index was formed by combining the two categorised indices as follows:
Asset category Income category 1 2 3 4 1 1 1 2 3 2 1 2 3 4 3 2 3 4 5 4 3 4 5 5
The resulting categories were labelled as follows:
Category code Category label 1 Category 1 (Poorest) 2 Category 2 (Poorer) 3 Category 3 (Poor) 4 Category 4 (Less poor) 5 Category 5 (Least poor)

19
Chapter 3: Managing the benefit
3.1 Setting up and training the village committees Three types of community management structure were piloted, namely:
# Committee led by the village head with members nominated by the village head (VH committee)
# Committee democratically elected at a meeting of the whole village (democratic committee)
# Committee formed by the beneficiaries and their carers (beneficiary/carer committee)
The aim of setting up different types of village committees was to find out which was most effective and efficient in handling the transfers.
3.1.1 Setting up the village committees
The CU Project Officers visited each village to sensitise the people on which type of village structure should be set up in their respective villages. In the villages where the VH was supposed to nominate who should be in the committee, the VH was told to choose the committee without holding a sensitisation meeting involving all the people in the village. Some VHs gave the Project Officers names of nominated individuals right away while others demanded some time. In all, to make sure that the VH did not consult anybody in the process, the Project Officers took a substantial amount of time explaining to the VH the importance of not consulting and why he was to choose a committee using his chieftainship powers. This approach registered tremendous success as the VHs became very cooperative and excited about what would be the outcome of the committees they would choose.
In villages where a democratic committee was to be set up, a meeting was held involving all the people, who chose a day when they would select the committee members. The Project Officers observed the selection process without any interference. Potential candidates were nominated and then voting would start. The voting system varied from village to village, with most villages favouring the raising of hands after closing their eyes. Others, however, preferred standing behind a candidate of their choice.
In villages where a committee comprising beneficiaries and their carers was to be set up, the VH was told to call a meeting of registered beneficiaries only. In instances where the beneficiary was unable to attend the meeting, a carer would represent the beneficiary. The selection procedure in these villages was not complicated, as in most villages the choice was limited. In Dzoole village, Linthipe, all the five registered beneficiaries found themselves in the committee, including a young boy of twelve years. Inclusion in this type of committee mostly depended on the ability of the individual to actively participate in project management activities. The CU Project Officers attended the selection meetings.
3.1.2 Training
After the committees were set up, they underwent a one-day training in manageable groups. In Kabwazi, they were divided into five groups with no specific criteria. This differed from Linthipe where they were divided into five groups depending on the type of monitoring: two sessions for closely monitored villages and three sessions for “hands off” villages. Both the Kabwazi and the Linthipe approaches worked well.
All 54 village committees (whether closely monitored or operating under the “hands-off” approach) were trained using a special-purpose manual (see Interim Report, Appendix 2). The closely monitored and the “hands off” committees underwent the same training. CU briefed them on how to manage the transfers, keep records, deal with problems, etc. The training was designed to allow the committees to manage the transfers with minimum need

20
for support from CU during the implementation period, although a degree of intervention by the CU Project Officers was inevitable in those villages which were closely monitored.
The guidelines provided at training included:
• strict non-interference in beneficiaries’ choices of what to do with their transfers;
• how to handle de-registration of beneficiaries and registration of new beneficiaries; and
• how to handle complaints from beneficiaries.
The training was designed in such a way that each committee was presented with a whole picture of what they should be doing, and with tools that they may need to handle different situations independently.
3.2 Performance of “closely monitored” village committees A number of ways were used to monitor the performance of the village committees in the closely monitored villages, including attending committee meetings, analysing records kept by village committees, and asking questions about the committees’ performance in the quarterly surveys. The Interim Report assessed the performance of the closely monitored villages and concluded that:
# Democratically elected committees are more capable and more transparent than the other types of committee, but sometimes take a part of the transfers as payment for their services before delivering them to the beneficiaries. They would require some recognition for their services if they were to continue to be involved. Such payment might reduce the incidence of taking ‘commission’ from the transfers.
# Beneficiary/carer committees are the most trustworthy (they do not steal from the transfers before they are delivered) and need no extra payment for managing the transfers. However, they are less capable than the other types of committee and require more external support.
# VH committees tend to be secretive and unaccountable, although in some cases where the VH does not sit on the committee himself, beneficiaries can complain to the VH if things go wrong.
3.3 Performance of “hands-off” village committees The Interim Report did not present the findings about performance of “hands-off” village committees, since these villages were deliberately not visited for the first nine months of the project in order to simulate a situation in which committees would manage the transfers on their own with occasional spot checks but without close monitoring. The members of the “hands-off” village committees received the same training as those from “closely monitored” villages (see Section 3.1), and were expected to handle the transfers and solve problems using the same guidelines. However, between September 2001 and May 2002 the CU Project Officers refrained from going to these villages, and no surveys were carried out in them after the baseline survey of July-August 2001. The Project Officers only met the committee members at distribution centres once a month, except if a serious problem or complaint was reported to one of the Project Officers.
In June 2002, the Project Officers visited all 27 “hands-off” villages. In this section, we present the evidence collected during these visits about how the village committees had performed. This is assessed in terms of:
• whether they delivered the benefit in full;
• whether they replaced beneficiaries who dropped off the register;
• their general management skills (including keeping records); and
• their ability to solve problems.
21
In each village, the Project Officers conducted interviews first with the village head, then with the beneficiaries and finally with the village committee. It was important to follow this sequence of discussions because we wanted to get some vital information from the village headmen and beneficiaries before talking to the committees. The information that was collected from the village headmen and beneficiaries was used to probe any areas of concern when talking to the village committee members.
The village head was asked to explain how he had seen the work progress and how the committee had been performing. All the village headmen indicated that the work had progressed well and that it was really helping the intended beneficiaries. They also requested that the project should continue and many mentioned that they would like to see an increase in the number of beneficiaries.
After discussing with the village head, all the beneficiaries were gathered together for a group interview, using a checklist (see Appendix 2). Among the questions, the beneficiaries were asked whether the committees were delivering the transfers in full and whether they had any complaints or problems.
The village committee members were not allowed to be present at the beneficiary interviews, so the beneficiaries would have freedom to report to the Project Officers any mismanagement of the transfers by the committee. In one instance, in Kansepa village, when the committee heard that the CU staff wanted to talk to the beneficiaries alone, they wrote a letter to the Project Officers requesting to know what they would discuss with the beneficiaries. The Project Officers refused to discuss with the committee before talking to the beneficiaries. During the discussions with the beneficiaries, it became clear that the committee (a village head committee) had been stealing 75 kg of maize flour every month for five months. When asked, the committee members accepted that they had been stealing and apologised for their behaviour. They attributed it to the serious hunger that was prevalent at the time.
3.3.1 Receipt of the benefit in “hands-off” villages
The final impact survey findings include data on receipt of benefit for cash and voucher beneficiaries (see Table 3.1)15. There does not appear to be much difference in the experience of closely monitored and “hands-off” villages.
Table 3.1: Proportion receiving the transfer in full at final impact survey % households receiving full value of benefit MK550 cash MK550 vouchers Closely monitored 94 98
Hands-off 96 93 Source: DSNPP final impact survey, July-August 2002.
During the visits to “hands-off” villages, five cases of theft by village committees were uncovered, four involving democratic committees and one involving a village head committee16. Of these, two involved cash transfers, two involved vouchers and one involved in-kind transfers (see Box 3.1). When questioned about the thefts, some committee members said that it was because they were doing a lot of work and not getting paid. There were no reports of theft by beneficiary/carer committees.
15 By the time of the visits to “hands-off” villages in June 2002 and the final impact survey in July-August, in-kind beneficiaries were no longer receiving transfers. 16 One case (Kalonga 2) was already known to the CU Project Officers, who had received a complaint about it in late 2001.

22
Box 3.1: Cases of theft reported during visits to “hands-off” villages
In Chafwala (democratic, vouchers), the beneficiaries complained that they were told to bring sugar or soap each time they used the voucher. They were threatened with de-registration if they did not do so. It was also reported that on one occasion the beneficiaries had to pay MK50 to collect their vouchers. The beneficiaries were warned not to report this to the CU Project Officers, but the retailer reported to CU that some beneficiaries from Chafwala came to the shop late because they did not have the MK50 to redeem their vouchers.
The committee at Kudemera (democratic, vouchers) was not transparent at all. Nobody was allowed to see the records. In December, all beneficiaries received vouchers that were worth MK500 only because the committee had removed MK50. The Project Officer paid a visit in response to complaints from the beneficiaries. The committee members admitted having taken the MK50s. They said they were starving, and promised that they would never do it again. In this village, there were also found to be three ghost beneficiaries. The committee members were sharing the three transfers among themselves.
The first committee that was selected in Kalonga 2 (democratic, cash) stole some money. The Project Officers received a complaint that each beneficiary had received MK430 in November. The committee members did not come to the distribution centre to collect their transfers. Instead they came to the CU office in Dedza. After receiving the envelopes, it seems they opened them and removed MK100 from each envelope. Then they bought new envelopes and sealed them again. When they got home, they asked each beneficiary household to give them K20 for transport. In December, the committee was dissolved and a new democratic committee elected. One of the members of the dissolved committee expressed the view that if CU wants the project to be successful, then the beneficiaries themselves should be involved the management of the transfers.
In Chidewere (democratic, cash) the committee was impeached and replaced by a beneficiary/carer committee after it delivered only MK450 to the beneficiaries in December. Three committee members were reported to be working together and excluding the other two. No records were kept.
Kansepa has a village head committee and was receiving in-kind transfers. From December, 15 out of the 35 beneficiary households received 10kg instead 15kg of maize flour. The explanation given by the committee was that due to the hunger crisis, CU had decided to reduce the amount of maize flour so that it could assist other beneficiaries elsewhere. This was not discovered until the village was visited in June, when the beneficiaries realised that it was not true that CU had reduced the amount of maize flour.
The final impact survey found evidence of problems in another “hands-off” village, Mnunkhaludzu, which receives cash and has a village head committee. On investigation, we found one instance of theft of part of the transfer and others in which the village head was reported to be pocketing the transfers of deceased beneficiaries (see Appendix 9).
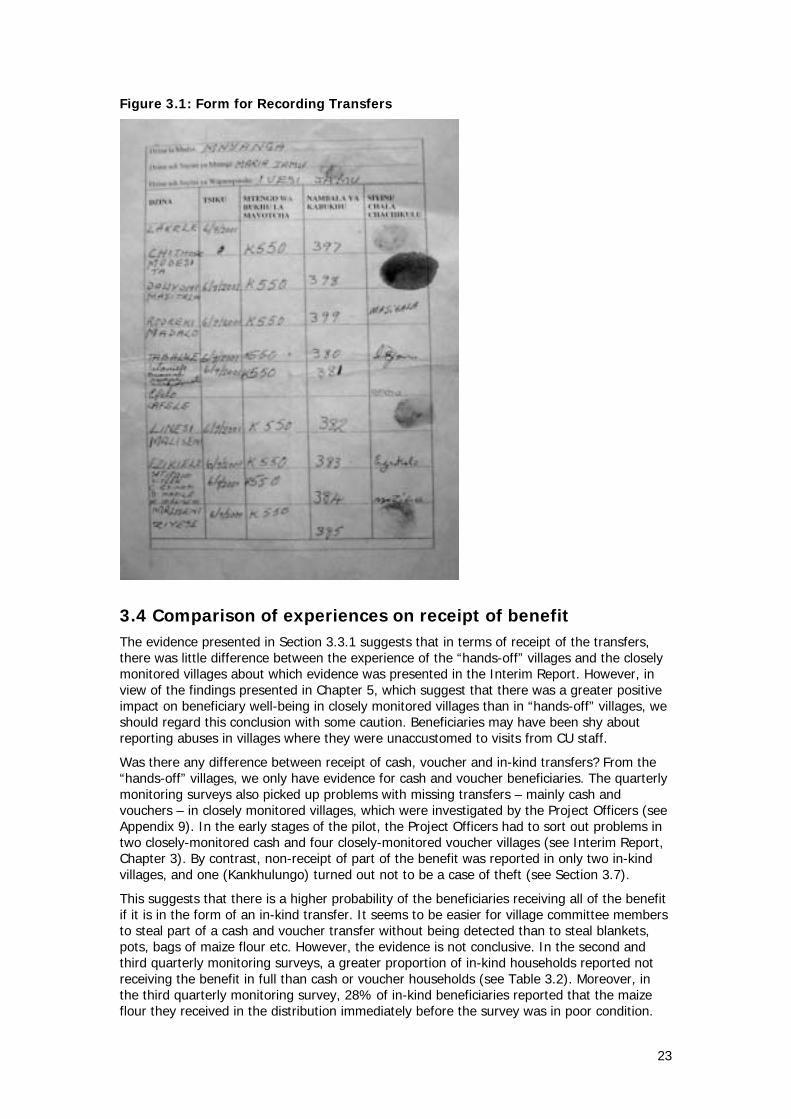
The committees were supposed to keep records of the transfers that they distributed on Forms for Recording Transfers, which the beneficiaries had to sign or thumb print (see Figure 3.1). However, we found that this system did not help in detecting theft. It usually appeared that all beneficiaries were receiving the transfers in full even in cases where theft was reported. In such cases, the village committee members were filling in the forms and getting the beneficiaries to sign as if they had received the transfer in full. We could not verify from the forms whether it was the true beneficiary that received the transfer and signed or thumb printed for it. Therefore a system of spot checks, including interviews with beneficiaries, would be recommended for a scaled-up version of the pilot.
23
Figure 3.1: Form for Recording Transfers
3.4 Comparison of experiences on receipt of benefit The evidence presented in Section 3.3.1 suggests that in terms of receipt of the transfers, there was little difference between the experience of the “hands-off” villages and the closely monitored villages about which evidence was presented in the Interim Report. However, in view of the findings presented in Chapter 5, which suggest that there was a greater positive impact on beneficiary well-being in closely monitored villages than in “hands-off” villages, we should regard this conclusion with some caution. Beneficiaries may have been shy about reporting abuses in villages where they were unaccustomed to visits from CU staff.
Was there any difference between receipt of cash, voucher and in-kind transfers? From the “hands-off” villages, we only have evidence for cash and voucher beneficiaries. The quarterly monitoring surveys also picked up problems with missing transfers – mainly cash and vouchers – in closely monitored villages, which were investigated by the Project Officers (see Appendix 9). In the early stages of the pilot, the Project Officers had to sort out problems in two closely-monitored cash and four closely-monitored voucher villages (see Interim Report, Chapter 3). By contrast, non-receipt of part of the benefit was reported in only two in-kind villages, and one (Kankhulungo) turned out not to be a case of theft (see Section 3.7).
This suggests that there is a higher probability of the beneficiaries receiving all of the benefit if it is in the form of an in-kind transfer. It seems to be easier for village committee members to steal part of a cash and voucher transfer without being detected than to steal blankets, pots, bags of maize flour etc. However, the evidence is not conclusive. In the second and third quarterly monitoring surveys, a greater proportion of in-kind households reported not receiving the benefit in full than cash or voucher households (see Table 3.2). Moreover, in the third quarterly monitoring survey, 28% of in-kind beneficiaries reported that the maize flour they received in the distribution immediately before the survey was in poor condition.

24
Table 3.2: Proportion receiving the transfer in full at Q2 and Q3 % households receiving full value of benefit MK550 cash MK550 vouchers 15 kg maize flour Q2 95 96 91
Q3 96 100 88 Source: DSNPP quarterly monitoring surveys.
It is also important to keep these findings in proportion. Most cases of cash or voucher theft reported to CU staff or detected by the surveys were minor in terms of the amounts taken, and none were reported in villages with beneficiary/carer committees.
3.5 Replacement of beneficiaries When beneficiaries died, moved away from the village or married, a replacement had to be chosen by the village committee. The replacement depended on level of vulnerability; it did not necessarily have to be someone from the same household. We found that all the committees were able to update beneficiary lists and make replacements. In general, the pilot found that this process was handled well. Around 10% of beneficiary households registered at the start of the project were replaced. However, 34 names dropped out in 18 villages and were not replaced by the village committees, equivalent to 3% of the total number of households receiving the transfers.
An analysis of the villages in which replacements were not made in full found that there was no correlation with type of monitoring or type of village committee. However, two-thirds of the 18 villages where problems occurred were in Kabwazi EPA. An example is Mnunkhaludzu village in Kabwazi, which had 13 beneficiary households. Three beneficiaries died and no replacements had been made by the village head committee by the time of the final impact survey (see Appendix 9). The committee had been receiving the transfers every month without informing the Project Officers or making replacements.
3.6 General management skills The Interim Report found that the village committees were generally able to manage the transfers, including keeping records of meetings and of the transfers distributed to beneficiaries (see Interim Report, Section 3.2). It found the democratic committees to be the most efficient and beneficiary/carer committees to be least effective when it came to attending meetings and turning up to collect transfers. However, the beneficiary/carer committees were found to be the most honest and efficient at distributing the transfers, while the democratic committees were most prone to stealing part of the transfers (often seeing this as reasonable remuneration for their efforts).
The committees were supposed to have monthly meetings and to keep records of them, as well as filling in the Form for Recording Transfers (see Figure 3.1). We found that most of the committees were able to keep records of monthly meetings. However, the quality of the records varied. We assessed the records in terms of presentation, content and reports of problem solving. We found no significant differences among the three kinds of committees on the three aspects that were examined. However, we noted that democratic and village head committees achieved a consistently satisfactory level of record-keeping while beneficiary/carer committees varied considerably. For instance Williamu in Kabwazi and Katuta and Dzoole in Linthipe kept good records, but Kajadila did badly on presentation, content and reports of problem solving (see Box 3.2).
The experience of the pilot as a whole confirms the findings of the Interim Report, with one modification: the evidence suggests that although democratic committees are probably the most efficient and the beneficiary/carer committees the least efficient, this overall picture hides much variability among beneficiary/carer committees – some of which are active, strong and have done an excellent job. These tend to be committees where there are some carers, who are able-bodied and likely to have higher levels of education than beneficiaries.

25
We believe that – as recommended in the Interim Report – the best type of committee for the future will be beneficiary/carer committees. However, care should be taken to make sure that these committees include carers, and that they do not depend only on the very elderly, the very young or the infirm, as this can lead to problems. At least one member of the committee should be able to read and write in order to keep records, and if the most active or literate members of the committee leave, they should be replaced – if possible – by new committee members with similar characteristics.
Box 3.2: Record keeping in Williamu and Kajadila
Williamu has a beneficiary/carer committee which keeps its record very well. The chairman of this committee is educated to Form 4 (fourth year of secondary school) and works at Thete trading centre. He does all the writing and the records are neat, properly reflecting the committee discussions.
In Kajadila the beneficiary/carer committee initially comprised four illiterate women and one very old man. Two women left for Mozambique in search of food. The old man is the one who signs for every thing, but his eyesight is very poor. He can only write his name, so he cannot keep the records of committee meetings. However, this committee keeps transfer recording forms as he can copy names of beneficiaries from the beneficiary list.
3.7 Problem solving In the June visits to “hands-off” villages, the main problem that was reported to the Project Officers involved the relationship between beneficiaries and non-beneficiaries, which was described as sour. There was frequent mention by the village committees of bad relations and even ‘hatred’ between beneficiaries and non-beneficiaries, complaints to the village committees, exchange of insults, threats by the non-beneficiaries to rob the beneficiaries of their transfers, and boycotting of development activities17.
During the 2002 hungry period, the problem seems to have been acute, as the number of vulnerable people increased. As the beneficiary list was not flexible, they could not be registered. Many of the village committees tried to solve this problem by promising the non-beneficiaries that they would be registered next time, and some committees even drew up waiting lists. However, a number of committees argued that they needed external assistance in solving the problem, and pleaded with CU to increase numbers of beneficiaries.
Box 3.3: Kankhulungo – a creative approach
Kankhulungo in Kabwazi is a beneficiary/carer committee handling in-kind transfers. The pilot picked up several irregularities in this village (see also Interim Report, Section 3.2). However, on further investigation these were found to be creative solutions to problems rather than instances of corruption. This is the only example found where committee members bent the rules in good faith. The decisions taken highlight the pressures faced by committee members during a food crisis, and the need to allow them the flexibility to register more beneficiaries if there are increased numbers of vulnerable people during some periods.
• At the peak of the hungry season, the committee decided to take some of the beneficiaries’ 5 kg bags of maize flour, open them and distribute the flour to other vulnerable people who were not on the beneficiary list but were near starvation. Thus some listed beneficiaries received only 10 kg instead of 15 kg in December-April.
• The committee says that in the critical period of hunger when people on the waiting list were badly affected, they started making replacements although they were not supposed to do so. They ended up with an expanded beneficiary list (although they still received the same number of transfers).
17 There were a few exceptions, such as Njati (beneficiary/carer committee), Kanamwalikwawo
(democratic committee) and Williamu (beneficiary/carer committee), where sharing between households took place in an effort to reduce the suffering of non-beneficiaries and improve relations.
26
We recommend that in future there should be a flexible approach to registration, allowing for more people to be registered during emergencies or food crises if they meet the criteria to qualify for receipt of the direct welfare transfers.
3.8 Conclusion The findings on village-level management of transfers in “hands-off” villages are similar to those from closely monitored villages. We recommend that a scaled-up DWT programme work with beneficiary/carer committees. These committees have the strongest record on delivery of the benefit and do not demand payment for their services, as democratic and village head committees do, because they benefit directly from the project. However, there should be a stronger emphasis on including carers as well as beneficiaries. If possible, one or two people with literacy skills should be on the committee. In a scaled-up version of the project, external support could be provided for the beneficiary/carer committees through Village Development Committees (VDCs).
While cases of theft of the benefit – including non-replacement of beneficiaries – are widespread, few of them involve large amounts in terms of value of benefit. However, we believe that a system of supervision is needed for a scaled-up version of the project. This would carry out random spot checks on the work of the village committees, feeding back the findings to CU immediately after each visit so that remedial action can be taken where there are irregularities. This system would also identify cases where committees need more external assistance or training. In addition, it could report on cases of ‘good practice’.
The findings show that some flexibility is needed in terms of registration of beneficiaries. A limited quota of beneficiaries is appropriate during times of plenty, but this quota should be allowed to expand in a hunger crisis. Failure to do so will lead to problems between beneficiaries and non-beneficiaries who feel that they qualify as beneficiaries but have not been registered. The village committees are powerless to solve this problem on their own, and, if not solved, it leads to social tension.

27
Chapter 4: Delivering the benefit
4.1 Logistics
4.1.1 Cash
Out of the 1,028 beneficiary households taking part in the pilot18, 278 households received cash transfers. The procedure for delivery to the beneficiaries was as follows:
The Project Officers requested funds from the CU accounts office, and the cash (MK550/month) was packed into small envelopes, one for each beneficiary household. The envelopes were delivered to the distribution points by a Project Officer19. The committee members collected the envelopes from the distribution points and took them to the village where they were given to the beneficiaries. When giving out the cash to beneficiaries, the committee members recorded the name of the beneficiary, date and amount on the Form for Recording Transfers (see Figure 3.1).
In some instances, the beneficiaries accompanied the committee members to the distribution points and if this happened the committee members distributed the money then and there. The beneficiaries opened the envelopes in the presence of the committee members and signed for the money received on the Form for Recording Transfers.
Concern Universal
Village Committee
Beneficiary
Retailer
Transfer of cash
Delivery of cash at Distribution Centre
Distribution of cash to beneficiaries and administration and control including de-registration and registration of new beneficiaries
Concern Universal
Village Committee
Beneficiary
Retailer
Transfer of cash
Delivery of cash at Distribution Centre
Distribution of cash to beneficiaries and administration and control including de-registration and registration of new beneficiaries
Figure 4.1: Cash transfers system
4.1.2 Vouchers
The voucher system was piloted with 371 households. Each voucher booklet was worth MK550, and one was distributed to each beneficiary household every month. The booklet had ten vouchers of different denominations as follows: 1 x MK10, 2 x MK20, 4 x MK50 and 3 x MK100. These entitled the beneficiaries to purchase goods of their choice up to the amount of MK550 at designated retailers. The idea of providing different denominations was that
18 This figure includes households in the six ‘learning villages’ as well as the 54 pilot villages. 19 There are two distribution points in Linthipe – at Makankhula and Mwenje. There are five distribution
points in Kabwazi – at Kapsya, Katewe, Mkavairi, Mtanthira and Kabwazi EPA offices.
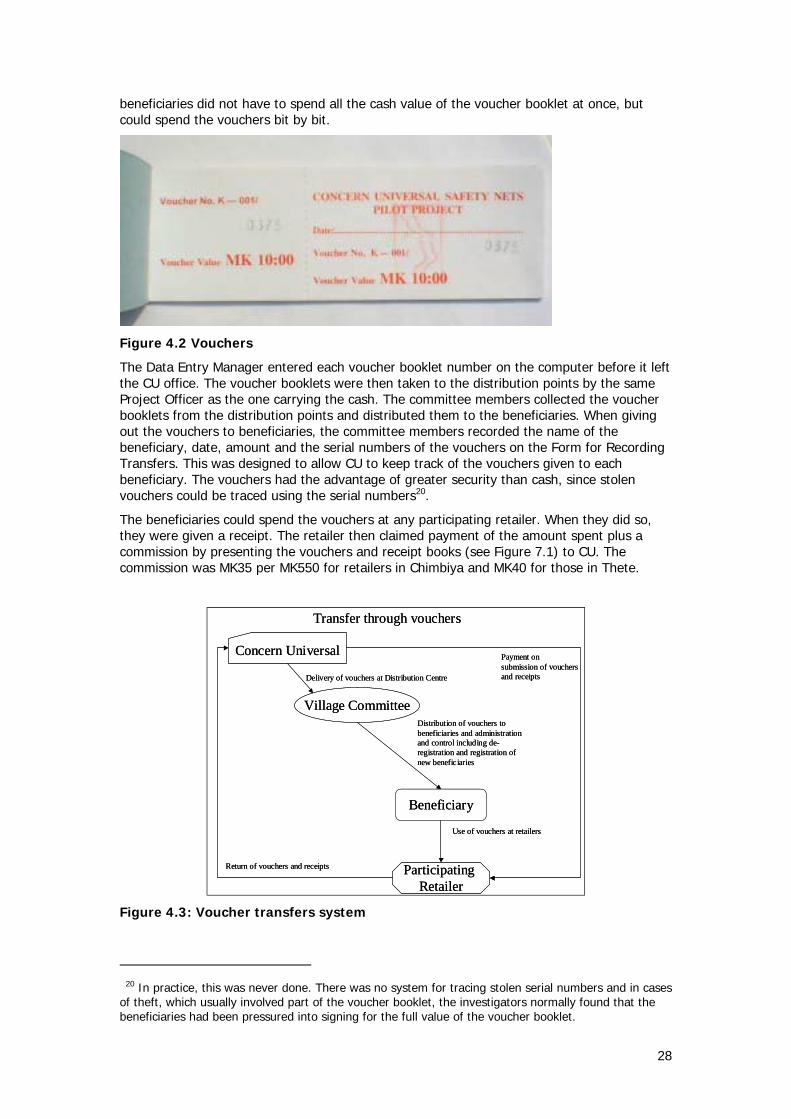
28
beneficiaries did not have to spend all the cash value of the voucher booklet at once, but could spend the vouchers bit by bit.
Figure 4.2 Vouchers
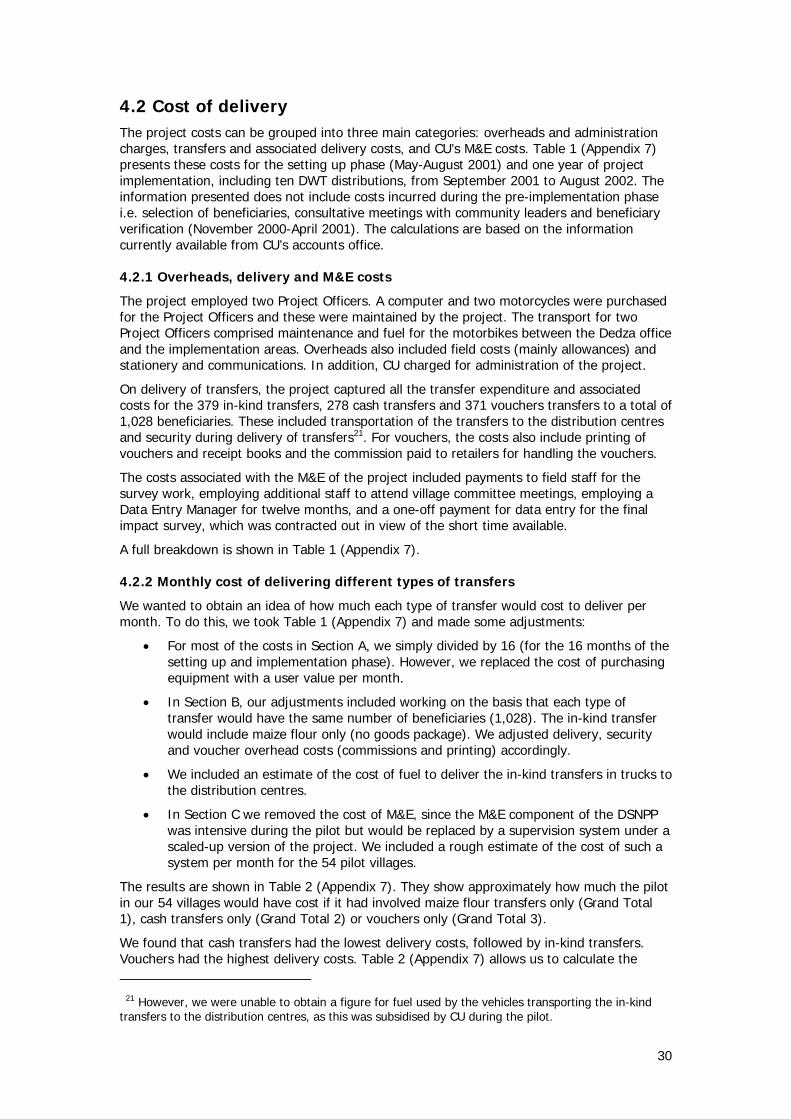
The Data Entry Manager entered each voucher booklet number on the computer before it left the CU office. The voucher booklets were then taken to the distribution points by the same Project Officer as the one carrying the cash. The committee members collected the voucher booklets from the distribution points and distributed them to the beneficiaries. When giving out the vouchers to beneficiaries, the committee members recorded the name of the beneficiary, date, amount and the serial numbers of the vouchers on the Form for Recording Transfers. This was designed to allow CU to keep track of the vouchers given to each beneficiary. The vouchers had the advantage of greater security than cash, since stolen vouchers could be traced using the serial numbers20.
The beneficiaries could spend the vouchers at any participating retailer. When they did so, they were given a receipt. The retailer then claimed payment of the amount spent plus a commission by presenting the vouchers and receipt books (see Figure 7.1) to CU. The commission was MK35 per MK550 for retailers in Chimbiya and MK40 for those in Thete.
Concern Universal
Village Committee
Beneficiary
Participating Retailer
Transfer through vouchers
Return of vouchers and receipts
Payment on submission of vouchers and receipts Delivery of vouchers at Distribution Centre
Distribution of vouchers to beneficiaries and administration and control including de-registration and registration of new beneficiaries
Use of vouchers at retailers
Figure 4.3: Voucher transfers system
20 In practice, this was never done. There was no system for tracing stolen serial numbers and in cases
of theft, which usually involved part of the voucher booklet, the investigators normally found that the beneficiaries had been pressured into signing for the full value of the voucher booklet.

29
4.1.3 In-kind transfers
In-kind transfers comprised a package of goods worth MK2,750 (five months’ worth of transfers at MK550/month) in the first distribution in September, followed by monthly distributions of maize flour worth MK550/month in October to May.
Each of the goods packages distributed in September contained 1 pail, 2 blankets, 6 plates, 1 cooking pot, 10 cakes of washing soap and 10 cakes of bathing soap. This was supplied by G.J. & Co. Ltd of Lilongwe. It was impossible to find a supplier in Dedza because some wholesalers sell groceries only while others sell hardware items only. It was also observed that the items were more expensive in Dedza. Therefore G. J. & Co. Ltd in Lilongwe was chosen because it had all the items we needed. A CU truck collected the items in Lilongwe. Packing was done at CU’s Lobi warehouse and distribution was done by the Project Officers.
Chingola Milling Company, which is based in Dedza, was chosen by CU to be the supplier of maize flour. From September to December 2001, MK550 bought 20 kg of maize flour per beneficiary per month, but due to the fact that the price of maize rose sharply in the 2001-02 hungry period, the same K550 bought only 15 kg of flour from January 2002.
The flour was normally packed a day before distribution. Chingola met all the packing costs and on the day of distribution the CU truck delivered the maize to the distribution centres. A CU Project Officer accompanied the truck on its rounds.
Concern Universal
Village Committee
Beneficiary
Supplier
Transfer of goods and food
Delivery of packs to Village Committee
Administration and control including de-registration and registration of new beneficiaries
Procurement of goods and foodaccording to CU specifications
Contract to supply goods
Concern Universal
Village Committee
Beneficiary
Supplier
Transfer of goods and food
Delivery of packs to Village Committee
Administration and control including de-registration and registration of new beneficiaries
Procurement of goods and foodaccording to CU specifications
Contract to supply goods
Figure 4.4: In-kind transfers system
4.1.4 Comparison of logistics
The amount of work involved in delivering the transfers varies:
• Cash is the simplest type of transfer to manage, since it only involves putting the cash in envelopes and delivering it on a motorbike to the distribution centres.
• Maize flour is also simple: the supplier packs the flour and CU delivers it by truck to the distribution centres; some liaison with suppliers is required.
• Vouchers, like cash, are simple to deliver. However, they involve a number of additional activities which make them complex to manage. These activities include coordinating retailers, agreeing commissions, printing vouchers and receipt books and reconciling payments. This absorbs much time on the part of CU’s Project Officers. A scaled-up version of the project involving vouchers would have to employ additional staff to liaise with retailers and reconcile payments.
30
4.2 Cost of delivery The project costs can be grouped into three main categories: overheads and administration charges, transfers and associated delivery costs, and CU’s M&E costs. Table 1 (Appendix 7) presents these costs for the setting up phase (May-August 2001) and one year of project implementation, including ten DWT distributions, from September 2001 to August 2002. The information presented does not include costs incurred during the pre-implementation phase i.e. selection of beneficiaries, consultative meetings with community leaders and beneficiary verification (November 2000-April 2001). The calculations are based on the information currently available from CU’s accounts office.
4.2.1 Overheads, delivery and M&E costs
The project employed two Project Officers. A computer and two motorcycles were purchased for the Project Officers and these were maintained by the project. The transport for two Project Officers comprised maintenance and fuel for the motorbikes between the Dedza office and the implementation areas. Overheads also included field costs (mainly allowances) and stationery and communications. In addition, CU charged for administration of the project.
On delivery of transfers, the project captured all the transfer expenditure and associated costs for the 379 in-kind transfers, 278 cash transfers and 371 vouchers transfers to a total of 1,028 beneficiaries. These included transportation of the transfers to the distribution centres and security during delivery of transfers21. For vouchers, the costs also include printing of vouchers and receipt books and the commission paid to retailers for handling the vouchers.
The costs associated with the M&E of the project included payments to field staff for the survey work, employing additional staff to attend village committee meetings, employing a Data Entry Manager for twelve months, and a one-off payment for data entry for the final impact survey, which was contracted out in view of the short time available.
A full breakdown is shown in Table 1 (Appendix 7).
4.2.2 Monthly cost of delivering different types of transfers
We wanted to obtain an idea of how much each type of transfer would cost to deliver per month. To do this, we took Table 1 (Appendix 7) and made some adjustments:
• For most of the costs in Section A, we simply divided by 16 (for the 16 months of the setting up and implementation phase). However, we replaced the cost of purchasing equipment with a user value per month.
• In Section B, our adjustments included working on the basis that each type of transfer would have the same number of beneficiaries (1,028). The in-kind transfer would include maize flour only (no goods package). We adjusted delivery, security and voucher overhead costs (commissions and printing) accordingly.
• We included an estimate of the cost of fuel to deliver the in-kind transfers in trucks to the distribution centres.
• In Section C we removed the cost of M&E, since the M&E component of the DSNPP was intensive during the pilot but would be replaced by a supervision system under a scaled-up version of the project. We included a rough estimate of the cost of such a system per month for the 54 pilot villages.
The results are shown in Table 2 (Appendix 7). They show approximately how much the pilot in our 54 villages would have cost if it had involved maize flour transfers only (Grand Total 1), cash transfers only (Grand Total 2) or vouchers only (Grand Total 3).
We found that cash transfers had the lowest delivery costs, followed by in-kind transfers. Vouchers had the highest delivery costs. Table 2 (Appendix 7) allows us to calculate the
21 However, we were unable to obtain a figure for fuel used by the vehicles transporting the in-kind transfers to the distribution centres, as this was subsidised by CU during the pilot.

31
‘alpha value’, or the proportion of the total cost of the project that actually reached the beneficiaries. Expressed in percentage terms, these are the following:
# 61% for in-kind transfers;
# 62% for cash transfers; and
# 56% for vouchers.
This indicates that 62% of the overall cost of the project reached the cash transfer beneficiaries, in the form of the transfers that they received, compared with 61% for in-kind transfer beneficiaries and only 56% for voucher beneficiaries. Thus cash transfers are the most efficient form of DWT delivery, and vouchers are the least efficient.
It should be emphasised that the above cost calculations do not include beneficiary selection or re-registration. The costs of beneficiary selection and re-registration are likely to be considerable, and would reduce alpha values. However, the reduction would be the same irrespective of the type of transfer.
4.3 Security and other problems There are a number of problems associated with the delivery of the transfers:
1. Organising the village committees to collect the transfers. As CU did not deliver the transfers on the same date each month, each time distributions were arranged messages had to be sent to all the village committees to come and collect the transfers. This was costly and time consuming, and would be impossible in a scaled-up version of the project. In future, CU should deliver to each distribution centre on the same date each month so that the committees know when to come for the transfers. However, this may be difficult during the rainy season, when feeder roads become very slippery. On some occasions, distributions were suspended due to bad road conditions and the process had to start all over again, sending new messages inviting committees to come and collect the transfers.
2. In-kind transfers are bulky. After delivery at distribution centres, in-kind village committees had problems transporting the transfers to their respective villages. To overcome this problem, beneficiaries or their carers now accompany the committee members to the distribution centres to collect the transfers. Distributions to beneficiaries take place there and then. Even so, if the level of the benefit is adjusted to provide 30-40 kg of maize flour instead of 15 kg during the hungry period (see Chapter 6), there will be problems carrying the transfers back to the villages. We would recommend providing the flour in small bags to make it easier to carry.
3. Security has been a problem during the 2002 hunger period, as non-beneficiaries have come to distribution centres. CU solved this problem by employing an armed policeman to accompany each distribution. However, some of the in-kind beneficiaries were ambushed on their way home (see Box 4.1).
4. Some committees and beneficiaries stay almost the whole day waiting for the transfers, and do not go home until it is dark because CU tries to cover a large number of distribution centres in one day. In future, we recommend that a less ambitious programme of distribution is undertaken, ending by mid-afternoon.
Box 4.1: Ambush of in-kind beneficiaries
When beneficiaries from Dzoole village were returning home after collecting their maize flour in March, people from villages that were not part of the DSNPP around Kamfundula distribution centre ambushed them. They wanted to rob them of their maize flour. Following this ambush attempt, the village headman advised the beneficiaries to walk in groups. When the matter was reported to the CU project staff, Kamfundula distribution centre was abandoned and the beneficiaries collected their transfers from Mwenje distribution centre.

32
4.4 Conclusion We found that cash and maize flour transfers are not complex to handle and over 60% of the project cost reaches the beneficiaries. On the other hand, vouchers were difficult to manage. Moreover, with vouchers the higher overheads and the need to pay commission to retailers means that only 56% of the project cost reaches the beneficiaries. In terms of logistics and costs, we would not recommend vouchers for a scaled-up version of the DSNPP.
Security during delivery of the DWTs was not a major problem – security problems can be solved by employing policemen to accompany the distribution vehicles. Vouchers had some apparent advantages on security, as stolen vouchers could be traced using the serial numbers. But in practice this proved virtually impossible to do.
If 30-40 kg of maize flour is provided per beneficiary during future hungry periods, there will be too much flour for the village committee members to carry. Beneficiaries will have to accompany the committee members to the distribution centres to collect their transfers, as they have already been doing in many cases. We would recommend providing the flour in small bags to make it easier to carry.
Another problem associated with delivery of the transfers was the schedule for distributions. It was often difficult to communicate with village committees in advance to tell them when distributions would take place. In future, CU should – as far as possible – aim to deliver to each distribution centre on the same date each month so that the village committee members and beneficiaries know when to come for the transfers. We would also recommend a less ambitious daily programme of distributions so that all deliveries are completed by mid-afternoon and committee members and beneficiaries can get back to their villages in daylight.
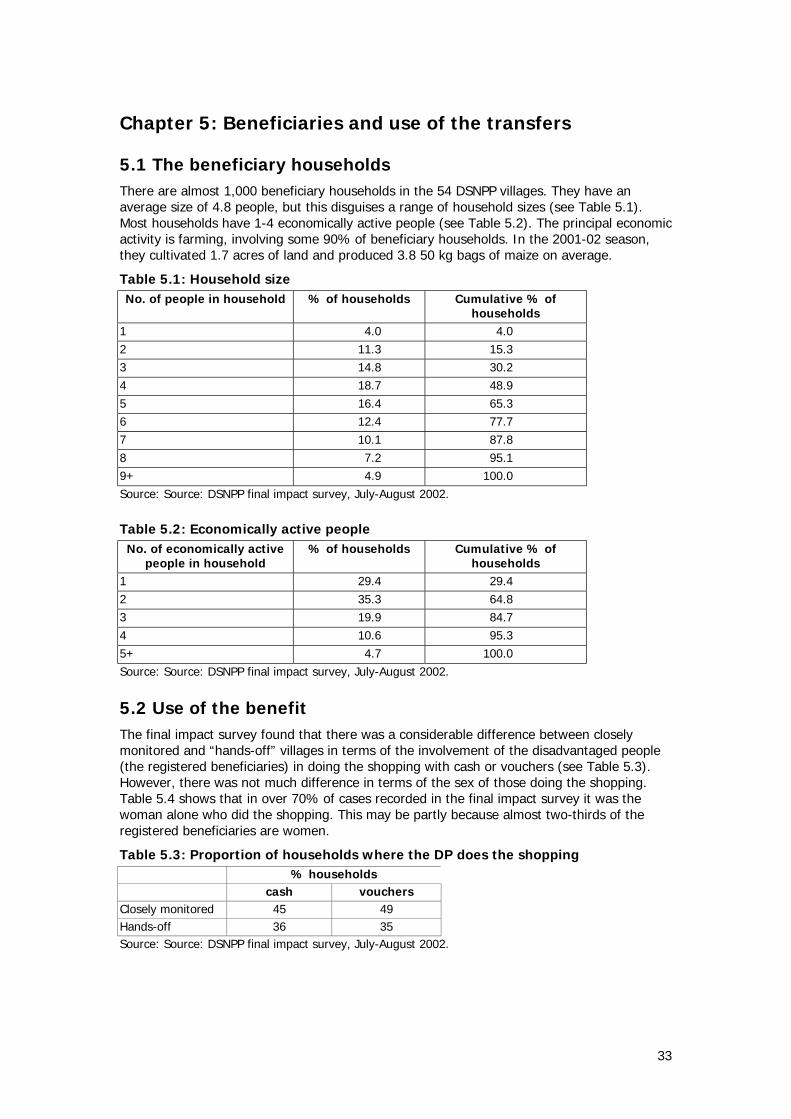
33
Chapter 5: Beneficiaries and use of the transfers
5.1 The beneficiary households There are almost 1,000 beneficiary households in the 54 DSNPP villages. They have an average size of 4.8 people, but this disguises a range of household sizes (see Table 5.1). Most households have 1-4 economically active people (see Table 5.2). The principal economic activity is farming, involving some 90% of beneficiary households. In the 2001-02 season, they cultivated 1.7 acres of land and produced 3.8 50 kg bags of maize on average.
Table 5.1: Household size No. of people in household % of households Cumulative % of
households 1 4.0 4.0 2 11.3 15.3 3 14.8 30.2 4 18.7 48.9 5 16.4 65.3 6 12.4 77.7 7 10.1 87.8 8 7.2 95.1 9+ 4.9 100.0 Source: Source: DSNPP final impact survey, July-August 2002. Table 5.2: Economically active people
No. of economically active people in household
% of households Cumulative % of households
1 29.4 29.4 2 35.3 64.8 3 19.9 84.7 4 10.6 95.3 5+ 4.7 100.0 Source: Source: DSNPP final impact survey, July-August 2002.
5.2 Use of the benefit The final impact survey found that there was a considerable difference between closely monitored and “hands-off” villages in terms of the involvement of the disadvantaged people (the registered beneficiaries) in doing the shopping with cash or vouchers (see Table 5.3). However, there was not much difference in terms of the sex of those doing the shopping. Table 5.4 shows that in over 70% of cases recorded in the final impact survey it was the woman alone who did the shopping. This may be partly because almost two-thirds of the registered beneficiaries are women.
Table 5.3: Proportion of households where the DP does the shopping % households cash vouchers Closely monitored 45 49 Hands-off 36 35 Source: Source: DSNPP final impact survey, July-August 2002.
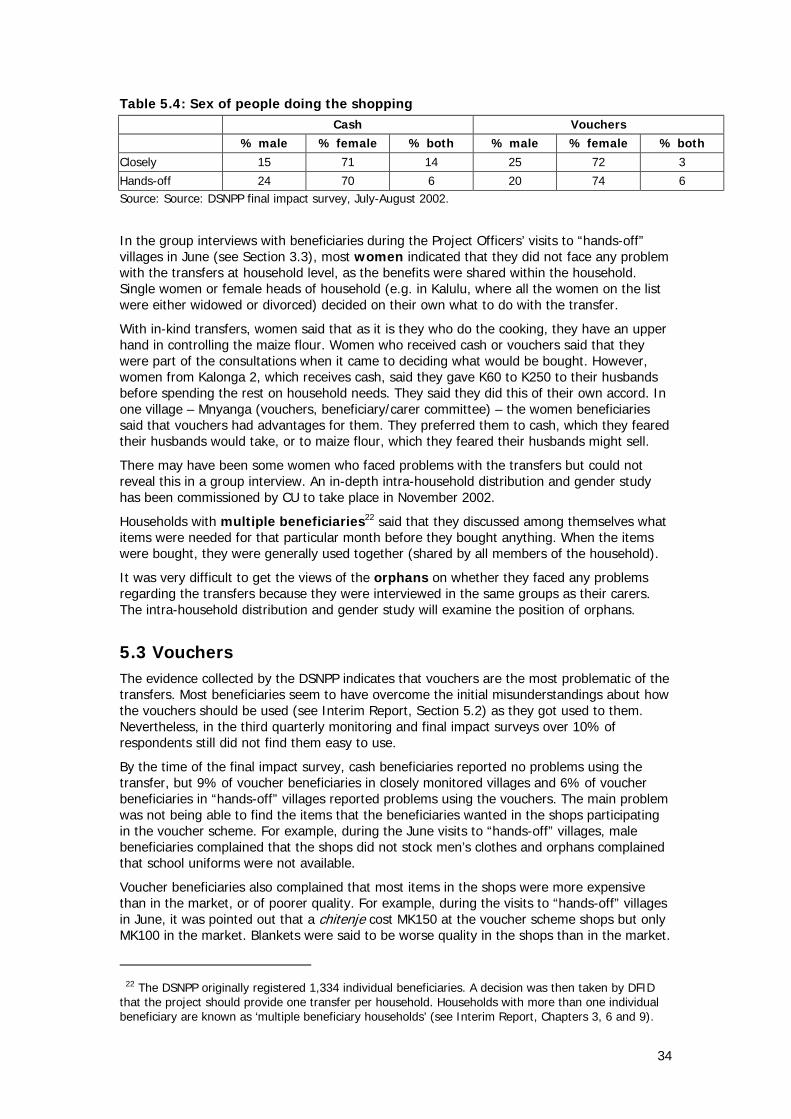
34
Table 5.4: Sex of people doing the shopping Cash Vouchers % male % female % both % male % female % both Closely 15 71 14 25 72 3
Hands-off 24 70 6 20 74 6 Source: Source: DSNPP final impact survey, July-August 2002.
In the group interviews with beneficiaries during the Project Officers’ visits to “hands-off” villages in June (see Section 3.3), most women indicated that they did not face any problem with the transfers at household level, as the benefits were shared within the household. Single women or female heads of household (e.g. in Kalulu, where all the women on the list were either widowed or divorced) decided on their own what to do with the transfer.
With in-kind transfers, women said that as it is they who do the cooking, they have an upper hand in controlling the maize flour. Women who received cash or vouchers said that they were part of the consultations when it came to deciding what would be bought. However, women from Kalonga 2, which receives cash, said they gave K60 to K250 to their husbands before spending the rest on household needs. They said they did this of their own accord. In one village – Mnyanga (vouchers, beneficiary/carer committee) – the women beneficiaries said that vouchers had advantages for them. They preferred them to cash, which they feared their husbands would take, or to maize flour, which they feared their husbands might sell.
There may have been some women who faced problems with the transfers but could not reveal this in a group interview. An in-depth intra-household distribution and gender study has been commissioned by CU to take place in November 2002.
Households with multiple beneficiaries22 said that they discussed among themselves what items were needed for that particular month before they bought anything. When the items were bought, they were generally used together (shared by all members of the household).
It was very difficult to get the views of the orphans on whether they faced any problems regarding the transfers because they were interviewed in the same groups as their carers. The intra-household distribution and gender study will examine the position of orphans.
5.3 Vouchers The evidence collected by the DSNPP indicates that vouchers are the most problematic of the transfers. Most beneficiaries seem to have overcome the initial misunderstandings about how the vouchers should be used (see Interim Report, Section 5.2) as they got used to them. Nevertheless, in the third quarterly monitoring and final impact surveys over 10% of respondents still did not find them easy to use.
By the time of the final impact survey, cash beneficiaries reported no problems using the transfer, but 9% of voucher beneficiaries in closely monitored villages and 6% of voucher beneficiaries in “hands-off” villages reported problems using the vouchers. The main problem was not being able to find the items that the beneficiaries wanted in the shops participating in the voucher scheme. For example, during the June visits to “hands-off” villages, male beneficiaries complained that the shops did not stock men’s clothes and orphans complained that school uniforms were not available.
Voucher beneficiaries also complained that most items in the shops were more expensive than in the market, or of poorer quality. For example, during the visits to “hands-off” villages in June, it was pointed out that a chitenje cost MK150 at the voucher scheme shops but only MK100 in the market. Blankets were said to be worse quality in the shops than in the market.
22 The DSNPP originally registered 1,334 individual beneficiaries. A decision was then taken by DFID
that the project should provide one transfer per household. Households with more than one individual beneficiary are known as ‘multiple beneficiary households’ (see Interim Report, Chapters 3, 6 and 9).

35
For the DSNPP, vouchers did not pose problems in terms of distance travelled to spend them because vouchers were only distributed to villages within walking distance of participating retailers (see Section 2.3). On average, beneficiaries walked about 3 ½ km to spend their vouchers. However, if the vouchers were to be adopted in a scaled-up version of the project, beneficiaries would have to walk longer distances because there are few shops in rural Dedza with capacity to handle the vouchers. If a participating retailer withdrew from the programme for any reason – either temporarily or permanently – beneficiaries would have to walk even farther to spend their vouchers, and other shops might have to deal with unexpected increases in demand. Khama at Thete threatened to withdraw from the scheme in June because CU had cash flow problems and did not settle the voucher payments on time. Another example comes from Chimbiya trading centre, where there were two retailers participating in the voucher scheme: Chimbiya Grocery and Veke. Veke withdrew temporarily in July because the owner was busy organising his wedding. All the beneficiaries at Chimbiya trading Centre flocked to Chimbiya Grocery, causing problems because the shop was too small to handle all the beneficiaries in the area.
5.4 Conclusion Nearly two-thirds of the DSNPP’s registered beneficiaries are women. They do not live in isolation, but are part of households characterised by a range of household sizes and 1-4 economically active people. The main economic activity of beneficiary households is farming.
In the closely monitored villages, a larger proportion of the beneficiaries themselves did the shopping than in the “hands-off” villages. However, the sex of those doing the shopping was similar, with the women doing the shopping in over 70% of cases at the time of the final impact survey.
Women said that they did not face any problems with the transfers at household level. In a general sense this claim is credible, as there is a culture of sharing within the household. However, some may have been unable to talk openly to us. An in-depth intra-household and gender study will be carried out in November 2002. This study should also look more closely at cases of multiple beneficiary household and the position of orphans within households.
Vouchers remain the most problematic of the transfers from the beneficiaries’ point of view, although the position has improved somewhat since the project began because most beneficiaries now understand how to use them. The main problems that continue to be faced by voucher beneficiaries are:
• not being able to find the items they want in the retailers participating in the voucher scheme; and
• having to pay higher prices for goods or accept poorer quality than at market stalls.
In the pilot, most voucher beneficiaries were – by design – located within easy walking distance of retailers participating in the voucher scheme. However, in a scaled-up version of the project which adopted vouchers, this might not be possible because there are few retailers in Dedza with the capacity to handle the vouchers. Moreover, if any retailer withdrew from the scheme, beneficiaries might have to walk farther to spend their vouchers and other retailers might face unexpected increases in demand.

36
Chapter 6: Beneficiary well-being This chapter looks at whether the project had any impact on beneficiary well-being. Originally, when we planned the M&E for the pilot, our assumption was that we would find indications of poverty reduction, increased food security and fewer unmet needs of beneficiaries as a result of the DSNPP intervention. However, the time in which the pilot was carried out (the 2001-02 season) turned out to be one of serious food crisis, accompanied by distress selling of livestock and increased poverty, particularly in the central region of Malawi where Dedza district is located23. Therefore, the intervention could at best have been expected to protect the DSNPP beneficiaries from the worst of the food crisis and reduce the extent to which their households were impoverished during 2001-02.
6.1 Poverty
6.1.1 The beneficiaries’ poverty profile
The Interim Report (Chapter 1) shows that most of the beneficiaries selected for the DSNPP were orphan children, the elderly or chronically sick or disabled people. Others were very poor (often widows or members of female headed households), the mentally ill and carers.
We collected data on the poverty profiles of beneficiary households during the baseline and final impact surveys, carried out in July-August 2001 and 2002. Table 6.1 shows that there was a worsening of the beneficiaries’ poverty profile between the baseline and final impact surveys: at the time of the baseline survey in 2001, 80% of households were in the bottom two poverty categories (1 and 2) of our poverty index, while at the time of the final impact survey in 2002, 91% were in categories 1 and 224.
We interpret this increased impoverishment of the beneficiaries as meaning that the DSNPP intervention was not enough to lift their households out of extreme poverty in the context of the 2001-02 crisis conditions. This may be because this type of intervention alone is not enough or it may imply that the level of benefit was too low.
Table 6.1: Change in poverty profile of beneficiary households Poverty category No. of households % of households
Baseline 1 – poorest 625 65.3 2 138 14.4 3 102 10.7 4 53 5.5 5 – least poor/wealthiest 39 4.1 Total 957 100.0 Final impact 1 – poorest 760 77.9 2 124 12.7 3 71 7.3 4 13 1.3 5 – least poor/wealthiest 8 0.8 Total 976 100.0 Source: DSNPP baseline and final impact surveys, July-August 2001 and 2002. Table 6.1 shows the poverty profiles of all those in the baseline and final impact surveys. However, some households remained within the project throughout (the ‘core group’) while
23 Nyirongo, C.C., Gondwe, H.C.Y, Msiska, F.B.M., Mdyetseni, H.A.J, and F.M.C.E. Kamanga: 2001-02
Targeted Inputs Programme Evaluation Module 1: Food Production and Security in Rural Malawi (Final Report of the pre-harvest survey), July 2002.
24 The income categories in our poverty index have been roughly adjusted to take account of maize price inflation between June 2001 and June 2002 (see Section 2.5 and Section 6.2.2).
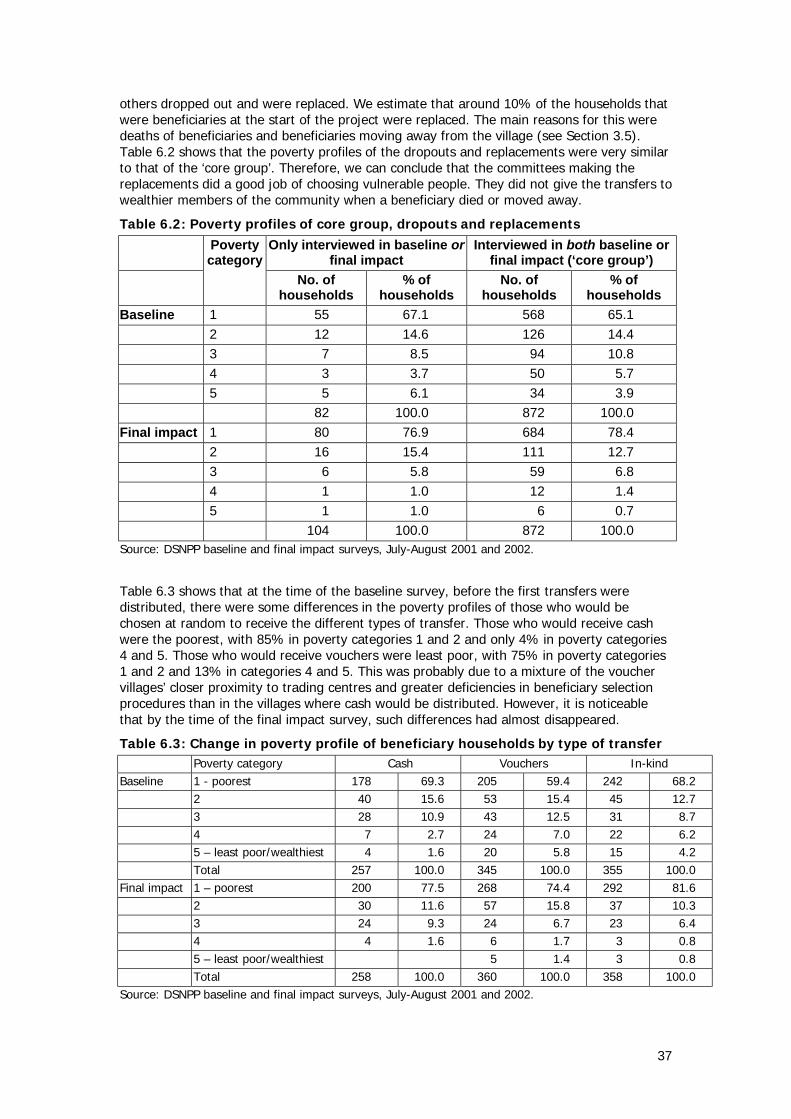
37
others dropped out and were replaced. We estimate that around 10% of the households that were beneficiaries at the start of the project were replaced. The main reasons for this were deaths of beneficiaries and beneficiaries moving away from the village (see Section 3.5). Table 6.2 shows that the poverty profiles of the dropouts and replacements were very similar to that of the ‘core group’. Therefore, we can conclude that the committees making the replacements did a good job of choosing vulnerable people. They did not give the transfers to wealthier members of the community when a beneficiary died or moved away.
Table 6.2: Poverty profiles of core group, dropouts and replacements
Only interviewed in baseline or
final impact Interviewed in both baseline or
final impact (‘core group’)
Poverty category
No. of households
% of households
No. of households
% of households
Baseline 1 55 67.1 568 65.1
2 12 14.6 126 14.4
3 7 8.5 94 10.8
4 3 3.7 50 5.7
5 5 6.1 34 3.9
82 100.0 872 100.0
Final impact 1 80 76.9 684 78.4
2 16 15.4 111 12.7
3 6 5.8 59 6.8
4 1 1.0 12 1.4
5 1 1.0 6 0.7
104 100.0 872 100.0 Source: DSNPP baseline and final impact surveys, July-August 2001 and 2002.
Table 6.3 shows that at the time of the baseline survey, before the first transfers were distributed, there were some differences in the poverty profiles of those who would be chosen at random to receive the different types of transfer. Those who would receive cash were the poorest, with 85% in poverty categories 1 and 2 and only 4% in poverty categories 4 and 5. Those who would receive vouchers were least poor, with 75% in poverty categories 1 and 2 and 13% in categories 4 and 5. This was probably due to a mixture of the voucher villages’ closer proximity to trading centres and greater deficiencies in beneficiary selection procedures than in the villages where cash would be distributed. However, it is noticeable that by the time of the final impact survey, such differences had almost disappeared.
Table 6.3: Change in poverty profile of beneficiary households by type of transfer Poverty category Cash Vouchers In-kind Baseline 1 - poorest 178 69.3 205 59.4 242 68.2 2 40 15.6 53 15.4 45 12.7 3 28 10.9 43 12.5 31 8.7 4 7 2.7 24 7.0 22 6.2 5 – least poor/wealthiest 4 1.6 20 5.8 15 4.2 Total 257 100.0 345 100.0 355 100.0 Final impact 1 – poorest 200 77.5 268 74.4 292 81.6 2 30 11.6 57 15.8 37 10.3 3 24 9.3 24 6.7 23 6.4 4 4 1.6 6 1.7 3 0.8 5 – least poor/wealthiest 5 1.4 3 0.8 Total 258 100.0 360 100.0 358 100.0 Source: DSNPP baseline and final impact surveys, July-August 2001 and 2002.

38
6.1.2 Housing and basic facilities
The baseline and final impact surveys collected data on the living conditions of the beneficiaries and their families. We found that over 85% of families lived in houses with mud walls, grass roofs and mud floors (see Table 6.4). Some 60% of houses had a kitchen, while around 70% had a pit latrine and a bath shelter. There was no significant change between the baseline and final impact surveys. The majority of beneficiaries continue to live in poor housing, with 30% to 40% lacking basic cooking and washing facilities and sanitation.
Table 6.4: Housing Baseline
Walls % Roof % Floor % Mud 90.2 Grass only 85.4 Mud 93.3
Unburnt brick 1.7 Iron sheet 8.8 Cement 4.3
Burnt brick 6.6 Plastic sheeting & grass 4.3 Some rooms cemented/tiled 0.9
Not specified 1.5 Not specified 1.5 Not specified 1.5
Final impact
Walls % Roof % Floor % Mud 93.7 Grass only 87.2 Mud 95.1
Unburnt brick 1.7 Iron sheet 8.6 Cement 4.6
Burnt brick 4.6 Plastic sheeting & grass 4.2 Some rooms cemented/tiled 0.4 Source: DSNPP baseline and final impact surveys, July-August 2001 and 2002.
6.1.3 Economic activities and income
The study found that 88% of beneficiary households in baseline survey and 96% in the final impact survey had at least one source of income. Around 90% of beneficiary households are involved in farming, but for most households this is not their only economic activity. In July-August 2002, beneficiary households reported a wider variety of income sources than a year earlier, with 42% having two or three income sources compared with 32% in July-August 2001 (see Table 6.5). This could be interpreted as a positive development, but it is more likely to be the result of desperation associated with hunger, as vulnerable households intensified their efforts to find sources of income during the 2002 crisis.
Table 6.5: Diversity of income sources
No. of
sources No. of
households % of
households Baseline 0 104 12.5
1 459 55.4
2 211 25.5
3 50 6.0
4 5 0.6
Total 829 100.0
Final 0 32 3.9
1 424 51.1
2 254 30.6
3 95 11.5
4 22 2.7
5 2 0.2
Total 829 100.0 Source: DSNPP baseline and final impact surveys, July-August 2001 and 2002.

39
This possibility seems the more likely given that 64% of households reported receiving less than MK100 in the time period covered by the final impact survey, compared with 51% for the baseline survey25; and only 20% of households reported over MK300 in the final impact survey, compared with 30% in the baseline survey. Their situation was even worse in real terms in view of the high inflation experienced in 2001-02 (see Section 6.2.2).
The most common sources of income for beneficiary households were sale of crops, ganyu wages and small business (see Table 6.6). More households reported doing ganyu and having income from small business in 2002 than the previous year. Artisan work and remittances (money sent home by relatives working away from the village) were also important.
Table 6.6: Sources of household income Baseline Final impact
% of
households % of
households Sale of crops 42.9 44.3
Ganyu wages 45.4 60.9
Small business 13.9 28.2
Artisan 8.1 10.3
Remittances 10.1 10.0
Sale of livestock and livestock products 4.9 3.4
Pension 0.4 1.0
Salary from employment 1.1 0.6
No source of income 12.5 3.9 Source: DSNPP baseline and final impact surveys, July-August 2001 and 2002.
6.1.4 Savings
Few beneficiary households (9%) reported having savings at the time of the baseline survey, whether in the form of a business, cash, a loan, or keeping livestock (see Table 6.7). However, by the time of the final impact survey, 14% reported having savings in the form of livestock, and a total of 18% said they had savings of some sort. Only 5% of the registered beneficiaries had their own savings, and these were mainly in the form of livestock.
Table 6.7: Household savings Baseline Final impact
No. of
households % of
households No. of
households % of
households Business 19 2.4 31 3.8
Cash 11 1.4 16 1.9
Loan 1 0.1 3 0.4
Livestock 34 4.3 118 14.3
Other 5 0.6 4 0.5
No savings 731 91.9 675 82.0 Source: DSNPP baseline and final impact surveys, July-August 2001 and 2002.
6.1.5 Assets
The baseline and final impact surveys were carried out in the post-harvest period, traditionally the time of year when livestock assets are least eroded. Nevertheless, livestock ownership in Malawi is extremely low at any time of year, and the group targeted to receive the DWTs is an extreme case. Only 39% of the beneficiary households interviewed for the baseline survey said that their households owned any chickens and this had fallen to 32% by
25 Income data reflects: the month before the baseline survey, plus sale of crops from the main
harvest (divided by 12), plus income from ganyu in the previous weeding period.
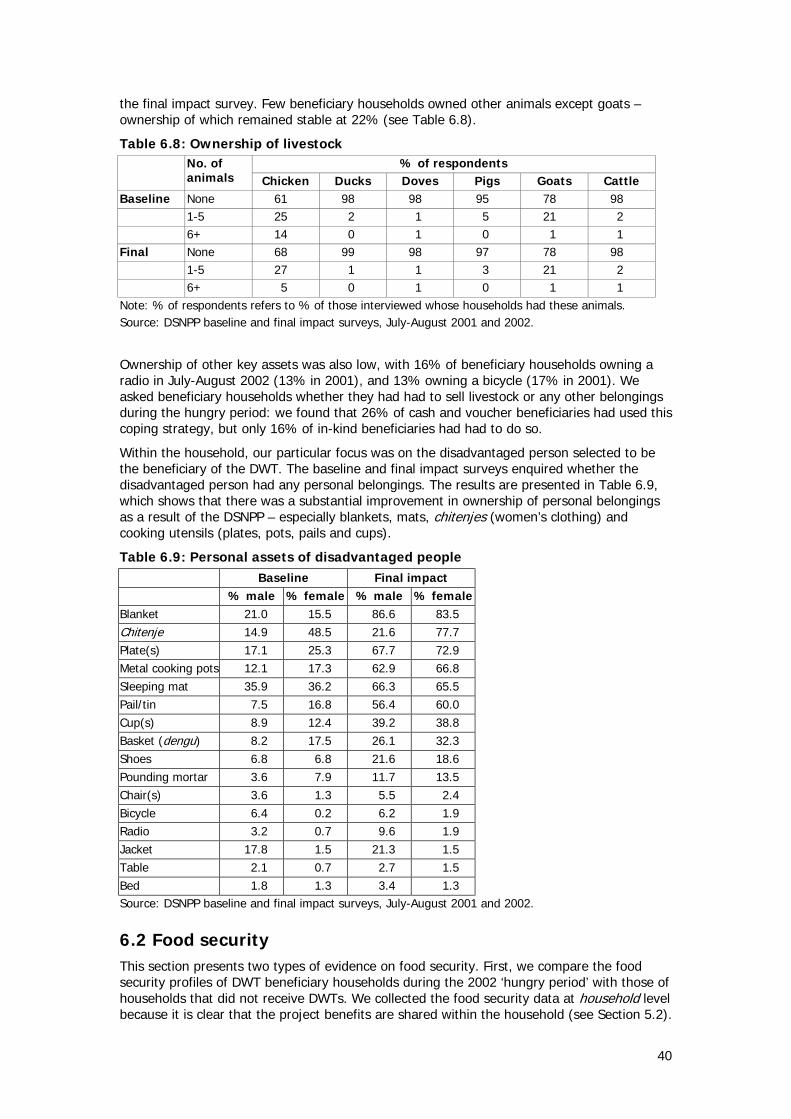
40
the final impact survey. Few beneficiary households owned other animals except goats – ownership of which remained stable at 22% (see Table 6.8).
Table 6.8: Ownership of livestock % of respondents No. of
animals Chicken Ducks Doves Pigs Goats Cattle Baseline None 61 98 98 95 78 98 1-5 25 2 1 5 21 2 6+ 14 0 1 0 1 1 Final None 68 99 98 97 78 98 1-5 27 1 1 3 21 2 6+ 5 0 1 0 1 1 Note: % of respondents refers to % of those interviewed whose households had these animals. Source: DSNPP baseline and final impact surveys, July-August 2001 and 2002.
Ownership of other key assets was also low, with 16% of beneficiary households owning a radio in July-August 2002 (13% in 2001), and 13% owning a bicycle (17% in 2001). We asked beneficiary households whether they had had to sell livestock or any other belongings during the hungry period: we found that 26% of cash and voucher beneficiaries had used this coping strategy, but only 16% of in-kind beneficiaries had had to do so.
Within the household, our particular focus was on the disadvantaged person selected to be the beneficiary of the DWT. The baseline and final impact surveys enquired whether the disadvantaged person had any personal belongings. The results are presented in Table 6.9, which shows that there was a substantial improvement in ownership of personal belongings as a result of the DSNPP – especially blankets, mats, chitenjes (women’s clothing) and cooking utensils (plates, pots, pails and cups).
Table 6.9: Personal assets of disadvantaged people Baseline Final impact % male % female % male % female Blanket 21.0 15.5 86.6 83.5 Chitenje 14.9 48.5 21.6 77.7 Plate(s) 17.1 25.3 67.7 72.9 Metal cooking pots 12.1 17.3 62.9 66.8 Sleeping mat 35.9 36.2 66.3 65.5 Pail/tin 7.5 16.8 56.4 60.0 Cup(s) 8.9 12.4 39.2 38.8 Basket (dengu) 8.2 17.5 26.1 32.3 Shoes 6.8 6.8 21.6 18.6 Pounding mortar 3.6 7.9 11.7 13.5 Chair(s) 3.6 1.3 5.5 2.4 Bicycle 6.4 0.2 6.2 1.9 Radio 3.2 0.7 9.6 1.9 Jacket 17.8 1.5 21.3 1.5 Table 2.1 0.7 2.7 1.5 Bed 1.8 1.3 3.4 1.3 Source: DSNPP baseline and final impact surveys, July-August 2001 and 2002.
6.2 Food security This section presents two types of evidence on food security. First, we compare the food security profiles of DWT beneficiary households during the 2002 ‘hungry period’ with those of households that did not receive DWTs. We collected the food security data at household level because it is clear that the project benefits are shared within the household (see Section 5.2).
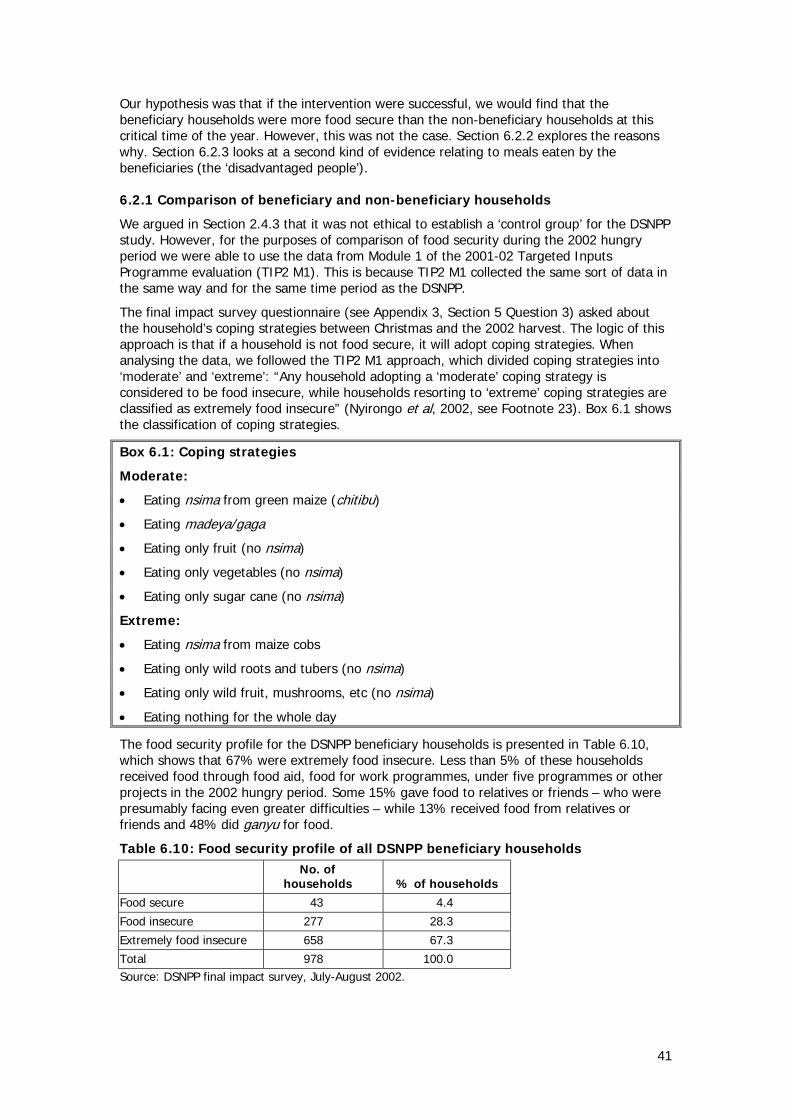
41
Our hypothesis was that if the intervention were successful, we would find that the beneficiary households were more food secure than the non-beneficiary households at this critical time of the year. However, this was not the case. Section 6.2.2 explores the reasons why. Section 6.2.3 looks at a second kind of evidence relating to meals eaten by the beneficiaries (the ‘disadvantaged people’).
6.2.1 Comparison of beneficiary and non-beneficiary households
We argued in Section 2.4.3 that it was not ethical to establish a ‘control group’ for the DSNPP study. However, for the purposes of comparison of food security during the 2002 hungry period we were able to use the data from Module 1 of the 2001-02 Targeted Inputs Programme evaluation (TIP2 M1). This is because TIP2 M1 collected the same sort of data in the same way and for the same time period as the DSNPP.
The final impact survey questionnaire (see Appendix 3, Section 5 Question 3) asked about the household’s coping strategies between Christmas and the 2002 harvest. The logic of this approach is that if a household is not food secure, it will adopt coping strategies. When analysing the data, we followed the TIP2 M1 approach, which divided coping strategies into ‘moderate’ and ‘extreme’: “Any household adopting a ‘moderate’ coping strategy is considered to be food insecure, while households resorting to ‘extreme’ coping strategies are classified as extremely food insecure” (Nyirongo et al, 2002, see Footnote 23). Box 6.1 shows the classification of coping strategies.
Box 6.1: Coping strategies
Moderate:
• Eating nsima from green maize (chitibu)
• Eating madeya/gaga
• Eating only fruit (no nsima)
• Eating only vegetables (no nsima)
• Eating only sugar cane (no nsima)
Extreme:
• Eating nsima from maize cobs
• Eating only wild roots and tubers (no nsima)
• Eating only wild fruit, mushrooms, etc (no nsima)
• Eating nothing for the whole day
The food security profile for the DSNPP beneficiary households is presented in Table 6.10, which shows that 67% were extremely food insecure. Less than 5% of these households received food through food aid, food for work programmes, under five programmes or other projects in the 2002 hungry period. Some 15% gave food to relatives or friends – who were presumably facing even greater difficulties – while 13% received food from relatives or friends and 48% did ganyu for food.
Table 6.10: Food security profile of all DSNPP beneficiary households
No. of
households % of households Food secure 43 4.4
Food insecure 277 28.3
Extremely food insecure 658 67.3
Total 978 100.0 Source: DSNPP final impact survey, July-August 2002.

42
Table 6.11 shows the food security profile for DSNPP beneficiary households in poverty categories 1 and 2. By isolating the households in these two poverty categories, we can make a comparison with the equivalent type of household in the central region in the TIP2 M1 database26. These households did not receive DWTs27. Their food security profile is shown in Table 6.12.
Table 6.11: Food security profile of poorest DSNPP beneficiary households*
No. of
households % of households Food secure 36 4.1
Food insecure 242 27.4
Extremely food insecure 606 68.6
Total 884 100.0 *Households in poverty categories 1 and 2 only. Source: DSNPP final impact survey, July-August 2002.
Table 6.12: Food security profile of non-beneficiaries*
No. of
households % of households Food secure 13 2.9
Food insecure 124 27.6
Extremely food insecure 313 69.6
Total 450 100.0 *Households in poverty categories 1 and 2 only, central region. Source: 2001-02 TIP evaluation Module 1 database.
The food security profiles of DSNPP beneficiary and non-beneficiary households are identical. Nearly 70% of both groups were extremely food insecure in the 2002 hungry period. This is disappointing, as we would have hoped to see an improvement in the food security status of households that received DWTs.
6.2.2 Why the DSNPP did not increase household food security
There are two factors which help to explain the fact that 67% of DSNPP beneficiary households suffered extreme food insecurity in the 2002 hungry period:
1. The DSNPP missed a distribution at the height of the hungry period, owing to a cash flow problem in Concern Universal. As a result, there were six weeks between the fourth, fifth and sixth distributions, instead of one month.
2. The real value of the transfers was severely eroded by the increase in maize prices during the 2001-02 season. When the figure of MK550 per month was agreed in May 2001, it purchased 70 kg of maize, compared with only 16 kg in the February 2002 at the height of the hungry period (see Figure 6.1). This meant that the transfers were not enough to feed beneficiary households for a whole month. In the final impact survey, 37% of households reported that the transfer lasted them one week or less, while 40% said it lasted 1-2 weeks; only 23% of households said that the transfer lasted for more than two weeks.
26 The comparison cannot be done for DSNPP beneficiaries as a whole vs. all households in the TIP2
M1 database, as the poverty profiles of the former are different to the latter. 27 The villages visited by the TIP2 M1 survey were not part of the DSNPP, so the households
interviewed were not DSNPP beneficiary households. Half of the households in the TIP2 M1 database are TIP beneficiaries while half are non-beneficiaries; however, in the central region, receipt of TIP made no difference at all to households’ food security profiles.

43
Figure 6.1: Price of maize at Chimbiya trading centre
0.00
5.00
10.00
15.00
20.00
25.00
30.00
35.00
40.00
Jan-01
Feb-01
Mar-01
Apr-01
May-01
Jun-01
Jul-01 Aug-01
Sep-01
Oct-01
Nov-01
Dec-01
Jan-02
Feb-02
Mar-02
Apr-02
May-02
Jun-02
Jul-02 Aug-02
Month
MK
Note: Data for April 2002 was missing; we have extrapolated it from the previous and following months’ data for the purposes of this graph. Source: FEWS (from Ministry of Agriculture data).
6.2.3 Did the DSNPP help to reduce hunger?
Although the receipt of DWTs did not improve the food security status of households in the 2002 hungry period, the evidence presented in this section shows clearly that receipt of the transfers did help to reduce hunger among DWT beneficiaries while the benefit lasted. The quarterly monitoring surveys and the final impact survey were timed to be carried out shortly after the distribution of the transfers. They show the impact of the transfers before they ran out (indicating their potential benefit if set at a level that would be sufficient to last from one distribution to the next).
The data presented in this section is based on the following questions in our surveys:
1. How many times did the disadvantaged person eat nsima yesterday?
2. Other than nsima, how many time did the disadvantaged person eat yesterday?
(E.g. Breakfast, substantial snacks, dinner, etc. without nsima)
3. In the last week, how many times in total did the disadvantaged person eat nsima with meat, chicken or fish?
4. In the last week, how many times in total did the disadvantaged person eat nsima with beans?
5. In the last week, how many times in total did the disadvantaged person eat nothing but vegetables or leaves?
6. In the last week, how many times in total did the disadvantaged person eat nothing but wild fruits (masuku) or mushrooms?

44
First, we examine the difference between responses to Questions 1, 2, 3 and 5 at the time of the baseline and final impact surveys. If the intervention was successful, we would expect to find that beneficiaries ate more meals – with and without nsima – and that these included more proteins such as meat, chicken or fish at the end of the project than before it started. We would expect to find that they resorted less to eating nothing but vegetables or leaves.
We did Analysis of Variance tests28 on data collected by the baseline and final impact surveys for the average number of times that the disadvantaged person ate nsima yesterday; meals other than nsima yesterday; meat/chicken/fish in the last week; and nothing but vegetables or leaves in the last week. We found that there was a statistically significant increase in eating meals, including protein, and a statistically significant decrease in eating nothing but vegetables and leaves. This suggests that the impact of the project was positive. The averages are shown in Table 6.13.
Table 6.13: Improvement in meals eaten by DP over period of project Average no. of times Baseline Final impact Ate nsima yesterday 1.37 1.54
Ate other meals/snacks yesterday 0.36 0.47
Ate chicken/meat/fish last week 0.40 0.72
Ate nothing but vegetables or leaves last week 0.40 0.17 Source: DSNPP baseline and final impact surveys, July-August 2001 and 2002.
We also looked at whether the type of transfer that beneficiaries received, the type of committee that managed their benefit and the type of monitoring to which they were subject during the pilot or the interactions between these factors had an impact on the effectiveness of the intervention in reducing beneficiaries’ hunger. The findings of our Analysis of Variance tests are summarised in Table 6.14. The test on eating nothing but vegetables and leaves was inconclusive, as numbers of beneficiaries resorting to this coping strategy are too low in July-August (the time of the baseline and final impact surveys) to detect the significance of such factors. Therefore, the results are not included in Table 6.14.
Table 6.14: Significant factors and interactions for meals eaten by DP Factors Type of committee
Type of monitoring Ate nsima yesterday
Interactions Type of committee and of monitoring
Factors Type of transfer Ate other meals and snacks yesterday Interactions Type of transfer and of committee
Type of transfer and of monitoring
Factors Type of transfer Type of committee Type of monitoring
Ate chicken/meat/fish last week
Interactions None Source: DSNPP baseline and final impact surveys, July-August 2001 and 2002.
It is interesting that the type of transfer was not a significant factor for how many times the beneficiaries ate nsima yesterday – despite the fact that the in-kind beneficiaries were no longer receiving the transfer by the time of the final impact survey. This suggests that in July-August (soon after the main maize harvest), maize flour for nsima was relatively accessible and non-receipt of the benefit did not make much difference. However, it did make a difference to the rest of the beneficiaries’ diet, with cash transfers having the strongest
28 See Section 2.2. These tests use only data from the ‘core group’ of beneficiaries only (i.e. those who remained in the project from the baseline to the final impact survey).

45
impact on increasing consumption of chicken/meat/fish. In terms of type of committee, the beneficiary/carer committees did most to increase consumption of these proteins, while in terms of type of monitoring, close monitoring had a greater positive impact than the “hands-off” approach.
The graphs in Appendix 4a shed more light on the factors and interactions shown in Table 6.14 with regard to eating nsima, other meals and snacks and chicken/meat/fish. We interpret these graphs as showing that:
1. Close monitoring gives significantly better results than the “hands-off” approach, indicating that in order to maximise the project’s impact, the scaled-up version of the DSNPP should include a system of unannounced spot checks to make communities feel that they are being closely supervised.
2. The graphs do not tell us anything about in-kind transfers, as these were no longer being distributed at the time of the final impact survey. If the choice were between cash and vouchers, cash would be the recommended option (because of its strong impact on consumption of other meals/snacks and protein).
3. If cash were chosen, beneficiary/carer committees (with supervision) would be the best type of management structure. If vouchers were chosen, democratic committees would be an option, but they would also require close supervision as they gave a poor result for eating nsima under “hands-off” conditions.
We ran an Analysis of Variance test on the data from the question “During the period after last Christmas and before the last harvest, when you received the transfers how many weeks did they last?” We found that type of transfer and type of monitoring were significant factors affecting the length of time that the transfer lasted:
• On average, the transfers lasted 2.2 weeks for cash beneficiaries, 1.8 weeks for in-kind beneficiaries and 1.7 weeks for voucher beneficiaries.
• The transfers lasted on average 2.1 weeks for closely monitored beneficiaries compared with 1.8 weeks for “hands-off” beneficiaries.
6.2.4 Seasonal variations and type of transfer
It should be noted that the time of year at which we conducted the baseline and final impact surveys had a bearing on the results. In order to check whether our conclusions about type of transfer held in the context of seasonal variations, we looked at the data on eating meals from the villages that were monitored every three months29.
Figure 1 in Appendix 4b shows the seasonal variations for cash and voucher beneficiaries, with beneficiaries eating more nsima on average in the post-harvest period – when the baseline, Q3 and final impact surveys were carried out – and less in the hungry period (which had begun by the time of the Q1 survey in November and was at its peak when the Q2 survey was carried out in February). The in-kind beneficiaries suffered a decline towards the end of the project – as expected because they were no longer receiving the transfers – but interestingly their consumption of nsima peaked in Q2 (February), when it was higher than consumption of nsima by cash or voucher beneficiaries. It fell in Q3 (April), probably because of the poor quality of the flour distributed before the Q3 survey.
Similar seasonal variations can be observed in Figures 2-3 in Appendix 4b for consumption of proteins and non-nsima meals. These graphs also suggest that cash beneficiaries did best in terms of proteins and other meals/snacks, followed by voucher beneficiaries. In-kind beneficiaries did worst, as might be expected given that their transfers did not allow them to acquire food other than nsima. Their consumption patterns give an indication of what would
29 The three quarterly surveys were carried out in November, February and April (see Section 2.4).

46
be the expected consumption pattern for proteins and other meals/snacks in the absence of any DWT intervention.
Figure 4 in Appendix 4b shows the pattern of consumption for beans, which is highly seasonal, and again suggests that cash and voucher beneficiaries did better than in-kind transfer beneficiaries. Figure 5 shows the extent to which beneficiaries had to resort to eating only vegetables and leaves. This happened mainly at the peak of the hungry period prior to the Q2 (February) survey, and voucher and in-kind transfer beneficiaries reported greater suffering than cash beneficiaries30.
In conclusion, the data presented in this section suggest that if the aim of the DWT intervention is to ensure that beneficiaries have enough nsima, in particular during the hungry period, in-kind transfers (maize/maize flour) are the best choice – but only if the quality of the product distributed is strictly controlled for quality. However, if the aim is to ensure that beneficiaries have other foods (a more balanced diet), cash or vouchers are preferable to in-kind transfers, and cash is more effective than vouchers. In Section 6.4, we discuss the possibility of a transfer combining the advantages of both types of transfer by including maize/maize flour and cash elements.
6.3 Unmet needs The baseline, final impact and quarterly monitoring surveys included a section on ‘unmet needs’, in which we asked the question “Does the disadvantaged person have any unmet needs at the moment? Ask them to say what. (Unmet needs are those things which the person needs but cannot afford to buy)”. If the project impact was positive, we hoped to find a significant reduction in unmet needs.
6.3.1 Before and after the project
First, we looked at the change in the percentage of disadvantaged people with unmet needs at the time of the baseline and final impact surveys. Table 6.15 shows that there was a reduction in the percentage of disadvantaged people with unmet needs for all key ‘basic needs’ items except shoes, which were mentioned by less than 20% of respondents in both the baseline and final impact surveys. This indicates a generally positive impact on unmet needs of beneficiaries.
Table 6.15: Reduction in unmet needs over period of project % of DPs with unmet need Baseline Final impact Food 0.86 0.69
Soap 0.32 0.14
Blanket 0.88 0.24
Clothing 0.86 0.58
Shoes 0.19 0.17
Metal pots 0.33 0.16 Source: DSNPP baseline and final impact surveys, July-August 2001 and 2002.
We also used Analysis of Variance tests on the ‘core group’ of beneficiaries to look at whether the type of transfer that beneficiaries received, the type of committee that managed the benefit and the type of monitoring to which they were subject or the interactions between these factors had an impact in terms of reducing the need for food, soap, blankets, clothing and metal pots. The findings of our tests are summarised in Table 6.16.
30 This was despite the fact that those who were to receive cash were the poorest group among the
potential beneficiaries at the time of the baseline survey (see Section 6.1.1).

47
The unmet need for food fell between the baseline and final impact surveys, but type of transfer, type of monitoring and type of management committee were not significant factors in meeting unmet need for food: the extent of the reduction was similar irrespective of the type of transfer, monitoring or committee.
Type of transfer was, however, an important factor in reducing unmet needs for soap, blankets, clothing and metal pots over the period of the project. Type of monitoring was also important for blankets, but type of committee was not an important factor (it did not affect the extent of the project’s ability to meet basic needs of beneficiaries).
Table 6.16: Significant factors for unmet needs Food None
Soap Type of transfer
Blankets Type of transfer Type of monitoring
Clothing Type of transfer
Metal pots Type of transfer Source: DSNPP baseline and final impact surveys, July-August 2001 and 2002.
The graphs in Appendix 5a shed more light on the factors shown in Table 6.16. We interpret these graphs as showing that:
1. Close monitoring was more effective in reducing unmet needs than the “hands-off” approach (examples are food and blankets). This result is similar to that of Section 6.2.3, indicating that the scaled-up version of the DSNPP should include a system designed to make communities feel that they are being closely supervised.
2. All types of transfer were effective in reducing the unmet needs for food. Cash was the most effective with regard to soap, although vouchers and in-kind transfers also had a moderate impact. Cash was also most effective for clothing, followed by vouchers; in-kind transfers did not do much to meet clothing needs.
3. In-kind transfers were the most effective in reducing the unmet needs for blankets and metal cooking pots, as might be expected given that the package of goods distributed to in-kind beneficiaries included 2 blankets and 1 metal cooking pot. However, cash and vouchers were also very effective in meeting the need for blankets and moderately effective in meeting the need for metal pots.
We conclude that if the aim of the DWT intervention is to ensure that beneficiaries meet basic food needs (nsima), any type of transfer (cash, vouchers or maize/maize flour) will achieve this. However, if the aim is to ensure that beneficiaries can also meet other basic needs, it would be recommendable either to distribute these items as part of an in-kind transfer or to provide a cash element. Cash is particularly effective for meeting clothing needs, which are impractical to deal with by direct provision31. We also conclude that the type of committee managing the transfers is not significant in terms of the project’s ability to meet basic needs, but that close monitoring (or a system of supervision) is important to ensure full impact.
6.3.2 Over the period of the project
The graphs in Appendix 5b show the variations in percentages of beneficiaries with unmet needs for key items over the period of the project. Seasonal variations are in evidence, but it is also possible to distinguish differences between types of transfer.
Unmet need for food was high at the time of the baseline and Q1 (November) surveys, but fell for goods and voucher beneficiaries in Q2 (February), while over 80% cash beneficiaries (the poorest at the start of the project – see Section 6.1.1) still saw food as an unmet need in
31 This would require collecting information about type of clothing, sizes etc from all beneficiaries.

48
Q2. However, by Q3 (April) less than 30% of cash and voucher beneficiaries recorded food as an unmet need, while almost 50% of in-kind beneficiaries saw food as an unmet need.
Few in-kind beneficiaries saw soap as an unmet need in Q1, after they had received the goods pack containing soap, but thereafter cash and voucher beneficiaries were in a better position than in-kind beneficiaries. In the case of blankets and metal pots, however, the one-off contribution of the goods package for in-kind beneficiaries was a lasting contribution to meeting unmet needs for these items, while cash and voucher beneficiaries saw a more gradual improvement. Cash and voucher beneficiaries also saw a gradual reduction in unmet needs for clothing, but in-kind beneficiaries – who received no clothing – saw little change.
6.4 Conclusion The poverty profile of the DSNPP beneficiary households was worse at the end of the project than at the beginning: 78% of beneficiary households were in the poorest category at the end of the project, compared with 65% at the beginning. At the time of the baseline survey, the households of beneficiaries who were to receive cash were the poorest, while those who were to receive vouchers were the least poor. By the time of the final impact survey, there was little difference between poverty profiles by type of transfer. Nearly two-thirds of households reported receiving less than MK100 in the time period covered by the final impact survey, and ownership of the main livestock asset – chicken – had been eroded.
Two-thirds of DSNPP beneficiary households were extremely food insecure in the 2001-02 hungry period, despite receiving the transfers. They were no less food insecure than non-beneficiaries in the Central Region. The increase in poverty and continuing food insecurity of the beneficiary households during the period of the project is owing to several factors:
• The severity of the 2002 hunger crisis;
• The level of the benefit (which, at MK550/month was enough to last most households only for 1-2 weeks); and
• Gaps of up to six weeks between transfers in between December and March 2002.
Although there is clear evidence that the DSNPP reduced hunger and helped to meet the basic needs of beneficiaries, the level of the benefit was too low in the context of the 2001-02 hunger crisis. We recommend that it should be increased to MK1,400 in the 2002-03 hungry period (roughly in line with inflation) and should thereafter reflect changes in the cost of living of the beneficiaries (food and other basic needs items).
The impact of the transfers on beneficiary well-being varied according to type of transfer, type of monitoring and type of village committee. Close monitoring gave better results than the “hands-off” approach. Although close monitoring is not an option for the scaled-up version of the DSNPP owing to the high costs involved, we recommend a supervision system of unannounced spot checks on whether the benefits have been received by the beneficiaries. CU should investigate any reported abuses and take immediate action to resolve them. The findings should be given high visibility through verbal bulletins at distribution centres when the transfers are being delivered.
All transfers were equally effective in meeting basic food needs (nsima), although in-kind transfers (maize flour) were the most effective at the height of the 2001-02 hungry period, and fewer in-kind households than cash or voucher households resorted to selling livestock assets. Cash transfers had a greater impact than maize flour on increasing consumption of other food and animal protein and were also an effective way of reducing unmet needs for basic needs items. The impact of vouchers was similar to that of cash, but weaker.
As a result of these findings, we recommend that for the extension phase of the DSNPP, when transfers will be delivered from November 2002 to April 2003, a combination of maize flour (30-40 kg) and cash be provided. A beneficiary preference study should be carried out in March-April 2003 to elicit the views of beneficiaries on whether they are satisfied with this approach or would like to see modifications. In particular, beneficiaries should be asked whether they want seasonal variations in the amount and composition of the transfer.

49
Chapter 7: Consumer demand and retailers In the first two sections of this chapter, we explore the pattern of expenditure of the beneficiary households associated with DWTs. In the third section, we consider the impact on the local economy of an injection of resources via cash or vouchers and of the procurement of goods and maize flour for in-kind transfers. In particular, we show how different types of transfer have had an impact on different types of retailer. Finally, in the fourth section, we consider the implications of the evidence about consumer demand and retailers for the expansion of the project.
7.1 Beneficiary household expenditure patterns As part of the M&E of the DSNPP, we studied the pattern of expenditure on goods and services of beneficiary households over the period of the project. Information was collected about the same goods and services in the baseline, quarterly and final impact surveys, in the section of the questionnaires entitled “consumption”.
Respondents were asked whether their household had purchased the following items in the last two weeks32: beans, groundnuts, beer/alcohol, chicken/meat, fish, milling, pulses, rice, bread, salt, soap, maize, sugar, tea, vegetables, blankets, clothing, shoes, cooking oil, matches, school fees, school uniform, pens, exercise books etc, health treatment, medicines, livestock, seed, fertilizer, farm implements/tools, paraffin, thatch, travel/transport, festivities, funerals, giving to church/mosque, bicycle, radio, kitchen utensils, furniture and iron sheets. The purchases were not limited to purchases with DWT transfers.
Appendix 6 shows the findings for most of these the goods and services. We do not present the results for those goods and services which no household reported purchasing (school fees, radios, furniture and iron sheets) or which only a very few bought (pulses, school uniform, health treatment, livestock, farm implements/tools, thatch, travel/transport, festivities and bicycle). We should also point out that the list did not include some items which – in view of the evidence from the voucher receipts (see Section 7.2.2) – are popular and should have been included (e.g. maize flour, vaseline).
It is interesting to note the differences in expenditure patterns between cash and voucher beneficiary households. In the training, it was made clear to the village committees that beneficiaries could make “any usage that may seem good or profitable to the beneficiary although members of the Committee disapprove of this usage”. However, the voucher beneficiaries did not have complete freedom in the use of the transfers (see Section 7.2.1).
The findings also show a number of seasonal effects, as well as the effect of the initially better position of the voucher recipients in terms of poverty (see Section 6.1.1).
The graphs in Appendix 6 have different scales because some items are purchased more than others. The main goods and services bought were: maize, maize milling, soap, sugar, salt, vegetables, fish, matches, paraffin, funerals and giving to a church or mosque. At the other end of the scale, less than 20% of beneficiaries bought chicken or meat even in times of plenty33.
The pattern of expenditure for the main goods and services shows that:
• Over 70% of cash beneficiary households recorded maize purchases in Q2 (February). Fewer in-kind households bought maize. Voucher beneficiaries increased their expenditure on maize in Q1 (November) but it then fell as maize became unavailable in
32 The two-week period was selected because it was felt that respondents would be able to recall what
they had bought in the past two weeks, while a longer recall period might pose problems for them. 33 Some may have eaten chicken/meat produced on-farm, but it should be noted that by no means all
beneficiaries have chicken or goats (Section 6.1.5).

50
participating retailers’ stores, and they bought maize flour instead (see Section 7.2.2). Meanwhile, over half of cash beneficiary households spent money on maize milling, but in-kind and voucher beneficiary households’ demand for maize milling dropped in the hungry period when they were receiving or purchasing maize flour and only rose again in the post-harvest period, when they presumably had their own maize to mill.
• Cash beneficiary households steadily increased demand for soap, while the demand of in-kind beneficiary households fell temporarily after they received soap in the goods packages at the start of the project. Voucher beneficiary households started the project with a higher level of purchasing capacity for soap, and their demand increased strongly during the hungry period. A similar pattern is observable for sugar, although in-kind beneficiary households’ demand for this item did not fall at the start of the project as they received no sugar from the DSNPP.
• The pattern of expenditure on salt is largely seasonal, with demand highest in the post-harvest period and at the peak of the hungry period (when it is used in or as relish for nsima). Expenditure on vegetables for relish also shows a highly seasonal pattern, with virtually no expenditure at the peak of the hungry period. There are few differences reflecting type of transfer. On the other hand, while in-kind beneficiary households were clearly only able to afford fish, chicken and meat at times of plenty, some cash beneficiary households – and to a lesser extent voucher beneficiary households – bought these proteins even in the hungry period; this seems to be a result of receipt of the DWT.
• The pattern of expenditure on paraffin and matches is seasonal (the in-kind beneficiary households show a sharp drop in numbers buying these items in February). However, cash and voucher beneficiary households were able to continue buying these items during the hungry period (again almost certainly a reflection of project impact).
• Expenditure on funerals and giving to the church or mosque is also highly seasonal, with contributions falling off in the hungry period. Nevertheless, a small number of cash and voucher beneficiary households were able to spend money on funerals in February 2002, while some voucher beneficiary households continued giving to church or mosque.
7.2 Analysis of voucher receipts This section presents the information collected from the retailers participating in the voucher scheme about what items were purchased by the DSNPP beneficiaries. This information comes from the voucher receipts. Participating retailers were required to give a receipt for every item purchased with a voucher. They were provided with receipt books that were designed especially for the pilot study (see Figure 7.1). In order to claim payments (the value of the vouchers received from beneficiaries plus a commission), they had to present the receipt books to CU together with the vouchers that they had collected. Payment was only made if the amounts recorded in the receipts matched the value of the vouchers that the retailers returned to CU34.
The information from the voucher receipts was entered into a database by CU. We have analysed the data for the first ten distributions (September 2001 to August 2002). Two receipt books were lost by CU during the initial stages of the project (one from Alinafe and one from Chimbiya), and one of the retailers (Chimbiya) recorded some of the information from the ninth distribution (28 June) incorrectly, making it impossible to include the data in our database. This information is missing from our analysis. However, our assessment is that while total amounts spent are slightly lower than they should be, the missing data does not distort the pattern of expenditure.
34 This system was designed for the pilot phase of the project, as part of the intensive M&E of the
pilot. It was not envisaged that receipts would continue to be required if the vouchers were recommended for the scaled-up version of the project. However, CU believes that it would be much more difficult to detect abuses by retailers if receipts were not collected in any future voucher scheme.

51
Figure 7.1: Receipt book for voucher sales
7.2.1 How the vouchers were spent
Voucher beneficiaries were issued with MK550 per month in the form of voucher booklets (see Section 4.1.2). The idea was that the vouchers would be used in a similar manner to cash, and it was explained to the beneficiaries that they could buy whatever they wanted with them. However, the information presented in this section shows that the vouchers did not in fact allow complete freedom of choice about what to buy. Choice was restricted – often severely – by what retailers had in stock. Some of the retailers also influenced how the vouchers were spent by methods ranging from telling beneficiaries what to buy to stocking only a restricted range of items at the time of the DSNPP distributions.
Figure 7.2 shows that there were differences between retailers. Muderanji (which was dropped after December), Alinafe and Khama (with some exceptions) tended to make the beneficiaries spend their vouchers all at once, or encourage them to do so. Muderanji initially gave the beneficiaries no choice, but simply prepared packages of assorted items for them worth MK550 (see Appendix 9: Chisambo village report). Alinafe did not tell the beneficiaries explicitly to spend all their vouchers at once, but stocked a range of items immediately after CU distributed the vouchers and then reduced stocks to low levels with a narrow choice of items. This compelled the beneficiaries to spend all their vouchers at once.
On the other hand, Veke and Chimbiya allowed greater flexibility: the amounts spent per transaction vary from the smallest voucher denominations to the total MK550. Veke and Chimbiya are both located at Chimbiya trading centre, had larger numbers of voucher customers and were competing with each other for them. This suggests that such schemes benefit from competition between retailers. However, there are few trading centres in the Dedza area where more than one retailer meeting the minimum requirements of the voucher scheme (particularly accounting capacity) can be found. Many potential DWT beneficiaries in Dedza district do not live within reach of such trading centres.

52
Figure 7.2: Amounts spent per transaction (all 10 distributions)
Alinafe Muderanji Chimbiya
Veke Khama0
250
500
750
No.
of t
rans
actio
ns
100 200 300 400 500
Amount (MK)
0
250
500
750
No.
of t
rans
actio
ns
100 200 300 400 500
Amount (MK)
The ‘box plot’ graphs in Figures 7.3-7.7 show similar information to that in Figure 7.2. However, the information is shown separately for each distribution (identified by a number and a date – for instance, the first distribution was on 25 September 2001). Where the box plot is bunched together into a heavy line at the MK550 level, this shows that all the vouchers in the booklet were spent at once. Where they are spread from the smaller denominations to MK550, they were spent in different transactions.
Figure 7.3: Amounts spent per transaction by distribution (Muderanji)
133123124N =
Distribution (no. and date)
4: 19 Dec3: 03 Dec2: 02 Nov1: 25 Sep
Rec
eipt
val
ue (
MK
)
551
550
549
548
547
546
545
544
543
11491079
1000
1001
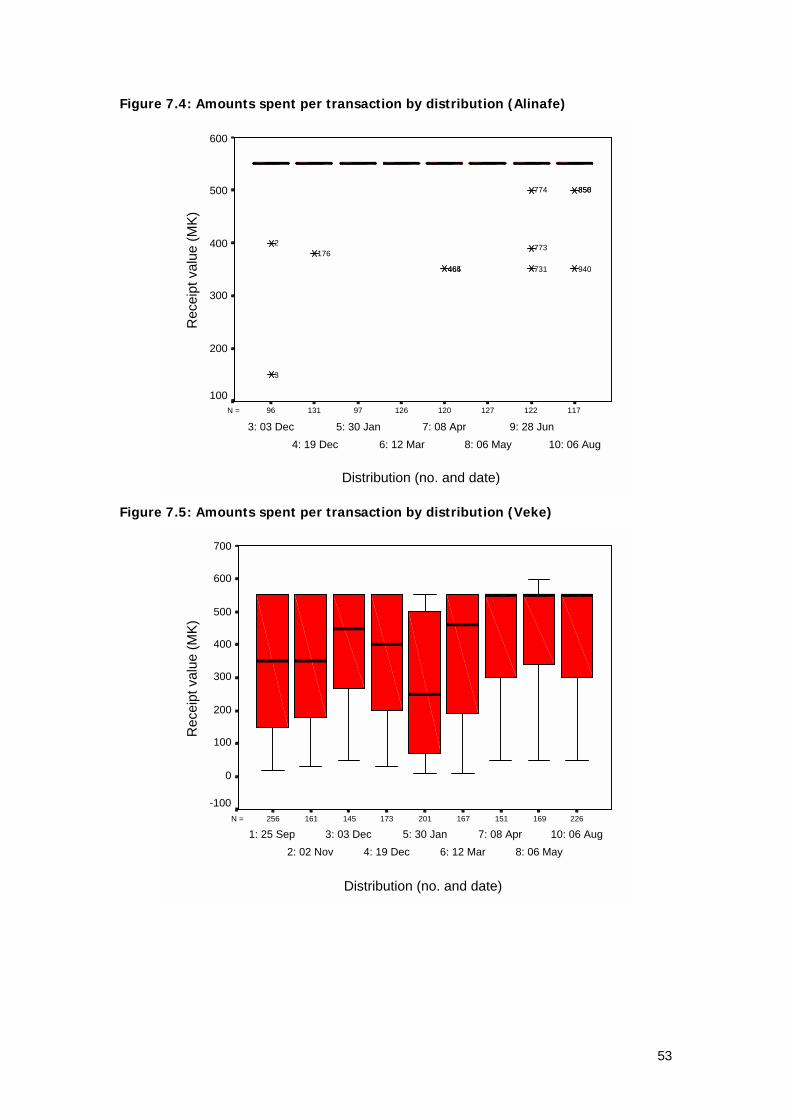
53
Figure 7.4: Amounts spent per transaction by distribution (Alinafe)
1171221271201269713196N =
Distribution (no. and date)
10: 06 Aug
9: 28 Jun
8: 06 May
7: 08 Apr
6: 12 Mar
5: 30 Jan
4: 19 Dec
3: 03 Dec
Rec
eipt
val
ue (
MK
)
600
500
400
300
200
100
858850
940
774
773
731465464
1762
3
Figure 7.5: Amounts spent per transaction by distribution (Veke)
226169151167201173145161256N =
Distribution (no. and date)
10: 06 Aug
8: 06 May
7: 08 Apr
6: 12 Mar
5: 30 Jan
4: 19 Dec
3: 03 Dec
2: 02 Nov
1: 25 Sep
Rec
eipt
val
ue (
MK
)
700
600
500
400
300
200
100
0
-100
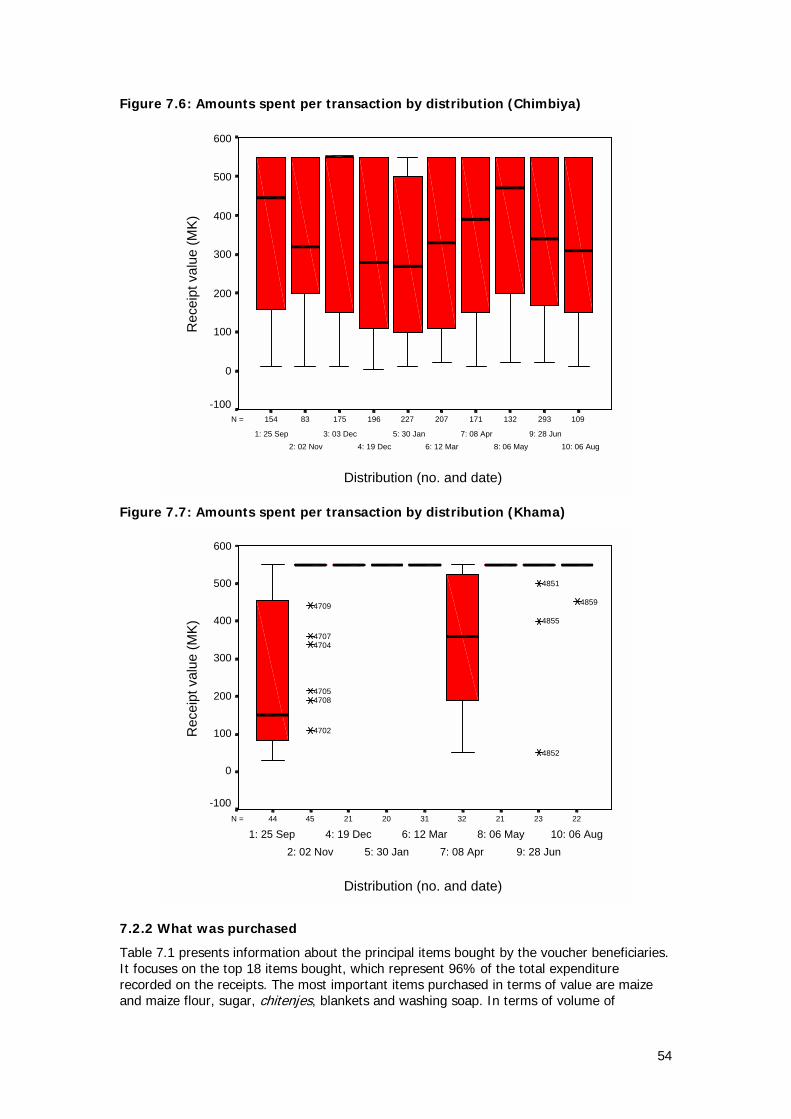
54
Figure 7.6: Amounts spent per transaction by distribution (Chimbiya)
10929313217120722719617583154N =
Distribution (no. and date)
10: 06 Aug
9: 28 Jun
8: 06 May
7: 08 Apr
6: 12 Mar
5: 30 Jan
4: 19 Dec
3: 03 Dec
2: 02 Nov
1: 25 Sep
Rec
eipt
val
ue (
MK
)
600
500
400
300
200
100
0
-100
Figure 7.7: Amounts spent per transaction by distribution (Khama)
222321323120214544N =
Distribution (no. and date)
10: 06 Aug
9: 28 Jun
8: 06 May
7: 08 Apr
6: 12 Mar
5: 30 Jan
4: 19 Dec
2: 02 Nov
1: 25 Sep
Rec
eipt
val
ue (
MK
)
600
500
400
300
200
100
0
-100
4859
4851
4855
4852
4709
47074704
47054708
4702
7.2.2 What was purchased
Table 7.1 presents information about the principal items bought by the voucher beneficiaries. It focuses on the top 18 items bought, which represent 96% of the total expenditure recorded on the receipts. The most important items purchased in terms of value are maize and maize flour, sugar, chitenjes, blankets and washing soap. In terms of volume of

55
transactions, smaller, less expensive items such as bathing soap, vaseline, salt and matches are also important.
Table 7.1: Breakdown of total voucher expenditure for top 18 items* bought during ten distributions (September 2001-July 2002) Total spent (MK) Number of purchases Average amount spent
per purchase (MK) Maize flour 635,221 2,239 284 Sugar 204,659 2,093 98 Chitenje** 182,132 936 195 Blanket 160,275 454 353 Washing soap 151,086 3,587 42 Maize 129,990 296 439 Bathing soap 69,832 2,007 35 Vaseline 59,887 1,466 41 Rice 43,306 635 68 Pot 38,573 189 204 Salt 37,234 1,521 24 Body Lotion 27,391 460 60 Plates 25,529 197 130 Cooking Oil 25,216 619 41 Hoe 22,052 142 155 Pail 18,880 119 159 Matches 15,925 1,429 11 Umbrella 6,377 39 164 * Comprising 96% of total expenditure. ** Women’s clothing (wrap around cloth). Source: DSNPP voucher receipts.
One puzzling result shown in Table 7.1 is that beneficiaries bought less maize than maize flour. However, it should be noted that the patterns are not a simple reflection of beneficiaries’ choices, but are affected by availability of goods in the shops that participated in the voucher scheme, as well as attempts by some retailers to influence beneficiaries’ purchasing decisions (see Section 7.2.1). Figure 7.8 shows that no one bought maize after the December distributions, but purchases of maize flour rose sharply after November and over MK120,000 was spent on maize flour following the fourth, fifth and sixth distributions (at the peak of the ‘hungry period’). This is because maize was only available in one participating retailers’ shop – Muderanji – which was suspended from the voucher scheme after December because it was not following the voucher scheme guidelines.
The aggregated data presented in Table 7.1 also disguises some interesting seasonal patterns of expenditure, which are illustrated in Figures 7.8-7.12:
• Staple food – maize, maize flour and rice – absorbed most of the voucher beneficiaries’ transfers between November and March; substantial amounts of salt were also bought, presumably as or for the relish eaten with nsima. Consumption of cooking oil and matches also remained relatively strong.
• During the planting season (September-October) and the post-harvest period (April-July) food absorbed less of the total transfer and other basic needs items were in demand: clothing (chitenjes), blankets, pots, pails, plates and hoes. Almost MK50,000 was spent on blankets in May.
• Expenditure on sugar – commonly used for beer brewing – also rose somewhat in the post-harvest period, but – as with bathing soap and washing soap – the sugar purchasing pattern appears to be affected more by availability than by seasonal variations. For instance, Alinafe had no sugar in February.

56
Figure 7.8: Expenditure on maize, maize flour and rice
0
20000
40000
60000
80000
100000
120000
140000
160000
1: 25 Sep 2: 02 Nov 3: 03 Dec 4: 19 Dec 5: 04 Feb 6: 16 Mar 7: 08 Apr 8: 06 May 9: 28 Jun 10: 06 Aug
Distribution (no. and date)
Tot
al e
xpen
ditu
re (
MK
)
Maize flour
Maize
Rice
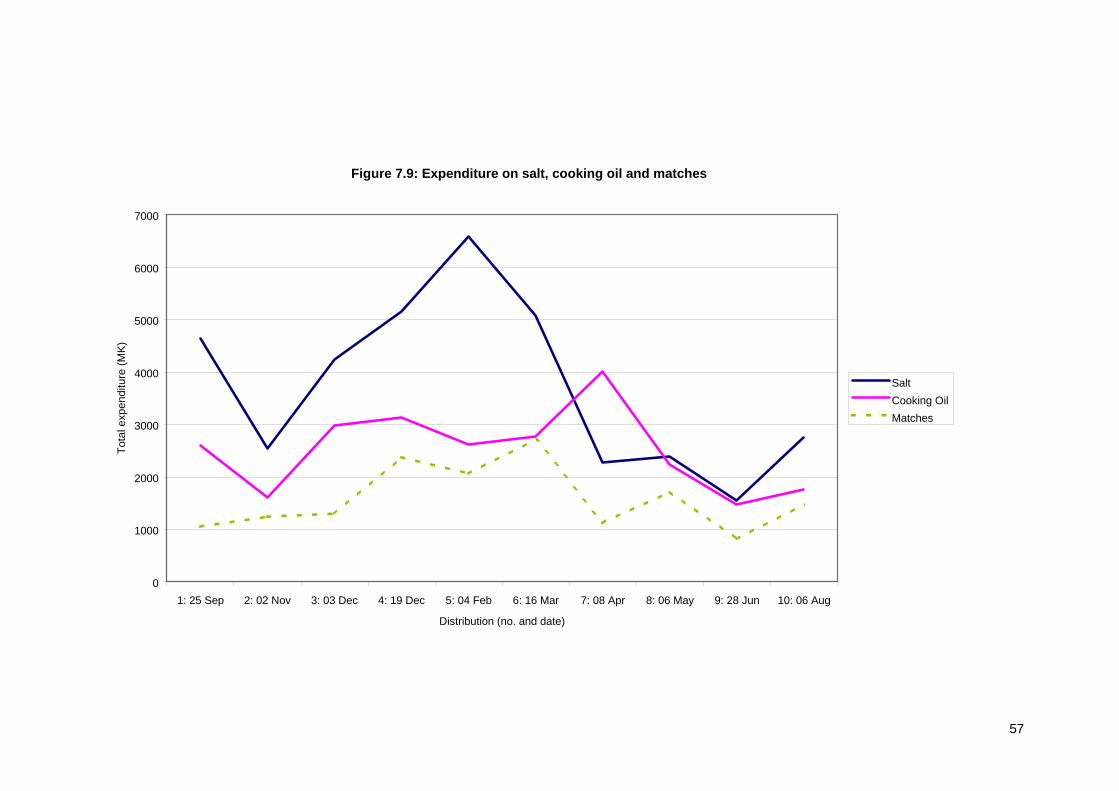
57
Figure 7.9: Expenditure on salt, cooking oil and matches
0
1000
2000
3000
4000
5000
6000
7000
1: 25 Sep 2: 02 Nov 3: 03 Dec 4: 19 Dec 5: 04 Feb 6: 16 Mar 7: 08 Apr 8: 06 May 9: 28 Jun 10: 06 Aug
Distribution (no. and date)
Tot
al e
xpen
ditu
re (
MK
)
Salt
Cooking Oil
Matches
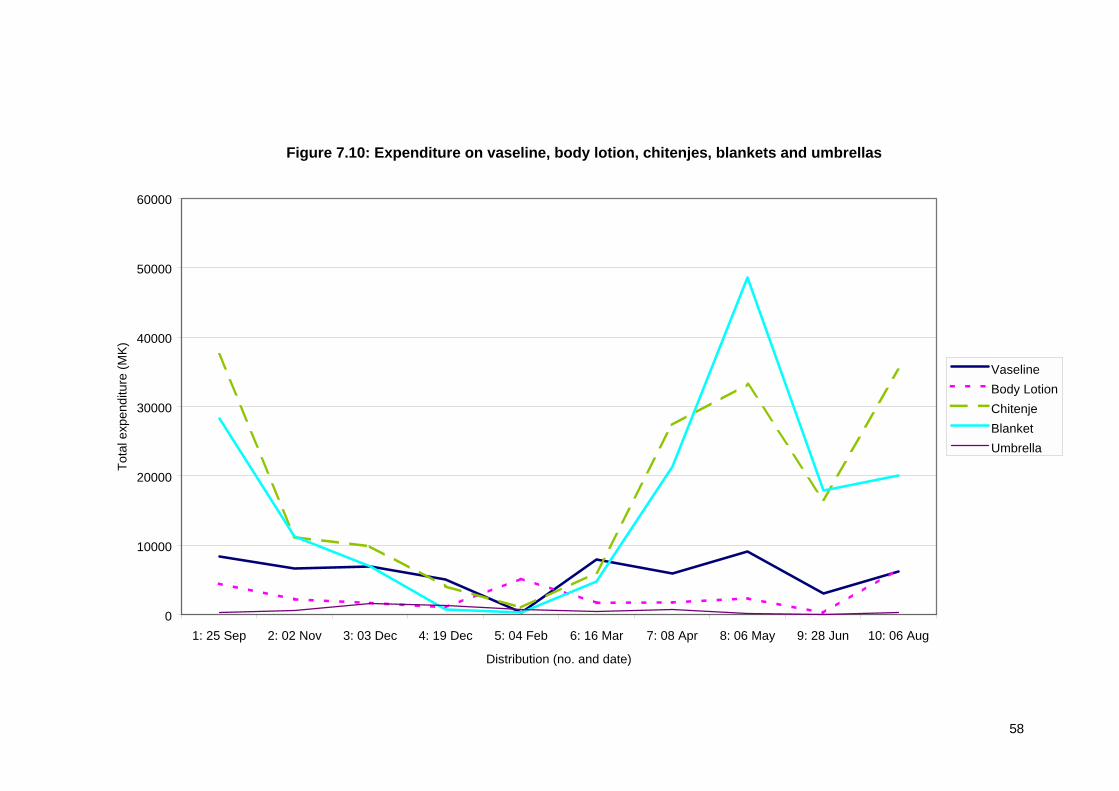
58
Figure 7.10: Expenditure on vaseline, body lotion, chitenjes, blankets and umbrellas
0
10000
20000
30000
40000
50000
60000
1: 25 Sep 2: 02 Nov 3: 03 Dec 4: 19 Dec 5: 04 Feb 6: 16 Mar 7: 08 Apr 8: 06 May 9: 28 Jun 10: 06 Aug
Distribution (no. and date)
Tot
al e
xpen
ditu
re (
MK
)
Vaseline
Body Lotion
Chitenje
Blanket
Umbrella

59
Figure 7.11: Expenditure on hoes, pails, pots and plates
0
2000
4000
6000
8000
10000
12000
14000
1: 25 Sep 2: 02 Nov 3: 03 Dec 4: 19 Dec 5: 04 Feb 6: 16 Mar 7: 08 Apr 8: 06 May 9: 28 Jun 10: 06 Aug
Distribution (no. and date)
Tot
al e
xpen
ditu
re (
MK
)
Hoe
Pail
Pot
Plates

60
Figure 7.12: Expenditure on sugar, bathing soap and washing soap
0
5000
10000
15000
20000
25000
30000
35000
1: 25 Sep 2: 02 Nov 3: 03 Dec 4: 19 Dec 5: 04 Feb 6: 16 Mar 7: 08 Apr 8: 06 May 9: 28 Jun 10: 06 Aug
Distribution (no. and date)
Tot
al e
xpen
ditu
re (
MK
)
Sugar
Bathing soap
Washing soap

61
7.2.3 Price increases
During the group interviews with beneficiaries carried out in “hands-off” villages in June, some of the voucher beneficiaries complained of the high prices and poor quality of goods available in the shops participating in the voucher scheme. In particular, they pointed out that better quality clothing and blankets could be bought in the market at lower prices than in the voucher scheme shops. In this sense, the voucher beneficiaries were at a disadvantage compared to the cash beneficiaries, who could purchase the items they needed in the market.
Table 7.2 shows that average amounts spent by voucher recipients on specific items at the height of the ‘hungry period’ varied considerably from store to store. This reflected both differences in amounts purchased in different shops and variations in pricing. For instance, while in February 2002 Chimbiya, Veke and Khama were selling mgaiwa maize flour (milled on the premises) at MK35 per kg, Alinafe was selling only special cream of maize flour at MK46-MK48 per kg. At the same time Alinafe and Khama were selling Lifebuoy soap at MK15 per bar, while Chimbiya and Veke were charging MK12 and MK13 respectively.
Table 7.2: Average amounts spent at different stores at peak of hungry period* Average amounts spent (MK) Alinafe Khama Chimbiya Veke Maize flour 378 393 225 261 Washing soap 26 39 40 47 Bathing soap 27 19 34 29 Sugar 58 112 96 72 Matches 16 8 7 7 Salt 18 24 32 21 Cooking Oil 33 15 25 50 Blanket -- -- 350 317 Chitenje** -- 125 150 162 * 4th-6th distributions. ** Women’s clothing (wrap around cloth). Source: DSNPP voucher receipts.
7.3 The impact on the retail sector The DSNPP has demonstrated that different types of transfer have different implications for economic development, in particular the development of the retail sector.
Cash transfers are spent at a wide variety of retail outlets, from local hawkers and vendors to market stalls and shops in trading centres. This means that the injection of resources by the DWT is spread throughout the local economy. Given the extremely cash-poor nature of the local economy, particularly during the hungry period, the cash transfers would boost consumer demand in a scaled-up version of the DSNPP. They could promote balanced development of the retail sector.
Voucher transfers are spent at a limited number of retailers, because those selected to participate have to fulfil basic requirements in terms of capacity to manage the vouchers. This means that the injection of resources by the DWT leads to uneven development, with two or three medium-sized or large retail outlets in each trading centre benefiting from the scheme by being able to sell to beneficiaries (and by being able to raise prices), while others are excluded. In a scaled-up version of the pilot, a two-tier retail structure would undoubtedly emerge, with some privileged ‘insiders’ benefiting while others – the ‘outsiders’ – do not. This could also lead to rent-seeking, with the Project Officers subject to approaches by retailers offering favours in order to be included. Even if this is avoided, the restrictive nature of the scheme would lead to uneven development of the retail sector.
In-kind transfers imply benefits for the suppliers of the goods and maize flour. In the case of the package of goods, it was not possible to find a supplier in Dedza, so one was identified in Lilongwe. Therefore the benefits of participation were felt by one large company Lilongwe,
62
rather than being spread through the local economy. For the maize flour, a supplier was found in Dedza, but still only one company benefited. This might change slightly in the scaled-up version of the project, as several suppliers might be selected, but the impact would still be concentrated on a relatively small number of medium- to large-scale businesses.
7.4 Project expansion The information about expenditure patterns presented in this chapter is helpful in predicting the consumer demand which will be generated by the project as it expands. The main goods and services purchased by beneficiaries are: maize, maize milling and maize flour, soap, sugar, salt, vegetables, fish, paraffin, matches, contributing to funerals, giving to church or mosque, chitenjes and blankets. There are major seasonal variations in purchasing patterns.
We found distortions in the purchasing patterns of voucher beneficiaries because of the behaviour of the voucher retailers. Prices were increased and goods were often of poor quality or not available when the beneficiaries wanted to buy them. The pattern of purchasing (when and what is bought) was more likely to be determined by the retailer than by the beneficiary.
The problems were greatest with the retailers based in Thete (serving Kabwazi EPA), while those based in Chimbiya (serving Linthipe EPA) performed better. This suggests that market/ price distortions could be reduced by promoting competition between participating retailers (including making sure that there are at least two in each trading centre) and taking action if uncompetitive practices are reported. However, it may be impossible to ensure competition given a) the lack of retailers in rural areas with the minimum capacity required for participating in a voucher scheme and b) the possibility of unforeseen withdrawals of retailers from the voucher scheme (see Section 5.3). Moreover, even in Chimbiya voucher beneficiaries complained that they would be able to buy cheaper, better quality goods in the market.
The decision about which type of transfer should be adopted for the scaled-up version of the project should take into account the potential impact on the development of the retail sector. It is clear that cash transfers spread the benefits evenly through the local economy, while, at the other extreme, in-kind transfers tend to concentrate the benefits in the district capital or Lilongwe. Vouchers present a series of problems for the local economy, in particular the uneven development of the retail sector. With vouchers, a two-tier system would emerge, possibly characterised by rent-seeking on the part of retailers.

63
Chapter 8: Main recommendations
8.1 Type of transfer The evidence presented in report supports a case for a combination of in-kind transfers (maize flour only) and cash to provide other foods and basic needs. We recommend avoiding vouchers in a scaled-up version of the DSNPP because:
• They are similar to cash but have a less positive impact on well-being (they do not allow the beneficiaries to maximise the benefit of the DWT);
• They are costly and complicated to administer;
• There is not enough retailer capacity in rural areas; and
• They introduce market and price distortions.
8.2 Type of committee We believe that beneficiary/carer committees are preferable to democratically elected or village head committees for management of the transfers at village level because they are trustworthy and do not require extra payment for their work. However, in terms of capability, the record of beneficiary/carer committees is varied. Therefore, we recommend that able-bodied carers should be included as a norm (not just if beneficiaries are unable to serve on the committees, as was the case in the pilot). If possible, one or two people with literacy skills should be on the committee. External support could be provided for the beneficiary/carer committees through Village Development Committees (VDCs).
8.3 Type of monitoring/supervision The positive impact of the DSNPP was greater in the closely monitored villages than in the “hands-off” villages. Although close monitoring is not an option when scaling up, due to cost, we believe that a system of supervision is needed for a scaled-up version of the project. This should carry out random spot checks on the work of the village committees, feeding back the findings to CU immediately after each visit so that remedial action can be taken where there are irregularities. It could also report on ‘good practice’, and would identify cases where committees need more external assistance or training.
8.4 Flexibility We argue that a greater degree of flexibility should be built into the DWTs than is the case at present. In particular:
• The number of beneficiaries should be allowed to increase in times of food crisis so that the safety net widens to cover all households in need and avoid the social tensions which result from the exclusion of those who ought to qualify under DWT targeting criteria. In October/November each year, the percentage of beneficiary households targeted should be increased if a crisis is forecast. This could be done by drawing up an ‘A’ list and a ‘B’ list of beneficiaries during beneficiary selection (in May-July). The ‘B’ list would cover those who are not vulnerable in times of plenty, but could become vulnerable as a result of a food crisis or other shock.
• The level of the benefit for each household should take account of the number of registered beneficiaries in the household. The level of benefit should be adjusted to reflect changes in the cost of living over time. Annual adjustments in October/ November are needed to ensure – as far as possible – that the transfers will be enough to last from one distribution to the next during the following hungry period.

64
Appendix 1: Interim Report Executive Summary March 2002
Chapter 1: Introduction
The Dedza Safety Nets Pilot Project (DSNPP) is designed to test a system of Direct Welfare Transfers to the work-constrained rural poor. The M&E component is an integral part of the pilot, since the point is to learn lessons for scaling up. The pilot was designed to enable lessons to be learnt about: types of transfer (cash, vouchers and in-kind transfers); whether community management structures can handle the transfers and which type of village committee is best; logistical and cost requirements; patterns of demand for goods and services generated by the intervention; and impact on the retail sector.
The process of beneficiary selection took place before the M&E system was established, but some lessons have been learnt. Selection by village heads was found to lead to over-registration. After filtering, most those selected as beneficiaries for the DSNPP were found to qualify in terms of the selection criteria and in terms of poverty targeting.
Chapter 2: Methodology
The M&E system is divided into four parts: The impact on beneficiaries; the process, as managed by the village committees; the logistics and costs, as managed by Concern Universal (CU); and the expenditure pattern of beneficiaries. M&E tools have been designed to collect information about all these areas of interest. A sampling scheme was devised on the basis of the different ‘factors’ and ‘levels’ involved, including the difference between ‘closely monitored’ and “hands-off” villages. The 54 villages participating in the pilot were chosen by random sampling, with some constraints imposed by geography and resources.
A baseline survey was carried out in July-August 2001, before the pilot began, providing reliable preliminary information about 1,262 listed beneficiaries and 899 households. Quarterly monitoring surveys were carried out in November 2001 and February 2002, providing information about a sample of 258 ‘fully monitored individuals’. A control group was not used for ethical reasons. An assets- and income-based poverty index was used to analyse the survey data.
Chapter 3: Community management structures
The Project Officers (from CU) visited the 54 villages selected for the pilot and set up the appropriate type of committee for each village: either a village head, democratic or beneficiary/carer committee. The choice was determined by the sampling scheme. The committees underwent a day of training using a manual.
The results of the pilot show that the village committees are able to manage the transfers and to keep the records required by the project. There are some differences according to type of committee, with village head committees performing worst, democratic committees performing most effectively and efficiently, and beneficiary/carer committees proving to be the least open to the temptation of stealing the transfers (as they are the recipients).
The cash and vouchers generated complaints about theft by village committee members, which required intervention by CU and the local authorities. The need to replace beneficiaries who had passed away also caused some problems, but village committees were able to resolve them. They were also able to provide short-term solutions to problems with multiple beneficiary households. They face continuing pressure from deserving people for inclusion on the list of beneficiaries, but this problem is beyond the scope of the committees to solve.
The village head and democratic committees have demanded payment of allowances to cover the cost of the activities that they are required to carry out for the project. Some have taken payment for their services from the beneficiaries’ transfers. The beneficiary/carer committees do not require allowances as they are benefiting from the project. However, they need more external support than the other types of committee. This could be provided by the Village Development Committees in a scaled-up DWT programme.

65
Chapter 4: Distribution and logistics
Delivery of all types of transfer has proven relatively straightforward. Cash and in-kind transfers require security measures to be taken, particularly in the current situation of food crisis, with reports that those villages not included in the pilot are very frustrated. The vouchers do not require security precautions, as they can be traced using the serial numbers.
The main problems with delivery are that village committee members have to wait a long time at distribution centres, and some fail to turn up to collect the transfers. However, these problems would be relatively easy to solve in a scaled-up DWT programme.
The logistics of the vouchers are more complicated than the other types of transfer. The vouchers and receipt books have to be printed (with precautions taken against forgery of vouchers). Retailers have to be recruited and trained, and commissions negotiated. Once the retailers have made sales, they bring the vouchers and receipt books to CU, and accountants reconcile them before authorising payment. In a scaled-up DWT programme involving vouchers, large numbers of additional staff would be required to deal with retailers.
A serious difficulty in the Dedza area is the lack of retailers who fulfil the basic requirements to participate in a voucher scheme. In a scaled-up DWT programme, it is doubtful whether there would be sufficient retailer capacity to deal with the beneficiaries without serious congestion and supply shortages. However, daily distributions – which would be necessary to reach the large number of beneficiaries – might help to reduce pressure on the retailers.
Chapter 5: Receipt and use of benefits
The pilot was successful in ensuring that most of the transfers reached the beneficiaries, and in sorting out problems when non-receipt of part of the transfers was reported.
When the beneficiaries receive cash or vouchers they tend to spend them immediately. Cash does not present any major problems – being easy and flexible to use – but vouchers do. The most vulnerable beneficiaries – especially women – find them difficult to understand; they give the beneficiaries little choice of distances travelled to shop; the choice of items available to buy is restricted; the retailer often decides what items are bought; and retailers have taken advantage of their near-monopoly on voucher sales to raise prices.
In-kind transfers are popular. The large package of goods delivered in September provided an initial boost in terms of key basic needs items, and the subsequent monthly distributions of maize flour have been praised because of the high quality of the flour that is distributed. Beneficiaries have shared the maize flour within households, and 9% gave some away to other households in January because of the critical shortage of food in the communities.
Chapter 6: Is there an impact on well-being?
The data from the baseline survey allows us to explore the initial characteristics of the beneficiaries. An adjusted poverty index, taking account of the number of registered beneficiaries in the household, shows that 80% of one-beneficiary households are in the bottom two poverty categories, rising to 100% for households with four or more beneficiaries. This suggests that an sliding scale of welfare transfers should be adopted.
The baseline survey data tells us that most beneficiaries live in poor housing, with one-quarter to one-third characterised by a complete lack of sleeping, cooking and washing facilities and basic sanitation. Almost three-quarters of beneficiary households received less than MK100 in the time period covered by the survey (roughly one month), and only 10% had savings of any sort (mainly livestock). Ownership of livestock and other assets were extremely low, and many disadvantaged people lacked key personal belongings such as sleeping mats and blankets. All households engaged in economic activities, but the disadvantaged people were less active than other members of the household. Almost two-thirds of disadvantaged people are female, and the great majority are children (mainly orphans) and the elderly. Education levels are low. The carers are also mainly women (80%), with hardly any regular income or savings. They have slightly higher education levels than the disadvantaged people, and slightly more engagement in economic activities.
66
All types of transfer have helped to prevent extreme food insecurity among the beneficiaries at a time of severe food shortages in their communities. The data does not show a clear relationship between impact on food security and type of transfer, so we cannot conclude that cash or vouchers or in-kind transfers are more effective in reducing food insecurity. On other basic unmet needs, there are some differences in impact of different types of transfer.
Chapter 7: Consumer demand and the economy
The findings of the DSNPP allow us to predict consumer demand which will be generated by the project as it expands, if cash or vouchers are adopted as the type of transfer. Expenditure will be higher than usual, especially during the hungry period. Retailers should be warned of probable increases in consumer demand for certain items. Otherwise, beneficiaries are likely to face supply constraints and rising prices. If in-kind transfers are adopted, consumer demand is likely to fall for items that are included in the transfer.
The decision about which type of transfer should be adopted for the scaled-up version of the project should take into account the impact on retailers (and suppliers for in-kind transfers). It is clear that cash transfers spread the benefits evenly through the local economy, while, at the other extreme, in-kind transfers concentrate the benefits in the district capital or Lilongwe. Vouchers present a series of problems for the local economy, in particular the uneven development of the retail sector. A two-tier system is likely to emerge, characterised by rent-seeking on the part of retailers and inflation for the DWT beneficiaries.
Chapter 8: Costs of the project
Cash and in-kind transfers have the lowest delivery costs and around 70% of the total cost of the project reaches the beneficiaries (alpha value). Vouchers have the highest delivery costs and the lowest alpha values – around 63%, even without taking into account the extra staff which a scaled-up voucher programme would require to deal with retailers.
Chapter 9: Conclusions and recommendations
The authors recommend that in future beneficiary selection should be done by democratically elected committees or at open village meetings. These two approaches should be tested during the first phase of scaling up. The DWT programme should address the problem of multiple beneficiary households. The use of a sliding scale of benefits is recommended. The DSNPP team considers that vouchers should be ruled out of future DWT projects. Their disadvantages clearly outweigh their advantages. The team’s preferred option for scaling up would be a combination of cash and in-kind transfers, with cash distributed from May to October and maize flour from November to April. Both types of transfer are popular with beneficiaries, manageable and can be delivered at relatively low cost.
We recommend that beneficiary/carer committees should manage the transfers in scaled-up DWT projects. Democratically elected committees have some advantages over them, but they are demanding to receive meals and transport allowances. Beneficiaries and their carers do not require extra payment for managing the transfers, but they need more external support than democratic committees. This could be provided by Village Development Committees.
Both cash and in-kind transfers are manageable and around 70% of the cost of the project reaches the beneficiaries (alpha value). Vouchers, on the other hand would be extremely difficult to manage in a scaled-up DWT programme, and alpha values would be lower.
DWTs have a major positive impact on the well-being of beneficiaries, although they are not enough to solve food and other basic needs requirements completely.
We can predict patterns of consumer demand associated with different types of transfer in order to inform retailers of what items will be required as the DWT programme expands. We can also predict the economic impact of a scaled-up DWT programme, in particular in relation to the retail sector and wholesale suppliers. Cash transfers spread the benefits throughout the local economy, while vouchers lead to uneven development of the retail sector and in-kind transfers will concentrate the benefits with suppliers in the district capital or Lilongwe.

67
Appendix 2: Guidelines, checklist and reporting form for visits to “hands-off” villages

GUIDELINES, CHECKLIST & REPORTING FORM FOR VISITS TO “HANDS-OFF” VILLAGES
May-June 2002
Name of village:___________________________ Date of visit:_________________
Type of committee:_____________________ Type of transfer:__________________
Name(s) of CU Project Officer(s) visiting:___________________________________
A. PARTICIPATORY FOCUS GROUP: BENEFICIARIES 1. RELATIONSHIP WITH VILLAGE COMMITTEE Was the committee delivering the transfers? Did the beneficiaries receive the transfers in full? How were the committee members treating the beneficiaries? Or How was the interaction between the committee members and the beneficiaries? Was the committee transparent enough? Did the beneficiaries have any problems or complaints? (If so, say what they were, whether they were solved – and if so, how they were solved).

2. HANDLING OF THE TRANSFERS WITHIN THE HOUSEHOLD How has the transfer been used? Who used it? Have others in the Household also benefited? How was the transfer being handled in multiple beneficiary households? Gender focus: Who was deciding how to use the transfer? Who was using it? What problems were women facing regarding the transfers? Did orphans face any problems regarding the transfers? 3. FOOD STOCKS What food items are available in stock? (please list those mentioned by participants)

FOOD STOCKS (CONTINUED) “STANDING IN LINE GAME” - DETERMINING HOW LONG FOOD STOCKS WILL LAST PROCEDURE Explain to the beneficiaries that they will stand in lines depending on the amount of food stocks they have in their households:
! If their household’s food reserves are expected to last for 1 month, s/he should stand in a ‘1 month line’
! If their household’s food reserves are expected to last for 2 months, s/he should stand in a ‘2 months line’
! If their household’s food reserves are expected to last for 3 months, s/he should stand in a ‘3 months line’
! If their household’s food reserves are expected to last for 4 months or more, s/he should stand in a ‘4 months line’
Find a way to mark the lines clearly, e.g. using stones (piles of 1, 2, 3 and 4 stones)
Explain that the shortest line will receive a prize.
# It is important to point out that ‘food stocks’ does not include anything that the beneficiaries expect to receive from the project, or any food aid
Each person in a line should have the responsibility to ensure that those on her/his line are really genuinely supposed to be there. Otherwise the ‘un-genuine members’ of the line can make the line lose the reward.
Count the number of beneficiaries in each line. For this village, the result is:
Line: No. of beneficiaries 1 month 2 months 3 months 4 months or more
Also indicate each person’s line number (1, 2, 3 or 4) against their name on the beneficiary list – you will need a separate column to record this information.
Give a prize to the line with fewest people and consolation prizes to the other lines.
Note: The beneficiaries should NOT know in advance that there would be a consolation prize for each line.
MATERIALS REQUIRED
$ Stones (or other markers to indicate where people should stand in line)
$ Prizes
$ Beneficiary list for this village

4. PREFERENCES FOR DIFFERENT TRANSFERS “VOTING GAME”
Explain to the beneficiaries that from October or November, if the project continues, they may not receive the same transfer as they have received this year. Explain that CU is considering the options, and would like to have the beneficiaries’ views on what they would prefer to receive. Say that it is not guaranteed that everybody will get what they prefer, but if there is a majority in favour of one option in all the villages participating in the project, then it may be approved by CU.
The options currently under discussion for the period October/November to April are:
1. Maize flour (Ufa) – 20kg
2. Maize flour (Ufa) – 15kg + MK 110.00
3. Maize – 25kg
4. Maize – 20kg + MK 110.00
(If participants are curious about the other six months of the year, you can explain that CU has not decided about this yet, but they might get cash instead of food as it’s not the hungry period. Note down their reactions to this idea in your notebooks).
In order to clarify the options, show the participants big cards with pictures of the options available. Discuss until all the participants understand the options – to check this, ask one of the beneficiaries to explain to the others what the options are.
Put the options where they can be seen and ask the beneficiaries to line up behind their preferred option (i.e. “vote” for it). Give them time to think, confer and decide which option to go for. There does NOT need to be a consensus. Each person can decide for him/herself.
Count the number of beneficiaries in each line. For this village, the result is:
Line: No. of beneficiaries Option 1 Option 2 Option 3 Option 4
Also indicate each person’s preferred option (1, 2, 3 or 4) against their name on the beneficiary list – you will need another column to record this information.
MATERIALS REQUIRED
$ Big cards with clearly drawn pictures of options 1, 2, 3 and 4
$ Beneficiary list for this village
5. RELATIONS BETWEEN BENEFICIARIES AND OTHERS IN THE VILLAGE How are the relations between beneficiaries and others in the village who are not receiving the transfers? Have they been affected – positively or negatively – by the project?

B. DISCUSSION WITH VILLAGE COMMITTEE
How did the committee members find their work? Did they find it easy or difficult to keep records? (How well did they do?) How were the women members participating in discussions and other committee activities? How were the committee members relating with the village headman? How were the committee members relating with non-registered members of the village?

DISCUSSIONS WITH VILLAGE COMMITTEE (CONTINUED)
Did the committee members receive complaints from beneficiaries or non-beneficiaries, or experience any other problems? If so, did they try to solve these problems/complaints? Did they manage to solve them? Probe on any other issues raised by the beneficiaries and/or the village headman: Issues raised:
Responses given by village committee:
General points: $ Don’t forget to take your notebooks
$ Collect, photocopy and return to village committees all records that have been kept during the first 8-9 months of the project
$ If any beneficiary has died or moved away, or is no longer on the beneficiary list for any other reason, make a note of this against his/her name on the beneficiary list
$ Also note down if any person on the beneficiary list is unable to attend the participatory focus group for beneficiaries, and give the reason why
The number of people ‘standing in line’ and ‘voting for preferences’ should add up to the total number of names on the beneficiary list MINUS those who have died, moved away etc, or those unable to attend the beneficiaries’ participatory focus group

74
Appendix 3: Final impact survey questionnaires

Final impact survey questionnaire VOUCHERS draft1.doc
Last saved: 31 October 2002 Page 1
SAFETY NETS PILOT PROJECT CONCERN UNIVERSAL
FINAL IMPACT SURVEY - VOUCHERS
CONFIDENTIAL
All the information collected in this questionnaire will be completely confidential and will not be used to assess whether the respondent should receive this or other benefits.
Identification panel CODES
VILLAGE NAME INDIVIDUAL NAME
HOUSEHOLD Control panel
Name Signature Date Interviewer Supervisor Data entry clerk
Section 1: Household information Ask the head of the household or another responsible adult. A. About the respondent 1. Sex…………………………………..………………………… Male !1 Female !2
Young adult !2 Middle aged !3
2. Age If age is not known, tick the appropriate box according to your own judgement
Years
Elderly !4 B. Household characteristics 1. Size a) Household size (total number of people including children) b) Number of economically active people in the household 2. Sources of income
Sale of crops ! 1 Remittances ! 2 Small business ! 3 Pension ! 4 Artisan ! 5 Ganyu wages ! 6
a) What sources of cash income does your household have? Read out all options so that the respondent is aware of them. Tick as many as necessary.
Sale of livestock & livestock products
! 6 Salary from employment
! 8

Final impact survey questionnaire VOUCHERS draft1.doc
Last saved: 31 October 2002 Page 2
Main staple food crop (last harvest)………………... Main cash crop* (last harvest)……………………… Sale of dimba crop (last month)….………………… Small business (last month)………………………… Artisan (last month)………………………………… Sale of livestock and livestock products (last month) Remittances (last month)…………………………… Pension (last month)………………………………... Ganyu wages (last weeding period)….…………….. Salary from employment (last month)……………… Rent (last month) ….………………………………. Sale of fish (last month)……………………………..
b) Roughly how much income did your household get from these sources in the time period mentioned (MK)? Read out all the options. Write zero if none.
Sale of charcoal and firewood (last month)………… Sale of grass (last month) Sale of mushrooms/forest products (last month) Sale of mice (last month) Sale of fruit (last month) Other income (last month)…………………………. * Explain that we are talking not only about tobacco but about any crop which is sold for cash. Eg. Soya, tomatoes, etc. 3. Assets a) Housing
Type of wall
Type of roof
Type of floor
No. of rooms
Kitchen Pit latrine Bath shelter
Yes ! 1 No ! 2
Yes ! 1 No ! 2
Yes ! 1 No ! 2
Codes: Type of wall Type of roof Type of floor Mud 1 Grass only 1 Mud 1 Unburnt brick 2 Iron sheet 2 Cement 2 Burnt brick 3 Tiles 3 Tiles 3 Cement blocks 4 Plastic sheeting & grass 4 Only some rooms cemented/tiled 4 b) How many of the following animals does your household own? (Read out each type of animal in the list and note down the number against it. Put zero for none).
Type Number Type Number Chicken Pigs
Doves Goats Ducks Donkeys
Guinea fowls Cattle Rabbits Oxen (pulling/cultivating)
Guinea Pigs
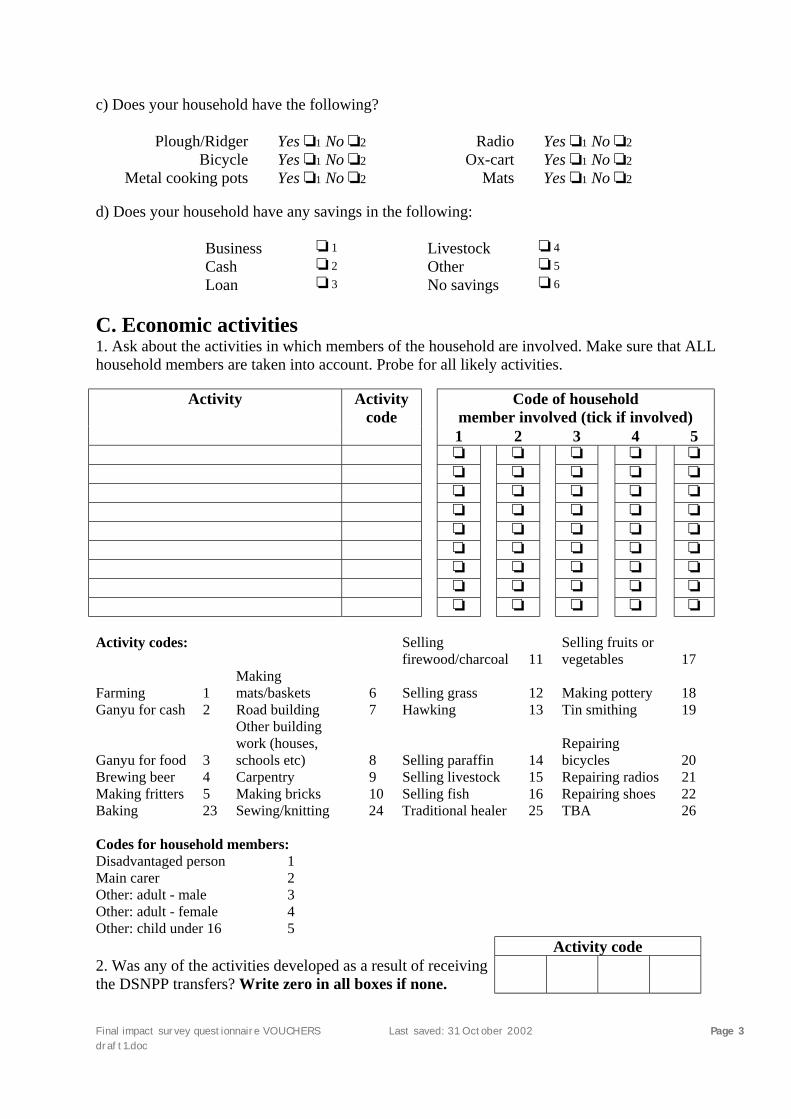
Final impact survey questionnaire VOUCHERS draft1.doc
Last saved: 31 October 2002 Page 3
c) Does your household have the following?
Plough/Ridger Yes !1 No !2 Radio Yes !1 No !2 Bicycle Yes !1 No !2 Ox-cart Yes !1 No !2
Metal cooking pots Yes !1 No !2 Mats Yes !1 No !2 d) Does your household have any savings in the following:
Business ! 1 Livestock ! 4 Cash ! 2 Other ! 5
Loan ! 3 No savings ! 6
C. Economic activities 1. Ask about the activities in which members of the household are involved. Make sure that ALL household members are taken into account. Probe for all likely activities.
Code of household member involved (tick if involved)
Activity Activity code
1 2 3 4 5 ! ! ! ! ! ! ! ! ! ! ! ! ! ! ! ! ! ! ! ! ! ! ! ! ! ! ! ! ! ! ! ! ! ! ! ! ! ! ! ! ! ! ! ! ! Activity codes: Selling
firewood/charcoal 11 Selling fruits or vegetables 17
Farming 1 Making mats/baskets 6 Selling grass 12 Making pottery 18
Ganyu for cash 2 Road building 7 Hawking 13 Tin smithing 19
Ganyu for food 3
Other building work (houses, schools etc) 8 Selling paraffin 14
Repairing bicycles 20
Brewing beer 4 Carpentry 9 Selling livestock 15 Repairing radios 21 Making fritters 5 Making bricks 10 Selling fish 16 Repairing shoes 22 Baking 23 Sewing/knitting 24 Traditional healer 25 TBA 26 Codes for household members: Disadvantaged person 1 Main carer 2 Other: adult - male 3 Other: adult - female 4 Other: child under 16 5 Activity code 2. Was any of the activities developed as a result of receiving the DSNPP transfers? Write zero in all boxes if none.

Final impact survey questionnaire VOUCHERS draft1.doc
Last saved: 31 October 2002 Page 4
3. If the household engages in farming, ask the following: a). How much land did your household cultivate last season (2001-02) in total?
Acres b). How many 50-kg bags of maize did your household produce in the 2001-02 season? If respondent mentions pails, baskets etc., convert to 50-kg bags.
50-kg bags
D. Receipt and use of the benefit 1. Has your household received any vouchers in the last 4 weeks? Yes !1 No !2
If NO, go to Section 2. If YES, answer the following questions: 2. What was their value (i.e. how much were they worth)? (Write –99 if the respondent does not know).
MK
Household member code 3. Who keeps the vouchers? 4. Who decides what to buy with them? 5. Who actually goes to the shop to make purchases with them?
Household member codes:
Disadvantaged person 1 Other: adult 3 Carer 2 Other: child (under 16) 4
If NOBODY in the household has used the vouchers, go to Section 2. If SOMEBODY HAS USED the vouchers, the rest of the questions in this section should be addressed to the person(s) who used them. Name of shop Code
6. At which shop(s) did you spend your vouchers over the last 4 weeks?
7. How far did you have to travel to your preferred shop where you could use the vouchers? km
8. Were the people doing the shopping….? Male !1 Female !2 Both !3

Final impact survey questionnaire VOUCHERS draft1.doc
Last saved: 31 October 2002 Page 5
9. What problems did they find with the vouchers over the last 4 weeks, if any? (Tick more than one if necessary).
None !1 Too far to travel to the shop !2
I couldn’t find the goods I wanted !3 I had to buy some things I didn’t really want !4
I wasn’t given change when I asked for it !5 I didn’t know which shops would accept vouchers !6
The shop I was told to go to didn’t accept my vouchers !7 The vouchers were stolen !8
Other, specify:……………………………………...……………………………… ………………………………………………………………………...
Code(s)
Easy !1 10. How easy or difficult has it been to use the vouchers in the last 4 weeks, in
your opinion? OK !2 Difficult !3
Name of shop Code
11. Is there any shop(s) that you have stopped going to with your vouchers since the scheme began because of any problems?

Final impact survey questionnaire VOUCHERS draft1.doc
Last saved: 31 October 2002 Page 6
Section 2: The disadvantaged person I want to talk to …… (name of listed beneficiary).
* If the disadvantaged person is unable to reply because of age (too young) or mental ability, ask the carer to respond to the following questions. If the household head (or other responsible adult) is in fact the disadvantaged person or the carer, the interview may continue with him/her. The remainder of this section, is about the current disadvantaged person (whether listed or not). Even if the person listed is a carer, this section refers to the disadvantaged person. A. Individual characteristics of disadvantaged person 1. Sex…………………………………..………………………… Male !1 Female !2 Child (under 16) !1
Young adult !2 Middle aged !3
2. Age If age is not known, tick the appropriate box according
to your own judgement
years
Elderly !4 3. Marital status
Married !1 Single (never married) !2
Divorced/separated !3 Widow/widower !4
None !1
Primary Standard 1-5 !2 Primary Standard 6-8 !3
Secondary !4 Tertiary/University !5
4. Educational level
Adult literacy !6
Carpentry !1 Sewing and knitting !7 Builder !2 Baking !8
Basket weaving !3 Pottery making !9 Tinsmith !4 Beer brewing !10
TBA !5 Bicycle/radio repairer !11
5. Skills
Shoe repairer !6 None !12
Other , specify……………………….…………………………… !13
C. Assets of disadvantaged person
1. Are you talking to the listed beneficiary? Yes !1 No !2 2. If “yes”, is the listed beneficiary… A disadvantaged person !1 A carer !2 3. If “no” in Qn 1, give reason: Talking to the carer* !1 New
beneficiary !2 4. If there is a new beneficiary, is he/she…? A disadvantaged person !1 A carer !2

Final impact survey questionnaire VOUCHERS draft1.doc
Last saved: 31 October 2002 Page 7
1. Does the disadvantaged person have any of the following? (as his/her personal belonging)
Mat !1 Pail/tin !9
Bed !2 Basket (dengu) !10
Blanket !3 Pounding mortar !11
Plate(s) !4 Radio !12
Cup (s) !5 Bicycle !13
Chair(s) !6 Chitenje !14
Table !7 Jacket !15
Metal pots !8 Shoes !16
D. Income and savings of disadvantaged person 1. Does he/she have any income of his/her own on a regular basis? Yes ! 1 No ! 2 2. Does he/she have any savings in the following:
Business ! 1 Livestock ! 4 Cash ! 2 Other ! 5
Loan ! 3 No savings ! 6
E. Meals 1. How many times did the disadvantaged person eat nsima yesterday?
2. Other than nsima, how many time did the disadvantaged person eat yesterday? (Eg. Breakfast, substantial snacks, dinner, etc. without nsima)
3. In the last week, how many times in total did the disadvantaged person eat nsima with meat, chicken or fish?
4. In the last week, how many times in total did the disadvantaged person eat nsima with beans?
5. In the last week, how many times in total did the disadvantaged person eat nothing but vegetables or leaves?
6. In the last week, how many times in total did the disadvantaged person eat nothing but wild fruits (masuku) or mushrooms?
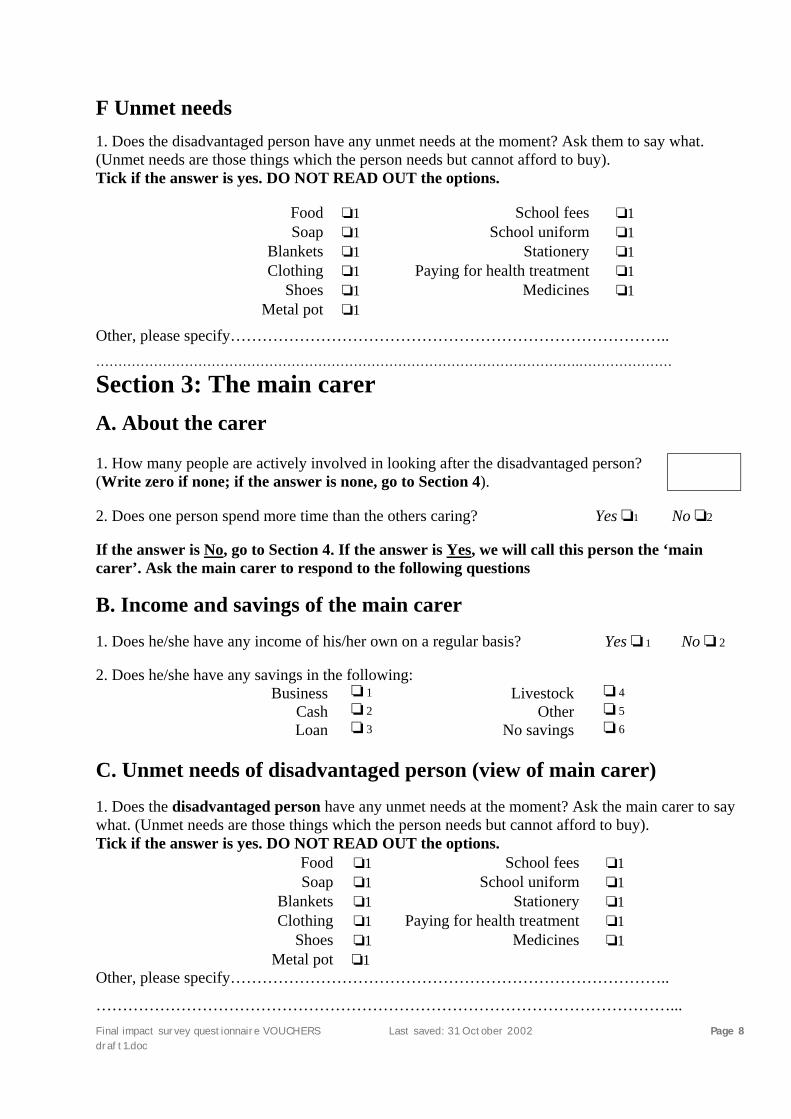
Final impact survey questionnaire VOUCHERS draft1.doc
Last saved: 31 October 2002 Page 8
F Unmet needs 1. Does the disadvantaged person have any unmet needs at the moment? Ask them to say what. (Unmet needs are those things which the person needs but cannot afford to buy). Tick if the answer is yes. DO NOT READ OUT the options.
Food !1 School fees !1 Soap !1 School uniform !1
Blankets !1 Stationery !1 Clothing !1 Paying for health treatment !1
Shoes !1 Medicines !1 Metal pot !1
Other, please specify……………………………………………………………………….. ……………………………………………………………………………………………….…………………
Section 3: The main carer
A. About the carer 1. How many people are actively involved in looking after the disadvantaged person? (Write zero if none; if the answer is none, go to Section 4).
2. Does one person spend more time than the others caring? Yes !1 No !2 If the answer is No, go to Section 4. If the answer is Yes, we will call this person the ‘main carer’. Ask the main carer to respond to the following questions
B. Income and savings of the main carer 1. Does he/she have any income of his/her own on a regular basis? Yes ! 1 No ! 2 2. Does he/she have any savings in the following:
Business ! 1 Livestock ! 4 Cash ! 2 Other ! 5
Loan ! 3 No savings ! 6
C. Unmet needs of disadvantaged person (view of main carer) 1. Does the disadvantaged person have any unmet needs at the moment? Ask the main carer to say what. (Unmet needs are those things which the person needs but cannot afford to buy). Tick if the answer is yes. DO NOT READ OUT the options.
Food !1 School fees !1 Soap !1 School uniform !1
Blankets !1 Stationery !1 Clothing !1 Paying for health treatment !1
Shoes !1 Medicines !1 Metal pot !1
Other, please specify………………………………………………………………………..
………………………………………………………………………………………………...

Final impact survey questionnaire VOUCHERS draft1.doc
Last saved: 31 October 2002 Page 9
2. In the carer’s view, how much has the disadvantaged person benefited from the transfer? Not at all? !1 A little? !2 Quite a bit? !3 A lot? !4 Not possible to tell !5
3. In the carer’s view, have other members of the household directly benefited from the transfer?
Not at all? !1 A little? !2 Quite a bit? !3 A lot? !4 Not possible to tell !5
Section 4: Consumption Ask these questions to the person who makes purchases for the household or someone who knows about what is purchased. 1. Has the household purchased any of the following items in the last two weeks? Please tick the column marked DP if the item was for the disadvantaged person only.
DP DP Beans !1 !2 School fees !1 !2
Groundnuts !1 !2 School uniform !1 !2 Beer/alcohol !1 !2 Pens, exercise books, etc !1 !2
Chicken/meat !1 !2 Paying for health treatment !1 !2 Fish !1 !2 Medicines !1 !2
Milling !1 !2 Livestock !1 !2 Pulses !1 !2 Seed !1 !2
Rice !1 !2 Fertiliser !1 !2 Bread !1 !2 Farm implements/tools !1 !2
Salt !1 !2 Paraffin !1 !2
Soap !1 !2 Thatch !1 !2 Maize !1 !2 Travel/transport !1 !2 Sugar !1 !2 Festivities !1 !2
Tea !1 !2 Funerals !1 !2 Vegetables !1 !2 Giving to church/mosque !1 !2
Blankets !1 !2 Bicycle !1 !2 Clothing !1 !2 Radio !1 !2
Shoes !1 !2 Kitchen utensils !1 !2 Cooking oil !1 !2 Furniture !1 !2
Matches !1 !2 Iron sheets !1 !2 2. At any time in the last year, has any member of the household saved vouchers from the DSNPP to buy the following…? (Tick ‘yes’ even if the item has not yet been received).
Shoes !1 Kitchen utensils (incl. pots) !1 Blankets !1 Iron sheets !1 Clothes !1 Seed or fertiliser !1

Final impact survey questionnaire VOUCHERS draft1.doc
Last saved: 31 October 2002 Page 10
Section 5: The hungry period (Jan-Feb 2002) Ask the head of the household or another responsible adult. Explain that the following questions apply to the period after last Christmas and before the last harvest. 1. During the period after last Christmas and before the last harvest, when you received the transfers how many weeks did they last?
Weeks
2. During this period… a) Did your household receive any food through ganyu? Yes ! 1 No ! 2 b) Did your household get any food from friends or relatives? Yes ! 1 No ! 2 c) Did your household give any food to your relatives or to friends? Yes ! 1 No ! 2 d) Did your household receive any food from… (Read out all the options)
Food for Work programme Yes ! 1 No ! 2 Under Five programme Yes ! 1 No ! 2
Food aid Yes ! 1 No ! 2 Other Yes ! 1 No ! 2
e) Did your household receive any other benefits from other projects? (This should not include the DSNPP).
Yes ! 1
No ! 2
3. During this period, did any member of your household regularly… Ask each and every question below
When did you do it for the first time?
Month Early Mid Late Eat only one meal a day? Yes ! 1 No ! 2 !1 !2 !3
Eat nsima from green maize (chitibu)? Yes ! 1 No ! 2 !1 !2 !3 Eat madeya/gaga? Yes ! 1 No ! 2 !1 !2 !3
Eat fruit only (no nsima)? Yes ! 1 No ! 2 !1 !2 !3 Eat vegetables only (no nsima)? Yes ! 1 No ! 2 !1 !2 !3
Eat nsima from maize cobs? Yes ! 1 No ! 2 !1 !2 !3 Eat only sugar cane (no nsima)? Yes ! 1 No ! 2 !1 !2 !3
Eat only wild roots and tubers (no nsima)? Yes ! 1 No ! 2 !1 !2 !3 Eat only wild fruit, mushrooms, etc (no nsima)? Yes ! 1 No ! 2 !1 !2 !3
Eat nothing for the whole day? Yes ! 1 No ! 2 !1 !2 !3 Eat anything else, please specify …………………. Yes ! 1 No ! 2 !1 !2 !3 Eat anything else, please specify …………………. Yes ! 1 No ! 2 !1 !2 !3 4. During this period, did your household reach a point when it was necessary to sell or barter animals or any other belongings?
Yes ! 1
No ! 2
If yes, please specify what was sold or bartered ………………………………………………………..
…………………………………………………………………………………………………………..

Final impact survey questionnaire VOUCHERS draft1.doc
Last saved: 31 October 2002 Page 11
Observations
This is the end of the interview
Remember to thank the respondent

Final impact survey questionnaire IN-KIND draft1.doc Last saved: 31 October 2002 Page 1
SAFETY NETS PILOT PROJECT CONCERN UNIVERSAL
FINAL IMPACT SURVEY – IN-KIND
CONFIDENTIAL
All the information collected in this questionnaire will be completely confidential and will not be used to assess whether the respondent should receive this or other benefits.
Identification panel CODES
VILLAGE NAME INDIVIDUAL NAME
HOUSEHOLD Control panel
Name Signature Date Interviewer Supervisor Data entry clerk
Section 1: Household information Ask the head of the household or another responsible adult. A. About the respondent 1. Sex…………………………………..………………………… Male !1 Female !2
Young adult !2 Middle aged !3
2. Age If age is not known, tick the appropriate box according to your own judgement
Years
Elderly !4 B. Household characteristics 1. Size a) Household size (total number of people including children) b) Number of economically active people in the household 2. Sources of income
Sale of crops ! 1 Remittances ! 2 Small business ! 3 Pension ! 4 Artisan ! 5 Ganyu wages ! 6
a) What sources of cash income does your household have? Read out all options so that the respondent is aware of them. Tick as many as necessary.
Sale of livestock & livestock products
! 6 Salary from employment
! 8

Final impact survey questionnaire IN-KIND draft1.doc Last saved: 31 October 2002 Page 2
Main staple food crop (last harvest)………………... Main cash crop* (last harvest)……………………… Sale of dimba crop (last month)….………………… Small business (last month)………………………… Artisan (last month)………………………………… Sale of livestock and livestock products (last month) Remittances (last month)…………………………… Pension (last month)………………………………... Ganyu wages (last weeding period)….…………….. Salary from employment (last month)……………… Rent (last month) ….………………………………. Sale of fish (last month)……………………………..
b) Roughly how much income did your household get from these sources in the time period mentioned (MK)? Read out all the options. Write zero if none.
Sale of charcoal and firewood (last month)………… Sale of grass (last month) Sale of mushrooms/forest products (last month) Sale of mice (last month) Sale of fruit (last month) Other income (last month)…………………………. * Explain that we are talking not only about tobacco but about any crop which is sold for cash. Eg. Soya, tomatoes, etc. 3. Assets a) Housing
Type of wall
Type of roof
Type of floor
No. of rooms
Kitchen Pit latrine Bath shelter
Yes ! 1 No ! 2
Yes ! 1 No ! 2
Yes ! 1 No ! 2
Codes: Type of wall Type of roof Type of floor Mud 1 Grass only 1 Mud 1 Unburnt brick 2 Iron sheet 2 Cement 2 Burnt brick 3 Tiles 3 Tiles 3 Cement blocks 4 Plastic sheeting & grass 4 Only some rooms cemented/tiled 4 b) How many of the following animals does your household own? (Read out each type of animal in the list and note down the number against it. Put zero for none).
Type Number Type Number Chicken Pigs
Doves Goats Ducks Donkeys
Guinea fowls Cattle Rabbits Oxen (pulling/cultivating)
Guinea Pigs
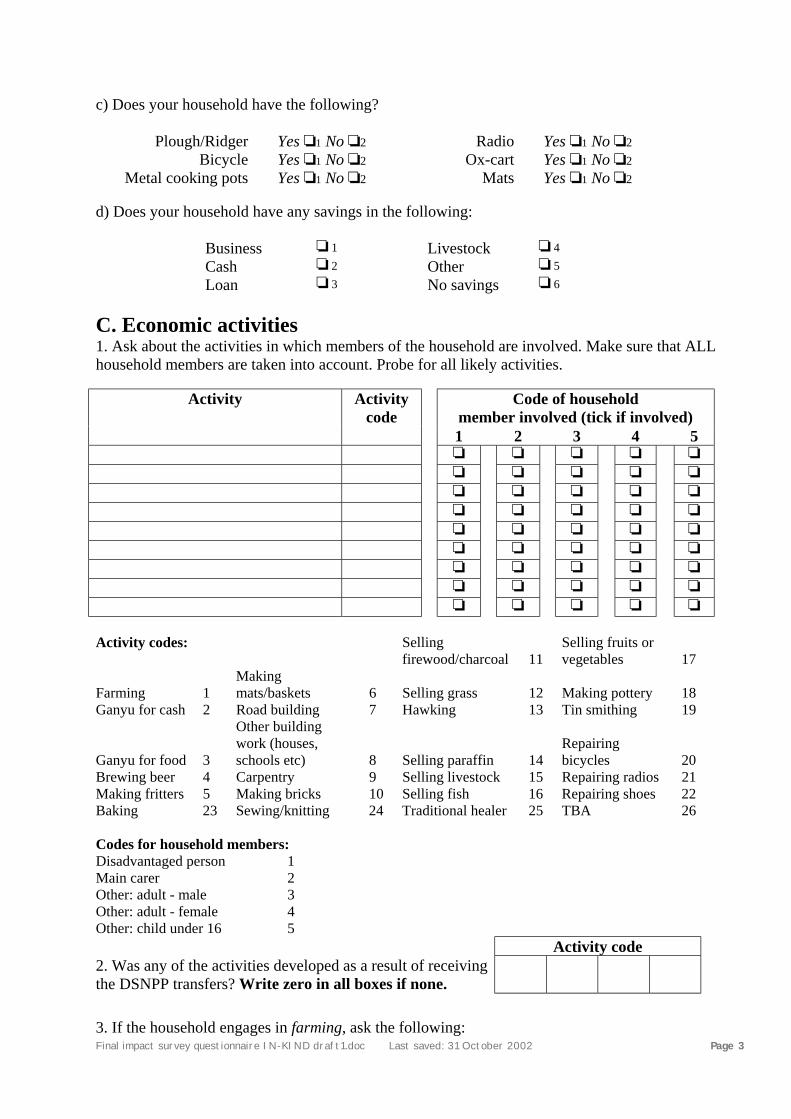
Final impact survey questionnaire IN-KIND draft1.doc Last saved: 31 October 2002 Page 3
c) Does your household have the following?
Plough/Ridger Yes !1 No !2 Radio Yes !1 No !2 Bicycle Yes !1 No !2 Ox-cart Yes !1 No !2
Metal cooking pots Yes !1 No !2 Mats Yes !1 No !2 d) Does your household have any savings in the following:
Business ! 1 Livestock ! 4 Cash ! 2 Other ! 5
Loan ! 3 No savings ! 6
C. Economic activities 1. Ask about the activities in which members of the household are involved. Make sure that ALL household members are taken into account. Probe for all likely activities.
Code of household member involved (tick if involved)
Activity Activity code
1 2 3 4 5 ! ! ! ! ! ! ! ! ! ! ! ! ! ! ! ! ! ! ! ! ! ! ! ! ! ! ! ! ! ! ! ! ! ! ! ! ! ! ! ! ! ! ! ! ! Activity codes: Selling
firewood/charcoal 11 Selling fruits or vegetables 17
Farming 1 Making mats/baskets 6 Selling grass 12 Making pottery 18
Ganyu for cash 2 Road building 7 Hawking 13 Tin smithing 19
Ganyu for food 3
Other building work (houses, schools etc) 8 Selling paraffin 14
Repairing bicycles 20
Brewing beer 4 Carpentry 9 Selling livestock 15 Repairing radios 21 Making fritters 5 Making bricks 10 Selling fish 16 Repairing shoes 22 Baking 23 Sewing/knitting 24 Traditional healer 25 TBA 26 Codes for household members: Disadvantaged person 1 Main carer 2 Other: adult - male 3 Other: adult - female 4 Other: child under 16 5 Activity code 2. Was any of the activities developed as a result of receiving the DSNPP transfers? Write zero in all boxes if none.
3. If the household engages in farming, ask the following:

Final impact survey questionnaire IN-KIND draft1.doc Last saved: 31 October 2002 Page 4
a). How much land did your household cultivate last season (2001-02) in total? Acres
b). How many 50-kg bags of maize did your household produce in the 2001-02 season? If respondent mentions pails, baskets etc., convert to 50-kg bags.
50-kg bags
D. Receipt and use of the benefit 1. Has your household received any benefit in the last 4 weeks? Yes !1 No !2
If NO, go to Section 2. If YES, answer the following questions: 2. What did you receive? (Write number of bags in right-hand box; write zero if none, 0.5 if half a bag, etc; write -99 if they don’t know if they received; –88 if they don’t know how many bags)
Code No. of
Bags Maize flour 7
Section 2: The disadvantaged person I want to talk to …… (name of listed beneficiary).
* If the disadvantaged person is unable to reply because of age (too young) or mental ability, ask the carer to respond to the following questions. If the household head (or other responsible adult) is in fact the disadvantaged person or the carer, the interview may continue with him/her. The remainder of this section, is about the current disadvantaged person (whether listed or not). Even if the person listed is a carer, this section refers to the disadvantaged person. A. Individual characteristics of disadvantaged person 1. Sex…………………………………..………………………… Male !1 Female !2 Child (under 16) !1
Young adult !2 Middle aged !3
2. Age If age is not known, tick the appropriate box according
to your own judgement
years
Elderly !4
1. Are you talking to the listed beneficiary? Yes !1 No !2 2. If “yes”, is the listed beneficiary… A disadvantaged person !1 A carer !2 3. If “no” in Qn 1, give reason: Talking to the carer* !1 New
beneficiary !2 4. If there is a new beneficiary, is he/she…? A disadvantaged person !1 A carer !2
Final impact survey questionnaire IN-KIND draft1.doc Last saved: 31 October 2002 Page 5
3. Marital status
Married !1 Single (never married) !2
Divorced/separated !3 Widow/widower !4
None !1
Primary Standard 1-5 !2 Primary Standard 6-8 !3
Secondary !4 Tertiary/University !5
4. Educational level
Adult literacy !6
Carpentry !1 Sewing and knitting !7 Builder !2 Baking !8
Basket weaving !3 Pottery making !9 Tinsmith !4 Beer brewing !10
TBA !5 Bicycle/radio repairer !11
5. Skills
Shoe repairer !6 None !12
Other , specify……………………….…………………………… !13
C. Assets of disadvantaged person 1. Does the disadvantaged person have any of the following? (as his/her personal belonging)
Mat !1 Pail/tin !9
Bed !2 Basket (dengu) !10
Blanket !3 Pounding mortar !11
Plate(s) !4 Radio !12
Cup (s) !5 Bicycle !13
Chair(s) !6 Chitenje !14
Table !7 Jacket !15
Metal pots !8 Shoes !16
D. Income and savings of disadvantaged person 1. Does he/she have any income of his/her own on a regular basis? Yes ! 1 No ! 2 2. Does he/she have any savings in the following:
Business ! 1 Livestock ! 4 Cash ! 2 Other ! 5
Loan ! 3 No savings ! 6

Final impact survey questionnaire IN-KIND draft1.doc Last saved: 31 October 2002 Page 6
E. Meals 1. How many times did the disadvantaged person eat nsima yesterday?
2. Other than nsima, how many time did the disadvantaged person eat yesterday? (Eg. Breakfast, substantial snacks, dinner, etc. without nsima)
3. In the last week, how many times in total did the disadvantaged person eat nsima with meat, chicken or fish?
4. In the last week, how many times in total did the disadvantaged person eat nsima with beans?
5. In the last week, how many times in total did the disadvantaged person eat nothing but vegetables or leaves?
6. In the last week, how many times in total did the disadvantaged person eat nothing but wild fruits (masuku) or mushrooms?
F. Unmet needs 1. Does the disadvantaged person have any unmet needs at the moment? Ask them to say what. (Unmet needs are those things which the person needs but cannot afford to buy). Tick if the answer is yes. DO NOT READ OUT the options.
Food !1 School fees !1 Soap !1 School uniform !1
Blankets !1 Stationery !1 Clothing !1 Paying for health treatment !1
Shoes !1 Medicines !1 Metal pot !1
Other, please specify……………………………………………………………………….. ……………………………………………………………………………………………….…………………
Section 3: The main carer A. About the carer 1. How many people are actively involved in looking after the disadvantaged person? (Write zero if none; if the answer is none, go to Section 4).
2. Does one person spend more time than the others caring? Yes !1 No !2 If the answer is No, go to Section 4. If the answer is Yes, we will call this person the ‘main carer’. Ask the main carer to respond to the following questions

Final impact survey questionnaire IN-KIND draft1.doc Last saved: 31 October 2002 Page 7
B. Income and savings of the main carer 1. Does he/she have any income of his/her own on a regular basis? Yes ! 1 No ! 2 2. Does he/she have any savings in the following:
Business ! 1 Livestock ! 4 Cash ! 2 Other ! 5
Loan ! 3 No savings ! 6
C. Unmet needs of disadvantaged person (view of main carer) 1. Does the disadvantaged person have any unmet needs at the moment? Ask the main carer to say what. (Unmet needs are those things which the person needs but cannot afford to buy). Tick if the answer is yes. DO NOT READ OUT the options.
Food !1 School fees !1 Soap !1 School uniform !1
Blankets !1 Stationery !1 Clothing !1 Paying for health treatment !1
Shoes !1 Medicines !1 Metal pot !1
Other, please specify………………………………………………………………………..
………………………………………………………………………………………………...
2. In the carer’s view, how much has the disadvantaged person benefited from the transfer? Not at all? !1 A little? !2 Quite a bit? !3 A lot? !4 Not possible to tell !5
3. In the carer’s view, have other members of the household directly benefited from the transfer?
Not at all? !1 A little? !2 Quite a bit? !3 A lot? !4 Not possible to tell !5

Final impact survey questionnaire IN-KIND draft1.doc Last saved: 31 October 2002 Page 8
Section 4: Consumption Ask these questions to the person who makes purchases for the household or someone who knows about what is purchased. 1. Has the household purchased any of the following items in the last two weeks? Please tick the column marked DP if the item was for the disadvantaged person only.
DP DP Beans !1 !2 School fees !1 !2
Groundnuts !1 !2 School uniform !1 !2 Beer/alcohol !1 !2 Pens, exercise books, etc !1 !2
Chicken/meat !1 !2 Paying for health treatment !1 !2 Fish !1 !2 Medicines !1 !2
Milling !1 !2 Livestock !1 !2 Pulses !1 !2 Seed !1 !2
Rice !1 !2 Fertiliser !1 !2 Bread !1 !2 Farm implements/tools !1 !2
Salt !1 !2 Paraffin !1 !2
Soap !1 !2 Thatch !1 !2 Maize !1 !2 Travel/transport !1 !2 Sugar !1 !2 Festivities !1 !2
Tea !1 !2 Funerals !1 !2 Vegetables !1 !2 Giving to church/mosque !1 !2
Blankets !1 !2 Bicycle !1 !2 Clothing !1 !2 Radio !1 !2
Shoes !1 !2 Kitchen utensils !1 !2 Cooking oil !1 !2 Furniture !1 !2
Matches !1 !2 Iron sheets !1 !2
Section 5: The hungry period (Jan-Feb 2002) Ask the head of the household or another responsible adult. Explain that the following questions apply to the period after last Christmas and before the last harvest. 1. During the period after last Christmas and before the last harvest, when you received the transfers how many weeks did they last?
Weeks
2. During this period… a) Did your household receive any food through ganyu? Yes ! 1 No ! 2 b) Did your household get any food from friends or relatives? Yes ! 1 No ! 2 c) Did your household give any food to your relatives or to friends? Yes ! 1 No ! 2
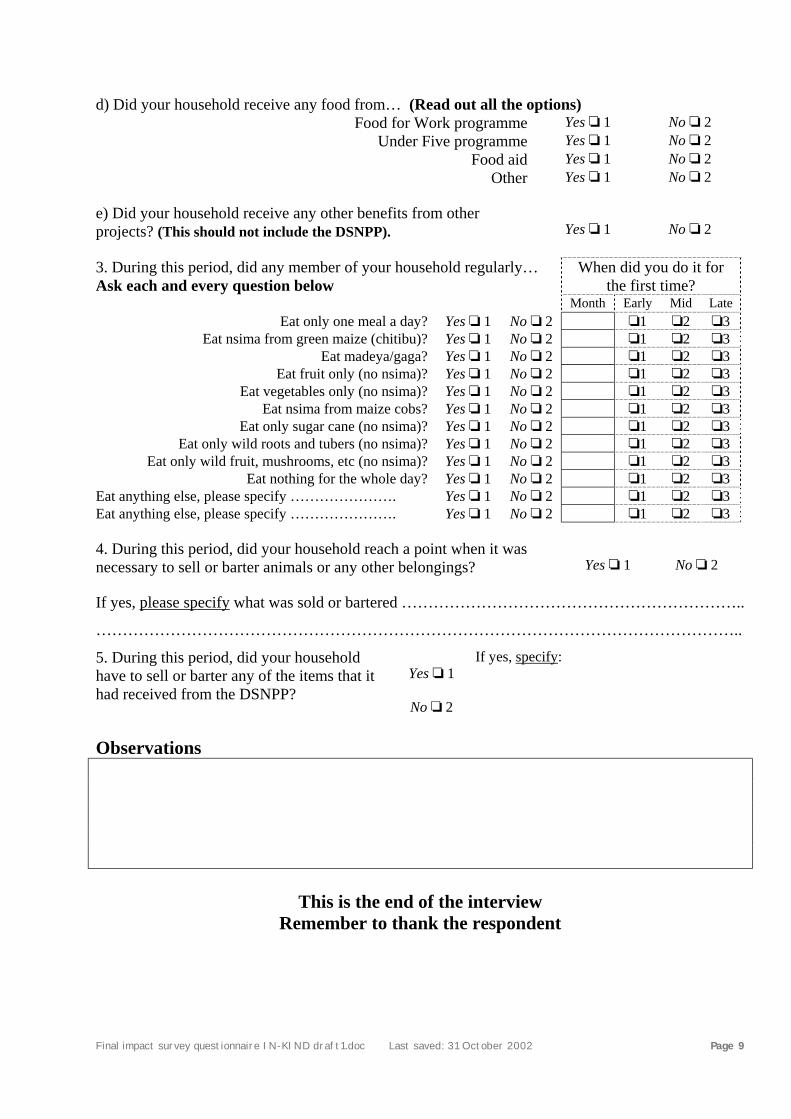
Final impact survey questionnaire IN-KIND draft1.doc Last saved: 31 October 2002 Page 9
d) Did your household receive any food from… (Read out all the options) Food for Work programme Yes ! 1 No ! 2
Under Five programme Yes ! 1 No ! 2 Food aid Yes ! 1 No ! 2
Other Yes ! 1 No ! 2
e) Did your household receive any other benefits from other projects? (This should not include the DSNPP).
Yes ! 1
No ! 2
3. During this period, did any member of your household regularly… Ask each and every question below
When did you do it for the first time?
Month Early Mid Late Eat only one meal a day? Yes ! 1 No ! 2 !1 !2 !3
Eat nsima from green maize (chitibu)? Yes ! 1 No ! 2 !1 !2 !3 Eat madeya/gaga? Yes ! 1 No ! 2 !1 !2 !3
Eat fruit only (no nsima)? Yes ! 1 No ! 2 !1 !2 !3 Eat vegetables only (no nsima)? Yes ! 1 No ! 2 !1 !2 !3
Eat nsima from maize cobs? Yes ! 1 No ! 2 !1 !2 !3 Eat only sugar cane (no nsima)? Yes ! 1 No ! 2 !1 !2 !3
Eat only wild roots and tubers (no nsima)? Yes ! 1 No ! 2 !1 !2 !3 Eat only wild fruit, mushrooms, etc (no nsima)? Yes ! 1 No ! 2 !1 !2 !3
Eat nothing for the whole day? Yes ! 1 No ! 2 !1 !2 !3 Eat anything else, please specify …………………. Yes ! 1 No ! 2 !1 !2 !3 Eat anything else, please specify …………………. Yes ! 1 No ! 2 !1 !2 !3 4. During this period, did your household reach a point when it was necessary to sell or barter animals or any other belongings?
Yes ! 1
No ! 2
If yes, please specify what was sold or bartered ………………………………………………………..
…………………………………………………………………………………………………………..
Yes ! 1
5. During this period, did your household have to sell or barter any of the items that it had received from the DSNPP?
No ! 2
If yes, specify:
Observations
This is the end of the interview
Remember to thank the respondent

Final impact survey questionnaire CASH draft1.doc Last saved: 31 October 2002 Page 1
SAFETY NETS PILOT PROJECT CONCERN UNIVERSAL
FINAL IMPACT SURVEY - CASH
CONFIDENTIAL
All the information collected in this questionnaire will be completely confidential and will not be used to assess whether the respondent should receive this or other benefits.
Identification panel CODES
VILLAGE NAME INDIVIDUAL NAME
HOUSEHOLD Control panel
Name Signature Date Interviewer Supervisor Data entry clerk
Section 1: Household information Ask the head of the household or another responsible adult. A. About the respondent 1. Sex…………………………………..………………………… Male !1 Female !2
Young adult !2 Middle aged !3
2. Age If age is not known, tick the appropriate box according to your own judgement
Years
Elderly !4 B. Household characteristics 1. Size a) Household size (total number of people including children) b) Number of economically active people in the household 2. Sources of income
Sale of crops ! 1 Remittances ! 2 Small business ! 3 Pension ! 4 Artisan ! 5 Ganyu wages ! 6
a) What sources of cash income does your household have? Read out all options so that the respondent is aware of them. Tick as many as necessary.
Sale of livestock & livestock products
! 6 Salary from employment
! 8

Final impact survey questionnaire CASH draft1.doc Last saved: 31 October 2002 Page 2
Main staple food crop (last harvest)………………... Main cash crop* (last harvest)……………………… Sale of dimba crop (last month)….………………… Small business (last month)………………………… Artisan (last month)………………………………… Sale of livestock and livestock products (last month) Remittances (last month)…………………………… Pension (last month)………………………………... Ganyu wages (last weeding period)….…………….. Salary from employment (last month)……………… Rent (last month) ….………………………………. Sale of fish (last month)……………………………..
b) Roughly how much income did your household get from these sources in the time period mentioned (MK)? Read out all the options. Write zero if none.
Sale of charcoal and firewood (last month)………… Sale of grass (last month) Sale of mushrooms/forest products (last month) Sale of mice (last month) Sale of fruit (last month) Other income (last month)…………………………. * Explain that we are talking not only about tobacco but about any crop which is sold for cash. Eg. Soya, tomatoes, etc. 3. Assets a) Housing
Type of wall
Type of roof
Type of floor
No. of rooms
Kitchen Pit latrine Bath shelter
Yes ! 1 No ! 2
Yes ! 1 No ! 2
Yes ! 1 No ! 2
Codes: Type of wall Type of roof Type of floor Mud 1 Grass only 1 Mud 1 Unburnt brick 2 Iron sheet 2 Cement 2 Burnt brick 3 Tiles 3 Tiles 3 Cement blocks 4 Plastic sheeting & grass 4 Only some rooms cemented/tiled 4 b) How many of the following animals does your household own? (Read out each type of animal in the list and note down the number against it. Put zero for none).
Type Number Type Number Chicken Pigs
Doves Goats Ducks Donkeys
Guinea fowls Cattle Rabbits Oxen (pulling/cultivating)
Guinea Pigs

Final impact survey questionnaire CASH draft1.doc Last saved: 31 October 2002 Page 3
c) Does your household have the following?
Plough/Ridger Yes !1 No !2 Radio Yes !1 No !2 Bicycle Yes !1 No !2 Ox-cart Yes !1 No !2
Metal cooking pots Yes !1 No !2 Mats Yes !1 No !2 d) Does your household have any savings in the following:
Business ! 1 Livestock ! 4 Cash ! 2 Other ! 5
Loan ! 3 No savings ! 6
C. Economic activities 1. Ask about the activities in which members of the household are involved. Make sure that ALL household members are taken into account. Probe for all likely activities.
Code of household member involved (tick if involved)
Activity Activity code
1 2 3 4 5 ! ! ! ! ! ! ! ! ! ! ! ! ! ! ! ! ! ! ! ! ! ! ! ! ! ! ! ! ! ! ! ! ! ! ! ! ! ! ! ! ! ! ! ! ! Activity codes: Selling
firewood/charcoal 11 Selling fruits or vegetables 17
Farming 1 Making mats/baskets 6 Selling grass 12 Making pottery 18
Ganyu for cash 2 Road building 7 Hawking 13 Tin smithing 19
Ganyu for food 3
Other building work (houses, schools etc) 8 Selling paraffin 14
Repairing bicycles 20
Brewing beer 4 Carpentry 9 Selling livestock 15 Repairing radios 21 Making fritters 5 Making bricks 10 Selling fish 16 Repairing shoes 22 Baking 23 Sewing/knitting 24 Traditional healer 25 TBA 26 Codes for household members: Disadvantaged person 1 Main carer 2 Other: adult - male 3 Other: adult - female 4 Other: child under 16 5 Activity code 2. Was any of the activities developed as a result of receiving the DSNPP transfers? Write zero in all boxes if none.

Final impact survey questionnaire CASH draft1.doc Last saved: 31 October 2002 Page 4
3. If the household engages in farming, ask the following: a). How much land did your household cultivate last season (2001-02) in total?
Acres b). How many 50-kg bags of maize did your household produce in the 2001-02 season? If respondent mentions pails, baskets etc., convert to 50-kg bags.
50-kg bags
D. Receipt and use of the benefit 1. Has your household received any cash benefit in the last 4 weeks? Yes !1 No !2
If NO, go to Section 2. If YES, answer the following questions: 2. How much cash did your household receive at this time? (Write –99 if respondent does not know how much cash was received)
MK
Household member code 3. Who keeps the cash? 4. Who decides what to buy with it? 5. Who actually goes to the shop to make purchases?
Household member codes:
Disadvantaged person 1 Other: adult 3 Carer 2 Other: child (under 16) 4
6. Were the people doing the shopping in the last 4 weeks….? Male !1 Female !2 Both !3
7. How far did they have to travel to the nearest shop or market to spend the cash benefit? km
8. What problems did they find with the cash benefit over the last 4 weeks, if any? (Tick more than one if necessary).
None !1 I couldn’t find the goods I wanted !2
The cash was stolen !3
Other, specify:……………………………………...……………………………… ………………………………………………………………………...
Code(s)

Final impact survey questionnaire CASH draft1.doc Last saved: 31 October 2002 Page 5
Section 2: The disadvantaged person I want to talk to …… (name of listed beneficiary).
* If the disadvantaged person is unable to reply because of age (too young) or mental ability, ask the carer to respond to the following questions. If the household head (or other responsible adult) is in fact the disadvantaged person or the carer, the interview may continue with him/her. The remainder of this section, is about the current disadvantaged person (whether listed or not). Even if the person listed is a carer, this section refers to the disadvantaged person. A. Individual characteristics of disadvantaged person 1. Sex…………………………………..………………………… Male !1 Female !2 Child (under 16) !1
Young adult !2 Middle aged !3
2. Age If age is not known, tick the appropriate box according
to your own judgement
years
Elderly !4 3. Marital status
Married !1 Single (never married) !2
Divorced/separated !3 Widow/widower !4
None !1
Primary Standard 1-5 !2 Primary Standard 6-8 !3
Secondary !4 Tertiary/University !5
4. Educational level
Adult literacy !6
Carpentry !1 Sewing and knitting !7 Builder !2 Baking !8
Basket weaving !3 Pottery making !9 Tinsmith !4 Beer brewing !10
TBA !5 Bicycle/radio repairer !11
5. Skills
Shoe repairer !6 None !12
Other , specify……………………….…………………………… !13
1. Are you talking to the listed beneficiary? Yes !1 No !2 2. If “yes”, is the listed beneficiary… A disadvantaged person !1 A carer !2 3. If “no” in Qn 1, give reason: Talking to the carer* !1 New
beneficiary !2 4. If there is a new beneficiary, is he/she…? A disadvantaged person !1 A carer !2

Final impact survey questionnaire CASH draft1.doc Last saved: 31 October 2002 Page 6
C. Assets of disadvantaged person 1. Does the disadvantaged person have any of the following? (as his/her personal belonging)
Mat !1 Pail/tin !9
Bed !2 Basket (dengu) !10
Blanket !3 Pounding mortar !11
Plate(s) !4 Radio !12
Cup (s) !5 Bicycle !13
Chair(s) !6 Chitenje !14
Table !7 Jacket !15
Metal pots !8 Shoes !16
D. Income and savings of disadvantaged person 1. Does he/she have any income of his/her own on a regular basis? Yes ! 1 No ! 2 2. Does he/she have any savings in the following:
Business ! 1 Livestock ! 4 Cash ! 2 Other ! 5
Loan ! 3 No savings ! 6
E. Meals 1. How many times did the disadvantaged person eat nsima yesterday?
2. Other than nsima, how many time did the disadvantaged person eat yesterday? (Eg. Breakfast, substantial snacks, dinner, etc. without nsima)
3. In the last week, how many times in total did the disadvantaged person eat nsima with meat, chicken or fish?
4. In the last week, how many times in total did the disadvantaged person eat nsima with beans?
5. In the last week, how many times in total did the disadvantaged person eat nothing but vegetables or leaves?
6. In the last week, how many times in total did the disadvantaged person eat nothing but wild fruits (masuku) or mushrooms?

Final impact survey questionnaire CASH draft1.doc Last saved: 31 October 2002 Page 7
F. Unmet needs 1. Does the disadvantaged person have any unmet needs at the moment? Ask them to say what. (Unmet needs are those things which the person needs but cannot afford to buy). Tick if the answer is yes. DO NOT READ OUT the options.
Food !1 School fees !1 Soap !1 School uniform !1
Blankets !1 Stationery !1 Clothing !1 Paying for health treatment !1
Shoes !1 Medicines !1 Metal pot !1
Other, please specify………………………………………………………………………..
Section 3: The main carer A. About the carer 1. How many people are actively involved in looking after the disadvantaged person? (Write zero if none; if the answer is none, go to Section 4).
2. Does one person spend more time than the others caring? Yes !1 No !2 If the answer is No, go to Section 4. If the answer is Yes, we will call this person the ‘main carer’. Ask the main carer to respond to the following questions
B. Income and savings of the main carer 1. Does he/she have any income of his/her own on a regular basis? Yes ! 1 No ! 2 2. Does he/she have any savings in the following:
Business ! 1 Livestock ! 4 Cash ! 2 Other ! 5
Loan ! 3 No savings ! 6
C. Unmet needs of disadvantaged person (view of main carer) 1. Does the disadvantaged person have any unmet needs at the moment? Ask the main carer to say what. (Unmet needs are those things which the person needs but cannot afford to buy). Tick if the answer is yes. DO NOT READ OUT the options.
Food !1 School fees !1 Soap !1 School uniform !1
Blankets !1 Stationery !1 Clothing !1 Paying for health treatment !1
Shoes !1 Medicines !1 Metal pot !1
Other, please specify………………………………………………………………………..
………………………………………………………………………………………………...

Final impact survey questionnaire CASH draft1.doc Last saved: 31 October 2002 Page 8
2. In the carer’s view, how much has the disadvantaged person benefited from the transfer? Not at all? !1 A little? !2 Quite a bit? !3 A lot? !4 Not possible to tell !5
3. In the carer’s view, have other members of the household directly benefited from the transfer?
Not at all? !1 A little? !2 Quite a bit? !3 A lot? !4 Not possible to tell !5
Section 4: Consumption Ask these questions to the person who makes purchases for the household or someone who knows about what is purchased. 1. Has the household purchased any of the following items in the last two weeks? Please tick the column marked DP if the item was for the disadvantaged person only.
DP DP Beans !1 !2 School fees !1 !2
Groundnuts !1 !2 School uniform !1 !2 Beer/alcohol !1 !2 Pens, exercise books, etc !1 !2
Chicken/meat !1 !2 Paying for health treatment !1 !2 Fish !1 !2 Medicines !1 !2
Milling !1 !2 Livestock !1 !2 Pulses !1 !2 Seed !1 !2
Rice !1 !2 Fertiliser !1 !2 Bread !1 !2 Farm implements/tools !1 !2
Salt !1 !2 Paraffin !1 !2
Soap !1 !2 Thatch !1 !2 Maize !1 !2 Travel/transport !1 !2 Sugar !1 !2 Festivities !1 !2
Tea !1 !2 Funerals !1 !2 Vegetables !1 !2 Giving to church/mosque !1 !2
Blankets !1 !2 Bicycle !1 !2 Clothing !1 !2 Radio !1 !2
Shoes !1 !2 Kitchen utensils !1 !2 Cooking oil !1 !2 Furniture !1 !2
Matches !1 !2 Iron sheets !1 !2 2. At any time in the last year, has any member of the household saved cash from the DSNPP to buy the following…? (Tick ‘yes’ even if the item has not yet been received).
Shoes !1 Kitchen utensils (incl. pots) !1 Blankets !1 Iron sheets !1 Clothes !1 Seed or fertiliser !1

Final impact survey questionnaire CASH draft1.doc Last saved: 31 October 2002 Page 9
Section 5: The hungry period (Jan-Feb 2002) Ask the head of the household or another responsible adult. Explain that the following questions apply to the period after last Christmas and before the last harvest. 1. During the period after last Christmas and before the last harvest, when you received the transfers how many weeks did they last? (i.e. for how long did you feel the benefit?)
Weeks
2. During this period… a) Did your household receive any food through ganyu? Yes ! 1 No ! 2 b) Did your household get any food from friends or relatives? Yes ! 1 No ! 2 c) Did your household give any food to your relatives or to friends? Yes ! 1 No ! 2 d) Did your household receive any food from… (Read out all the options)
Food for Work programme Yes ! 1 No ! 2 Under Five programme Yes ! 1 No ! 2
Food aid Yes ! 1 No ! 2 Other Yes ! 1 No ! 2
e) Did your household receive any other benefits from other projects? (This should not include the DSNPP).
Yes ! 1
No ! 2
3. During this period, did any member of your household regularly… Ask each and every question below
When did you do it for the first time?
Month Early Mid Late Eat only one meal a day? Yes ! 1 No ! 2 !1 !2 !3
Eat nsima from green maize (chitibu)? Yes ! 1 No ! 2 !1 !2 !3 Eat madeya/gaga? Yes ! 1 No ! 2 !1 !2 !3
Eat fruit only (no nsima)? Yes ! 1 No ! 2 !1 !2 !3 Eat vegetables only (no nsima)? Yes ! 1 No ! 2 !1 !2 !3
Eat nsima from maize cobs? Yes ! 1 No ! 2 !1 !2 !3 Eat only sugar cane (no nsima)? Yes ! 1 No ! 2 !1 !2 !3
Eat only wild roots and tubers (no nsima)? Yes ! 1 No ! 2 !1 !2 !3 Eat only wild fruit, mushrooms, etc (no nsima)? Yes ! 1 No ! 2 !1 !2 !3
Eat nothing for the whole day? Yes ! 1 No ! 2 !1 !2 !3 Eat anything else, please specify …………………. Yes ! 1 No ! 2 !1 !2 !3 Eat anything else, please specify …………………. Yes ! 1 No ! 2 !1 !2 !3 4. During this period, did your household reach a point when it was necessary to sell or barter animals or any other belongings?
Yes ! 1
No ! 2
If yes, please specify what was sold or bartered ………………………………………………………..
…………………………………………………………………………………………………………..

Final impact survey questionnaire CASH draft1.doc Last saved: 31 October 2002 Page 10
Observations
This is the end of the interview
Remember to thank the respondent

105
Appendix 4a: Beneficiary eating patterns (baseline and final impact surveys)
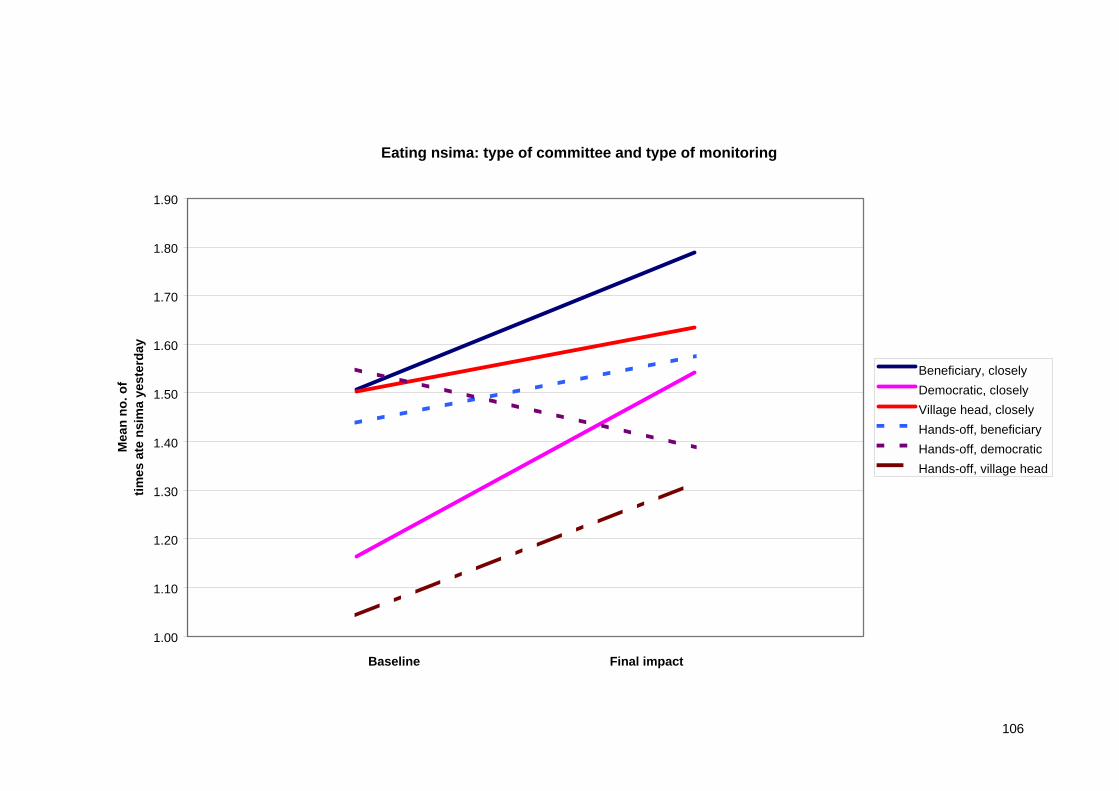
106
Eating nsima: type of committee and type of monitoring
1.00
1.10
1.20
1.30
1.40
1.50
1.60
1.70
1.80
1.90
Baseline Final impact
Mea
n no
. of
times
ate
nsi
ma
yest
erda
y
Beneficiary, closely
Democratic, closely
Village head, closely
Hands-off, beneficiary
Hands-off, democratic
Hands-off, village head

107
Eating protein: type of committee
0.00
0.10
0.20
0.30
0.40
0.50
0.60
0.70
0.80
0.90
1.00
Baseline Final impact
Mea
n no
. of t
imes
ate
pro
tein
last
wee
k
Beneficiary
Democratic
Village head

108
Eating protein: type of monitoring
0.00
0.10
0.20
0.30
0.40
0.50
0.60
0.70
0.80
0.90
1.00
Baseline Final impact
Mea
n no
. of t
imes
ate
pro
tein
last
wee
k
Closely monitored
Hands-off

109
Eating protein: type of transfer
0.0
0.2
0.4
0.6
0.8
1.0
1.2
Baseline Final impact
Mea
n no
. of t
imes
ate
pro
tein
last
wee
k
Cash
Vouchers
In-kind

110
Eating snacks: cash and type of committee
0
0.1
0.2
0.3
0.4
0.5
0.6
0.7
0.8
0.9
Baseline Final impact
Mea
n no
. of t
imes
ate
sna
cks
yest
erda
y
Beneficiary
Democratic
VH

111
Eating snacks: vouchers and type of committee
0
0.1
0.2
0.3
0.4
0.5
0.6
0.7
0.8
0.9
Baseline Final impact
Mea
n no
. of t
imes
ate
sna
cks
yest
erda
y
Beneficiary
Democratic
VH

112
Eating snacks: in-kind transfers and type of committee
0
0.05
0.1
0.15
0.2
0.25
0.3
0.35
0.4
0.45
0.5
Baseline Final impact
Mea
n no
. of t
imes
ate
sna
cks
yest
erda
y
Beneficiary
Democratic
VH

113
Appendix 4b: Beneficiary eating patterns (all surveys)

114
��������������������������������������������������������������������������������������������������������������������������������������������������������������������������������������������������������������
����������������������������������������������������������������������������������������������������������������������������������������������������������
������������������������������������������������������������������������������������������������ ���������������������������������������������������������������������������������������������������������������������������������������������������������������������������������������������
����������������������������������������������������������������������������������������������������������������������������� �������������������������������������������������������������������������������������������������������������������������������������������������������������������������������������������������������������������������������������������������������
����������������������������������������������������������������������������������������������������������������������������������������������������������������������������������������������������������������������������������������������������������
���������������������������������������������������������������������������������������������������������������������������������������������������������������������������������������������������������������������������������������������������������������������������������������������������������
��������������������������������������������������������������������������������������������������������������������������������������������������������������������������������������
��������������������������������������������������������������������������������������������������������������������������������������������������������������������������������������������������������������������������������������������������������
��������������������������������������������������������������������������������������������������������������������������������������������������������������������������������������������������������������������������
��������������������������������������������������������������������������������������������������������������������������������������������������������������������������������������������������
Figure 1: Mean no. of times DP ate nsima yesterday
0
0.2
0.4
0.6
0.8
1
1.2
1.4
1.6
1.8
2B
asel
ine
Q1
Q2
Q3
Fin
al im
pact
Bas
elin
e
Q1
Q2
Q3
Fin
al im
pact
Bas
elin
e
Q1
Q2
Q3
Fin
al im
pact
Cash Vouchers In-kind
Mea
n
������ Cash Baseline
�������� Cash Q1
������ Cash Q2
�������� Cash Q3
������ Cash Final impact
Vouchers Baseline
Vouchers Q1
Vouchers Q2
Vouchers Q3
Vouchers Final impact
������ In-kind Baseline
�������� In-kind Q1
������ In-kind Q2
�������� In-kind Q3
������ In-kind Final impact
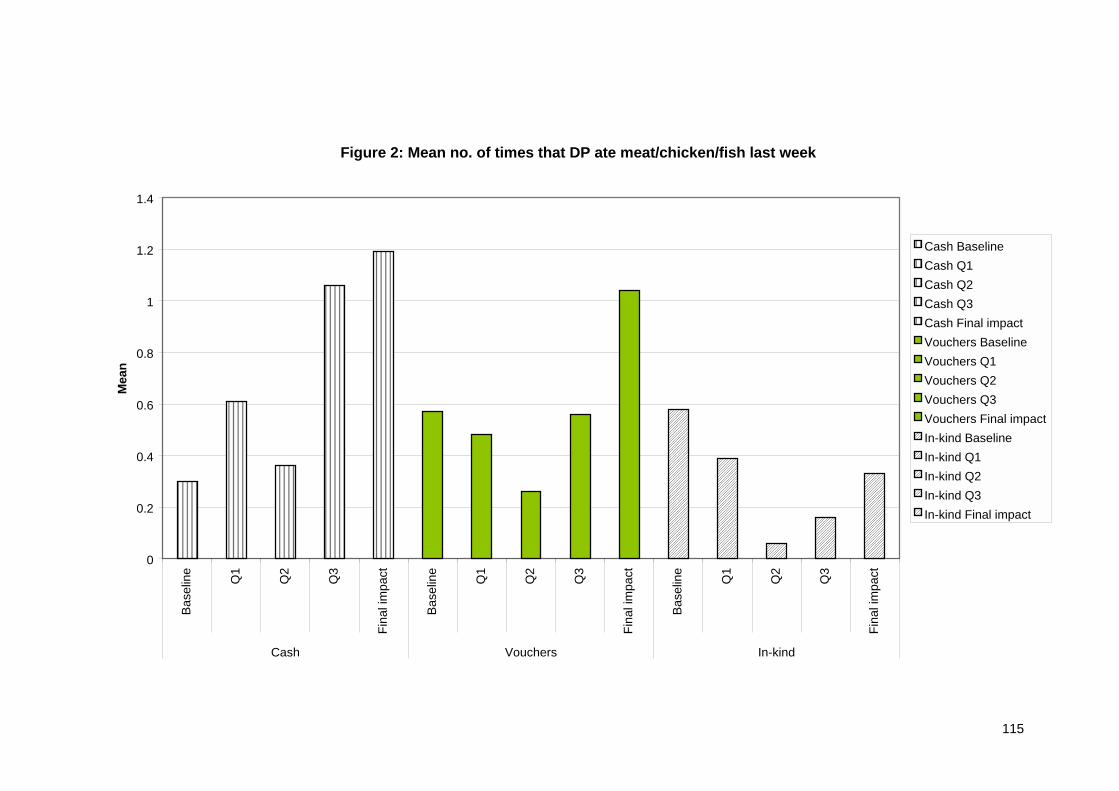
115
��������������������������������������������������������������
��������������������������������������������������������������� ���������������������������������������������������������������������������������������������������������������������������
�������������������������������������� �������������������������������������������������������������������������
������������������������������������������������������������������������������������������������������������������������������������������������������������������������������������������������������������������������
��������������������������������������������������������������������������������������������������������������������������������������������������������������������������������������������������������������������������������������������������
����������������������������������������������������������������������������������������������������������������������
����������������������������������������� �������������������������������������������������������������������������������
��������������
����������������������������������
��������������������������������������������������������������������
Figure 2: Mean no. of times that DP ate meat/chicken/fish last week
0
0.2
0.4
0.6
0.8
1
1.2
1.4B
asel
ine
Q1
Q2
Q3
Fin
al im
pact
Bas
elin
e
Q1
Q2
Q3
Fin
al im
pact
Bas
elin
e
Q1
Q2
Q3
Fin
al im
pact
Cash Vouchers In-kind
Mea
n
������ Cash Baseline�������� Cash Q1
������ Cash Q2�������� Cash Q3
������ Cash Final impact
Vouchers Baseline
Vouchers Q1
Vouchers Q2
Vouchers Q3
Vouchers Final impact
������ In-kind Baseline�������� In-kind Q1
������ In-kind Q2�������� In-kind Q3
������ In-kind Final impact

116
������������������������������������������������������������������������������������������������������������������������������������������������
��������������������������������������������������������������������������������������������������������������������������������������
��������������������������������������������������������������������������������������������������������������������������
��������������������������������������������������������������������������������������������������������������������������������������������������������������������������������������������������
���������������������������������������������������������������������������������������������������������������������������������������������������������������������������������������������������������������������������������������������������������������������������������������������������������������������������������������������������������������������������������������������������������
����������������������������������������������������������������������������������������������������������������������������������������������������������������������������������
����������������������������������������������
������������������������ ���������������������������������������������
������������������������������������������������������������������������������������������������������
��������������������������������������������������������������������������������������������������������������������������������
Figure 3: Mean no. of times that DP ate 'snack' yesterday
0
0.1
0.2
0.3
0.4
0.5
0.6
0.7
0.8
0.9B
asel
ine
Q1
Q2
Q3
Fin
al im
pact
Bas
elin
e
Q1
Q2
Q3
Fin
al im
pact
Bas
elin
e
Q1
Q2
Q3
Fin
al im
pact
Cash Vouchers In-kind
Mea
n
�������� Cash Baseline
�������� Cash Q1�������� Cash Q2�������� Cash Q3
�������� Cash Final impact
Vouchers Baseline
Vouchers Q1
Vouchers Q2
Vouchers Q3
Vouchers Final impact
�������� In-kind Baseline
�������� In-kind Q1
�������� In-kind Q2����
���� In-kind Q3�������� In-kind Final impact

117
����������������������������������������������������������
��������������������������������������������������������������������
������������� �����������������������
������������������������������������������������������������������������������������� �����������������������������������������������������������������������������������������������������������������������������������������������������������������������
����������������������������������������������������������������������������������������������
������������������������������������������������������������������������������������������������������������������
������������������������������������������������������������������������
��������������������
������������������������������������������������������������������������������������������������������������
����������������������������������������������������
Figure 4: Mean no. of times that DP ate beans last week
0
0.5
1
1.5
2
2.5
3B
asel
ine
Q1
Q2
Q3
Fin
al im
pact
Bas
elin
e
Q1
Q2
Q3
Fin
al im
pact
Bas
elin
e
Q1
Q2
Q3
Fin
al im
pact
Cash Vouchers In-kind
Mea
n
������ Cash Baseline�������� Cash Q1
������ Cash Q2�������� Cash Q3
������ Cash Final impact
Vouchers Baseline
Vouchers Q1
Vouchers Q2
Vouchers Q3
Vouchers Final impact
������ In-kind Baseline�������� In-kind Q1
������ In-kind Q2�������� In-kind Q3
������ In-kind Final impact

118
������������������������������
��������������������������������������
������������������������������������������������������������������������������������������������������������������������������������������������ ������ ����
���������������������������������������������������
����������������������� �������������������������������������������
���������������������������������������������������������������������������������������������������������������������������������������������������������������������������������������������������������������������������������������������������������������������������������������������������������������������������������������������������������
����������������������������
������������
Figure 5: No. of times that DP ate nothing but leaves/vegetables last week
0
1
2
3
4
5
6
Bas
elin
e
Q1
Q2
Q3
Fin
al im
pact
Bas
elin
e
Q1
Q2
Q3
Fin
al im
pact
Bas
elin
e
Q1
Q2
Q3
Fin
al im
pact
Cash Vouchers In-kind
Mea
n
���Cash Baseline����Cash Q1����Cash Q2
����Cash Q3����Cash Final impact
Vouchers Baseline
Vouchers Q1
Vouchers Q2
Vouchers Q3
Vouchers Final impact
����In-kind Baseline����In-kind Q1
����In-kind Q2����In-kind Q3
����In-kind Final impact

119
Appendix 5a: Unmet needs findings (baseline and final impact surveys)

120
Reduction in unmet needs (soap) by type of transfer
0%
5%
10%
15%
20%
25%
30%
35%
40%
Baseline Final impact
Mea
n %
of D
Ps w
ith u
nmet
nee
d
Cash
Vouchers
In-kind
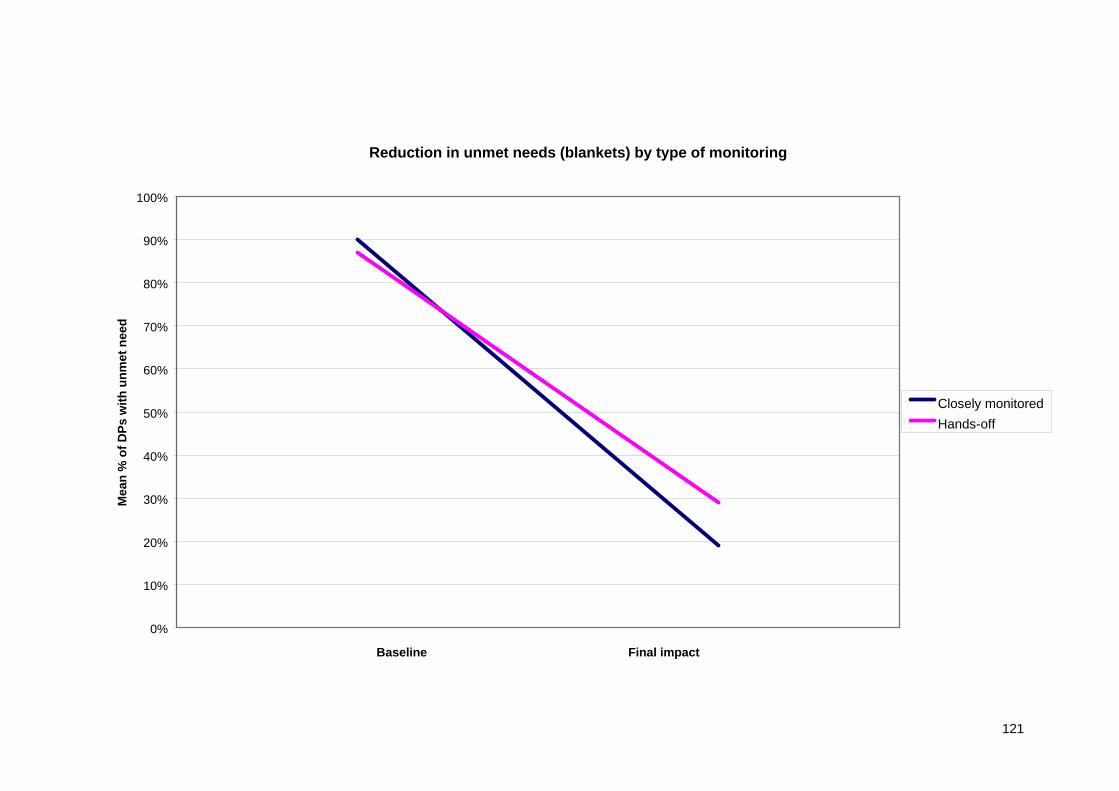
121
Reduction in unmet needs (blankets) by type of monitoring
0%
10%
20%
30%
40%
50%
60%
70%
80%
90%
100%
Baseline Final impact
Mea
n %
of D
Ps w
ith u
nmet
nee
d
Closely monitored
Hands-off

122
Reduction in unmet needs (blankets) by type of transfer
0%
10%
20%
30%
40%
50%
60%
70%
80%
90%
100%
Baseline Final impact
Mea
n %
of D
Ps w
ith u
nmet
nee
d
Cash
Vouchers
In-kind

123
Reduction in unmet needs (clothing) by type of transfer
0%
10%
20%
30%
40%
50%
60%
70%
80%
90%
100%
Baseline Final impact
Mea
n %
of D
Ps w
ith u
nmet
nee
d
Cash
Vouchers
In-kind
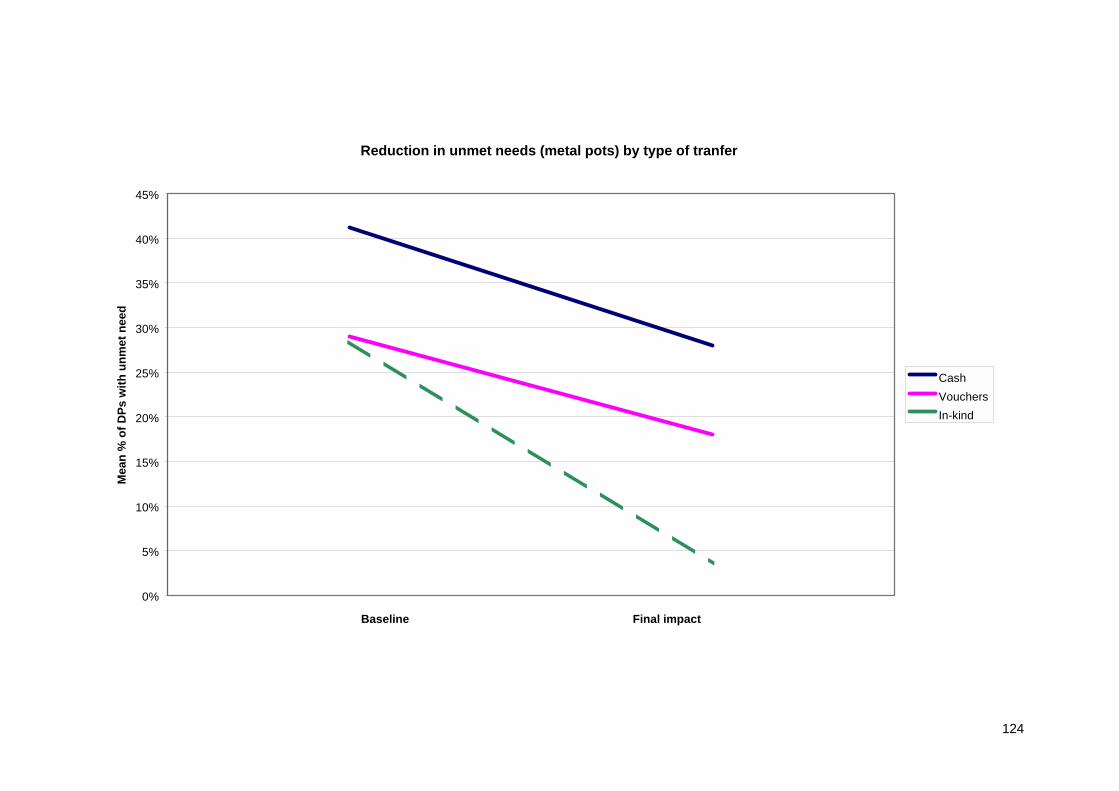
124
Reduction in unmet needs (metal pots) by type of tranfer
0%
5%
10%
15%
20%
25%
30%
35%
40%
45%
Baseline Final impact
Mea
n %
of D
Ps w
ith u
nmet
nee
d
Cash
Vouchers
In-kind

Appendix 5b: Unmet needs findings (all surveys)
Unmet needs - Food
Type of transfer
VouchersGoodsCash
%>
0 fo
r F
ood
100
80
60
40
20
0
Quarter
Baseline
Q1
Q2
Q3
Final
Unmet needs - Soap
Type of transfer
VouchersGoodsCash
%>
0 fo
r S
oap
100
90
80
70
60
50
40
30
20
10
0
Quarter
Baseline
Q1
Q2
Q3
Final

126
Unmet needs - Clothing
Type of transfer
VouchersGoodsCash
%>
0 fo
r C
loth
ing
100
90
80
70
60
50
40
30
Quarter
Baseline
Q1
Q2
Q3
Final
Unmet needs - Shoes
Type of transfer
VouchersGoodsCash
%>
0 fo
r S
hoes
100
90
80
70
60
50
40
30
20
10
0
Quarter
Baseline
Q1
Q2
Q3
Final

127
Unmet needs - Blankets
Type of transfer
VouchersGoodsCash
%>
0 fo
r B
lank
ets
100
80
60
40
20
0
Quarter
Baseline
Q1
Q2
Q3
Final
Unmet needs - Metal pots
Type of transfer
VouchersGoodsCash
%>
0 fo
r M
etal
pot
100
90
80
70
60
50
40
30
20
10
0
Quarter
Baseline
Q1
Q2
Q3
Final

128
Appendix 6: Household expenditure (all surveys)
Expenditure on Maize
Type of transfer
VouchersGoodsCash
%>
0 fo
r M
aize
80
60
40
20
0
Quarter
Baseline
Q1
Q2
Q3
Final
Expenditure on Maize Milling
Type of transfer
VouchersGoodsCash
%>
0 fo
r M
illin
g
80
60
40
20
0
Quarter
Baseline
Q1
Q2
Q3
Final

129
Expenditure on Paraffin
Type of transfer
VouchersGoodsCash
%>
0 fo
r P
araf
fin60
50
40
30
20
10
0
Quarter
Baseline
Q1
Q2
Q3
Final
Expenditure on Vegetables
Type of transfer
VouchersGoodsCash
%>
0 fo
r V
eget
able
s
60
50
40
30
20
10
0
Quarter
Baseline
Q1
Q2
Q3
Final

130
Expenditure on Sugar
Type of transfer
VouchersGoodsCash
%>
0 fo
r S
ugar
70
60
50
40
30
20
10
0
Quarter
Baseline
Q1
Q2
Q3
Final
Expenditure on Soap
Type of transfer
VouchersGoodsCash
%>
0 fo
r S
oap
100
80
60
40
20
0
Quarter
Baseline
Q1
Q2
Q3
Final

131
Expenditure on Salt
Type of transfer
VouchersGoodsCash
%>
0 fo
r S
alt
90
80
70
60
50
40
30
Quarter
Baseline
Q1
Q2
Q3
Final
Expenditure on Matches
Type of transfer
VouchersGoodsCash
%>
0 fo
r M
atch
es
70
60
50
40
30
20
10
Quarter
Baseline
Q1
Q2
Q3
Final

132
Expenditure on Fish
Type of transfer
VouchersGoodsCash
%>
0 fo
r F
ish
60
50
40
30
20
10
0
Quarter
Baseline
Q1
Q2
Q3
Final
Expenditure on Chicken and meat
Type of transfer
VouchersGoodsCash
%>
0 fo
r C
hick
en/m
eat
30
20
10
0
Quarter
Baseline
Q1
Q2
Q3
Final

133
Expenditure on Beans
Type of transfer
VouchersGoodsCash
%>
0 fo
r B
eans
40
30
20
10
0
Quarter
Baseline
Q1
Q2
Q3
Final
Expenditure on Groundnuts
Type of transfer
VouchersGoodsCash
%>
0 fo
r G
roun
d nu
ts
20
10
0
Quarter
Baseline
Q1
Q2
Q3
Final
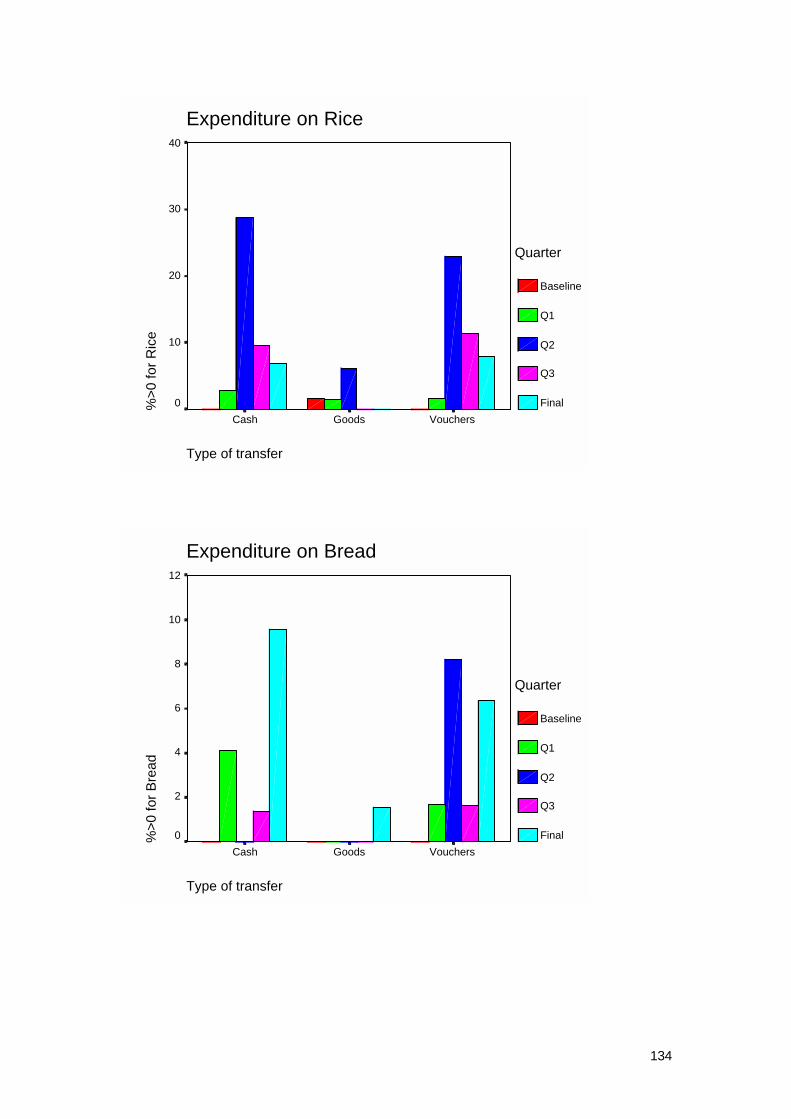
134
Expenditure on Rice
Type of transfer
VouchersGoodsCash
%>
0 fo
r R
ice
40
30
20
10
0
Quarter
Baseline
Q1
Q2
Q3
Final
Expenditure on Bread
Type of transfer
VouchersGoodsCash
%>
0 fo
r B
read
12
10
8
6
4
2
0
Quarter
Baseline
Q1
Q2
Q3
Final

135
Expenditure on Tea
Type of transfer
VouchersGoodsCash
%>
0 fo
r T
ea14
12
10
8
6
4
2
0
Quarter
Baseline
Q1
Q2
Q3
Final
Expenditure on Beer and alcohol
Type of transfer
VouchersGoodsCash
%>
0 fo
r B
eer/
alco
hol
12
10
8
6
4
2
0
Quarter
Baseline
Q1
Q2
Q3
Final

136
Expenditure on Clothing
Type of transfer
VouchersGoodsCash
%>
0 fo
r C
loth
ing
30
20
10
0
Quarter
Baseline
Q1
Q2
Q3
Final
Expenditure on Shoes
Type of transfer
VouchersGoodsCash
%>
0 fo
r S
hoes
12
10
8
6
4
2
0
Quarter
Baseline
Q1
Q2
Q3
Final

137
Expenditure on Cooking oil
Type of transfer
VouchersGoodsCash
%>
0 fo
r C
ooki
ng o
il30
20
10
0
Quarter
Baseline
Q1
Q2
Q3
Final
Expenditure on Blankets
Type of transfer
VouchersGoodsCash
%>
0 fo
r B
lank
ets
14
12
10
8
6
4
2
0
Quarter
Baseline
Q1
Q2
Q3
Final

138
Expenditure on Medicines
Type of transfer
VouchersGoodsCash
%>
0 fo
r M
edic
ines
30
20
10
0
Quarter
Baseline
Q1
Q2
Q3
Final
Expenditure on Pens, exercise books, etc
Type of transfer
VouchersGoodsCash
%>
0 fo
r P
ens,
exe
rcis
e bo
oks,
etc
.
12
10
8
6
4
2
0
Quarter
Baseline
Q1
Q2
Q3
Final
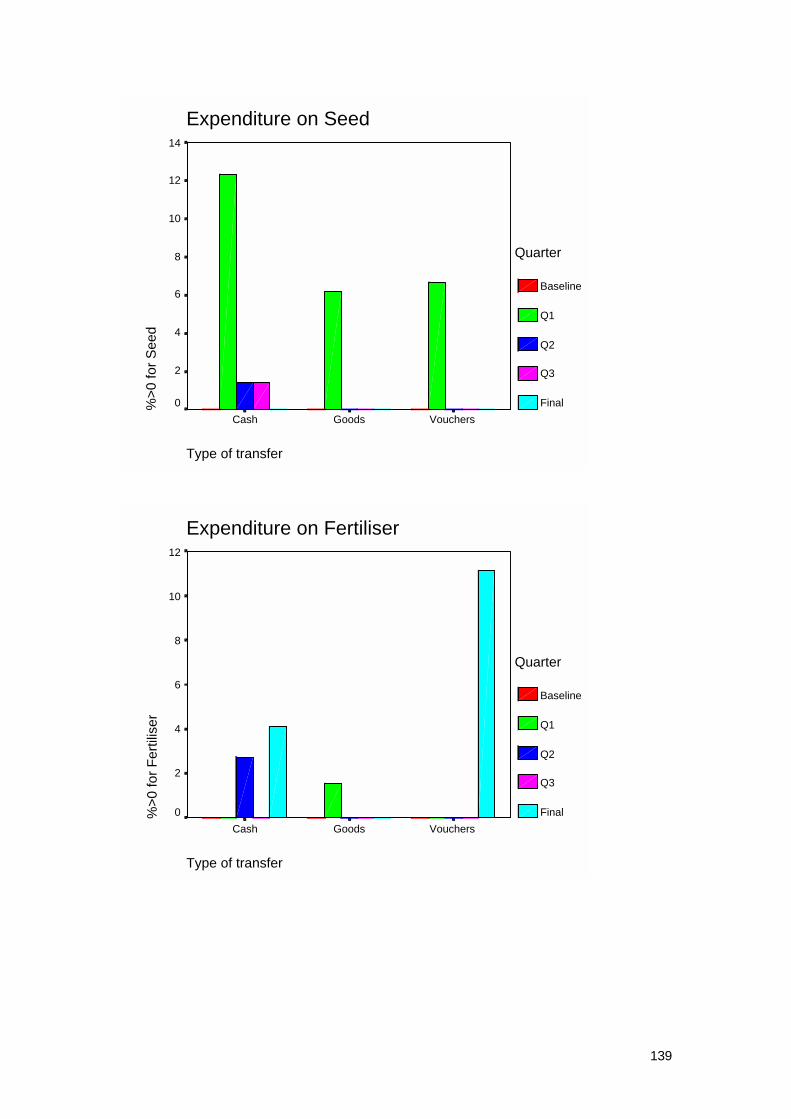
139
Expenditure on Seed
Type of transfer
VouchersGoodsCash
%>
0 fo
r S
eed
14
12
10
8
6
4
2
0
Quarter
Baseline
Q1
Q2
Q3
Final
Expenditure on Fertiliser
Type of transfer
VouchersGoodsCash
%>
0 fo
r F
ertil
iser
12
10
8
6
4
2
0
Quarter
Baseline
Q1
Q2
Q3
Final

140
Expenditure on Funerals
Type of transfer
VouchersGoodsCash
%>
0 fo
r F
uner
als
50
40
30
20
10
0
Quarter
Baseline
Q1
Q2
Q3
Final
Expenditure on Giving to church or mosque
Type of transfer
VouchersGoodsCash
%>
0 fo
r G
ivin
g to
chu
rch/
mos
que
50
40
30
20
10
0
Quarter
Baseline
Q1
Q2
Q3
Final
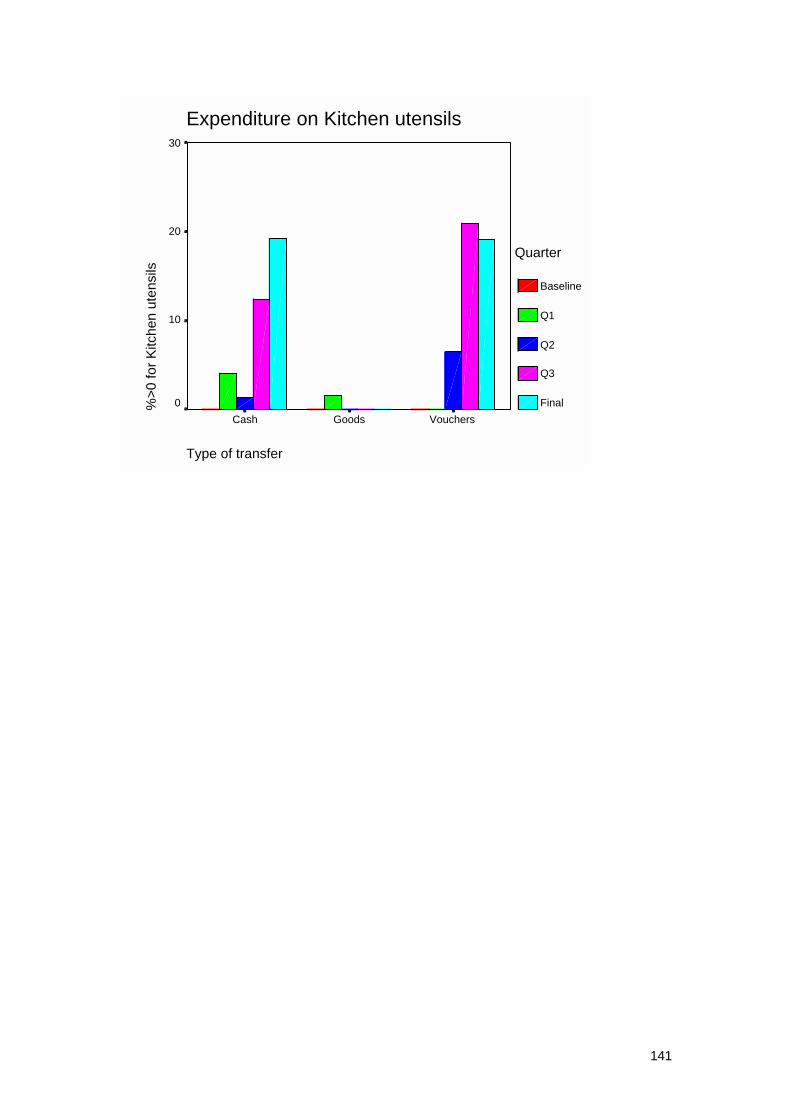
141
Expenditure on Kitchen utensils
Type of transfer
VouchersGoodsCash
%>
0 fo
r K
itche
n ut
ensi
ls30
20
10
0
Quarter
Baseline
Q1
Q2
Q3
Final

142
Appendix 7: Costs Appendix 7, Table 1: Main costs of DSNPP, May 2001 to August 2002 Amount (MK)
A. Overheads and administration charges
Employing 2 Project Officers for 16 months 992,099
Transport for 2 Project Officers (fuel and maintenance for 2 motor cycles) 230,420
Field costs (incl. Project Officer field allowances and training village committees) 392,577
Purchase of 2 motorcycles 375,340
Purchase of computers (plus printer and UPS) 439,199
Stationery, communications, etc 423,986
Administration charge 1,840,000
Total: 4,693,622
B. Delivery of transfers
In-kind (1 goods delivery + 7 months of maize flour deliveries)
Payment to G.J. & Company (equivalent to 5 months of transfers) 1,042,250
Payment to Chingola for supply of maize flour (7 months) 1,459,150
Payment to Police for security (allowances) 6,720
Cash (10 months):
Cash payments to beneficiaries 1,529,000
Payment to Police for security (allowances) 3,360
Envelopes far packing cash 15,164
Vouchers (10 months):
Voucher redemption payments to retailers 2,040,500
Commission paid to retailers 139,398
Printing vouchers 221,552
Printing voucher receipts 18,625
Payment to Police for security (allowances) 3,360
Total: 6,479,079
C. Concern Universal M&E costs:
Baseline survey (allowances) 258,550

143
1st quarter monitoring survey (allowances) 35,900
2nd quarter monitoring survey (allowances) 36,000
3rd quarter monitoring survey (allowances) 38,000
Final impact survey (allowances) 274,000
Employing additional staff to attend village committee meetings 22,100
Employing Data Entry Manager (12 months) 341,197
Data entry for final impact survey 66,541
Questionnaire photocopying 140,270
Total: 1,212,558
Grand Total (A+B+C) 12,385,258
Source: Authors’ calculations based on Concern Universal DSNPP accounts (not yet finalised). Appendix 7, Table 2: Approximate cost per month including supervision system Amount (MK)
A. Overheads and administration charges
Employing 2 Project Officers 62,006
Transport for 2 Project Officers (fuel and maintenance for 2 motor cycles) 14,401
Field costs (incl. Project Officer field allowances and training village committees) 69,889
Purchase of 2 motorcycles 6,255
Purchase of computers (plus printer and UPS) 14,640
Stationery, communications, etc 49,629
Administration charge 115,000
Total: 331,821
B. Delivery of transfers
In-kind transfer (maize flour only)
Cost of transfer for 1028 beneficiaries 565,400
Cost of delivery (vehicles) 9,000
Payment to Police for security (allowances) 5,760
580,160
Cash
Cost of transfer for 1028 beneficiaries 565,400
Payment to Police for security (allowances) 5,760
Envelopes far packing cash 5,607

144
576,767
Vouchers
Voucher redemption payments to retailers for 1028 beneficiaries 565,400
Commission paid to retailers 38,626
Printing vouchers 61,390
Printing voucher receipts 5,161
Payment to Police for security (allowances) 5,760
Total: 676,336
C. Estimated cost of supervision system
Allowances for field staff 7,333
Transport for field staff 667
Photocopying recording forms etc 1,200
9,200
Grand Total 1 (A+B+C) for in-kind transfers 921,181
Grand Total 2 (A+B+C) for cash transfers 906,421
Grand Total 3 (A+B+C) for voucher transfers 1,017,357
Source: Authors’ calculations based on Concern Universal DSNPP accounts (not yet finalised).

145
Appendix 8: CU payments to retailers
Payments between September 2001 and August 2002 (10 distributions)
Name of Shop Date Voucher Value (MK)
Commission (MK) Total Paid (MK)
Khama Shop 01-Oct-01 7,540.00 548.36 8,088.36 Khama Shop 23-Oct-01 4,010.00 291.64 4,301.64 Khama Shop 27-Nov-01 11,550.00 840.00 12,390.00 Khama Shop 07-Jan-02 11,550.00 735.00 12,285.00 Khama Shop 16-Jan-02 11,550.00 840.00 12,390.00 Khama Shop 18-Feb-02 11,550.00 735.00 12,285.00 Khama Shop 22-Mar-02 17,000.00 1,236.36 18,236.36 Khama Shop 03-May-02 11,550.00 840.00 12,390.00 Khama Shop 03-Jun-02 11,550.00 840.00 12,390.00 Khama Shop 16-Jul-02 11,950.00 869.09 12,819.09 Khama Shop 20-Aug-02 11,550.00 840.00 12,390.00 121,350.00 8,615.45 129,965.45 Veke Shop 10-Oct-01 68,960.00 4,388.36 73,348.36 Veke Shop 23-Oct-01 71,470.00 4,548.09 76,018.09 Veke Shop 20-Dec-01 58,270.00 3,708.09 61,978.09 Veke Shop 07-Jan-02 62,520.00 3,978.55 66,498.55 Veke Shop 20-Feb-02 57,460.00 3,656.55 61,116.55 Veke Shop 25-Mar-02 61,350.00 3,904.10 65,254.10 Veke Shop 25-Apr-02 65,130.00 4,736.73 69,866.73 Veke Shop 21-May-02 74,860.00 4,763.82 79,623.82 Veke Shop 21-Aug-02 95,280.00 6,063.27 101,343.27 615,300.00 39,747.56 655,047.56 Chimbiya Grocery 09-Oct-01 55,720.00 3,545.82 59,265.82 Chimbiya Grocery 27-Nov-01 54,360.00 3,459.27 57,819.27 Chimbiya Grocery 20-Dec-01 66,910.00 4,257.91 71,167.91 Chimbiya Grocery 07-Jan-02 62,440.00 3,973.45 66,413.45 Chimbiya Grocery 20-Feb-02 66,790.00 4,250.27 71,040.27 Chimbiya Grocery 28-Mar-02 65,740.00 4,183.46 69,923.46 Chimbiya Grocery 29-Apr-02 60,180.00 3,829.64 64,009.64 Chimbiya Grocery 10-Jun-02 49,410.00 3,144.27 52,554.27 Chimbiya Grocery 16-Jul-02 120,300.00 7,655.46 127,955.46 Chimbiya Grocery 21-Aug-02 36,000.00 2,290.91 38,290.91 637,850.00 40,590.47 678,440.47 Muderanji 03-Oct-01 55,000.00 4,000.00 59,000.00 Muderanji 09-Nov-01 68,170.00 4,957.82 73,127.82 Muderanji 21-Dec-01 18,150.00 1,320.00 19,470.00 Muderanji 21-Dec-01 14,100.00 1,025.45 15,125.45 155,420.00 11,303.27 166,723.27 Alinafe shop 14-Dec-01 52,650.00 3,829.09 56,479.09 Alinafe shop 04-Jan-02 48,960.00 3,560.73 52,520.73 Alinafe shop 14-Feb-02 52,250.00 3,800.00 56,050.00 Alinafe shop 27-Feb-02 15,400.00 1,120.00 16,520.00
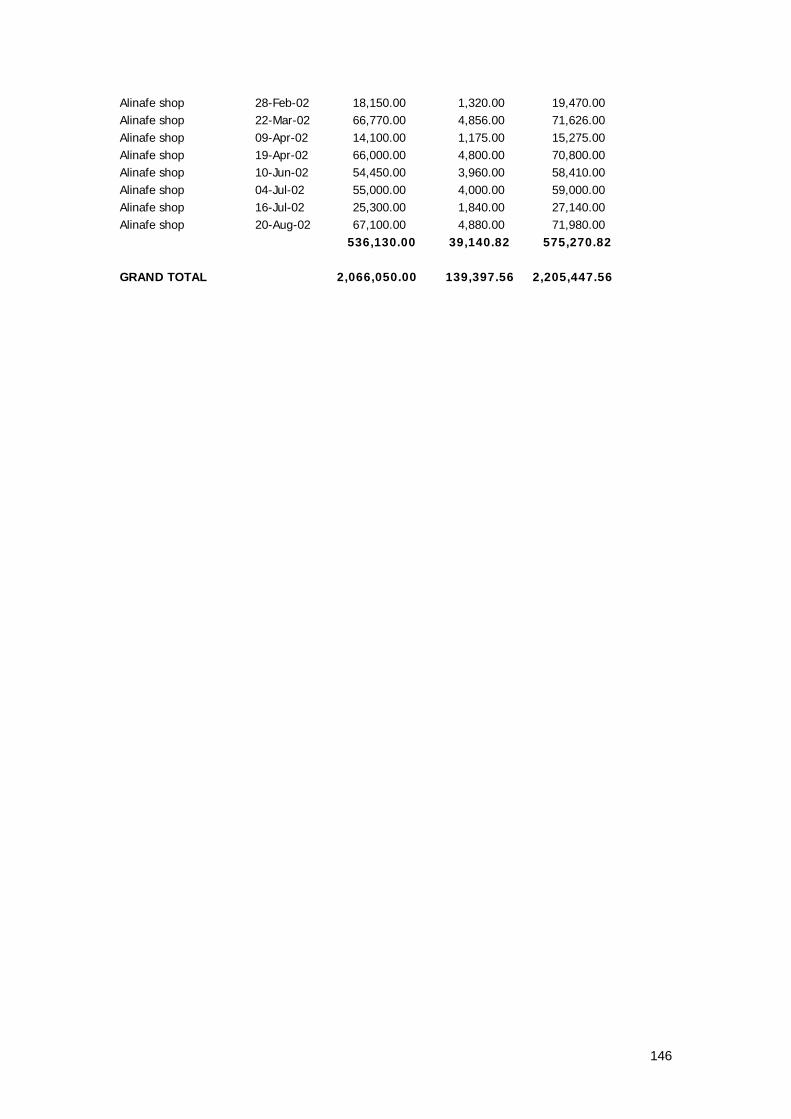
146
Alinafe shop 28-Feb-02 18,150.00 1,320.00 19,470.00 Alinafe shop 22-Mar-02 66,770.00 4,856.00 71,626.00 Alinafe shop 09-Apr-02 14,100.00 1,175.00 15,275.00 Alinafe shop 19-Apr-02 66,000.00 4,800.00 70,800.00 Alinafe shop 10-Jun-02 54,450.00 3,960.00 58,410.00 Alinafe shop 04-Jul-02 55,000.00 4,000.00 59,000.00 Alinafe shop 16-Jul-02 25,300.00 1,840.00 27,140.00 Alinafe shop 20-Aug-02 67,100.00 4,880.00 71,980.00 536,130.00 39,140.82 575,270.82 GRAND TOTAL 2,066,050.00 139,397.56 2,205,447.56

147
Appendix 9: Problems detected during data analysis This appendix contains reports on visits to villages where problems were detected during the data analysis for the Final Report. The visits were carried out by the two CU Project Officers during the writing of the Final Report on 23 October 2002. In the following reports, the names and individual codes of those whose cases were investigated have been removed for reasons of confidentiality.
KANKHULUNGO (Kabwazi: in-kind, beneficiary/carer committee)
Problem 1: There were more replacements than dropouts.
The committee says things got out of hand in the most critical period of hunger when people on the waiting list were badly affected. This prompted them to start making replacements where they were not supposed to do so. E.g. when somebody from a multiple beneficiary household died, they made replacements to show that they were willing to assist more vulnerable individuals. Hence more replacements than dropouts.
Problem 2: Between 6 and 9 households only received 10 kg maize flour according to the Q2 and Q3 surveys.
The committee members admitted their error but insisted that this was the only way they could save people from dying. In order to make sure that every one got a share of the transfers, they opened some of the 5 kg bags and shared the flour with non-beneficiaries. The committee says they were rotating – each time it was the turn of different beneficiaries to have a 5 kg bag withheld. This led to many beneficiaries indicating that they did not know the quantity they were receiving. Others just indicated one 10 kg bag.
NGULUWE (Kabwazi: cash, democratic committee)
Problem 1: A few people only receiving MK 500 from Q1 to final impact survey.
Problem 2: One person not replaced.
On investigation, we found that the village committee was demanding MK50 from each beneficiary as payment for the work of managing the benefits. The beneficiaries were warned earnestly never to reveal this to us, and the committee members were shocked to learn that we had found out what they were doing. They apologised and promised never to do it again.
Beneficiary A was getting MK250 because he was sharing his transfer with Beneficiary B, who did not belong to the same household although CU’s records showed him as belonging to the same household. When Beneficiary C died, the committee allocated Beneficiary C’s transfer to Beneficiary B who was already on the beneficiary list. This gave Beneficiary B an opportunity to be allocated a full transfer. However, Beneficiary A still received only MK275. He did not know that the individual he had been sharing with had been allocated a full transfer, and therefore he should also have received a full transfer. The committee members had stolen this money.
The committee has accepted all the cases of theft and we agreed to meet again next week to discuss the situation.
MNUNKHALUDZU (Kabwazi: cash, VH committee)
Problem: One person received MK450 (final impact survey).
The committee took advantage of one very old woman and stole MK100 from her. There may be other cases of theft that we may not be aware of because the committee was really tense when I asked them about this case. They have since promised to give back the money and requested me not to take the issue too far.
Problem 2: Four people not replaced.
One woman had temporarily gone to Mozambique and is now back, therefore there was no replacement. She has been receiving transfers every month.
148
Asked about replacements for the other three beneficiaries, the committee members (only three were present) were tongue-tied. I talked to some non-beneficiaries who said that the village headman himself heads the committee and his daughter is also part of the committee. They said when the transfers arrive he is in charge of the whole distribution process. They also said he has been pocketing the transfers from the deceased beneficiaries.
I have arranged to carry out a further follow-up next week.
NANSETA (Kabwazi: vouchers, beneficiary/carer committee)
Problem 1: Three people said they did not know the value of the transfer they received.
These people said the committee did not give them the vouchers when they had been collected. Rather, the committee kept the vouchers until the day they agreed to go and purchase items at Thete. They said this annoyed them so much and as a way of reporting to CU about this treatment, they said when interviewed that they did not know the value of the vouchers.
They also said the beneficiaries were never given a chance to know what was the value of the vouchers. When they got to Alinafe, the committee was giving the vouchers directly to the shop owner without giving a chance to the beneficiaries to check their value.
When I asked the committee about this, they said there was an incident in May when one old woman had her vouchers soaked in a pail of water. To prevent this from happening again, the committee decided to keep the vouchers for the beneficiaries until the day they go to collect the transfers. The committee said they did not do this again in the following months, as the beneficiaries reported the matter to the village headman who advised the committee not to keep the vouchers on behalf of the beneficiaries.
Problem 2: Three households not replaced.
The chairman for this committee is lame and has some mental problems. However, he commands a lot of respect amongst the beneficiaries and his fellow committee members because he did his schooling in Zimbabwe.
He says they agreed with his fellow committee members that instead of making permanent replacements, people on the waiting list should take turns to get the three vouchers. This – according to the committee – would give a number of people on the waiting list an opportunity to access the transfers. They said they had made only one permanent replacement, but all the people on the waiting list began pressing to be included. They indicated that they will call for a meeting for the whole village where they will address the issue and assert their position and procedures for making replacements.
ARONI (Kabwazi: cash, beneficiary/carer committee – formerly village head)
Problem: Five people in Q3 and one in the final impact survey said they received nothing.
The five people in Q3 with MK0 values for the transfers are deceased. They passed away in the period between the second quarterly and the third quarterly monitoring surveys during a cholera outbreak. All these have now been replaced.
KAIMVI (Kabwazi: cash, beneficiary/carer committee)
Problem 1: Two replacements not made.
Both beneficiaries had temporarily gone away, one to Mozambique while the other had gone to Namitete. Now both are back, so no replacements were needed.
Problem 2: Two people only received MK500 in Q1.
Both beneficiaries said there was an error, as there has never been a time when they received less than MK550.

149
I asked the committee who insisted that they gave the beneficiaries sealed envelopes and the beneficiaries opened them in the presence of the committee members. They stood their ground, saying they have never found any envelope that had anything less than MK550.
MBUTA (Kabwazi: cash, village head committee)
Problem 1: Q1 and Q2: people received between MK250 and MK500.
Several people reported amounts of MK250 or MK300. These were multiple beneficiary households. The households as a whole received MK500.
It seems that in Mbuta, the beneficiaries from multiple beneficiary households were dividing the transfers between themselves. This is different from the trend in other villages, where the transfer was being used by all household members together.
One beneficiary who reported receiving only MK500 said that there was MK550 in the envelope, but after opening it she was asked to give back MK50 as a payment for the work being done by the village committee. The committee told her that since the village headman was the one that registered her, she had to show her appreciation by giving him something.
There is some form of theft in this village. The committee insisted that they were being given the MK50 without asking, but it seems that people do not give the committee and the village headman the MK50s of their own will. This issue requires further investigation.
Problem 2: One person not replaced.
The committee said when the person in question died no replacement was made. The transfer was given to his household in his name. His household accepted having received the transfers amounting to MK500.
CHISAMBO (Kabwazi: vouchers, village head committee)
Problem: Six people got MK500 in Q1.
All the six people from Chisambo village said that at first they were not allowed to handle the voucher by themselves. The vouchers were kept by the committee treasurer and handed over to the retailer (Muderanji) a day before the beneficiaries came. They never knew how much were they worth, and Muderanji never gave them any choice of what they wanted. They just found already packed items ready for collection. They only began knowing the value of the vouchers when they started buying from Alinafe. They said all along they had a faint idea and thought the vouchers were worth MK500.
The committee members indicated that they were fooled by the retailer (Muderanji) who told them to deliver the vouchers to the shop a day before so that the beneficiaries could come to collect the items, as it was time consuming writing the receipts and selling the items individually. They said when they started going to Alinafe there was no such an arrangement. They now distribute the vouchers to beneficiaries as soon as they get them.
LORENCE (Kabwazi: in-kind, beneficiary/carer committee)
Problem: Three people not replaced.
One person died in May before the final transfers. His transfer was given to his household. The household members accepted having received the transfer in May. Another person married in July and has not yet been replaced, while the third passed away in June and has not been replaced. The committee members were not in a hurry to make replacements for these beneficiaries, since the in-kind transfers ended in May. They said the replacements will be made when they hear that distributions are about to start again. They said they felt it would be unethical to tell someone that he/she has been included on the beneficiary list when they are not sure if/when distributions will start again.

150
CHIDEWERE (Kabwazi: cash, beneficiary/carer committee – formerly democratic)
Problem: Four people not replaced.
The committee says part of this money was being stolen by the old committee. At the time that the old committee was impeached around January, these transfers were being given to the deceased people’s families. An enumerator advised them to make formal replacements. However, in view of the confusion inherited from the VH committee, they just agreed that the same households should continue receiving. They would like to make replacements properly depending on level of vulnerability.
CHAFWALA (Linthipe: vouchers, democratic committee)
Problem: Several households said they did not know the value of the transfers.
For the final impact survey, some beneficiaries insisted that they did not know how much they got from the committee. An observation was made that all of them who said that they did not know were very old, so it is possible that they were not sure about the amount. However, the committee members said that some of the voucher booklets which they received did not have the MK50. This is not possible because all voucher booklets contain the full MK550. The truth of the matter is that the committee members were demanding MK50 from the beneficiaries in exchange for the vouchers (see Section 3.3, Box 3.1) and they removed MK50 from the voucher booklet if they did not have the cash to pay for it.
PAIWE (Linthipe: vouchers, village head committee)
Problem: Q1 and Q2 some beneficiaries were receiving less than MK550.
The committee accepted that they shared some of the vouchers at the beginning of the project. They could not remember how many, but they said they were less than five.
MBALAME YA NYENGO (Linthipe: vouchers, village head committee)
Problem 1: One person only received MK500 in Q2.
Problem 2: One person was not replaced.
The committee denied having given out a MK500 voucher to anybody. All the beneficiaries said they were receiving vouchers with the full MK550. The beneficiary that died was replaced immediately.
It seems likely that these may have been data collection errors, as the information given by the committee and by the beneficiaries indicates that there were no irregularities.
MBALIRA (Linthipe: cash, village head committee)
Problem: Two beneficiaries were not replaced.
One beneficiary was not replaced because there were two beneficiaries in that household, so the other continued receiving the benefit. The second one was replaced and a new beneficiary was receiving the transfer. It seems likely that this was a mistake in data collection during the final impact survey.
CHIOZA MTOSO (Linthipe: goods, village head)
Problem: Two beneficiaries were not replaced.
Two replacements were not made. The committee claimed that the transfers were being given to the grandchildren of the deceased. However, the grandchild of one of the deceased was questioned and reported never having received any transfer from CU. It seems likely that the members of the committee are sharing these transfers.

Appendix 10: List of villages in DSNPP
EPA Type Committee Monitoring Village name Any changes? Kabwazi Cash Beneficiaries Closely Kachipeya Kabwazi Cash Beneficiaries Closely Kaimvi Kabwazi Cash Beneficiaries Hands-off Kapondoza Kabwazi Cash Beneficiaries Hands-off Kajadira Kabwazi Cash Democratic Closely Nguluwe Kabwazi Cash Democratic Closely Zirelakhasu Kabwazi Cash Beneficiaries Hands-off Chidewere formerly democratic Kabwazi Cash Democratic Hands-off Kalamba Kabwazi Cash Beneficiaries Closely Aroni formerly village head Kabwazi Cash Village head Closely Mbuta Kabwazi Cash Village head Hands-off Manola Kabwazi Cash Village head Hands-off Mnunkhaludzu Kabwazi Goods Beneficiaries Closely Kankhulungo Kabwazi Goods Beneficiaries Hands-off Lolensi Kabwazi Goods Beneficiaries Hands-off Njati Kabwazi Goods Democratic Closely Kajinya Kabwazi Goods Democratic Hands-off Kanamwalikwawo Kabwazi Goods Democratic Hands-off Mphasayaweni Kabwazi Goods Village head Closely Mkavairi Kabwazi Goods Village head Hands-off Kamtambo Kabwazi Goods Village head Hands-off Kansepa Kabwazi Vouchers Beneficiaries Closely Nanseta Kabwazi Vouchers Beneficiaries Hands-off Masinja Kabwazi Vouchers Democratic Closely Kafotsela Kabwazi Vouchers Democratic Hands-off Chimutu Kabwazi Vouchers Village head Closely Chisambo Kabwazi Vouchers Beneficiaries Hands-off William formerly village head
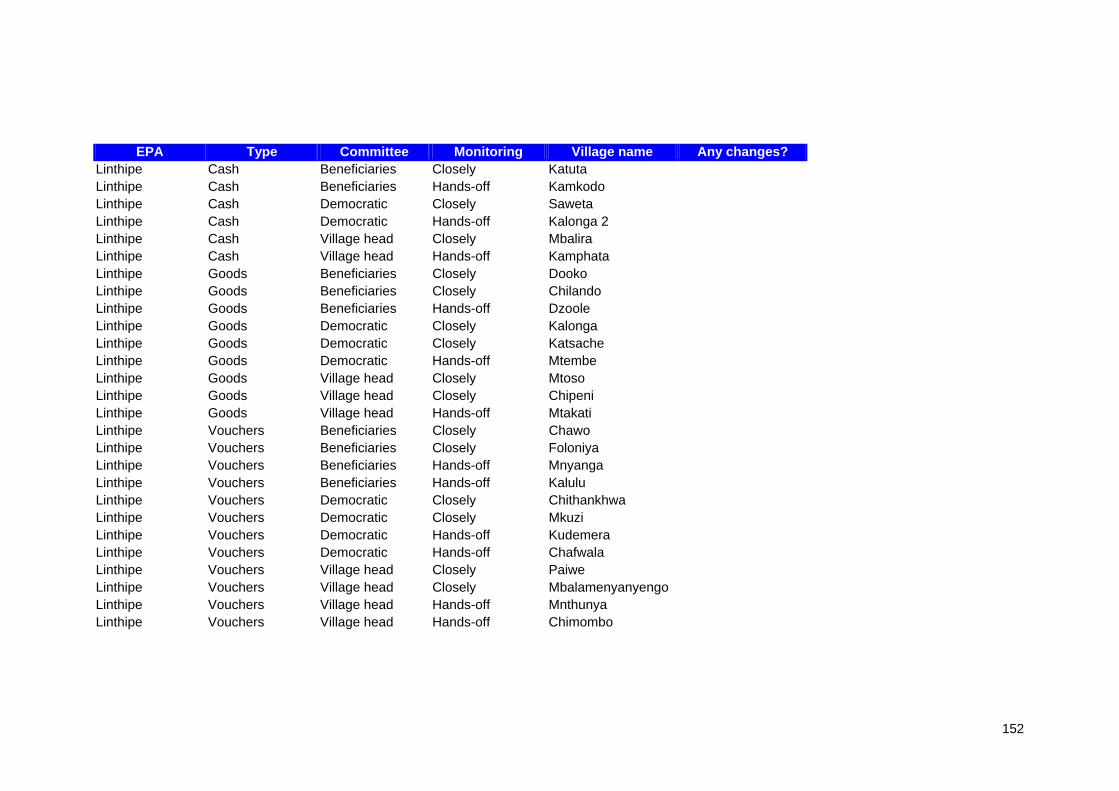
152
EPA Type Committee Monitoring Village name Any changes? Linthipe Cash Beneficiaries Closely Katuta Linthipe Cash Beneficiaries Hands-off Kamkodo Linthipe Cash Democratic Closely Saweta Linthipe Cash Democratic Hands-off Kalonga 2 Linthipe Cash Village head Closely Mbalira Linthipe Cash Village head Hands-off Kamphata Linthipe Goods Beneficiaries Closely Dooko Linthipe Goods Beneficiaries Closely Chilando Linthipe Goods Beneficiaries Hands-off Dzoole Linthipe Goods Democratic Closely Kalonga Linthipe Goods Democratic Closely Katsache Linthipe Goods Democratic Hands-off Mtembe Linthipe Goods Village head Closely Mtoso Linthipe Goods Village head Closely Chipeni Linthipe Goods Village head Hands-off Mtakati Linthipe Vouchers Beneficiaries Closely Chawo Linthipe Vouchers Beneficiaries Closely Foloniya Linthipe Vouchers Beneficiaries Hands-off Mnyanga Linthipe Vouchers Beneficiaries Hands-off Kalulu Linthipe Vouchers Democratic Closely Chithankhwa Linthipe Vouchers Democratic Closely Mkuzi Linthipe Vouchers Democratic Hands-off Kudemera Linthipe Vouchers Democratic Hands-off Chafwala Linthipe Vouchers Village head Closely Paiwe Linthipe Vouchers Village head Closely Mbalamenyanyengo Linthipe Vouchers Village head Hands-off Mnthunya Linthipe Vouchers Village head Hands-off Chimombo