deep dive into the data of the lending club · page 2 of 9 deep dive into the data of the lending...
TRANSCRIPT

DATA DRIVEN STRATEGIES IN MARKETPLACE LENDING
Investment managers analyze loan and borrower data not only to look for ways to gain higher return of their investments, but to enhance their data models. Marketplace lenders such as Lending Club often provide their investors with data as well as a unique analytical assessment of the loans, grading them by quality, and grouping them by risk and interest rates. However many investment managers wish to improve their allocation strategy with additional insights from this data. These investors want to learn more about borrowers, and to locate lower risk loans in higher grade segments.
Loan data provided by many marketplace lenders typically includes loan issuance information and data on past performance, however this raw data is not adequate for making strategic investment decisions. Many common algorithms used to model loan performance are known to most risk and portfolio analysts, investment managers look to create statistical models based on unique risk-assessment approaches to gain a strategic advantage. They use these models to assess new loans and help them select assets to add to their portfolios.
Most loans available from marketplace lenders such as the Lending Club contain a significant amount of information about the borrower: a social and demographic profile, employment information, income details, and previous loans history. Most of this is numerical information that can easily be used in statistical models, however additional borrower information, such as job title and the purpose of the loan, are entered as free-form text that most models cannot accommodate. Even though the analysis must fall outside of traditional models, this data can give additional insights on loan performance, as well as providing addition data to adjust their models.
DEEP DIVE INTO THE DATA OF THE LENDING CLUB
Investors increase portfolio performance and gain competitive advantage by analyzing data about loans to make investment decisions. The sharp growth in
marketplace lending has spurred investors to explore new ways to find additional insights behind the raw data, even in non-numerical data that can be difficult to
assess.

PAGE 2 OF 9DEEP DIVE INTO THE DATA OF THE LENDING CLUB
The analysis of non-numerical data requires a special approach. In this paper we will discuss how insights can be found in non-numerical Lending Club data, however these methods are applicable to comparable data from any marketplace lender.
BRING IN THE EMPLOYMENT DATA
The data set we studied for this paper was provided by Lending Club, and it contained information on 57,000 loans issued from 2007 to 2011. In this data, the majority of borrowers indicated information regarding their employment, however we were interested to look at those who did not. Figure 1 below shows a chart of aggregate loans grouped by the loans’ grades, along with the percentage of respondents in each group that chose not to indicate employment information.
The chart shows that the better performing groups (those in grades A and B) were more likely not to give employment information. One possible reason for omitting employment information may be that these borrowers are retired, or may be freelance workers or other entrepreneurs with job titles that are difficult to describe. Among the borrowers who indicated the level of their work experience in terms of years, there is no significant difference across the grades: most of the borrowers had 10 or more years of experience in their field.
THE IMPORTANCE OF WORD CHOICE
Another way to analyze the employment data entered by Lending Club borrowers is to take a close look at the words used in the job titles to uncover trends among the groups of risk. Figure 2 below shows a word-cloud chart, which shows the distribution of these words such that the
FIGURE 1The percentage of borrowers who did not indicate their employment details, by loan grade
4.7%6.1%
5.0% 4.7%
6.6%
A B C D E
4.3%5.4%
F G

larger the word shown, the more frequently it occurred in the data set. The colors in this chart are only to aid in differentiating between words.
One would assume that by grouping this data by grade, it would allow investors to form a number of hypotheses about risk based on professions. However analysis of the distribution of these words among the groups of grades shows that there is no significant correlation. According to Lending Club grades, all borrowers indicate similar information in their employment title. We will later look at whether this feature is important in identifying poor performing loans.
GEOGRAPHIC DISTRIBUTION
Next we analyzed how the employment details are distributed geographically across the United States. In the map chart shown in Figure 3 below, each circle shows the proportion of borrowers with certain keywords in their employment titles, excluding some non-relative words. For example, the chart shows that school-related jobs are most common in California, whereas jobs involving banks are most common in New York. We will return to the geographic view later in this paper when we look at non-performing loans.
FIGURE 2The most common words borrowers indicate in their employment titles
PAGE 3 OF 9DEEP DIVE INTO THE DATA OF THE LENDING CLUB

FIGURE 3Illustrative cash flow for the parties
INSIGHTS ON GOOD AND BAD BORROWERS
To analyze how a borrower’s type of employment may affect creditworthiness, we used the statistics of historical portfolio performance. In this context, a loan is considered to be non-performing when it is delinquent for 120 days after scheduled payment, and it is charged off when it is deemed to be uncollectable. We calculate a bad rate as a share of charged off loans within a certain group. Coverage refers to how often borrowers within a group appear in the whole dataset. When the bad rate is calculated, the information should be adjusted for each group to account for the coverage of borrowers: a high bad rate is not of as much consequence if it involves a group with a very low coverage.
We now use the calculated bad rates of the loans and return to the word-cloud chart of the words used in borrowers’ job titles, where the larger the word, the more frequently it was used. However the colors used in the chart shown in Figure 4 gives bad rate detail in the range of color showing borrowers with a good, or low, bad rate (those words shown in green), through neutral or average bad rates (those words shown in gray), to borrowers with a high bad rate (those shown in red).
PAGE 4 OF 9DEEP DIVE INTO THE DATA OF THE LENDING CLUB

FIGURE 4Bad rate (color) and frequency (size) of the most common words in employment titles
Several interesting insights may be gleaned from this chart:
• People working or studying at universities or schools, as well as those in the healthcare industry are typically good borrowers.
• Those working in federal and government positions can probably be considered as not risky.
• Borrowers working in management, marketing, and communication specialties might not be considered a good risk.
• Rare word choices such as casino, navy, police, or guard in many cases refer to borrowers with a high bad rate.
Next we look at the geographic distribution based on bad rate. The map chart in Figure 5 below helps us identify the geographical role in predicting future charge offs. The color range in this chart, just as in the word-cloud chart in the previous chart, shows the bad rate from high in red to low in green, with an average bad rate shown in gray. The coverage is indicated by the number in brackets.
PAGE 5 OF 9DEEP DIVE INTO THE DATA OF THE LENDING CLUB

Some of geographic distribution insights revealed by this chart include:
• California is the state with the highest coverage as well as a large proportion of bad loans.
• Better borrowers tend to live on the East Coast rather than on the West Coast.
• The lowest defaults are in northern states Montana and Wyoming, however their coverage is low.
• The optimal geographical locations are Texas, Pennsylvania, and Ohio with lowest default rates.
USING THE INSIGHTS
Analysis of non-numerical employment and geographic information in the Lending Club data reveals some key insights about borrowers. We can see that borrowers cannot be distinguished by the length of their work experience, however loans with borrowers who prefer not to give details about their jobs often are given better grades.
Using these insights in conjunction with established analysis methods bring investors even more value, as they may increase decision model precision and provide important information for manually selecting loans for a portfolio. While grading of loans is important, applying the outer information about borrowers gained by our analysis can increase scoring efficiency. For example,
FIGURE 5Bad rate (color) and coverage (in brackets) of borrowers in the United States
PAGE 6 OF 9DEEP DIVE INTO THE DATA OF THE LENDING CLUB

we have shown that the borrowers of loans with the best performance come from educational institutions and the healthcare industry on the East Cost. We have also shown that riskier borrowers, according to loan performance, live in California and Florida and are likely to work in management, marketing, or communications specialties.
The charts in Figure 6 below show cumulative charge-off curves demonstrating how the insights based on employment and geography affect model efficiency. As with our previous charts, we use a color range from red to green to show the bad rate with red being a high bad rate, gray being neutral, and green being a low bad rate.
The top curve charts the red, green, and gray bad rate segments from the word-cloud chart in Figure 4, which assessed the words used in employment titles. The bottom chart charts the bad rate segments from the map chart in Figure 5, which showed the bad rate by geography.
Therefore Mintos and Twino have a good value proposition for the retail investors. In 2015 the companies facilitated EUR 8.9M of balance sheet loans to payday lending companies. It is important to highlight however that given ultra-short duration of these loans total committed capital is smaller, due to high turnover and constant reinvestment.
In the chart in Figure 6, one can see that the green, low bad-rate portfolio shows better performance in all cases: with a low level of 9-10% defaults. The red, high bad-rate portfolio goes higher, indicating a 15-16% defaults level. The proposed insights decreases the risk of the portfolio by almost 23% overall.
To analyze how well this strategy works, we perform the same approach on fresher data: loans issued in Q1 and Q2 of 2013. The charts shown in Figure 7 show the cumulative charge-off differences between the high and low bad rate loans (red and green, respectively). The chart on
FIGURE 6Cumulative Charge-off curves showing bad rate per employment title key words (top) and geography (bottom)(2007-2010 portfolio)
PAGE 7 OF 9DEEP DIVE INTO THE DATA OF THE LENDING CLUB
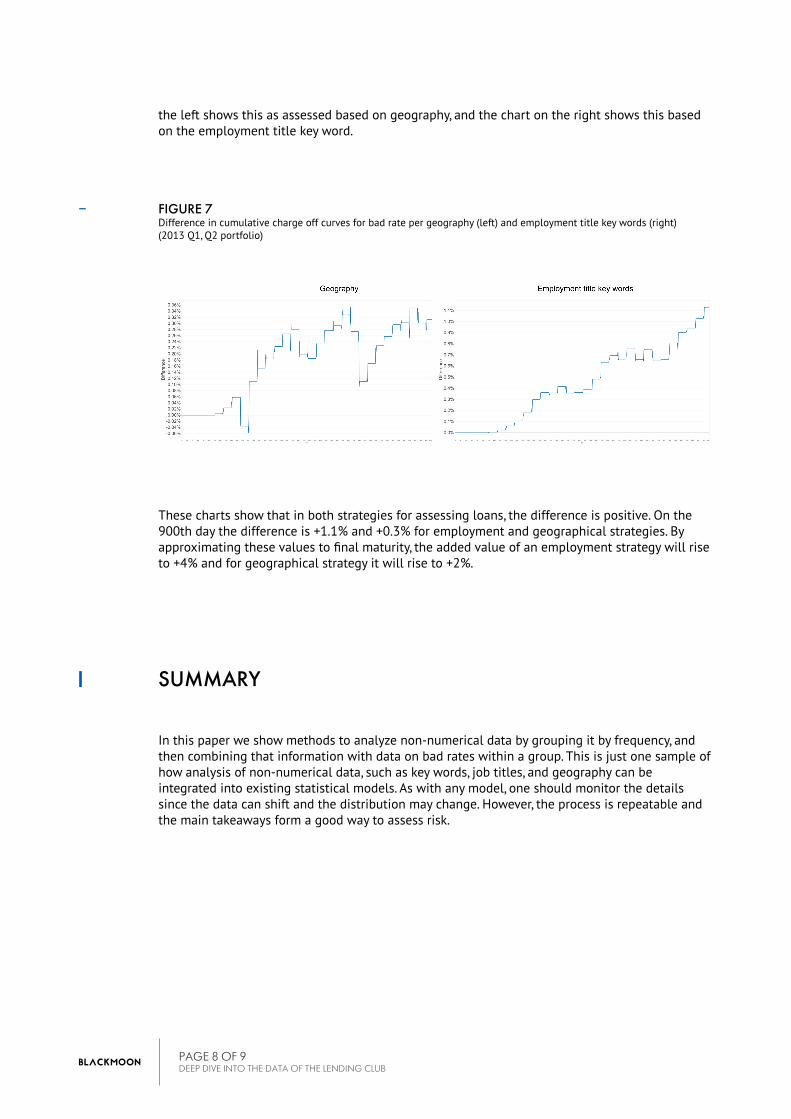
the left shows this as assessed based on geography, and the chart on the right shows this based on the employment title key word.
FIGURE 7Difference in cumulative charge off curves for bad rate per geography (left) and employment title key words (right)(2013 Q1, Q2 portfolio)
These charts show that in both strategies for assessing loans, the difference is positive. On the 900th day the difference is +1.1% and +0.3% for employment and geographical strategies. By approximating these values to final maturity, the added value of an employment strategy will rise to +4% and for geographical strategy it will rise to +2%.
SUMMARY
In this paper we show methods to analyze non-numerical data by grouping it by frequency, and then combining that information with data on bad rates within a group. This is just one sample of how analysis of non-numerical data, such as key words, job titles, and geography can be integrated into existing statistical models. As with any model, one should monitor the details since the data can shift and the distribution may change. However, the process is repeatable and the main takeaways form a good way to assess risk.
PAGE 8 OF 9DEEP DIVE INTO THE DATA OF THE LENDING CLUB

ABOUT BLACKMOON FINANCIAL GROUP
Blackmoon Financial Group was founded in 2015 to deliver innovative solutions in composite lending. For investors, Blackmoon offers high-yield consumer loan portfolios in Europe and the CIS with a proprietary technology solution, risk analysis toolkit, and technical support. For loan originators, Blackmoon provides access to a consistent, high-tech off-balance sheet funding source that locks in profits at the time of loan issuance, and preserves flexible pricing and product policy for the originator.
For more information about Blackmoon Financial Group, please visit us online at www.blackmoonfg.com or contact us at [email protected].
© 2016 BLACKMOON CORPORATION. ALL RIGHTS RESERVED.
PAGE 9 OF 9DEEP DIVE INTO THE DATA OF THE LENDING CLUB