deep multiband surface photometry on star forming galaxies: ii. a
TRANSCRIPT

Mon. Not. R. Astron. Soc. 000, 1–48 (2011) Printed 20 April 2012 (MN LATEX style file v2.2)
Deep multiband surface photometry on star forminggalaxies: II. A volume limited sample of 21 emission linesgalaxies
Genoveva Micheva1?, Goran Ostlin2, Erik Zackrisson2, Nils Bergvall3, ThomasMarquart1,3, Josefa Masegosa4, Isabel Marquez4, Robert Cumming5, Florence Durret61Stockholm Observatory, Department of Astronomy, Stockholm University, 106 91 Stockholm, Sweden2Oskar Klein Centre for Cosmoparticle Physics, Department of Astronomy, Stockholm University, 106 91 Stockholm, Sweden3Division of Astronomy & Space Physics, Uppsala university, 751 20 Uppsala, Sweden4Instituto Astrofisica Andalucia (IAA), CSIC, Spain5??,Goteborg, Sweden6UPMC-CNRS, UMR7095, Institut d’Astrophysique de Paris, F-75014, Paris, France
Accepted .... Received ...; in original form ...
ABSTRACT
We present deep surface photometry of a volume–limited sample of 21 UM emissionline galaxies in broadband optical UBV RI and near infra-red (NIR) HKs filters.The sample comprises 19 blue compact galaxies (BCGs) and two spirals. For sometargets the exposure times are the deepest to date. For the BCG UM462 we observea previously undetected second disk component beyond a surface brightness level ofµB = 26 mag arcsec−2. This is a true low surface brightness component with centralsurface brightness µ0 = 24.1 mag arcsec−2 and scale length hr = 1.5 kpc. All BCGsare dwarfs, with MB 6 −18, and very compact, with an average scale length ofhr ∼ 1 kpc. We separate the burst and host populations for each galaxy and comparethem to stellar evolutionary models with and without nebular emission contribution.We also measure the A180 asymmetry in all filters and detect a shift from opticalto NIR in the average asymmetry of the sample. This shift seems to be correlatedwith the morphological class of the BCGs. Using the color-asymmetry relation, weidentify five BCGs in the sample as mergers, which is confirmed by their morphologicalclass. Though clearly separated from normal galaxies in the concentration–asymmetryparameter space, we find that it is not possible to distinguish luminous starburstingBCGs from the merely star forming low luminosity BCGs.
Key words: galaxies: dwarf - photometry - stellar content - halo, etc...
1 INTRODUCTION
Blue compact galaxies (BCGs) are low metallicity gas–richgalaxies at low redshifts, currently undergoing intensestar formation (SF). Their star formation rates (SFR)are on average too high to be indefinitely sustained bythe available gas supply. Their spectra are reminiscent ofHII regions, with strong emission lines superposed on ablue stellar continuum, which is why they are sometimesreferred to as HII galaxies. Deep optical and near infra–red(NIR) observations have revealed the presence of an oldstellar population in these galaxies, often referred to as the
? E-mail: [email protected] (GM)
“host”, in which the starbursting regions are embedded.The original criteria of what constitutes a BCG (Thuan& Martin 1981) referred to compactness (r25 ∼ 1 kpc indiameter) on photographic plates, blue colors, and low totalluminosity (MB & −18), however, with the discovery ofan old and extended underlying host population in almostall BCGs (e.g. Papaderos et al. 1996; Telles & Terlevich1997; Cairos et al. 2001,?; Bergvall & Ostlin 2002; Cairoset al. 2003; Noeske et al. 2003), these criteria have beenrelaxed to be more inclusive. Thus, BCGs comprise aheterogeneous group of galaxies, with varied morphologies,star formation histories, and total luminosities, but they allhave HII region emission line spectra, which is in practice
c© 2011 RAS

2 Micheva et al.
their only unifying characteristic.
Sample selection
This paper is part of a series and should be read as such.In Micheva et al. (2012, hereafter Paper I) we presented andanalysed UBV RIHKs broadband imaging for a sampleof 24 BCGs. That sample was hand–picked to containinteresting and representative cases of BCGs and is biasedtowards relatively luminous (median MB ∼ −18 mag)galaxies. The Paper I sample is defined in terms of galaxyclass – all galaxies are BCGs – but the heterogeneousand hand–picked nature of the sample make it difficult totranslate the properties of such an inherently mixed bagof BCGs to global properties of the galaxies in the localUniverse. An inherent problem is that the BCG classifi-cation is somewhat ad hoc and based on criteria mainlyrelating to their appearance on photographic plates ratherthan their star forming properties, and most samples haveill determined completenesses. In an attempt to study aspatially well defined sample of BCGs complete in terms ofluminosity we turned to emission line surveys. In magnitudelimited surveys a galaxy’s inclusion in the survey dependsentirely on its apparent brightness, which introduces a biasagainst low luminosity systems despite the fact that thoseare the most common ones. Understandably, one would liketo study the most common type of galaxy in the Universewhich makes emission line surveys, with their small/no lu-minosity bias, a favorable place to look for a representativeand abundant sample of such systems. Salzer et al. (1989a)compiled a large sample of emission line galaxies (ELGs)from Lists IV and V of the University of Michigan (UM)objective-prism survey. The primary selection criteria forthis survey are based on the strength and contrast of the[OIII] λ5007 emission line and it therefore contains a largerfraction of low luminosity dwarfs compared to magnitudelimited surveys (Salzer et al. 1989b). BCGs, being asubgroup of emission line galaxies, make up about twothirds of the UM survey (Salzer et al. 1989b). Our approachin this paper is to take a volume of space and study allemission line galaxies in it. We use Salzer et al. (1989a) toselect a volume limited sample defined by 11 6 RA 6 14hand v 6 2100 km s−1. This velocity cut–off ensures thatwe have good completeness at the faint end (Salzer 1989,completeness & 95% for v < 2500km s−1). Inside of thisvolume are 21 UM ELGs, of which 19 are BCG–like andtwo are giant spiral galaxies. Thus selected, this sampleis representative of the star forming galaxy population inthe local Universe. It consists predominantly of compactlow–luminosity dwarfs of various (burst) metallicities –from low (Z ∼ 0.004) to close to solar (Z ∼ 0.02), and withvarying gas content. Throughout this paper we refer to thesample galaxies, with the exception of the two spirals, asBCGs.
These galaxies and the targets from Paper I togetherconstitute a sample of 46 high and low luminosity BCGs.The observations presented here are a part of our ongoingeffort to study representative numbers of such galaxies.Kinematic data exist for the majority and are about to bepublished (Ostlin et al. 2012 in prep., Marquart et al. 2012
in prep.). Telles et al. (1997) find that such galaxies readilydivide into two major morphological types (roughly intoregular and irregular), which indicates that they may havedifferent progenitors. The deep optical and NIR imagingdata in this paper and in Paper I will allow us to study thedifference in the faint old populations of these two groupsand compare their structural parameters and photometricproperties. Though we will frequently refer to the propertiesof the BCGs in Paper I throughout this paper, the bulk ofthe analysis juxtaposing low and high luminosity BCGs willappear in a dedicated future paper (Micheva et al. 2012).We have assumed H0 = 73 km−1s−1Mpc−1.
The layout of this paper is as follows: § 2 introduces the dataand the calibration, and provides a log of the observations.§ 3 briefly summarizes the derived profiles and the measuredquantities. § 4 gives brief notes on the characteristics of thegalaxies, as well as a detailed summary of how stellar evo-lutionary models (SEMs) compare with the observed colorsfor each galaxy. Where possible, an indication of the age andmetallicity for the different populations is given. Observedtrends in the integrated colors, asymmetries, total luminosi-ties, and other galaxy properties are discussed in § 5. Wesummarize our conclusions in § 6.
2 OBSERVATIONS
The data consist of optical and NIR broadband imaging,obtained during the period 2003–2007 with ALFOSC (atthe Nordic Optical Telescope, NOT), MOSCA (NOT),and EMMI (at the European Southern Observatory NewTechnology Telescope, ESO NTT) in the optical, and withNOTCAM (NOT) and SOFI (ESO NTT) in the NIR.
We have presented in detail the reduction pipelines and thecalibration of the data in Micheva et al. (2010) and Paper I.We shall not repeat it here, except to give some brief noteson MOSCA reductions since Paper I did not contain anysuch data.
MOSCA is a multi-chip instrument (4 CCDs). Each CCDhad its own illumination gradient, which was not aligned inconcert with the rest. Since our pipeline fits and subtractsa sky from every reduced frame before stacking, it becamenecessary to adapt it to fit 4 separate skies and subtractthose from the individual CCDs on each reduced frame,instead of fitting a single sky on the mosaiced (raw) frames.Dark current (DC) frames were available, however aftersubtracting the masterbias from the masterdark we foundthe remaining DC to be negligible for our longest exposureof 10 minutes, hence we did not use the DC frames inthe reduction. The MOSCA bias level can occasionallyfluctuate throughout the night on some of the CCDs, butagain, after examination of the bias frames taken on fiveseparate occasions throughout the night we found it tobe very stable for all 4 CCDs. This is not universally thecase with MOSCA data, so care must be taken to checkthe behavior of the dark and bias levels in the four chipsfor each individual night. The orientation of the four chipsis slightly misaligned, which we have corrected for before
c© 2011 RAS, MNRAS 000, 1–48

Deep multiband surface photometry on 21 ELGs 3
Table 1. Total integration times for the sample. All
times are given in minutes and converted to the frame-work of a 2.56 meter telescope where needed. Thevalues are for observations in a single filter, e.g. onlySOFI Ks, and not SOFI Ks+NOTCAM Ks.
U B V R I H Ks
UM422 20 60 30 30† 58 23 125‡
UM439 60 40 40 9 58 249
UM446 40 40 9 116 21 51
UM452 70 60 20 7 46 37 64
UM456 40 40 40 7 38 30 32
UM461 60 50 40 6 38 32 82
UM462 30 40 40 6 38 32 48
UM463 30 40 40 38 30 73
UM465 40 40 50 121
UM477 40 20 20 6 38 62
UM483 20 35 30 9 48 249
UM491 60 40 40 9 58 249
UM499 40 36 36 19 62
UM500 60 60 30 30† 38 61 123
UM501 40 40 40 6 38 32 121
UM504 30 40 40 9 9 31 121
UM523 10 40 40 6 38 62
UM533 20 40 40 6 38 80
UM538 30 30 20 9 58 145
UM559 60 40 40 9 12 7 123
† – ALFOSC, ‡ – SOFI
making the final stacked images.
We should further mention that during the reductionsof this sample we again made extensive use of the as-trometry.net software (Lang et al. 2010) to add a worldcoordinate system (WCS) to the headers of most of theNOTCAM data. Possibly useful for the community tips,derived from our experience with this software, can befound in Paper I.
Tables 1 and 2 summarize the individual exposure timesfor each filter and the observation log for these data. Theheliocentric redshift and distance in Mpc, both taken fromNED1, are also provided. The filter number at the respectiveobservatory is given for convenience. The sample is volume–limited, with 11 6 RA 6 14h and v 6 2100 km s−1.
1 NASA/IPAC Extragalactic Database,http://ned.ipac.caltech.edu/
2.1 Photometric calibration
All data were calibrated in the Vega photometric system.We remind the reader that the calibration in the opticalwas carried out with Landolt standard stars, while in theNIR we used 2MASS to calibrate against the mean zeropoint of field stars found in each individual frame, whichmakes the NIR calibration less dependent on photometricconditions. In the optical we compared the photometry ofstars in our calibrated frames with SDSS photometry inthe same fields. Any offset larger than 0.05 mag detectedbetween our photometry and the SDSS photometry wasthen applied to our frames. For both wavelength regimeswe estimated the zero point uncertainty, σzp, for each finalframe as the average residual difference in magnitudesbetween SDSS/2MASS and our own measurements fordifferent stars around each target (after any existing clearoffset has been corrected). If a galaxy was observed onseveral nights in the same filter we added the uncertaintiesin quadrature to obtain a total σzp for that galaxy andfilter. We have further compared the photometry of ourfield stars to values from the Pickles stellar library in bothoptical and NIR, and found no significant offsets.
3 METHODS
The methods used in obtaining surface brightness and colorprofiles, structural parameters and other quantities of inter-est were presented in detail in Paper I. Here we will providea brief outline of the major steps but we refer the interestedreader to Paper I for a more in–depth description of the pro-cedures, the individual sources of uncertainty, motivation forthe error composition, systematic errors consideration, etc.For the sake of brevity hereafter we will refer toKs as simplyK (except in the conclusions).
3.1 Surface brightness profiles
We obtained isophotal and elliptical integration surfacebrightness profiles for the galaxies in the sample. In theformer case we used a constant magnitude bin size of0.5m for all galaxies and all filters, and the deepest image(usually the B band) to define the area of integration ateach step. This area was then applied to the rest of thefilters. In the case of elliptical integration the radial binsize is 1 arcsec for all galaxies and all filters, and we againused the B band to define the parameters of the integratingellipse and applied those to the rest of the filters. In otherwords, the same physical area is sampled at each magnitudeor radial bin in all filters. All foreground and backgroundsources, except the target galaxy, were masked out priorto performing surface photometry on the images, wherethe mask size is usually a factor of 2.5 larger than what isreturned by SExtractor. Though the source detection andmasking procedures are automatic, all masks were visuallyinspected and modified if it was deemed necessary.
The elliptical integration errors include the zero point un-certainty σzp, the uncertainty in the sky σsky, and the un-certainty in the mean flux level, represented by the standard
c© 2011 RAS, MNRAS 000, 1–48

4 Micheva et al.
Figure 1. UM461 (top) and UM500 (bottom) in SDSS (left)and our (right) RGB color schemes.
deviation of the mean flux in each elliptical ring, σsdom. Theisophotal errors are similarly obtained but of course excludeσsdom. The details of the error estimation and the integra-tion procedures are described in Paper I. Figure 2 shows theisophotal and elliptical surface brightness profiles as well asthe resulting radial color profiles for all galaxies.
3.2 Contour plots and RGB images
Figure 2 also contains the contour plots, which we obtainedwith a combination of the python astLib package and thebuilt–in pylab function contour. The isophotal bin is 0.5 magfor all galaxies. To reduce the noise in the fainter isophotesthe images were partially smoothed with the boxcar medianfilter indicated in Figure 2. The RGB images for each galaxywere made with our own implementation of the Lupton et al.(2004) algorithm, where the same scaling and stretch fac-tors were applied to all galaxies in order to facilitate directcomparison. The contour plots and RGB images are bothoriented so that North is up and East is to the left. To illus-trate the difference in color schemes between the SDSS andour own RGB image we show such a comparison in Figure 1for two random galaxies from our sample.
3.3 Integrated surface photometry
Similar to Paper I, in Tables 3 and 4 we present theparameters derived from the surface photometry, includingposition angle and ellipticity, the Holmberg radius rH ,and the total apparent and absolute magnitudes for eachgalaxy measured down to rH . The error on the totalluminosity was obtained by varying the position angle andellipticity parameters by ±5◦, respectively ±0.1. In Table 5we summarize some general information for each target,such as oxygen–based metallicities and Hβ equivalentwidths, as well as the morphological class obtained either
from the literature or through our own analysis of themorphology, where such classification was missing. We alsosplit the underlying host galaxy in two regions, one betweenµB ∼ 24–26 and one between µB ∼ 26–28 mag arcsec−2,and calculate the total color over these regions (Table 6).In the same table we also provide the color of the centralregion, from the center of integration down to µB ∼ 24 magarcsec−2, which contains contributions from both the starforming regions and the underlying host galaxy.
Most of the host galaxies in this sample are well approxi-mated by a disk, so it is meaningful to estimate the scalelength hr and the central surface brightness µ0 (Table 7) forthe sample, which we do in the same way as in Paper I. Theassumption of knowing the exact shape of the underlyinghost enables us to give an estimate of the burst luminosity,i.e. the excess light above the exponential disk (Table 8).The burst errors include the fitting errors of the exponentialdisk, scaled to units of the profile errors, and the zero pointuncertainty. Thus they may be underestimated since thereis no measure of the uncertainty in the exact flux level ofthe burst region. The latter is not included since the burstregion is never explicitly defined in 2D. All color measure-ments are always performed over identical physical rangesfor all filters, taking the B band as reference for defining therespective regions and then applying these regions to therest of the filters. The errors of the colors are the compos-ite of the individual errors in the two filters, which in turncontain contributions from all three relevant sources of un-certainty – σzp, σsky, and σsdom. The structural parameterserrors, σ(hr) and σ(µ0), are the propagated errors of thefitted slope, and a composite of the fit error and zero pointuncertainty, respectively.
3.4 Asymmetry and concentration
The histogram in Figure 10 shows the distribution ofthe minimum Petrosian asymmetry (AP ) in each filter,while Table 10 shows the individual AP for each galaxy.These are calculated following Conselice et al. (2000) as
A =∑
|I0−Iφ|2∑
|I0|, where φ = 180 degrees. The measurements
were performed over the area included in the Petrosianradius r[η(0.2)], where all pixels below the correspondingflux level are masked out. We use the inverted η, defined asthe ratio between the local surface brightness at some radiusand the average surface brightness inside that radius (seeBershady et al. 2000, and references therein). The individ-ual Petrosian radii are also presented in Table 10, sinceit can be informative to know how large the enclosed area is.
Alternative measures of asymmetry are shown in Table 11,namely the Holmberg (A′
H) and the dynamical (Adyn)asymmetry. A′
H is calculated over images smoothed by aboxcar average filter of 1 × 1 kpc from the area enclosedby the Holmberg radius at µ = 26.5 mag arcsec−2 in theoptical and R23 at µ = 23 mag arcsec−2 in the NIR. Adyn,the dynamical asymmetry, is also calculated over smoothedimages, but all pixels brighter than µ = 25, µ = 21 magarcsec−2 are set to the constant value of 25, 21 magarcsec−2 in the optical, respectively the NIR. This meansthat all star forming regions contribute nothing to the total
c© 2011 RAS, MNRAS 000, 1–48

Deep multiband surface photometry on 21 ELGs 5
asymmetry, allowing Adyn to give more weight to the faintdynamical structures. The faintest isophote in Adyn is 27mag arcsec−2 in the optical and 23 mag arcsec−2 in the NIR.
The concentration index (e.g. Bershady et al. 2000) wascalculated from C = 5 × log
r80%r20%
where r20,r80 are the
radii at 20%, respectively 80% light over an area inside the1.5× r[η(0.2)] radius. These values are listed in Table 12.
c© 2011 RAS, MNRAS 000, 1–48

6 Micheva et al.
Table 2. Log of the observations. Heliocentric redshift and cosmology–corrected luminosity distances from NED.
Name Ra Dec (J2000) Redshift D [Mpc] Year Instrument Filters
UM422 11h20m14.6s 0.005360 27.2 2003 ALFOSC-FASU U#7, B#74, V#75, R#76+02d31m53s 2005 EMMI R#608, I#610
SOFI Ks#13NOTCAM H#204
2007 NOTCAM Ks#207
UM439 11h36m36.8s 0.003666 20.2 2004 ALFOSC-FASU B#74, V#75+00d48m58s 2005 EMMI R#608, I#610
ALFOSC-FASU U#72006 SOFI Ks#13
UM446 11h41m45.6s 0.006032 30.0 2004 ALFOSC-FASU B#74, V#75-01d54m05s 2005 EMMI R#608, I#610
NOTCAM H#2042006 NOTCAM Ks#207
UM452 11h47m00.7s 0.004931 25.4 2003 ALFOSC-FASU B#74, V#75-00d17m39s 2005 EMMI R#608, I#610
NOTCAM H#204ALFOSC-FASU U#7
2007 NOTCAM Ks#207
UM456 11h50m36.3s 0.005940 29.6 2004 ALFOSC-FASU B#74, V#75-00d34m03s 2005 EMMI R#608, I#610
NOTCAM H#2042006 MOSCA U#104
NOTCAM Ks#207
UM461 11h51m33.3s 0.003465 19.3 2004 ALFOSC-FASU B#74, V#75-02d22m22s 2005 EMMI R#608, I#610
ALFOSC-FASU U#7NOTCAM H#204
2006 NOTCAM Ks#207
UM462 11h52m37.2s 0.003527 19.6 2004 ALFOSC-FASU B#74, V#75-02d28m10s 2005 ALFOSC-FASU U#7
EMMI R#608, I#610NOTCAM H#204
2007 NOTCAM Ks#207
UM463 11h52m47.5s 0.004640 24.2 2004 ALFOSC-FASU B#74, V#75-00d40m08s 2005 NOTCAM H#204
EMMI I#6102006 MOSCA U#1042007 NOTCAM Ks#207
UM465 11h54m12.3s 0.003820 20.7 2004 ALFOSC-FASU B#74, V#75+00d08m12s 2006 SOFI Ks#13
MOSCA U#104
UM477 12h08m11.1s 0.004426 23.2 2005 EMMI R#608, I#610+02d52m42s SOFI Ks#13
2006 ALFOSC-FASU B#74, V#75MOSCA U#104
UM483 12h12m14.7s 0.007792 37.2 2005 ALFOSC-FASU U#7+00d04m20s EMMI R#608, I#610
2006 ALFOSC-FASU B#74, V#75SOFI Ks#13
UM491 12h19m53.2s 0.006665 32.4 2004 ALFOSC-FASU B#74, V#75+01d46m24s 2005 EMMI R#608, I#610
ALFOSC-FASU U#72006 SOFI Ks#13
UM499 12h25m42.8s 0.007138 34.3 2004 ALFOSC-FASU B#74, V#75+00d34m21s 2005 EMMI I#610
SOFI Ks#132006 MOSCA U#104
UM500 12h26m12.8s 0.007000 33.8 2003 ALFOSC-FASU B#74, V#75, R#76-01d18m16s 2005 EMMI R#608, I#610
NOTCAM H#204ALFOSC-FASU U#7
2006 SOFI Ks#13
UM501 12h26m22.7s 0.006761 32.8 2004 ALFOSC-FASU B#74, V#75-01d15m12s 2005 EMMI R#608, I#610
NOTCAM H#2042006 SOFI Ks#13
MOSCA U#104
UM504 12h32m23.6s 0.006800 32.9 2004 ALFOSC-FASU B#74, V#75-01d44m24s 2005 NOTCAM H#204
2006 MOSCA U#104SOFI Ks#13ALFOSC-FASU R#76, I#12
UM523 12h54m51.0s 0.003052 17.1 2004 ALFOSC-FASU B#74, V#75+02d39m15s 2005 SOFI Ks#13
EMMI R#608, I#6102006 MOSCA U#104
UM533 12h59m58.1s 0.002957 16.7 2004 ALFOSC-FASU B#74, V#75+02d02m57s 2005 EMMI R#608, I#610
SOFI Ks#132006 MOSCA U#104
UM538 13h02m40.8s 0.003065 17.1 2005 EMMI R#608, I#610+01d04m27s SOFI Ks#13
2006 MOSCA U#104ALFOSC-FASU B#74, V#75
UM559 13h17m42.8s 0.004153 21.5 2004 ALFOSC-FASU B#74, V#75-01d00m01s 2005 ALFOSC-FASU U#7
NOTCAM H#2042006 SOFI Ks#13
ALFOSC-FASU R#76, I#12
c© 2011 RAS, MNRAS 000, 1–48

Deep multiband surface photometry on 21 ELGs 7
Figure 2. UM422. Left panel : Surface brightness and color radial profiles for elliptical (open circles) and isophotal
(red circles) integration in the Vega photometric system. Upper right panel : contour plot based on the B band.Isophotes fainter than 23.0, 25.5 are iteratively smoothed with a boxcar median filter of sizes 5, 15 pixels respectively.Lower right panel : A true color RGB composite image using the U,B,I filters. Each channel has been corrected forGalactic extinction following Schlegel et al. (1998) and converted to the AB photometric system. The RGB composite
was created by adapting the Lupton et al. (2004) algorithm.
c© 2011 RAS, MNRAS 000, 1–48

8 Micheva et al.
Figure 2 – continued UM439. Left panel : Surface brightness and color radial profiles for elliptical (open circles)and isophotal (red circles) integration in the Vega photometric system. Upper right panel : contour plot based on the
B band. Isophotes fainter than 23.0, 25.5 are iteratively smoothed with a boxcar median filter of sizes 5, 15 pixelsrespectively. Lower right panel : A true color RGB composite image using the U,B,I filters. Each channel has beencorrected for Galactic extinction following Schlegel et al. (1998) and converted to the AB photometric system. The
RGB composite was created by adapting the Lupton et al. (2004) algorithm.
c© 2011 RAS, MNRAS 000, 1–48

Deep multiband surface photometry on 21 ELGs 9
Figure 2 – continued UM446. Left panel : Surface brightness and color radial profiles for elliptical (open circles)
and isophotal (red circles) integration in the Vega photometric system. Upper right panel : contour plot based on theB band. Isophotes fainter than 23.0, 25.5 are iteratively smoothed with a boxcar median filter of sizes 5, 15 pixelsrespectively. Lower right panel : A true color RGB composite image using the B,V,I filters. Each channel has beencorrected for Galactic extinction following Schlegel et al. (1998) and converted to the AB photometric system. The
RGB composite was created by adapting the Lupton et al. (2004) algorithm.
c© 2011 RAS, MNRAS 000, 1–48

10 Micheva et al.
Figure 2 – continued UM452. Left panel : Surface brightness and color radial profiles for elliptical (open circles)
and isophotal (red circles) integration in the Vega photometric system. Upper right panel : contour plot based on theB band. Isophotes fainter than 22.5 are smoothed with a boxcar median filter of size 5 pixels. Lower right panel :A true color RGB composite image using the U,B,I filters. Each channel has been corrected for Galactic extinctionfollowing Schlegel et al. (1998) and converted to the AB photometric system. The RGB composite was created by
adapting the Lupton et al. (2004) algorithm.
c© 2011 RAS, MNRAS 000, 1–48

Deep multiband surface photometry on 21 ELGs 11
Figure 2 – continued UM456. Left panel : Surface brightness and color radial profiles for elliptical (open circles)
and isophotal (red circles) integration in the Vega photometric system. Upper right panel : contour plot based on theB band. Isophotes fainter than 23.0 are smoothed with a boxcar median filter of size 5 pixels. Lower right panel :A true color RGB composite image using the U,B,I filters. Each channel has been corrected for Galactic extinctionfollowing Schlegel et al. (1998) and converted to the AB photometric system. The RGB composite was created by
adapting the Lupton et al. (2004) algorithm.
c© 2011 RAS, MNRAS 000, 1–48

12 Micheva et al.
Figure 2 – continued UM461. Left panel : Surface brightness and color radial profiles for elliptical (open circles)and isophotal (red circles) integration in the Vega photometric system. Upper right panel : contour plot based on the
B band. Isophotes fainter than 23.5, 25.5 are iteratively smoothed with a boxcar median filter of sizes 5, 15 pixelsrespectively. Lower right panel : A true color RGB composite image using the U,B,I filters. Each channel has beencorrected for Galactic extinction following Schlegel et al. (1998) and converted to the AB photometric system. The
RGB composite was created by adapting the Lupton et al. (2004) algorithm.
c© 2011 RAS, MNRAS 000, 1–48

Deep multiband surface photometry on 21 ELGs 13
Figure 2 – continued UM462. Left panel : Surface brightness and color radial profiles for elliptical (open circles)
and isophotal (red circles) integration in the Vega photometric system. Upper right panel : contour plot based on theB band. Isophotes fainter than 22.5, 25.5 are iteratively smoothed with a boxcar median filter of sizes 5, 15 pixelsrespectively. Lower right panel : A true color RGB composite image using the U,B,I filters. Each channel has beencorrected for Galactic extinction following Schlegel et al. (1998) and converted to the AB photometric system. The
RGB composite was created by adapting the Lupton et al. (2004) algorithm.
c© 2011 RAS, MNRAS 000, 1–48

14 Micheva et al.
Figure 2 – continued UM463. Left panel : Surface brightness and color radial profiles for elliptical (open circles)and isophotal (red circles) integration in the Vega photometric system. Upper right panel : contour plot based on theB band. Isophotes fainter than 23.0 are smoothed with a boxcar median filter of size 5 pixels. Lower right panel :A true color RGB composite image using the U,B,I filters. Each channel has been corrected for Galactic extinction
following Schlegel et al. (1998) and converted to the AB photometric system. The RGB composite was created byadapting the Lupton et al. (2004) algorithm.
c© 2011 RAS, MNRAS 000, 1–48

Deep multiband surface photometry on 21 ELGs 15
Figure 2 – continued UM465. Left panel : Surface brightness and color radial profiles for elliptical (open circles)and isophotal (red circles) integration in the Vega photometric system. Upper right panel : contour plot based on the
B band. Isophotes fainter than 23.0, 25.5 are iteratively smoothed with a boxcar median filter of sizes 5, 15 pixelsrespectively. Lower right panel : A true color RGB composite image using the U,B,V filters. Each channel has beencorrected for Galactic extinction following Schlegel et al. (1998) and converted to the AB photometric system. The
RGB composite was created by adapting the Lupton et al. (2004) algorithm.
c© 2011 RAS, MNRAS 000, 1–48

16 Micheva et al.
Figure 2 – continued UM477. Left panel : Surface brightness and color radial profiles for elliptical (open circles)and isophotal (red circles) integration in the Vega photometric system. Upper right panel : contour plot based on theB band. Isophotes fainter than 22.0, 25.0 are iteratively smoothed with a boxcar median filter of sizes 5, 15 pixels
respectively. Lower right panel : A true color RGB composite image using the U,B,I filters. Each channel has beencorrected for Galactic extinction following Schlegel et al. (1998) and converted to the AB photometric system. TheRGB composite was created by adapting the Lupton et al. (2004) algorithm.
c© 2011 RAS, MNRAS 000, 1–48

Deep multiband surface photometry on 21 ELGs 17
Figure 2 – continued UM483. Left panel : Surface brightness and color radial profiles for elliptical (open circles)
and isophotal (red circles) integration in the Vega photometric system. Upper right panel : contour plot based on theB band. Isophotes fainter than 23.5, 25.5 are iteratively smoothed with a boxcar median filter of sizes 5, 15 pixelsrespectively. Lower right panel : A true color RGB composite image using the U,B,I filters. Each channel has beencorrected for Galactic extinction following Schlegel et al. (1998) and converted to the AB photometric system. The
RGB composite was created by adapting the Lupton et al. (2004) algorithm.
c© 2011 RAS, MNRAS 000, 1–48

18 Micheva et al.
Figure 2 – continued UM491. Left panel : Surface brightness and color radial profiles for elliptical (open circles)
and isophotal (red circles) integration in the Vega photometric system. Upper right panel : contour plot based on theB band. Isophotes fainter than 23.5, 25.5 are iteratively smoothed with a boxcar median filter of sizes 5, 15 pixelsrespectively. Lower right panel : A true color RGB composite image using the U,B,I filters. Each channel has beencorrected for Galactic extinction following Schlegel et al. (1998) and converted to the AB photometric system. The
RGB composite was created by adapting the Lupton et al. (2004) algorithm.
c© 2011 RAS, MNRAS 000, 1–48

Deep multiband surface photometry on 21 ELGs 19
Figure 2 – continued UM499. Left panel : Surface brightness and color radial profiles for elliptical (open circles)
and isophotal (red circles) integration in the Vega photometric system. Upper right panel : contour plot based on theB band. Isophotes fainter than 22.0, 24.5, 25.5 are iteratively smoothed with a boxcar median filter of sizes 5, 15, 25pixels respectively. Lower right panel : A true color RGB composite image using the U,B,I filters. Each channel hasbeen corrected for Galactic extinction following Schlegel et al. (1998) and converted to the AB photometric system.
The RGB composite was created by adapting the Lupton et al. (2004) algorithm.
c© 2011 RAS, MNRAS 000, 1–48

20 Micheva et al.
Figure 2 – continued UM500. Left panel : Surface brightness and color radial profiles for elliptical (open circles)
and isophotal (red circles) integration in the Vega photometric system. Upper right panel : contour plot based on theB band. Isophotes fainter than 23.5, 25.5 are iteratively smoothed with a boxcar median filter of sizes 5, 15 pixelsrespectively. Lower right panel : A true color RGB composite image using the U,B,I filters. Each channel has beencorrected for Galactic extinction following Schlegel et al. (1998) and converted to the AB photometric system. The
RGB composite was created by adapting the Lupton et al. (2004) algorithm.
c© 2011 RAS, MNRAS 000, 1–48

Deep multiband surface photometry on 21 ELGs 21
Figure 2 – continued UM501. Left panel : Surface brightness and color radial profiles for elliptical (open circles)
and isophotal (red circles) integration in the Vega photometric system. Upper right panel : contour plot based on theB band. Isophotes fainter than 23.0, 25.5 are iteratively smoothed with a boxcar median filter of sizes 5, 15 pixelsrespectively. Lower right panel : A true color RGB composite image using the U,B,I filters. Each channel has beencorrected for Galactic extinction following Schlegel et al. (1998) and converted to the AB photometric system. The
RGB composite was created by adapting the Lupton et al. (2004) algorithm.
c© 2011 RAS, MNRAS 000, 1–48

22 Micheva et al.
Figure 2 – continued UM504. Left panel : Surface brightness and color radial profiles for elliptical (open circles)and isophotal (red circles) integration in the Vega photometric system. Upper right panel : contour plot based on the
B band. Isophotes fainter than 24.2, 25.5 are iteratively smoothed with a boxcar median filter of sizes 5, 15 pixelsrespectively. Lower right panel : A true color RGB composite image using the U,B,I filters. Each channel has beencorrected for Galactic extinction following Schlegel et al. (1998) and converted to the AB photometric system. The
RGB composite was created by adapting the Lupton et al. (2004) algorithm.
c© 2011 RAS, MNRAS 000, 1–48

Deep multiband surface photometry on 21 ELGs 23
Figure 2 – continued UM523A (NGC4809). Left panel : Surface brightness and color radial profiles for elliptical
(open circles) and isophotal (red circles) integration in the Vega photometric system. Upper right panel : contourplot based on the B band. Isophotes fainter than 23.0, 25.5 are iteratively smoothed with a boxcar median filterof sizes 5, 15 pixels respectively. Lower right panel : A true color RGB composite image using the U,B,I filters.
Each channel has been corrected for Galactic extinction following Schlegel et al. (1998) and converted to the ABphotometric system. The RGB composite was created by adapting the Lupton et al. (2004) algorithm.
c© 2011 RAS, MNRAS 000, 1–48

24 Micheva et al.
Figure 2 – continued UM523B (NGC4810). Left panel : Surface brightness and color radial profiles for elliptical(open circles) and isophotal (red circles) integration in the Vega photometric system. Upper right panel : contour
plot based on the B band. Isophotes fainter than 23.0, 25.5 are iteratively smoothed with a boxcar median filterof sizes 5, 15 pixels respectively. Lower right panel : A true color RGB composite image using the U,B,I filters.Each channel has been corrected for Galactic extinction following Schlegel et al. (1998) and converted to the ABphotometric system. The RGB composite was created by adapting the Lupton et al. (2004) algorithm.
c© 2011 RAS, MNRAS 000, 1–48

Deep multiband surface photometry on 21 ELGs 25
Figure 2 – continued UM533. Left panel : Surface brightness and color radial profiles for elliptical (open circles)and isophotal (red circles) integration in the Vega photometric system. Upper right panel : contour plot based on the
B band. Isophotes fainter than 23.0, 25.5 are iteratively smoothed with a boxcar median filter of sizes 5, 15 pixelsrespectively. Lower right panel : A true color RGB composite image using the U,B,I filters. Each channel has beencorrected for Galactic extinction following Schlegel et al. (1998) and converted to the AB photometric system. TheRGB composite was created by adapting the Lupton et al. (2004) algorithm.
c© 2011 RAS, MNRAS 000, 1–48

26 Micheva et al.
Figure 2 – continued UM538. Left panel : Surface brightness and color radial profiles for elliptical (open circles)
and isophotal (red circles) integration in the Vega photometric system. Upper right panel : contour plot based on theB band. Isophotes fainter than 23.0, 25.5 are iteratively smoothed with a boxcar median filter of sizes 5, 15 pixelsrespectively. Lower right panel : A true color RGB composite image using the U,B,I filters. Each channel has beencorrected for Galactic extinction following Schlegel et al. (1998) and converted to the AB photometric system. The
RGB composite was created by adapting the Lupton et al. (2004) algorithm.
c© 2011 RAS, MNRAS 000, 1–48

Deep multiband surface photometry on 21 ELGs 27
Figure 2 – continued UM559. Left panel : Surface brightness and color radial profiles for elliptical (open circles)
and isophotal (red circles) integration in the Vega photometric system. Upper right panel : contour plot based on theB band. Isophotes fainter than 23.0, 26.5 are iteratively smoothed with a boxcar median filter of sizes 5, 15 pixelsrespectively. Lower right panel : A true color RGB composite image using the U,B,I filters. Each channel has beencorrected for Galactic extinction following Schlegel et al. (1998) and converted to the AB photometric system. The
RGB composite was created by adapting the Lupton et al. (2004) algorithm.
c© 2011 RAS, MNRAS 000, 1–48

28 Micheva et al.
4 CHARACTERISTICS OF INDIVIDUALGALAXIES
In what follows we provide brief notes on the characteristicsand relevant information from the literature on the individ-ual galaxies. We have also analyzed color–color diagrams ofall combinations of our five primary colors (U − B, B − V ,V −R, V − I, V −K, and H−K) for each galaxy and com-pared them to two stellar evolutionary models – one withnebular emission contribution and assumed instantaneousburst at zero redshift, and one with a pure stellar popula-tion without gas and an e–folding time of 109 yrs, also atzero redshift. The model tracks with nebular emission arebased on the Yggdrasil spectral synthesis code (Zackrissonet al. 2011), whereas the pure stellar population tracksare based on Marigo et al. (2008) isochrones. Paper I canbe consulted for further details on these models. In eachsuch diagram we plotted the total galaxy color, the centralcolor down to µB ∼ 24 mag arcsec−2, the colors between24 . µB . 26 and 26 . µB . 28 mag arcsec−2, and theburst color estimate. Since the number of plots grew to over400, we have not included them in this paper, but theyare available on demand2. Any statement we make thatindicates the possible metallicity or age of the young or oldpopulations is based on the individual analysis of these plots.
We further provide the morphological class of the galaxyif it is available in the literature, and in the cases whereit is missing we assign such a class based on our anal-ysis of the contour and RGB plots for each galaxy. Wewill adhere to the morphological classification of Loose &Thuan (1986), namely iE (irregular inner and ellipticalouter isophotes), nE (central nucleus in an elliptical host),iI,C (off–center nucleus in a cometary host), and iI,M (off–center nucleus in an apparent merger). We further reiteratethe Salzer et al. (1989b) classification for each galaxy basedon spectral features, namely DANS (dwarf amorphous nu-clear starburst galaxies), Starburst nucleus galaxies, HIIH(HII hotspot galaxies), DHIIH (dwarf HII hotspot galax-ies), SS (Sargent–Searle objects). These are summarized inTable 5.
UM422
This composite object is embedded in one of the most mas-sive HI envelopes of the sample and has an HI compan-ion (Taylor et al. 1995). UM422 is actually the blue knotvisible to the North–West in the RGB image, in close prox-imity to an extended red irregular galaxy. This galaxy is soclose to its much more massive neighbor that we are unableto separate it and extract its individual surface brightness orcolor profiles. Since the two galaxies are most likely merging,we present instead the surface brightness and color profilesfor the composite object. Due to the irregular morphologyof the merger our simplified burst estimation fails for theregion µB = 26–28 mag arcsec−2. We therefore exclude thisgalaxy from Figure 5. UM422 has a diameter of ∼ 3 kpcmeasured down to the Holmberg radius, which makes it atrue SS object (Salzer et al. 1989b). We have measured total
2 E-mail: [email protected]
colors down to the Holmberg radius, as well as integrated thecolors in the two µB = 24–26 and µB = 26–28 mag arcsec−2
regions for the composite object (UM422 + neighbor), butwe acknowledge that those will represent the colors of theneighbor more than the colors of UM422 itself. All colorsindicate the dominant presence of an old stellar component.Specifically, the B− V vs. V −R, V − I, or V −K colors ofthe composite object show very little nebular emission con-tamination and are well–fitted by a stellar population withage & 3 Gyr. They are also well–fitted by model tracks in-cluding nebular emission but also for an old age & 1 Gyr.Since both models indicate the sampled population is old,we must place higher weight on the pure stellar populationmodel, since it is better suited to model old populations thanYggdrasil.
UM439
This is a Wolf–Rayet galaxy (Schaerer et al. 1999) classi-fied as iE BCD by Gil de Paz et al. (2003), and a DHIIHby Salzer et al. (1989b). This galaxy has an HI distribu-tion asymmetric in the North–East, which might indicatean interaction companion or a tidal feature (Taylor et al.1995), however, the galaxy appears isolated in the sense thatthere are no detected companions within 1 Mpc (Campos-Aguilar & Moles 1991; Campos-Aguilar et al. 1993; Tayloret al. 1995). The strongest star forming region is located atthe highest HI column density, with the weaker SF regionsbeing remnants of recent burst activity which seems to bedying out (van Zee et al. 1998). Based on its IRAS f25/f100and f60/f100 color indices the starburst is still the dominantproperty of this galaxy, with relatively low extinction basedon Hα/Hβ (Terlevich et al. 1991). The extinction is enough,however, to affect the U−B and B−V burst colors. The cen-tral colors are indicative of a young population > 10 Myrsand nebular emission contribution. The latter drops dramat-ically for 24 . µB . 26 and 26 . µB . 28 mag arcsec−2
region colors, specifically V − I > 1 and V − R > 0.6 col-ors are observed for both regions, indicative of an old ∼ 10Gyr stellar population of metallicity higher than Z ∼ 0.004.There is a bright strongly saturated star in the I band to theEast of the galaxy, which we have of course masked out whenobtaining the surface brightness profiles or measuring burstor host integrated colors. However, the saturation causescharge bleeding along the columns across the galaxy (whichbecome rows after tangential North–East projection), andto be on the cautious side we applied extensive masking, in-cluding most of the Southern part of the galaxy. The maskwas heavily biased towards fainter regions beyond the cen-tral ∼ 15 arcsec, since the main star forming knot off–centerto the South is bright enough to dominate the flux over thelight leak from the star. Color measurements based on the Iband should nevertheless be treated with a healthy dose ofsuspicion, since the remaining unmasked half of the galaxymay still suffer some contamination from the saturated starat faint isophote levels.
UM446
This SS galaxy is among the least luminous and most com-pact in the sample. It does not have HI companions, even
c© 2011 RAS, MNRAS 000, 1–48

Deep multiband surface photometry on 21 ELGs 29
Table 3. Surface photometry parameters. The position angle
(PA◦) in degrees and the ellipticity (e) were obtained from theB band image and applied to the remaining filters. The radiuswhere the mean surface brightness is µB ≈ 26.5 mag arcsec−2
is the Holmberg radius, RH , and is given in arcseconds and kpc.
The absolute B magnitude, MB , is calculated from the area insideRH and has been corrected for Galactic extinction (Schlegel et al.1998). The MB errors are identical to the errors of the apparent
B magnitude in Table 4.
Galaxy PA◦ e R′′H Rkpc
H MB
UM422 51 0.36 86.7 11.4 −18.27UM439 −22 0.37 34.9 3.4 −16.58
UM446 −45 0.22 16.9 2.5 −15.67UM452 −64 0.36 32.9 4.1 −16.65UM456 35 0.36 37.8 5.4 −16.99UM461 90 0.03 17.9 1.7 −15.14
UM462 67 0.12 34.9 3.3 −16.93UM463 27 0.36 9.0 1.1 −13.90UM465 20 0.16 35.4 3.6 −17.53
UM477 −75 0.17 152.4 17.1 −19.84UM483 56 0.25 19.0 3.4 −16.84UM491 30 0.27 21.6 3.4 −16.87UM499 90 0.58 114.5 19.0 −19.57
UM500 2 0.16 43.8 7.2 −17.82UM501 35 0.40 30.9 4.9 −16.06UM504 −16 0.24 16.4 2.6 −16.29UM523A 69 0.42 59.8 5.0 −17.09
UM523B −9 0.11 38.8 3.2 −16.71UM533 −6 0.25 55.8 4.5 −16.29UM538 −11 0.23 16.9 1.4 −13.66UM559 89 0.55 32.0 3.3 −15.60
though there is an extended HI tail to the South–East butthe mass in that feature is only a few percent of the totalmass of the system, and hence is not considered a legitimatecandidate companion (Taylor et al. 1995). There is very lit-tle detected extinction based on the Hα/Hβ ratio (Terlevichet al. 1991). B − V vs. V − R or H −K shows strong neb-ular emission and a very young burst of just a few Myr andintermediate metallicity (Z ∼ 0.008). V − I and V − R vs.H − K or V − K also indicate a very young age with thesame Z ∼ 0.008 metallicity. B − V vs. V − I or V − Kshows the host to be very metal–poor (Z ∼ 0.001) and old(∼ 6 Gyrs). It has a nuclear star forming knot and a sec-ond knot off-center to the North–West but regular ellipticalouter isophotes, hence we classify it as an iE BCD.
UM452
This is a nE BCD and a DHIIH galaxy. It has no detectedHI companions in its vicinity (Taylor et al. 1995). B − Vvs. V − I, V − K, or H − K indicates an old (> 8 Gyrs)host with low metallicity (Z ∼ 0.004), and a burst of close–to–solar metallicity, younger than 1 Gyr, but not by much.This is consistent with the diffuse morphology of the starforming region we observe in the RGB image, and the lackof any compact bright star forming knots. We are seeing thisgalaxy at the end of its most recent star formation phase,and there is largely no nebular emission contribution to anyof the colors – most colors are best fitted with the purestellar population model.
UM456
This Wolf–Rayet galaxy (Schaerer et al. 1999) has mor-phological classification iI BCD and a spectral classifica-tion DHIIH. It is the Southern component of a system withthree distinct HI overdensities, of which only UM456 hasdetected emission lines, while the other two HI clumps ei-ther have no emission lines or no optical counterpart alto-gether (Taylor et al. 1995). B − V or V − R vs. V − I orV −K shows an intermediate metallicity (Z ∼ 0.008) burstmuch younger than 10 Myr, strongly affected by significantnebular emission contribution in U−B, V −K , and H−K.The host is very metal–poor (Z ∼ 0.001) and older than 3Gyr.
UM461
This Wolf–Rayet galaxy (Schaerer et al. 1999) has been clas-sified as an SS object. Originally thought to be tidally in-teracting with UM462 (Taylor et al. 1995), this was laterquestioned by van Zee et al. (1998) who find a crossing timeof ∼ 700 Myr, which is significantly longer than the age ofthe starburst, expected to be less than 100 Myr. Doublieret al. (1999) observe a double exponential profile, with theouter disk visible in the surface brightness profile beyondµB = 26.75 mag arcsec−2. However, our B data show no ev-idence of a double exponential structure around or beyondthis isophotal level. In fact, the surface brightness profile isvery well fitted with a single disk down to µB ∼ 28 magarcsec−2. Since our data are deeper and have much smallererrors at fainter isophotes, the double disk structure in thesurface brightness profile of Doublier et al. (1999) must bedue to systematic sky effects, and not to the presence ofa second component. Judging by B − V vs. V − R, V − Ior V − K the burst is only a few (< 5) Myr old and haslow metallicity (Z ∼ 0.004). This seems to be the youngestand simultaneously the most metal–poor burst in the sam-ple, with all color–color diagrams clearly indicating a similarvery young age at the same metallicity. There is strong neb-ular emission contribution dominating the total and burstcolors in all colors, but this becomes insignificant in the twooutskirt regions, which are well–fitted by a very metal–poor(Z ∼ 0.001) stellar population older than 3 Gyrs. All inte-grated colors indicate that nebular emission is sufficient for agood fit with the evolutionary models, no dust is necessary.This is consistent with the extremely low extinction valuesmeasured through the Balmer decrement Hα/Hβ by Ter-levich et al. (1991). The off–center double–knot structure ofthe star forming regions and the irregularities in the outerisophotes (see contour plot) lead us to classify this galaxyas an iI BCD.
UM462
This Wolf–Rayet galaxy (Schaerer et al. 1999) is classified asiE BCD by Cairos et al. (2001) and as a DHIIH. This galaxyis referred to as rather compact in the literature (Campos-Aguilar & Moles 1991; Cairos et al. 2001,?), however, wedetect a very low surface brightness structure extended to
c© 2011 RAS, MNRAS 000, 1–48
30 Micheva et al.
the North and South of the main star forming nucleus. Thisstructure is not only visible in the surface brightness profilebeyond µB = 26 mag arcsec−2, but also in the contour plot.This component is previously unobserved both in B bandsurface brightness profiles and contour plots (Cairos et al.2001,?), however, previous observations have exposure timesa factor of four shorter than ours. Together with the ex-tended low surface brightness component this galaxy bearsa striking morphological similarity to NGC 5128 (CentaurusA). B−V vs. V −I or V −K diagrams indicate that the ageof the component previously thought to be the only host (inthe region 24 . µB . 26 mag arcsec−2) is between 3 and 4Gyrs and has very low metallicity (Z ∼ 0.001). Due to thelarge errorbars we cannot identify a specific age or metallic-ity of the new host component detected at 26 . µB . 28 inany color–color diagram, except to say that it looks to beolder than 5 Gyrs in B − V vs. V −R or V − I but is con-sistent with all metallicities within the errorbars. V −R vs.H−K or V − I indicate a very young burst of < 5 Myr andlow metallicity (Z ∼ 0.004) with significant nebular emis-sion contribution in all filters. The presence of significantquantities of dust is suggested by the extinction effect inand around the burst regions, judging by their U − B andB − V colors.
UM463
This SS galaxy is not particularly gas–rich as it is unde-tected in HI (Taylor et al. 1995; Smoker et al. 2000) witha detection limit of 6.9 × 10⁶M�. Indeed, we see only mildnebular emission contribution in the color diagrams, with anold (> 5 Gyr) very metal–poor (Z ∼ 0.001) host. We foundno morphological classification in the literature, so we clas-sify this galaxy as iE BCD based on its contour plot andRGB image. Note that the NIR photometry of this galaxyis uncertain, since we found no stars close to the galaxy (onthe final stacked image) and hence could not verify our fi-nal photometry against 2MASS (nor against SDSS in theoptical, for that matter). A correction based on offsets fromPickles stellar library values and stellar evolutionary trackshad to be applied instead. Since this correction is an esti-mate, we retain a 0.5 mag error for all NIR measurements ofthis galaxy. The optical colors we measure for this galaxy areunusual. U−B is the bluest for the entire sample, while B−Vis rather red. We checked our U, V, I photometry againstdownloaded archived data from the Hubble Space Telescopein F330W, F550M, F814W and found good agreement.This makes us suspicious of the B band, however Telles &Terlevich (1995) find a very similar apparent B magnitude(B = 17.87) which is consistent with ours (B = 18.02).An additional though weaker argument is that both B andV band observations for this galaxy were taken during thesame night and right after each other. Though we find thecolors unusual, we cannot find fault in the photometry.
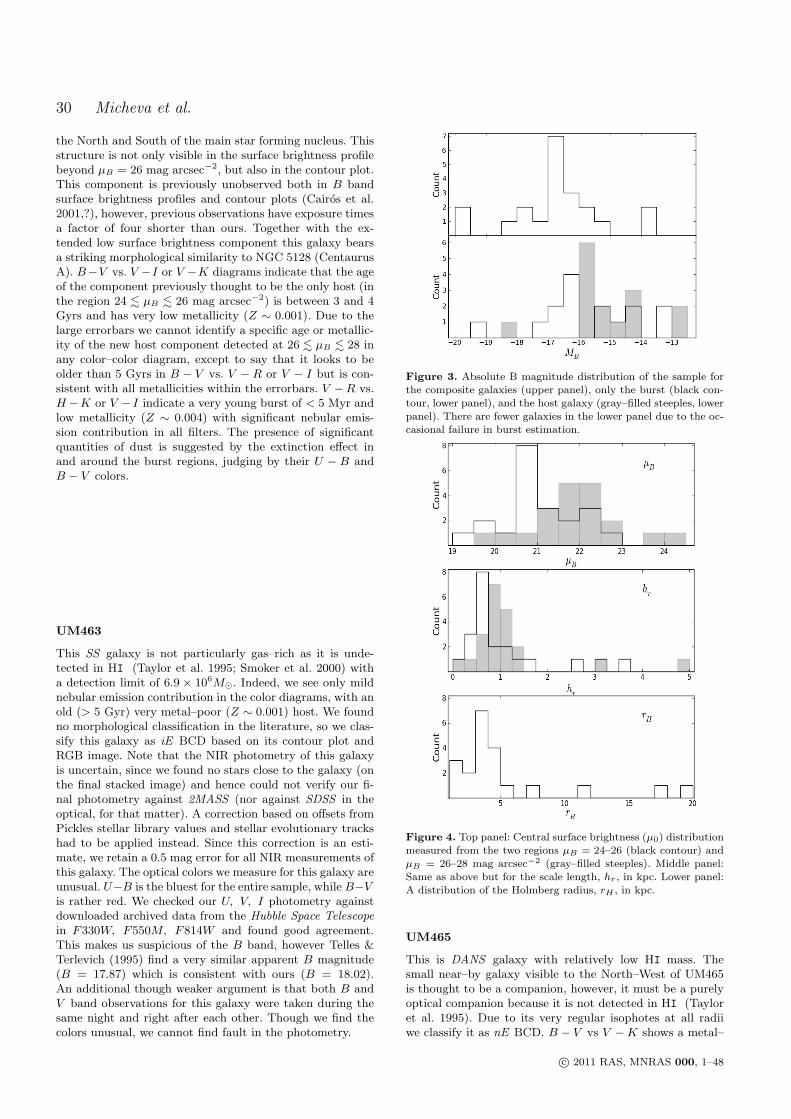
Figure 3. Absolute B magnitude distribution of the sample forthe composite galaxies (upper panel), only the burst (black con-tour, lower panel), and the host galaxy (gray–filled steeples, lower
panel). There are fewer galaxies in the lower panel due to the oc-casional failure in burst estimation.
Figure 4. Top panel: Central surface brightness (µ0) distributionmeasured from the two regions µB = 24–26 (black contour) and
µB = 26–28 mag arcsec−2 (gray–filled steeples). Middle panel:Same as above but for the scale length, hr, in kpc. Lower panel:A distribution of the Holmberg radius, rH , in kpc.
UM465
This is DANS galaxy with relatively low HI mass. Thesmall near–by galaxy visible to the North–West of UM465is thought to be a companion, however, it must be a purelyoptical companion because it is not detected in HI (Tayloret al. 1995). Due to its very regular isophotes at all radiiwe classify it as nE BCD. B − V vs V −K shows a metal–
c© 2011 RAS, MNRAS 000, 1–48

Deep multiband surface photometry on 21 ELGs 31
Table 4. Integrated surface photometry for the sample. The integration is carried out down to the Holmberg radius R′′H , which
is defined from µB for each target and then applied to the remaining filters. All values have been corrected for Galactic extinc-tion (Schlegel et al. 1998).
Galaxy B U−B B−V V−R V−I V−K H−K
UM422 13.91± 0.03 −0.34± 0.05 0.45± 0.04 0.30± 0.06 0.86± 0.07 1.61± 0.09 −0.30± 0.10UM439 14.94± 0.03 −0.48± 0.05 0.39± 0.04 0.28± 0.03 0.62± 0.05 1.77± 0.06UM446 16.71± 0.04 0.58± 0.05 0.45± 0.03 0.71± 0.08 2.32± 0.26 0.42± 0.26
UM452 15.38± 0.01 −0.20± 0.12 0.71± 0.02 0.43± 0.05 0.96± 0.04 2.45± 0.04 0.26± 0.05UM456 15.37± 0.01 −0.41± 0.03 0.41± 0.03 0.24± 0.04 0.52± 0.04 1.83± 0.04 0.68± 0.09UM461 16.29± 0.02 −0.56± 0.04 0.66± 0.04 −0.06± 0.03 0.10± 0.04 1.31± 0.07 0.53± 0.14UM462 14.53± 0.03 −0.66± 0.15 0.36± 0.05 0.08± 0.25 0.07± 0.19 1.77± 0.07 0.39± 0.07
UM463 18.02± 0.02 −0.84± 0.05 0.74± 0.04 0.11± 0.05 2.31± 0.50 0.13± 0.50UM465 14.05± 0.01 −0.30± 0.02 0.60± 0.03 2.50± 0.05UM477 11.99± 0.02 0.16± 0.03 0.57± 0.02 0.47± 0.05 0.95± 0.02 2.46± 0.06UM483 16.02± 0.02 −0.30± 0.07 0.45± 0.06 0.18± 0.07 0.56± 0.06 2.05± 0.07
UM491 15.69± 0.01 −0.40± 0.04 0.44± 0.03 0.28± 0.06 0.62± 0.03 2.24± 0.16UM499 13.11± 0.04 −0.08± 0.04 0.64± 0.04 0.95± 0.04 2.69± 0.08UM500 14.82± 0.01 −0.42± 0.02 0.68± 0.03 −0.02± 0.05 0.26± 0.03 1.38± 0.05 −0.01± 0.13UM501 16.52± 0.04 −0.45± 0.04 0.38± 0.05 0.22± 0.04 0.55± 0.05 1.43± 0.16 0.37± 0.17
UM504 16.30± 0.04 −0.21± 0.05 0.56± 0.05 0.28± 0.04 0.69± 0.10 2.14± 0.05 0.28± 0.06UM523A 14.07± 0.06 −0.08± 0.07 0.33± 0.07 0.22± 0.05 0.64± 0.04 1.80± 0.07UM523B 14.46± 0.06 −0.40± 0.07 0.30± 0.07 0.26± 0.05 0.61± 0.04 1.80± 0.07UM533 14.83± 0.03 0.02± 0.04 0.63± 0.04 0.35± 0.03 0.82± 0.02 2.04± 0.10
UM538 17.50± 0.04 −0.34± 0.06 0.58± 0.05 0.22± 0.07 0.72± 0.04 2.01± 0.06UM559 16.07± 0.02 −0.33± 0.03 0.36± 0.05 0.20± 0.06 0.56± 0.06 1.63± 0.06 −0.01± 0.07
Table 5. Oxygen–based metallicities, Hβ equivalent widths in A, and morphological (M class) and spectral (S class) classificationcompiled from the literature, or obtained in this work (Ref.=0). Metallicities marked with ? indicate that the value is estimated from
Eq. 5 in Salzer et al. (1989b) since tabulated values were unavailable. All spectral classifications are from Salzer et al. (1989b). Note thatfor UM422 and UM559 we see a clear inconsistency between the assigned class, SS, which implies the target is small and compact, andthe extended morphology we observe in our contour and RGB plots for these targets. This is marked with a “?”.
Galaxy 12 + logO/H Ref. EW (Hβ) Ref. M class Ref. S class
UM422 8.0 1 344 4 SS?
UM439 8.0 2 160 4 iE 7 DHIIHUM446 8.3? 3 38 4 iE 0 SSUM452 8.4? 3 13.5 6 nE 7 DHIIHUM456 7.9 1 40 4 iI 7 DHIIH
UM461 7.7 2 342 4 iI 0 SSUM462 7.9 2 124 4 iE 8 DHIIHUM463 7.7 1 119 4 iE 0 SSUM465 8.4? 3 10 4 nE 0 DANS
UM477 8.7 4 22 4 SB SBNUM483 8.3 1 26 4 i0 7 DHIIHUM491 7.9 1 11 4 nE 7 DHIIH
UM499 8.6 4 32 4 SB SBNUM500 8.1 1 133 4 iI 0 SSUM501 8.3? 3 123 4 iI, i0? 0 MIUM504 8.4? 3 18 4 nE 0 DHIIH
UM523A 8.1 4 30 4 iE 0UM523B 8.1 4 30 4 iE 0UM533 8.3? 3 101 4 iE 7 MIUM538 7.8 1 77 4 iE 0 SS
UM559 7.7 5 325 4 iE/nE 5 SS?
1 – Masegosa et al. (1994), 2 – Nava et al. (2006),3 – Salzer et al. (1989b), 4 – Terlevich et al. (1991), 5 – Papaderos et al. (2006), 6– Salzer et al. (1989a), 7 – Gil de Paz et al. (2003), 8 – Cairos et al. (2001)
c© 2011 RAS, MNRAS 000, 1–48

32 Micheva et al.
Table 6. Total colors for radial ranges corresponding to µB . 24, 24 . µB < 26, and 26 . µB . 28 mag
arcsec−2. All values have been corrected for Galactic extinction (Schlegel et al. 1998). The errors includeσsky , σsdom and σzp added in quadrature.
Galaxy µB U−B B−V V−R V−I V−K H−K
UM422 ?–24 −0.33 ± 0.05 0.48 ± 0.04 0.31 ± 0.07 0.88 ± 0.07 1.76 ± 0.30 −0.15 ± 0.3224–26 −0.36 ± 0.12 0.49 ± 0.07 0.18 ± 0.09 0.79 ± 0.15 1.29 ± 2.89 −0.83 ± 2.9526–28 −0.70 ± 2.54 1.01 ± 1.27 0.20 ± 1.07 1.89 ± 1.09
UM439 ?–24 −0.51 ± 0.06 0.37 ± 0.06 0.14 ± 0.05 0.41 ± 0.05 1.78 ± 0.0724–26 −0.21 ± 0.07 0.47 ± 0.05 0.70 ± 0.05 1.20 ± 0.05 1.89 ± 0.2626–28 −0.29 ± 0.40 0.53 ± 0.23 0.91 ± 0.27 1.43 ± 0.22
UM446 ?–24 0.55 ± 0.07 0.40 ± 0.06 0.63 ± 0.08 2.14 ± 0.08 0.38 ± 0.1024–26 0.69 ± 0.06 0.57 ± 0.05 0.91 ± 0.07 2.77 ± 0.47 0.51 ± 0.7826–28 0.60 ± 0.15 0.73 ± 0.16 1.08 ± 0.22 3.71 ± 1.17 0.60 ± 2.03
UM452 ?–24 −0.23 ± 0.05 0.69 ± 0.04 0.41 ± 0.05 0.93 ± 0.05 2.41 ± 0.05 0.29 ± 0.0824–26 0.00 ± 0.08 0.83 ± 0.06 0.51 ± 0.06 1.06 ± 0.06 2.60 ± 0.28 0.21 ± 0.5226–28 −0.33 ± 0.33 0.92 ± 0.28 0.58 ± 0.22 1.10 ± 0.23 2.88 ± 1.19 −0.13 ± 1.77
UM456 ?–24 −0.53 ± 0.04 0.36 ± 0.04 0.17 ± 0.04 0.40 ± 0.05 1.77 ± 0.15 0.34 ± 0.2224–26 −0.04 ± 0.05 0.47 ± 0.05 0.36 ± 0.05 0.71 ± 0.06 1.94 ± 0.78 1.06 ± 1.7626–28 −0.10 ± 0.34 0.49 ± 0.22 0.48 ± 0.26 0.79 ± 0.30
UM461 ?–24 −0.58 ± 0.09 0.68 ± 0.10 −0.10 ± 0.10 0.01 ± 0.09 1.15 ± 0.14 0.45 ± 0.2324–26 −0.37 ± 0.07 0.54 ± 0.05 0.23 ± 0.07 0.67 ± 0.07 2.08 ± 0.52 0.77 ± 1.3126–28 −0.45 ± 0.27 0.47 ± 0.14 0.38 ± 0.28 0.82 ± 0.24
UM462 ?–24 −0.69 ± 0.15 0.34 ± 0.06 0.04 ± 0.25 −0.01 ± 0.20 1.72 ± 0.09 0.45 ± 0.1124–26 −0.35 ± 0.15 0.47 ± 0.06 0.35 ± 0.25 0.50 ± 0.20 2.13 ± 0.50 0.18 ± 0.6826–28 −0.45 ± 0.33 0.75 ± 0.20 0.27 ± 0.33 0.53 ± 0.33
UM463 ?–24 −0.90 ± 0.11 0.74 ± 0.11 −0.01 ± 0.11 2.26 ± 0.50 0.15 ± 0.5024–26 −0.37 ± 0.10 0.78 ± 0.09 0.63 ± 0.09 2.31 ± 1.16 −0.26 ± 1.0026–28 −0.76 ± 0.44 0.98 ± 0.40 0.57 ± 0.35
UM465 ?–24 −0.32 ± 0.06 0.59 ± 0.04 2.48 ± 0.0624–26 −0.06 ± 0.06 0.74 ± 0.03 2.61 ± 0.1826–28 −0.24 ± 0.30 0.58 ± 0.13 3.10 ± 0.79
UM477 ?–24 0.14 ± 0.03 0.62 ± 0.02 0.50 ± 0.05 0.99 ± 0.02 2.73 ± 0.0624–26 0.56 ± 0.11 0.52 ± 0.04 0.43 ± 0.07 0.81 ± 0.0526–28 0.50 ± 0.16 0.47 ± 0.19 0.65 ± 0.25
UM483 ?–24 −0.31 ± 0.05 0.44 ± 0.07 0.18 ± 0.08 0.55 ± 0.07 2.07 ± 0.0924–26 −0.15 ± 0.11 0.55 ± 0.07 0.24 ± 0.08 0.67 ± 0.09 1.94 ± 0.3126–28 −0.13 ± 0.56 0.80 ± 0.19 0.25 ± 0.18 0.54 ± 0.32
UM491 ?–24 −0.43 ± 0.06 0.41 ± 0.05 0.26 ± 0.05 0.58 ± 0.05 2.20 ± 0.1424–26 −0.13 ± 0.06 0.65 ± 0.04 0.50 ± 0.04 0.88 ± 0.05 2.53 ± 0.2226–28 −0.02 ± 0.26 0.63 ± 0.10 0.76 ± 0.11 1.04 ± 0.14 2.81 ± 0.70
UM499 ?–24 −0.13 ± 0.06 0.63 ± 0.05 0.93 ± 0.04 2.70 ± 0.0924–26 0.18 ± 0.05 0.68 ± 0.05 1.02 ± 0.05 2.67 ± 0.1226–28 0.47 ± 0.25 0.62 ± 0.18 1.25 ± 0.20 3.15 ± 0.40
UM500 ?–24 −0.45 ± 0.02 0.62 ± 0.04 0.05 ± 0.05 0.25 ± 0.04 1.38 ± 0.14 0.07 ± 0.2024–26 −0.41 ± 0.09 0.68 ± 0.06 0.09 ± 0.08 0.35 ± 0.08 1.25 ± 0.93 −0.41 ± 1.0526–28 −0.47 ± 0.38 0.65 ± 0.27 0.09 ± 0.32 0.42 ± 0.36
UM501 ?–24 −0.55 ± 0.06 0.45 ± 0.06 0.06 ± 0.05 0.30 ± 0.06 1.33 ± 0.15 0.30 ± 0.4124–26 −0.29 ± 0.06 0.40 ± 0.05 0.25 ± 0.05 0.61 ± 0.06 1.47 ± 0.51 0.37 ± 1.6726–28 −0.33 ± 0.29 0.51 ± 0.13 0.21 ± 0.24 0.62 ± 0.23 1.87 ± 2.10
UM504 ?–24 −0.23 ± 0.09 0.53 ± 0.09 0.25 ± 0.07 0.64 ± 0.10 2.10 ± 0.08 0.27 ± 0.0824–26 −0.06 ± 0.10 0.74 ± 0.06 0.41 ± 0.05 0.94 ± 0.09 2.37 ± 0.20 0.30 ± 0.3526–28 −0.49 ± 0.57 0.78 ± 0.24 0.53 ± 0.21 0.87 ± 0.33
UM523A ?–24 −0.31 ± 0.07 0.34 ± 0.07 0.25 ± 0.05 0.63 ± 0.04 1.82 ± 0.0724–26 0.03 ± 0.11 0.38 ± 0.07 0.29 ± 0.07 0.76 ± 0.06 1.72 ± 0.3026–28 0.44 ± 0.64 0.52 ± 0.11 0.32 ± 0.23 0.96 ± 0.18
UM523B ?–24 −0.40 ± 0.07 0.25 ± 0.07 0.22 ± 0.05 0.59 ± 0.04 1.79 ± 0.0724–26 −0.28 ± 0.09 0.44 ± 0.07 0.37 ± 0.05 0.78 ± 0.05 2.04 ± 0.2126–28 −0.10 ± 0.33 0.58 ± 0.09 0.48 ± 0.12 0.94 ± 0.13 1.85 ± 1.09
UM533 ?–24 −0.12 ± 0.05 0.58 ± 0.04 0.32 ± 0.03 0.73 ± 0.03 2.03 ± 0.1024–26 0.29 ± 0.10 0.71 ± 0.04 0.42 ± 0.04 0.96 ± 0.03 2.06 ± 0.1826–28 1.22 ± 1.52 0.69 ± 0.08 0.31 ± 0.22 1.08 ± 0.14 1.92 ± 1.22
UM538 ?–24 −0.52 ± 0.07 0.51 ± 0.06 0.13 ± 0.08 0.59 ± 0.05 1.99 ± 0.0824–26 −0.07 ± 0.11 0.67 ± 0.07 0.31 ± 0.08 0.88 ± 0.06 1.97 ± 0.3126–28 −0.07 ± 0.49 0.74 ± 0.20 0.35 ± 0.20 0.92 ± 0.20 2.23 ± 1.12
UM559 ?–24 −0.32 ± 0.02 0.36 ± 0.04 0.18 ± 0.05 0.55 ± 0.05 1.65 ± 0.08 0.20 ± 0.3224–26 −0.31 ± 0.07 0.37 ± 0.05 0.26 ± 0.06 0.62 ± 0.10 1.81 ± 0.45 −0.43 ± 1.2526–28 −0.38 ± 0.35 0.49 ± 0.16 0.22 ± 0.21 0.58 ± 0.44 1.71 ± 2.56
poor (Z ∼ 0.004) host older than 5 Gyrs, while the nuclearstarburst is consistent with high metallicities (Z ∼ 0.02),an age > 50 Myr, and negligible contribution from nebularemission in any of the colors.
UM477
This is a gas–rich barred spiral with a central starburst re-gion, which is a member of an interacting pair. It is one ofonly two galaxies classified as SBN in our sample, the otherone being UM499 – another spiral. The burst metallicity isclose to solar, but the measured extinction is moderate (Ter-levich et al. 1991, Hα/Hβ = 4.50, 12 + logO/H = 8.69).
c© 2011 RAS, MNRAS 000, 1–48

Deep multiband surface photometry on 21 ELGs 33
Table 7. Host structural parameters. Absolute B magnitude of the host (MhostB ) obtained by subtracting the burst luminosity. The
scale length hr in arcseconds and kpc, and the central surface brightness µ0 based on a weighted least squares fit to the deepest image(B band) for two radial ranges derived from 24 . µB < 26 and 26 . µB . 28 mag arcsec−2. Correction for Galactic extinction (Schlegelet al. 1998) has been applied.
Galaxy µB MhostB h
′′r h
kpcr µB
0
UM422 24–26 −17.7 20.57 ± 0.75 2.71 ± 0.10 21.90 ± 0.1126–28 6.17 ± 0.22 0.81 ± 0.03 11.35 ± 0.58
UM439 24–26 −15.6 6.64 ± 0.10 0.65 ± 0.01 21.09 ± 0.0726–28 −14.9 10.71 ± 0.43 1.05 ± 0.04 22.92 ± 0.16
UM446 24–26 −14.6 3.38 ± 0.07 0.49 ± 0.01 21.49 ± 0.0826–28 −14.3 4.98 ± 0.18 0.72 ± 0.03 22.88 ± 0.14
UM452 24–26 −15.6 7.03 ± 0.10 0.87 ± 0.01 21.55 ± 0.0526–28 −15.6 8.58 ± 0.27 1.06 ± 0.03 22.31 ± 0.14
UM456 24–26 −15.9 9.50 ± 0.20 1.36 ± 0.03 22.00 ± 0.0626–28 7.34 ± 0.23 1.05 ± 0.03 21.02 ± 0.18
UM461 24–26 −14.1 3.77 ± 0.06 0.35 ± 0.01 21.42 ± 0.0726–28 −14.4 3.94 ± 0.06 0.37 ± 0.01 21.59 ± 0.09
UM462 24–26 −16.1 5.45 ± 0.07 0.52 ± 0.01 20.58 ± 0.0626–28 −14.4 15.59 ± 0.40 1.48 ± 0.04 24.12 ± 0.08
UM463 24–26 −13.1 1.59 ± 0.00 0.19 ± 0.00 20.72 ± 0.0226–28 −12.8 2.06 ± 0.26 0.24 ± 0.03 21.85 ± 0.62
UM465 24–26 −16.9 6.48 ± 0.03 0.65 ± 0.00 19.97 ± 0.0226–28 −15.9 9.37 ± 0.25 0.94 ± 0.03 21.82 ± 0.13
UM477 24–26 28.35 ± 0.49 3.19 ± 0.06 20.88 ± 0.0826–28 27.32 ± 0.52 3.07 ± 0.06 20.47 ± 0.12
UM483 24–26 −16.0 3.45 ± 0.16 0.62 ± 0.03 20.56 ± 0.2226–28 −15.2 5.54 ± 0.20 1.00 ± 0.04 22.46 ± 0.16
UM491 24–26 −15.9 4.36 ± 0.12 0.68 ± 0.02 20.63 ± 0.1226–28 −15.9 4.94 ± 0.13 0.78 ± 0.02 21.15 ± 0.15
UM499 24–26 −19.2 21.49 ± 0.18 3.57 ± 0.03 20.63 ± 0.0526–28 −18.4 29.60 ± 0.64 4.92 ± 0.11 22.25 ± 0.11
UM500 24–26 7.43 ± 0.34 1.22 ± 0.06 20.41 ± 0.2326–28 8.94 ± 0.24 1.46 ± 0.04 21.15 ± 0.16
UM501 24–26 −14.5 10.07 ± 0.36 1.60 ± 0.06 22.82 ± 0.0826–28 7.32 ± 0.27 1.16 ± 0.04 21.98 ± 0.19
UM504 24–26 −15.3 3.49 ± 0.03 0.56 ± 0.00 20.93 ± 0.0526–28 −15.6 3.51 ± 0.20 0.56 ± 0.03 20.88 ± 0.35
UM523A 24–26 9.14 ± 0.24 0.76 ± 0.02 19.43 ± 0.1626–28 9.75 ± 0.20 0.81 ± 0.02 19.84 ± 0.16
UM523B 24–26 −16.1 6.98 ± 0.24 0.58 ± 0.02 20.79 ± 0.1726–28 −15.6 9.67 ± 0.31 0.80 ± 0.03 22.18 ± 0.16
UM533 24–26 −15.3 13.81 ± 0.11 1.12 ± 0.01 22.18 ± 0.0426–28 −15.9 14.76 ± 0.22 1.20 ± 0.02 22.38 ± 0.07
UM538 24–26 −12.8 3.75 ± 0.04 0.31 ± 0.00 22.07 ± 0.0526–28 −12.5 6.17 ± 0.44 0.51 ± 0.04 23.63 ± 0.22
UM559 24–26 5.35 ± 0.21 0.56 ± 0.02 19.68 ± 0.2326–28 −15.2 7.97 ± 0.19 0.83 ± 0.02 21.59 ± 0.13
The star formation occurs along the spiral arms at largedistances from the center. This is reflected in the behaviorof the B−V vs V −R, V − I, or V −K colors in the regions24 . µB . 26 and 26 . µB . 28 mag arcsec−2, which showgreater age and more nebular emission contamination thanthe central colors. Judging by V − I vs. V −K the nucleusappears to be > 5 Gyr and of low metallicity (Z ∼ 0.004),with no hint of extinction in U −B.
UM483
UM4833 is a Wolf–Rayet galaxy (Schaerer et al. 1999), clas-sified as i0 BCD by Gil de Paz et al. (2003) and DHIIHby Salzer et al. (1989b). The star forming regions form an
3 Note that UM483 is misclassified on NED as a Seyfert 1, butthe given reference catalog (Veron–Cetty & Veron 2006) does notactually contain any object with similar RA and Dec.
ark–like structure surrounding the outskirts of a red hostwith regular elliptical isophotes. This galaxy has no HI com-panion (Taylor et al. 1996; Smoker et al. 2000). The burstis not particularly recent, U − B or V − I vs V −K colorsplace it somewhat younger than 1 Gyr and consistent withZ & 0.008 and negligible nebular emission contribution. Thehost is older than 2 Gyrs and of low metallicity Z . 0.004.
UM491
This is an nE BCG and a DHIIH galaxy. It has no HI com-panions (Taylor et al. 1996; Smoker et al. 2000) and low ex-tinction (Terlevich et al. 1991). B − V vs V − I or V − Kshows a metal–poor (Z ∼ 0.004) host older than 4 Gyr andan intermediate metallicity burst (Z ∼ 0.008) older than 10Myr. V − R vs. V − I indicates that contamination fromnebular emission is negligible.
c© 2011 RAS, MNRAS 000, 1–48

34 Micheva et al.
Figure 5. Upper panel: B–band µ0 in mag arcsec−2 vs. loggedhr in kpc, both measured over the µB = 26–28 mag arcsec−2
region. Lower panel: absolute magnitude of the burst vs. absolute
magnitude of the (assumed exponential) host. Marker size in bothpanels reflects the scale length. The colors indicate the relativeburst contribution to the total (burst+host) luminosity of eachtarget. Targets for which the burst strength estimation failed are
given with open circles. Errorbars are overplotted on each marker.
UM499
This Wolf–Rayet (Schaerer et al. 1999) galaxy is a nor-mal spiral, classified as a SBN because of its nuclear star-burst activity. The metallicity of the burst is fairly highas appropriate for normal galaxies, and the measured ex-tinction is significant (Terlevich et al. 1991, Hα/Hβ =8.32, 12+logO/H = 8.56). Its f25/f100 IRAS colors suggestthat the central starburst is only of moderate importance,since this flux ratio is low. Similarly to UM477, the star for-mation in this galaxy occurs along the spiral arms, givingthe 24 . µB . 26 and 26 . µB . 28 mag arcsec−2 regions ahigh metallicity (Z ∼ 0.02) as indicated by U −B or B− Vvs. V −K or V − I. The colors of the star formation regionare, however, dominated by an old population with an age& 8 Gyrs. The central colors show a similarly old popula-tion but of intermediate metallicity Z ∼ 0.008. Note thatthe profile break at µB ∼ 27.5 mag arcsec−2 corresponds toa real structure as seen in Figure A1.
UM500
Together with UM501 this SS galaxy forms a binary pairwith an extended HI bridge between the two (Taylor et al.1995). It is the more massive and extended of the two galax-ies in both the optical and HI . The measured extinction islow (Terlevich et al. 1991). Based on its somewhat regularalbeit noisy outer isophotes in the contour plot and the loca-tion of the star forming regions in the RGB image one couldclassify it as iE BCG. However, the presence of what lookslike spiral arm remnants make this a iI,M candidate. Thisis further supported by the appearance of the galaxy in theNIR, where the circular outer envelope is not observed atall. In the B band the host galaxy has a remarkably disk–like structure recognized both from the contour plot and thesurface brightness profile. The multiple star forming regionsare located at large radii from the center. The burst estima-tion fails here, but the total, central, and 24 . µB . 26 and26 . µB . 28 mag arcsec−2 region colors are all very simi-lar, require significant contribution from nebular emission tofit the tracks, and are clumped together in most color–colordiagrams. The similarity in color across different physical re-gions reflects the well–mixed nature of the morphology andwe cannot achieve enough separation between the host andthe burst to estimate its metallicity or age.
UM501
This MI galaxy is the second member of the binary pair.It is less massive in HI than its companion (Taylor et al.1995), and it also has slightly higher extinction and metal-licity than UM500 (Terlevich et al. 1991; Campos-Aguilaret al. 1993). Campos-Aguilar & Moles (1991) state that thisgalaxy has its starburst in a small companion or in an exter-nal HII region of the galaxy, but our deeper contour plot andRGB image show that in fact the numerous star forming re-gions are embedded beyond the 24.5th B band isophote in asingle object with vaguely elliptical isophotes. The isophotesare not regular even at very faint levels, however, indicatingthat this may be a merger of smaller objects. We give theclassification iI since we cannot be more specific withoutkinematic data on the individual starburst knots. The mor-phology of this galaxy is very similar to UM500, with numer-ous dispersed starburst knots at large and small radii fromthe center. The measured colors are again clumped togetherin the color–color diagrams and require a large contributionfrom nebular emission. We have a burst estimate for thistarget, but the surface brightness profile is remarkably flatinspite of the irregular burst morphology. This is an indica-tion that the excess luminosity above the exponential diskmust underestimate the actual burst luminosity. We see theeffect of this underestimation in all color–color diagrams –all metallicity tracks of both models fail to reproduce ourburst estimate.
UM504
This DHIIH galaxy has low extinction (Terlevich et al.1991). It possibly has an HI companion with no opticalcounterpart (Taylor et al. 1995), however, other authors donot detect any HI companions (Smoker et al. 2000). We clas-sify it as nE BCD based on its centrally located star form-
c© 2011 RAS, MNRAS 000, 1–48

Deep multiband surface photometry on 21 ELGs 35
ing region and regular outer isophotes seen in the contourplot. B − V vs. V − I or V −K indicate a very metal–poor(Z ∼ 0.001) host older than 5 Gyrs. Nebular emission contri-bution is not necessary to model most of the colors, thoughonly the burst can be modeled by both tracks with and with-out nebular emission in e.g. U−B and V −I vs H−K, thusindicating that some amount of nebular emission must stillbe present. The burst cannot be much younger than 1 Gyr.
UM523
This is an interacting pair, NGC4809 (our UM523A) andNGC4810 (our UM523B). No individual HI measurementsexist for the members of the pair, since they are in con-tact (beyond the 23.5th B isophote) and get confused inHI surveys. Both galaxies have very similar morphologies,with numerous compact blue star forming regions dispersedthroughout the individual disks, though an increase in theabundance of the star forming knots is notable near the con-tact region between the two. UM523A has very low extinc-tion (Terlevich et al. 1991), so it is reasonable to expect thesame for UM523B. Indeed, we see no dust reddening of thecentral isophotal U−B or B−V radial profiles. Both galax-ies have regular outer isophotes, so we classify each as iEBCGs.
UM523A (NGC4809)
Significant nebular emission is necessary to explain the col-ors in B−V vs. V −R and V −K. Different physical regionsin the galaxy give very similar colors, indicating that theyall contain a mixture of young and old stellar populations,together with gas. Due to this well–mixed nature we foundno conclusive constraints on the age and metallicity of any ofthe different regions. The burst estimation fails here, whichis just as well, since it would likely be a severe underesti-mate.
UM523B (NGC4810)
Nebular emission is similarly needed here to explain the totaland burst colors. The 26 . µB . 28 mag arcsec−2 regionis free from SF knots, and is consistent with a single, old(> 3 Gyrs), very metal–poor (Z ∼ 0.001) stellar populationin V −K vs. B−V , V −R, and V −I. The total and centralcolors are very similar in all diagrams though many of theSF knots can be found beyond the µB = 24 isophote. Thisimplies that our approximation underestimates the burst.
UM533
This is an iE BCD (Gil de Paz et al. 2003) and a MIgalaxy with non-negligible extinction (Terlevich et al. 1991,Hα/Hβ = 5.21, 12 + logO/H = 8.10). It has no HI com-panions (Taylor et al. 1995; Smoker et al. 2000). There area few star forming blue knots close to the galactic centerin the RGB image, but the extended regular elliptical hostseems to be the dominating component of this galaxy. Allregions except the burst estimate are well–fitted with a purestellar population in B − V vs. V − I or V − K diagrams,with an age > 5 Gyrs and very low metallicity (Z ∼ 0.001).
The total colors of the galaxy are very similar to the colorsin the outer regions, which is consistent with the observationthat the burst is not dominant. Nebular emission contribu-tion is required to fit the burst in U − B vs. B − V , andB − V vs. V − R and V − I diagrams, both indicating aburst age younger than 10 Myr and a moderate metallicity(Z ∼ 0.008).
UM538
This metal–poor SS galaxy is the least luminous inthe sample. It has no HI companions and low detectedHI mass (Taylor et al. 1995; Smoker et al. 2000), makingit one of the least massive galaxies in the sample as well. Itsonly star forming region is off–center, distorting the centralisophotes, so we classify it as iE BCD. The burst is not dom-inating, and cannot be fitted with tracks including nebularemission in any color–color diagram. A pure stellar popula-tion model fits all measurements. B−V vs V −K indicatesa burst age > 100 Myr with low metallicity (Z ∼ 0.004),and very low metallicity (Z ∼ 0.001) for the old (> 5 Gyrs)host, which is also supported by V − I vs V −K diagrams.
UM559
This SS galaxy has an HI companion (Taylor et al. 1995)and low extinction (Terlevich et al. 1991). It is very metal–poor and it is classified as iE/iI BCD by Papaderos et al.(2006). Compact starburst regions are visible in the out-skirts, but the RGB image hints at the presence of diffuseblue regions dispersed throughout the galaxy. This is consis-tent with the clustering we observe in color–color diagrams,where the colors of different regions are very similar to eachother. The nature of the sampled areas must obviously bewell–mixed, and we cannot distinguish an age or metallicityfor any separate physical component, but a significant neb-ular emission contribution is decidedly necessary to fit all ofthe measurements.
5 RESULTS AND DISCUSSION
In Figures 3 and 4 we present the distribution of thetotal absolute B band luminosity, the burst and the hostluminosities separately, the central surface brightness, thescale length and the Holmberg radius for all galaxies inthe sample. The sample contains mostly dwarfs, stronglypeaked at MB ∼ −16.7 mag, and two bright spirals withMB ∼ −20 mag. The luminosity of the hosts is naturallyfainter but already here we can conclude that the burst,although dominating the total galaxy luminosity, onlyincreases the light output by about a magnitude for mostgalaxies. Most galaxies in this sample also seem to be verycompact, with very similar scale lengths and Holmbergradii. There are of course outliers in both luminosity andsize, with some extremely faint and very extended galaxiesor vice versa, however, on the large there appears to be adistinct subgroup of objects with nearly identical sizes andluminosities. We will come back to this group later on in
c© 2011 RAS, MNRAS 000, 1–48

36 Micheva et al.
Table 8. Estimated luminosity in excess of the exponential disk defined by h′′r and µ0. The upper and lower
numbers for each galaxy are for disk properties derived from the radial ranges corresponding to 24 . µB < 26and 26 . µB . 28 mag arcsec−2, respectively. Fields are left blank where the estimation method failed. All
values have been corrected for Galactic extinction (Schlegel et al. 1998). The % column gives the B bandrelative burst contribution to the total galaxy luminosity.
Galaxy % B? (U − B)? (B − V )? (V − R)? (V − I)? (V − K)? (H − K)?
UM422 2 18.3 ± 0.1 −0.93 ± 0.12 0.68 ± 0.12 1.43 ± 0.07 1.67 ± 0.08 4.31 ± 0.10 1.67 ± 0.10
UM439 45 15.8 ± 0.1 −0.72 ± 0.08 0.29 ± 0.07 −1.18 ± 0.05 1.55 ± 0.0877 15.2 ± 0.2 −0.52 ± 0.17 0.34 ± 0.16 −0.06 ± 0.04 0.09 ± 0.06 2.09 ± 0.45
UM446 42 17.6 ± 0.1 0.43 ± 0.08 0.19 ± 0.04 0.12 ± 0.06 0.93 ± 0.06 0.05 ± 0.1369 17.1 ± 0.1 0.56 ± 0.15 0.29 ± 0.04 0.53 ± 0.06 0.92 ± 0.09
UM452 40 16.4 ± 0.1 −0.46 ± 0.06 0.50 ± 0.05 0.29 ± 0.05 0.71 ± 0.04 2.12 ± 0.03 0.31 ± 0.0658 16.0 ± 0.1 −0.19 ± 0.15 0.64 ± 0.15 0.35 ± 0.05 0.84 ± 0.05 1.92 ± 0.07 3.34 ± 0.11
UM456 32 16.6 ± 0.1 −0.90 ± 0.07 0.15 ± 0.07 −0.32 ± 0.04 −0.54 ± 0.05 1.04 ± 0.06 −0.25 ± 0.10
UM461 42 17.2 ± 0.1 −0.78 ± 0.08 0.84 ± 0.07 −0.46 ± 0.04 −1.13 ± 0.04 −0.57 ± 0.12 −0.60 ± 0.1647 17.1 ± 0.1 −0.63 ± 0.10 0.81 ± 0.09 −0.35 ± 0.05 −0.86 ± 0.05
UM462 43 15.5 ± 0.1 −0.97 ± 0.16 0.18 ± 0.07 −0.52 ± 0.25 −1.39 ± 0.20 0.76 ± 0.08 3.00 ± 0.1188 14.7 ± 0.1 −0.68 ± 0.16 0.31 ± 0.09 0.02 ± 0.25 −0.08 ± 0.20 1.65 ± 0.12 0.68 ± 0.12
UM463 37 19.1 ± 0.1 −1.30 ± 0.06 0.81 ± 0.06 −2.53 ± 0.0763 18.5 ± 0.6 −0.97 ± 0.62 0.75 ± 0.62 −1.11 ± 0.09 2.74 ± 0.50
UM465 34 15.2 ± 0.1 −0.68 ± 0.04 0.19 ± 0.04 2.05 ± 0.0676 14.4 ± 0.1 −0.33 ± 0.14 0.58 ± 0.14 2.33 ± 0.07
UM477
UM483 44 16.9 ± 0.2 −0.44 ± 0.22 0.34 ± 0.22 0.12 ± 0.08 0.42 ± 0.08 2.12 ± 0.0977 16.3 ± 0.2 −0.31 ± 0.17 0.37 ± 0.17 0.18 ± 0.08 0.49 ± 0.08 2.24 ± 0.09
UM491 47 16.5 ± 0.1 −0.63 ± 0.13 0.14 ± 0.13 −0.11 ± 0.05 0.03 ± 0.05 1.72 ± 0.1459 16.3 ± 0.2 −0.59 ± 0.16 0.15 ± 0.15 −0.32 ± 0.05 −0.00 ± 0.04 0.63 ± 0.14
UM499 15 15.2 ± 0.1 −0.97 ± 0.06 0.43 ± 0.06 0.12 ± 0.03 3.14 ± 0.0866 13.6 ± 0.1 −0.27 ± 0.11 0.66 ± 0.11 0.67 ± 0.04 2.25 ± 0.09
UM500
UM501 12 18.8 ± 0.1 −0.92 ± 0.08 0.61 ± 0.08 −0.65 ± 0.04 −1.56 ± 0.05 0.76 ± 0.06 0.80 ± 0.09
UM504 48 17.1 ± 0.1 −0.39 ± 0.06 0.31 ± 0.06 0.01 ± 0.04 0.17 ± 0.08 1.68 ± 0.05 0.40 ± 0.0745 17.2 ± 0.4 −0.22 ± 0.37 0.30 ± 0.35 −0.15 ± 0.06 0.08 ± 0.08 2.15 ± 0.06 −0.63 ± 0.25
UM523A
UM523B 28 15.9 ± 0.2 0.16 ± 0.18 −1.34 ± 0.1764 14.9 ± 0.2 −0.46 ± 0.17 0.00 ± 0.16 −0.36 ± 0.05 0.25 ± 0.05 0.60 ± 0.10
UM533 22 16.5 ± 0.1 −0.61 ± 0.05 0.27 ± 0.04 −0.01 ± 0.03 −0.44 ± 0.02 1.60 ± 0.0927 16.2 ± 0.1 −0.83 ± 0.09 0.38 ± 0.08 0.39 ± 0.03 −1.43 ± 0.02 1.48 ± 0.12
UM538 16 19.5 ± 0.1 −1.26 ± 0.06 0.01 ± 0.06 −1.68 ± 0.07 1.10 ± 0.0756 18.1 ± 0.2 −0.53 ± 0.22 0.38 ± 0.22 0.10 ± 0.08 0.52 ± 0.05 1.82 ± 0.09
UM55926 17.6 ± 0.1 −0.74 ± 0.14 0.35 ± 0.14 −0.37 ± 0.06 0.24 ± 0.07
the discussion.
Contrary to Paper I, in this sample we see no correlationbetween the central surface brightness and the scale length(upper panel, Figure 5). There is no trend for the more ex-tended hosts to be of fainter µ0. That is not surprising sincethe trend seems to appear most strongly for hosts whichqualify as true LSB galaxies, with µ0 & 23 mag arcsec−2,and the scatter in the relation increases significantly forbrighter µ0 (compare with Figure 9 in Paper I). In this sam-ple most objects fall above the µ0 ∼ 23 mag arcsec−2 line,although the bulk of the objects around hr ∼ 1 kpc andµ0 ∼ 22 mag arcsec−2 would fall on the correlation line de-fined by Figure 9 in Paper I. There is also no clear trend withincreasing relative burst contribution – most galaxies havemoderate burst strengths (∼ 50%) and those seem fairlyindependent of µ0 and hr. Similarly to Paper I, we find a
correlation between the luminosity of the burst and the lu-minosity of the host (lower panel, Figure 5). The brightestburst in absolute terms, the spiral galaxy UM499, corre-sponds to the brightest host as expected, but its relativeburst contribution is moderate, only ∼ 65% (yellow). Muchsmaller and intrinsically fainter galaxies in the sample, likeUM439 and UM483, have larger relative burst contributionsof ∼ 80% (orange).
Examining the surface brightness profiles in Figure 2 wesee that most profiles are very well fitted in the outskirtswith an exponential disk. In fact, there are no observedprofile breaks in the region 24 . µB . 28 mag arcsec−2 forthe vast majority of galaxies. UM462 is an exception, witha previously undetected extended second LSB componentbeyond µB = 26 mag arcsec−2. Two other galaxies showprofile breaks at faint isophotes – UM465 at µB ∼ 27.0 mag
c© 2011 RAS, MNRAS 000, 1–48

Deep multiband surface photometry on 21 ELGs 37
Figure 6. Comparing the structural properties of the host galax-ies in our BCG sample (orange and black stars) to those of dEs,dIs, LSB and BCD galaxies from the literature. dE, dI, BCDand some LSB data were obtained from Papaderos et al. (2008)
and references therein, while the giant LSB galaxies were takenfrom Sprayberry et al. (1995) and references therein. The orangestars indicate structural parameters derived from the physical re-gion corresponding to µB = 24−26 mag arcsec−2, while the black
stars are from the fainter µB = 26 − 28 region. Note that hr ishere in units of pc, not kpc.
arcsec−2, and UM499 at µB ∼ 27.5 mag arcsec−2. For thelatter two galaxies the structural parameters obtained froman exponential disk fit over the range 26− 28 mag arcsec−2
will be influenced by this change in profile slope, but theyare not an accurate measure of the faint components beyondµB ∼ 27.0 and µB ∼ 27.5 mag arcsec−2 for UM465 andUM499 respectively. These structures are real, as evidencedby the extremely faint contours in Figure A1.
There are a significant number of galaxies for which thehost is well approximated by a single exponential disk in theoutskirts all the way down to µB ∼ 28 mag arcsec−2. Forsuch targets, this implies that nebular emission cannot bedominating the brighter µB = 24–26 mag arcsec−2 regions.Even though BCG literature often does not present surfacebrightness profiles probing much fainter than the Holmbergradius, targets with no profile change at faint (µB > 26 magarcsec−2) isophotes should agree well with BCG structuralparameters in the literature for both µB = 24–26 mag
arcsec−2 and µB = 26–28 mag arcsec−2 regions. In Figure 6we compare the host structural parameters of our sampleto those compiled by Papaderos et al. (2008) for dE, dI,and blue compact dwarfs (BCD), and to the giant lowsurface brightness (LSB) spiral galaxies of Sprayberry et al.(1995). In contrast to the luminous BCGs of Paper I manygalaxies in this sample have µ0 and hr consistent withBCD data. The rest occupy the same parameter space asdE and dI. This is suggestive of a separation of BCGs intotwo groups, consistent with that proposed by Telles et al.(1997). As evidenced by the structural parameter space,the irregular extended BCGs in Paper I must have differentprogenitors than the more compact and regular ones inthis sample. We will get back to this in Micheva et al. (2012).
5.1 Color trends
We first acknowledge that with a maximum of 21 measure-ments of any photometric or structural quantity we are inthe regime of small number statistics, and we should notoverinterpret the observed distributions and trends in thesemeasurements.
The color histograms in Fig. 7 have bin sizes 0.1, 0.05, 0.05,0.1, 0.2 for U−B, B−V , V −R, V −I, and V −K respectively.In the first row of the figure, where the histograms of thetotal colors down to the Holmberg radius are presented, thechosen bin sizes are much larger than or equal to the averageerrors of the colors in Table 4. The same bin sizes are alsoappropriate for the second and third rows, where the centralcolors down to µB = 24 mag arcsec−2 and the colors between24 . µB . 26 mag arcsec−2 are presented (from Table 6).In the latter case increasing the bin size where necessary toexactly correspond to the average error, e.g. bin size a = 0.07from σ(V − R) = 0.07 instead of the used value a = 0.05,or bin size a = 0.3 from σ(V − K) = 0.3 instead of theused a = 0.2, does not significantly alter the shape of thehistogram, so we maintain the same bin size even here. Thecolors between 26 . µB . 28 mag arcsec−2, presented in thelast row of Fig. 7, however, have much higher average errorsthan the selected bin sizes. In some extreme cases like V −Ktaking the bin size to be the average error of σ(V −K) = 1.2will smooth all features in the histogram. We have thereforechosen to keep the same bin size in all histograms for aspecific color but in the 26 . µB . 28 mag arcsec−2 regionthe only meaningful statistic we can measure is the averagecolor.
In the B − V column of Fig. 7 the total colors showa seemingly bi–modal distribution, which separates thesample essentially in two equal halves. For the sake ofsimplicity we will refer to these “blue” and “red” galaxiesas GB and GR, respectively. These are listed in Table 9.This apparent separation is curious, because even thoughthe counts are small, the bin size is larger than or equal tothe relevant color errors for both groups. We do not knowwhat the actual distribution would look like, it may be flator even Gaussian – a Shapiro-Wilk normality test gives ap–value = 0.18 which does not reject the null hypothesis ata α = 0.1 significance level for our sample size. Additionally,we do not see this “bimodality” in any other filter and
c© 2011 RAS, MNRAS 000, 1–48

38 Micheva et al.
Figure 7. The distribution of colors measured over different regions of the galaxies – total color down to the Holmberg radius rH (toprow); central colors down to µB = 24 mag arcsec−2 (second row); color in the region 24 . µB . 26 mag arcsec−2 (third row); color in
the region 26 . µB . 28 mag arcsec−2 (last row). The bin sizes are 0.1, 0.05, 0.05, 0.1, 0.2 for U −B, B − V , V −R, V − I, and V −Krespectively, making the bin sizes greater than or equal to the average errors in the colors in the first row (Table 4). The GB and GR
groups in the text are marked with blue and red.
Figure 8. A follow–up on the different behavior of the blue and red (GB and GR in the text) groups defined from the total B−V colorhistogram in Figure 7. The marker coloring is self-evident, except in the scale length (hr) and central surface brightness (µ0) scatterplots, where the filled and open circles correspond to disk parameters defined over 24 . µB . 26, and 26 . µB . 28 mag arcsec−2,
respectively. The black/red diamonds are UM461 and UM500, which belong to GR but deviate in many of the plots. MB is the absoluteB band luminosity integrated down to rH in Vega magnitudes. The Hβ equivalent width is taken from Terlevich et al. (1991). TheHα/Hβ ratio, corrected for Galactic extinction, is estimated from the SDSS spectra where such existed.
c© 2011 RAS, MNRAS 000, 1–48

Deep multiband surface photometry on 21 ELGs 39
Figure 9. Integrated optical/NIR colors with SEMs tracks with (left panel) and without (right panel) nebular emission. From top to
bottom in both panels the plotted data points are the total colors over the entire area of the galaxy, the estimated burst colors downto µB = 24, the colors of the µB ∼ 24 − 26 halo region, and the colors of the µB ∼ 26 − 28 halo region. The data are corrected forGalactic extinction. The errorbars include different uncertainties depending on the case (see § 3.3), and the burst uncertainties may be
underestimated. The number of targets in the plots is not equal since the burst/host separation fails completely for a number of objectswith irregular morphology, or the integrated flux inside µB ∼ 26− 28 is negative for the K band. The left panel shows Yggdrasil trackswith nebular emission, with metallicities Z = 0.0004 (dotted), Z = 0.004 (dash–dotted), Z = 0.008 (dashed), and Z = 0.02 (line).The ages of 10 Myr (open square), 1 Gyr (open circle), and 14 Gyrs (open triangle) are marked for convenience. In the right panel the
tracks are for a pure stellar population with a Salpeter IMF, Mmin = 0.08M�, Mmax = 120M�, an e–folding time of 109 yr, and withmetallicity Z = 0.001 (dotted), Z = 0.004 (dash–dotted), and Z = 0.02 (line). The ages of 1 (open circle), 3 (open left triangle), 5 (opensquare), and 14 Gyrs (open triangle) are marked for convenience.
c© 2011 RAS, MNRAS 000, 1–48

40 Micheva et al.
Table 9. List of galaxies in GB and GR
GB GR
UM422 UM446UM439 UM452UM456 UM461
UM462 UM463UM483 UM465UM491 UM477UM501 UM499
UM523A UM500UM523B UM504UM559 UM533
UM538
hence GB and GR are unlikely to belong to a true bimodaldistribution. Nevertheless, GB and GR are clearly separatedin our data and we investigate their behavior further. Theseparation between blue and red BGCs is preserved inthe histogram of the central colors down to µB = 24 magarcsec−2 (Figure 7, second row), albeit with more smoothedpeaks. Such behavior is expected if the separation is due todifferences in the young population. Both GB and GR shifttowards bluer colors in this region due to the diminishedhost contribution. The same is true for the color in the24 . µB . 26 mag arcsec−2 region, showing that the burstcontamination to that region is still significant. In the26 . µB . 28 mag arcsec−2 region we expect that we aresampling exclusively host–dominated regions, and indeed,the trend is destroyed and we observe a redwards skeweddistribution instead.
In Figure 8 we examine the behavior of the GB and GR
galaxies in terms of various other properties. For theremainder of this subsection we exclude the two spiralgalaxies, UM477 and UM499, since they are not BCGs,or BCG–like. With the exception of a few outliers, B − Vshows a positive correlation with all other colors in thesense that GB is on average bluer than GR in everycolor. In terms of total galaxy luminosity, scale length,and central surface brightness both GB and GR behavein a similar fashion. From the literature we have furtherinvestigated the metallicity, HI mass, and Hβ equivalentwidths (EW (Hβ)) for the galaxies in GB and GR, andfind them similar, with both groups containing objects oneither end of the extremes. We also considered a possibledifference in inclination, with the ellipticity as proxy but,again, saw no significant differences. One defining differencebetween the blue and red BCGs is found when analyzingtheir typical morphology. All GB galaxies have multiplestar forming regions, highly irregular inner isophotes andonly vaguely elliptical outer isophotes. The GR galaxies,with the exception of UM461 and UM500, have predomi-nantly nuclear star forming regions or a single off–centeredcompact star forming knot. The outliers UM461 andUM500 both have multiple star forming knots and havebeen marked with black–red diamonds in Figure 8. A lookat Table 4 reveals that these two galaxies are red only inB − V , while in every other color they fall bluewards ofthe sample median. This is likely due to a nebular emissioncontribution, which would make B − V redder due to the
much stronger [OIII] λ5007 A line in the V band (typicalfilter transmission T > 70%), compared to Hβ λ4861 A inthe B band (T ∼ 25%). High nebular emission in bothof these galaxies is further indicated by their very highEW (Hβ) (Figure 8, bottom row, middle panel).
Other than morphology of the star formation regions dif-ferences in the strength of the star formation itself shouldcontribute to the separation between blue and red BCGs.We would naturally expect the blue BCGs to have strongerstar formation. However, the estimate of the relative star-burst strength fails with our method more often for GB thanfor GR, as is to be expected from the easier–to–fit surfacebrightness profiles of the nuclear starbursts. We therefore donot have enough galaxies populating a histogram of the rel-ative starburst contribution for GB to be able to tell if thisgroup is also defined by more dominating star formationthan GR. Differences in extinction in blue and red BCGsmay also enhance the separation between them. A quickcheck of Hα/Hβ ratios from SDSS spectra (bottom row,right panel of Figure 8) does indeed suggest a larger extinc-tion for the GR group, albeit this is based on very few GR
data points. The U − B color is very sensitive to extinc-tion, and should reflect extinction differences between thered and blue BCGs. Aside from a few outliers, the B−V vs.U − B plot in Figure 8 is consistent with GR having largerextinction. GB galaxies, on the other hand, all have similartotal U −B colors, which implies a similar age of the youngpopulation for these targets. Since this is a total color, i.e.integrated over the entire galaxy, it is a mixture of youngand old stars, as well as gas. It is curious that the differentcomponents for the individual GB galaxies all conspire toproduce similar total U − B colors. We will come back toGB and GR when we examine the asymmetry in § 5.3.
5.2 Stellar evolutionary tracks
In Figure 9 we compare the B − V vs V − K colors,measured over different physical regions of the galaxies,with the predictions from stellar evolutionary models. Themodel tracks with nebular emission (left column) assumezero redshift and instant burst, and are based on theYggdrasil spectral synthesis code (Zackrisson et al. 2011),whereas the pure stellar population tracks (right column)are based on Marigo et al. (2008) isochrones, are also atzero redshift, and have an exponential SFR decay of 1Gyr. The total colors (first row) for about half the sampleare redwards of V − K ∼ 2, having a low to moderatecontribution from nebular emission coming from the starforming regions. The rest of the galaxies bluewards ofV − K ∼ 2 have total V − K colors clearly incompatiblewith those of a pure stellar population and may sufferthe effects of nebular emission contamination and dustextinction. Examining only the burst color estimate downto µB = 24 mag arcsec−2 we see that they are better fittedwith nebular emission contribution, as expected. Most datapoints fall on or close to the model tracks, though someclearly are incompatible with this instant burst model,and would be better modeled with an extended burstinstead. The fit can only get better when we account forthe difference in used filters and the non-zero redshift of the
c© 2011 RAS, MNRAS 000, 1–48

Deep multiband surface photometry on 21 ELGs 41
Table 10. AP asymmetry in each filter measured inside the Petrosian radius r[η(0.2)], given here in kpc. In theoptical the S/N within the Petrosian radius is significantly high so that the typical errors are � 0.02 (rms), whilein the NIR the S/N often drops to low values of . 400 within r[η(0.2)], which gives typical errors of ∼ 0.05. Thesetypical errors have been estimated by Conselice et al. (2000).
Galaxy AU rU AB rB AV rV AR rR AI rI AH rH AK rK
UM422 0.58 7.7 0.43 7.7 0.44 7.6 0.39 7.2 0.40 7.4 0.43 7.2 0.55 5.4UM439 0.26 1.2 0.26 1.3 0.27 1.3 0.22 1.5 0.21 1.7 0.28 1.6UM446 0.11 0.7 0.11 0.7 0.13 0.9 0.11 1.0 0.40 1.0 0.32 1.0
UM452 0.27 1.5 0.24 1.7 0.23 1.8 0.24 1.8 0.23 2.0 0.31 2.0 0.27 2.0UM456 0.36 1.9 0.39 2.1 0.43 2.4 0.40 3.0 0.35 3.4 0.55 2.4 0.50 2.6UM461 0.45 0.7 0.42 0.7 0.47 0.7 0.44 0.7 0.35 0.9 0.48 0.9 0.49 0.8UM462 0.16 0.9 0.22 0.9 0.23 0.9 0.23 1.1 0.28 1.1 0.42 1.2 0.34 1.2
UM463 0.17 0.5 0.15 0.5 0.20 0.5 0.13 0.6 0.35 0.6 0.37 0.7UM465 0.19 0.3 0.09 0.6 0.16 0.8 0.14 1.2UM477 0.37 0.6 0.22 9.3 0.19 8.0 0.21 7.4 0.15 7.3 0.30 0.8
UM483 0.17 1.1 0.14 1.2 0.12 1.2 0.12 1.2 0.13 1.2 0.15 1.2UM491 0.23 1.1 0.22 1.2 0.21 1.2 0.20 1.4 0.19 1.4 0.20 1.4UM499 0.20 1.7 0.18 2.2 0.14 6.1 0.08 6.3 0.09 3.5UM500 0.63 4.7 0.36 4.7 0.42 4.7 0.41 4.7 0.31 4.9 0.45 4.7 0.42 4.7
UM501 0.49 3.0 0.46 3.3 0.43 3.0 0.44 3.8 0.47 4.1 0.65 2.4 0.59 3.5UM504 0.20 0.6 0.13 0.7 0.14 0.7 0.11 0.8 0.10 0.8 0.30 0.8 0.13 0.8UM523A 0.48 2.6 0.33 3.5 0.29 3.5 0.27 3.6 0.26 3.5 0.40 3.5UM523B 0.30 1.7 0.18 1.7 0.17 1.7 0.15 1.7 0.15 1.7 0.24 1.8
UM533 0.41 1.5 0.22 2.1 0.21 2.4 0.22 2.6 0.16 2.9 0.41 2.6UM538 0.28 0.5 0.23 0.7 0.22 0.8 0.19 0.9 0.19 0.9 0.37 0.8UM559 0.31 2.5 0.17 2.4 0.15 2.4 0.23 2.5 0.34 2.5 0.60 2.7 0.33 2.4
Figure 10. Left: distribution of AP asymmetry obtained overthe area enclosed by the Petrosian radius r[η(0.2)] for each galaxyand filter. Right: A′
H (black) over the area enclosed by the Holm-
berg radius, smoothed with 1 × 1 kpc box. Overplotted in red isAdyn asymmetry, obtained over the area enclosed by R27 in theoptical and R23 in the NIR, with star forming knots set to aconstant flux value. The bin size is 0.05 in both panels.
sample. The very red V −K outlier in that plot (Figure 9,left column, second row) is UM422, or rather the compositegalaxy together with the very extended neighbor. Thereare no visible blue knots of star formation inside the regionµB . 24 mag arcsec−2 for that galaxy, so we expect the
burst estimate to be very inaccurate for this target due toits morphology and profile shape, and the fact that we arenot actually measuring a star forming region. The region24 . µB . 26 mag arcsec−2 shows colors similar to the totalcolors in the first row of Figure 9, which implies that eitherthe starburst is not dominating the total galaxy colors, orthat the 24 . µB . 26 region is still very much stronglycontaminated by the burst contribution. The latter is notlikely since we observe continuous smooth profile slopesalong the entire 24 . µB . 28 region, and also becausewe have established that the relative burst contribution ison average moderate. Further, from the predominantly flatcolor profiles we observe in Figure 2 we would not expecta big change in the integrated color at larger radii. Thisis unfortunately difficult to see, since the 26 . µB . 28mag arcsec−2 region contains fewer measurements due tothe limiting effect of the K band. For the same reason,the errorbars here are large. Nevertheless, the location ofthe data points is here better fitted with the pure stellarpopulation model, with some very metal–poor (Z ∼ 0.001)and some very metal–rich Z ∼ 0.02 hosts older than afew Gyr. The three outliers close to the solar–metallicitytrack beyond V −K ∼ 3 are UM446, UM465, and UM499.Solar metallicity is not unusual for spiral galaxies, henceUM499 is not truly a deviating data point. With the helpof Hα data in Micheva et al. (2012) we will be able todiscern whether there is any nebular emission contributionat such radii for these three galaxies, and hence whetherone should compare them to the left or right panel tracksin Figure 9. For now we can conclude that the case for a socalled “red halo” (Bergvall & Ostlin 2002; Bergvall et al.2005; Zackrisson et al. 2006) in this sample of emission linegalaxies is weak, though if taken at face value the stellarevolutionary tracks imply unusually high metallicities for
c© 2011 RAS, MNRAS 000, 1–48

42 Micheva et al.
some hosts in the sample.
5.3 Asymmetries
In Table 10 and Figure 10 (left panel) we present the distri-bution of the Petrosian AP asymmetries measured in eachfilter down to the Petrosian radius r[η(0.2)]. Since the sam-ple consists exclusively of emission line galaxies, the com-posite asymmetry of a galaxy is usually dominated by theflocculent asymmetry, where we use the distinction “floccu-lent” and “dynamical” asymmetry as defined by Conseliceet al. (2000). This domination is further enhanced by ourchoice of the area over which the asymmetry is measured –Table 10 shows that the Petrosian r[η(0.2)] radius is usuallyquite small, and hence the enclosed area is limited to fairlybright surface brightness levels. This implies that for manygalaxies the dominating component to the total asymmetry(flocculent plus dynamical) will be the asymmetry due toindividual star forming knots, i.e. the flocculent asymmetry,best estimated by AP . The dynamical asymmetry contri-bution is underestimated in this way, because the tidal tailsand plumes usually associated with mergers and strong tidalinteractions, can be very faint and will thus lie beyond ther[η(0.2)] radius. Even if faint features were included theircontribution would be negligible since the asymmetry is lu-minosity weighted. In an attempt to obtain a better estimateof the dynamical asymmetry component in Paper I we ex-amined alternative asymmetry measurements, such as the“Holmberg” A′
H asymmetry and the purely dynamical Adyn
asymmetry. We will come back to these later on but firstlet us examine in detail the behavior of the Petrosian AP
asymmetry.
This is a volume limited sample with fairly similar redshifts(Table 2). The difference in distance to the galaxies variesat most by a factor of 2, and hence differences in measuredasymmetry values are not due to simple resolution effects.All optical filters show a strongly peaked distribution atsmall AP ∼ 0.2, which we expect since the minimum asym-metry is usually found in the starbursting knots, regardlessof their location in the galaxy. There are, of course, excep-tions to this as is the case for galaxies with starformingregions of comparable brightness located symmetrically oneither side of the geometric center, e.g. UM559, UM483 inthis sample. For most galaxies, the physical location of theminimum asymmetry does not change with filter, howeverthe value of the asymmetry does so, with the most dras-tic change observed when going from optical to NIR filters.The H and K histograms both show a distinct shift of themajority of the targets to much higher asymmetry values,AP ∼ 0.4, than in the optical. This change in asymmetryfrom optical to NIR reflects the change between flocculentto dynamical domination in the integrated asymmetry value.In the NIR the contribution to the light output of the galaxyfrom old stars is significant, while the burst is of diminishedimportance. Hence, we expect the NIR asymmetry to be areflection of the departure from the symmetric ground statedue to dynamical effects, such as merging or tidal interac-tions. We can distinguish three groups of galaxies based ontheir AP asymmetry behavior in the optical and NIR.
Table 11. Minimum asymmetries measured in each filter. The
two numbers per filter per galaxy are Holmberg A′H asymmetry
measured over the area enclosed by the Holmberg radius r(µ =26.5) in the optical and by r(µ = 23) in the NIR (top value), andthe dynamical Adyn asymmetry, with regions µ < 25 (µ < 21)
set to 25 (21) mag arcsec−2 in the optical (NIR) (bottom value).The images are pre–processed by a boxcar average of size 1 × 1kpc.
Galaxy AU AB AV AR AI AH AK
UM422 0.41 0.36 0.34 0.30 0.28 0.25 0.32
0.18 0.15 0.15 0.13 0.12 0.23 0.29UM439 0.09 0.09 0.10 0.15 0.18 0.10
0.13 0.12 0.16 0.21 0.21 0.11UM446 0.05 0.05 0.05 0.06 0.08 0.10
0.03 0.05 0.08 0.11 0.10 0.12UM452 0.10 0.11 0.11 0.11 0.11 0.21 0.12
0.10 0.05 0.08 0.08 0.10 0.24 0.11
UM456 0.23 0.28 0.30 0.28 0.26 0.35 0.350.11 0.09 0.08 0.10 0.13 0.27 0.32
UM461 0.20 0.20 0.23 0.20 0.16 0.09 0.110.09 0.08 0.08 0.10 0.10 0.09 0.10
UM462 0.07 0.09 0.10 0.10 0.13 0.10 0.140.10 0.06 0.08 0.10 0.12 0.08 0.08
UM463 0.04 0.02 0.04 0.09 0.11 0.080.06 0.02 0.05 0.06 0.14 0.06
UM465 0.04 0.04 0.04 0.040.06 0.05 0.05 0.05
UM477 0.20 0.14 0.12 0.11 0.10 0.080.17 0.11 0.10 0.12 0.11 0.09
UM483 0.08 0.07 0.07 0.08 0.07 0.080.08 0.07 0.16 0.12 0.15 0.07
UM491 0.12 0.12 0.12 0.11 0.11 0.100.08 0.06 0.07 0.11 0.12 0.06
UM499 0.12 0.09 0.08 0.07 0.080.15 0.11 0.18 0.14 0.14
UM500 0.36 0.28 0.29 0.27 0.25 0.25 0.26
0.11 0.11 0.11 0.11 0.12 0.21 0.22UM501 0.37 0.34 0.31 0.30 0.29 0.25 0.26
0.13 0.11 0.11 0.19 0.24 0.25 0.26UM504 0.04 0.05 0.04 0.05 0.06 0.06 0.07
0.08 0.03 0.03 0.05 0.19 0.05 0.06UM523A 0.27 0.24 0.22 0.21 0.21 0.22
0.21 0.10 0.09 0.13 0.15 0.13UM523B 0.21 0.10 0.12 0.10 0.12 0.10
0.18 0.14 0.13 0.13 0.11 0.12UM533 0.13 0.08 0.08 0.08 0.06 0.09
0.06 0.03 0.03 0.06 0.08 0.06UM538 0.08 0.06 0.08 0.06 0.05 0.04
0.03 0.04 0.09 0.07 0.07 0.04UM559 0.20 0.12 0.12 0.11 0.12 0.21 0.09
0.16 0.12 0.12 0.13 0.20 0.21 0.09
• Small optical and small NIR AP asymmetry:These are predominantly members from the nE BCG class,have regular isophotes, and include all the nuclear star-bursts. Thus, they have small flocculent and small dynamicalasymmetries. They are UM439, UM452, UM465, UM477,UM483, UM491, UM499, and UM504.
• Small optical and large NIR AP asymmetry: Thisgroup is characterized by having a spatially extended burstregion, or multiple SF knots off–center. The host is otherwiseregular at faint isophotes, i.e. the dominant morphologicalclasses here iE and SS BCGs. These are UM446, UM462,UM463, UM523A, UM523B, UM533, UM538, and UM559.
c© 2011 RAS, MNRAS 000, 1–48

Deep multiband surface photometry on 21 ELGs 43
Figure 11. B − V total color (Table 4) vs. the AP asymmetry in the R (left panel), and the I bands (right panel). The markers arecolor–coded by their B band asymmetry, while their size reflects their Holmberg radius rH . The gray area is the location of the fiducialgalaxy color–asymmetry sequence as defined in Conselice et al. (2000).
Table 12. Concentration parameter for each filter
Galaxy CU CB CV CR CI CH CK
UM422 2.2 2.5 2.6 2.6 2.7 2.8 2.4UM439 2.2 2.2 2.4 2.7 2.7 2.7
UM446 2.4 2.4 2.7 3.0 3.0 2.1UM452 2.2 2.6 2.7 2.7 2.9 2.9 2.9UM456 2.4 2.9 3.0 3.2 3.3 2.7 3.2UM461 1.8 1.8 1.5 2.1 2.4 2.4 2.2
UM462 2.4 2.6 2.6 2.4 2.4 2.6 2.6UM463 1.5 1.5 1.5 2.0 2.0 2.0UM465 1.5 2.1 2.8 3.5UM477 2.4 2.7 3.0 3.2 3.2 3.3
UM483 1.8 2.1 2.1 2.1 2.1 2.1UM491 1.8 2.1 2.4 2.4 2.4 2.4UM499 2.4 2.6 4.0 3.7 3.2UM500 2.4 2.6 2.4 2.7 2.4 2.6 2.3
UM501 3.0 2.7 2.7 2.9 2.7 2.5 2.8UM504 1.5 2.0 2.4 2.7 2.7 2.7 2.7UM523A 3.3 2.7 2.6 2.6 2.6 2.5
UM523B 2.8 2.7 2.8 2.4 2.5 2.5UM533 2.4 2.8 2.8 2.9 2.8 2.8UM538 2.4 2.4 2.6 2.8 2.8 2.6UM559 2.2 2.1 2.4 2.5 2.5 2.7 2.5
This group has small flocculent and large dynamical asym-metries.
• Large optical and large NIR AP asymmetry: Thisgroup contains all galaxies with highly irregular morpholo-gies and/or numerous SF knots. These are UM422, UM456,UM461, UM500, and UM501. Note that all targets classi-fied as mergers (iI ) are found here. This group has largeflocculent and large dynamical asymmetries.
Interestingly, we found no galaxies with large optical and
small NIR AP asymmetries in this sample. If we use opticalasymmetry as a proxy for the flocculent asymmetry com-ponent, and NIR asymmetry as a proxy for the dynamicalasymmetry component, then such a combination would im-ply a galaxy in or close to the symmetric ground state butwith a non-nuclear starforming region. This is difficult toachieve because any compact localized off-center star forma-tion presumably would require some sort of tidal interactionor merger to trigger, which in turn would raise the dynam-ical asymmetry value. While possible, such morphologicalsetup is obviously rare.
There is a known correlation between the (blue) color andthe (red) AP asymmetry for spheroids, disks and irregu-lars (Conselice et al. 2000), and in Figure 11 we compare thetotal B−V color of the galaxies in the sample to the R andI asymmetries. We have estimated the region of the fiducialgalaxy color-asymmetry sequence by Conselice et al. (2000),and plotted it for comparison. Galaxies deviating from thissequence are too asymmetric for their observed color, whichis an indication of a merger or ongoing interaction. All ofthe potential mergers in the group with large optical andNIR asymmetries are indeed located to the right of thefiducial line. Star formation alone cannot account for theirmeasured asymmetries, and a boost to the asymmetry bydynamical processes is needed. We note that our previoussuspicions about the merger nature of UM500 are reinforcedin this figure, with UM500 falling clearly to the far rightof the fiducial line. We find this convincing and now firmlyclassify UM500 as a iI,M BCG. This means that the galaxygroup with large optical and large NIR AP asymmetrynow exclusively captures all classified mergers in our sample.
The fact that the Petrosian AP asymmetry varies with
c© 2011 RAS, MNRAS 000, 1–48

44 Micheva et al.
Figure 12. Petrosian asymmetry (AP ) vs. all alternative asym-metry measurements. AH is the Holmberg asymmetry without
any smoothing of the images, while a 1 × 1 kpc smoothing boxhas been applied to A′
P (Petrosian), A′H (Holmberg), and dynam-
ical Adyn asymmetry. The uninterrupted lines are least square fits
to the similarly colored data points. The dashed line has a slopeof 1. The dotted line is an extrapolation from the correlationof Conselice (2003) for E, S0, Sa–b, Sc–d and Irr, which lie be-yond AP ∼ 0.6. All asymmetries here are from the I band, in
order to facilitate comparison with Conselice (2003).
wavelength regime is a strong indication that it is not com-pletely flocculent dominated as was the case in Paper I. Ifthis is the case it should be also evident from the behavior ofthe alternative asymmetry measurements shown in Table 11and described in § 3.4. The right panel of Figure 10 showsthe distribution of the Holmberg A′
H and the dynamicalAdyn asymmetries. The A′
H distribution differs significantlyfrom the AP values. The grouping by optical/NIR asym-metry we presented above is now destroyed, and only twomajor groups emerge – one with small (. 0.2) optical andsmall NIR A′
H which contains the majority of the galaxies,and one with large (& 0.2) optical and large NIR A′
H , whichcontains UM422, UM456, UM500, UM501, and UM523A.The fact that A′
H does not follow the same distributionas AP implies that, contrary to Paper I, the latter is notcompletely flocculent dominated and the contribution of thedynamical component to AP is not insignificant. We alsonote that the K band A′
H asymmetry is nearly identical tothe dynamical Adyn asymmetry distribution. The same istrue for the H band but is better seen comparing the A′
H
and Adyn values in Table 11. This confirms our assumptionthat the NIR asymmetry is a very good proxy of thedynamical asymmetry component. Further, in the Adyn
asymmetry distribution there are essentially no galaxieswith large (& 0.2) optical asymmetries. This is consistentwith the optical asymmetry being flocculent dominated,a dominance which is effectively neutralized through ourmethod of obtaining Adyn. In terms of morphologicalclass we would expect Adyn to only be able to distinguishmergers from the rest. Indeed, the galaxies here fall intotwo groups, the majority having small (. 0.2) opticaland NIR Adyn asymmetries. The exceptions are UM422,UM456, UM500, and UM501, all of which are mergers, andhave optical Adyn ∼ 0.1 and a much larger NIR Adyn ∼ 0.3
Figure 13. GB (blue circles) and GR (red circles) in a Holmbergradius (rH) vs. dynamical B band asymmetry (Adyn) parameterspace. The black/red circles are the deviating GR galaxies UM461and UM500. The two spiral galaxies are not included in the plot.
(averaged values). In other words, our measure of the purelydynamical component, Adyn, successfully represents theeffect mergers have on the morphology of a galaxy. Notethat A′
H performs nearly as well in distinguishing mergersfrom non-mergers (one false positive notwithstanding),and is therefore an acceptable measure of the dynamicalasymmetry for the low luminosity BCGs in our sample.
In Figure 12 we plot these alternative asymmetry mea-surements versus the Petrosian AP asymmetry. Similarto Paper I, we find a strong correlation between thesmoothed and unsmoothed Holmberg (A′
H , AH) and Pet-rosian (A′
P , AP ) asymmetries. The correlation coefficientsfor AP vs A′
P , A′H , AH are R = 0.8, 0.9, 0.9, with line
slopes m = 0.60, 0.62, 0.87 respectively. Contrary to Pa-per I we also find a medium strength correlation betweenAP (predominantly flocculent) and Adyn (dynamical) asym-metries. Pearson’s R for this correlation is ∼ 0.4, which isonly marginally significant for a sample of this size. This isconsistent with our findings for the BCG sample of Paper I.
Figure 13 shows the behavior of the blue GB and redGR BCGs (defined in § 5.1) in terms of the dynamicalasymmetry component Adyn and Holmberg radius, rH .There is only a weak trend for the GB galaxies to havelarger Holmberg radii and hence to be more extended butclearly they have higher dynamical asymmetries than theGR galaxies. While we established in § 5.1 that the starformation morphologies between blue and red BCGs clearlyvary, the dynamical asymmetries suggest that also themorphologies of the underlying hosts of blue and red BCGsare different. As we already saw in the preceding discussionsome of the GB galaxies are clearly mergers or show signs ofstrong tidal interaction. Other members of the GB group,e.g. UM491 or UM483, seem unlikely merger candidatesyet they, too, display high dynamical asymmetries andblue colors. It is possible that the dynamical asymmetrycomponent allows us to identify not only the obvious majormergers but also the more “mature” or minor ones. For
c© 2011 RAS, MNRAS 000, 1–48

Deep multiband surface photometry on 21 ELGs 45
example, the location and morphology of the star formingregions in UM491 or UM483 are suggestive of a long passeddynamical disturbance. We will investigate the ability ofAdyn to detect minor mergers in detail in Micheva et al.(2012).
The galaxies in our sample are clearly separated fromspheroids and early and late type disks in the concentration–asymmetry parameter space (Figure 14). They occupy thesame region as the BCGs in Paper I, with large asymmetriesand small concentration indices. Note that BCGs show sig-nificant scatter in the concentration–asymmetry parameterspace compared to normal galaxies.
6 CONCLUSIONS
We have presented deep broadband imaging data inUBV RIHKs for a volume limited (11 6 Ra 6 14h,v 6 2100 km s−1) sample of 21 emission line galaxies,comprising 19 BCGs and two spirals. We have analyzedthe surface brightness and radial color profiles, contourmaps and RGB images of the galaxies, and provided amorphological classification based on Loose & Thuan(1986) where such was missing in the literature. Separatingeach galaxy into different regions, we were able to obtaina central surface brightness and scale length from tworadial ranges, estimate the burst luminosity and its relativecontribution to the total light, as well as investigate thebehavior of the regions in terms of color with respect toother galaxy properties.
Most of the galaxies have no break in the surface brightnessprofiles in the outer parts, and are well fitted with a singleexponential throughout the range µB = 24 − 28 magarcsec−2. For UM462 we observe a previously undetectedsecond exponential disk component which dominates theprofile beyond µB ∼ 26 mag arcsec−2. This componentis symmetrically extended to the North and South of thecentral galaxy regions, and is also clearly visible in thecontour plot. The presence of this component makes theUM462 host a true low surface brightness galaxy, with acentral surface brightness of µB = 24.1 mag arcsec−2 and ascale length hr = 1.48 kpc.
Comparing the integrated colors for different componentsof the galaxy, i.e. burst, host, and composite total, tostellar evolutionary models both with and without nebularemission contribution we are able to give indications ofthe metallicity and age of both the young burst and thehost populations in quite a few cases. The models indicatethat the typical host galaxy is metal poor (Z . 0.004),though some hosts require an unexpectedly high metallicity(Z ∼ 0.02). A careful investigation of such cases will beprovided in a future paper (Micheva et al. 2012).
We have derived Petrosian AP asymmetries based on theregion inside the Petrosian radius r[η(0.2)] for each galaxyin each filter. The center of asymmetry minimum staysconstant in all filters for most galaxies. We detect a strongpeak of the asymmetry distribution of the galaxies in theoptical around AP ∼ 0.2, which shifts to AP ∼ 0.4 in the
NIR for the majority of galaxies, though some retain theirsmall 0.2 asymmetry value. This separates the galaxiesinto three different groups based on the behavior of theAP asymmetry in the different filters. These groups arecorrelated with the morphological class of a galaxy, nEshaving small optical and NIR asymmetries, iEs havingsmall optical and large NIR asymmetries, and iI s andiI,M s having both large optical and NIR asymmetries.The latter group is clearly deviating from the fiducialgalaxy color–asymmetry sequence of Conselice et al. (2000)for spheroidals, disks and irregulars, which is consistentwith the group’s morphological classification as tidallyinteracting/merging galaxies.
The Petrosian AP asymmetry for this sample is dominatedby the flocculent component (i.e. due to the star formation),though to a lesser extent than for the luminous BCGs inPaper I. The alternative asymmetry measurements wehave used carry valuable additional information which isunavailable if one solely considers AP . Our “Holmberg”(A′
H) and “dynamical” (Adyn) asymmetries confirm thatNIR asymmetry is a good proxy for the dynamical asym-metry component (i.e. due to the galaxy morphology).Similar to Paper I we find that the dynamical asymmetrycomponent is weakly, if at all, correlated with AP . Wefind a strong correlation between AP and A′
H in the sensethat A′
H ≈ 0.62 × AP − 0.003. This should be comparedto Conselice (2003) who finds A′
Global ≈ 0.67×AP + 0.01.
The BCGs in the sample, i.e. excluding the two spiralgalaxies, seem to divide into a blue and red groups in allcolors. This division is due to differences in star formationand nebular emission contribution, with the blue BCGshaving brighter, more extended, and more irregular starforming regions compared to the red ones. The hosts of theblue BCGs also show higher dynamical asymmetries (Adyn).
In a concentration–asymmetry plot emission line galaxiesoccupy the region with low concentration and high asym-metry, i.e. it is not possible to distinguish between luminousblue compact galaxies and the less vigorously star forminggalaxies of this sample in this parameter space. This is in-teresting considering the otherwise very different behaviorand structural parameters of the galaxies in this paper andthe luminous blue compacts of Micheva et al. (2012).
ACKNOWLEDGMENTS
Part of the data presented in this paper is based onobservations made with the Nordic Optical Telescope,operated on the island of La Palma jointly by Denmark,Finland, Iceland, Norway, and Sweden, in the SpanishObservatorio del Roque de los Muchachos of the Institutode Astrofisica de Canarias. ALFOSC is provided by theInstituto de Astrofisica de Andalucia (IAA) under a jointagreement with the University of Copenhagen and NOTSA.Part of the observations are collected at the EuropeanOrganization for Astronomical Research in the SouthernHemisphere, Chile, (including the corresponding observingproposal which should clearly be identified by its ESO
c© 2011 RAS, MNRAS 000, 1–48

46 Micheva et al.
Figure 14. Concentration vs Petrosian AP Asymmetry for our sample (red text) compared to spheroids, early and late type disks, andirregulars taken from Conselice et al. (2000) and the BCG galaxies from Paper I. To make all labels as readable as possible we omittedthe SBS0335–052E measurement from Paper I. The red text indicates the UM number of the respective galaxy.
number, e.g. 072.A-0555)
G.O. is a Royal Swedish Academy of Sciences Research Fel-low supported by a grant from the Knut and Alice Wal-lenberg Foundation. G.O. acknowledges support from theSwedish research council (VR) and the Swedish NationalSpace Board. E.Z. acknowledges research grants from theSwedish Research Council and the Swedish National SpaceBoard. J.M. and I.M. acknowledge financial support fromthe Spanish grant AYA2010-15169 and from the Junta deAndalucia through TIC-114 and the Excellence Project P08-TIC-03531.This work made use of the NASA/IPAC ExtragalacticDatabase (NED) which is operated by the Jet PropulsionLaboratory, California Institute of Technology, under con-tract with the National Aeronautics and Space Administra-tion.
APPENDIX A: EXTREMELY FAINTCONTOURS
In Figure A1 we present extremely faint contours of thegalaxies in the sample. Both contours and images have beenheavily smoothed to reduce noise. The diagonal streak fea-tures in the UM422 image are satellite tracks.
A1 UM462
Figure A2 shows a zoom of the spectacular low surfacebrightness features of UM462.
REFERENCES
Bergvall N., Marquart T., Persson C., Zackrisson E., OstlinG., 2005, in A. Renzini & R. Bender ed., MultiwavelengthMapping of Galaxy Formation and Evolution StrangeHosts of Blue Compact Galaxies. p. 355
Bergvall N., Ostlin G., 2002, A&A, 390, 891Bershady M. A., Jangren A., Conselice C. J., 2000, AJ,119, 2645
Cairos L. M., Caon N., Papaderos P., Noeske K., VılchezJ. M., Garcıa Lorenzo B., Munoz-Tunon C., 2003, ApJ,593, 312
Cairos L. M., Caon N., Vılchez J. M., Gonzalez-Perez J. N.,Munoz-Tunon C., 2001, ApJS, 136, 393
Cairos L. M., Vılchez J. M., Gonzalez Perez J. N., Iglesias-Paramo J., Caon N., 2001, ApJS, 133, 321
Campos-Aguilar A., Moles M., 1991, A&A, 241, 358Campos-Aguilar A., Moles M., Masegosa J., 1993, AJ, 106,1784
Conselice C. J., 2003, ApJS, 147, 1Conselice C. J., Bershady M. A., Jangren A., 2000, ApJ,529, 886
Doublier V., Caulet A., Comte G., 1999, AAPS, 138, 213Gil de Paz A., Madore B. F., Pevunova O., 2003, ApJS,147, 29
Lang D., Hogg D. W., Mierle K., Blanton M., Roweis S.,2010, AJ, 139, 1782
Loose H.-H., Thuan T. X., 1986, in D. Kunth, T. X. Thuan,J. Tran Thanh Van, J. Lequeux, & J. Audouze ed., Star-forming Dwarf Galaxies and Related Objects The mor-phology and structure of blue compact dwarf galaxiesfrom CCD observations.. pp 73–88
Lupton R., Blanton M. R., Fekete G., Hogg D. W.,O’Mullane W., Szalay A., Wherry N., 2004, PASP, 116,133
Marigo P., Girardi L., Bressan A., Groenewegen M. A. T.,
c© 2011 RAS, MNRAS 000, 1–48

Deep multiband surface photometry on 21 ELGs 47
Figure A1. Extreme contours. Numbers in red/black indicate the isophotal level of the red/black contour in mag arcsec−2.
Silva L., Granato G. L., 2008, A&A, 482, 883
Masegosa J., Moles M., Campos-Aguilar A., 1994, ApJ,420, 576
Micheva G., Ostlin G., Bergvall N., Zackrisson E., 2012, inpreparation
Micheva G., Ostlin G., Bergvall N., Zackrisson E.,Masegosa J., Marquez I., Marquart T., Durret F., 2012,submitted to MNRAS
Micheva G., Zackrisson E., Ostlin G., Bergvall N., PursimoT., 2010, MNRAS, 405, 1203
Nava A., Casebeer D., Henry R. B. C., Jevremovic D., 2006,ApJ, 645, 1076
Noeske K. G., Papaderos P., Cairos L. M., Fricke K. J.,2003, A&A, 410, 481
Papaderos P., Guseva N. G., Izotov Y. I., Fricke K. J., 2008,A&A, 491, 113
Papaderos P., Guseva N. G., Izotov Y. I., Noeske K. G.,
Thuan T. X., Fricke K. J., 2006, A&A, 457, 45
Papaderos P., Loose H.-H., Fricke K. J., Thuan T. X., 1996,A&A, 314, 59
Papaderos P., Loose H.-H., Thuan T. X., Fricke K. J., 1996,AAPS, 120, 207
Salzer J. J., 1989, ApJ, 347, 152
Salzer J. J., MacAlpine G. M., Boroson T. A., 1989a, ApJS,70, 447
Salzer J. J., MacAlpine G. M., Boroson T. A., 1989b, ApJS,70, 479
Schaerer D., Contini T., Pindao M., 1999, AAPS, 136, 35
Schlegel D. J., Finkbeiner D. P., Davis M., 1998, ApJ, 500,525
Smoker J. V., Davies R. D., Axon D. J., Hummel E., 2000,A&A, 361, 19
Sprayberry D., Impey C. D., Bothun G. D., Irwin M. J.,1995, AJ, 109, 558
c© 2011 RAS, MNRAS 000, 1–48

48 Micheva et al.
Figure A1 – continued
Taylor C. L., Brinks E., Grashuis R. M., Skillman E. D.,1995, ApJS, 99, 427
Taylor C. L., Brinks E., Grashuis R. M., Skillman E. D.,1996, ApJS, 102, 189
Telles E., Melnick J., Terlevich R., 1997, MNRAS, 288, 78Telles E., Terlevich R., 1995, MNRAS, 275, 1Telles E., Terlevich R., 1997, MNRAS, 286, 183Terlevich R., Melnick J., Masegosa J., Moles M., CopettiM. V. F., 1991, AAPS, 91, 285
Thuan T. X., Martin G. E., 1981, ApJ, 247, 823van Zee L., Skillman E. D., Salzer J. J., 1998, AJ, 116, 1186Zackrisson E., Bergvall N., Ostlin G., Micheva G., LeksellM., 2006, ApJ, 650, 812
Zackrisson E., Rydberg C.-E., Schaerer D., Ostlin G., TuliM., 2011, ApJ, 740, 13
This paper has been typeset from a TEX/ LATEX file preparedby the author.
c© 2011 RAS, MNRAS 000, 1–48

Deep multiband surface photometry on 21 ELGs 49
Figure A2. A zoom on UM462. Note that these spectacular faint features bear a striking morphological similarity to NGC 5128(Centaurus A). The black contours are at µB = 27.9 mag arcsec−2.
c© 2011 RAS, MNRAS 000, 1–48