deep sea bottom-simulating-reflectors: calibration of · pdf filedeep sea...
TRANSCRIPT

Earth and Planetary Science Letters, 109 (1992) 289-301 289 Elsevier Science Publishers B.V., Amsterdam
[MK]
Deep sea bottom-simulating-reflectors: calibration of the base of the hydrate stability field as used for heat flow estimates *
R.D. Hyndman a, j .p. Foucher b M. Yamano c, A. Fisher d and Scientific Team of Ocean Drilling Program Leg 131 **
a Pacific Geoscience Centre, Geological Survey of Canada, P.O. Box 6000, Sidney, B.C. V8L 4B2, Canada b IFREMER / CB, BP 70, 29280 Plouzane, France
c Earthquake Research Institute, University of Tokyo, 1-1-1 Yayoi, Bunkyo-ku, Tokyo 113, Japan d Ocean Drilling Program, Texas A and M University, Research Park, 1000 Discovery Drive, College Station, Texas, USA
Received February 6, 1991; revision accepted November 4, 1991
ABSTRACT
Ocean Drilling Program and Deep Sea Drilling Project downhole data from three areas, the southwestern Japan Nankai margin, the continental slope off Peru, and the Blake-Bahama Outer Ridge, provide temperature calibrations for bottom simulating reflectors (BSR) that mark the base of a clathrate hydrate stability field. The inferred temperatures at BSRs provide an important reference for the mapping of geothermal gradient and heat flow from subduction zone accretionary sedimentary wedges. The borehole results provide information on which stability field is applicable for the BSRs and thus calibrate the heat flow estimates. While an ideal calibration has not been possible, the BSR temperatures at the three sites in the temperature range 25-27°C, have been estimated with uncertainties of _+0.7 to _+2.0°C. The temperatures correspond closely to the laboratory dissociation temperatures for pure water-pure methane hydrate at equivalent pressures. No laboratory data are available for seawater salinity and methane at equivalent pressures, but extrapolation from lower pressures gives temperatures 1-2°C lower, which is just significantly different. The data also could be explained by the stability curve for seawater salinity and methane with about 7% CO2, or with a small amount of higher hydrocarbons, but most hydrate samples that have been recovered by deep sea drilling have contained almost pure methane. The uncertainties in the temperature at the BSR should contribute no more than +_ 5% error in heat flow estimates from BSR depths if the pure water-methane stability field is used.
I. Introduction
An important source of thermal data in sub- duction zone accretionary sedimentary prisms is
Correspondence to: R.D. Hyndman, Pacific Geoscience Cen- tre, Geological Survey of Canada, P.O. Box 6000, Sidney, B.C. V8L 4B2, Canada.
* Geological Survey of Canada contribution 25491. ** U. Berner, W. Bruckmann, T. Byrne, T. Chabernaud, J.V.
Firth, T. Gamo, J.M. Gieskes, I.A. Hill, D.E. Karig, M. Kastner, Y. Kato, S. Lallemand, R. Lau, A.J. Maltman, G.F. Moore, K. Moran, G. Olafsson, W.H. Owens, K. Pickering, F. Siena, A. Taira, E. Taylor, M.B. Underwood, C. Wilkinson, J. Zhang.
obtained from the depth to bottom simulating reflectors (BSR) [1]. These reflectors are com- monly found beneath the lower to mid-continen- tal slope at a depth of several hundred metres, and are taken to mark the base of the tempera- ture-pressure field for methane clathrate hydrate stability. The stability field has only a moderate dependence on pressure; the primary sub-bottom depth dependence is on the temperature. Thus, since the pressure is readily estimated, the BSR provides a temperature reference. The BSR tem- perature estimates provide particularly valuable information on the regional pattern of heat flow through accretionary wedges [2-5]. They allow heat flow to be estimated where slope sediments
0012-821X/92/$05.00 © 1992 - Elsevier Science Publishers B.V. All rights reserved

290 R.D. H Y N D M A N E T AL.
are not soft enough for seafloor heat flow probe penetration, and have the advantage that BSR heat flow estimates are not much affected by disturbances at the seafloor such as short-term bottom water temperature variations. The BSR temperature, in combination with seafloor probe data, can also provide information on tectonic fluid expulsion from accretionary prisms if the flow rate is high (e.g., [5]). The purpose of this article is to present deep sea borehole data that provide some constraint on the hydrate stability field that controls the depth to BSRs.
Quite extensive laboratory data are available for the stability fields of hydrate of compositions that may form beneath the deep seafloor. How- ever, there is an important question as to which composition is applicable, i.e., pure water and pure methane, or for example, seawater salinity fluid and gases in addition to methane such as CO 2 and higher hydrocarbons. While only low accuracy data were available to them, Tucholke et al. [6] suggested that BSRs mainly occurred at depths greater than that of the pure me thane - pure water stability field. This article presents borehole data from three areas that provide a higher accuracy field test of the applicability to BSRs of laboratory hydrate stability data.
1.1 Nature and formation of BSRs
Bottom-parallel seismic reflectors commonly occur several hundred metres beneath the seafloor in continental slope sediments, particu- larly in subduction zone accretionary prisms (e.g., [7,8]). These reflectors are inferred to mark the base of the region for methane hydrate stability in most cases from the following observations: there is general agreement between the tempera- ture and pressure conditions estimated for the BSRs and those required for hydrate stability from laboratory tests; the reflection signal has negative polarity indicating a negative impedance contrast, presumably between sediments that contain high-velocity hydrate and underlying sedi- ments with lower velocities that could contain free gas; and methane hydrates have been recov- ered in deep sea boreholes in sections above BSRs (see summaries in [8-10]).
The mechanism of production of methane hy- drate beneath the seafloor remains a puzzle. The
concentration of methane that can be produced locally by normal amounts of organic material in the sediment appears to be hardly sufficient to exceed solubility and initiate hydrate formation (see [51] for a discussion). Locally generated methane is certainly inadequate to explain the high hydrate concentrations inferred from seismic data. Thus, some mechanism for concentrating methane seems required. Based on the associa- tion that extensive BSRs occur primarily in two environments, subduction zone accretionary wedges and regions of very rapid sediment depo- sition where consolidation results in fluid expul- sion through the seafloor, Hyndman and Davis [11] suggested a concentration mechanism. In their hypothesis, BSR hydrate forms from dis- solved biogenic methane carried upward in the rising fluid that is swept out to form hydrate as it enters the stability field at the BSR. The diffi- culty with the latter model is understanding the process by which the methane in the rising fluid is removed upon entering the hydrate stability field.
1.2 P -T conditions for hydrate stability
Deep sea hydrates are clathrate ice-like solids formed from hydrous solutions at high pressures through stabilization of the structure by the in- corporation of other, especially hydrocarbon molecules (e.g., [12-15]). The laboratory stability data refer to the dissociation point, i.e., the phase diagram univariant point where hydrate, liquid and gas co-exist. The pressure- temperature sta- bility conditions depend on both the composition of the gas and on the salinity of the pore fluid (Fig. 1). The primary hydrate forming gas in seafloor sediments is undoubtedly methane. However, the addition of small amounts of higher hydrocarbons or CO 2 increases, and salinity de- creases the maximum temperature for stability of hydrate. The available laboratory data for saline fluid and for the addition of CO 2 require extra- polation to the BSR pressure at the sites dis- cussed in this article. Analyses of hydrates recov- ered in DSDP cores indicate that the hydrocar- bons in the gas are almost entirely methane (e.g., [16-18]); occasionally a few percent CO 2 has been detected. Even if higher hydrocarbons or CO 2 are present, they may be preferentially re-

DEEP SEA BOTTOM-SIMULATING-REFLECTORS, HYDRATES AND HEAT FLOW 291
2
3
4
5
6 7 8
~" 19
~ 20
, , i , l , , i , l , , l i l , i , i l , , i , l , i , , l , l i , 2OO
" u ~ - 3 0 0
Field of no • " ~ hydrate - 4oo '~l " ' ~ X 7 % C 0 2
i 5OO
.2.31~I t~ ~NI~ i E & B Seawater 700
" ~ - 800 :,.w ', \ X _ -900 - , ~ ,, \ ,~ -10o0
2o~ ",,'~ ~,~ NaC1 -.~ water . . . . . Sea "..'~ - 2oo0
Ta te r /" ,N~k '..q
30 Approx ",~ ~' B I - B a h a m a • 3000 ~
" 7 \ 40 ~ - 4O00
so ~ p ~ r ~ - "',~"N.,. lq s°°° 6O 70 Field of hydrate ".~, -1600o
• . " 7000 80 stability " . . ""~. ~ 8ooo 90 ~ i l i i l l I i i i i i i i i l l i l ~ t l j 9000
100 0 5 I0 15 20 25 30 35
Temperature (deg C) Fig. 1. Laboratory data for the hydrate stability fields• The temperatures and uncertainties estimated for the BSR at the three sites studied are marked. Pure water and pure methane data are from the compilation of Sloan [15]; the curve is a second-order polynomial fit to the data. See text for a discus- sion and for sources of the other data. The extrapolated seawater curve has an uncertainty of at least _+ I°C at the
depth of the three sites studied•
moved from rising pore fluid to form hydrate at a greater depth than the main methane hydrate BSR.
Figure 1 presents the laboratory data for pure water and pure methane from the compilation of Sloan [15]. The data in the pressure range of the BSR points studied are from Kobayashi and Katz [19], McLeod and Campbell [20], Marshall et al. [21], and Jhaveri and Robinson [22]. Following the recommendat ion of Lewin and Associates [23], the data points of Kobayashi and Katz (solid squares) have not been included in the second- order polynomial fit to the data shown as a solid line.
Hydrate formed from saline rather than from pure water has a lower maximum tempera ture of stability, as iS the case for normal ice. However, the situation is complex because salts tend to be excluded in the formation of hydrate structure; the melting of hydrate results in the production of fresh water (e.g., [24]). A theoretical estimate for the stability field of 'artificial seawater has
been reported by Englezos and Bishnoi [25] to 13 MPa. On Fig. 1, this has been extrapolated to higher pressures assuming a constant fractional increase (16%) in dissociation pressure. Miller [13] suggested an increase of 11% or 20% on theoretical grounds. The data for a 10% NaC1 solution given by Kobayashi et al. [26] have often been employed to obtain an approximation for seawater salinity by interpolation. However, with increasing pressure their data trend diverges from that of the artificial seawater data in a way that is not observed in the data of Roo et al. [27] or the theoretical prediction for seawater or saline solu- tions by Englezos and Bishnoi [25]. Use of this interpolation may explain the larger difference of 3-5°C between pure water and seawater at pres- sures near 60 MPa given in plots by a number of authors. The uncertainty in the seawater curve is at least + I ° C in the range of interest for this study. Further laboratory and theoretical work is clearly needed on the stability field for seawater salinity.
It is discussed in a later section how, even though pore fluid analyses from cores in the regions of BSRs have found salinities generally within 10 or 20% of that of seawater, the pure water stability field may be applicable for BSR temperatures.
The effect of CO2 on the stability field has been studied by Unruh and Katz [28]; a point for 7% CO2 is shown in Fig. 1.
1.3 Determination of heat flow from BSR depths
Determinat ion of heat flux from BSR depths requires estimates of: (1) the reflection time to the BSR from seismic reflection data; (2) the veloci ty-depth relationship to convert reflection times to depth; (3) the pressure at the BSR from the water depth and from the sediment thickness; (4) the applicable p ressure - t empera tu re relation- ship for hydrate stability to determine the tem- perature at the BSR; (5) the seafloor temperature to obtain the temperature gradient; and (6) the thermal conductivi ty-depth relation to obtain heat flow. Of these factors, uncertainties in re- flection times and seafloor temperatures are usu- ally small enough to contribute a negligible error. The velocity and thermal conductivity estimates are important sources of uncertainty in the esti-

292 R.D. H Y N D M A N E T AL.
mated heat flow. They are site-specific and must be estimated from extrapolating seafloor core- sample data, f rom seismic reflection and refrac- tion measurements , and more accurately where available, f rom borehole data in the region. As pointed out by G. Claypool (pers. commun., 1991), the fluid pressure in the sediments should be used tO estimate in-situ pressure, i.e., total depth from the sea surface to the BSR times seawater density, not lithostatic pressure as has b e e n as- sumed by a number of previous authors. Over- pressures are rare at depths of a few hundred metres.
The hydrate stability P - T relationship re- quired to estimate the tempera ture at the depth of the BSR has so far been obtained only from laboratory data. Even if the laboratory data are applicable to seafloor in-situ conditions, there is the question of what P - T curve to employ. As noted above, the applicable relationship could be that for pure methane and pure water or for seawater salinity, and including other con- stituents such as CO 2 and higher hydrocarbons. It is not known if the applicable stability field is different for different areas, for example from different CO2 content or salinity. Different stabil- ity curves for reasonable compositions can give differences in est imated heat flow of at least 20%, thus, this calibration is an important factor in evaluating the accuracy of geothermal heat flow estimates from BSR depths.
1.4 BSR temperature calibration
Ideally, calibration of the applicable stability field would be provided by a deep sea borehole that penetra ted a clear BSR, with accurate down- hole tempera ture data and, either downhole log- ging or core measurements to identify the precise depth to the base of the hydrate, or downhole velocity data to allow the reflection times to the BSR to be accurately converted to depth. Be- cause of safety concerns over the possibility of free gas below BSRs, no such holes have as yet been drilled.
Several holes on an early DSDP leg did pene- trate a BSR on the B lake -Bahama Outer Ridge (Leg 11 [29]). No tempera ture data or precise determination of the BSR depth were obtained, but tempera ture gradient data were obtained in
more recent shallower drilling on Leg 76 that did not reach the BSR [30]. Additional data are avail- able on the continental slope of the Peru margin where a hole was drilled during Leg 112 to below the base of the stability field [9,10]. The best constraints are now available from an Ocean Drilling Program (ODP) site on the southeastern Nankai margin of Japan where temperature , ve- locity and thermal conductivity data were ob- tained in a series of boreholes [31]. ODP Site 808 is located in the subduction zone accretionary sedimentary wedge just landward from the defor- mation front. At neither the Nankai nor the Peru ODP sites did holes penetra te an obvious seismic BSR, but both sites were positioned less than 3 km from a clear BSR.
2. Stability field calibration from ODP Site 808, southern Japan subduction zone
2.1 Depth to the BSR at ODP Site 808
No BSR is evident on the multichannel seismic line directly over Site 808 on ODP Leg 131, and no hydrate was evident in the drill cores or down- hole logs at the expected BSR depth; a small amount of hydrate was recovered from a core at a shallower depth. Thus, either the depth at which the BSR is expected to occur at Site 808 must be obtained through extrapolation from regions landward of the site, or the thermal and velocity data must be extrapolated from the drill site landward to regions where a BSR is seen. Both approaches give essentially the same result and we have chosen to use the drill site as a reference and extrapolate the BSR depth to its location.
Figure 2 shows the BSR on a multichannel seismic line that passes over the site [32]. Figure 3 shows the BSR reflection time as a function of distance landward from the ODP Site 808. The reflection times have been taken from the seismic waveforms using the positive peak of the seafloor reflection and the negative peak of the BSR reflection since they result from opposite polarity impedance contrasts. The BSR depth is seen to decrease toward the trench in a smooth system- atic way. Since the water depth only varies from about 4.2 to 4.7 km (Site 808, 4675 m water depth), there is only a small variation in the pressure effect on the depth to the base of the

D E E P S E A B O T T O M - S I M U L A T I N G - R E F L E C T O R S , H Y D R A T E S A N D H E A T F L O W 293
BSR ODP Site 8 0 8 - l k m
m i
Fig. 2. Mult ichannel seismic reflection section NT62-8 over the seaward part of the Nankai accretionary wedge illustrating the BSR [31]. The vertical scale is two-way reflection time from the sea surface in seconds, the numbers at the top of the plot are shot points. The oceanic crust is the strong reflector 1-2 s (about 1-2 km) beneath the seafloor that descends beneath the margin to the left below the t ransparent (light) band that corresponds to the under thrust ing sediment section. The nearest BSR to the borehole
site is noted as First BSR.
stability field, equivalent to about 0.5°C on the P - T diagram• The depth is primarily related to temperature and thus heat flow. This systematic trend in BSR depth is consistent with the heat flow data near the seismic line that shows an increase from about 50 mW m -z, 50 km land- ward from the deformation front, to about 150 mW m -z, 10 km seaward of the deformation front (Fig. 4) [33,53]• The linearly extrapolated depth (two-way time) at Site 808 is 230 + 12 ms, 95% confidence ( + 6 ms, 67% confidence) (Fig. 3).
We recognize a number of cautions in extrapo- lating the depth to the BSRs. Firstly, the bore- hole is close to the deformation front where conditions may be fundamentally different from more landward sites, for example because of dif- ferences in fluid expulsion rate. Secondly, a de- tailed examination of Fig. 3 reveals that the two points closest to the drill site have shallower depths than predicted from linear extrapolation; they are outside the 67% and near the 95% confidence limits• The difference in reflection time between these two points and the regression line is about 4% which translates to about I°C in BSR temperature• Finally, the sediment section and thus velocity and thermal conductivity are undoubtedly laterally variable.
2.2 Average seismic velocity to the BSR
Reflection times to the BSR at Site 808 must be converted to depth. The penetrated section was a highly variable sequence of turbidite sands and muds. As the core recovery for the upper 200 m was very poor and biased to muds rather than sand, and because of core disturbance from ex-
0 . 4 0 i i j i i i i i i i i i I I I I J i i 1.4 I , B S ] ~ . l " ) l t ] ' ~ I - i • • ~ ' " i
,.~ o.3s De.... ? ~ . . ""
S 70.30
~ o.2s .- annel Line
• ODP Site 808
0.20 n n n ~ l n ~ n n l n ~ l ~ l ~ a
0 S 10 1S 20 25
Dist. f rom Site 808 (Km)
Fig. 3. The depth (reflection time) to the bottom simulating reflector as a function of distance landward of the drill site on the mult ichannel seismic line. The linear regression and 95% confidence limits are shown. The 67% confidence limits are
approximately half this bound.

294 R . D . H Y N D M A N E T A L .
2 5 0
D e f o r m a t i o n F r o n t S h i k o k u B a s i n
v I > i i i i
200
]= E 150
] =
o 100
LI_
m 5 0 -.t-
O - 8 0
• • o O • ODP Si te 808. •
O •
i I I l I I I
- 6 0 - 4 0 - 2 0 0 20 4 0 60 80
Relotive Distance (km)
Fig. 4. H e a t f low d a t a ac ros s t he N a n k a i a c c r e t i o n a r y w e d g e r eg ion ( a f t e r [53]). T h e do t s a r e o c e a n h e a t p r o b e m e a s u r e m e n t s ; the
c i rc les a r e f r o m the d e p t h s to h y d r a t e B S R s .
solved methane gas release upon recovery, only downhole log data have been used in this analy- sis. The log velocities available from depths of 80-160 m must be extrapolated over the remain- ing intervals between the seafloor and the ap- proximately 205 m depth of the BSR. The data and extrapolation are shown in Fig. 5. The ex- trapolation was made assuming an exponential porosi ty-depth relation with parameters such that the inferred velocities pass through the mean and have the slope of the velocity log data, i.e., P = 0.58 e x p ( - z / 8 0 0 ) . The low surface porosity and rapid decrease with depth reflects the generally coarse-grained trench fill sediments in the upper part of the section. The Hamilton [34] porosi ty- velocity relation was used which was found to give good agreement between velocity and poros- ity data at the site. The velocity extrapolation is quite insensitive to the porosi ty-depth function used. Based on this relationship, the effective mean velocity and estimated uncertainty from the surface to 205 m is 1.79 + 0.03 km s-1. Confirma- tion of this average velocity is provided by two lower accuracy estimates, a downhole vertical seismic profile (VSP), and a split-spread seismic profile about 1.5 km landward of the site. The latter also gives an average velocity of 1.79 km s- 1 for the upper 300 m of the section [35]. Thus, the BSR reflection time extrapolated to the site of 230 ms corresponds to a depth of 205 + 7 m. The effect of any hydrate above the BSR and below the logged interval on velocity has been
0 . 4 5 o 8-
20
40
60
8O
¢)
• i
'; Hole 808B , i i • Z i
................. i ....................... 5 0 , ,
........................ • . . . . . . . . . . . . . . . . ,~. . . . 1 0 0 , . - g
Velocity ",, ............................ ~ . . . . . . . . i .................... ~ 5 0 ...,.
[ ! •
. . . . . . . . . . . . . i ................. ~ ................ r 200
Porosity
0 . 5 0 0 . 5 5 0 . 6 0
............ / . . . . . .
.'" Porosity
..
120 .............. t • ............................ ~ .....................................
i - -
140 . . . . . . . . . . . . . ............... , . . . . . . . . . . . . . . . ~ ....................................................... : i :
160 .............. : . . . . . . . . . . . . . . . . . . . . . . . . . . . - ........
180 . . . . . . . . . . . . . . . . . . . . . . . . . . . . . . . . . . . . , .................... . . . . . . . . .
i ' ,
200 1.6 1.7 1.8 1.9 2.0 2.1
Velocity (km/s)
Fig. 5. D o w n h o l e log ve loc i ty d a t a f r o m Site 808. T h e inse t
gives t he p o r o s i t y - d e p t h f u n c t i o n u s e d in the e x t r a p o l a t i o n o f
t he ve loc i ty d a t a ove r the 200-m d e p t h in terval . T h e d a s h e d l ine gives the v e l o c i t y - d e p t h f u n c t i o n u sed to conve r t ref lec-
t ion t imes to dep th s .

DEEP SEA BO'lq'OM-SIMULATING-REFLECTORS, HYDRATES AND HEAT FLOW 295
ignored since the geochemical da t a indicate that the amounts are small.
2.3 Temperature and thermal conductivity data
Temperatures were measured at Site 808 in the hole bottom at intervals during drilling using a downhole temperature recording tool [36-38]. The WSTP (water sampler - tempera ture-pres - sure) tool has a long probe that is pushed ahead of the drill bit into the undisturbed sediments at the bottom of the hole to measure the in-situ formation temperature during interruptions to drilling. The instrument has a resolution of about 0.01°C, but uncertainty in extrapolating the pene- tration frictional heating pulse to equilibrium lim- its the accuracy to no better than +0.1°C. The uncertainty can be much larger if the probe does not remain stationary during the 5 min required to allow accurate extrapolation to equilibrium temperatures. A review of data acquired on the Deep Sea Drilling Project with this type of instru- ment is given by Hyndman et al. [39].
Six of the nine measurements attempted at the site gave reliable data extending between 91 and 347 m below the seafloor [53] (Fig. 6). They all exhibit the characteristic penetration heating pulse and subsequent decay. Because of the pos-
Temperature (deg C) 0 1 0 2 0 3 0 4 0 5 0
0 • • . i . . . . i . . . . i . . . . i . . . .
t \ ' ODP Site 808 1°°I
• .~ 20(1
400m . . . . i . . . . , . . . . i . . , , I ,~ ,
Fig. 6. Temperature vs. depth at Site 808. The squares are
temperatures measured at Site 808 with the WSTP probe; measurement precisions are smaller than the symbols shown. The curve indicates the t empera tu re -dep th profile expected assuming a conductive heat flow of 129 mW m -2, and the
thermal conductivity structure measured on core samples. The dashed lines indicate the est imated depth uncertainty for the
BSR.
sibility of conduction or advection of heat from the borehole to the depth of the probe measure- ment, the temperature values are probably a min- imum. In addition, accurate bottom water tem- perature was obtained within the pipe above the seafloor. The latter temperature is consistent with oceanographic data and the temperature mea- sured near the bottom during seafloor probe heat flow measurements. Five of the measurements and the seafloor temperature define a gradient having a small smooth increase with depth within the measurement uncertainty. One measurement at 299 m deviates from the trend defined by the other data by about 4°C and must either have an unrecognized source of error or be subject to a local water flow disturbance. However, this mea- surement is well below the BSR depth, and it has been excluded in the gradient estimate.
In addition to the hole-bottom probe, a series of continuous temperature logs was run in several of the boreholes at the site. All of these logs exhibit drilling circulation disturbance to the tem- peratures, and accurate extrapolation to equilib- rium has not been possible. The log temperatures are consistent with the WSTP data and they provide important data deeper in the prism, but the uncertainties are too large to provide useful calibration of BSR temperatures.
Extensive laboratory thermal conductivity measurements were made on the recovered core from the site using the needle probe technique. The values may be biased to somewhat low con- ductivity because of poor core recovery in the unconsolidated high conductivity sand sections and because of gas expansion in the cores upon recovery. The measured conductivity increases approximately linearly over the upper 400 m as defined by 117 measurements [31], described by k = 0.91 + 0.0017z (m) W m-1 K - l , corrected to in-situ temperature and pressure (Fig. 7). Apply- ing this conductivity-depth function, the temper- a tu re -dep th function shown in Fig. 6 is obtained for uniform heat flow versus depth; the curve defines a value of 129 mW m -2. This value is within the range expected for the approximately 15 Ma age of the underlying oceanic crust esti- mated from biostratigraphic data on the sedi- ments just above basement, i.e., 125-136 mW m-2 [40], although application of a sedimentation correction would increase the measured value
296 R.D. H Y N D M A N E T AL.
Thermal Cond. (W/m/K) 0.5 1.0 1.5 2.0
0 . . . . . . . .
I 0 0 • ° ° ~ ° ' ~ • o o o
~ • 2 0 0 •
° " "'. ' .2,.:. • . " - - X o o . . 3 0 0
• % .%*I.\" "0 Q wo • •
. . . . . : ; ' \ . 4 0 0 , , . a , , ,
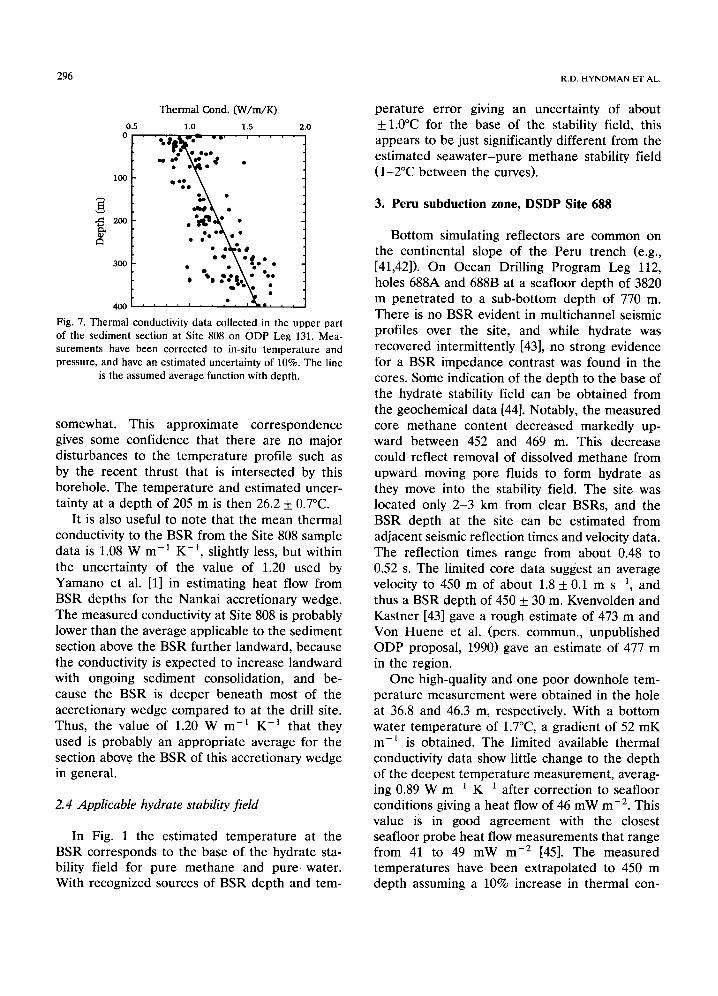
Fig. 7. Thermal conductivity data collected in the upper part of the sediment section at Site 808 on ODP Leg 131. Mea- surements have been corrected to in-situ temperature and pressure, and have an estimated uncertainty of 10%. The line
is the assumed average function with depth.
somewhat. This approximate correspondence gives some confidence that there are no major disturbances to the tempera ture profile such as by the recent thrust that is intersected by this borehole. The tempera ture and estimated uncer- tainty at a depth of 205 m is then 26.2 + 0.7°C.
It is also useful to note that the mean thermal conductivity to the BSR from the Site 808 sample data is 1.08 W m -] K - ] , slightly less, but within the uncertainty of the value of 1.20 used by Yamano et al. [1] in estimating heat flow from BSR depths for the Nankai accretionary wedge. The measured conductivity at Site 808 is probably lower than the average applicable to the sediment section above the BSR further landward, because the conductivity is expected to increase landward with ongoing sediment consolidation, and be- cause the BSR is deeper beneath most of the accretionary wedge compared to at the drill site. Thus, the value of 1.20 W m - ] K -~ that they used is probably an appropriate average for the section abov.e the BSR of this accretionary wedge in general.
2.4 Applicable hydrate stability fieM
In Fig. 1 the estimated tempera ture at the BSR corresponds to the base of the hydrate sta- bility field for pure methane and pure water. With recognized sources of BSR depth and tem-
perature error giving an uncertainty of about + 1.0°C for the base of the stability field, this appears to be just significantly different from the estimated seawate r -pure methane stability field (1-2°C between the curves).
3. Peru subduct ion zone, D S D P Site 688
Bottom simulating reflectors are common on the continental slope of the Peru trench (e.g., [41,42]). On Ocean Drilling Program Leg 112, holes 688A and 688B at a seafloor depth of 3820 m penetrated to a sub-bottom depth of 770 m. There is no BSR evident in multichannel seismic profiles over the site, and while hydrate was recovered intermittently [43], no strong evidence for a BSR impedance contrast was found in the cores. Some indication of the depth to the base of the hydrate stability field can be obtained from the geochemical data [44]. Notably, the measured core methane content decreased markedly up- ward between 452 and 469 m. This decrease could reflect removal of dissolved methane from upward moving pore fluids to form hydrate as they move into the stability field. The site was located only 2 -3 km from clear BSRs, and the BSR depth at the site can be estimated from adjacent seismic reflection times and velocity data. The reflection times range from about 0.48 to 0.52 s. The limited core data suggest an average velocity to 450 m of about 1.8 + 0.1 m s -1, and thus a BSR depth of 450 + 30 m. Kvenvolden and Kastner [43] gave a rough estimate of 473 m and Von Huene et al. (pers. commun., unpublished ODP proposal, 1990) gave an estimate of 477 m in the region.
One high-quality and one poor downhole tem- perature measurement were obtained in the hole at 36.8 and 46.3 m, respectively. With a bot tom water tempera ture of 1.7°C, a gradient of 52 mK m -1 is obtained. The limited available thermal conductivity data show little change to the depth of the deepest temperature measurement, averag- ing 0.89 W m-1 K-~ after correction to seafloor conditions giving a heat flow of 46 mW m -2. This value is in good agreement with the closest seafloor probe heat flow measurements that range from 41 to 49 mW m -2 [45]. The measured temperatures have been extrapolated to 450 m depth assuming a 10% increase in thermal con-

DEEP SEA BO'VFOM-SIMULATING-REFLECTORS, HYDRATES AND H E A T FLOW 297
0 o
lOO
2OO
3oo
,oo
50O
Temperature (deg C) 5 10 15 20 25 30
. . . . . . . . . . . . . . . . .
Fig. 8. Temperature versus depth at Peru ODP Site 688A. The extrapolated temperature profile assumes a 10% increase in thermal conductivity with depth below about 100 m. The dashed lines indicate the estimated depth uncertainty for the
BSR.
ductivity and thus decrease in gradient based on core porosity data, giving an estimated BSR tem- perature of 25.0 + 2.0°C (Fig. 8). Since the geo- chemical data indicate only small amounts of hydrate in the section, the effect of hydrate pre- sent on thermal conductivity and on velocity has been ignored. This temperature corresponds well to the laboratory stability field for pure water and methane but the error bounds encompass the seawater salinity curve (Fig. 1).
4. Blake-Bahama Outer Ridge, DSDP Sites 102, 104, 533
The Blake-Bahama Outer Ridge exhibits a very clear bottom simulating reflector at about 0.6 s (e.g., [46]). The ridge has been built up by rapid contour current deposition, and the rapid loading of underlying sediments may be the cause of the fluid expulsion suggested to be required for BSR hydrate formation. Leg 11 of the Deep Sea Drilling Project appears to have penetrated this reflector at Sites 102 (total depth 661 m) and 104 (total depth 617 m) [47]; these are the only deep sea drill holes that have penetrated a very clear BSR.
Unfortunately Leg 11 had very poor core re- covery and no downhole logs and the best esti- mate of the depth to the BSR is from a very pronounced decrease in drilling rate at 625 m
(Site 102, 3426 m water depth) and 615 m (Site 104, 3811 m water depth). The harder drilling is suggested to be a diagenetic effect associated with the base of the hydrate stability field. How- ever, the harder drilling could have resulted from the top of a layer containing high concentrations of hydrate, in which case the BSR marking the base of the hydrate could be deeper. The average depth to harder drilling of 620 m is in approxi- mate agreement with the BSR reflection times near the sites of 0.62 s combined with velocity estimates for the section over the BSR. Sonobuoy measurements have variously given average val- ues from 2.0 to 2.3 km s -1. Velocities have also been obtained from reflection times to prominent horizons encountered at known drilling depths, i.e., 1.9 km s-1 between 0 and 370 m, and 2.3 km s-~ between 370 and 620 m [48]. The estimated BSR depth from this approach of about 635 m provides confirmation of the BSR depth estimate from drilling rate.
Additional shallow drilling not reaching the BSR was carried out on DSDP Leg 76, Site 533 (water depth 3191 m) [30,48]. Extensive sampling and geochemical measurements showed that hy- drate was intermittently present above the BSR but only in small amounts. Three moderate qual- ity downhole temperature measurements were made in the hole to 400 m. Extrapolation of these temperature measurements as initially analyzed to the 620 m depth of the BSR indicates a tem- perature of about 27°C [30]. With the small revi- sion to the downhole temperature estimates by Hyndman et al. [39] which gives a more linear t empera ture -dep th profile and a heat flow of 54 mW m -2, the temperature at 620 m is 26.0°C with an uncertainty estimate of about + I°C (Fig. 9). Allowing for a depth uncertainty from 600 to 640 m, the inferred BSR temperature is 26.5 + 1.5°C. On the laboratory hydrate stability field, this temperature plots near the curve for pure water and methane and 2-3°C above that for seawater (Fig. 1).
Both the BSR depth and the t empera ture - depth profile have substantial uncertainty. If the drilling rate increase resulted from the top of a hydrate layer and the BSR is deeper marking its base, or if the temperature estimates of Sheridan et al. [30] are used, the BSR temperatures would be even higher, well above the pure wate r -

2 9 8 R . D . H Y N D M A N El" A L .
Temperature (deg C) 0 10 15 2 0 2 5 3 0
0 - i . . . . i . . . . i . . . . i . . . . i . . . .
~ " B L A K E B A H A M A
100 ~..., 2OO
~" 400
5 0 0
6 0 0 B S R
7 0 0 . . . . . . ' . . . . ' . . . . ' . . . . ' ' ' '
Fig. 9. Temperature vs. depth at Blake-Bahama DSDP Site 688A. The extrapolated temperature profile assumes a smooth increase of about 20% in thermal conductivity with depth to the BSR such as to fit the temperature points with constant heat flow. The dashed lines indicate the estimated depth
uncertainty for the BSR.
methane curve. The estimated heat flow at the site of 54 mW m-2 is somewhat higher than most marine probe values in the general area (within 300 km) of 46 to 52 mW m-2 (e.g., [49,50]). The values generally decrease away from the centre of the Bermuda rise. If the downhole temperature measurements are in error such that the true heat flow at the drill hole sites is the regional average of about 48 mW m -2, the temperature at the BSR would be about 2°C cooler, approxi- mately corresponding to the seawater-methane stability curve. Another potential source of error is that hydrate present above the BSR could increase the thermal conductivity and thus de- crease the gradient over that interval. However, the geochemical data indicate that the amount of hydrate is small and thus it probably does not have a significant effect on conductivity.
5. Discussion: inferred stability field for BSRs
From all three deep sea drilling areas where BSR temperatures have been estimated, the base of the stability field defined by the bottom simu- lating reflectors corresponds well to that for pure water and methane (Fig. 1). The pore fluid salin- ity measured on core samples from the upper several hundred metres of the drill holes is within
10% of that of seawater for all of the sites so agreement with the seawater curve was expected. The individual site uncertainties are close to or include the estimated seawater curve, but the average temperature from a combination of the data from the three sites appears to be signifi- cantly off the seawater curve. This is particularly so if, as displayed in many papers, the effect of seawater is larger than shown in Fig. 1. However, since no laboratory data for seawater salinity is available, the difference in between the BSR temperatures and the estimated seawater-pure methane stability field must be interpreted with caution.
Two explanations for this apparent discrep- ancy are suggested: (1) that salt exclusion in hy- drate formation equilibrates the base of the hy- drate at the pure water field and (2) that approxi- mately 7% CO 2 or a few percent higher hydro- carbons are usually present which will increase the stability temperature and compensate for the lowering from salinity.
The first explanation for the BSR being lo- cated at the base of the pure water stability field comes from the exclusion of salts in the forma- tion of hydrate (e.g., [24]) as in the formation of normal ice. In the majority of BSR environments, the base of the stability field must move upward through the sediment section with time in re- sponse to: (1) ongoing sediment deposition; (2) to uplift and pressure decrease associated with sub- duction zone sediment accretion; and (3) to tec- tonic thickening and vertical spreading of the isotherms in the sediment section. In these situa- tions, the hydrate will be continuously melting at the BSR and reforming at a higher level within the stability field. The hydrate that is dissociating will contain very little salt so melting could occur at the pure water stability field conditions. The difficulty with this mechanism is that salt diffu- sion should be fast enough to keep a relatively high salinity at the surface of the solid hydrate unless melting is very rapid. In addition, most estimates have less than half of the pore fluid replaced by hydrate at the BSR; the remaining part should be approximately of normal salinity. Melting of the hydrate thus will produce pore water with at least half normal salinity. The op- posite situation with the hydrate BSR migrating downward may also occur, for example where the

DEEP SEA BOTTOM-SIMULATING-REFLECTORS, HYDRATES AND HEAT FLOW 299
common landward decrease in heat flow domi- nates the mechanisms listed above. In this case the hydrate BSR must migrate downward into normal salinity pore fluid. This problem requires more detailed theoretical analysis and experimen- tal modelling.
The second explanation, of other constituents, has been the reason why many authors have taken the applicable stability field to approximate that for fresh wa te r -pure methane (e.g., [51,52]). They have assumed an approximate balance be- tween the competing effects of salinity and of other constituents. However, as noted above, more recent data from deep sea drilling have shown that most samples of hydrate that have been recovered contained almost pure methane. Also, the consistency among the three calibration sites would be surprising if this were the explana- tion because it requires that a constant amount of CO 2 or of higher hydrocarbons is present at all three sites. In support of a role for COz is diage- netic change that appears to occur at or near the BSR in some drill sites, e.g., the Blake-Bahama and Peru sites. Greater diagenesis may occur below compared to above the BSR because of the removal of CO z as well as methane at the base of the stability field.
One other factor could be important. Almost all of the laboratory hydrate dissociation temper- ature measurements have been made with large amounts of excess methane gas with no addi- tional constituents. For example, the role of clay surface activity and the fine pore spaces in deep sea sediments is unknown.
In conclusion, the in-situ data from three deep BSR sites indicate agreement with the pure wa- t e r -pu re methane dissociation field. The differ- ence from the stability field for seawater salinity fluid appears to be just significant although ap- propriate laboratory data are not yet available for comparison. Future drilling through a well de- fined BSR is needed to clearly resolve whether the difference is real and if it is, to determine the mechanism by which the fresh water field is ap- propriate. The in-situ borehole data indicate that a negligible error is probably introduced in heat flow estimates from BSR depths through the use of the fresh wa te r -pure methane stability field, i.e., _+ 1°C in BSR temperature or about + 5 % in heat flow from this source.
Acknowledgements
We wish to acknowledge the outstanding oper- ations and scientific support by the personnel of Ocean Drilling Program Leg 131. The careful and perceptive review by G. Claypool was greatly appreciated. Very helpful discussions with R. Bishnoi and E.D. Sloan are acknowledged.
References
1 M. Yamano, S. Uyeda, Y. Aoki and T.H. Shipley, Esti- mates of heat flow derived from gas hydrates, Geology 10, 339-343, 1982.
2 M. Yamano, Heat flow studies of the circum-Pacific sub- duction zones, Ph.D. thesis, Univ. Tokyo, Tokyo, Japan, 1985.
3 S.C. Cande, R.B. Leslie, J.C. Parra and M. Hobart, Inter- action between the Chile Ridge and Chile Trench: geo- physical and geothermal evidence, J. Geophys. Res. 92, 495-520, 1987.
4 T.A. Minshull and R.S. White, Sediment compaction and fluid migration in the Makran accretionary prism, J. Geo- phys. Res. 94, 7387-7402, 1989.
5 E.E. Davis, R.D. Hyndman and H. Villinger, Rates of fluid expulsion across the northern Cascadia accretionary prism: constraints from new heat flow and multichannel seismic reflection data, J. Geophys. Res. 95, 8869-8889, 1990.
6 B.E. Tucholke, G.M. Bryan and J.I. Ewing, Gas-hydrate horizons detected in seismic-profiler data from the west- ern North Atlantic, Am. Assoc. Pet. Geol. 61, 698-707, 1977.
7 T.H. Shipley, M.H. Houston, R.T. Buffler, F.J. Shaub, K.J. McMillen, J.W. Ladd and J.L. Worzel, Seismic evidence for widespread possible gas hydrate horizons on continen- tal slopes and rises, Am. Assoc. Pet. Geol. Bull. 63, 2204-2213, 1979.
8 K.A. Kvenvolden and L.A. Barnard, Hydrates of natural gas in continental margins, in: Studies in Continental Margin Geology, J.S. Watkins and C.L. Drake, eds., Am. Assoc. Petrol. Geol. Memoir 34, 631-640, 1983.
9 E.R. Suess, R. von Huene et al., Ocean Drilling Program Leg 112, Peru continental margin: Part 2, Sedimentary history and diagenesis in a coastal upwelling environment, Geology 16, 939-943, 1988.
10 E.R. Suess, R. von Huene et al., Proceedings of the Ocean Drilling Program, Initial Reports, 112, College Station, Texas (Ocean Drilling Program), 1988.
11 R.D. Hyndman, R.D. and E.E. Davis, A mechanism for the formation of methane hydrate and sea floor bottom simulating reflectors by vertical fluid expulsion, J. Geo- phys. Res., in press, 1991.
12 J.H. Hand, D.L. Katz and V.K. Verma, Review of gas hydrates with implications for ocean sediments, in: Natu- ral Gases in Marine Sediments, I.R. Kaplan, ed., pp. 179-194, Plenum Press, New York, 1984.

300 R.D. HYNDMAN ET AL.
13 S.L. Miller, The nature and occurrence of clathrate hy- drates, in: Natural Gases in Marine Sediments, I.R. Kap- lan, ed., pp. 151-177, Plenum Press, New York, 1984.
14 Yu. F. Makogon, Hydrates of Natural Gas, 237 pp., trans- lated from the Russian by W.J. Cieslewicz, PennWell Publ. Co., Tulsa, Okla., 1981.
15 E.D. Sloan, Clathrate Hydrates of Natural Gases, 641 pp., Marcel Dekker, New York and Basel.
16 K.A. Kvenvolden, K.A. and T.J. McDonald, Gas hydrates of the middle America trench--Deep Sea Drilling Project Leg 84, Init. Rep. DSDP 84, 667-682, 1985.
17 T.H. Shipley and B.M. Didyk, Occurrence of methane hydrate offshore southern Mexico, Init. Rep. DSDP 66, 547-556, 1981.
18 R.D. Mclver, Hydrocarbon gas (methane) in canned Deep Sea Drilling Project core samples, in: Natural Gases in Marine Sediments, I.R. Kaplan, ed., pp. 63-69, Plenum Press, New York, 1984.
19 R. Kobayashi and D.L. Katz, Methane hydrate at high pressure, Trans. Am. Inst. Mech. Eng. 186, 66-70, 1949.
20 H.O. McLeod and J.M. Campbell, Natural gas hydrates at pressures to 100,000 psia, J. Pet. Technol. 13, 590-594, 1961.
21 D.R. Marshall, S. Saito and R. Kobayashi, Hydrates at high pressure: Part 1, Methane-water, argon-water, and nitrogen-water systems, Am. Inst. Chem. Eng. J. 10, 202- 205, 1964.
22 J. Jhaveri and D.B. Robinson, Hydrates in the methane- nitrogen system, Can. J. Chem. Eng. 43, 75-78, 1965.
23 Lewin and Associates, Handbook of gas hydrate proper- ties and occurrence, U.S. Dept. Energy Rep. distributed by Natl. Tech: Inf. Cent., Springfield, Va.
24 R. Hesse and W.E. Harrison, Gas hydrates (clathrates) causing pore-water freshening and oxygen isotope frac- tionation in deep-water sedimentary sections of terrige- nous continental margins, Earth Planet. Sci. Lett. 55, 453-462, 1981.
25 P. Englezos and P.R. Bishnoi, Prediction of gas hydrate formation conditions in aqueous solutions, Am. Inst. Chem. Eng. 34, 1718-1721.
26 R. Kobayashi, H.J. Withrow, G.B. Williams and D.L. Katz, Gas hydrate formation with brine and ethanol solutions, Proc. 30th Annu. Conv. Nat. Gas Assoc. Am., 27-31, 1951.
27 J.L. Roo, G.J. Peters, R.N. Lichtenthaler and G.A.M. Diepen, Occurrence of methane hydrate in saturated and unsaturated solutions of sodium chloride and water in dependence of temperature and pressure, Am. Inst. Chem. Eng. J. 29, 651-657, 1983.
28 C.H. Unruh and D.L. Katz, Gas hydrates of carbon diox- ide-methane mixtures, Trans. Am. Inst. Metall. Eng. 186, 83-86, 1949.
29 Y. Lancelot and J.I. Ewing, Correlation of natural gas zonation and carbonate diagenesis in Tertiary sediments from the North-west Atlantic, Init. Rep. DSDP 11, 791- 799, 1972.
30 R.E. Sheridan, F.M. Gradstein, et al., Initial Reports of the Deep Sea Drilling Project, 76, U.S. Government Print- ing Office, Washington, 1983.
31 I.A. Hill, A. Taira et al., Proceedings of the Ocean Drilling
Program, Initial Reports, 131, College Station, Texas (Oc- ean Drilling Program), 1991.
32 G.F. Moore, T.H. Shipley, P.L. Stoffa, D.E. Karig, A. Taira, S. Kuramoto, H. Tokuyama and K. Suyehiro, Struc- ture of the Nankai Trough accretionary zone from multi- channel seismic reflection data, J. Geophys. Res. 95, 8753-8765, 1990.
33 Preliminary report of the KH 85-6 cruise of the R / V Hakuho-Maru, Ocean Research Institute, University of Tokyo, 1985.
34 E.L. Hamilton, Sound velocity-density relations in seafloor sediments, J. Acoustic Soc. Am., 63, 266-377, 1979.
35 W.T. Wood, One and two dimensional seismic velocity inversion in the domain of intercept time and ray parame- ter: an example in the Nankai Trough, M.Sc. thesis, Univ. Texas at Austin, 1989.
36 A.J. Erickson, R.P. Von Herzen, J.G. Sclater, R.W. Girdler, B.V. Marshall and R.D. Hyndman, Geothermal measurements in deep-sea boreholes, J. Geophys. Res. 80, 2525-2528, 1975.
37 T. Yokota, H. Kinoshita and S. Uyeda, New DSDP (Deep Sea Drilling Project) downhole temperature probe utiliz- ing IC RAM (memory) elements, Tokyo Daigaku Jishin Kenkyusho Iho 55, 75-88, 1980.
38 R.O. Barnes, ODP in situ fluid sampling and measure- ment: a new wireline tool, Proc. ODP, Init. Rep. 110, 55-63, 1987.
39 R.D. Hyndman, M.G. Langseth and R.P. Von Herzen, Deep Sea Drilling Project geothermal measurements: a review, Rev. Geophys. 25, 1563-1582, 1987.
40 C.R.B. Lister, Estimates for heat flow and deep rock properties based on boundary layer theory, Tectonophysics 41, 157-171, 1977.
41 R. von Huene and J.J. Miller, Migrated multichannel seismic-reflection records across the Peru continental mar- gin, Proc. ODP, Init. Rep. 67, 109-119, 1988.
42 J.J. Miller, M.W. Lee and R. von Huene, A quantitative analysis of gas hydrate phase boundary reflection (BSR), offshore Peru, Am. Assoc. Pet. Geol. Bull. 75, 910-924, 1991.
43 K.A. Kvenvolden and M. Kastner, Gas hydrates of the Peruvian outer continental margin, Proc. ODP, Sci. Re- suits 112, 517-526, 1990.
44 M. Kastner, H. Elderfield, J.B. Martin, E. Suess, K.A. Kvenvolden and R.E. Garrison, Diagenesis and intersti- tial-water chemistry at the Peruvian continental margin- major constituents and strontium isotopes, Proc. ODP, Sci. Results 112, 413-440, 1990.
45 M. Yamano and S. Uyeda, Heat-flow studies in the Peru trench subduction zone, Proc. ODP, Sci. Results 112, 653-661, 1990.
46 T.H. Shipley, R.T. Buffler and J.S. Watkins, Seismic stratigraphy and geologic history of Blake Plateau and adjacent western North Atlantic continental margin, Am. Assoc. Pet. Geol. Bull. 62, 792-812, 1978.
47 C.D. Hollister, J.l. Ewing et al., Initial Reports of the Deep Sea Drilling Project 11, U.S. Government Printing Office, Washington, 1972.
48 K.A. Kvenvolden and L.A. Barnard, Gas hydrates of the

DEEP SEA BOTTOM-SIMULATING-REFLECTORS, HYDRATES AND HEAT FLOW 301
Blake Outer Ridge, site 533, Deep Sea Drilling Project Leg 76, Init. Rep. DSDP 76, 353-366, 1983.
49 R.S. Dietrich, R.P. Von Herzen, B. Parsons, D. Sandwell and M. Dougherty, Heat flow observations of the Bermuda Rise and thermal models of midplate swells, J. Geophys. Res. 91, 3701-3723, 1986.
50 K.E. Louden and J.M. Wright, Marine heat flow data: a new compilation of observations and brief review of its analysis, in: CRC Handbook of Seafloor Heatflow, K.E. Louden and J.M. Wright eds., pp. 3-70, CRC Press, Boca Raton, Fla., 1989.
51 G.E. Claypool and I.R. Kaplan, The origin and distribu-
tion of methane in marine sediments, in: I.R. Kaplan, ed., pp. 99-139, Natural Gases in Marine Sediments, Plenum Press, New York, 1985.
52 K.A. Kvenvolden and M.A. McMenamin, Hydrates of natural gas: a review of their geologic occurrence, U.S. Geol. Surv., Circ. 825, 1980.
53 M. Yamano, J.-P. Foucher et al., Heat flow and fluid flow regime in the western Nankai accretionary prism, Earth Planet. Sci. Lett., this issue.