deep-sea research part i - marinebioacoustics.com · 600 m deep, and is composed of mesopelagic...
TRANSCRIPT
Contents lists available at ScienceDirect
Deep-Sea Research Part I
journal homepage: www.elsevier.com/locate/dsri
Diverse foraging strategies by a marine top predator: Sperm whales exploitpelagic and demersal habitats in the Kaikōura submarine canyon
M. Guerraa,⁎, L. Hickmottb,c, J. van der Hoopd, W. Raymenta, E. Leunissena, E. Slootena,M. Mooree
a University of Otago, Dunedin, New Zealandb Scottish Oceans Institute, University of St Andrews, St Andrews, UKc Open Ocean Consulting, Petersfield, Hants, UKd Aarhus University, Aarhus, Denmarke Woods Hole Oceanographic Institution, Woods Hole, USA
A R T I C L E I N F O
Keywords:Submarine canyonSperm whaleForagingKaikouraEcholocationDemersal
A B S T R A C T
The submarine canyon off Kaikōura (New Zealand) is an extremely productive deep-sea habitat, and an im-portant foraging ground for male sperm whales (Physeter macrocephalus). We used high-resolution archival tagsto study the diving behaviour of sperm whales, and used the echoes from their echolocation sounds to estimatetheir distance from the seafloor. Diving depths and distance above the seafloor were obtained for 28 dives fromsix individuals. Whales foraged at depths between 284 and 1433 m, targeting mesopelagic and demersal preylayers. The majority of foraging buzzes occurred within one of three vertical strata: within 50 m of the seafloor,mid-water at depths of 700–900 m, and mid-water at depths of 400–600 m. Sperm whales sampled during thisstudy performed more demersal foraging than that reported in any previous studies – including at Kaikōura infurther inshore waters. This suggests that the extreme benthic productivity of the Kaikōura Canyon is reflected inthe trophic preferences of these massive top predators. We found some evidence for circadian patterns in theforaging behaviour of sperm whales, which might be related to vertical movements of their prey following thedeep scattering layer. We explored the ecological implications of the whales’ foraging preferences on theirhabitat use, highlighting the need for further research on how submarine canyons facilitate top predator hot-spots.
1. Introduction
Submarine canyons are complex topographic features that crosscontinental margins all over the globe, connecting the shallow con-tinental shelves to deep ocean basins (Shepard and Dill, 1966). They areextremely productive, serving as hotspots of benthic and pelagic bio-mass and diversity (De Leo et al., 2010; Vetter et al., 2010; van Oevelenet al., 2011), and are key habitats for top predators, including deep-diving cetaceans (Yen et al., 2004; Moors-Murphy, 2014). Despite beingglobally numerous, submarine canyons are poorly studied, and thedrivers behind their exceptional productivity are not well understood(De Leo et al., 2010; Moors-Murphy, 2014).
The Kaikōura Canyon, off the east coast of New Zealand (Fig. 1), hasbeen described as the most productive non-chemosynthetic habitat re-corded to date in the deep sea (De Leo et al., 2010). It harbours ex-ceptional biomass of infaunal and epifaunal invertebrates, includingnematodes, and also benthic-feeding fish (De Leo et al., 2010; Leduc
et al., 2012). Furthermore, the presence of many top-predators tar-geting mesopelagic prey (e.g., Benoit‐Bird et al., 2004; Boren et al.,2006) suggests that the area hosts a highly productive pelagic system.
The Kaikōura Canyon is also an important year-round foragingground for male sperm whales (Physeter macrocephalus) (Childerhouseet al., 1995; Jaquet et al., 2000), deep-diving predators (Papastavrouet al., 1989; Watkins et al., 1993) that use echolocation to detect andlocate prey (Møhl et al., 2000; Madsen et al., 2002). Although squid aretheir primary food source (Okutani and Nemoto, 1964; Rice, 1989;Santos et al., 1999), demersal fish appear to be an important componentof their diet in some regions (Martin and Clarke, 1986), including theKaikōura/Cook Strait region of New Zealand (Gaskin and Cawthorn,1967).
Deep-diving predators exploit specialist niches below the photiczone, where most biomass is concentrated in two vertical bands: thedeep scattering layer (DSL, Johnson, 1948) and the benthic boundarylayer (BBL, Marshall, 1965). The DSL is typically between 200 and
http://dx.doi.org/10.1016/j.dsr.2017.08.012Received 31 March 2017; Received in revised form 19 July 2017; Accepted 28 August 2017
⁎ Corresponding author.E-mail address: [email protected] (M. Guerra).
Deep-Sea Research Part I xxx (xxxx) xxx–xxx
0967-0637/ © 2017 Elsevier Ltd. All rights reserved.
Please cite this article as: Guerra, M., Deep-Sea Research Part I (2017), http://dx.doi.org/10.1016/j.dsr.2017.08.012
600 m deep, and is composed of mesopelagic organisms, dominated bymicronektonic fish (Barham, 1966; Hays, 2003), while the BBL com-prises benthopelagic organisms that move freely on and just above thesea bed (Angel and Boxshall, 1990). Studies of diving and acousticbehaviour can reveal which types of prey are targeted by deep-divingodontocetes (Teloni et al., 2008; Arranz et al., 2011; Miller et al., 2013).The underwater behaviour of sperm whales has been investigated usinga variety of methods including implanted transponders (Watkins et al.,1993), archival tags attached via suction cups (Johnson and Tyack,2003; Watwood et al., 2006; Fais et al., 2015), tags attached with dartsor barbs (Davis et al., 2007; Mate et al., 2016), and passive acoustics(Thode et al., 2002; Wahlberg et al., 2001; Wahlberg, 2002; Milleret al., 2013).
Foraging ecology of sperm whales at Kaikōura was first studied in2007 using a three-dimensional (3-D) passive acoustic array (Miller andDawson, 2009; Miller et al., 2013). The study revealed that whalesforaged throughout the water column, with the majority of foragingbuzzes occurring in mid-water at depths of 400–550 m. The Miller et al.(2013) dataset included 78 recordings of full or partial dive cycles, withwhale identity known for 42 recordings (12 whales). These data weregathered over one year in the upper portion of the Kaikōura Canyonand around the Conway Rise (see Fig. 1). The foraging behaviour ofsperm whales in the deeper parts of the canyon, and areas further off-shore, has remained unstudied.
The abundance of sperm whales feeding at Kaikōura has suffered arecent decline, from nearly 100 individuals in 1991 to half that numberin 2007 (van der Linde, 2009). With no evidence for direct impacts onsurvival, it is possible that the decline has been driven by a change indistribution away from Kaikōura, potentially reflecting underlyingecological changes that affect the availability or distribution of theirprey. It is therefore essential to better understand what sustains the dietof sperm whales and the environmental features which drive theirdistribution. Given the extreme benthic biomass of the KaikōuraCanyon (De Leo et al., 2010; Leduc et al., 2012), and that demersal fishare known to constitute an important part of the diet of sperm whales inthe region (Gaskin and Cawthorn, 1967), we hypothesise that spermwhales at Kaikōura are likely to forage extensively near the seafloor.
To address this hypothesis, we attached acoustic multi-sensor tags(‘Dtags’, Johnson and Tyack, 2003) to sperm whales at Kaikōura. Our
main objective was to investigate which prey layers are targeted bysperm whales in the Kaikōura Canyon system. We also aimed to identifycircadian patterns in their foraging behaviour, and compare foragingpreferences with other populations and previous observations at Kai-kōura. We use the findings from this study to better understand howsperm whales use the different vertical strata in their habitat in order tomeet their high energy requirements.
2. Methods
2.1. Field site and data collection
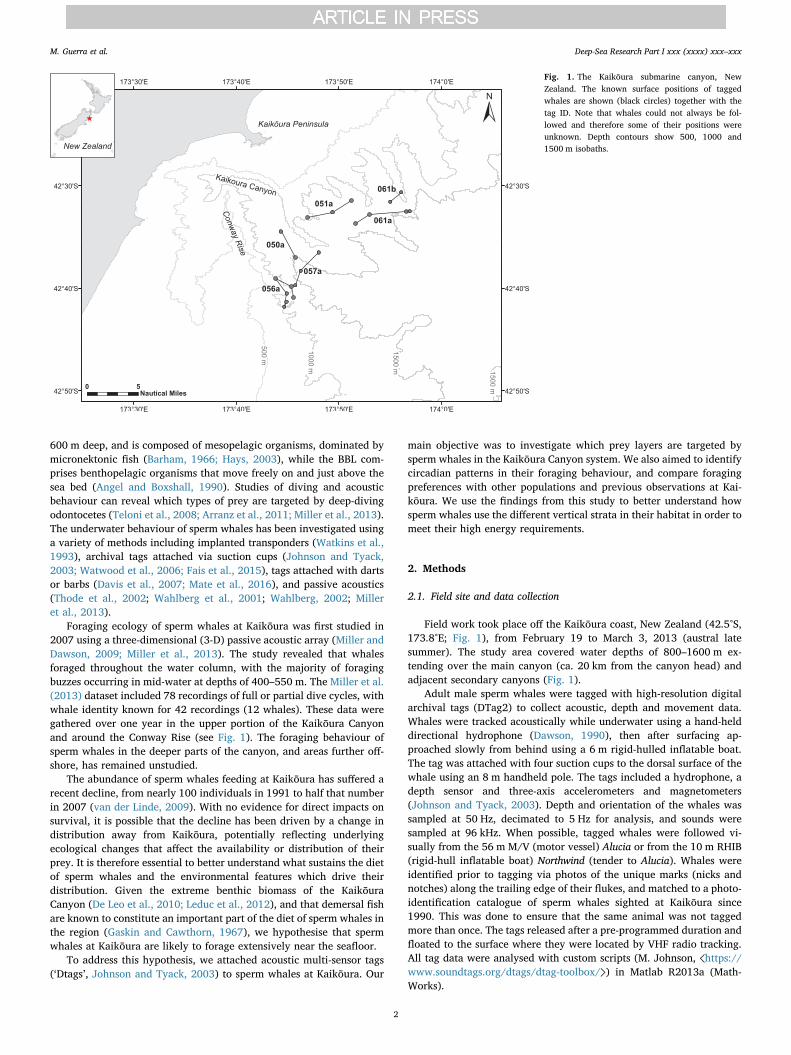
Field work took place off the Kaikōura coast, New Zealand (42.5°S,173.8°E; Fig. 1), from February 19 to March 3, 2013 (austral latesummer). The study area covered water depths of 800–1600 m ex-tending over the main canyon (ca. 20 km from the canyon head) andadjacent secondary canyons (Fig. 1).
Adult male sperm whales were tagged with high-resolution digitalarchival tags (DTag2) to collect acoustic, depth and movement data.Whales were tracked acoustically while underwater using a hand-helddirectional hydrophone (Dawson, 1990), then after surfacing ap-proached slowly from behind using a 6 m rigid-hulled inflatable boat.The tag was attached with four suction cups to the dorsal surface of thewhale using an 8 m handheld pole. The tags included a hydrophone, adepth sensor and three-axis accelerometers and magnetometers(Johnson and Tyack, 2003). Depth and orientation of the whales wassampled at 50 Hz, decimated to 5 Hz for analysis, and sounds weresampled at 96 kHz. When possible, tagged whales were followed vi-sually from the 56 m M/V (motor vessel) Alucia or from the 10 m RHIB(rigid-hull inflatable boat) Northwind (tender to Alucia). Whales wereidentified prior to tagging via photos of the unique marks (nicks andnotches) along the trailing edge of their flukes, and matched to a photo-identification catalogue of sperm whales sighted at Kaikōura since1990. This was done to ensure that the same animal was not taggedmore than once. The tags released after a pre-programmed duration andfloated to the surface where they were located by VHF radio tracking.All tag data were analysed with custom scripts (M. Johnson, ⟨https://www.soundtags.org/dtags/dtag-toolbox/⟩) in Matlab R2013a (Math-Works).
Fig. 1. The Kaikōura submarine canyon, NewZealand. The known surface positions of taggedwhales are shown (black circles) together with thetag ID. Note that whales could not always be fol-lowed and therefore some of their positions wereunknown. Depth contours show 500, 1000 and1500 m isobaths.
M. Guerra et al. Deep-Sea Research Part I xxx (xxxx) xxx–xxx
2
To assess the behavioural reactions of sperm whales to tagging at-tempts, we recorded whether whales exhibited a startle response (e.g., aswipe of the flukes), performed a shallow dive (i.e., not lifting flukes),displayed evasive behaviour by turning and swimming away from thetagging boat, or performed an early dive. A dive was considered to be‘early’ if the whale’s time at the surface was<4.5 min, which is half ofthe mean surface time recorded for sperm whales at Kaikōura (Douglaset al. 2005).
2.2. Dive cycle and foraging activity
While diving, sperm whales regularly produce loud broadbandecholocation clicks (known as ‘usual clicks’) to search for prey (Weilgartand Whitehead, 1988), as well as buzzes (or ‘creaks’) which are as-sumed to indicate prey capture attempts (Miller et al., 2004; Fais et al.,2015). Acoustic recordings were examined acoustically and visuallyusing spectrograms (512 point FFT, Hanning window, 50% overlap) tolocate the start and end of the clicking phase of each dive, and toidentify buzzes. Buzzes were defined as a series of clicks with inter-clickintervals shorter than 0.22 s (Teloni et al., 2008; Fais et al., 2015). Anautomatic click finder in Matlab (“findallclicks” by M. Johnson,⟨https://www.soundtags.org/dtags/dtag-toolbox/⟩) was used to detectindividual clicks for posterior echo analysis.
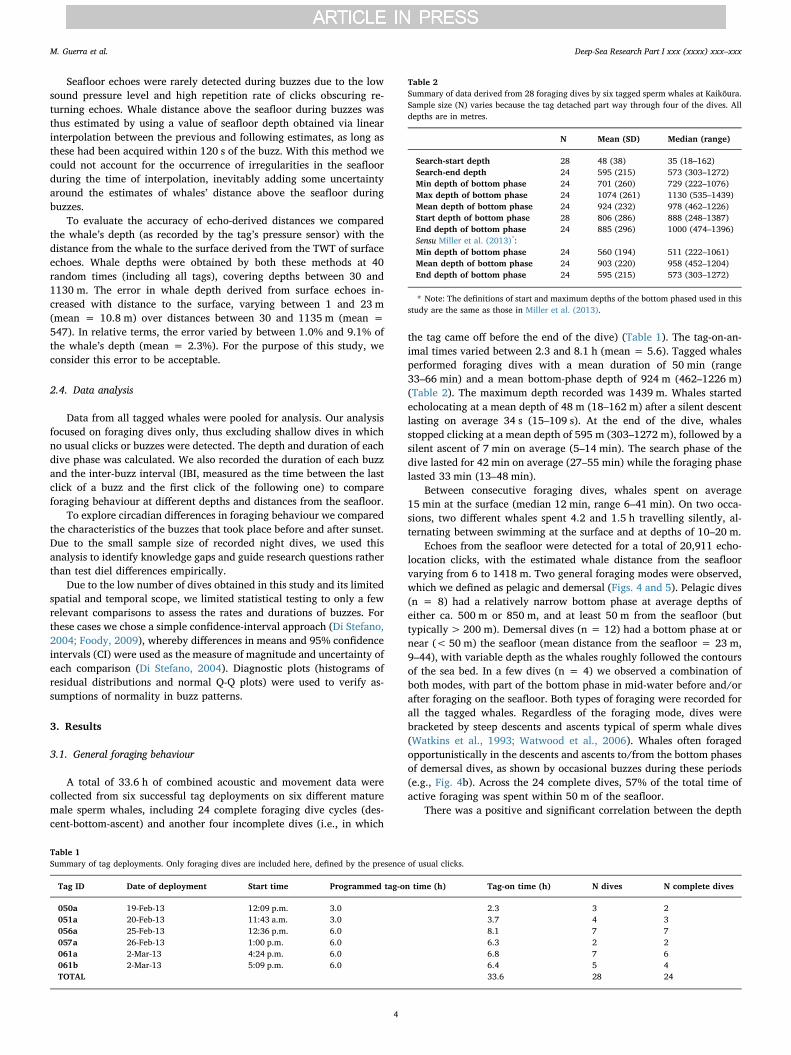
To facilitate the interpretation of the whales’ foraging behaviour,we divided each dive cycle into distinct phases (Fig. 2), based on thedive profiles and foraging vocalisations (Watwood et al., 2006; Milleret al., 2013; Fais et al., 2015). The ‘descent’ phase started when thewhale fluked up, and ended with the first decrease in whale depth; thisphase is therefore characterised by a continuous downwards orienta-tion. The ‘bottom’ phase of the dive followed immediately after thedescent phase and continued until the time when the whale was lastoriented downwards. The ‘ascent’ phase was characterised by a con-tinuous upwards orientation, starting immediately after the end of thebottom phase, and finishing at the time of surfacing. The ‘search’ phasecomprised the part of the dive when the whale was producing usualecholocation clicks. The ‘foraging’ phase of the dive was defined as theperiod from the first to last buzz, representing the time when spermwhales were actively encountering prey. For the specific purpose ofcomparing foraging behaviour to that of sperm whales tracked
acoustically at Kaikōura in near-shore waters, we also used an alter-native definition of ‘bottom’ phase which continued until the whalebecame silent on ascent, following Miller et al. (2013).
2.3. Seafloor echoes and distance above the seafloor
Dtags record the sounds emitted by sperm whales, but also anyechoes returning from the sea surface, seafloor or organisms in thewater (Thode et al., 2002; Arranz et al., 2011; Fais et al., 2015). Thedistance of a sperm whale above the seafloor (also known as ‘whalealtitude’, Arranz et al., 2011; Fais et al., 2015) was thus obtained fromthe echoes generated by the whale’s clicks as they reflected from the seabed (Thode et al., 2002; Arranz et al., 2011; Fais et al., 2015). In es-sence, this method taps into the whales’ sonic perception of their sur-roundings, eavesdropping on their bio-sonar to collect information thatthe whales themselves receive from their physical environment.
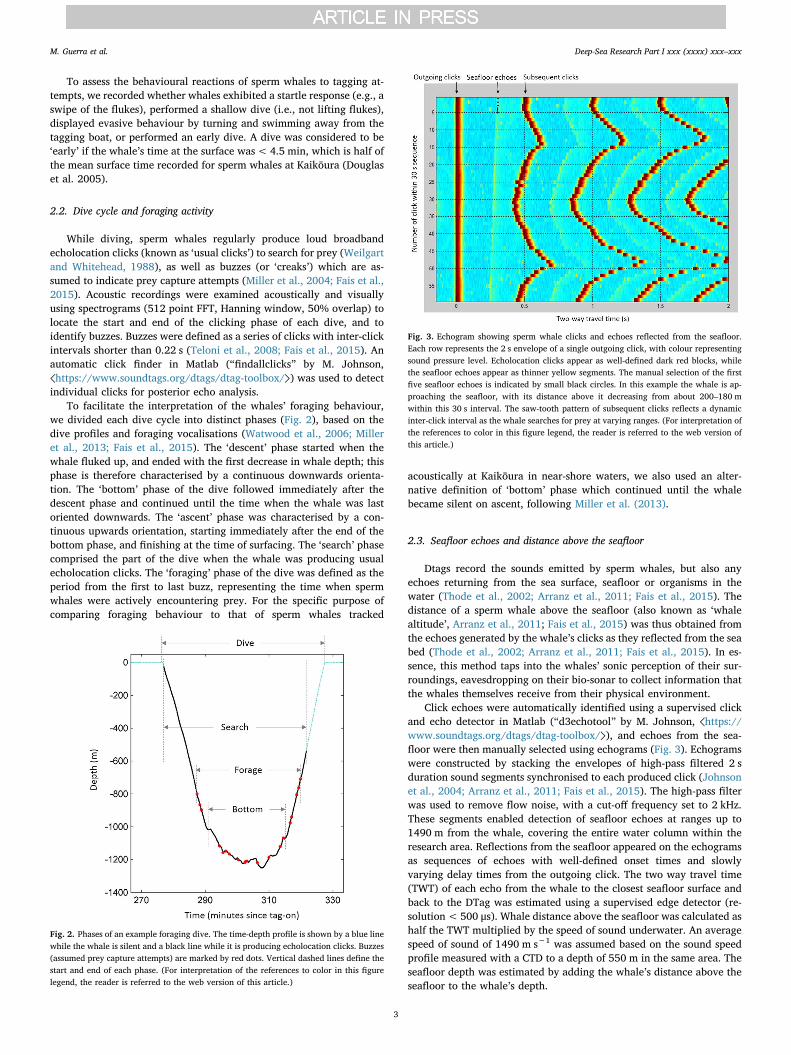
Click echoes were automatically identified using a supervised clickand echo detector in Matlab (“d3echotool” by M. Johnson, ⟨https://www.soundtags.org/dtags/dtag-toolbox/⟩), and echoes from the sea-floor were then manually selected using echograms (Fig. 3). Echogramswere constructed by stacking the envelopes of high-pass filtered 2 sduration sound segments synchronised to each produced click (Johnsonet al., 2004; Arranz et al., 2011; Fais et al., 2015). The high-pass filterwas used to remove flow noise, with a cut-off frequency set to 2 kHz.These segments enabled detection of seafloor echoes at ranges up to1490 m from the whale, covering the entire water column within theresearch area. Reflections from the seafloor appeared on the echogramsas sequences of echoes with well-defined onset times and slowlyvarying delay times from the outgoing click. The two way travel time(TWT) of each echo from the whale to the closest seafloor surface andback to the DTag was estimated using a supervised edge detector (re-solution<500 μs). Whale distance above the seafloor was calculated ashalf the TWT multiplied by the speed of sound underwater. An averagespeed of sound of 1490 m s−1 was assumed based on the sound speedprofile measured with a CTD to a depth of 550 m in the same area. Theseafloor depth was estimated by adding the whale’s distance above theseafloor to the whale’s depth.
Fig. 2. Phases of an example foraging dive. The time-depth profile is shown by a blue linewhile the whale is silent and a black line while it is producing echolocation clicks. Buzzes(assumed prey capture attempts) are marked by red dots. Vertical dashed lines define thestart and end of each phase. (For interpretation of the references to color in this figurelegend, the reader is referred to the web version of this article.)
Fig. 3. Echogram showing sperm whale clicks and echoes reflected from the seafloor.Each row represents the 2 s envelope of a single outgoing click, with colour representingsound pressure level. Echolocation clicks appear as well-defined dark red blocks, whilethe seafloor echoes appear as thinner yellow segments. The manual selection of the firstfive seafloor echoes is indicated by small black circles. In this example the whale is ap-proaching the seafloor, with its distance above it decreasing from about 200–180 mwithin this 30 s interval. The saw-tooth pattern of subsequent clicks reflects a dynamicinter-click interval as the whale searches for prey at varying ranges. (For interpretation ofthe references to color in this figure legend, the reader is referred to the web version ofthis article.)
M. Guerra et al. Deep-Sea Research Part I xxx (xxxx) xxx–xxx
3
Seafloor echoes were rarely detected during buzzes due to the lowsound pressure level and high repetition rate of clicks obscuring re-turning echoes. Whale distance above the seafloor during buzzes wasthus estimated by using a value of seafloor depth obtained via linearinterpolation between the previous and following estimates, as long asthese had been acquired within 120 s of the buzz. With this method wecould not account for the occurrence of irregularities in the seafloorduring the time of interpolation, inevitably adding some uncertaintyaround the estimates of whales’ distance above the seafloor duringbuzzes.
To evaluate the accuracy of echo-derived distances we comparedthe whale’s depth (as recorded by the tag’s pressure sensor) with thedistance from the whale to the surface derived from the TWT of surfaceechoes. Whale depths were obtained by both these methods at 40random times (including all tags), covering depths between 30 and1130 m. The error in whale depth derived from surface echoes in-creased with distance to the surface, varying between 1 and 23 m(mean = 10.8 m) over distances between 30 and 1135 m (mean =547). In relative terms, the error varied by between 1.0% and 9.1% ofthe whale’s depth (mean = 2.3%). For the purpose of this study, weconsider this error to be acceptable.
2.4. Data analysis
Data from all tagged whales were pooled for analysis. Our analysisfocused on foraging dives only, thus excluding shallow dives in whichno usual clicks or buzzes were detected. The depth and duration of eachdive phase was calculated. We also recorded the duration of each buzzand the inter-buzz interval (IBI, measured as the time between the lastclick of a buzz and the first click of the following one) to compareforaging behaviour at different depths and distances from the seafloor.
To explore circadian differences in foraging behaviour we comparedthe characteristics of the buzzes that took place before and after sunset.Due to the small sample size of recorded night dives, we used thisanalysis to identify knowledge gaps and guide research questions ratherthan test diel differences empirically.
Due to the low number of dives obtained in this study and its limitedspatial and temporal scope, we limited statistical testing to only a fewrelevant comparisons to assess the rates and durations of buzzes. Forthese cases we chose a simple confidence-interval approach (Di Stefano,2004; Foody, 2009), whereby differences in means and 95% confidenceintervals (CI) were used as the measure of magnitude and uncertainty ofeach comparison (Di Stefano, 2004). Diagnostic plots (histograms ofresidual distributions and normal Q-Q plots) were used to verify as-sumptions of normality in buzz patterns.
3. Results
3.1. General foraging behaviour
A total of 33.6 h of combined acoustic and movement data werecollected from six successful tag deployments on six different maturemale sperm whales, including 24 complete foraging dive cycles (des-cent-bottom-ascent) and another four incomplete dives (i.e., in which
the tag came off before the end of the dive) (Table 1). The tag-on-an-imal times varied between 2.3 and 8.1 h (mean = 5.6). Tagged whalesperformed foraging dives with a mean duration of 50 min (range33–66 min) and a mean bottom-phase depth of 924 m (462–1226 m)(Table 2). The maximum depth recorded was 1439 m. Whales startedecholocating at a mean depth of 48 m (18–162 m) after a silent descentlasting on average 34 s (15–109 s). At the end of the dive, whalesstopped clicking at a mean depth of 595 m (303–1272 m), followed by asilent ascent of 7 min on average (5–14 min). The search phase of thedive lasted for 42 min on average (27–55 min) while the foraging phaselasted 33 min (13–48 min).
Between consecutive foraging dives, whales spent on average15 min at the surface (median 12 min, range 6–41 min). On two occa-sions, two different whales spent 4.2 and 1.5 h travelling silently, al-ternating between swimming at the surface and at depths of 10–20 m.
Echoes from the seafloor were detected for a total of 20,911 echo-location clicks, with the estimated whale distance from the seafloorvarying from 6 to 1418 m. Two general foraging modes were observed,which we defined as pelagic and demersal (Figs. 4 and 5). Pelagic dives(n = 8) had a relatively narrow bottom phase at average depths ofeither ca. 500 m or 850 m, and at least 50 m from the seafloor (buttypically> 200 m). Demersal dives (n = 12) had a bottom phase at ornear (< 50 m) the seafloor (mean distance from the seafloor = 23 m,9–44), with variable depth as the whales roughly followed the contoursof the sea bed. In a few dives (n = 4) we observed a combination ofboth modes, with part of the bottom phase in mid-water before and/orafter foraging on the seafloor. Both types of foraging were recorded forall the tagged whales. Regardless of the foraging mode, dives werebracketed by steep descents and ascents typical of sperm whale dives(Watkins et al., 1993; Watwood et al., 2006). Whales often foragedopportunistically in the descents and ascents to/from the bottom phasesof demersal dives, as shown by occasional buzzes during these periods(e.g., Fig. 4b). Across the 24 complete dives, 57% of the total time ofactive foraging was spent within 50 m of the seafloor.
There was a positive and significant correlation between the depth
Table 1Summary of tag deployments. Only foraging dives are included here, defined by the presence of usual clicks.
Tag ID Date of deployment Start time Programmed tag-on time (h) Tag-on time (h) N dives N complete dives
050a 19-Feb-13 12:09 p.m. 3.0 2.3 3 2051a 20-Feb-13 11:43 a.m. 3.0 3.7 4 3056a 25-Feb-13 12:36 p.m. 6.0 8.1 7 7057a 26-Feb-13 1:00 p.m. 6.0 6.3 2 2061a 2-Mar-13 4:24 p.m. 6.0 6.8 7 6061b 2-Mar-13 5:09 p.m. 6.0 6.4 5 4TOTAL 33.6 28 24
Table 2Summary of data derived from 28 foraging dives by six tagged sperm whales at Kaikōura.Sample size (N) varies because the tag detached part way through four of the dives. Alldepths are in metres.
N Mean (SD) Median (range)
Search-start depth 28 48 (38) 35 (18–162)Search-end depth 24 595 (215) 573 (303–1272)Min depth of bottom phase 24 701 (260) 729 (222–1076)Max depth of bottom phase 24 1074 (261) 1130 (535–1439)Mean depth of bottom phase 24 924 (232) 978 (462–1226)Start depth of bottom phase 28 806 (286) 888 (248–1387)End depth of bottom phase 24 885 (296) 1000 (474–1396)Sensu Miller et al. (2013)*:Min depth of bottom phase 24 560 (194) 511 (222–1061)Mean depth of bottom phase 24 903 (220) 958 (452–1204)End depth of bottom phase 24 595 (215) 573 (303–1272)
* Note: The definitions of start and maximum depths of the bottom phased used in thisstudy are the same as those in Miller et al. (2013).
M. Guerra et al. Deep-Sea Research Part I xxx (xxxx) xxx–xxx
4
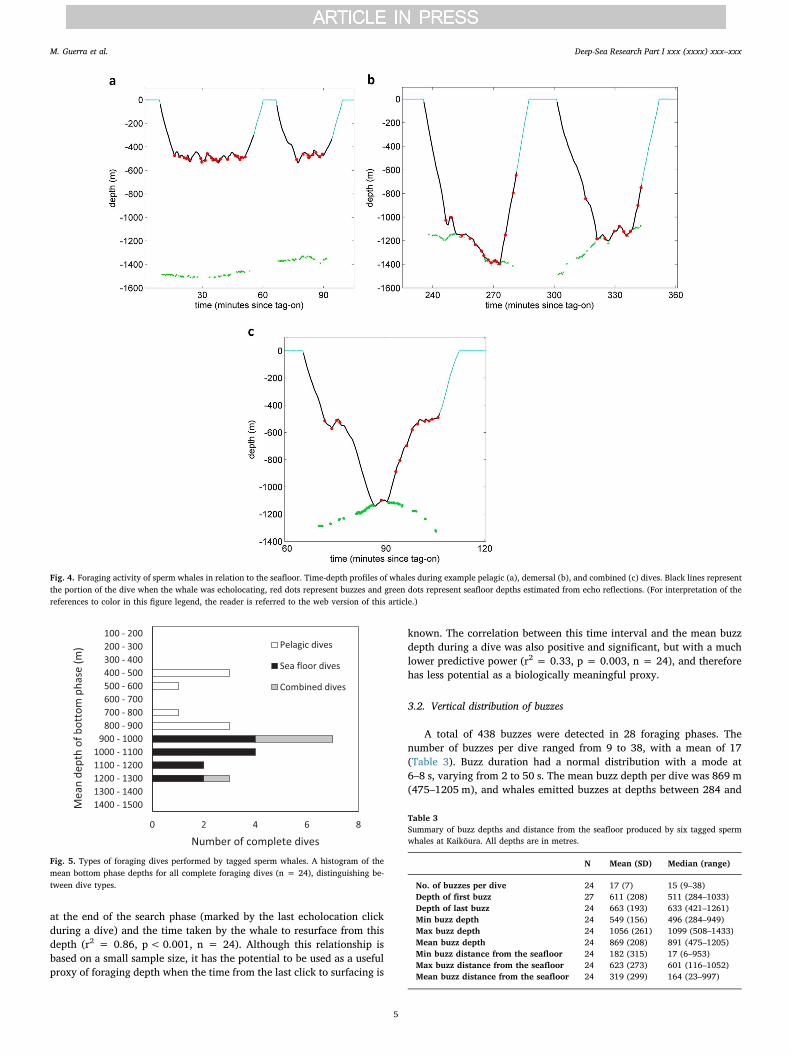
at the end of the search phase (marked by the last echolocation clickduring a dive) and the time taken by the whale to resurface from thisdepth (r2 = 0.86, p<0.001, n = 24). Although this relationship isbased on a small sample size, it has the potential to be used as a usefulproxy of foraging depth when the time from the last click to surfacing is
known. The correlation between this time interval and the mean buzzdepth during a dive was also positive and significant, but with a muchlower predictive power (r2 = 0.33, p = 0.003, n = 24), and thereforehas less potential as a biologically meaningful proxy.
3.2. Vertical distribution of buzzes
A total of 438 buzzes were detected in 28 foraging phases. Thenumber of buzzes per dive ranged from 9 to 38, with a mean of 17(Table 3). Buzz duration had a normal distribution with a mode at6–8 s, varying from 2 to 50 s. The mean buzz depth per dive was 869 m(475–1205 m), and whales emitted buzzes at depths between 284 and
Fig. 4. Foraging activity of sperm whales in relation to the seafloor. Time-depth profiles of whales during example pelagic (a), demersal (b), and combined (c) dives. Black lines representthe portion of the dive when the whale was echolocating, red dots represent buzzes and green dots represent seafloor depths estimated from echo reflections. (For interpretation of thereferences to color in this figure legend, the reader is referred to the web version of this article.)
Fig. 5. Types of foraging dives performed by tagged sperm whales. A histogram of themean bottom phase depths for all complete foraging dives (n = 24), distinguishing be-tween dive types.
Table 3Summary of buzz depths and distance from the seafloor produced by six tagged spermwhales at Kaikōura. All depths are in metres.
N Mean (SD) Median (range)
No. of buzzes per dive 24 17 (7) 15 (9–38)Depth of first buzz 27 611 (208) 511 (284–1033)Depth of last buzz 24 663 (193) 633 (421–1261)Min buzz depth 24 549 (156) 496 (284–949)Max buzz depth 24 1056 (261) 1099 (508–1433)Mean buzz depth 24 869 (208) 891 (475–1205)Min buzz distance from the seafloor 24 182 (315) 17 (6–953)Max buzz distance from the seafloor 24 623 (273) 601 (116–1052)Mean buzz distance from the seafloor 24 319 (299) 164 (23–997)
M. Guerra et al. Deep-Sea Research Part I xxx (xxxx) xxx–xxx
5
1433 m (Table 3). On average, the first buzz in a dive was made 8.4 minafter fluking up (range 4.7–14.4 min).
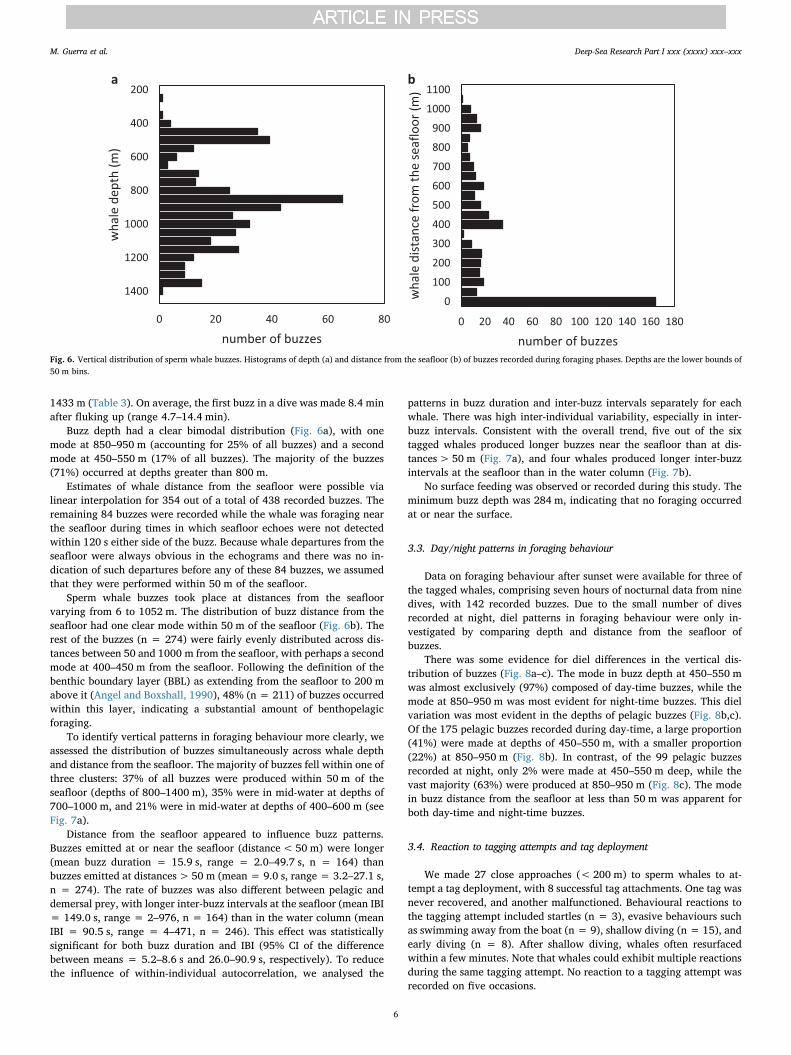
Buzz depth had a clear bimodal distribution (Fig. 6a), with onemode at 850–950 m (accounting for 25% of all buzzes) and a secondmode at 450–550 m (17% of all buzzes). The majority of the buzzes(71%) occurred at depths greater than 800 m.
Estimates of whale distance from the seafloor were possible vialinear interpolation for 354 out of a total of 438 recorded buzzes. Theremaining 84 buzzes were recorded while the whale was foraging nearthe seafloor during times in which seafloor echoes were not detectedwithin 120 s either side of the buzz. Because whale departures from theseafloor were always obvious in the echograms and there was no in-dication of such departures before any of these 84 buzzes, we assumedthat they were performed within 50 m of the seafloor.
Sperm whale buzzes took place at distances from the seafloorvarying from 6 to 1052 m. The distribution of buzz distance from theseafloor had one clear mode within 50 m of the seafloor (Fig. 6b). Therest of the buzzes (n = 274) were fairly evenly distributed across dis-tances between 50 and 1000 m from the seafloor, with perhaps a secondmode at 400–450 m from the seafloor. Following the definition of thebenthic boundary layer (BBL) as extending from the seafloor to 200 mabove it (Angel and Boxshall, 1990), 48% (n = 211) of buzzes occurredwithin this layer, indicating a substantial amount of benthopelagicforaging.
To identify vertical patterns in foraging behaviour more clearly, weassessed the distribution of buzzes simultaneously across whale depthand distance from the seafloor. The majority of buzzes fell within one ofthree clusters: 37% of all buzzes were produced within 50 m of theseafloor (depths of 800–1400 m), 35% were in mid-water at depths of700–1000 m, and 21% were in mid-water at depths of 400–600 m (seeFig. 7a).
Distance from the seafloor appeared to influence buzz patterns.Buzzes emitted at or near the seafloor (distance< 50 m) were longer(mean buzz duration = 15.9 s, range = 2.0–49.7 s, n = 164) thanbuzzes emitted at distances> 50 m (mean = 9.0 s, range = 3.2–27.1 s,n = 274). The rate of buzzes was also different between pelagic anddemersal prey, with longer inter-buzz intervals at the seafloor (mean IBI= 149.0 s, range = 2–976, n = 164) than in the water column (meanIBI = 90.5 s, range = 4–471, n = 246). This effect was statisticallysignificant for both buzz duration and IBI (95% CI of the differencebetween means = 5.2–8.6 s and 26.0–90.9 s, respectively). To reducethe influence of within-individual autocorrelation, we analysed the
patterns in buzz duration and inter-buzz intervals separately for eachwhale. There was high inter-individual variability, especially in inter-buzz intervals. Consistent with the overall trend, five out of the sixtagged whales produced longer buzzes near the seafloor than at dis-tances> 50 m (Fig. 7a), and four whales produced longer inter-buzzintervals at the seafloor than in the water column (Fig. 7b).
No surface feeding was observed or recorded during this study. Theminimum buzz depth was 284 m, indicating that no foraging occurredat or near the surface.
3.3. Day/night patterns in foraging behaviour
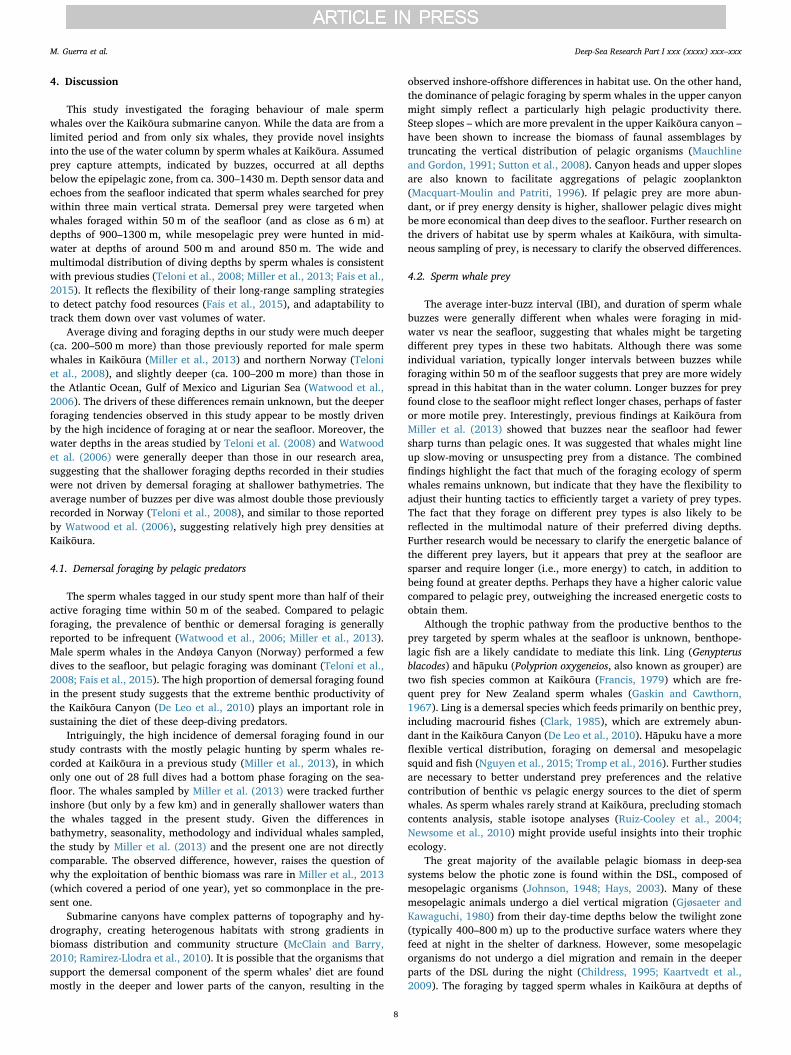
Data on foraging behaviour after sunset were available for three ofthe tagged whales, comprising seven hours of nocturnal data from ninedives, with 142 recorded buzzes. Due to the small number of divesrecorded at night, diel patterns in foraging behaviour were only in-vestigated by comparing depth and distance from the seafloor ofbuzzes.
There was some evidence for diel differences in the vertical dis-tribution of buzzes (Fig. 8a–c). The mode in buzz depth at 450–550 mwas almost exclusively (97%) composed of day-time buzzes, while themode at 850–950 m was most evident for night-time buzzes. This dielvariation was most evident in the depths of pelagic buzzes (Fig. 8b,c).Of the 175 pelagic buzzes recorded during day-time, a large proportion(41%) were made at depths of 450–550 m, with a smaller proportion(22%) at 850–950 m (Fig. 8b). In contrast, of the 99 pelagic buzzesrecorded at night, only 2% were made at 450–550 m deep, while thevast majority (63%) were produced at 850–950 m (Fig. 8c). The modein buzz distance from the seafloor at less than 50 m was apparent forboth day-time and night-time buzzes.
3.4. Reaction to tagging attempts and tag deployment
We made 27 close approaches (< 200 m) to sperm whales to at-tempt a tag deployment, with 8 successful tag attachments. One tag wasnever recovered, and another malfunctioned. Behavioural reactions tothe tagging attempt included startles (n = 3), evasive behaviours suchas swimming away from the boat (n = 9), shallow diving (n = 15), andearly diving (n = 8). After shallow diving, whales often resurfacedwithin a few minutes. Note that whales could exhibit multiple reactionsduring the same tagging attempt. No reaction to a tagging attempt wasrecorded on five occasions.
Fig. 6. Vertical distribution of sperm whale buzzes. Histograms of depth (a) and distance from the seafloor (b) of buzzes recorded during foraging phases. Depths are the lower bounds of50 m bins.
M. Guerra et al. Deep-Sea Research Part I xxx (xxxx) xxx–xxx
6
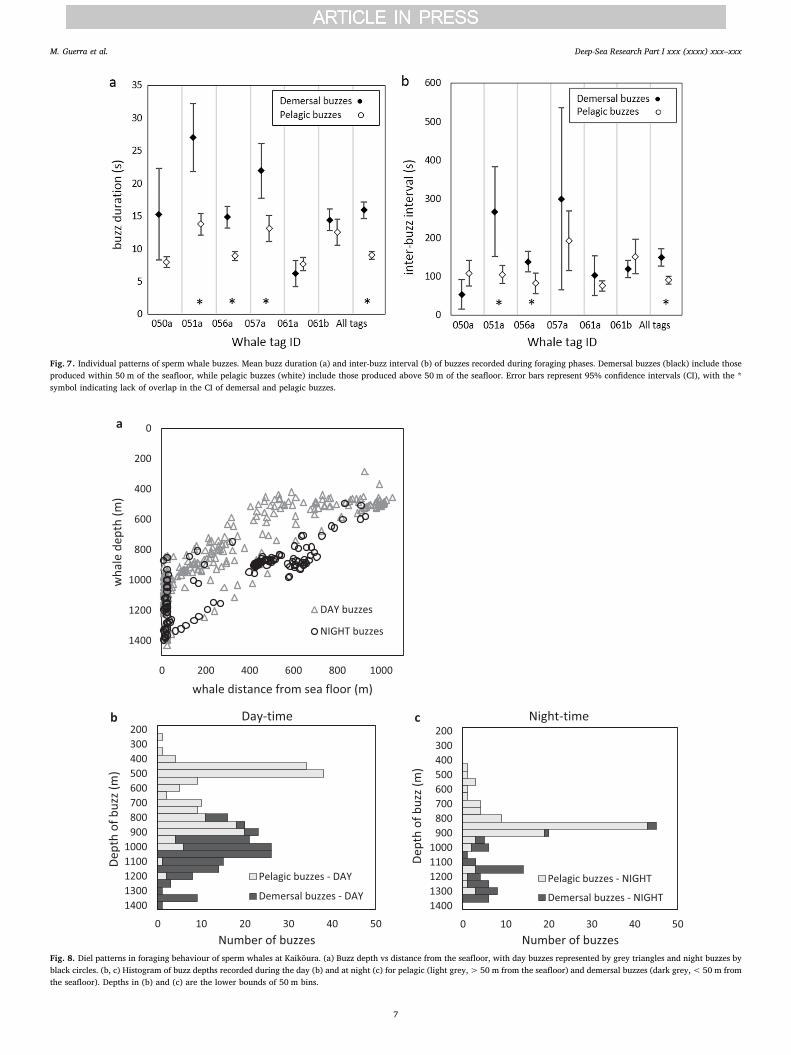
Fig. 7. Individual patterns of sperm whale buzzes. Mean buzz duration (a) and inter-buzz interval (b) of buzzes recorded during foraging phases. Demersal buzzes (black) include thoseproduced within 50 m of the seafloor, while pelagic buzzes (white) include those produced above 50 m of the seafloor. Error bars represent 95% confidence intervals (CI), with the *symbol indicating lack of overlap in the CI of demersal and pelagic buzzes.
Fig. 8. Diel patterns in foraging behaviour of sperm whales at Kaikōura. (a) Buzz depth vs distance from the seafloor, with day buzzes represented by grey triangles and night buzzes byblack circles. (b, c) Histogram of buzz depths recorded during the day (b) and at night (c) for pelagic (light grey,> 50 m from the seafloor) and demersal buzzes (dark grey,< 50 m fromthe seafloor). Depths in (b) and (c) are the lower bounds of 50 m bins.
M. Guerra et al. Deep-Sea Research Part I xxx (xxxx) xxx–xxx
7
4. Discussion
This study investigated the foraging behaviour of male spermwhales over the Kaikōura submarine canyon. While the data are from alimited period and from only six whales, they provide novel insightsinto the use of the water column by sperm whales at Kaikōura. Assumedprey capture attempts, indicated by buzzes, occurred at all depthsbelow the epipelagic zone, from ca. 300–1430 m. Depth sensor data andechoes from the seafloor indicated that sperm whales searched for preywithin three main vertical strata. Demersal prey were targeted whenwhales foraged within 50 m of the seafloor (and as close as 6 m) atdepths of 900–1300 m, while mesopelagic prey were hunted in mid-water at depths of around 500 m and around 850 m. The wide andmultimodal distribution of diving depths by sperm whales is consistentwith previous studies (Teloni et al., 2008; Miller et al., 2013; Fais et al.,2015). It reflects the flexibility of their long-range sampling strategiesto detect patchy food resources (Fais et al., 2015), and adaptability totrack them down over vast volumes of water.
Average diving and foraging depths in our study were much deeper(ca. 200–500 m more) than those previously reported for male spermwhales in Kaikōura (Miller et al., 2013) and northern Norway (Teloniet al., 2008), and slightly deeper (ca. 100–200 m more) than those inthe Atlantic Ocean, Gulf of Mexico and Ligurian Sea (Watwood et al.,2006). The drivers of these differences remain unknown, but the deeperforaging tendencies observed in this study appear to be mostly drivenby the high incidence of foraging at or near the seafloor. Moreover, thewater depths in the areas studied by Teloni et al. (2008) and Watwoodet al. (2006) were generally deeper than those in our research area,suggesting that the shallower foraging depths recorded in their studieswere not driven by demersal foraging at shallower bathymetries. Theaverage number of buzzes per dive was almost double those previouslyrecorded in Norway (Teloni et al., 2008), and similar to those reportedby Watwood et al. (2006), suggesting relatively high prey densities atKaikōura.
4.1. Demersal foraging by pelagic predators
The sperm whales tagged in our study spent more than half of theiractive foraging time within 50 m of the seabed. Compared to pelagicforaging, the prevalence of benthic or demersal foraging is generallyreported to be infrequent (Watwood et al., 2006; Miller et al., 2013).Male sperm whales in the Andøya Canyon (Norway) performed a fewdives to the seafloor, but pelagic foraging was dominant (Teloni et al.,2008; Fais et al., 2015). The high proportion of demersal foraging foundin the present study suggests that the extreme benthic productivity ofthe Kaikōura Canyon (De Leo et al., 2010) plays an important role insustaining the diet of these deep-diving predators.
Intriguingly, the high incidence of demersal foraging found in ourstudy contrasts with the mostly pelagic hunting by sperm whales re-corded at Kaikōura in a previous study (Miller et al., 2013), in whichonly one out of 28 full dives had a bottom phase foraging on the sea-floor. The whales sampled by Miller et al. (2013) were tracked furtherinshore (but only by a few km) and in generally shallower waters thanthe whales tagged in the present study. Given the differences inbathymetry, seasonality, methodology and individual whales sampled,the study by Miller et al. (2013) and the present one are not directlycomparable. The observed difference, however, raises the question ofwhy the exploitation of benthic biomass was rare in Miller et al., 2013(which covered a period of one year), yet so commonplace in the pre-sent one.
Submarine canyons have complex patterns of topography and hy-drography, creating heterogenous habitats with strong gradients inbiomass distribution and community structure (McClain and Barry,2010; Ramirez-Llodra et al., 2010). It is possible that the organisms thatsupport the demersal component of the sperm whales’ diet are foundmostly in the deeper and lower parts of the canyon, resulting in the
observed inshore-offshore differences in habitat use. On the other hand,the dominance of pelagic foraging by sperm whales in the upper canyonmight simply reflect a particularly high pelagic productivity there.Steep slopes – which are more prevalent in the upper Kaikōura canyon –have been shown to increase the biomass of faunal assemblages bytruncating the vertical distribution of pelagic organisms (Mauchlineand Gordon, 1991; Sutton et al., 2008). Canyon heads and upper slopesare also known to facilitate aggregations of pelagic zooplankton(Macquart-Moulin and Patriti, 1996). If pelagic prey are more abun-dant, or if prey energy density is higher, shallower pelagic dives mightbe more economical than deep dives to the seafloor. Further research onthe drivers of habitat use by sperm whales at Kaikōura, with simulta-neous sampling of prey, is necessary to clarify the observed differences.
4.2. Sperm whale prey
The average inter-buzz interval (IBI), and duration of sperm whalebuzzes were generally different when whales were foraging in mid-water vs near the seafloor, suggesting that whales might be targetingdifferent prey types in these two habitats. Although there was someindividual variation, typically longer intervals between buzzes whileforaging within 50 m of the seafloor suggests that prey are more widelyspread in this habitat than in the water column. Longer buzzes for preyfound close to the seafloor might reflect longer chases, perhaps of fasteror more motile prey. Interestingly, previous findings at Kaikōura fromMiller et al. (2013) showed that buzzes near the seafloor had fewersharp turns than pelagic ones. It was suggested that whales might lineup slow-moving or unsuspecting prey from a distance. The combinedfindings highlight the fact that much of the foraging ecology of spermwhales remains unknown, but indicate that they have the flexibility toadjust their hunting tactics to efficiently target a variety of prey types.The fact that they forage on different prey types is also likely to bereflected in the multimodal nature of their preferred diving depths.Further research would be necessary to clarify the energetic balance ofthe different prey layers, but it appears that prey at the seafloor aresparser and require longer (i.e., more energy) to catch, in addition tobeing found at greater depths. Perhaps they have a higher caloric valuecompared to pelagic prey, outweighing the increased energetic costs toobtain them.
Although the trophic pathway from the productive benthos to theprey targeted by sperm whales at the seafloor is unknown, benthope-lagic fish are a likely candidate to mediate this link. Ling (Genypterusblacodes) and hāpuku (Polyprion oxygeneios, also known as grouper) aretwo fish species common at Kaikōura (Francis, 1979) which are fre-quent prey for New Zealand sperm whales (Gaskin and Cawthorn,1967). Ling is a demersal species which feeds primarily on benthic prey,including macrourid fishes (Clark, 1985), which are extremely abun-dant in the Kaikōura Canyon (De Leo et al., 2010). Hāpuku have a moreflexible vertical distribution, foraging on demersal and mesopelagicsquid and fish (Nguyen et al., 2015; Tromp et al., 2016). Further studiesare necessary to better understand prey preferences and the relativecontribution of benthic vs pelagic energy sources to the diet of spermwhales. As sperm whales rarely strand at Kaikōura, precluding stomachcontents analysis, stable isotope analyses (Ruiz-Cooley et al., 2004;Newsome et al., 2010) might provide useful insights into their trophicecology.
The great majority of the available pelagic biomass in deep-seasystems below the photic zone is found within the DSL, composed ofmesopelagic organisms (Johnson, 1948; Hays, 2003). Many of thesemesopelagic animals undergo a diel vertical migration (Gjøsaeter andKawaguchi, 1980) from their day-time depths below the twilight zone(typically 400–800 m) up to the productive surface waters where theyfeed at night in the shelter of darkness. However, some mesopelagicorganisms do not undergo a diel migration and remain in the deeperparts of the DSL during the night (Childress, 1995; Kaartvedt et al.,2009). The foraging by tagged sperm whales in Kaikōura at depths of
M. Guerra et al. Deep-Sea Research Part I xxx (xxxx) xxx–xxx
8
400–600 m fall within the typical boundaries of the lower parts of DSLsreported globally (O'Driscoll et al., 2009; Netburn and Koslow 2015;Klevjer et al., 2012, 2016). Although simultaneous sampling of spermwhale behaviour and prey distribution has not yet been attempted atKaikōura, at least a fraction of the mesopelagic prey targeted by spermwhales is likely to be associated with the lower boundaries of the DSL.
Based on stomach contents analysis, the primary prey item of NewZealand sperm whales are Onychoteuthid squid, and predominantly thewarty squid Onykia ingens (formerly known as Moroteuthis ingens)(Gaskin and Cawthorn, 1967). Warty squid undergo a gradual onto-genic migration from epipelagic waters into deeper demersal habitats asthey mature (Jackson, 1997), with depth ranges of 300–1400 m(Jackson et al., 2000). Adults are demersal at night but appear to mi-grate vertically into pelagic waters during the day, where they feed onmesopelagic myctophids associated with the DSL (Jackson et al., 1998,2000). We found some evidence in this study for circadian shifts in theforaging depths of sperm whales, and a likely association of pelagicprey captures with depths typical of lower-DSL boundaries (i.e., ca.500 m). Warty squid are found at Kaikōura, and mature specimens havebeen found floating at the surface with marks consistent with spermwhale teeth (Guerra, pers. obs.) It seems very plausible that spermwhales are targeting warty squid during their dives to 400–600 m inmid-water during the day, and possibly during demersal foraging atnight. Strong associations with the DSL have been shown for manydeep-diving top predators including pilot whales (Abecassis et al.,2015), elephant seals (Saijo et al., 2016) and Blainville’s beaked whales(Arranz et al., 2011), for which circadian changes in foraging behaviourhave been associated with changes in the vertical distribution of theirprey.
4.3. Use of Dtags to study sperm whale behaviour
Dtags can provide useful insights into the foraging behaviour ofdeep-diving mammals in relation to the seafloor, in addition to pro-viding night-time behaviour information. They can also offer usefulinformation on the density of organisms in the water column, byquantifying the backscatter from animals that are ensonified by thewhales (Arranz et al., 2011). However, they have some limitations –such as not being able to provide accurate georeferenced locations –which prevent relating the whales’ foraging behaviour to other relevantphysical characteristics of their habitat. For example, we were not ableto address if demersal foraging was more or less prevalent over parti-cular topographic features such as canyon slopes. Passive acousticstudies using three-dimensional arrays (e.g., Wahlberg, 2002; Millerand Dawson, 2009; Miller et al., 2013) are an alternative research tool,with the advantage of providing high-resolution georeferenced 3D lo-cations for relating whale movement and behaviour to their physicalenvironment.
We found a strong correlation between a whale’s depth at the end ofthe search phase and the time taken to resurface, revealing a potentialproxy for foraging depth when the underwater track of a whale is un-known. The duration of this silent ascent is an easy metric to recordwhile acoustically tracking a whale. The application of this variable ishowever limited to sperm whales foraging individually and it onlyprovides an estimate of depth for the final phase of a dive. In spite ofthese caveats, it could be useful for investigating temporal and spatialdifferences in foraging depth between seasons, or for assessing an-thropogenic impacts on behaviour.
Our observations of sperm whale behaviour during tagging attemptsrevealed behavioural reactions to close vessel approaches and tagging.Tendencies to reduce time at the surface, for example, correspond tochanges expected under a stress response (Richter et al., 2006; Lusseau,2003). The rate of shallow diving (55% of all approaches) was sub-stantially higher than the average rate recorded for Kaikōura spermwhales (6% of 677 approaches, Otago University Marine Mammal Re-search Group, unpublished data). The fact that sperm whales often
resurfaced within a few minutes after shallow diving suggested that thiswas used as an evasive manoeuvre. Although the physiological costs tothe animals are unknown, they are unlikely to be long-lasting. How-ever, this evidence suggests that sperm whales may experience somestress from tagging attempts, and that foraging behaviour measured viaattached tags may be modified (Miller et al., 2005, 2009). Passiveacoustic studies (Wahlberg, 2002; Miller et al., 2013) can be used tostudy foraging behaviour in detail, with minimal influence on the targetanimals. This should be considered when choosing the most appropriatemethod to study diving and foraging behaviour.
4.4. Ecological implications of the observed foraging behaviour
The present study has provided useful data for understanding whichstrata might be important for foraging sperm whales at Kaikōura.Oceanographic characteristics of mid-water depths at ca. 500 and900 m (e.g., temperature, salinity and dissolved oxygen), in addition tophysical aspects of the seafloor (e.g., slope, aspect and sediment type)would be useful additions to the candidate set of environmental vari-ables used to investigate the habitat preferences of sperm whales. Theapparent differences in foraging behaviour between inshore and off-shore habitats at Kaikōura (Miller et al., 2013, present study) provide auseful framework for future research aimed at understanding intra-population variability in the spatial distribution of sperm whales.
By feeding at depth and releasing fecal plumes close to the surface(Kooyman et al., 1981; Whitehead, 1996), whales play an importantrole in ecosystem connectivity and enhancing productivity (Laveryet al., 2010; Roman and McCarthy, 2010; Sutton, 2013). They act as an‘upward whale pump’, recycling organic carbon and nutrients from thedeep by bringing them to the photic zone, where they become availableto phytoplankton (Roman and McCarthy, 2010; Roman et al., 2014).The vertical flux of nutrients is particularly great in the case of spermwhales (Roman et al., 2014), due to their extreme foraging depths andtheir uptake of food sources across the entire water column. In Kai-kōura, where the density of sperm whales has been historically high(Childerhouse et al., 1995), their contribution to the biological pumpcould be an important driver of the canyon’s high productivity. The factthat abundance of sperm whales at Kaikōura appears to be declining(van der Linde, 2009), raises questions about whether this productivitywill be sustained. Unexpected responses of coastal ecosystems to an-thropogenic stressors arise from insufficient knowledge about complexfood web interactions and feedback loops (Doak et al., 2008). It istherefore essential to better understand food web structures, mechan-isms and functions. Elucidating the processes that result in the extra-ordinary biological assemblages associated with submarine canyons iskey to their long-term protection.
Acknowledgements
Support for this work was provided from contributions by Ray Dalioto the WHOI Access to the Sea Fund. We thank the owners, captain andcrew of the M/V Alucia for their dedicated assistance. For assistance inthe field we thank Moira Brown, Andreas Fahlman, Don LeRoi, WaynePerryman, Luis Lamar and Maryann Morin. The New Zealand Whaleand Dolphin Trust and the University of Otago Marine MammalResearch Group provided equipment and access to the photo-identifi-cation catalogue from Kaikōura. Thanks to Mark Johnson for makingthe Matlab scripts for Dtag analysis freely available, and for helpfulsuggestions, and to Brian Miller for helpful comments and advice. Wethank Mike Morrissey and Whale Watch Kaikōura for logistical support.Sperm whales were tagged under permit 35604-MAR issued by the NewZealand Department of Conservation to Michael Moore, and with theconsent of the University of Otago Animal Ethics Committee (AECnumber 73/2012) issued to William Rayment. The manuscript wasgreatly improved by comments and analysis suggestions from ananonymous reviewer.
M. Guerra et al. Deep-Sea Research Part I xxx (xxxx) xxx–xxx
9
References
Abecassis, M., Polovina, J., Baird, R.W., Copeland, A., Drazen, J.C., Domokos, R., Oleson,E., Jia, Y., Schorr, G.S., Webster, D.L., Andrews, R.D., 2015. Characterizing a foraginghotspot for short-finned pilot whales and Blainville’s beaked whales located off thewest side of Hawai‘i Island by using tagging and oceanographic data. PLoS One 10,e0142628.
Angel, M.V., Boxshall, G.A., 1990. Life in the benthic boundary layer: connections to themid-water and sea floor. Philos. Trans. R. Soc. A 33, 15–28.
Arranz, P., Aguilar Soto, N., Madsen, P.T., Brito, A., Bordes, F., Johnson, M.P., 2011.Following a foraging fish-finder: diel habitat use of Blainville’s beaked whales re-vealed by echolocation. PLoS One 6, e28353.
Barham, E., 1966. Deep scattering layer migration and composition: observations from adiving saucer. Science 151, 1399–1403.
Benoit‐Bird, K.J., Würsig, B., Mfadden, C.J., 2004. Dusky dolphin (Lagenorhynchus ob-scurus) foraging in two different habitats: active acoustic detection of dolphins andtheir prey. Mar. Mamm. Sci. 20, 215–231.
Boren, L.J., Muller, C.G., Gemmell, N.J., 2006. Colony growth and pup condition of theNew Zealand fur seal (Arctocephalus forsteri) on the Kaikoura coastline compared withother east coast colonies. Wild Res. 33, 497–505.
Childerhouse, S.J., Dawson, S.M., Slooten, E., 1995. Abundance and seasonal residence ofsperm whales at Kaikōura, New Zealand. Can. J. Zool. 73, 723–731.
Childress, J.J., 1995. Are there physiological and biochemical adaptations of metabolismin deep-sea animals? Trends Ecol. Evol. 10, 30–36.
Clark, M.R., 1985. The food and feeding of seven fish species from the Campbell Plateau,New Zealand. NZ J. Mar. Freshw. Res. 19, 339–363.
Davis, R.W., Jaquet, N., Gendron, D., Markaida, U., Bazzino, G., Gilly, W., 2007. Divingbehavior of sperm whales in relation to behavior of a major prey species, the jumbosquid, in the Gulf of California, Mexico. Mar. Ecol. Prog. Ser. 333, 291–302.
Dawson S., 1990. Building the CETOS directional hydrophone. ⟨http://whaledolphintrust.org.nz/wp-content/uploads/Building-Directional-HPs.pdf⟩.
De Leo, F.C., Smith, C.R., Rowden, A.R., Bowden, D.A., Clark, M.R., 2010. Submarinecanyons: hotspots of benthic biomass and productivity in the deep sea. Proc. R. Soc. B277, 2783–2792.
Di Stefano, J., 2004. A confidence interval approach to data analysis. For. Ecol. Manag.187, 173–183.
Doak, D.F., Estes, J.A., Halpern, B.S., Jacob, U., Lindberg, D.R., Lovvorn, J., Monson,D.H., Tinker, M.T., Williams, T.M., Wootton, J.T., Carroll, I., 2008. Understandingand predicting ecological dynamics: are major surprises inevitable. Ecology 89,952–961.
Fais, A., Soto, N.A., Johnson, M., Pérez-González, C., Miller, P.J.O., Madsen, P.T., 2015.Sperm whale echolocation behaviour reveals a directed, prior-based search strategyinformed by prey distribution. Behav. Ecol. Sociobiol. 69, 663–674.
Foody, G.M., 2009. Classification accuracy comparison: hypothesis tests and the use ofconfidence intervals in evaluations of difference, equivalence and noninferiority.Remote Sens. Environ. 113, 1658–1663.
Francis MP (1979) Checklist of the marine fishes of Kaikoura, New Zealand. Mauri ora 7:pp.63–71.
Gaskin, D.E., Cawthorn, M.W., 1967. Diet and feeding habits of the sperm whale (Physetercatadon L.) in the Cook Strait region of New Zealand. N.Z. J. Mar. Freshw. Res. 2,156–179.
Gjøsaeter, J.K., Kawaguchi, K., 1980. A review of the world resources of mesopelagic fish.FAO Fish. Tech. Pap. 193, 151.
Hays, G.C., 2003. A review of the adaptive significance and ecosystem consequences ofzooplankton diel vertical migrations. Hydrobiologia 503, 163–170.
Jackson, G.D., 1997. Age, growth and maturation of the deepwater squid Moroteuthisingens (Cephalopoda: onychoteuthidae) in New Zealand waters. Polar Biol. 17,268–274.
Jackson, G.D., McKinnon, J.F., Lalas, C., Ardern, R., Buxton, N.G., 1998. Food spectrum ofthe deepwater squid Moroteuthis ingens (Cephalopoda: onychoteuthidae) in NewZealand waters. Polar Biol. 20, 56–65.
Jackson, G.D., Shaw, A.G., Lalas, C., 2000. Distribution and biomass of two squid speciesoff southern New Zealand: Nototodarus sloanii and Moroteuthis ingens. Polar Biol. 23,699–705.
Jaquet, N., Dawson, S., Slooten, E., 2000. Seasonal distribution and diving behaviour ofmale sperm whales off Kaikōura: foraging implications. Can. J. Zool. 78, 407–419.
Johnson, M.W., 1948. Sound as a tool in marine ecology, from data on biological noisesand the deep scattering layer. J. Mar. Res. 7, 443–458.
Johnson, M.P., Madsen, P.T., Zimmer, W.M.X., Aguilar de Soto, N., Tyack, P.L., 2004.Beaked whales echolocate on prey. Biol. Lett. 271, 383–386.
Johnson, M.P., Tyack, P.L., 2003. A digital acoustic recording tag for measuring the re-sponse of wild marine mammals to sound. IEEE J. Ocean. Eng. 28, 3–12.
Kaartvedt, S., Røstad, A., Klevjer, T.A., Staby, A., 2009. Use of bottommounted echosounders in exploring behavior of mesopelagic fishes. Mar. Ecol. Prog. Ser. 395,109–118.
Klevjer T.A., Irigoien X., Røstad A., Fraile-Nuez E., Benítez-Barrios V.M., Kaartvedt S.,(2016) Large scale patterns in vertical distribution and behaviour of mesopelagicscattering layers. Scientific Reports 6:19873.
Klevjer, T.A., Torres, D.J., Kaartvedt, S., 2012. Distribution and diel vertical movementsof mesopelagic scattering layers in the Red Sea. Mar. Biol. 159, 1833–1841.
Kooyman, G.L., Castellini, M.A., Davis, R.W., 1981. Physiology of diving marine mam-mals. Annu. Rev. Physiol. 43, 343–356.
Lavery, T.J., Roudnew, B., Gill, P., Seymour, J., Seuront, L., Johnson, G., Mitchell, J.G.,Smetacek, V., 2010. Iron defecation by sperm whales stimulates carbon export in theSouthern Ocean. Proc. R. Soc. Lond. B Biol. Sci. http://dx.doi.org/10.1098/rspb.
2010.0863.Leduc, D., Rowden, A.A., Bowden, D.A., Probert, P.K., Pilditch, C.A., Nodder, S.D., 2012.
Unimodal relationship between biomass and species richness of deep-sea nematodes:implications for the link between productivity and diversity. Mar. Ecol. Prog. Ser.454, 53–64.
Lusseau, 2003. Male and female bottlenose dolphins Tursiops spp. have different strategiesto avoid interactions with tour boats in doubtful sound, New Zealand. Mar. Ecol.Prog. Ser. 257, 267–274.
Macquart-Moulin, C., Patriti, G., 1996. Accumulation of migratory micronekton crusta-ceans over the upper slope and submarine canyons of the northwestern mediterra-nean. Deep-Sea Res. Part I Oceanogr. Res. Pap. 43, 579–601.
Madsen, P., Wahlberg, M., Møhl, B., 2002. Male sperm whale (Physeter macrocephalus)acoustics in a high-latitude habitat: implications for echolocation and communica-tion. Behav. Ecol. Sociobiol. 53, 31–41.
Marshall, N.B., 1965. Systematical and biological studies of the macrourid fishes(Anacanthini-Teleostii). Deep-Sea Res. I 12, 299–322.
Martin, A.R., Clarke, M.R., 1986. The diet of sperm whales (Physeter macrocephalus)captured between Iceland and Greenland. J. Mar. Biol. Assoc. U.K. 1, 779–790.
Mate, B.R., Irvine, L.M., Palacios, D.M., 2016. The development of an inter-mediate‐duration tag to characterize the diving behavior of large whales. Ecol. Evol.http://dx.doi.org/10.1002/ece3.2649.
Mauchline, J., Gordon, J.D.M., 1991. Oceanic pelagic prey of benthopelagic fish in thebenthic boundary layer of a marginal oceanic region. Mar. Ecol. Prog. Ser. 74,109–115.
McClain, C.R., Barry, J.P., 2010. Habitat heterogeneity, disturbance, and productivitywork in concert to regulate biodiversity in deep submarine canyons. Ecology 91,964–976.
Miller, B., Dawson, S., 2009. A large-aperture low-cost hydrophone array for trackingwhales from small boats. J. Acoust. Soc. Am. 126, 2248–2256.
Miller, B., Dawson, S., Vennell, R., 2013. Underwater behavior of sperm whales offKaikoura, NZ, as revealed by a three-dimensional hydrophone array. J. Acoust Soc.Am. 134, 2690–2700.
Miller, P.J.O., Johnson, M., Madsen, P.T., Biassoni, N., Quero, M., Tyack, P.L., 2009.Using at-sea experiments to study the effects of airguns on the foraging behavior ofsperm whales in the Gulf of Mexico. Deep-Sea Res. I 56, 1168–1181.
Miller, P.J.O., Johnson, M.P., Tyack, P.L., 2004. Sperm whale behaviour indicates the useof echolocation click buzzes ‘creaks' in prey capture. Proc. R. Soc. Lond. B 271,2239–2247.
Miller P.J.O., Tyack P.L., Biassoni N., Johnson M.P., 2005. Short-term effects of suctioncup tagging on the deep-diving behaviour of sperm whales. In: Proceedings of theAbstracts in Second International Symposium of Biologging Science, St. Andrews,Scotland.
Møhl, B., Wahlberg, M., Madsen, P.T., Miller, L.A., Surlykke, A., 2000. Sperm whaleclicks: directionality and source level revisited. J. Acoust. Soc. Am. 107, 638–648.
Moors-Murphy, H.B., 2014. Submarine canyons as important habitat for cetaceans, withspecial reference to the Gully: a review. Deep Sea Res. II: Top. Stud. Oceanogr. 104,6–19.
Netburn, A.N., Koslow, J.A., 2015. Dissolved oxygen as a constraint on daytime deepscattering layer depth in the southern California current ecosystem. Deep-Sea Res.Part I Oceanogr. Res. Pap. 104, 149–158.
Newsome, S.D., Clementz, M.T., Koch, P.L., 2010. Using stable isotope biogeochemistry tostudy marine mammal ecology. Mar. Mamm. Sci. 26, 509–572.
Nguyen, H.M., Rountrey, A.N., Meeuwig, J.J., Coulson, P.G., Feng, M., Newman, S.J.,Waite, A.M., Wakefield, C.B., Meekan, M.G., 2015. Growth of a deep-water, pre-datory fish is influenced by the productivity of a boundary current system. Sci.Rep. 5.
O'Driscoll, R.L., Gauthier, S., Devine, J.A., 2009. Acoustic estimates of mesopelagic fish:as clear as day and night? ICES J. Mar. Sci. 66.
Okutani, T., Nemoto, T., 1964. Squids as the food of sperm whales in the Bering Sea andAlaska Gulf. Sci. Rep. Whales Res Inst. 18.
Papastavrou, V., Smith, S.C., Whitehead, H., 1989. Diving behavior of the sperm whale,Physeter macrocephalus, off the Galapagos Islands. Can. J. Zool. 67, 839–846.
Ramirez-Llodra, E., Brandt, A., Danovaro, R., De Mol, B., Escobar, E., German, C., Levin,L., Arbizu, P., Menot, L., Buhl-Mortensen, P., Narayanaswamy, B.E., 2010. Deep,diverse and definitely different: unique attributes of the world's largest ecosystem.Biogeosciences 7, 2851–2899.
Rice, D.W., 1989. Sperm whale. Physeter macrocephalus Linnaeus, 1758. In: Ridgway, H.(Ed.), Handbook of Marine Mammals 4 Academic Press, London.
Richter, C., Dawson, S., Slooten, E., 2006. Impacts of commercial whale watching on malesperm whales at Kaikoura, New Zealand. Mar. Mamm. Sci. 22, 46–63.
Roman, J., Estes, J.A., Morissette, L., Smith, C., Costa, D., McCarthy, J., Nation, J.B.,Nicol, S., Pershing, A., Smetacek, V., 2014. Whales as marine ecosystem engineers.Front. Ecol. Environ. 12, 377–385.
Roman, J., McCarthy, J.J., 2010. The whale pump: marine mammals enhance primaryproductivity in a coastal basin. PLoS One 5, e13255.
Ruiz-Cooley, R.I., Gendron, D., Aguíñiga, S., Mesnick, S., Carriquiry, J.D., 2004. Trophicrelationships between sperm whales and jumbo squid using stable isotopes of C andN. Mar. Ecol. Prog. Ser. 277, 275–283.
Saijo, D., Mitani, Y., Abe, T., Sasaki, H., Goetsch, C., Costa, D.P., Miyashita, K., 2016.Linking mesopelagic prey abundance and distribution to the foraging behavior of adeep-diving predator, the northern elephant seal. Deep Sea Res. II: Top. Stud.Oceanogr. http://dx.doi.org/10.1016/j.dsr2.2016.11.007.
Santos, M.B., Pierce, G.J., Boyle, P.R., Reid, R.J., Ross, H.M., Patterson, I.A.P., Kinze, C.C.,Tougaard, S., Lick, R., Piatkowski, U., Hernandez-Garcia, V., 1999. Stomach contentsof sperm whales Physeter macrocephalus stranded in the North Sea 1990–1996. Mar.Ecol. Prog. Ser. 183, 281–294.
M. Guerra et al. Deep-Sea Research Part I xxx (xxxx) xxx–xxx
10
Shepard, F.P., Dill, R.F., 1966. Submarine Canyons and other Sea Valleys. RandMcNally & Co, Chicago, IL.
Sutton, T.T., 2013. Vertical ecology of the pelagic ocean: classical patterns and newperspectives. J. Fish. Biol. 83, 1508–1527.
Sutton, T.T., Porteiro, F.M., Heino, M., Byrkjedal, I., Langhelle, G., Anderson, C.I., Horne,J., Søiland, H., Falkenhaug, T., Godø, O.R., Bergstad, O.A., 2008. Vertical structure,biomass and topographic association of deep-pelagic fishes in relation to a mid-oceanridge system. Deep Sea Res. II: Top. Stud. Oceanogr. 55, 161–184.
Teloni, V., Johnson, M.P., Miller, J.O.P., Madsen, P.M., 2008. Shallow food for deep di-vers: dynamic foraging behavior of male sperm whales in a high latitude habitat. J.Exp. Mar. Biol. Ecol. 354, 119–131.
Thode, A., Mellinger, D.K., Stienessen, S., Martinez, A., Mullin, K., 2002. Depth-depen-dent acoustic features of diving sperm whales (Physeter macrocephalus) in the Gulf ofMexico. J. Acoust. Soc. Am. 112, 308–321.
Tromp, J.J., Jones, P.L., Symonds, J.E., Walker, S.P., Pope, A., Pether, S.M., Afonso, L.O.,2016. Effects of commercial diets and temperature on the growth performance andstress response of hapuku (Polyprion oxygeneios). Aquaculture 452, 128–133.
van der Linde, M., 2009. Long-term Monitoring of Sperm Whales in Kaikoura, NewZealand: Data-management, Abundance, and Population Dynamics. University ofOtago, New Zealand (MSc dissertation).
Van Oevelen, D., Soetaert, K., García, R., De Stigter, H.C., Cunha, M.R., Pusceddu, A.,
Danovaro, R., 2011. Canyon conditions impact carbon flows in food webs of threesections of the Nazaré canyon. Deep Sea Res. II: Top. Stud. Oceanogr. 58, 2461–2476.
Vetter, E.W., Smith, C.R., De Leo, F.C., 2010. Hawaiian hotspots: enhanced megafaunalabundance and diversity in submarine canyons on the oceanic islands of Hawaii. Mar.Ecol. 31, 183–199.
Wahlberg, M., 2002. The acoustic behaviour of diving sperm whales observed with ahydrophone array. J. Exp. Mar. Biol. Ecol. 281, 53–62.
Wahlberg, M., Møhl, B., Madsen, P.T., 2001. Estimating source position accuracy of alarge-aperture hydrophone array for bioacoustics. J. Acoust. Soc. Am. 109, 397–406.
Watkins, W.A., Daher, M.A., Fristrup, K.M., Howald, T.J., Notarbartolo di Sciara, G.,1993. Sperm whales tagged with transponders and tracked underwater by sonar. Mar.Mamm. Sci. 9, 55–67.
Watwood, S., Miller, P., Johnson, M., Madsen, P., Tyack, P., 2006. Deep-diving foragingbehaviour of sperm whales (Physeter macrocephalus). J. Anim. Ecol. 75, 814–825.
Weilgart, L.S., Whitehead, H., 1988. Distinctive vocalizations from mature male spermwhales (Physeter macrocephalus). Can. J. Zool. 66, 1931–1937.
Whitehead, H., 1996. Variation in the feeding success of sperm whales: temporal scale,spatial scale and relationship to migrations. J. Anim. Ecol. 65, 429–438.
Yen, P.P., Sydeman, W.J., Hyrenbach, K.D., 2004. Marine bird and cetacean associationswith bathymetric habitats and shallow-water topographies: implications for trophictransfer and conservation. J. Mar. Syst. 50, 79–99.
M. Guerra et al. Deep-Sea Research Part I xxx (xxxx) xxx–xxx
11