deep-sea research part ii
TRANSCRIPT

Deep–Sea Research II xxx (xxxx) xxx
Please cite this article as: Mariana C. Nieva Tamasiunas, Deep–Sea Research II, https://doi.org/10.1016/j.dsr2.2021.104985
Available online 1 October 20210967-0645/© 2021 Published by Elsevier Ltd.
Intraseasonal variability of the Indonesian throughflow associated with the Madden-Julian Oscillation
Mariana C. Nieva Tamasiunas a,*, Toshiaki Shinoda a, R. Dwi Susanto b, Luis Zamudio c, E. Joseph Metzger d
a Texas A&M University Corpus Christi, 6300 Ocean Dr., Corpus Christi, TX, 78412, USA b University of Maryland, College Park, MD, 20742, USA c Florida State University, 282 Champions Way, Tallahassee, FL, 32306-2400, USA d Naval Research Laboratory, Stennis Space Center, 1005 Balch Boulevard, MS, 39529, USA
A R T I C L E I N F O
Keywords: Indonesian throughflow Intraseasonal variability Madden-Julian Oscillation Maritime continent Kelvin wave
A B S T R A C T
Intraseasonal variability (20–90 days) of the Indonesian Throughflow (ITF), which is primarily forced by the Madden-Julian Oscillation (MJO), is investigated using a high-resolution global ocean reanalysis and satellite altimeter data. Previous studies show that during the MJO active phase, downwelling Kelvin waves generated in the central equatorial Indian Ocean propagate along the coast of Sumatra and Java islands, affecting the ITF transport at exit passages in the Indonesian Seas and Makassar Strait. However, the intraseasonal variation of the ITF transport through these straits over the MJO life cycle, especially during the suppressed phase, has not been quantified. To quantify the ITF transport associated with the MJO, composites of ITF transport through major straits in the Indonesian Seas are constructed using a 0.08◦ global HYbrid Coordinate Ocean Model (HYCOM) reanalysis. A prominent reduction of ITF transport through major straits is found during the MJO active phase, and a transport enhancement comparable to the reduction is evident during the suppressed phase. As a result, the net effect of the MJO on the mean ITF transport is very small due to the cancellation of the enhancement and reduction. The magnitude of the MJO-associated ITF transport variation through all ITF exit passages is about 6 Sv, which is about 50% of the total transport. While the propagation of coastal Kelvin waves during the MJO active phase and their impact on ITF transport is clearly evident in the composite, such Kelvin wave influence on ITF transport is not clearly detected during the suppressed phase. This suggests that anomalous winds over the Maritime Continent (MC) area are mostly responsible for the ITF variation during the suppressed phase in many MJO events. Yet, during some MJO events, remotely-forced upwelling Kelvin waves and their significant impact on the ITF transport are evident during the MJO suppressed phase.
1. Introduction
Oceanic and atmospheric processes over the Maritime Continent (MC) play a key role in the Earth’s climate and global ocean circulations (e.g., Sprintall et al., 2014; Lee et al., 2019). As the MC is located in the warmest (~28 ◦C) ocean area in the world, the area has a potential to transfer a large amount of energy to the atmosphere, and thus ocean variability in this region affects climate variations across the globe on multiple time scales (e.g., Neale and Slingo 2003).
Ocean circulation over the MC region is a portion of the upper branch of the global ocean thermohaline circulation. The Indonesian Throughflow (ITF), which is a major current within the MC area, carries
about 10–15 Sv of waters from the Pacific to the Indian Ocean (Gordon 2005; Sprintall et al., 2009; Gordon et al., 2010). ITF flows through the complex bathymetries in the Indonesian Seas and its mean and vari-ability largely influence Pacific and Indian Ocean circulations (e.g., Lee et al., 2002; McCreary et al., 2007). Because of the importance of the ITF for global ocean circulation and climate variability, transport through major straits in the Indonesian Seas has been intensively studied in the last few decades (e.g., Sprintall et al., 2009; Gordon et al., 2010; Susanto et al., 2012). For example, the International Nusantara STratification ANd Transport program (INSTANT) was designed to estimate the ITF transport in all major straits in the Indonesian Seas, and intensive measurements were conducted during 2004–2006 (Sprintall et al.,
* Corresponding author. E-mail address: [email protected] (M.C. Nieva Tamasiunas).
Contents lists available at ScienceDirect
Deep-Sea Research Part II
journal homepage: www.elsevier.com/locate/dsr2
https://doi.org/10.1016/j.dsr2.2021.104985 Received 8 October 2020; Received in revised form 14 September 2021; Accepted 28 September 2021

Deep-Sea Research Part II xxx (xxxx) xxx
2
2004). As a result of these observational studies on the ITF in recent years, uncertainties of mean ITF transport are now substantially reduced (e.g., Gordon et al., 2010; Susanto et al., 2016). However, large un-certainties still exist for the variability of ITF transport.
The ITF varies on several different time scales. Previous studies suggest significant ITF variability on seasonal (e.g., Sprintall et al., 2009; Shinoda et al., 2012), interannual (e.g., Meyers 1996; Masumoto 2002; Wijffels and Meyers 2004), decadal (e.g., Wainwright et al., 2008), and centennial (e.g., Feng et al., 2018) time scales. In addition, prominent intraseasonal variability of the ITF is identified in recent studies (e.g., Qiu et al., 1999; Schiller et al., 2010; Zhu and Murtugudde 2010; Pujiana et al., 2013; Shinoda et al., 2016; Napitu et al., 2019). These studies indicate that a large portion of ITF intraseasonal variability is caused by wind forcing associated with the Madden-Julian Oscillation (MJO; Madden and Julian 1972), which is a dominant mode of atmospheric intra-seasonal variability in the tropics (e.g., Zhang 2005). For example, Qiu et al. (1999) found that the intraseasonal signals along the Suma-tra/Java coasts were induced remotely by coastal Kelvin waves that are generated by intraseasonal anomalous surface zonal winds in the central equatorial Indian Ocean, and these anomalous coastal currents affect the ITF transport at Lombok and Makassar Straits. Schiller et al. (2010) further demonstrated that the signals of intraseasonal Kelvin waves are detected as far east as the Banda Sea and that the intraseasonal vari-ability in the region is also forced by local winds. Pujiana et al. (2013) provided the detailed description of Kelvin wave characteristics between Lombok and Makassar Straits. It is suggested that equatorial westerly wind bursts in the Indian Ocean associated with the MJO generate these intraseasonal coastal Kelvin waves that penetrate the Indonesian Seas. A recent study by Napitu et al. (2019) further examined the ITF transport variation through Makassar Strait associated with the MJO based on the analysis of mooring data. They reported that Makassar Strait through-flow transport is significantly decreased during the MJO active phase, while the transport is increased during the suppressed phase.
While these previous studies on ITF intraseasonal variability suggest some important oceanic processes that could influence the ITF, the ITF transport variations through most major straits in the Indonesian Seas over the life cycle of the MJO have not been quantified. Although some of the recent studies estimate the ITF transport variability associated with the MJO (e.g. Drushka et al., 2010; Pujiana et al., 2013; Napitu et al., 2019), most of these studies focus on the ITF transport through a specific strait (e.g., Makassar Strait) or for the short time period when the in situ data are available (e.g. INSTANT), and the overall variation of ITF transport on the intraseasonal time scale through major straits and the relation of the transport between those straits are not well under-stood. In addition, these studies mostly investigate the impact of the MJO during the active phase. However, significant anomalies of surface forcing fields including winds are observed during the suppressed phase of the MJO, which generate large sea surface temperature (SST) anomalies (e.g., Shinoda et al., 1998; Vialard et al., 2013; Marshall and Hendon 2014). Hence it is likely that such wind anomalies during the suppressed phase produce prominent anomalous currents including ITF. Yet the MJO influence on ITF transport during the suppressed phase is not emphasized in previous studies, and thus the net effect of MJO on the overall ITF transport is not well known.
A major goal of this study is to quantify the intraseasonal variability of overall ITF transport through major straits associated with the MJO. Until recently, it has been difficult to describe ITF transport variability through all major straits in the Indonesian Seas due to the lack of in situ observations as well as other reliable high-resolution data. A high- resolution (0.08◦) global ocean reanalysis has been integrated recently, which can provide a useful tool to investigate the upper ocean variability including the ITF. In this study, we analyze the high- resolution ocean reanalysis along with the satellite and in situ data to examine the effect of the MJO on the upper ocean currents and the ITF transport.
The following specific questions will be addressed in this study:
I) How does the transport of the ITF through major straits in the Indonesian Seas vary during the MJO active and suppressed phases, and what is the net effect of the MJO on the overall ITF transport?
II) How does the remotely-forced Kelvin waves associated with the MJO contribute to the ITF transport in major straits during the active and suppressed phases?
Ocean circulations including the ITF over the MC region in the high- resolution reanalysis are first validated based on the comparison with existing observational data. Then the MJO composites of ITF transport through major straits are constructed. A particular emphasis in the analysis is given to the examination of net effect of MJO on the long- term or mean ITF transport by quantifying the transport during both active and suppressed phases.
2. Data and method
2.1. Data
2.1.1. High resolution ocean reanalysis This study employs the eddy-resolving global ocean reanalysis,
which was created using a system similarly configured to the US Navy’s operational Global Ocean Forecast System (Metzger et al., 2014). It consists of the HYbrid Coordinate Ocean Model (HYCOM; Bleck 2002) that is two-way coupled to the Community Ice CodE (CICE) and assim-ilates available observations using the Navy Coupled Ocean Data Assimilation (NCODA; Cummings 2006; Cummings and Smedstad 2013). This reanalysis product is referred to as “HYCOM reanalysis” hereafter. HYCOM has an equatorial horizontal resolution of 0.08◦
(1/12.5◦ or ~ 9 km near the equator), which makes it eddy-resolving for the oceanic mesoscale. HYCOM uses a hybrid vertical coordinate which combines the z-level coordinate for the unstratified sea, the isopycnal coordinate in the open stratified ocean and a terrain-following sigma coordinate for coastal areas. Surface forcing fields are derived from Climate Forecast System Reanalysis hourly products (CFSR; Saha et al., 2010). Further details of HYCOM are found in Bleck (2002).
The data assimilated by NCODA includes remotely sensed sea surface height (SSH), SST and sea ice concentration along with in-situ surface and subsurface observations of temperature and salinity from XBTs, CTDs, moored and drifting buoys, gliders and even marine mammals. NCODA also includes synthetic temperature and salinity profiles deter-mined by the Improved Synthetic Ocean Profile (ISOP; Helber et al., 2013), in which satellite SSH and SST observations are projected downward based on the statistical relationships derived from the global data sets. Further technical details of HYCOM/NCODA system are found in Cummings and Smedstad (2013), Metzger et al. (2014), and Helber et al. (2013). Because of the high horizontal resolution (0.08◦), the HYCOM reanalysis can adequately resolve complex bathymetry and topography in the Indonesian Seas and thus is suitable for this study. Signficant care was taken in the HYCOM topography file to properly define the sill depths in the key ITF passages.
The daily mean values of velocity and sea surface height for the period 2003–2015 are used in this study, during which many MJO events are observed. Also, the period covers one of the major in-situ observations of ITF: the International Nusantara STratification ANd Transport program (INSTANT) during 2004–2006. The HYCOM rean-alysis will be validated against in-situ and satellite observations over the MC region in this study, while it has been extensively validated in other areas (Yu et al., 2015; Thoppil et al., 2016; Shinoda et al. 2019, 2020). The transport at major straits in the MC region is calculated using the upper 800 m data since the ocean response to the MJO forcing is confined mostly in the upper 300 m (e.g., Shinoda et al., 2017).
2.1.2. In-situ and satellite data The in situ data used for the validation of the HYCOM reanalysis
M.C. Nieva Tamasiunas et al.
Deep-Sea Research Part II xxx (xxxx) xxx
3
includes those collected at Makassar Strait (e.g., Gordon et al., 2008) during the INSTANT program (Sprintall et al., 2004).
INSTANT was designed to directly measure the ITF in major straits in the Indonesian Seas.
The hourly velocity data from the two Makassar Strait ADCP moor-ings are used for the comparison with the HYCOM reanalysis. Also, the HYCOM reanalysis is compared with published results of INSTANT obervations.
SSH data from Archiving, Validation, and Interpretation of Satellite Oceanographic (AVISO) are used, which provide daily SSH values on 0.25◦ grids. NOAA Interpolated Outgoing Longwave Radiation (OLR) data (Liebmann and Smith 2006) are used, which are presented on a 2.5◦ × 2.5◦ global grid. Daily winds at 10 m height obtained from the National Centers for Environmental Prediction (NCEP) Climate Forecast System Reanalysis (CFSR) (Saha et al., 2010) for the period of 2003–2010 and the Climate Forecast System Version 2 (CFSv2) (Saha et al., 2014) for the period of 2011–2015 are also used. These wind products are used as surface forcing fields for the HYCOM reanalysis.
2.2. Composite analysis
To detect common processes acting in most MJO events, oceanic and atmospheric variables derived from the HYCOM reanalysis and obser-vations for the period 2003–2015 are used to form the composite of the MJO. The composite is based on the Real-time Multivariate MJO (RMM) Index (Wheeler and Hendon 2004) to detect the MJO events. The
method is widely used in many MJO composite studies (e.g., Pohl and Matthews 2007; Guan et al., 2014; Marshall and Hendon 2014).
The RMM index is based on a pair of empirical orthogonal functions (EOFs) for OLR and wind anomalies, and it describes a MJO event as an eight-phase cycle. The principal component time series that are a result of the projection of observed data onto the multiple-variable EOFs, vary mostly on the intraseasonal time scale of the MJO only. Following Guan et al. (2014), the period of MJO event was defined as the time during which the RMM MJO index magnitude is greater than 1 for at least thirty consecutive days. To assure eastward propagation, the time period when the MJO stays 20 consecutive days or more in a single phase is excluded from the MJO period used for the composite. Anomalies of all variables are calculated by subtracting the climatological seasonal cycle for the 2003–2015 period. Then the anomalies are intraseasonally filtered using Lanczos filter (Duchon 1979) with a 20–90 days cutoff period. The composite is constructed by averaging the filtered anomalies during the MJO period for each MJO phase.
3. Results
3.1. Comparison of HYCOM reanalysis with observations
To evaluate the representativeness of the HYCOM reanalysis over the MC region, velocities in the major straits or passages of the ITF in the HYCOM reanalysis are first compared with those from the INSTANT observations for the period 2004–2006. Mean transport values as well as
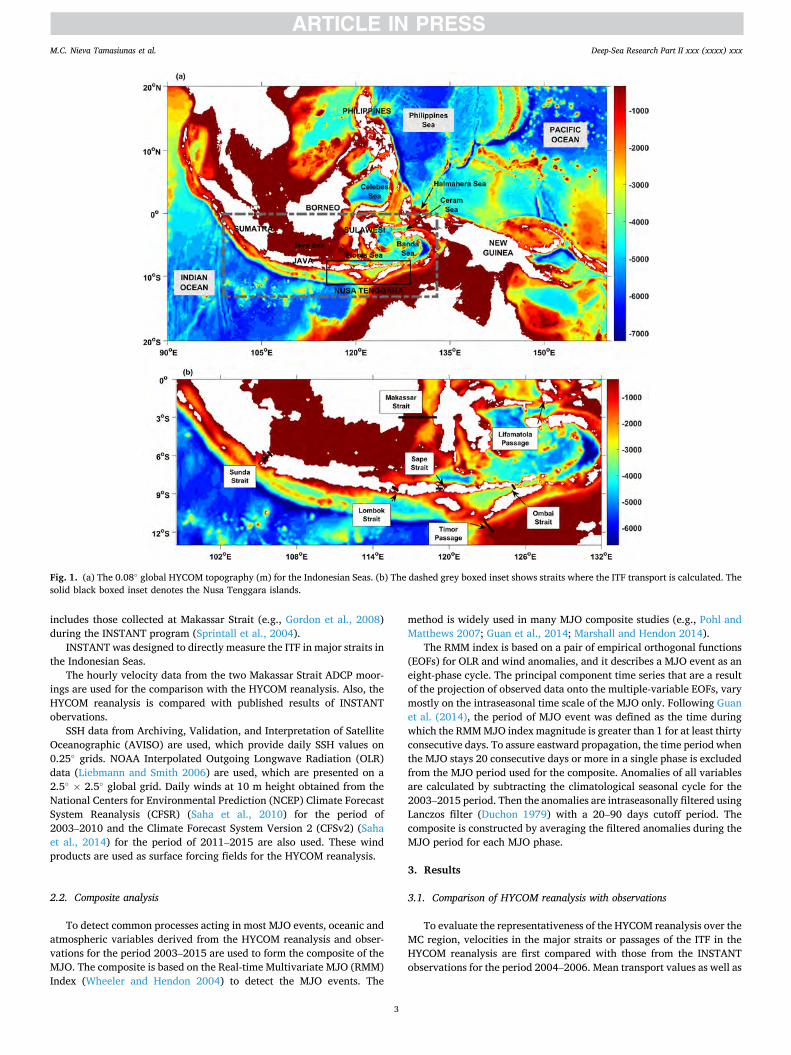
Fig. 1. (a) The 0.08◦ global HYCOM topography (m) for the Indonesian Seas. (b) The dashed grey boxed inset shows straits where the ITF transport is calculated. The solid black boxed inset denotes the Nusa Tenggara islands.
M.C. Nieva Tamasiunas et al.

Deep-Sea Research Part II xxx (xxxx) xxx
4
the vertical structures of mean currents are calculated for all major straits. The mean transport values for all major straits (Fig. 1) agree well with values estimated from observations reported in previous studies (Table 1).
The vertical structures of mean currents across the major straits also agree well with observations (Fig. 2). For example, the location of the maximum mean current from the HYCOM reanalysis is quite similar to that for the observations for Lombok Strait (Fig. 2a), although the cur-rent is a little weaker (~0.2 cm/s). Mean along-strait currents for Ombai Strait and Timor Passage (Fig. 2b and c) are also similar to the obser-vations. However, there some discripacies in the detailed current structure. For example, the secondary minimum of the mean current at around 150 m in Ombai strait in observations is not found in the rean-alysis. Also, HYCOM underestimates the velocity minima in all straits.
The time series of along-strait velocity at Makassar Strait was compared with INSTANT observations (Fig. 3). The reanalysis is able to capture the variability of Makassar Strait Throughflow reasonably well, including its semi-annual and intraseasonal variations. For example, the decrease of southward along-strait velocity observed during April–June 2005 is well reproduced by the HYCOM reanalysis. This intraseasonal
fluctuation of along-strait velocity is associated with the MJO event observed during this period (not shown).
The time series of transport at Makassar Strait estimated from the HYCOM reanalysis is compared to that from mooring observations (Fig. 4). Since the observational estimates should have some un-certainties, which may partly stem from the limited number of moorings across the straits, the transport is also estimated using the two nearest grid points to the mooring locations with the extrapolation method used in Gordon et al. (2008). Although differences between the two estimates from the HYCOM reanalysis in transport (blue and red curves) some-times exceed 1 Sv, both time series from the HYCOM reanalysis agree well with the observational estimates. In particular, semi-annual varia-tion is well captured by the HYCOM reanalysis. These results are consistent with different versions of HYCOM simulations (Metzger et al., 2010; Shinoda et al. 2012, 2016).
Comparisons with the in-situ data collected in the central equatorial Indian Ocean during DYNAMO are also made to further validate the intraseasonal variability in the HYCOM reanalysis (not shown). Intra-seasonal variations associated with the MJO in the HYCOM reanalysis agree well with those of the mooring observations. In particular, the reanalysis is able to reproduce the acceleration of the eastward jet on the equator produced by the westerly winds associated with the MJO and its decay a month later. These results are also consistent with other versions of HYCOM simulations (Shinoda et al. 2016, 2017).
A comparison between SSH derived from satellite altimeter (AVISO) and the HYCOM reanalysis is further performed for the period of the DYNAMO field campaign (Fig. 5). Due to the strong MJO event during DYNAMO, the strong eastward equatorial jet produced a significant increase in SSH along the coast of Sumatra (e.g., Shinoda et al., 2017). The HYCOM reanalysis is able to reproduce the SSH anomalies near the Sumatra coast, as well as the negative anomalies in the central Indian Ocean around 5◦S.
The comparisons with observational data described above demon-strate that velocity and SSH fields in the HYCOM reanalysis including intraseasonal variations are sufficiently accurate for the further analysis,
Table 1 Transport (Sv) in the upper 800 m obtained from the HYCOM reanalysis (left) and based on observations (right) in the major straits in the Indonesian Seas for the period 2004–2006. Negative values indicate a transport from Pacific to In-dian Oceans.
Transports (Sv)
HYCOM reanalysis
Observations
Makassar − 11.05 − 11.60 (Gordon et al., 2008), − 12.70 (Susanto et al., 2012)
Lombok − 2.79 − 2.60 (Sprintall et al., 2009) Ombai − 4.17 − 4.90 (Sprintall et al., 2009) Timor − 5.80 − 7.50 (Sprintall et al., 2009) Lifamatola +9 × 10− 3 − 1 (van Aken et at. 2009)
Fig. 2. Mean 2004–2006 along-strait velocity (cm/s) vs. depth for (a) Lombok Strait, (b) Ombai Strait and (c) Timor Passage from observations (left column) and the HYCOM reanalysis (right column). Note that negative values indicate flow into the Indian Ocean. The panels for observations are adapted from Metzger et al. (2010).
M.C. Nieva Tamasiunas et al.

Deep-Sea Research Part II xxx (xxxx) xxx
5
which will be described in the following sections.
3.2. MJO composites
3.2.1. ITF transport associated with the MJO Based on the RMM index, 20 MJO events were detected for the
2003–2015 period. All of them except for two events are defined as those in which the index magnitude exceeds 1 for at least 30 consecutive days. The two exceptions are the events observed during DYNAMO (Novem-ber–December 2011), which are widely discussed in previous studies (e. g., Gottschalck et al., 2013; Shinoda et al., 2013b, 2016, 2017).
Composite transports of ITF through all major straits within the Indonesian Seas (Makassar, Lombok, Ombai Straits and Timor Passage) and other narrow exit passages of ITF (Sunda and Sape Straits, Fig. 1) are calculated (Fig. 6a) based on the filtered along-strait velocity data. The sections used for the transport calculation are indicated in Fig. 1 as solid black lines, onto which the gridded data are interpolated for the calcu-lation. A significant reduction of the transport is found in all 4 major straits during and right after the MJO active phase over the MC region (phases 4, 5, and 6), and a phase lag between the straits is evident. In Lombok Strait, the transport starts being reduced at phase 4 and the maximum positive anomalous transport occurs at phase 6. In Ombai and Makassar straits, the reduction starts later (phase 5) and the anomaly
reaches its maximum at phase 7. In Timor Passage, the anomalous transport is maximum at phase 5. The timing of the reduction in Makassar Strait in relation to the MJO phase is consistent with previous observational and modeling studies (e.g. Pujiana et al., 2013; Shinoda et al., 2016; Napitu et al., 2019). For three of the major ITF straits (Lombok, Ombai and Makassar), the maximum anomalous transport is between 1.3 and 1.6 Sv, which is similar to estimates from observations for Makassar Strait (Pujiana et al., 2013; Napitu et al., 2019). The maximum anomalous transport is much smaller in Timor passage (~0.5 Sv), although the mean transport is larger than other exit passages.
In addition to the reduction of ITF transport, a significant enhance-ment of the transport is also evident during the suppressed phase of the MJO. The magnitude of the enhancement in the major straits is com-parable to that of the reduction. For Lombok, Ombai and Makassar Straits, the maximum negative anomalous transport occurs at phase 3 and the magnitude is smaller (~1 Sv) than the maximum positive anomaly. However, the relatively large negative anomalous transport occurs for a longer period than the large positive anomaly. This is because the period of suppressed phase is generally longer than the active phase (e.g., Shinoda et al., 1998). For example, in Ombai Strait, a large negative anomaly occurs at phases 2, 3, and 4 which is 281 days total during all MJO events with − 0.92 Sv average transport anomaly, while a large positive anomalous transport is found during phases 6 and
Fig. 3. Time series of along-strait velocity profile from INSTANT observations (top panel) and the HYCOM reanalysis (bottom panel). Units are cm/s and negative velocity indicates southward flow.
Fig. 4. Transport (Sv) through Makassar Strait estimated from observations (black line), from the HYCOM reanalysis (blue line) and estimates derived from only the velocity at the two grid points closest to the mooring locations in the HYCOM reanalysis by using the extrapolation method by Gordon et al. (2008) (red line). Mean transport values for each method are shown in straight dashed lines of the same colors.
M.C. Nieva Tamasiunas et al.

Deep-Sea Research Part II xxx (xxxx) xxx
6
7 which is 245 days with 1.37 Sv transport anomaly. The maximum negative anomaly at Timor Passage (phase 3) is smaller (~0.25 Sv) than the other major straits.
Table 2 shows the average transport anomaly in the major straits during all MJO events used in the composite which includes both active and suppressed phases. These values are calculated as the average transport anomaly for the periods of all MJO events. While the anom-alies are all positive values, they are much smaller than the magnitude of the intraseasonal fluctuation, and negligible compared to the mean transport. Although the reduction and enhancement of the transport through major straits are not completely symmetric as described above, the reduction is nearly cancelled out by the enhancement in all major straits over the life cycle of the MJO. Hence the net effect of the MJO on the mean or long-term ITF transport is nearly zero in all straits because of the cancellation (Table 2).
In addition to the prominent reduction during the MJO active phase and enhancement during the suppressed phase in all four major straits, a variation of transport through other small passages such as Sunda and Sape straits is also significant (~0.2–0.3 Sv, Fig. 6a). Given that the total
transport for Sunda Strait varies from 0.24 ± 0.1 Sv in the boreal winter to − 0.83 ± 0.2 Sv in the boreal summer (Susanto et al., 2016; Li et al., 2018), the enhancement or reduction of the transport produced by the MJO could be of the same order of the total transport. The mean transport anomaly during MJO events in these straits is also much smaller than the magnitude of intraseasonal variation and the mean total transport (Table 2).
The clear phase lag of transport variation between the different straits and passages discussed above is consistent with the propagation of downwelling Kelvin waves during the active phase discussed in pre-vious studies (e.g., Shinoda et al., 2016; Pujiana and McPhaden 2020). During the MJO active phase, the maximum reduction occurs first at Sunda Strait (phase 5), followed by Lombok and Sape (phase 6) and then at Makassar and Ombai Straits (phase 7). On the other hand, during the suppressed phase, the phase lag is not as clear as in the active phase. The maximum negative anomaly occurs at phase 3 in all major straits. This suggests that the local wind forcing may be important during the MJO suppressed phase, which will be further investigated in the later section.
As discussed above, the anomalous positive transport during the active phase in Lombok, Ombai, and Makassar Straits are similar, and the transport in Lombok leads the other two straits. This suggests that about 50% of the anomalous transport along the south coast of Java enters into Lombok Strait and another 50% continues to propagate along the south coast of Java and enters into Ombai Strait. The anomalous transport at Lombok Strait further propagates to Makassar Strait which generates a similar amount of anomalous transport. The result also suggests that the anomalous transport at Ombai Strait does not signifi-cantly contribute to the transport anomaly at Makassar Strait. Note that the transport anomalies generated by local winds modify the above scenario. However, further quantification or the isolation of local wind contribution is not possible based only on this analysis. The phase lag consistent with Kelvin wave propagation is not found at Timor Passage where the maximum positive transport anomaly during the active phase occurs earlier (phase 5) than that at Lombok Strait, suggesting that local forcing contributes to the intraseasonal ITF variation.
The intraseasonal fluctuation of ITF transport anomaly at all ITF exit
Fig. 5. Upper panel: SSH anomalies (m) relative to its 2003–2015 climatology averaged for 20–31 December from AVISO satellite altimeter data. Lower panel: Same as the upper panel but from the HYCOM reanalysis.
Fig. 6. (a) MJO composite of anomalous transport (Sv) relative to its 2003–2015 climatology through Sunda (dark blue), Lombok (orange), Sape (yellow), and Makassar (purple) Straits, Timor passage (green) and Ombai Strait (light blue). See Fig. 1 for the locations of straits and passages. Positive anomalies indicate the reduction of the transport from the Pacific to Indian Oceans. (b) MJO composite of anomalous (left ordinate) and total (right ordinate) transport through all exit passages of ITF. The mean value during all MJO events is added to the composite anomalies to calculate the total transport. Phases 2 and 3 (5 and 6) are considered as the MJO suppressed (active) phase over the MC based on anomalous winds associated with the MJO (see section 3.2.2).
Table 2 Average transport anomaly (Sv) during the MJO period in 2003–2015.
Strait/Passage Makassar Sunda Lombok Sape Ombai Timor
Av. anomalous transport (Sv)
0.161 0.005 0.098 0.023 0.118 0.031
M.C. Nieva Tamasiunas et al.

Deep-Sea Research Part II xxx (xxxx) xxx
7
Fig. 7. MJO composite of along-strait velocity anomaly (m/s) relative to its 2003–2015 climatology at Lombok strait. Positive values indicate northward currents.
M.C. Nieva Tamasiunas et al.
Deep-Sea Research Part II xxx (xxxx) xxx
8
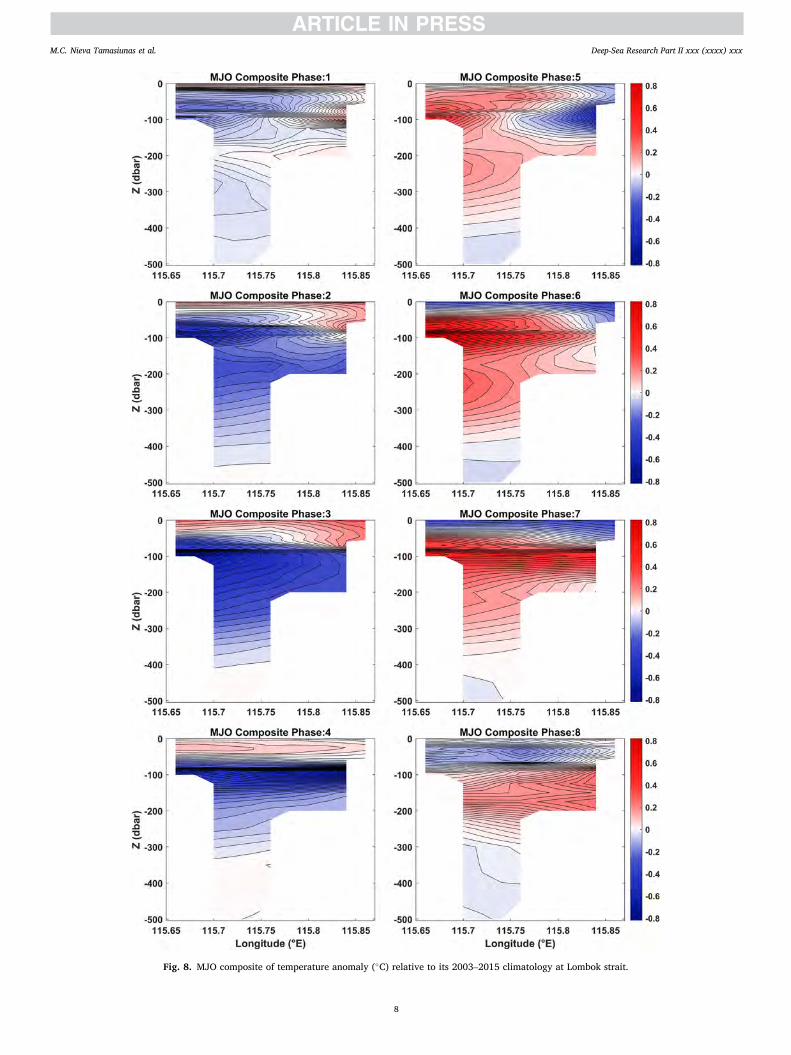
Fig. 8. MJO composite of temperature anomaly (◦C) relative to its 2003–2015 climatology at Lombok strait.
M.C. Nieva Tamasiunas et al.
Deep-Sea Research Part II xxx (xxxx) xxx
9
passages (Lombok, Ombai, Sunda and Sape Straits and Timor Passage) is compared with the total transport through these straits (Fig. 6b). The magnitude of the transport fluctuation due to intraseasonal variability (maximum minus minimum) is about 6 Sv (Fig. 6b), which is about 50% of the mean ITF transport. The contribution of intraseasonal transport anomalies for the total transport is smaller at Makassar Strait where the transport variation associated with the MJO represents about 20% of its total transport.
To further examine the vertical structure of current fluctuation, the
composite of along-strait velocity across each strait is calculated. Fig. 7 shows the vertical section of the along-strait velocity across Lombok Strait. The strong (>0.2 m/s) anomalous southward currents (phase 3) extend to only about 100 m depth while the northward anomalies (phase 6) extend all the way to about 150 m. Similar results are found for Ombai Strait and Timor Passage except the subsurface maximum velocity is found in Ombai Strait due to the vertical propagation of Kelvin wave (e. g., Drushka et al., 2010, not shown).
These results suggest that the vertical motion near the coast changes
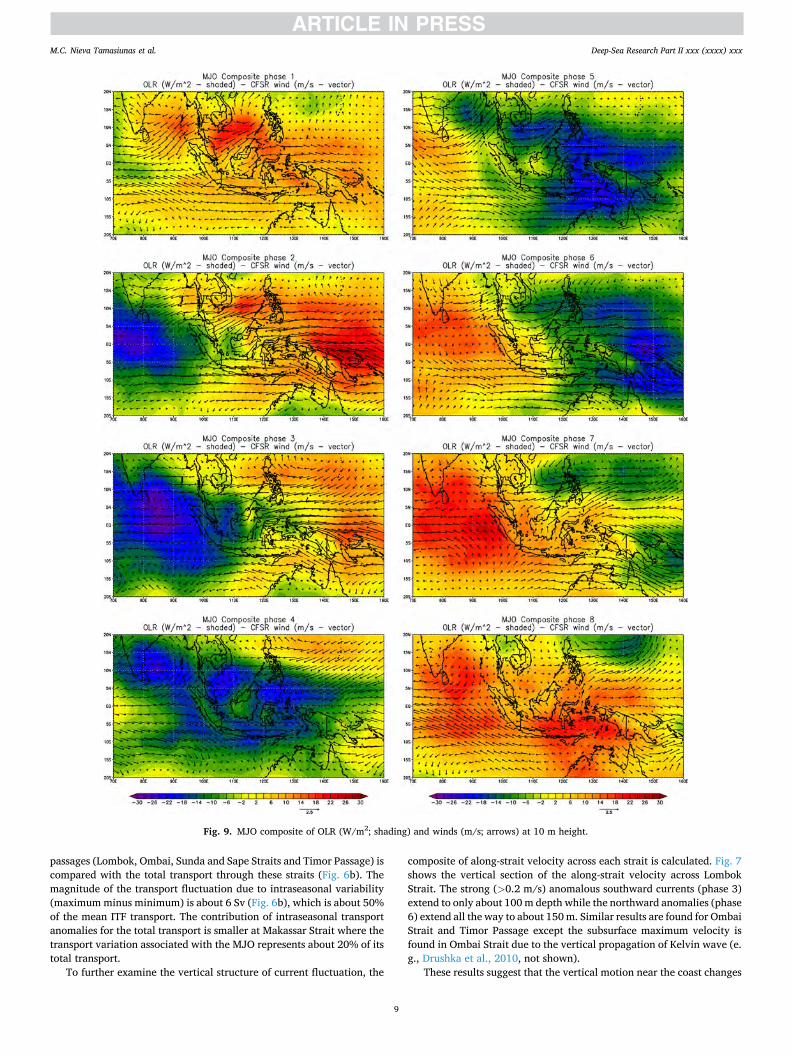
Fig. 9. MJO composite of OLR (W/m2; shading) and winds (m/s; arrows) at 10 m height.
M.C. Nieva Tamasiunas et al.

Deep-Sea Research Part II xxx (xxxx) xxx
10
Fig. 10. MJO composite of upper-ocean (average over 0–150 m depths) velocity (m/s) and SSH anomalies (m) from the HYCOM reanalysis for the MC region.
M.C. Nieva Tamasiunas et al.

Deep-Sea Research Part II xxx (xxxx) xxx
11
Fig. 11. MJO composite of wind anomaly at 10 m (m/s; arrows) and wind speed anomaly (m/s; shading) in the MC region.
M.C. Nieva Tamasiunas et al.
Deep-Sea Research Part II xxx (xxxx) xxx
12
the vertical extent of along-shore surface currents. To confirm the effect of vertical motion, the composite of the temperature along the same section in Lombok Strait is constructed (Fig. 8). The large cold anomalies around the thermocline depth (~100 m) during the suppressed phase suggest strong upwelling associated with negative SSH anomalies (described in the next section), which can decrease the along-shore
current vertical extent. Similarly, the warm anomalies around the thermocline depth indicate the downwelling during the active phase, which may cause the increase of the surface current vertical extent.
3.2.2. Large-scale ocean circulation around the Indonesian Seas To compare MJO-associated oceanic variability and ITF transport
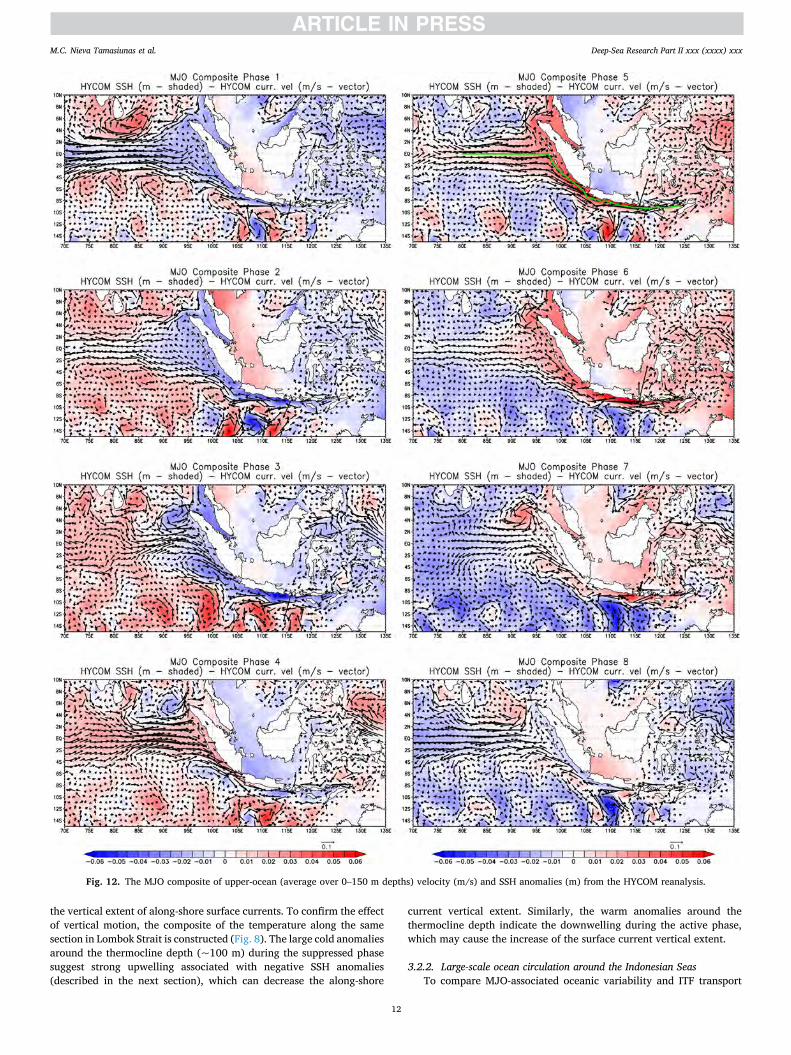
Fig. 12. The MJO composite of upper-ocean (average over 0–150 m depths) velocity (m/s) and SSH anomalies (m) from the HYCOM reanalysis.
M.C. Nieva Tamasiunas et al.

Deep-Sea Research Part II xxx (xxxx) xxx
13
with winds and atmospheric convection, MJO composites of OLR and surface winds, are constructed (Fig. 9). Consistent with previous MJO composite analyses (e.g., Pohl and Matthews 2007; Chattopadhyay et al., 2013), negative OLR anomalies (intense convection) appear in the central Indian Ocean during phase 1 and 2 and the convection is centered over the MC around phase 4 and 5. Strong easterly wind
anomalies are present over most of the MC for phases 2 and 3 and they propagate eastward, followed by westerly wind anomalies for phases 5 and 6. Since the intraseasonal variation of the ITF is mostly driven by wind forcing, phases 2 and 3 (5 and 6) are considered as the MJO sup-pressed (active) phase over the MC for the following discussion.
To describe the large-scale upper ocean variability associated with
Fig. 13. MJO composite of upper-ocean (average over 0–150 m depths) velocity anomalies (m/s) from the HYCOM reanalysis and AVISO’s SSH anomalies (m).
M.C. Nieva Tamasiunas et al.

Deep-Sea Research Part II xxx (xxxx) xxx
14
the MJO and to compare it with the transports through major straits, the composites of average ocean current velocity in the upper 150 m and SSH anomalies are computed (Fig. 10). During the MJO suppressed phase over the MC, negative SSH anomalies are present in most of the MC region, with maximum values along the Nusa Tenggara Islands (115.82◦E− 127.39◦E, 8◦S− 11.14◦S). Adjacent to the southern coast of those islands, westward velocity anomalies associated with the SSH anomalies are found. In Makassar Strait, southward velocity anomalies are found, which is the same as the mean ITF direction. These southward anomalies reach the southern part of Indonesian Seas and exit mainly through Lombok but also through Sape Strait. The southward anomalies present in Makassar Strait seem to be connected to the Pacific Ocean through the Celebes and Philippine Seas where westward current anomalies are found. Southward current anomalies in the western end of the Banda Sea (centered around 125◦E, 5◦S for MJO phase 2) exit the Indonesian Seas through Ombai Strait with a velocity of around 0.1 m/s, and part of them may also exit through Timor Passage. SSH and velocity
anomalies shown on Fig. 10 are consistent with the enhancement of the ITF transport described in the previous section, as the strong negative SSH anomalies south of the Nusa Tenggara Islands produce strong up-welling close to the exit passages.
During the active phase, positive SSH anomalies are found over the entire MC region, with the maximum values along the Nusa Tenggara islands. In phase 5 of the MJO, the strong positive SSH anomalies along with the eastward current anomalies adjacent to the southern coast of the Nusa Tenggara islands penetrate into Lombok Strait, producing very strong northward current anomalies. After penetrating into the Indo-nesian Seas, part of those northward current anomalies travel eastward into the Banda Sea, through the Flores Sea. During phases 6 and 7, the northward anomalies present in both Lombok and Sape Straits propa-gate northward to Makassar Strait and all the way to the Celebes and Philippine Seas.
The eastward current anomalies found in the south of the Nusa Tenggara archipelago during the active phase (phases 6 and 7)
Fig. 14. Chosen path (black solid line) for the calculation of the Hovmoller diagram on top of 1/12◦ global HYCOM topography (m). The path is also featured on Figs. 12 and 13 upper right panel as a solid green line.
Fig. 15. Hovmoller diagram of SSH anomalies at different MJO phases from (a) HYCOM reanalysis and (b) AVISO. Locations of A, B, C, and D can be found on Fig. 14 and the black (grey) solid line indicates the phase line of 2.9 m/s (1.8 m/s). A period of 65 days is used to calculate the phase speed.
M.C. Nieva Tamasiunas et al.

Deep-Sea Research Part II xxx (xxxx) xxx
15
propagate eastward along with the SSH positive anomalies, reaching Ombai Strait and entering the Flores and Banda Seas. The northward current anomalies found in the Banda Sea around 128◦E, 5◦S flow northward to the Ceram Sea where they are forced to the east by the topography, exiting to the north through the Halmahera and the Phil-ippine Seas where they connect to the Pacific Ocean. However, part of the anomalous northward currents at Ombai Strait could converge within the Indonesian Seas and some of them may return to the Indian Ocean. Futher quantification of the exact pathway of these current anomalies is difficult only from the composite analysis.
Fig. 11 shows composites of winds at 10 m height and wind speed for the MC area. During the MJO suppressed phase, anomalous easterly winds are evident over most of the MC region, with a maximum wind speed anomaly of about 2.5 m/s. Strong northeasterly wind anomalies are found over Makassar Strait, which are favorable for causing the enhancement of the ITF. During the MJO active phase, the wind anomalies reverse their direction, which is westerly over most of the region and southwesterly over Lombok and Makassar Straits. The di-rection of the wind anomalies is also consistent with the reduction of the ITF transport during the active phase.
3.2.3. Influence of oceanic Kelvin waves generated by MJO forcing on ITF As discussed in previous sections, the variation of transport through
major straits in the Indonesian Seas associated with the MJO is consis-tent with the Kelvin wave propagation at least during the active phase. To examine the contribution of remotely forced ocean response to the MJO for the ITF transport variation, composites of upper ocean currents and SSH for a larger domain are formed (Fig. 12). During the MJO active phase over the eastern equatorial Indian Ocean (phases 3, 4 and 5 of Fig. 12), when westerly winds are found near the equator, eastward currents along the equator cause the increase of SSH at the eastern boundary. Then the anomalous SSH and southeastward along-shore currents propagate along the coast of Sumatra and Java islands. Dur-ing and right after the suppressed phase over the eastern equatorial Indian Ocean (phases 8, 1 and 2 of Fig. 12), negative SSH anomalies with the time evolution similar to those during the active phase are also present. However, the magnitude of equatorial and alongshore currents near the equator are smaller than those during the active phase.
The same composite analysis is carried out using AVISO SSH data (Fig. 13) to validate the results obtained from the HYCOM reanalysis. The composite of SSH anomalies from AVISO is very similar to that from the HYCOM reanalysis, including the spatial distribution and
Fig. 16. SSH (shading; m) and upper-ocean (average over 0–150 m depths) velocity anomalies (vectors, m/s) for November 22, 26, December 2, 25, 2011 and January 1 and 5, 2012 relative to the climatology for the 2003–2015 period from the HYCOM reanalysis.
M.C. Nieva Tamasiunas et al.

Deep-Sea Research Part II xxx (xxxx) xxx
16
magnitude. For example, for the MJO phase 1, both composites reveal negative SSH anomalies around the coast of Sumatra and Java with the magnitude of about − 0.04 to − 0.03 m, and during phase 5 the location of the positive SSH anomalies around the coast is nearly identical.
The propagation of SSH and upper ocean current anomalies during the MJO active phase shown in Figs. 12 and 13 appears to be consistent with MJO-induced coastal Kelvin waves from the central equatorial Indian Ocean, which are discussed in previous studies (e.g., Pujiana et al., 2013; Marshall and Hendon 2015; Shinoda et al., 2016, 2017). To further examine the Kelvin wave propagation from the central Indian Ocean to Ombai Strait, a Hovmoller diagram of composite SSH along the equatorial Indian Ocean and the coast of Sumatra and Java (green lines shown in the top right panel of Figs. 12 and 13 and black line in Fig. 14) is constructed (Fig. 15).
The propagation of positive SSH anomalies along the path (the line shown in Fig. 14) between phases 4 and 6 is clearly evident in SSH from both the HYCOM reanalysis (Fig. 15a) and AVISO (Fig. 15b). As the waves propagate from the equatorial Indian Ocean to the Sumatra and Java coasts, the area of positive SSH anomalies in the diagram become wider, suggesting that the signal includes multiple vertical modes of Kelvin wave. The range of phase speed is about 1.8–2.9 m/s, which is consistent with a mixture of the first and the second baroclinic mode Kelvin wave speeds in this region (e.g., Drushka et al., 2010). Also, such wide range of phase speed is consistent with previous observational studies on intraseasonal Kelvin waves in this area (e.g., Drushka et al., 2010; Pujiana and McPhaden 2020). It is also noteworthy that the SSH positive anomalies are amplified between locations A and B. The surface wind variability along the coast of Sumatra and Java could contribute to the amplification (Fig. 9).
The propagation of negative SSH anomalies during phases 2 and 3 is not as clear as that in active phase in the composite, which is also consistent with the ITF transport composites at each strait described on Section 3.2.1 (Fig. 6). However, the propagation of the negative anomalies can be found for some of the MJO events, which will be discussed in Section 3.3.
3.3. Case study
To further evaluate the influence of the remote ocean response to the MJO on the upper ocean current variability, a case study for the period of the DYNAMO field campaign is carried out.
The MJO events during DYNAMO are discussed as a case study here because details of these events have been well documented in many previous studies (e.g., Yoneyama et al., 2013; Zhang et al., 2013; Shi-noda et al., 2013b; Gottschalck et al., 2013; Shinoda et al., 2016).
During DYNAMO, three strong MJO events were observed (Gott-schalck et al., 2013; Shinoda et al., 2013b). While the intraseasonal variability of upper ocean currents and ITF transport during DYNAMO at Makassar Strait have been discussed in a recent study (Shinoda et al., 2016), those in other straits (Fig. 1) have not been examined so far. Fig. 16 shows the SSH and upper-ocean (average over 0–150-m depths) velocity anomalies during the period of suppressed and active phase of the MJO events observed in DYNAMO. During the MJO suppressed phase, negative SSH anomalies and the associated anomalous westward currents are shown to propagate eastward from the Indian Ocean and along the coastline of the Nusa Tenggara Islands (Fig. 16). They are followed by positive SSH anomalies that also reach as far as Ombai Strait during the subsequent active phase. While these variations of SSH and upper ocean currents during the MJO active phase observed in DYNAMO are consistent with the results of the composite analysis, the propagation of upwelling Kelvin waves is also found during this event, which is not clearly evident in the composite.
Fig. 17 shows the Hovmoller diagram along the same path of Fig. 14 for HYCOM’s SSH anomaly for the same dates as in Fig. 16. It is clear that both negative and positive anomalies propagate along the path with a similar speed. As discussed in the previous section, such clear propa-gation of negative SSH anomalies is not found in the composite. This suggests that the propagation of upwelling Kelvin waves during the suppressed phase occurs for some of the events, but it is not always observed during the MJO events used for the composite analysis. The eastward phase speed for both negative and positive anomalies (~2.9 m/s) is consistent with that of the first baroclinic mode Kelvin wave. This is in consistency with previous observational studies which indicate that one of the Kelvin wave vertical modes is dominant in most MJO events (e.g., Drushka et al., 2010).
To examine how the transport is modified during the MJO event, the transport through Lombok and Ombai Straits is calculated for the period of upwelling and downwelling Kelvin wave propagation (Fig. 18). Consistent with the transport composite (Fig. 6), an enhancement of the southward transport (~2 Sv) at Lombok Strait is found in late November during the suppressed phase of the MJO over the MC region (shown in the figures as the light blue area). In early December during the active phase (light red areas), a reduction of the transport of about 1.5–2 Sv occurs. Since the total transport at Lombok Strait during this season is small, the anomalous transport associated with the MJO causes the northward total transport right after this active phase. After the reduc-tion of the northward transport and recovery of southward transport between the two active phases, the positive anomalous transport is further enhanced by about 1 Sv during the second active phase in late December to early January.
A similar intraseasonal variation of the transport during active and suppressed phases is found at Ombai Strait (Fig. 18b), in which the enhancement (reduction) of negative transport anomalies occur during suppressed (active) phase. The phase lag between the two intra-seasonally filtered time series (Ombai and Lombok) is about 4–5 days
Fig. 17. Hovmoller diagram for the DYNAMO study case. A, B, C, and D lo-cations can be found on Fig. 14. Black solid lines indicate the phase line of ~2.9 m/s.
M.C. Nieva Tamasiunas et al.

Deep-Sea Research Part II xxx (xxxx) xxx
17
(~2.4–3.0 m/s phase speed), which is evident in both active and supressed phases and is consistent with the first baroclinic mode Kelvin wave speed. It should be noted that the subsurface maximum velocity anomaly at Ombai Strait is also evident during this event due to the vertical propagation (not shown), and thus the velocity fields associated with Kelvin waves around this area should deviate from the pure first baroclinic mode wave solution.
In summary, the results during DYNAMO described above are consistent with the composite in that a significant enhancement (reduction) of anomalous transport through ITF exit passages occurs during suppressed (active) phase of the MJO. In addition, the results suggest that upwelling Kelvin waves could contribute to the transport reduction in some MJO events.
4. Conclusions
Previous studies suggest that the winds associated with the MJO could significantly influence the Indonesian Throughflow (ITF) trans-port through major straits over the Maritime Continent (MC) region. However, the overall impact of the MJO on the ITF transport has not been quantified in these studies. In particular, the ITF fluctuation during the MJO suppressed phase is not emphasized in previous studies. Here the high-resolution ocean reanalysis (HYCOM reanalysis) and the data
from satellite and in-situ observations are analyzed to quantify the ITF transport in multiple straits including all exit passages during both active and suppressed periods of the MJO.
First, to validate the HYCOM reanalysis over the MC region, mean and intraseasonal variability in the ocean reanalysis are compared with the in situ and satellite observations. The mean transports through all major straits in the Indonesian Seas from observations are very similar to those calculated from the reanalysis. Also, the vertical structures of mean currents in these straits agree well with observations. The varia-tion of the along-strait velocity in Makassar Strait is well captured by the HYCOM reanalysis including the intraseasonal variations based on the comparison with the INSTANT mooring data. Furthermore, the rean-alysis is able to reproduce large scale SSH variability associated with the MJO based on the comparison with the AVISO satellite altimeter data during the MJO event observed in the DYNAMO field campaign.
To quantify the typical values of ITF transport variation associated with the MJO, the MJO composite of the transport through all major straits within the Indonesian Seas are constructed. A significant reduc-tion of the transport during and right after the active phase of the MJO over the MC is evident in all major straits. In addition, a large enhancement of the transport during the MJO suppressed phase is clearly found in all straits, and the magnitude of the enhancement is comparable to that of the reduction. Hence the transport reduction
Fig. 18. (a) Time series of total transport (blue), transport anomaly (red), and the band-pass filtered (20–90 days) anomaly (black) through Lombok Strait during DYNAMO. Negative values indicate the transport from the Pacific to Indian Oceans. The light blue area indicates the MJO suppressed phase (phases 2 and 3) over the MC region and the light red area indicates the MJO active phase (phases 5 and 6). (b) Same as (a) except for Ombai Strait.
M.C. Nieva Tamasiunas et al.
Deep-Sea Research Part II xxx (xxxx) xxx
18
during the active phase is nearly canceled out by the enhancement during the suppressed phase and thus the net effect of the MJO on the mean or long-term ITF transport over its life cycle is close to zero. The magnitude of the ITF transport variation induced by the MJO is about 50% of its mean transport in the ITF exit passages, while the intra-seasonal transport fluctuation in Makassar Strait is about 20% of its total transport. During the active phase, a clear phase lag in the reduction of the transports between Lombok, Makassar and Ombai straits is evident. The phase lag is consistent with the propagation of downwelling Kelvin waves. On the other hand, such phase lag is not clear in the transport enhancement during the suppressed phase. The lack of clear phase lag during the suppressed phase suggests the importance of the local wind forcing for generating anomalous transport during this period.
The vertical structure of the anomalous along-strait velocity associ-ated with the MJO in the exit passages is examined based on the com-posite at each strait. The strong positive (the direction from Indian Ocean to Pacific) velocity anomalies during the active phase extend to the deeper area than the negative anomalies during the suppressed phase. Also, the composite of temperature anomalies indicate the strong upwelling (downwelling) during the MJO active (suppressed) phase, suggesting that upwelling (downwelling) significantly affects the verti-cal structure of along-shore velocity anomaly.
Spatial distribution of composite oceanic variables in the HYCOM reanalysis is compared with the surface wind composite over the MC region. The spatial pattern of anomalous winds over the MC region is favorable for generating the enhancement of the ITF transport during the MJO suppressed phase and the reduction during the active phase, suggesting that local wind forcing associated with the MJO contributes to anomalous transport during both phases. However, during the active phase over the MC, a large contribution of remotely forced downwelling Kelvin waves for the transport fluctuation is clearly evident. The com-posite of SSH and upper ocean currents reveals that positive SSH anomalies and eastward currents propagate eastward along the coast of Java and Sumatra, and largely influence the ITF transport in ITF exit passages and Makassar Strait. The propagation speed of the positive SSH anomalies along the coast is consistent with a mixture of the first and second baroclinic mode coastal Kelvin waves although these two modes are not clearly separated.
A case study is performed for the period of DYNAMO field campaign in fall/winter 2011 to further examine the influence of remote ocean response to the MJO on the ITF transport. SSH and upper ocean current anomalies during this period show the propagation of negative anom-alies along the coast of Sumatra and Java during the suppressed phase of the MJO event followed by the propagation of positive anomalies during the active phase. A Hovmoller diagram confirms the propagation of the positive SSH anomalies whose phase speed is consistent with a first baroclinic mode Kelvin wave. Unlike the result of the composite anal-ysis, the propagation of the negative SSH anomalies during the sup-pressed phase is also clearly evident during this particular event. This suggests that the propagation of upwelling Kelvin waves during the suppressed phase occurs for some of the events only, but it is not always observed. A significant enhancement and reduction of the transport in the ITF exit passages are evident during the DYNAMO MJO events which is also consistent with the composites.
The results in this study suggest that both remote and local focing significantly contribute to the intraseasonal ITF variations. However, the relative contributions are different in active and suppressed phases of the MJO. The lack of clear phase lag between ITF exit passages sug-gests that the contributions of local focing may be much larger during many MJO events. However, further quantitative discussion is not possible since the contribution of remote forcing cannot be completely isolated in the present analysis. Numerial modeling that can isolate the effect of winds in remote areas is necessary to further quantify the relative contribution.
Credit author statement
Mariana C. Nieva Tamasiunas: Software, Validation, Formal analysis, Writing - Original Draft. Toshiaki Shinoda: Conceptualiza-tion, Methodology, Writing - Review & Editing, Supervision, Funding acquisition. R. Dwi Susanto: Resources, Writing - Review & Editing. Luis Zamudio: Data Curation, Writing - Review & Editing. Joseph Metzger: Data Curation, Writing - Review & Editing.
Declaration of competing interest
The authors declare that they have no known competing financial interests or personal relationships that could have appeared to influence the work reported in this paper.
Acknowledgements
Grants of computer time for the HYCOM reanalysis were provided by the Department of Defense (DoD) High Performance Computing Modernization Program, and the reanalysis was performed at the Navy DoD Supercomputing Resources Center, Stennis Space Center, MS. Computing resources were also provided by the HPC systems at the Texas A&M University, College Station and Corpus Christi, and the Climate Simulation Laboratory at NCAR’s Computational and Informa-tion Systems Laboratory, sponsored by the National Science Foundation. This research is supported by NOAA grant NA17OAR4310256 and NSF grant OCE-1658218. TS is also supported by DoD grant W911NF-20-1- 0309 and NASA grant NNX17AH25G. RDS is supported by NASA grants 80NSSC18K0777 and NNX17AE79A. This is NRL publication number NRL-JA-7320-21-5068 that has been approved for public release and distribution is unlimited.
References
Bleck, R., 2002. An oceanic general circulation model framed in hybrid isopycnic- Cartesian coordinates. Ocean Model. 4, 55–88. https://doi.org/10.1016/S1463- 5003(01)00012-9.
Chattopadhyay, R., Vintzileos, A., Zhang, C., 2013. A description of the Madden-Julian oscillation based on a self-OrganizingMmap. J. Clim. 26, 1716–1732. https://doi. org/10.1175/JCLI-D-12-00123.1.
Cummings, J.A., 2006. Operational multivariate ocean data assimilation. Q. J. R. Meteorol. Soc. 131, 3583–3604. https://doi.org/10.1256/qj.05.105.
Cummings, J.A., Smedstad, O.M., 2013. Variational data assimilation for the global ocean. In: Data Assimilation for Atmospheric, Oceanic and Hydrologic Applications, vol. II. Springer Berlin Heidelberg, pp. 303–343. https://doi.org/10.1007/978-3- 642-35088-7.
Drushka, K., Sprintall, J., Gille, S.T., Brodjonegoro, I., 2010. Vertical structure of Kelvin waves in the Indonesian throughflow exit passages. J. Phys. Oceanogr. 40, 1965–1987. https://doi.org/10.1175/2010JPO4380.1.
Duchon, C., 1979. Lanczos filtering on one and two dimensions. J. Appl. Meteorol. 18, 1016–1022.
Feng, M., Zhang, N., Liu, Q., Wijffels, S., 2018. The Indonesian throughflow, its variability and centennial change. Geosci. Lett. 5 https://doi.org/10.1186/s40562- 018-0102-2.
Gordon, A.L., Sprintall, J., Van Aken, H.M., Susanto, R.D., Wijffels, S., Molcard, R., Ffield, A., Pranowo, W., Wirasantosa, S., 2010. The Indonesian throughflow during 2004-2006 as observed by the INSTANT program. Dynam. Atmos. Oceans 50, 115–128. https://doi.org/10.1016/j.dynatmoce.2009.12.002.
Gordon, A.L., Susanto, R.D., Ffield, A., Huber, B.A., Pranowo, W., Wirasantosa, S., 2008. Makassar strait throughflow, 2004 to 2006. Geophys. Res. Lett. 35, 3–7. https://doi. org/10.1029/2008GL036372.
Gordon, A.L., 2005. Oceanography of the Indonesian seas and their throughflow. Oceanography 18, 15–27. https://doi.org/10.5670/oceanog.2005.01.
Gottschalck, J., Roundy, P.E., Schreck, C.J., Vintzileos, A., Zhang, C., 2013. Large-scale atmospheric and oceanic conditions during the 2011-12 DYNAMO field campaign. Mon. Weather Rev. 141, 4173–4196. https://doi.org/10.1175/MWR-D-13-00022.1.
Guan, B., Lee, T., Halkides, D.J., Waliser, D.E., 2014. Aquarius surface salinity and the Madden-Julian Oscillation: the role of salinity in surface layer density and potential energy. Geophys. Res. Lett. 41, 2858–2869. https://doi.org/10.1002/ 2014GL059704.
Helber, R.W., Townsend, T.L., Barron, C.N., Dastugue, J.M., Carnes, M.R., 2013. Validation test report for the improved Synthetic Ocean profile (ISOP) system , Part I : synthetic profile methods and. In: NRL Memo. Rep. NRL/MR/732, pp. 1–66.
Lee, T., Fournier, S., Gordon, A.L., Sprintall, J., 2019. Maritime Continent water cycle regulates low-latitude chokepoint of global ocean circulation. Nat. Commun. 10, 1–13. https://doi.org/10.1038/s41467-019-10109-z.
M.C. Nieva Tamasiunas et al.

Deep-Sea Research Part II xxx (xxxx) xxx
19
Lee, T., Fukumori, I., Menemenlis, D., Xing, Z., Fu, L.L., 2002. Effects of the Indonesian throughflow on the Pacific and Indian oceans. J. Phys. Oceanogr. 32, 1404–1429. https://doi.org/10.1175/1520-0485(2002)032<1404:EOTITO>2.0.CO;2.
Li, S., Wei, Z., Susanto, R.D., Zhu, Y., Setiawan, A., Xu, T., Fan, B., Agustiadi, T., Trenggono, M., Fang, G., 2018. Observations of intraseasonal variability in the Sunda Strait throughflow. J. Oceanogr. 74, 541–547. https://doi.org/10.1007/ s10872-018-0476-y.
Liebmann, B., Smith, C.A., 2006. Description of a complete (interpolated) outgoing Longwave radiation dataset. Bull. Am. Meteorol. Soc. 77, 1275–1277.
Madden, R.A., Julian, P.R., 1972. Description of global-scale circulation cells in the tropics with a 40–50 Day period. J. Atmos. Sci. 29, 1109–1123. https://doi.org/ 10.1175/1520-0469(1972)029<1109:dogscc>2.0.co;2.
Marshall, A.G., Hendon, H.H., 2014. Impacts of the MJO in the Indian ocean and on the Western Australian coast. Clim. Dynam. 42, 579–595. https://doi.org/10.1007/ s00382-012-1643-2.
Marshall, A.G., Hendon, H.H., 2015. Subseasonal prediction of Australian summer monsoon anomalies. Geophys. Res. Lett. 42, 10913–10919. https://doi.org/ 10.1002/2015GL067086.
Masumoto, Y., 2002. Effects of interannual variability in the eastern Indian Ocean on the Indonesian throughflow. J. Oceanogr. 58, 175–182. https://doi.org/10.1023/A: 1015889004089.
McCreary, J.P., Miyama, T., Furue, R., Jensen, T., Kang, H.W., Bang, B., Qu, T., 2007. Interactions between the Indonesian throughflow and circulations in the Indian and Pacific oceans. Prog. Oceanogr. 75, 70–114. https://doi.org/10.1016/j. pocean.2007.05.004.
Metzger, E.J., Hurlburt, H.E., Xu, X., Shriver, J.F., Gordon, A.L., Sprintall, J., Susanto, R. D., van Aken, H.M., 2010. Simulated and observed circulation in the Indonesian Seas: 1/12◦ global HYCOM and the INSTANT observations. Dynam. Atmos. Oceans 50, 275–300. https://doi.org/10.1016/j.dynatmoce.2010.04.002.
Metzger, J.E., Smedstad, O.M., Thoppil, P.G., Hurlburt, H.E., Cummings, J.A., Wallcraft, A.J., Zamudio, L., Franklin, D.S., Posey, P.G., Phelps, M.W., Hogan, P.J., Bub, F.L., DeHaan, C.J., 2014. US Navy operational global ocean and Arctic ice prediction systems. Oceanography 27, 32–43. https://doi.org/10.5670/ oceanog.2014.66.
Meyers, G., 1996. Variation of Indonesian throughflow and the El Nino - southern oscillation. J. Geophys. Res. C Oceans 101, 12255–12263. https://doi.org/10.1029/ 95JC03729.
Napitu, A.M., Pujiana, K., Gordon, A.L., 2019. The Madden-Julian oscillation’s impact on the Makassar strait surface layer transport. J. Geophys. Res. Ocean 124, 3538–3550. https://doi.org/10.1029/2018JC014729.
Neale, R., Slingo, J., 2003. The maritime continent and its role in the global climate: a GCM study. J. Clim. 16, 834–848. https://doi.org/10.1175/1520-0442(2003) 016<0834:TMCAIR>2.0.CO;2.
Pohl, B., Matthews, A.J., 2007. Observed changes in the lifetime and amplitude of the Madden-Julian oscillation associated with interannual ENSO sea surface temperature anomalies. J. Clim. 20, 2659–2674. https://doi.org/10.1175/ JCLI4230.1.
Pujiana, K., Gordon, A.L., Sprintall, J., 2013. Intraseasonal Kelvin wave in Makassar strait. J. Geophys. Res. Ocean 118, 2023–2034. https://doi.org/10.1002/jgrc.20069.
Pujiana, K., McPhaden, M.J., 2020. Intraseasonal Kelvin Waves in the equatorial Indian ocean and their propagation into the Indonesian seas. J. Geophys. Res. Ocean 125, 1–18. https://doi.org/10.1029/2019JC015839.
Qiu, B., Mao, M., Kashino, Y., 1999. Intraseasonal variability in the indo-Pacific throughflow and the regions surrounding the Indonesian seas. J. Phys. Oceanogr. 29, 1599–1618. https://doi.org/10.1175/1520-0485(1999)029<1599:IVITIP>2.0.CO; 2.
Saha, S., Moorthi, S., Pan, H.L., Wu, X., Wang, Jiande, Nadiga, S., Tripp, P., Kistler, R., Woollen, J., Behringer, D., Liu, H., Stokes, D., Grumbine, R., Gayno, G., Wang, Jun, Hou, Y.T., Chuang, H.Y., Juang, H.M.H., Sela, J., Iredell, M., Treadon, R., Kleist, D., Van Delst, P., Keyser, D., Derber, J., Ek, M., Meng, J., Wei, H., Yang, R., Lord, S., Van Den Dool, H., Kumar, A., Wang, W., Long, C., Chelliah, M., Xue, Y., Huang, B., Schemm, J.K., Ebisuzaki, W., Lin, R., Xie, P., Chen, M., Zhou, S., Higgins, W., Zou, C. Z., Liu, Q., Chen, Y., Han, Y., Cucurull, L., Reynolds, R.W., Rutledge, G., Goldberg, M., 2010. The NCEP climate Forecast system reanalysis. Bull. Am. Meteorol. Soc. 91, 1015–1057. https://doi.org/10.1175/2010BAMS3001.1.
Saha, S., Moorthi, S., Wu, X., Wang, J., Nadiga, S., Tripp, P., Behringer, D., Hou, Y.T., Chuang, H.Y., Iredell, M., Ek, M., Meng, J., Yang, R., Mendez, M.P., Van Den Dool, H., Zhang, Q., Wang, W., Chen, M., Becker, E., 2014. The NCEP climate Forecast system version 2. J. Clim. 27, 2185–2208. https://doi.org/10.1175/JCLI-D- 12-00823.1.
Schiller, A., Wijffels, S.E., Sprintall, J., Molcard, R., Oke, P.R., 2010. Pathways of intraseasonal variability in the Indonesian Throughflow region. Dynam. Atmos. Oceans 50, 174–200. https://doi.org/10.1016/j.dynatmoce.2010.02.003.
Shinoda, T., Han, W., Jensen, T.G., Zamudio, L., Joseph Metzger, E., Lien, R.C., 2016. Impact of the Madden-Julian oscillation on the Indonesian throughflow in the
Makassar strait during the CINDY/DYNAMO field campaign. J. Clim. 29, 6085–6108. https://doi.org/10.1175/JCLI-D-15-0711.1.
Shinoda, T., Han, W., Joseph Metzger, E., Hurlburt, H.E., 2012. Seasonal variation of the Indonesian throughflow in Makassar strait. J. Phys. Oceanogr. 42, 1099–1123. https://doi.org/10.1175/JPO-D-11-0120.1.
Shinoda, T., Han, W., Zamudio, L., Feng, X., 2020. Influence of atmospheric rivers on the Leeuwin Current system. Clim. Dynam. 54, 4263–4277. https://doi.org/10.1007/ s00382-020-05228-z.
Shinoda, T., Han, W., Zamudio, L., Lien, R.C., Katsumata, M., 2017. Remote Ocean response to the Madden-Julian oscillation during the DYNAMO field campaign: impact on Somali current system and the Seychelles-Chagos thermocline ridge. Atmosphere 8. https://doi.org/10.3390/atmos8090171.
Shinoda, T., Hendon, H.H., Glick, J., 1998. Intraseasonal variability of surface fluxes and sea surface temperature in the tropical Western Pacific and Indian oceans. J. Clim. 11, 1685–1702. https://doi.org/10.1175/1520-0442(1998)011<1685:IVOSFA>2.0. CO;2.
Shinoda, T., Jensen, T.G., Flatau, M., Chen, S., Han, W., Wang, C., 2013. Large-scale oceanic variability associated with the Madden-Julian oscillation during the CINDY/ DYNAMO field campaign from satellite observations. Rem. Sens. 5, 2072–2092. https://doi.org/10.3390/rs5052072.
Shinoda, T., Zamudio, L., Guo, Y., Metzger, E.J., Fairall, C.W., 2019. Ocean variability and air-sea fluxes produced by atmospheric rivers. Sci. Rep. 9, 1–12. https://doi.org/ 10.1038/s41598-019-38562-2.
Sprintall, J., Gordon, A.L., Koch-Larrouy, A., Lee, T., Potemra, J.T., Pujiana, K., Wijffels, S.E., 2014. The Indonesian seas and their role in the coupled ocean-climate system. Nat. Geosci. 7, 487–492. https://doi.org/10.1038/ngeo2188.
Sprintall, J., Wijffels, S.E., Molcard, R., Jaya, I., 2009. Direct estimates of the Indonesian throughflow entering the Indian ocean: 2004-2006. J. Geophys. Res. Ocean 114. https://doi.org/10.1029/2008JC005257.
Sprintall, J., Wuffels, S., Gordon, A.L., Field, A.F., Molcard, R., Susaoto, R.D., Soesilo, I., Sopaheluwakan, J., Surachman, Y., Van Aken, H.M., 2004. Instant: A New International Array to Measure the Indonesian Throughflow, vol. 85. Eos, Washington. DC. https://doi.org/10.1029/2004EO390002.
Susanto, R.D., Ffield, A., Gordon, A.L., Adi, T.R., 2012. Variability of Indonesian throughflow within Makassar strait, 2004-2009. J. Geophys. Res. Ocean 117. https://doi.org/10.1029/2012JC008096, 2004–2009.
Susanto, R.D., Wei, Z., Adi, T.R., Zheng, Q., Fang, G., Fan, B., Supangat, A., Agustiadi, T., Li, S., Trenggono, M., Setiawan, A., 2016. Oceanography surrounding Krakatau volcano in the Sunda Strait, Indonesia. Oceanography 29, 264–272. https://doi.org/ 10.5670/oceanog.2016.31.
Thoppil, P.G., Metzger, E.J., Hurlburt, H.E., Smedstad, O.M., Ichikawa, H., 2016. The current system east of the Ryukyu Islands as revealed by a global ocean reanalysis. Prog. Oceanogr. 141, 239–258. https://doi.org/10.1016/j.pocean.2015.12.013.
van Aken, H.M., Brodjonegoro, I.S., Jaya, I., 2009. The deep-water motion through the Lifamatola Passage and its contribution to the Indonesian throughflow. Deep. Res. I Oceanogr. Res. Pap. 56, 1203–1216. https://doi.org/10.1016/j.dsr.2009.02.001.
Vialard, J., Drushka, K., Bellenger, H., Lengaigne, M., Pous, S., Duvel, J.P., 2013. Understanding Madden-Julian-induced sea surface temperature variations in the North Western Australian basin. Clim. Dynam. 41, 3203–3218. https://doi.org/ 10.1007/s00382-012-1541-7.
Wainwright, L., Meyers, G., Wijffels, S., Pigot, L., 2008. Change in the Indonesian Throughflow with the climatic shift of 1976/77. Geophys. Res. Lett. 35, 1–5. https:// doi.org/10.1029/2007GL031911.
Wheeler, M.C., Hendon, H.H., 2004. An all-season real-time multivariate MJO index: development of an index for Monitoring and prediction. Mon. Weather Rev. 132 https://doi.org/10.1175/1520-0493(2004)132<1917:AARMMI>2.0.CO;2, 1917–1932.
Wijffels, S., Meyers, G., 2004. An intersection of oceanic waveguides: variability in the Indonesian throughflow region. J. Phys. Oceanogr. 34, 1232–1253. https://doi.org/ 10.1175/1520-0485(2004)034<1232:AIOOWV>2.0.CO;2.
Yoneyama, K., Zhang, C., Long, C.N., 2013. Tracking pulses of the Madden-Julian oscillation. Bull. Am. Meteorol. Soc. 94, 1871–1891. https://doi.org/10.1175/ BAMS-D-12-00157.1.
Yu, Z., Metzger, E.J., Thoppil, P., Hurlburt, H.E., Zamudio, L., Smedstad, O.M., Na, H., Nakamura, H., Park, J.H., 2015. Seasonal cycle of volume transport through Kerama Gap revealed by a 20-year global HYbrid Coordinate Ocean Model reanalysis. Ocean Model. 96, 203–213. https://doi.org/10.1016/j.ocemod.2015.10.012.
Zhang, C., 2005. Madden Julian oscillation. Rev. Geophys. 43 https://doi.org/10.1029/ 2004RG000158.
Zhang, C., Gottschalck, J., Maloney, E.D., Moncrieff, M.W., Vitart, F., Waliser, D.E., Wang, B., Wheeler, M.C., 2013. Cracking the MJO nut. Geophys. Res. Lett. 40, 1223–1230. https://doi.org/10.1002/grl.50244.
Zhou, L., Murtugudde, R., 2010. Influences of Madden-Julian oscillations on the eastern Indian ocean and the maritime continent. Dynam. Atmos. Oceans 50, 257–274. https://doi.org/10.1016/j.dynatmoce.2009.12.003.
M.C. Nieva Tamasiunas et al.