deepening
TRANSCRIPT

Measures of Position Quantiles - values which divide a set of data into equal parts 1. First quartile (designated Q1) also called the lower
quartile or the 25th percentile (splits off the lowest 25% of data from the highest 75%)2. Second quartile (designated Q2) also called
the median or the 50th percentile (cuts data set in half)3. Third quartile (designated Q3) also called the upper
quartile or the 75th percentile (splits off the highest 25% of data from the lowest 75%)

Illustrations
A. Quartile
B. Decile
C. Percentile
Q1 Q2 Q3
D1 D2 D3 D4 D5 D6 D7 D8 D9
P10 P20 P30 P40 P50 P60 P70 P80 P90

Formula for Quantiles of Ungrouped Data
Position of Qk =
Position of Dk =
Position of Pk =
where: n = sample size k = position

ExamplesCalculate the quartiles for the set of measurements
7 18 12 17 29 18 4 27 30 2 4 10 21 5 8
First we need to order the data
2 4 4 5 7 8 10 12 17 18 18 21 27 29 30

The lower quartile or Q1
k = 1 n = 15Qk = Q1 =
= =
Q1 = 4The lower quartile is the 4th value.2 4 4 5 7 8 10 12 17 18 18 21 27 29 30Hence the lower quartile is 5.

The median (middle quartile) or Q2.k = 2 n = 15Qk = Q1=
= = Q1= 8
The median is the 8th value.2 4 4 5 7 8 10 12 17 18 18 21 27 29 30Hence the median is 12.

The upper quartile or Q3
k = 3 n = 15 Qk =
Q1= = = Q1= 12The upper quartile is the 12th value.
2 4 4 5 7 8 10 12 17 18 18 21 27 29 30Hence the upper quartile is 21.

Examples
Calculate D3 and P40 for the set of measurements
2 4 4 5 7 8 10 12 17 18 18 21 27 29 30

Computing for D3
k = 3 n = 15 Dk =
D3= = = D3= 4.8
Using Mendenhall, round off 4.8 to the nearest integer. Then D3 is the 5th value 2 4 4 5 7 8 10 12 17 18 18 21 27 29 30
Hence 7 is the 3rd decile.

2 4 4 5 7 8 10 12 17 18 18 21 27 29 30 D3 = D3= 4.8
1. Subtract the 4th data from the 5th data.7 – 5 = 2
2. Multiply the result by the decimal part obtained in the third step.
2(0.8) = 1.6 3. Add the result in step 2 to the smaller number in the
4th and 5th data. 1. 6 + 5 = 6.5 Hence D3 is 6.5
Using interpolation

For P40
2 4 4 5 7 8 10 12 17 18 18 21 27 29 30 k= 40 n= 15
Pk =
P40=
=
P40= 6.4

SolutionsUsing Mendenhall
P40= 6.4 6
P40 is the 6th element
2 4 4 5 7 8 10 12 17 18 18 21 27 29 30 Therefore, P40 = 8
* 40% of the distribution got a score less than or equal to 8.
Using interpolation P40= 6.4
2 4 4 5 7 8 10 12 17 18 18 21 27 29 30
1. 10 – 8 = 2 2. 2(0.4) = 0.8 3. 8 + 0.8 = 8.8
* Hence, P40 = 8.8

Example The following are the scores of 9 students in their 40 – item quiz.
34, 23, 15, 27, 36, 21, 20, 33, 25
Calculate Q1 and Q3 for the set of data.
Example

Solving for Q1
Using Mendenhallk = 1 n = 9
Qk = Q1= = Q1= 2.5 15, 20, 21, 23, 25, 27, 33, 34, 36
Hence lower quartile is 21.* 25% of the students got a score less than or equal to 21.
Using InterpolationQ1= 2.5
15, 20, 21, 23, 25, 27, 33, 34, 361. 21 – 20 = 12. 1(.5) = .53. 20 + .5 = 20.5
Hence lower quartile is 20.5.
* 25% of the students got a score less than or equal to 20.5.

Activity
Consider the observations 11, 14, 17, 23, 27, 32, 40, 49, 54, 59, 71 and 80
Find the value of• Group 1: D2
• Group 2: D5
• Group 3: D8
• Group 4: P60
• Group 5: P75
• Group 6: P30
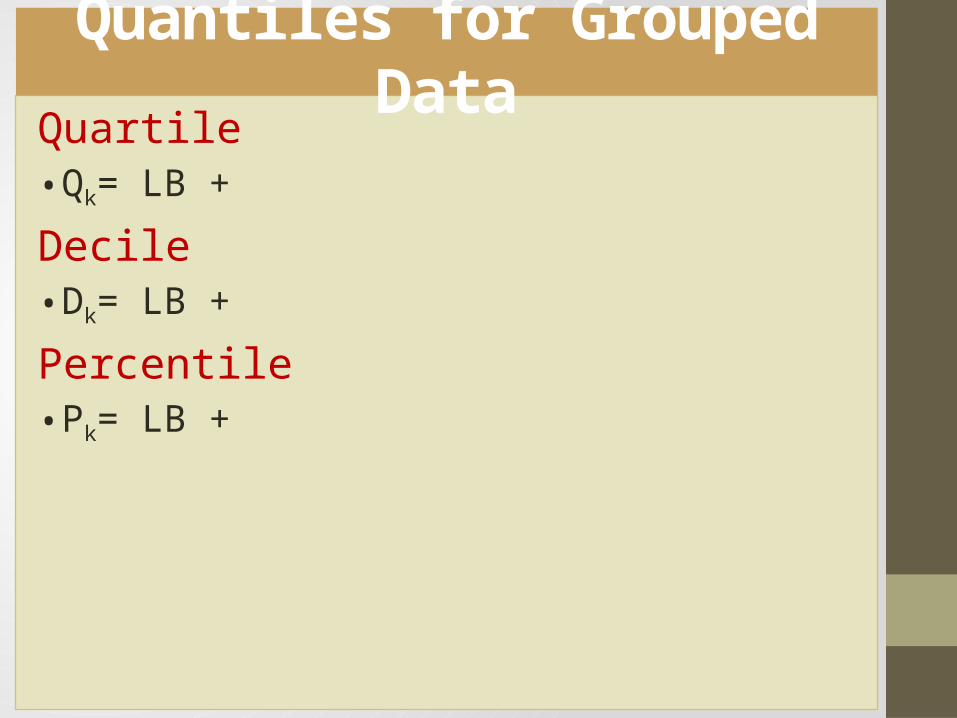
Quartile• Qk= LB +
Decile• Dk= LB +
Percentile• Pk= LB +
Quantiles for Grouped Data

ExampleFind 3rd Quartiles, 1st Decile and 29th Percentile

Box Plot or Box and Whiskers Plot

Steps in Constructing Boxplots
1. Order that data. The most efficient way to do this is to construct a stem and leaf display.
2. Calculate the five-number summary.3. Draw a box with the ends of the box located at the lower and upper quartiles.4. Draw a vertical line I the box at the location of the median.

Steps in Constructing Boxplots
5. Identify any outliers. An outlier is any value located at a distance of more than 1.5 x IQR from the box.6. Draw lines extending from the box to the smallest and largest values within 1.5 x IQR , i.e. the most extreme value that is not an outlier. These lines are called whiskers.7. Plot any outliers individually.

• http://www.brainingcamp.com/content/box-and-whisker-plots/index.html
Link

Outliers and the Interquartile Range (IQR)
An outlier is an extremely high or an extremely low data value when compared with the rest of the data values.
The Interquartile Range,
IQR = Q3 – Q1.

Outliers and the Interquartile Range (IQR)
To determine whether a data value can be considered as an outlier:
Step 1: Compute Q1 and Q3.
Step 2: Find the IQR = Q3 – Q1.
Step 3: Compute (1.5)(IQR).
Step 4: Compute Q1 – (1.5)(IQR) and Q3 + (1.5)(IQR).

Outliers and the Interquartile Range (IQR)
Step 5: Compare the data value (say X)
with Q1 – (1.5)(IQR) and Q3 + (1.5)(IQR).
If X < Q1 – (1.5)(IQR) or if X > Q3 + (1.5)(IQR),
then X is considered an outlier.

Outliers and the Interquartile Range (IQR) - Example
Given the data set 5, 6, 12, 13, 15, 18, 22, 50, can the value of 50 be considered as an outlier?
Q1 = 9, Q3 = 20, IQR = 11. Verify.
(1.5)(IQR) = (1.5)(11) = 16.5.
9 – 16.5 = – 7.5 and 20 + 16.5 = 36.5.
The value of 50 is outside the range – 7.5 to
36.5, hence 50 is an outlier.

Example
Construct a box plot for the set of measurements
7 18 12 17 29 18 4 27 30 2 4 10 21 5 8The five-number summary isMin = 2 Q1 = 5 M = 12 Q3 = 21 Max = 30
The inter quartile range is IQR = 16

1.5 x IQR = 1.5 X 16 = 24
Q1 – 1.5 x IQR = 5 – 24 = -19
Q3 + 1.5 x IQR = 21 + 24 = 45
7 18 12 17 29 18 4 27 30 2 4 10 21 5 8There are no data values less than -19 or greater than 45.
Therefore there are no outliers.

Min = 2 Q1 = 5 M = 12 Q3 = 21 Max = 30

Information Obtained from a Box Plot
If the median is near the center of the box, the distribution is approximately symmetric.
If the median falls to the left of the center of the box, the distribution is positively skewed.
If the median falls to the right of the center of the box, the distribution is negatively skewed.

Information Obtained from a Box Plot
If the lines are about the same length, the distribution is approximately symmetric.
If the right line is larger than the left line, the distribution is positively skewed.
If the left line is larger than the right line, the distribution is negatively skewed.

https://www.youtube.com/watch?v=1HjLY1tc508

Activity
Problem