deepview: basic molecular modeling - institute for ... · pdf filetextwrangler or wordpad) ......
TRANSCRIPT
Biochem 660 – 2008 153
DeepView‐page‐153
DeepView: Basic Molecular Modeling
Deep View formerly known as Swiss PDB Viewer (http://us.expasy.org/spdbv/) is a free program developed by Glaxo Smith Kline R&D & the Swiss Institute of Bioinformatics. It has many features available in other programs, but with an array of additional features not commonly found in free software. It is available on many platforms, including Mac OSX, Windows and Unix, therefore providing a wide distribution.
- e -
1 DeepView - Exercise A: Starting DeepView and opening a molecule
The exact location of the DeepView program will be provided by the instructor. On OSX it may be available on the task bar, on Windows it may be available within the Start>Programs button.
✔ TASK
1) Double click on the DeepView icon 2) You are immediately prompted to open a PDB file with a dialog
window. Select the file “hrv2-2A-2HRV.pdb” from the PDB files directory “PDB-files-for-lab”
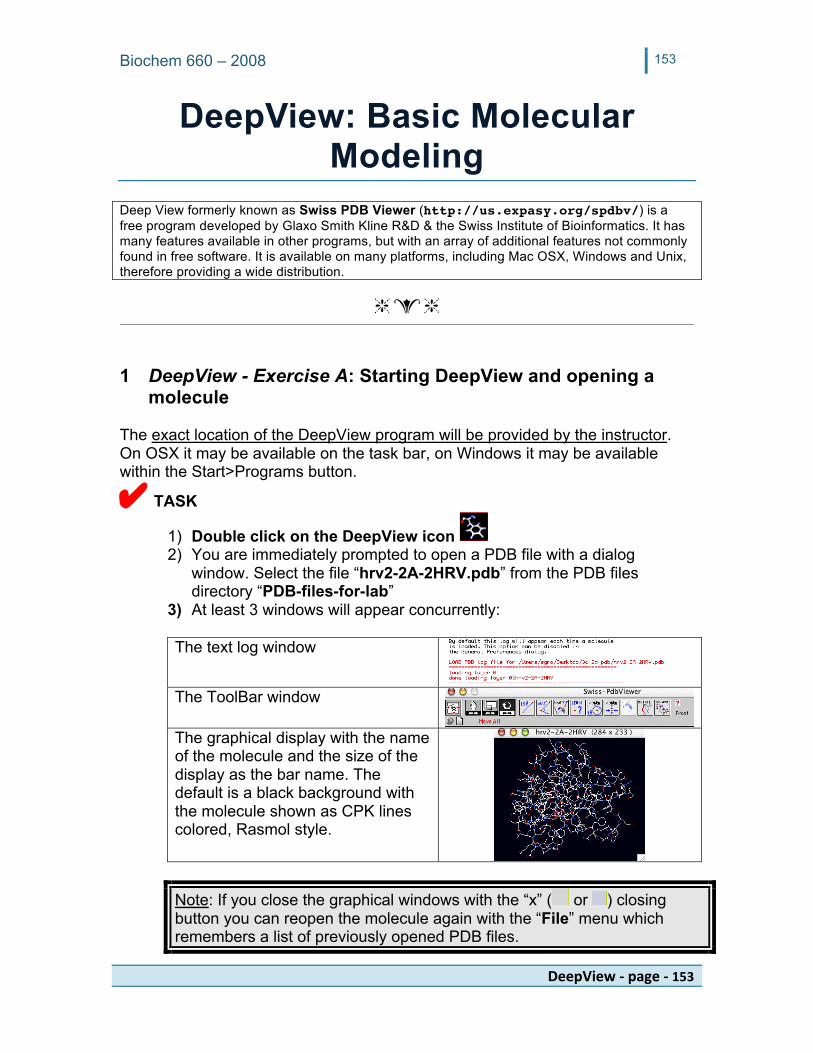
3) At least 3 windows will appear concurrently:
The text log window
The ToolBar window
The graphical display with the name of the molecule and the size of the display as the bar name. The default is a black background with the molecule shown as CPK lines colored, Rasmol style.
Note: If you close the graphical windows with the “x” ( or ) closing button you can reopen the molecule again with the “File” menu which remembers a list of previously opened PDB files.

Biochem 660 – 2008 154
DeepView‐page‐154
4) From the Wind menu call
the “Control Panel” the “Layer Infos” and the “Sequences Alignment” windows.
- e -
2 DeepView - Exercise B: Interacting with the molecular display
✔ READ The mouse can be used to rotate, translate and scale (zoom) the molecule interactively. These three functions are toggled from the “Toolbar.” Note that the currently selected function is shown with a black background, the others are shown with a gray background.
Rotate:
Scale:
Translate:
1) The function button must be selected each time the mouse is to assume a
different function.
2) The leftmost button on the Toolbar will recenter and rescale the molecule, a useful tool if you loose it.
- e -
3 DeepView - Exercise C: Coloring the molecule and side chains
✔ TASK a. Color the molecule with some of the
available options in the “Color” menu. b. Return to CPK color when you are done
exploring. c. Engage the menus Display > Render in 3D
(note that the display may become black) and then also Render in solid 3D

Biochem 660 – 2008 155
DeepView‐page‐155
d. Bring the “Control Panel” from the “Wind”
menu. Note for reference the 2 check marks that allow you to make the molecule visible or immobile (can move). e. Scroll down and find His25 within the list.
f. Click on the 2 check marks and see how
this undisplays (makes invisible) the complete amino acid or only the side chain.
g. Click on the square with a minus sign at the right hand side of this line. This will open the color menu selection.
h. Slide the vertical slide bar on the right to make the color brighter, and click for selecting a color within the disk (for example yellow).
Note that other mode of color selections appear by clicking on the various icons at the top. The options might be slightly different depending on the operating system.
i. Click OK
j. Look in the display to see where
His25 is located. k. Rotate the molecule to bring it to the
top right of the display l. In the Toolbar click on the “?” buton
(8th from the left: ) m. Click on an atom of His25, this will
create a label.
- e -
4 DeepView - Exercise D: Mutating a side chains Finding a mutant in the laboratory is exciting because it may help understand the function of an amino acid within the molecule. It is even more exciting to be able to create a “mutate” a 3D model with the mutation you have isolated, provided a 3D X-ray or NMR structure exists. The following exercise illustrates a method within DeepView to mutate an amino acid side-chain.

Biochem 660 – 2008 156
DeepView‐page‐156
✔ TASK
1) Click on the “Mutate” button (second from right in Toolbar)
2) Click on any atom of His25 Note that a local menu shows up
3) Mutate this His25 to His for this time around. (Note that the proposed orientation differs from the current side chain position but offers an additional H-Bond with the oxygen of Ser22.)
4) Click on the “Mutate” button again, and click “Discard” this will make His25 return to its original orientation.
Note: you can click on the “?” button while the mutation takes place to identify who is doing the H-Bond. You can also click on the “Rotate” button in the Toolbar and rotate the display.
5) Mutate the side chain again to ASN and
note that this time the proposed orientation makes an Hbond with the O of Glu23
6) Explore various mutations options, you can save them if you are curious.
7) Save your structure: File > Save >
Layer…. Enter a PDB file name, e.g.
“mutant.pdb” 8) Open the “mutant.pdb” file you just
created with a word processor (e.g. TextWrangler or WordPad) and look at the PDB coordinates where you created the mutation.
- e -
5 DeepView - Exercise E: 3D superimposition of 3 molecules A PDB file contains XYZ 3D Cartesian coordinates, but the origin point (0,0,0) is not necessarily the same for similar structures, as various factors can influence the final 3D file including the orientation within the crystal or choices made by the authors. It is sometimes useful to be able to superimpose 2 or more structures in 3D space to see how they align in 3D.

Biochem 660 – 2008 157
DeepView‐page‐157
✔ TASK 1) Quit and Resart DeepView if
you are currently running it. 2) Open the following 3 PDB files: hrv2-2A-2HRV.pdb hrv2-3C-1CQQ.pdb polio-3C-1L1N.pdb
Note: Use the File > Open PDB… menu to open the 2nd and 3rd files.
3) Use the Wind menu to bring in the Sequences
Alignment 4) Use the Color menu and color by Layer. Note that the sequences change to the same color as the 3D structures.
5) Use the Wind menu can bring the Control Panel
Note that you can select which molecule is being worked on by clicking on the name of the currently displayed molecule.
6) Click on the word “side” in the Control Panel and watch the side chain disappear from the display and the check marks disappear from the list.
7) Repeat this for all 3 molecules.
8) Use the Wind menu can bring
the Layers Infos 9) For all 3 molecules click on CA
This makes all the protein shown as Carbon-Alpha traces.
10) In the Control Panel switch back
to hrv2-3C-1CQQ.pdb 11) Scroll all the way to the bottom
of the list and uncheck AG7501
(you might have noticed that “something” is still shown with all the side chains. This is compound bound the the protein)

Biochem 660 – 2008 158
DeepView‐page‐158
12) In the Fit menu select Magic Fit (quickTest)
Keep the CA default option and note that the calculation can occur only for 2 molecules at a time, by default the first two layers.
13) Repeat the Fit >Magic Fit
command. Keep the same “Reference” Now choose polio-3C-1L1N.pdb as the second in the list.
14) Rotate the 3D display, you should now have a nice superimposition of the 3 structures.
15) Save each 3D structure in the following manner: a. In the control panel select a layer, e.g.
hrv2-2A-2HRV.pdb b. File > Save > Layer… c. Save the coordinates into a file e.g.
L1.pdb
16) Repeat the procedure for the next 2 layers and call the saved files e.g. L2.pdb and L3.pdb
Note: If you keep the same “Reference” for all the fitting, you may skip saving that 3D structure as it is not changed by the procedure.
Note: although only the CA are displayed, all the atoms are saved by the saving function.
- e -
End of DeepView
Class notes

Biochem 660 – 2008 159
DeepView‐page‐159
DeepView - Supplemental Aknowledgements: The following unedited tutorial is reproduced with the permission of
Jacqueline Roberts, PhD, Depaw University, Indiana. Tutorial developing by Elizabeth Garrett. - e -
Protein Structure Computer Tutorial and Problem SetSwiss PDB Viewer (Mac/PC Version 3.6b2) Obtaining Files/Downloading the Program (for your own computer)
• You can obtain a free copy of Swiss PDB Viewer version 3.6b2 (Quick Draw3D) by going to the following web site: http://expasv.nhri.org.tw/spdbv/text/getrnac.htm (or getpc.htm for PC users). In addition, the site will give you access to tutorials and manuals related to the program. • Go to the Protein Database (http://www.rcsb.org/pdb/) and search for 2LZM using the "Enter a PDB ID" also click on "query by PDB ID" You should pull up a file for bacterial T4Lysozyme. • At the left-hand side of the screen click on "Download/Display File". • Under the "Download Structure File" category choose "Header Only" click on the TEXT file. • In the next window, click on "Save Full Entry to Disk". You will open up Swiss PDB Viewer.
Getting Acquainted with the Windows in Swiss PDB Viewer (Deep Viewer)
• Open the Swiss PDB Viewer Program and click "OK" on the first box that appears • A second box will appear on your screen asking you to select a PDB file to open. Find and select your 2LZM file and then click ok. A display window will now open showing the PDB file. (Note: an "inputlog.txt" box will pop up immediately upon opening of your file. Just close that box). In addition to the display window, you will see a toolbar and a widow labeled "Control Panel" • At the top of the screen you will see several pull-down menus. One of these is labeled "Wind" Pull down the Wind menu and select "Toolbar" The bar above the display window will become highlighted. This toolbar contains the commands for several essential program functions. We will discuss this toolbar in detail in the next section. • Next choose Wind-->Sequence Alignment. A black "Align" box will show up towards the bottom of the screen. This box gives the amino acid sequence (using the one letter codes) of the protein. • From the pull-down menus, Select-->AH. In the Align window the color of the letters for the amino acids will change from white to purple. This indicates that the entire sequence of amino acids is selected. Notice that in the window labeled "Control Panel" the amino acids in the sequence also changed from black to red indicating they have been selected. • Choose Wind and notice the other possible windows to open. We will explore these windows in greater detail at a later time. • Also notice that in each of the windows open there is a small red question mark. Clicking on this question mark will provide information and help on the functions of the corresponding window.
The Toolbar and Model Manipulation
• Above the Display window you will see a toolbar. The first button on the left changes the attributes of the display window. Select this button and a box will open giving you information on the current settings. While using this menu is one option for adjusting display window size, a better option exists. Hit Cancel and the box will disappear. The better way to adjust the size of the display window is simply by expanding it using your mouse (go to the lower right-hand corner of the display window and stretch the window).

Biochem 660 – 2008 160
DeepView‐page‐160
• The next three buttons on the toolbar allow you to translate, rotate, and zoom in on protein. To use one of these buttons simply click on it. The button will become highlighted indicating that it is active. To translate the molecule, select the first button (the hand). Click on the protein and simply move it around. The next button allows you to zoom in or out on protein. Moving your mouse to the left will zoom out, while moving it to the right will zoom in. The third button in this trio allows you to rotate the model. Experiment with these tools. • After playing with the model, hit the = or the help key on your keyboard. Doing this centers the molecule and resizes it to fit the display window. • Your PDB file can also be centered on a specific amino acid. First, click on the control panel window to activate it. Next press option on the keyboard and at the same time click on one of the three letter amino acid codes in the control panel (for PC users, just right click). Doing this centers your file on that amino acid. Try this a couple of times. The last time, Option Click on Phe104 to center 2LZM on this amino acid. The amino acid's name will be in bold print on the control panel indicating the molecule is centered on it.
Evaluation Protein Structure
• Scroll down the control panel and notice how groups in the PDB file are identified. Amino acids are labeled in the control panel by their three-letter code and their residue number.
Question 1: How many amino acids are in lysozyme?
• Option click in the column labeled side in the control panel. Doing this will take away all of the sidechains of the amino acids. • Various methods are available for selecting and displaying all or part of this amino acid sequence. Place your pointer on LYS6O and drag down to ILE78. The letters in the display for these amino acids should turn red, indicating they have been selected. Press Return on the keyboard. All other amino acids will disappear from the screen, leaving only those you have selected. Notice that in the control panel, checkmarks in the "show" column appear only for your selected groups. Press = or help to center your selection. • On the control panel, click in the "side" column next to PHE67. The side chain for this amino acid will appear. At the top of the control panel click on the word side. All of the sidechains for your selected amino acids will appear. • Rotate and examine your selection on the screen. This sequence of amino acids makes a familiar secondary structure.
Question 2: What secondary structure do residues 60-78 make?
• Under the Tools menu select Computer H-bonds. Question 3: Between what atoms does hydrogen bonding occur in this secondary structure? Write down three specific examples.
• To remove the display of hydrogen bonds, go to the Display menu. Next to "Show H-Bonds" you will see a checkmark showing that they are displayed. To remove them from display deselect Show H-bonds by clicking on it. • At the top of the control panel click on label. Swiss-PDB Viewer will label all of the amino acids of your selected group. The label is placed at the alpha carbon. Examine the results. • The control panel will also allow us to add a Van der Waals surface to our selection. Click on V at the top of the control panel. A Van der Waals surface will be displayed.
***As you can see from these last several commands, clicking a column at the top of the control
panel will act only on your current selection. Carry this out for the ribn column. A ribbon diagram representation of your selection will be portrayed.

Biochem 660 – 2008 161
DeepView‐page‐161
• Remove the ribbons, labels, and surface as follows: Place your pointer in the desired column. Simultaneously press shift on the keyboard while clicking in the column. An alternative way to remove the labels is to go to the display menu. From here go to Labels, then Clear User Labels. You should now be left with the carbon backbone and sidechains of the selected sequence. • In the Show column, click while pressing the shift key. The entire sequence should reappear. This same procedure can be used for any column. Practice turning off and on various features of the entire molecule. End by displaying the entire molecule with sidechains. • Another option allows you to display single alpha helices or beta strands. Note that just to the left of the groups names is a column in which you see either a s, an h or a blank space. Groups labeled s are strands of a beta sheet, while those labeled h are of an alpha helix. Click on the s next to Leu15 and then press return. You have now selected and displayed only the amino acids involved in the same strand as Leu 15. • Find another series of s designations in this amino acid chain. Click on the s column by one of these amino acids and press Control and Return simultaneously. A second strand should appear near the first strand. Carry out this procedure for the remaining amino acids designated s. Next, go to the tools menu and compute H-bonds.
Question 4: 1) What secondary structure do these strands form? 2) Using arrows as the designation for a strand, draw a picture indicating the direction of the strands relative to one another. Is this secondary structure parallel, antiparallel, or both?
• Swiss PDB Viewer can also display all strands or all helices for you. Go the Select menu and choose Secondary structure and then helices.
Question 5: 1) How many alpha helices are in T4 lysozyme? 2) How many beta strands are in T4 lysozyme?
• Select and display the entire protein molecule without sidechains. • Another convenient way to view secondary structure is by coloring secondary structure types. Under the Color menu select Secondary structure. You will now see helices in red, beta sheets in yellow, and other secondary structure in gray. • In the Color menu select Secondary Structure succession. This command portrays each secondary structure element in a different color. • Go Back to Color and select Secondary Structure. • In the Display, click on Render in 3D. • Option click on the ribn column in the Control Panel. You will now see the secondary structure in 3D • Option click on the show column in the Control Panel. You should have a nice ribbon structure.
Evaluating Protein Characteristics
• Under the Color menu select CPK. This returns the protein model to its original color scheme. Next, make sure the protein molecule is displaying all amino acids and sidechains. • Go to the Select menu and choose Group Property and then Basic. This command selects only the basic amino acids. Go to the Color menu and choose Selection. The selected basic amino acids will now be colored cyan with the other residues colored gray.
Question 6: What amino acids are characterized as basic? How many basic amino acids are in Lysozyme?
Biochem 660 – 2008 162
DeepView‐page‐162
• Next, in the Select menu choose Group Property, Acidic and color these amino acids as was done in the previous step.
Question 7: What amino acids are classified as acidic? How many acidic amino acid residues are in lysozyme? Question 8: Considering the ratio of acidic to basic amino acids would you expect lysozyme to be more basic or more acidic? How would this affect the protein's p1?
• Select, Group Property, Nonpolar. This command selects all nonpolar residues in the protein molecule. Color the selection.
Question 9: Are the majority of nonpolar residues located throughout the molecule, at the interior, or at the exterior?
• Select, Group Property, Polar. This command selects all polar residues in the protein. Color your selection by clicking at the top of the color column on the control panel and then selecting a color from the "Crayon Picker". (Clicking at the top of a column, as you may recall, carries out a function on only the selected residues).
Question 10: Where are the majority of the polar residues located? Question 11: Give the amino acid name and number of any residues that surprised you in where they resided in the protein. Provide at least two interior and exterior residues.
Comparing Similar Proteins
• Go to the protein databank and download the following files: 1HEW (Hen Egg-white lysozyme), 2EQL (Horse milk lysozyme), 1QQY (dog milk lysozyme), and 1JSF (Human lysozyme). You already have T4 lysozyme.
Question 12: Considering the evolutionary relationship of the different species to be compared, which proteins do you expect to be most similar? Which proteins do you expect to be most different? Why?
• In Swiss PDB-Viewer open 1HEW, and 1JSF. They all should appear on the same screen. Press = to center them on the screen. • For the convenience of being able to differentiate between protein molecules, we want to color each lysozyme a different color. Go to the Color menu and select Layer. Each of the PDB files is considered a separate layer, and thus each will be colored differently. We can tell which molecule is what color by doing the following: At the top of the control panel, there is a strip in which you find the name of the PDB file. Click on that strip. You will see that from here you can toggle between the different files. Note which file is which color. • If you wish to change the color of the molecules, do the following. With the desire file active on the control panel, Go to the Select menu and Select All. Next go to the control panel and click on COL. From the Crayon Picker select a color. Now this protein file is in the color you selected. • Go to the Wind menu and select Layers Info. A new window will appear on your screen displaying the files you currently have open. The one highlighted in red is the protein file currently being manipulated. Using this menu you can hide layers, keep layers from moving, or carry out other tasks. In the far left-hand column is the name of your PDB tile. Just to the right of this is a column entitled vis. Click on a checkmark in the vis column. The file corresponding to the row you clicked will disappear, thus this function allows you to hide PDB files. The next column is the mov column. Removing the checkmarks in this column allows you to lock protein files in place, allowing you to move some layers while leaving others

Biochem 660 – 2008 163
DeepView‐page‐163
stationary. Also note the sel column on the far right-hand side of the table. This column tells you how many residues are currently selected in each of the protein files.
Question 13: How would this select column feature have helped you in questions 7 and 8 in the protein characteristic section?
• Go to the Fit menu and select Magic Fit. Choose 1JSF as your reference layer and 1HEW as the other file. 1HEW will now be placed on top of IJSF. (If you get an error message saying "current layer is reference layer", go to the control panel and change it to the other file). • Go to the Color menu and select RMS. This function colors the amino acids of 1JSF based on its similarity to 1 HEW. Red indicates a poor fit, while blue indicates a good fit. The colors in between then follow ROYGBIV. • Go to the Wind menu and select Sequence Alignment. A black window will appear with the one-letter codes for the amino acid sequence of each of the proteins. The amino acids selected in each protein will appear with a purple box around them. Click on one amino acid residue in each sequence to get rid of the annoying purple boxes. You will notice that the selected amino acids will be blinking on your molecule display screen. • In the sequence alignment box, note the RMS coloring of USE • Next, go to Fit and select Best (or Improve Fit). Again, use IJSF as your reference and 1 HEW as your other file. Watch as the fit of your proteins changes slightly. • Go to color and select RMS. Now look in the sequence alignment window. Did your fit improve?
Question 14: Make a list of the colors (blue, green, yellow, orange and red) in your RMS fit (Group all the blues together) and give the number of residues falling in each category. What percent of the amino acids fall in each of the different colored categories?
• Repeat the fitting steps for horse lysozyme, canine lysozyme and bacterial lysozyme (one of these may not fit well at all) using human lysozyme as the reference layer for all fits.
Question 15: Add to the table in question 14 the data you obtained for the other three lysozyme proteins. Make sure you include the number of residues in each colored category along with the percentages.
Question 16: Rank each lysozyme in order of similarity too human. Does this ranking surprise you? Explain in a few sentences. Evaluating Active Sites
• Close all active PDB files except L HEW. Center the protein molecule and return coloring to CPK. • Look at the amino acid sequence in the control panel for this PDB file. At the end of the list there are 3 residues labeled NAG2OI, NAG2O2, and NAG2O3. Select these three residues and color them the same color using the COL column in the control panel. • Zoom in on this tri-NAG molecule. • On the toolbar select the button with the eye and the circle on it. Next, Click on an atom on the center ring of the tri-NAG chain. A box will appear. Click on the button next to display only groups within" and set the distance to 10 Angstroms. • Center your selection on the screen by pressing =. • Go to the Tools menu and Compute Hydrogen bonds. All of the hydrogen bonds present in the selection will appear. • In the control panel select only the 3 NAG residues. Go to the Display menu and select Show only H-Bonds from selection. • Now examine your display screen.
Biochem 660 – 2008 164
DeepView‐page‐164
Question 17: How many hydrogen bonds are present between the protein and Tri-NAG? Make a table listing each of the hydrogen bonds. Include the name of the amino acid participating (and which atom on that amino acid), the NAG participating (and which atom on that NAG), and the distance of the hydrogen bond.
• Using the ? button on the tool bar, determine the names of the atoms/amino acids participating in the Hydrogen bonds. • Using the distance button on the toolbar (the button just to the right of the rotate button) determine the distance of the hydrogen bonds by pointing on the atoms participating in the bonds. • Using the procedure outlined in "Evaluating Protein Characteristics" determine the properties of the active site.
Question 18: Are the majority of the amino acids in the active site acidic, basic or neutral? Polar or non-polar? Provide the number of each. Question 19: Consider the other amino acids surrounding the Tri-NAG molecule. Other than hydrogen bonds, what other types of interactions might be contributing to the molecule's binding to the active site? Question 20: Many diseases are the result of a mutation in a protein. These mutations are particularly critical if they occur in the protein's active site. Can you explain why?
• Locate amino acid residue Trp62. • On the tool bar select the Mutate button. Now click on Trp62. A long box will appear with the three letter codes of each amino acid. The Trp residue will now be replaced with Phe.
Question 21: Based on the differences between Phe and Trp, do you expect them to interact differently with the NAG? In your answer explain the differences in the properties and structures of these amino acids.
• Once you are finished examining this mutated amino acid, Click on the Mutate button again. A box will come up. Select Discard. The amino acid in the protein will return to its original Trp identity. • Locate residue 107 in the protein active site. • Mutate residue 107 to a Glu.
Question 22: Based on the differences between the two residues, do you expect them to interact differently with NAG? In your answer explain the differences in the properties and structures of these amino acids. Question 23: Do you think either of these mutations would help lysozyme with substrate binding? May help to count H-bonds before and after each mutation.
- e -
End of DeepView Supplemental