deepviz: visualizing convolutional neural networks for...
TRANSCRIPT
deepViz: Visualizing Convolutional Neural Networks for Image Classification
Daniel Bruckner Joshua Rosen Evan R. Sparks
UC Berkeley{bruckner, joshrosen, sparks}@cs.berkeley.edu
Abstract
Deep convolutional neural networks have recently shown state ofthe art performance on image classification problems. However,their inner workings remain a mystery to machine learning experts,particularly when compared to better studied and less complex al-gorithms such as SVM and Logistic Regression. As a result, con-structing and debugging effective convolutional neural networks istime-consuming and error-prone, as it often involves a substantialamount of trial and error. We introduce deepViz, a system de-signed to allow experts to understand their models and diagnose is-sues with the model structure, enabling more rapid iteration duringthe model construction process and faster convergence to a suitablemodel for the task at hand.
1 Introduction
Deep learning, or the use of deep (i.e., many-layered) convolutionalneural networks for machine recognition and classification, is ad-vancing the limits of performance in domains as varied as com-puter vision, speech, and text ([Zeiler and Fergus 2013], [Deanet al. 2012]). Improvements in both hardware and software perfor-mance have enabled the development of larger networks that haveachieved record results ([Krizhevsky et al. 2012]). The promise ofdeep learning is to automate feature engineering, a task that oth-erwise requires application of both domain expertise and machinelearning expertise. Neural networks offer a coherent framework totrain multifaceted models that compose featurization and classifica-tion components in a unified pipeline.
But to architect a deep network is not trivial. There are three pri-mary challenges. First, because convolutional networks composemany functional components—whose values as individuals and asa whole are not well understood ([Jarrett et al. 2009])—they aredifficult to design. Second, each component of a network may havedozens of hyper-parameters associated with it, all of which must betuned for peak performance. And finally, the complexity of neuralnetworks has protected them from the rigorous formalism of otherfields of machine learning, so practitioners can only rely on anec-dotal results to guide design. An intimate community has focusedon convolutional networks, so few know of good design heuris-tics. Moreover, the majority of this community is now employedby Google and Facebook. Given these challenges, how can a rel-ative novice to field learn to obtain results on par with the field’sleading experts?
We propose visualization as a means to make high-end deep learn-ing approachable. Convolutional networks are not a black box:their internals (filters, namely) can be visualized in a natural way asbitmaps. What is more, because neural networks are composed oflayers, intermediate representations of transformed data can be readout after each layer. When a network is applied to image process-ing, these intermediate forms are themselves images, and can bevisualized as such. That is, it is possible to see what the model seesat different stages of computation. As shown by [Zeiler et al. 2011]and [Vondrick et al. 2013] visualization of these reconstructed in-
termediate states can be an aid to model tuning and debugging.
Our system, deepViz, is an interactive visualization system fordeep learning. Given a trained convolutional model and an imagecorpus, deepViz offers displays and interactions that empower auser to explore their model and its relationship to the data.
deepViz targets an iterative workflow for development and re-finement of convolutional networks. After a user chooses an ar-chitecture and parameters for a network and then trains it againstsome data set, they can use deepViz to observe snapshot visu-alizations of the model at different time steps during the trainingprocess. These snapshots give insight into the model and into prop-erties of the training process itself (e.g., rates of convergence, andcorrelated structure across time and space) that allow the user to di-agnose shortcomings and highlight strengths of the current model.These observations lead to revisions to the model architecture andfurther rounds of training, visualization, and evaluation.
The deepViz interface provides access to several classes of vi-sualization. Users can view bitmap representations of filter banksin convolutional layers and of weight matrices in fully connectedlayers. For all types of layers, a user may select an image from theinput data set and view the output that image induces on the layer.These featurized representations allow a deeper understanding ofthe function of particular layers and filters, and can be used to spotsources of confusion in the model.
The system also gives users views of the model’s final output. Thefirst of these is an interactive confusion matrix that plots the num-ber of images by true class and predicted class, and allows the userto view example images in each category. Another visualizationshows the results of a clustering algorithm run on the featurizedoutput of the model for each image. This view is intended to high-light subclasses of images, for example, the class of airplanes maysplit into a cluster of images of planes in profile and another clusterof images shots head on (or from above or below). Understand-ing how the model partitions the input data (or fails to partition) isanother aid to diagnosis.
All of the visualizations in deepViz are driven by a timeline sys-tem. As mentioned above, each display represents a snapshot of themodel at a particular point in its training. An interactive slider in-put allows users to control which snapshot to show, or the view canbe displayed as an animation spanning the entire training process.Animations give the user a sense of how components of the modelevolve during training. Users can stop and start animation at anypoint with a button click.
The remainder of this paper is organized as follows. Section 2 dis-cusses related work, and Section 3 gives a brief introduction to con-volutional neural networks and how the are designed and trained.The deepViz system architecture is described in Section 4, andthe key features, visualizations, and interactions of the system arepresented in Section 5. Section 6 describes directions for futurework and Section 7 concludes.
2 Related Work
For several decades, convolutional neural networks have been ap-plied to problems in computer vision. In the nineties, such ar-chitectures achieved breakthrough performance in applications likehandwriting detection and face recognition. LeNet [LeCun et al.1998], a system for handwritten digit recognition, is among the firstto achieve near-human accuracy. LeNet notably includes an inter-active visualization system that displays featurized versions of in-put images as well as predictions. The visualizations allow directand compelling demonstration of important properties of the systemlike invariance to translations and deformations of the input. WhileLeNet’s visualizations provide evidence for the system’s merits—and add to its merits, since an inspectable model is better than ablack box—they do not serve as design aids to practitioners.
Increases in computing resources have allowed deeper and morecomplex convolutional to be trained. [Krizhevsky et al. 2012]achieved record results in the ImageNet Large Scale Visual Recog-nition Challenge [ImageNet 2013] with an eight layer networktrained on two GPUs over twelve days. For our project, we haveused open source code released by [Krizhevsky 2012] to train largemodels. [Donahue et al. 2013] introduced decaf, a system writtenin Python and developed here at Berkeley, to make convolutionalnetwork processing more approachable. deepViz uses decafextensively for interactive image featurization and for offline statis-tical computations.
Much recent work explores the growing design space of convolu-
tional networks. [Jarrett et al. 2009] evaluate architectural vari-ations of different hand-designed networks on several data sets.Others, like [Yamins et al. 2013], use Bayesian methods to auto-matically search the parameter space of convolutional networks.deepViz intends to supplement such efforts by helping users de-velop heuristics to guide search and evaluation in this increasinglycomplex space.
Beyond neural networks, visualization has been used in computervision more generally as a tool to aid in feature evaluation. [Von-drick et al. 2013] argue for the necessity of visual inspection ofimage features to understand models’ failures. They use featureinversion algorithms, whereby an image is featurized and then re-covered to a transformed but basically intelligible format, to giveintuitive access to abstract feature representations.
Feature inversion has been applied to convolutional neural networksto obtain several interesting results. [Le et al. 2011] perform inverseoptimization on a network trained by unsupervised learning to con-struct the optimal inputs for particular neurons. In particular, theyfind single deep neurons trained to respond to faces (both humanand feline) and bodies. This year, [Zeiler and Fergus 2013] use atype of feature inversion called deconvolution to render re-weightedversions of input that highlight the areas, patterns, and textures of animage deemed most important by a particular part of the network.These re-weighted images are both accessible and informative, andthe authors used insights from these images to refine their networkdesign to achieve state-of-the-art performance. In the future, weplan to add forms of feature inversion to deepViz.
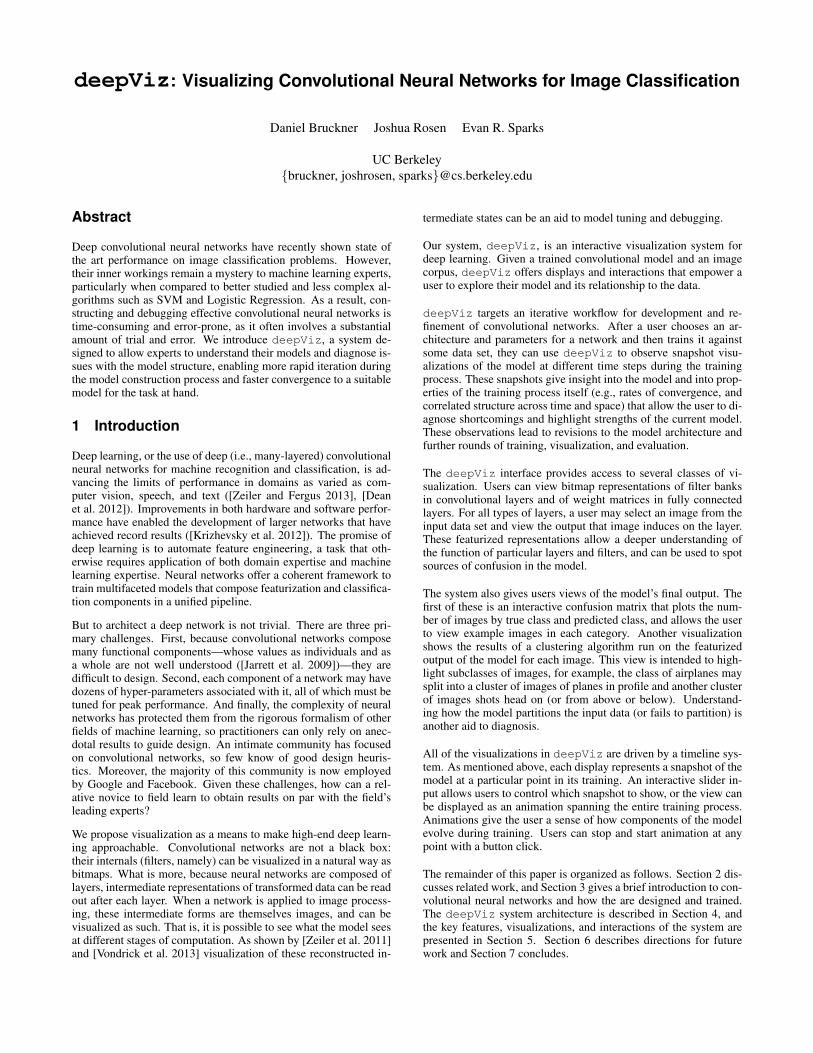
Figure 1: The deepViz interface
3 Background
We begin by describing the structure of deep convolutional neuralnetworks and provide a rough overview of the design space that thearchitect of such a network must consider explore when construct-ing it. After establishing this architecture, we describe the conven-tional training process used to converge on an appropriate modelfor a particular problem. While these networks can be trained forunsupervised learning tasks, we focus on the supervised case sinceour target problem (image classification) falls into that family.
3.1 Convolutional Neural Networks
In general, an artificial neural network consists of a successionof layers of so-called neurons. A neuron computes a function oninputs from the preceding layer and passes the result, sometimescalled the neuron’s activation, to outputs in the succeeding layer.Within each layer, all neurons compute the same function, but indi-vidual neurons may have distinct sets of inputs and outputs and mayassign different weights to their inputs. Different types of layers aredefined by the number and pattern of connections between neurons.In a fully connected layer, the neurons receive input from every out-put in the preceding layer. In a locally connected layer, the neuronsare indexed spatially, and each only takes input from nearby out-puts. A convolutional layer is a type of locally connected layerwhere the weights that each neuron applies to its inputs are sharedin a particular way. We describe convolution in greater detail below.
A neural network architecture for image classification combines adiversity of functions and connectivity structures using several lay-ers. The first layers are convolutional and produce a featurized rep-resentation of an image. Afterwards, a non-linear transformationis often applied, followed by a linear classifier such as logistic re-gression or SVM. The output of the network (usually a vector ofpredicted probabilities) can be assessed relative to a true image la-bel, and the result can be used by an optimization algorithm likegradient descent to train the network. The great appeal of neuralnetworks is that training can be applied to the featurization layersas well as the classifier. This end-to-end training algorithm, calledback-propagation, is the current state-of-the-art in image classifi-cation and other domains such as speech recognition [Dean et al.2012]. Typically, training is an iterative process that involves mul-tiple passes of the input data until the model converges.
3.1.1 Convolution
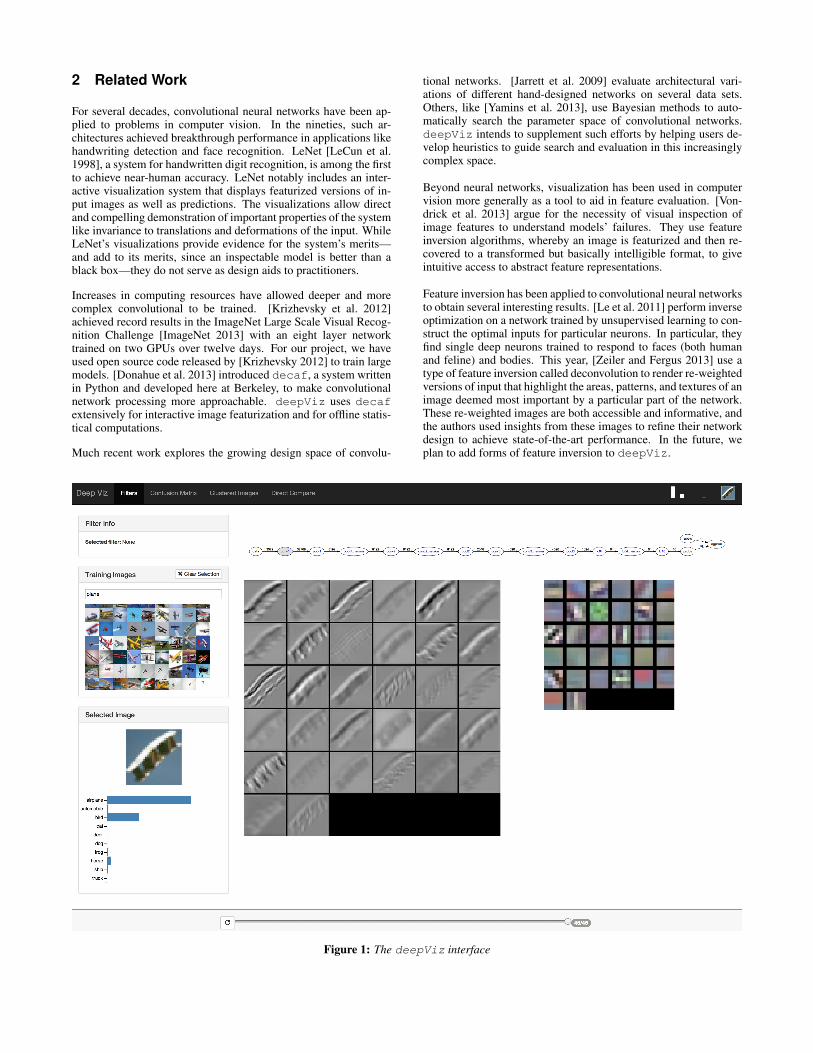
The convolution of an image is produced by applying a filter toimage, and produces a new image. A filter is a k × k weight-matrix where k is an odd number (so that the matrix has uniquecenter). Pixels in the convolved image are produced by placing thefilter on top of the image, with its center aligned at the correspond-ing input pixel, and computing the dot product of the filter withthe pixels below it. The convolution can be imagined as the resultof moving a filter across the image that replaces each pixel withsome function of its neighborhood. This process is illustrated inFigure 2.[Wikipedia 2013]
In the context of neural networks, a convolutional layer appliesmany filters to its input to generate a feature map, which is essen-tially a stack of convolved images, or equivalently, one convolvedimage with an arbitrary number of channels per pixel. In addi-tion, convolutional layers are often bundled with several auxiliarylayers that apply a fixed transformation to the convolved featuremap. These auxiliary layers include normalization (of pixel val-ues within a neighborhood), pooling (aggregation of small patchesof pixels, for example, by averaging or taking the maximum pixel
Figure 2: Image Convolution.
value), down-sampling, and the application of various non-linearfunctions to pixel values.
So far, our discussion of convolution has tended to the abstract, andthe reader would be justified to ask “what’s the point?” In fact, con-volutions are capable of transforming images in many useful andconcrete ways, like emphasizing edges and computing gradients ofhue and value. Moreover, deep successions of convolutions havebeen shown to produce image encodings that are favorable for clas-sification, namely due to invariance to translation and deformation[Bruna and Mallat 2012]. But exactly what is computed—and itsusefulness for classification—depends on the filters used, and there-fore success of a convolutional network crucially depends cruciallyon choosing good filters.
3.2 Design Space
Recent success in image classification has come from going deeper:using more filters in more layers. Back-propagation automates thetraining of the filter weights in these deep networks, and with largerdata sets, like ImageNet [ImageNet 2013], deeper and richer mod-els can be trained. But the ease of training deep networks belies thedifficulty of their design.
While we have presented a basic overview of the workings of aconvolutional neural network, we have glossed over several detailsof the network structure that represent design points that model’sbuilder must consider.
Particular parameters that must be tuned include:
• Size of filters - Determining an appropriate size for convo-lutional filters is not a precise science. Too small and thefeatures are in some sense “too coarse”, too large and modelcomplexity explodes with little benefit.
• Number of layers - Additional layers seems to improve modelperformance, but they increase model complexity, and toomany layers may cause the signal-to-noise ratio during back-propagation to be too low for the first few layers to be trainedinto anything useful.
• Filters per layer - Again, models generally perform betterwith more filters, but at what point are diminishing returnsoutweighed by the increased model complexity and trainingtime?
• Layer connectivity - Besides convolutional layers, what othertypes of layers should be used? Some top results have mixedfully-connected and locally-connected layers with convolu-tional ones to great effect [Krizhevsky et al. 2012].
• Initialization - Should we initialize our weights uniformly,randomly, or to some structure? Does it make a difference?
• Auxiliary layers - The choice of pooling and normalizationfunction can have a significant impact on model accuracy, andeach comes bundled with several numeric parameters. Howdo you tune them?
• Non-linear functions - Surprisingly, the choice of what non-linearity to apply after a convolution can have dramatic impacton training run-time performance. Indeed, [Krizhevsky et al.2012] note that the use of the “relu” non-linearity instead ofthe sigmoid function makes a large difference in their models’performance.
• Optimization parameters - As with any ML model, learningparameters like step size and regularization must be tuned tomaximize accuracy and convergence speed. Algorithms likeAdaGrad [Duchi et al. 2011] are often used to manage someof these parameters, functional dependencies between param-eters can make tuning difficult.
All of these parameters can have a dramatic impact on model per-formance and complexity. By offering visual tools to explore theeffects of these design decisions, deepViz enables users to ex-plore the design space without “shooting in the dark” or trying allpermutations of these possible choices.
4 Architecture
Our system consists of several components that work together todrive the interactive visual display. We make use of several exter-nal libraries - in particular, cudaconvnet[Krizhevsky 2012] anddecaf[Donahue et al. 2013] provide the basic framework for load-ing, training, and displaying components of convolutional neuralnetworks. Python’s [NumPy ] and [scikit.learn ] libraries providetools for linear algebra, multidimensional array manipulation, andclustering. We make heavy use of [jQuery ], [Bootsrap ], [D3 ], and[Vega ] to produce interactive data displays.
4.1 Model Training and Snapshotting
Before we can visualize a model, we must train it. One of our goalsis to understand how models change over the course of their trainingprocess, so we capture snapshots of the state of the model at severalpoints during training.
We train our models using cudaconvnet, a GPU-accelerated li-brary for training CNNs. This tool provides an excellent platformfor training convolutional models with fairly general architectures.
To collect the data required for our visualizations, we instrumentedcudaconvnet to dump complete snapshots of the model to diskseveral times during training.
To ensure that our visualizations show the current state of the art inimage classification networks, we trained our models according to[Krizhevsky 2012] using the CIFAR-10 dataset.
4.2 Model Queries and Visualization Generation
Our system’s data model for convolutional neural networks consistsof four basic components: checkpoints, layers, filters, and channels.Models have identical structure across checkpoints, although thelearned weights may vary from checkpoint to checkpoint. Eachlayer has a different number of channels and filters associated withit.
Internally, our system allows the user to specify either a single pointin this space or a set of points (often defined by a range). If a rangeis not specified, all points along a particular axis are returned bydefault. This means that if a user asks for ‘checkpoint 1’, then alllayers, filters, and channels of that checkpoint are returned as a sin-gle object. If a user selects a single layer and checkpoint, then onlya single image is returned by the back end. If several are selected,then the result is displayed as a collection of images.
For performance, each layer is rendered as a single image. Insteadof dealing with thousands of tiny images, the browser only needs todeal with a few large ones. In our description of the front end, wewill discuss how we enable interaction with individual componentseach of these images.
Optionally, a user may ask to apply a selected subset of the modelto an input image. In this case, the query semantics are identical,except that a user must specify which image from the image corpusto apply the model to. Our system then (using decaf) applies themodel to the input image, and retrieves the output activations of theimage at each selected layer.
4.2.1 Image Corpus
We provide the user the ability to specify an image corpus thatcan be used to provide visual examples of model behavior, asabove. This corpus is also used to calculate model statistics and todrive image-specific visualizations, like the Confusion Matrix. Wehave implemented a corpus layer that interacts with the CIFAR-10dataset, but this architecture is extensible and it will be easy to addsupport for additional image corpora.
4.2.2 Rendering Visualizations
Regardless of the mode the user chooses, our system uses decafto render visualizations. Internally, decaf takes the convolu-tional layers, normalizes them, and then visualizes them on a grid- typically displaying filters in rows with each channel shown ina separate column. This is an instance of visualizing small multi-ples [Tufte 1991], with position encoding pieces of the model struc-ture.
One consideration that we have not incorporated yet is decaf’sfilter image normalization strategy. While their normalization strat-egy is appropriate when displaying a single layer, it may cause someinformation loss when displaying layers over time. That is, wewould rather see the layers globally normalized across all modelcheckpoints, as it would more accurately show model transitionsover time. We leave this as future work.
We make use of decaf’s graph representation of the network todraw a graph that displays the structure of the network and the con-nectivity between its layers.
4.3 Statistics Engine
Several of our visualizations require model statistics that must becomputed on the full training set. The models and corpora are quitelarge, so computing it’s unrealistic to compute these in an onlinemanner. Instead, we provide an engine to compute statistics inbatches and save them to a database. This database is queried viathe same web service that powers our filter visualizations.
Currently, the statistics engine calculates the following statisticsover the corpus at each time step: the set of class probabilitiesby image, a confusion matrix indicating counts of predicted/ac-tual class for all class pairs over all images, an index of imagesby the combination of their predicted/actual classes, and a set of
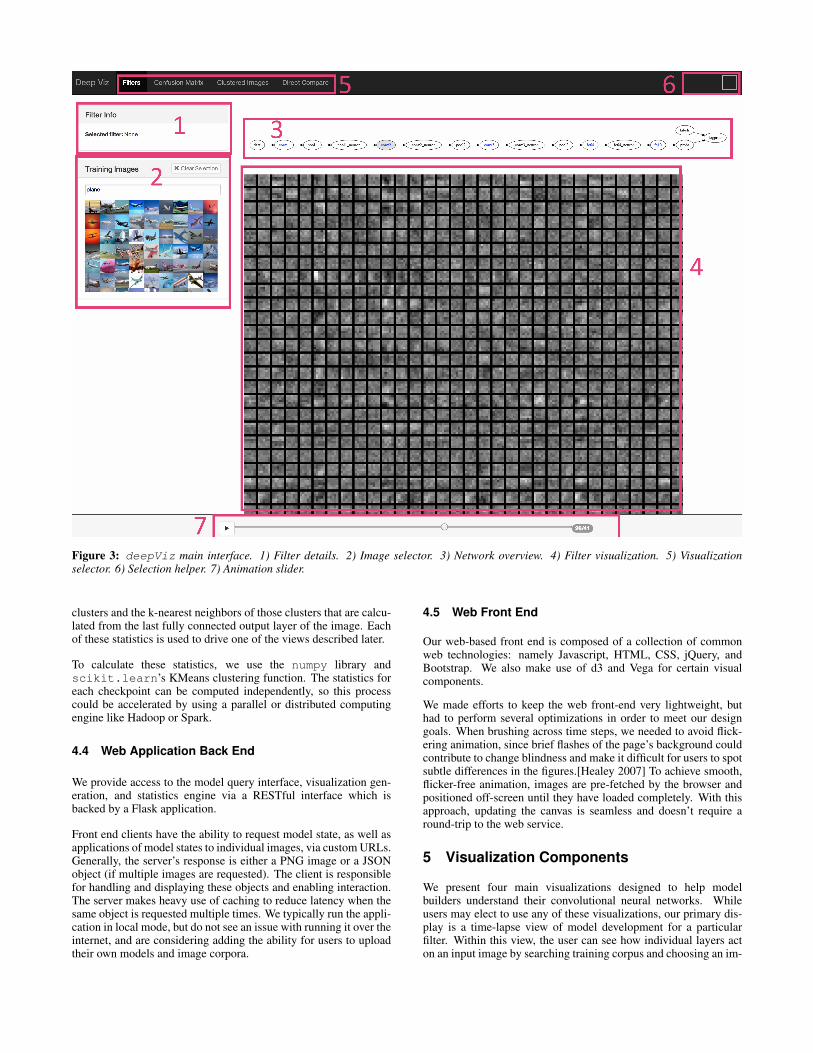
Figure 3: deepViz main interface. 1) Filter details. 2) Image selector. 3) Network overview. 4) Filter visualization. 5) Visualizationselector. 6) Selection helper. 7) Animation slider.
clusters and the k-nearest neighbors of those clusters that are calcu-lated from the last fully connected output layer of the image. Eachof these statistics is used to drive one of the views described later.
To calculate these statistics, we use the numpy library andscikit.learn’s KMeans clustering function. The statistics foreach checkpoint can be computed independently, so this processcould be accelerated by using a parallel or distributed computingengine like Hadoop or Spark.
4.4 Web Application Back End
We provide access to the model query interface, visualization gen-eration, and statistics engine via a RESTful interface which isbacked by a Flask application.
Front end clients have the ability to request model state, as well asapplications of model states to individual images, via custom URLs.Generally, the server’s response is either a PNG image or a JSONobject (if multiple images are requested). The client is responsiblefor handling and displaying these objects and enabling interaction.The server makes heavy use of caching to reduce latency when thesame object is requested multiple times. We typically run the appli-cation in local mode, but do not see an issue with running it over theinternet, and are considering adding the ability for users to uploadtheir own models and image corpora.
4.5 Web Front End
Our web-based front end is composed of a collection of commonweb technologies: namely Javascript, HTML, CSS, jQuery, andBootstrap. We also make use of d3 and Vega for certain visualcomponents.
We made efforts to keep the web front-end very lightweight, buthad to perform several optimizations in order to meet our designgoals. When brushing across time steps, we needed to avoid flick-ering animation, since brief flashes of the page’s background couldcontribute to change blindness and make it difficult for users to spotsubtle differences in the figures.[Healey 2007] To achieve smooth,flicker-free animation, images are pre-fetched by the browser andpositioned off-screen until they have loaded completely. With thisapproach, updating the canvas is seamless and doesn’t require around-trip to the web service.
5 Visualization Components
We present four main visualizations designed to help modelbuilders understand their convolutional neural networks. Whileusers may elect to use any of these visualizations, our primary dis-play is a time-lapse view of model development for a particularfilter. Within this view, the user can see how individual layers acton an input image by searching training corpus and choosing an im-
age, which applies the model to that input image and displaying theimage’s activations at the selected filter layer.
All of our visualizations focus on helping users understand howthe model changes over the course of training. That is, each viewprovides some notion of viewing and comparing models acrosstime steps. We feel that this is an important and differentiatingcharacteristic of our work which may enable new insights into themodel training process. The additional visualizations serve as sup-porting information to help the user assess hypotheses about thecause of certain types of errors and understand the interaction be-tween classes. Several of these visualization components are gen-eral enough to be used with other types of image classification sys-tems. For example - the confusion matrix with small multiples ofimages would be a useful feature to have in any pipeline that in-volves multinomial classification.
All visualizations are displayed using a 3-layer model trained on theCIFAR-10[Krizhevsky et al. ] dataset based on [Krizhevsky 2012].The images displayed come from this training set.
5.1 Filters
Our system’s main user interface is shown in Figure 3. At the bot-tom of the window is timeline control that supports pause, play,rewind, and sliding interactions. All of our views update in re-sponse to the current timeline value. These animated views allowusers to see how the model evolves over time—in particular, es-pecially at the early layers, we can easily observe how structureemerges. Indeed, the filter layers at this early stage end up look-ing much like Gabor filters [Movellan ], which have used for yearsas featurizers for image classification algorithms. They can be in-terpreted as scale- and rotational-invariant edge detectors, an effectthat we can see in Figure 1. It is important to note that the modelconverges on these filters automatically as part of the training pro-cess.
The top of the page displays a graphical representation of the neuralnetwork’s layers. Nodes in this network may be selected with themouse in order to choose which layer’s filters are displayed in themain view.
Details about the currently displayed filters are provided in theupper-left corner of the display. Useful information like filter andchannel position, as well as values of the current filter currentlypopulate this display. In the future, this view might display infor-mation, such as the current filter’s functional dependencies and therelative importance of its activation to each image class.
We provide a search interface for the image training corpus thatallows users to search for and select images to pass through the net-work. In 1, we have searched for the word “plane” and selected apicture of an airplane. Our selected image is passed through thecurrent model snapshot and we can visualize the output at eachconvolutional layer. Users can also click on images displayed inother views to select them. The sidebar displays a histogram of themodel’s predicted classes for the selected image. A more compactversion of this histogram is displayed in the top-right corner of thepage and is present in each of our four views. This mini-histogramallows users to quickly get a sense of the model’s confidence in itspredictions, which can be useful when using other views to inspectmisclassified images.
5.2 Confusion Matrix
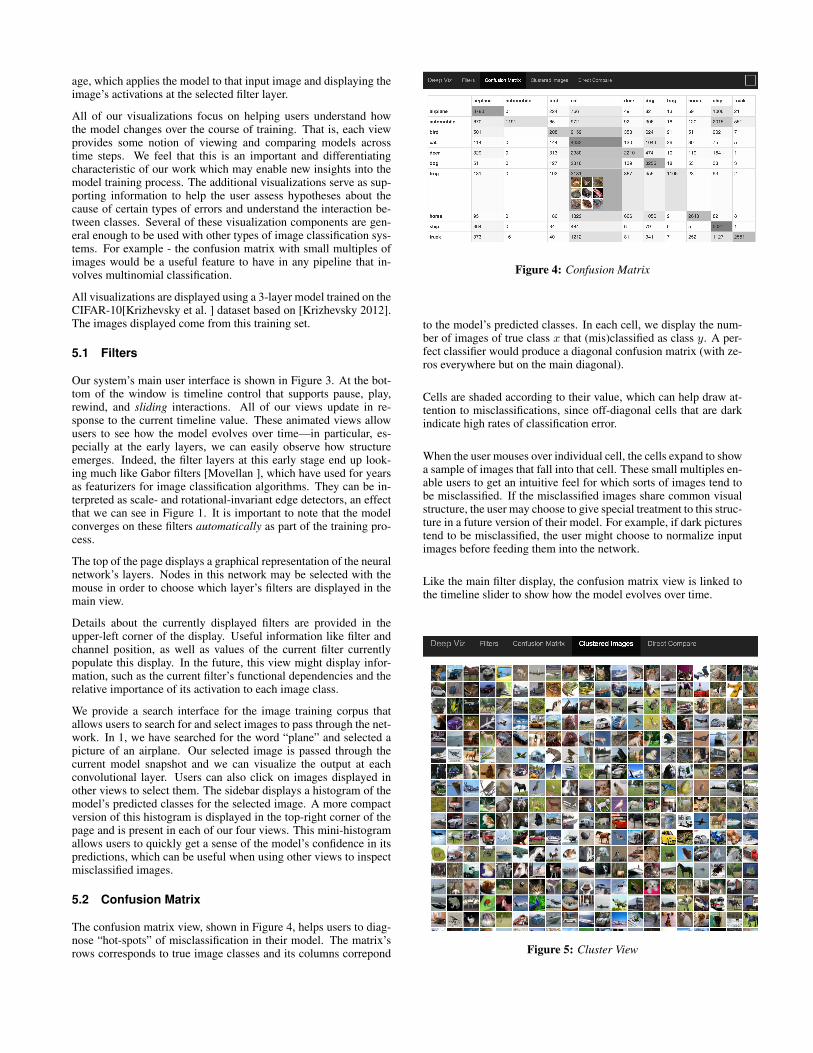
The confusion matrix view, shown in Figure 4, helps users to diag-nose “hot-spots” of misclassification in their model. The matrix’srows corresponds to true image classes and its columns correpond
Figure 4: Confusion Matrix
to the model’s predicted classes. In each cell, we display the num-ber of images of true class x that (mis)classified as class y. A per-fect classifier would produce a diagonal confusion matrix (with ze-ros everywhere but on the main diagonal).
Cells are shaded according to their value, which can help draw at-tention to misclassifications, since off-diagonal cells that are darkindicate high rates of classification error.
When the user mouses over individual cell, the cells expand to showa sample of images that fall into that cell. These small multiples en-able users to get an intuitive feel for which sorts of images tend tobe misclassified. If the misclassified images share common visualstructure, the user may choose to give special treatment to this struc-ture in a future version of their model. For example, if dark picturestend to be misclassified, the user might choose to normalize inputimages before feeding them into the network.
Like the main filter display, the confusion matrix view is linked tothe timeline slider to show how the model evolves over time.
Figure 5: Cluster View
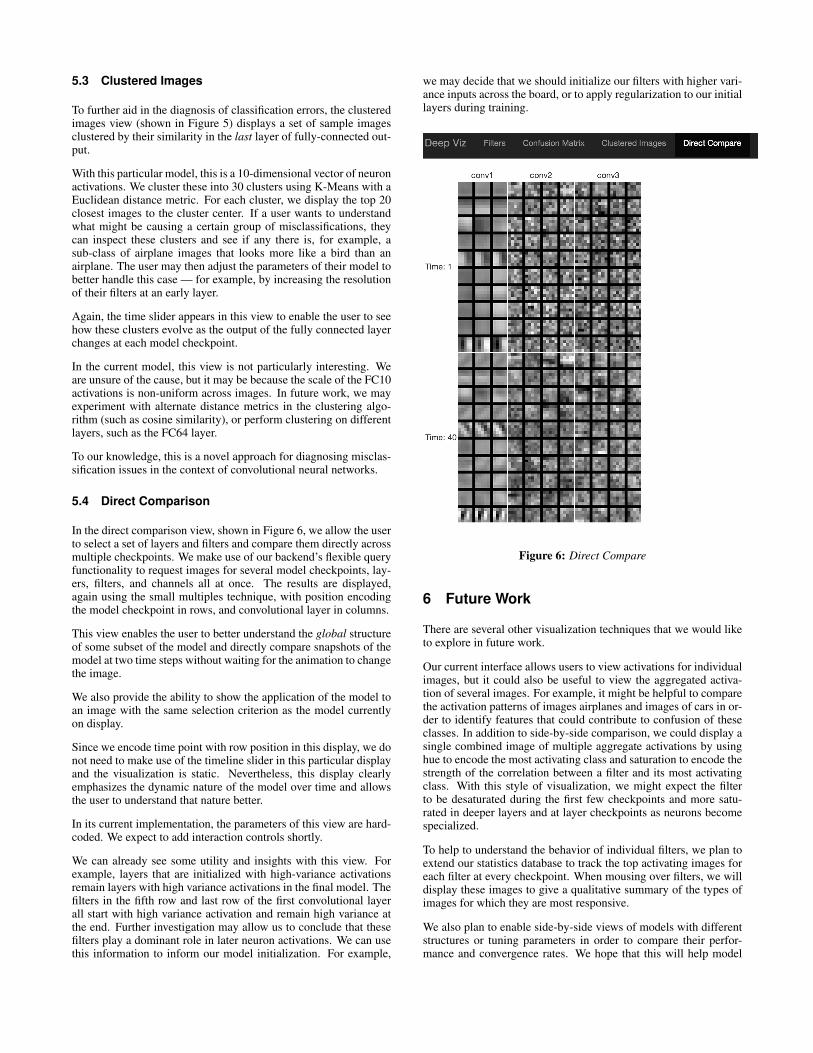
5.3 Clustered Images
To further aid in the diagnosis of classification errors, the clusteredimages view (shown in Figure 5) displays a set of sample imagesclustered by their similarity in the last layer of fully-connected out-put.
With this particular model, this is a 10-dimensional vector of neuronactivations. We cluster these into 30 clusters using K-Means with aEuclidean distance metric. For each cluster, we display the top 20closest images to the cluster center. If a user wants to understandwhat might be causing a certain group of misclassifications, theycan inspect these clusters and see if any there is, for example, asub-class of airplane images that looks more like a bird than anairplane. The user may then adjust the parameters of their model tobetter handle this case — for example, by increasing the resolutionof their filters at an early layer.
Again, the time slider appears in this view to enable the user to seehow these clusters evolve as the output of the fully connected layerchanges at each model checkpoint.
In the current model, this view is not particularly interesting. Weare unsure of the cause, but it may be because the scale of the FC10activations is non-uniform across images. In future work, we mayexperiment with alternate distance metrics in the clustering algo-rithm (such as cosine similarity), or perform clustering on differentlayers, such as the FC64 layer.
To our knowledge, this is a novel approach for diagnosing misclas-sification issues in the context of convolutional neural networks.
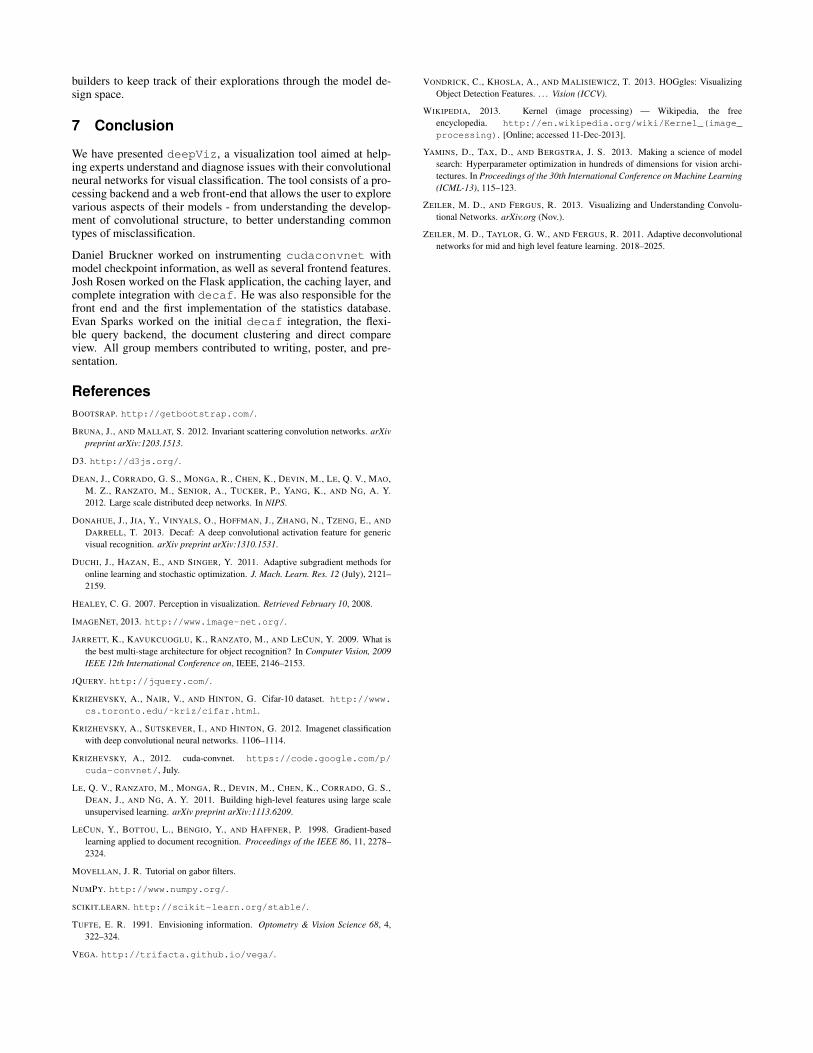
5.4 Direct Comparison
In the direct comparison view, shown in Figure 6, we allow the userto select a set of layers and filters and compare them directly acrossmultiple checkpoints. We make use of our backend’s flexible queryfunctionality to request images for several model checkpoints, lay-ers, filters, and channels all at once. The results are displayed,again using the small multiples technique, with position encodingthe model checkpoint in rows, and convolutional layer in columns.
This view enables the user to better understand the global structureof some subset of the model and directly compare snapshots of themodel at two time steps without waiting for the animation to changethe image.
We also provide the ability to show the application of the model toan image with the same selection criterion as the model currentlyon display.
Since we encode time point with row position in this display, we donot need to make use of the timeline slider in this particular displayand the visualization is static. Nevertheless, this display clearlyemphasizes the dynamic nature of the model over time and allowsthe user to understand that nature better.
In its current implementation, the parameters of this view are hard-coded. We expect to add interaction controls shortly.
We can already see some utility and insights with this view. Forexample, layers that are initialized with high-variance activationsremain layers with high variance activations in the final model. Thefilters in the fifth row and last row of the first convolutional layerall start with high variance activation and remain high variance atthe end. Further investigation may allow us to conclude that thesefilters play a dominant role in later neuron activations. We can usethis information to inform our model initialization. For example,
we may decide that we should initialize our filters with higher vari-ance inputs across the board, or to apply regularization to our initiallayers during training.
Figure 6: Direct Compare
6 Future Work
There are several other visualization techniques that we would liketo explore in future work.
Our current interface allows users to view activations for individualimages, but it could also be useful to view the aggregated activa-tion of several images. For example, it might be helpful to comparethe activation patterns of images airplanes and images of cars in or-der to identify features that could contribute to confusion of theseclasses. In addition to side-by-side comparison, we could display asingle combined image of multiple aggregate activations by usinghue to encode the most activating class and saturation to encode thestrength of the correlation between a filter and its most activatingclass. With this style of visualization, we might expect the filterto be desaturated during the first few checkpoints and more satu-rated in deeper layers and at layer checkpoints as neurons becomespecialized.
To help to understand the behavior of individual filters, we plan toextend our statistics database to track the top activating images foreach filter at every checkpoint. When mousing over filters, we willdisplay these images to give a qualitative summary of the types ofimages for which they are most responsive.
We also plan to enable side-by-side views of models with differentstructures or tuning parameters in order to compare their perfor-mance and convergence rates. We hope that this will help model
builders to keep track of their explorations through the model de-sign space.
7 Conclusion
We have presented deepViz, a visualization tool aimed at help-ing experts understand and diagnose issues with their convolutionalneural networks for visual classification. The tool consists of a pro-cessing backend and a web front-end that allows the user to explorevarious aspects of their models - from understanding the develop-ment of convolutional structure, to better understanding commontypes of misclassification.
Daniel Bruckner worked on instrumenting cudaconvnet withmodel checkpoint information, as well as several frontend features.Josh Rosen worked on the Flask application, the caching layer, andcomplete integration with decaf. He was also responsible for thefront end and the first implementation of the statistics database.Evan Sparks worked on the initial decaf integration, the flexi-ble query backend, the document clustering and direct compareview. All group members contributed to writing, poster, and pre-sentation.
ReferencesBOOTSRAP. http://getbootstrap.com/.
BRUNA, J., AND MALLAT, S. 2012. Invariant scattering convolution networks. arXivpreprint arXiv:1203.1513.
D3. http://d3js.org/.
DEAN, J., CORRADO, G. S., MONGA, R., CHEN, K., DEVIN, M., LE, Q. V., MAO,M. Z., RANZATO, M., SENIOR, A., TUCKER, P., YANG, K., AND NG, A. Y.2012. Large scale distributed deep networks. In NIPS.
DONAHUE, J., JIA, Y., VINYALS, O., HOFFMAN, J., ZHANG, N., TZENG, E., AND
DARRELL, T. 2013. Decaf: A deep convolutional activation feature for genericvisual recognition. arXiv preprint arXiv:1310.1531.
DUCHI, J., HAZAN, E., AND SINGER, Y. 2011. Adaptive subgradient methods foronline learning and stochastic optimization. J. Mach. Learn. Res. 12 (July), 2121–2159.
HEALEY, C. G. 2007. Perception in visualization. Retrieved February 10, 2008.
IMAGENET, 2013. http://www.image-net.org/.
JARRETT, K., KAVUKCUOGLU, K., RANZATO, M., AND LECUN, Y. 2009. What isthe best multi-stage architecture for object recognition? In Computer Vision, 2009IEEE 12th International Conference on, IEEE, 2146–2153.
JQUERY. http://jquery.com/.
KRIZHEVSKY, A., NAIR, V., AND HINTON, G. Cifar-10 dataset. http://www.cs.toronto.edu/˜kriz/cifar.html.
KRIZHEVSKY, A., SUTSKEVER, I., AND HINTON, G. 2012. Imagenet classificationwith deep convolutional neural networks. 1106–1114.
KRIZHEVSKY, A., 2012. cuda-convnet. https://code.google.com/p/cuda-convnet/, July.
LE, Q. V., RANZATO, M., MONGA, R., DEVIN, M., CHEN, K., CORRADO, G. S.,DEAN, J., AND NG, A. Y. 2011. Building high-level features using large scaleunsupervised learning. arXiv preprint arXiv:1113.6209.
LECUN, Y., BOTTOU, L., BENGIO, Y., AND HAFFNER, P. 1998. Gradient-basedlearning applied to document recognition. Proceedings of the IEEE 86, 11, 2278–2324.
MOVELLAN, J. R. Tutorial on gabor filters.
NUMPY. http://www.numpy.org/.
SCIKIT.LEARN. http://scikit-learn.org/stable/.
TUFTE, E. R. 1991. Envisioning information. Optometry & Vision Science 68, 4,322–324.
VEGA. http://trifacta.github.io/vega/.
VONDRICK, C., KHOSLA, A., AND MALISIEWICZ, T. 2013. HOGgles: VisualizingObject Detection Features. . . . Vision (ICCV).
WIKIPEDIA, 2013. Kernel (image processing) — Wikipedia, the freeencyclopedia. http://en.wikipedia.org/wiki/Kernel_(image_processing). [Online; accessed 11-Dec-2013].
YAMINS, D., TAX, D., AND BERGSTRA, J. S. 2013. Making a science of modelsearch: Hyperparameter optimization in hundreds of dimensions for vision archi-tectures. In Proceedings of the 30th International Conference on Machine Learning(ICML-13), 115–123.
ZEILER, M. D., AND FERGUS, R. 2013. Visualizing and Understanding Convolu-tional Networks. arXiv.org (Nov.).
ZEILER, M. D., TAYLOR, G. W., AND FERGUS, R. 2011. Adaptive deconvolutionalnetworks for mid and high level feature learning. 2018–2025.