deer database: 2011 update documentation · deer database: 2011 update documentation . appendices ....
TRANSCRIPT
DEER Database:
2011 Update Documentation
Appendices
Submitted to:
Peter Lai California Public Utility Commission
505 Van Ness Avenue San Francisco, CA
Submitted by:
Itron, Inc. 1111 Broadway, Suite 1800 Oakland, California 94607
(510) 844-2800
With assistance from:
KEMA JJ Hirsh
November 8, 2011

Itron, Inc. i Table of Contents
Table of Contents
Appendix A-1 DEER Measure Database Updates .............................................. A-1
Appendix A-2 Methodology .............................................................................. A-2-1
Appendix A-3 Commercial HVAC..................................................................... A-3-1
Appendix A-4 Commercial Refrigeration ........................................................ A-4-1
Appendix A-5 Residential HVAC ...................................................................... A-5-1
Appendix A-6 Residential & Non-Residential Water Heating ........................ A-6-1
Appendix A-7 Residential Appliances ............................................................. A-7-1
Itron, Inc. A-1 Appendix A-1
Appendix A-1
DEER Measure Database Updates Measure content, modeling method, model input parameter, and database format changes (Version 4.00 first release in November 2011) This document last updated 8 November 2011 Version 4.00 of the DEER measure database is the update to the mid-December DEER 2008 release for 2009-2011 Energy Efficiency Planning/Reporting (DEER v2.05). It was created with a new version of the DEER measure analysis software (MAS). The new MAS tool includes a number of changes and additions to the previous version that results in an improved and expanded DEER measure database. The database structure and the database viewing tool, MISer, have also been updated for this database release. Changes to the MAS tool were made to either fix simulation errors or to improve the processing of hourly simulation data for the determination of demand impacts. In addition, the MAS tool was expanded to include additional measures and additional measure base cases that were requested by the utilities. Outline of Contents: DEER Measure Database Updates...................................................................................... 1
Changes to the MAS tool ................................................................................................ 3 Large Office primary lighting schedule ...................................................................... 3 Nonresidential indoor lighting operating hours and coincident demand factors ........ 3 Boiler Sizing ............................................................................................................... 5 Hot Water Storage Heater Sizing ................................................................................ 5 Packaged HVAC specifications .................................................................................. 5 Oldest building vintage HVAC system performance ................................................. 6 Economizer set point................................................................................................... 6 DOE2.2 bug fixes........................................................................................................ 6 T12 linear fluorescent baseline fixtures ...................................................................... 6 Residential Interior Lighting Profile for CFLs ........................................................... 8 Residential Interior CFL Operating Hours and Coincident Demand Factors ............. 9 Residential Exterior CFL Lighting Operating Hours................................................ 10 Residential CFL Lighting Wattage Reduction .......................................................... 10 Residential Refrigerator Equipment Rating set point ............................................... 11 Peak-Period Demand Issues ...................................................................................... 11
Additions to the DEER database................................................................................... 12 • Non-residential lighting fixtures ........................................................................ 12 • Updates for Code Baselines Based on EPACT and 2008 Title 24: ................... 12 • Clothes washer and dishwasher measures .......................................................... 12 • Residential multi-family prototype .................................................................... 12

Database for Energy Efficiency Resources: 2011 Update
Itron, Inc. A-2 Appendix A-1
• Residential and nonresidential high efficiency heat pump measures ................. 12 • Residential insulation retrofit ............................................................................. 12 • Agricultural greenhouse retrofit ......................................................................... 13 • Select non-updated results from DEER2005 retired .......................................... 13
Changes to the DEER database Structure ..................................................................... 13 Changes to the DEER Results....................................................................................... 14 Appendix – Lighting Operating Hours and Coincident Demand Factors ..................... 24 Appendix – Status of 2005 DEER Measures ................................................................ 26

Database for Energy Efficiency Resources: 2011 Update
Itron, Inc. A-3 Appendix A-1
Changes to the MAS tool The changes described here are typically due to errors discovered in the previous MAS tool. Some of the errors were simply incorrect building prototype specifications, such as an incorrect schedule or an inappropriate equipment size. Other fixes were made in order to make the calculation of demand impacts more robust.
Large Office primary lighting schedule The primary lighting schedule associated with linear fluorescent fixtures had been (incorrectly) set to the secondary schedule associated with CFL fixtures. The result was that the linear fluorescent fixtures were “on” more hours than intended, but with a decreased coincident demand. The end-use demand impacts increased by 14% due to this change while the annual electric end-use impacts decreased by 10%. The table under the next heading provides the complete listing of lighting operating hours by building type and lighting technology type. Nonresidential indoor lighting operating hours and coincident demand factors All lighting UES values are now based on a consistent set of lighting operating hours and coincident demand factors (CDFs) for the entire building. Whole building operating hours and CDFs had previously been provided by activity area within each DEER building type. The operating hours and CDFs provided in the tables below are exact values, calculated from the energy simulation results using the following relationship:
Operating Hours = Whole Building kWH Lighting Savings Whole Building Connected Lighting kW Reduction
The 2008 DEER update documentation included a table of operating hours by activity area within each DEER building type. These values were an approximation of operating hours based on hand calculations of each daily profile to an entire year and were not accurate for some building types. Additionally the table in the 2008 DEER update documentation did not include operating hours for the entire building. DEER v4.00 requires the following tables as well as the complete tables of CDFs included in the appendix to be used for calculating lighting UES values for DEER building types.

Database for Energy Efficiency Resources: 2011 Update
Itron, Inc. A-4 Appendix A-1
DEER v4.00 Linear Fluorescent and High Bay Opereating Hours
* CDF values presented in ranges have different CDFs by climate zone. Refer to the appendix for complete list of CDFs
Building TypeOperating
Hours CDF (range)*Assembly 2610 0.53Primary School 2140 0.02 - 0.62Secondary School 2280 0.02 - 0.71Community College 2420 0.02 - 0.81University 2350 0.03 - 0.72Relocatable Classroom 2480 0.02 - 0.7Grocery 4910 0.69Hospital 5260 0.83Nursing Home 4160 0.68Hotel 1950 0.24Motel 1550 0.17Bio/Tech Manuf. 3530 0.85Light Industrial Manuf. 3220 0.92Large Office 2640 0.71Small Office 2590 0.69Sit-Down Restaurant 4830 0.80Fast-Food Restaurant 4840 0.81Department Store 3380 0.76Big Box Retail 4270 0.85Small Retail 3380 0.88Conditioned Storage 3420 0.70Unconditioned Storage 3420 0.70Refrigerated Warehouse 4770 0.56
LINEAR FLUORESCENT AND HIGH BAY FIXTURES
Database for Energy Efficiency Resources: 2011 Update
Itron, Inc. A-5 Appendix A-1
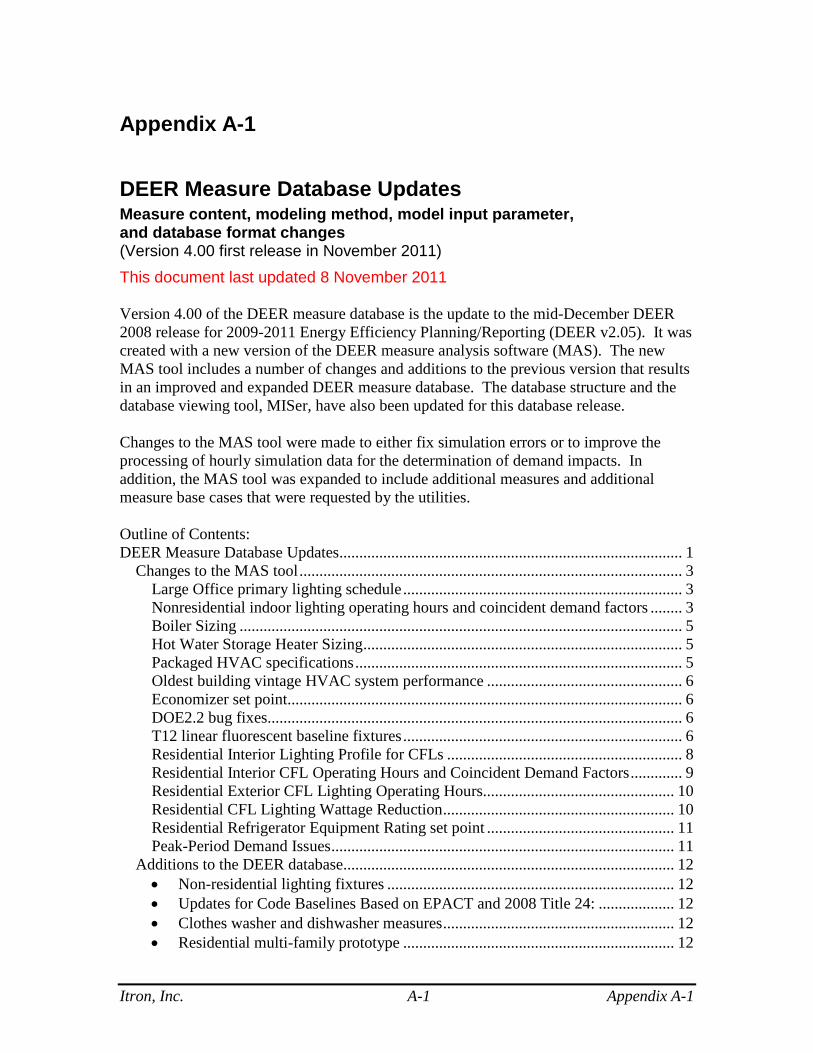
DEER v4.00 Compact Fluorescent Lamp Operating Hours
* CDF values presented in ranges have different CDFs by climate zone. Refer to the appendix for complete list of CDFs Boiler Sizing The sizing method used for the HVAC boilers resulted in boilers over-sized by 50 - 100% in the older vintage buildings. The performance of these boilers operating at low part-load caused an over-statement of the heating energy required to compensate for reduced internal loads (such as associated with indoor lighting measures). Hot Water Storage Heater Sizing The size of the commercial hot water storage heaters was increased by 25% to account for lower mains water temperature in the winter months. In some building types and in some climate zones, the demand for water heating exceeded the specified capacity for long periods of time.
Packaged HVAC specifications The single-phase and three-phase distinction for SEER-rated packaged HVAC equipment (SEER 12, 13 and 14) has been eliminated. There are still entries in the
Building TypeOperating
Hours CDF (range)*Assembly 2300 0.41Primary School 2240 0.02 - 0.63Secondary School 2330 0.02 - 0.72Community College 2420 0.02 - 0.81University 2370 0.03 - 0.72Relocatable Classroom 2600 0.02 - 0.73Grocery 3890 0.49Hospital 4200 0.72Nursing Home 3570 0.56Hotel 1670 0.20Motel 1370 0.15Bio/Tech Manuf. 3090 0.78Light Industrial Manuf. 2580 0.78Large Office 3000 0.63Small Office 2980 0.68Sit-Down Restaurant 4830 0.80Fast-Food Restaurant 4810 0.81Department Store 3710 0.63Big Box Retail 4350 0.69Small Retail 4010 0.70Conditioned Storage 2760 0.57Unconditioned Storage 2760 0.57Refrigerated Warehouse 4730 0.55
COMPACT FLUORESCENT LAMPS
Database for Energy Efficiency Resources: 2011 Update
Itron, Inc. A-6 Appendix A-1
database for three-phase units, but their performance and energy impact results are the same as for the units that do not specify the phase distinction. Revisions to the CEE tier 1, 2 and 3 efficiency levels have affected the EER rating of three packaged HVAC measures. The 10 EER unit in the size range from 240 – 760 kBTU/hr was changed to a 9.8 EER rated unit. In the size range greater than 760 kBTU/hr, the 9.7 and 10 EER units were changed to 9.5 and 9.7 EER, respectively.
Oldest building vintage HVAC system performance Analysis of CEUS data indicates that many older vintage building have updated HVAC systems and that these older buildings are not well represented by a constant volume HVAC system, as was assumed for the oldest vintage DEER prototypes. Built-up HVAC system in the oldest vintage buildings are now modeled as a combination of constant volume and variable volume systems, represented by an variable air volume HVAC system with a high minimum flow rate (60% minimum flow).
Economizer set point The controls for the economizer have been changed in climate zones CZ01, CZ03 and CZ05. In these climate zones, standard control settings allowed the economizer to be used during the peak cooling period, causing a large peak latent cooling load. Though compliant with the Title-24 ACM specifications, it is unlikely that an economizer would be utilized in a way that increases the peak demand. The economizer set point temperature, above which the outside air is forced to its minimum flow rate, was lowered to 70 °F from 75 °F in these climate zones. This change results in more appropriate (i.e. smaller) design chiller size in these climate zones, especially in the older vintage buildings. DOE2.2 bug fixes These changes to the measure analysis software tool were prompted by an update to the DOE2.2 simulation engine that is used in the DEER MAS tool. The following fixes were identified as having some impact on the DEER measure results; there may be other bug fixes included in the update of the DOE2.2 simulation engine that do not affect the DEER results. Fix that affects the outside air volume associated with duct leakage: this mainly
impacts the mobile home duct measures but has a small effect on the single-family and multi-family prototypes as well. DOE2.2 was previously over accounting for outside make-up air associated with duct losses to unconditioned spaces (in both base and measure cases). Non-commercial buildings were not impacted by this fix.
Fix regarding default minimum heating flow rates. In some cases, the default zone minimum heating flow rate did not default to the system minimum heating flow rate as was intended. The impact of this fix on the DEER results is minor.
Fix that corrects an error with the calculation of the heat load due to lighting fixtures under specific circumstances of zoning and lighting system configuration. All of the results in the “Lighting Workbook” are based on simulations that include this DOE2.2 source code correction.
T12 linear fluorescent baseline fixtures Input power for T12 linear fluorescent baseline fixtures were updated to reflect USDOE ballast efficacy requirements enacted in 1990.

Database for Energy Efficiency Resources: 2011 Update
Itron, Inc. A-7 Appendix A-1
Minimum efficiency requirements for magnetic ballasts were adopted as part of EPACT in 1990. Ballasts covered by these standards are often called “Energy Efficient” or “ES” magnetic ballasts. These minimum efficiency requirements were updated again in 2005. The new requirements essentially prohibited the inclusion of ES magnetic ballasts in any new fixtures. However, the standard did allow the shipment of ES magnetic ballasts for repair or replacement purposes.
In 2010 EPACT prohibited the manufacture or import for sale of any T12 magnetic ballasts. Most importantly, EPACT 1990 required ES magnetic ballasts for all nonresidential applications. Pre-EPACT (pre-1990) fixtures that were installed with standard magnetic ballasts would need to have survived without any ballast replacements for twenty three years by 2013. Ballast replacements would have utilized either an ES ballast in the 1990’s or a hybrid or electronic ballast in the 2000-2010 period and since 2010 an electronic ballast.
During this same time period (especially post 1990’s) the standard lamp/ballast and fixture retrofits have become T8 lamps with electronic ballasts and the prices and availability of electronic ballasts compatible with the T12 lamps has allowed them to become the normal repair choice. For these reasons, baseline wattages of fixtures in the DEER lighting fixture table that include pre-EPACT magnetic ballasts have been revised to assume ES magnetic ballasts. The table provides a sample of these fixture power revisions for 4 and 8 foot 2-lamp fixtures.
Changes to DEER T12 Linear Fluorescent Fixture Watts for STD to ES Magnetic Ballasts
The table below provides show how the above described changes to the baseline fixture wattages for typical early retirement retrofit measures will reduce the per fixture wattage change pre-retrofit versus post-retrofit. This value can be similar to the reduction in measure savings from this baseline change.
Fixture Lamp Lamp Lamps Lamp Ballast BallastsCode Type Size per Fixture Code Type per Fixture 2008 2011
F41EIS T12 48 inch 1 F48T12/ES Mag-STD 1 51 43F41SIS/T2 T12 48 inch 1 F40T12 Mag-STD 2 52 44
F41SIS T12 48 inch 1 F40T12 Mag-STD 1 60 48F42EIS T12 48 inch 2 F34T12/ES Mag-STD 2 82 72F42SIS T12 48 inch 2 F40T12 Mag-STD 2 84 74F43EIS T12 48 inch 3 F48T12/ES Mag-STD 1 133 109F43SIS T12 48 inch 3 F40T12 Mag-STD 1 136 112
F81ES/T2 T12 96 inch 1 F96T12/ES Mag-STD 2 64 62F81ES T12 96 inch 1 F96T12/ES Mag-STD 1 75 64
F81EHS T12 96 inch 1 F96T12/HO/ES Mag-STD 1 112 105F82ES T12 96 inch 2 F96T12/ES Mag-STD 2 128 123
F82EHS T12 96 inch 2 F96T12/HO/ES Mag-STD 2 227 207F83ES T12 96 inch 3 F96T12/ES Mag-STD 1 + 2 203 185
F83EHE T12 96 inch 3 F96T12/HO/ES Mag-ES/STD 1 + 2 319 312F83EHS T12 96 inch 3 F96T12/HO/ES Mag-STD 1 + 2 380 312F84ES T12 96 inch 4 F96T12/ES Mag-STD 2 256 246
F84EHS T12 96 inch 4 F96T12/HO/ES Mag-STD 2 454 414F86EHS T12 96 inch 6 F96T12/HO/ES Mag-STD 2 721 621
DEER Watts Per Fixture

Database for Energy Efficiency Resources: 2011 Update
Itron, Inc. A-8 Appendix A-1
Reduction in DEER 2008 Measure Wattage Change Due to ES-Magnetic Ballast Baseline
Residential Interior Lighting Profile for CFLs The residential lighting profile used for indoor lighting in general, and for the CFL lamp replacement measure specifically, was reformulated based on the lighting logger study performed by KEMA as part of the evaluation of the 2006-2006 upstream lighting program. The profiles were updated based on a model that projects saturation of CFLs in the year 2013 and are intended to represent the typical hours of use of CFLs in that program year. The figure below compares the average annual CFL usage profiles for DEER v4.00 (2011) and v2.05 (2008).
Typical T12 Linear Fluorescent RetrofitsReduction in Wattage
ChangeFL, (1) 48in, ES IS lamp, Mag, W/fixt=51 ==> FL, (1) 48in, ES T8, Prem IS Bal, W/fixt=24 30%FL, (1) 48in, ES IS lamp, Mag, W/fixt=51 ==> FL, (1) 48in, ES T8, Prem IS Bal, W/fixt=27 33%FL, (1) 48in, ES IS lamp, Mag, W/fixt=51 ==> FL, (1) 48in, T8 lamp, IS EB, W/fixt=31 40%FL, (1) 48in, ES IS lamp, Mag, W/fixt=51 ==> FL, (1) 48in, T8, Prem IS EB, W/fixt=25 31%FL, (1) 48in, ES IS lamp, Mag, W/fixt=51 ==> FL, (1) 48in, T8, Prem IS EB, W/fixt=28 35%FL, (1) 48in, STD IS lamp, Mag, W/fixt=60 ==> FL, (1) 48in, ES T8, Prem IS Bal, W/fixt=24 22%FL, (1) 48in, STD IS lamp, Mag, W/fixt=60 ==> FL, (1) 48in, ES T8, Prem IS Bal, W/fixt=27 24%FL, (1) 48in, STD IS lamp, Mag, W/fixt=60 ==> FL, (1) 48in, T8 lamp, IS EB, W/fixt=31 28%FL, (1) 48in, STD IS lamp, Mag, W/fixt=60 ==> FL, (1) 48in, T8, Prem IS EB, W/fixt=25 23%FL, (1) 48in, STD IS lamp, Mag, W/fixt=60 ==> FL, (1) 48in, T8, Prem IS EB, W/fixt=28 25%FL, (2) 48in, ES IS lamp, Mag, W/fixt=82 ==> FL, (2) 48in, ES T8, Prem IS Bal, W/fixt=45 27%FL, (2) 48in, ES IS lamp, Mag, W/fixt=82 ==> FL, (2) 48in, ES T8, Prem IS Bal, W/fixt=51 32%FL, (2) 48in, ES IS lamp, Mag, W/fixt=82 ==> FL, (2) 48in, T8 lamp, RS EB, W/fixt=54 36%FL, (2) 48in, ES IS lamp, Mag, W/fixt=82 ==> FL, (2) 48in, T8, Prem IS EB, W/fixt=48 29%FL, (2) 48in, ES IS lamp, Mag, W/fixt=82 ==> FL, (2) 48in, T8, Prem IS EB, W/fixt=54 36%FL, (2) 48in, STD IS lamp, Mag, W/fixt=84 ==> FL, (2) 48in, ES T8, Prem IS Bal, W/fixt=45 26%FL, (2) 48in, STD IS lamp, Mag, W/fixt=84 ==> FL, (2) 48in, ES T8, Prem IS Bal, W/fixt=51 30%FL, (2) 48in, STD IS lamp, Mag, W/fixt=84 ==> FL, (2) 48in, T8 lamp, RS EB, W/fixt=54 33%FL, (2) 48in, STD IS lamp, Mag, W/fixt=84 ==> FL, (2) 48in, T8, Prem IS EB, W/fixt=48 28%FL, (2) 48in, STD IS lamp, Mag, W/fixt=84 ==> FL, (2) 48in, T8, Prem IS EB, W/fixt=54 33%FL, (3) 48in, ES IS lamp, Mag, W/fixt=133 ==> FL, (3) 48in, T8 lamp, IS EB, W/fixt=78 44%FL, (3) 48in, STD IS lamp, Mag, W/fixt=136 ==> FL, (3) 48in, T8 lamp, IS EB, W/fixt=78 41%FL, (4) 48in, STD IS lamp, Mag, W/fixt=168 ==> FL, (4) 48in, T8 lamp, IS EB, W/fixt=102 30%

Database for Energy Efficiency Resources: 2011 Update
Itron, Inc. A-9 Appendix A-1
Residential Interior CFL Usage Profile
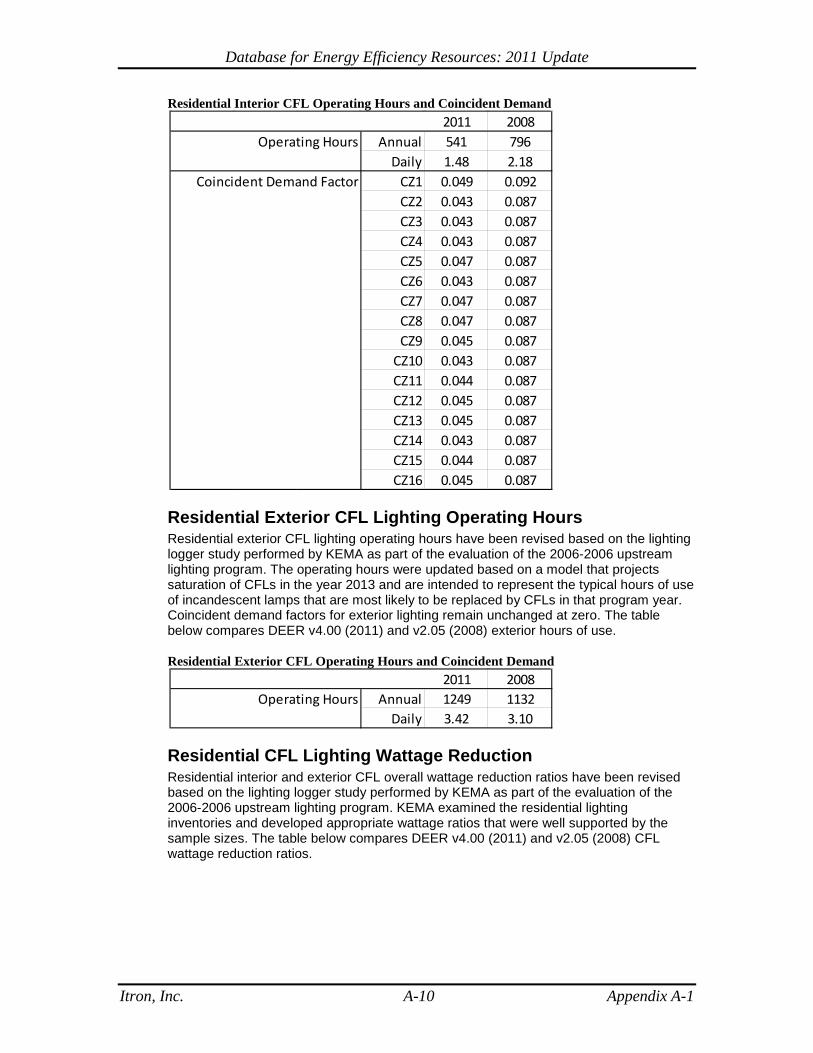
Residential Interior CFL Operating Hours and Coincident Demand Factors The revised interior lighting profiles also result in revised annual operating hours as well as coincident demand factors. The table below compares the 2008 and 2011 values. The table below compares DEER v4.00 (2011) and v2.05 (2008) interior CFL operating hours and CDFs.
0%
5%
10%
15%
20%
25%
1 2 3 4 5 6 7 8 9 10 11 12 13 14 15 16 17 18 19 20 21 22 23 24
Lam
p Pe
rcen
t On
Hour of Day
State_Int_2011
State_Int_2008
Database for Energy Efficiency Resources: 2011 Update
Itron, Inc. A-10 Appendix A-1
Residential Interior CFL Operating Hours and Coincident Demand
Residential Exterior CFL Lighting Operating Hours Residential exterior CFL lighting operating hours have been revised based on the lighting logger study performed by KEMA as part of the evaluation of the 2006-2006 upstream lighting program. The operating hours were updated based on a model that projects saturation of CFLs in the year 2013 and are intended to represent the typical hours of use of incandescent lamps that are most likely to be replaced by CFLs in that program year. Coincident demand factors for exterior lighting remain unchanged at zero. The table below compares DEER v4.00 (2011) and v2.05 (2008) exterior hours of use.
Residential Exterior CFL Operating Hours and Coincident Demand
Residential CFL Lighting Wattage Reduction Residential interior and exterior CFL overall wattage reduction ratios have been revised based on the lighting logger study performed by KEMA as part of the evaluation of the 2006-2006 upstream lighting program. KEMA examined the residential lighting inventories and developed appropriate wattage ratios that were well supported by the sample sizes. The table below compares DEER v4.00 (2011) and v2.05 (2008) CFL wattage reduction ratios.
2011 2008Operating Hours Annual 541 796
Daily 1.48 2.18Coincident Demand Factor CZ1 0.049 0.092
CZ2 0.043 0.087CZ3 0.043 0.087CZ4 0.043 0.087CZ5 0.047 0.087CZ6 0.043 0.087CZ7 0.047 0.087CZ8 0.047 0.087CZ9 0.045 0.087
CZ10 0.043 0.087CZ11 0.044 0.087CZ12 0.045 0.087CZ13 0.045 0.087CZ14 0.043 0.087CZ15 0.044 0.087CZ16 0.045 0.087
2011 2008Operating Hours Annual 1249 1132
Daily 3.42 3.10

Database for Energy Efficiency Resources: 2011 Update
Itron, Inc. A-11 Appendix A-1
Wattage Reduction Ratio Recommendations for Short Term update
Location Lamp Shape DEER 2011 DEER 2008 INTERIOR REFLECTOR 4.09 3.53 INTERIOR ALL OTHER 3.47 3.53 EXTERIOR All 4.07 3.53
Residential Refrigerator Equipment Rating set point The new “EQUIP-RATED-T” keyword in DOE2 was not specified correctly for the simulation of residential refrigerators. This change impacts refrigerators simulated in the house as well as those simulated in the unconditioned garage. The specified value of 90 °F corresponds to the DOE rating condition for refrigerators, but for these simulations, the value must correspond to the temperature at which the specified “EQUIP-PWR-FT” curve returns a value of 1.0. This correction causes the simulated energy use of the refrigerators to increase by 17% in conditioned spaces and by as much as 22% in unconditioned spaces.
Peak-Period Demand Issues In order to make results from standard energy simulation programs (specifically, eQUEST) consistent with the DEER demand impact results, the calculation used by the MAS tool to determine the demand impact was modified. The basic calculation remains the same: the demand savings due to an energy efficiency measure is calculated as the average reduction in energy use over a defined nine-hour demand period. The previous database version used the smoothed hourly impacts as the basis for these calculations while the latest version uses the non-modified results from the DOE2 simulations. The difference in the demand values between these two methods is typically quite small, but occasional large deviations from expected values were observed. Changes to the HVAC control scheme for the affected system types were required in order to produce reliable demand results. These changes to the HVAC controls resulted in very little difference to the annual energy savings, but much more predictable behavior during the peak demand period. The following changes were implemented for all appropriate system types:
• Night cycle control setpoints were expanded (max 60 for heating and a minimum of 86 for cooling) so that the number of hours of night-cycling would not change significantly between the base and measures simulations. Changes in the hours of night cycle control would occasionally shift the cooling load by an hour and result in relatively large differences in the hourly energy use of the base and measure simulations during the demand period.
• Outside air is turned off during night cycle control; though rare, the induction of some latent load associated with the outside air flow during night-cycling could exasperate the night-cycle issue discussed above.
• Space heating is turned off during the peak cooling period; though rare, the occasional need for space heating during the cooling season in some climate zones would shift cooling demands by an hour and cause large changes in the hourly demand between a base case simulation with high lighting loads and a measure case with low lighting loads.
Database for Energy Efficiency Resources: 2011 Update
Itron, Inc. A-12 Appendix A-1
• A single chiller is used for non-HVAC measures; this prevents a step-function change in demand when the controller switches between one and two chillers. When appropriate, multiple chillers are still used for the analysis of HVAC measures.
Additions to the DEER database A number of additions were made to the DEER database at the request of the IOUs. The following list summarizes these new entries:
• Non-residential lighting fixtures; over 100 new lighting measures were added to the database. Refer to the accompanying spreadsheet for a description of all changes and additions.
• Updates for Code Baselines Based on EPACT and 2008 Title 24: For fixture replacement and early retirement measures that are covered by Title 24 LPD requirements, linear fluorescent fixture code baselines were revised to reflect the typical fixture needed to meet the new maximum installed lighting power requirements. In general, second generation T8 lamps and electronic ballasts are required. For retrofit measures, code baselines were revised or added to all four foot and 8 foot linear fluorescent measures to reflect the July 2012 federal prohibition of manufacture and sale of T12 lamps and magnetic ballasts. All code baselines now assume T8 lamps and electronic ballasts.
• A total of 14 hot water and steam boiler measures were added to the non-residential measure list.
• Clothes washer and dishwasher measures were added for all residential building types, including the multi-family apartment building.
• Residential multi-family prototype is now included in the database. All residential measures defined for the single-family building type have adapted to the multi-family prototype. Additional measures specific to the multi-family building type have also been added, including common water heater measure and common clothes washer measures.
• Residential and nonresidential high efficiency heat pump measures are now included in the database. These include residential heat pumps ranging from 13 SEER to 18 SEER and nonresidential heat pumps that align with the latest high efficiency tiers established by the Consortium for Energy Efficiency (CEE.)
• Residential insulation retrofit measures have been updated from the 2005 results included in v2.05. All simulation updates discussed above have been utilized in developing UES values for these measures. In v2.05 ceiling batt insulation measures were defined with a base of no insulation and various measure levels equal to standard batt insulation levels such as R-11, R-19 and R-30. These measure definitions have been revised to add standard batt insulation levels to the typical insulation for a particular home vintage as defined in DEER.
Database for Energy Efficiency Resources: 2011 Update
Itron, Inc. A-13 Appendix A-1
• Agricultural greenhouse retrofit measures have been updated to reflect results of impact evaluation work from 2006-2008 PG&E Agricultural and Food Processing Program. The changes include the improvements listed below.
1. The measures may be taken individually, in combination or with baselines that include one of the other measures (e.g. that addition of a thermal curtain to a greenhouse that already has IR film on its roofing material.)
2. The EUS values include two heating system types, a standard over-head gas-fired unit heater and a floor level radiant heating system (typically steam or hot water circulated through piping within the greenhouse.)
3. Revised greenhouse simulation models for greenhouses with overhead heating systems developed in 2008 for and confirmed by the 2006-2008 PG&E Agricultural and Food Processing Program impact evaluation. These model changes addressed major issues that affected energy savings associated with the various measures - predominantly prior incorrect temperature stratification assumptions.
4. The 2006-2008 impact evaluation found that radiant heating systems will dramatically reduce the savings due to the elimination of temperature stratification within the greenhouse. Stratification increased energy use as temperatures above the greenhouse are higher, resulting in a larger heating load that would occur if the temperature were uniform. The 2006-2008 report notes this a major contributing factor to low realization rates (39% for IR film measures and 62% for thermal curtains). The measure updates reflect the addition of this heating system type which was identified as the primary type of heating system utilized in California greenhouses.
5. IR films attached to walls and single-layer roofing materials are included in the database showing zero savings.
• Select non-updated results from DEER2005 retired: Non-updated measures from the DEER2005 database that were included in the DEER2008 database were evaluated for relevancy in the current planning cycle. Measure that were updated in version 3.02 or 4.00 were dropped as were measures that are either no longer relevant or covered by updated IOU workpapers. See the appendix for the status of all DEER 2005 measures include in the previous version.
Changes to the DEER database Structure The format for the DEER2011 Measure and Energy Impact tables follow the new SPTdb format developed by ED and presented in these documents available on the DEEResources.com web site:
• Updated SPTdb Tables and Reporting process - 1Sept2011.pdf • The new SPT database - 2Sept2011.pptx • SPT Data Format with Examples -version 0.97.xls
Database for Energy Efficiency Resources: 2011 Update
Itron, Inc. A-14 Appendix A-1
The new format makes extensive use of a standardized set of classification fields to identify measures and technologies and is part of the common format that will be used for all ED measure information reporting. All DEER UES results that are part of the DEER2011 database are included in the new database. The source for all UES values are identified as one of the following:
• DEER2005 v2.01 Non-updated results from the DEER2005 database that are still relevant.
• DEER2008 v2.05 Results from the official release of the DEER2008 database.
• DEER2008 v3.02 Results from the updated DEER2008 database that were referenced as version 3.02. Includes HVAC interactive effects results that weight indoor lighting measures across applicable HVAC system types.
• DEER2011 v4.00 New results for this release.
READI (“Remote Ex-Ante Database Interface”) is a database tool developed to give users access to all of the DEER2011 data via a remote connection to the ED database. An internet connection and access through ports 22 or 5432 is required to use the program. The latest version of the program can be found on the DEEResources.com web site.
Changes to the DEER Results
The accumulation of changes listed in this document has caused a large portion of the DEER energy impact results to change at least slightly. Some updates have caused specific results to change significantly, such as the large office lighting profile fix.
Other changes, such as the various HVAC control and sizing issues listed above, have had only a small effect on the electricity energy and demand results, but have a profound effect on the secondary natural gas impact. In almost all cases, the heating energy “take back” associated with commercial lighting measures has decreased dramatically (on the order of 25 – 60%).
Figure 1 shows the large decrease in the negative gas impacts for a lighting measure in the multi-story retail building prototype. This result is typical of prototypes with central plant HVAC systems and is largely due to changes in the control mechanism of the oldest vintage HVAC system and the fix to the boiler sizing.
Figure 2 shows the same type of results for the small office building prototype, a building with packaged HVAC equipment. In this case, there is very little difference in the

Database for Energy Efficiency Resources: 2011 Update
Itron, Inc. A-15 Appendix A-1
negative gas impacts since the two changes mentioned above do not apply to packaged HVAC equipment.
Figure 1. Showing a large decrease in the gas heating “take back” associated with a lighting measure in the Multi-Story Retail, Existing Vintage prototype
-0.250
-0.200
-0.150
-0.100
-0.050
0.000
w01 w02 w03 w04 w05 w06 w07 w08 w09 w10 w11 w12 w13 w14 w15 w16
ther
ms
per u
nit
Clmate Zone
Lighting - FL, (1) 48in, 3g T8 lamp, Premium IS EB, RLO (BF: < .85), Lumens=2376, W/fixt=25
Gas Impact therm/unit (v4.00) Gas Impact therm/unit (2.05)
Change in DEER natural gas impacts

Database for Energy Efficiency Resources: 2011 Update
Itron, Inc. A-16 Appendix A-1
Figure 2. Showing a small change in gas heating “take back” associated with a lighting measure in the Small Office Building, Existing Vintage prototype
Figure 3 shows the energy and demand impacts for the recent vintage large office building prototype. The change in demand savings in climate zones CZ01, CZ03 and CZ05 is due to the design chiller size decreasing by approximately 20% in these climate zones. The change in chiller design size is a direct results of the economizer set point issue discussed above.
-3.000
-2.500
-2.000
-1.500
-1.000
-0.500
0.000
w01 w02 w03 w04 w05 w06 w07 w08 w09 w10 w11 w12 w13 w14 w15 w16
ther
ms
per u
nit
Clmate Zone
Lighting - CFL, 20W, Indoor, Non-Reflector
Gas Impact therm/unit (v4.00)
Change in DEER natural gas impacts

Database for Energy Efficiency Resources: 2011 Update
Itron, Inc. A-17 Appendix A-1
Figure 3. Showing the change in demand impacts for climate zones CZ01, CZ03 and CZ05 for the Large Office Building, 2002-2005 Vintage prototype Figure 4 shows the decrease in the gas energy savings per kBTUh capacity for a hot water system in the small office prototype. This decrease per unit of capacity is due to the increase in assumed heating capacity of the hot water system, as discussed above. The actual energy savings in total therms is actually slightly larger in the new version, but the capacity increased by 25% in this case.
0.0
20.0
40.0
60.0
80.0
100.0
120.0
0.0
50.0
100.0
150.0
200.0
250.0
w01 w02 w03 w04 w05 w06 w07 w08 w09 w10 w11 w12 w13 w14 w15 w16
dem
and
(kW
) im
pact
per
uni
t
ener
g (k
Wh)
impa
ct p
er u
nit
Climate Zone
HVAC - Water cooled centrifugal chiller (150-299 tons, 0.507 kW/ton)
Energy Impact kWh/unit (v4.00) Energy Impact kWh/unit (2.05) Demand Impact W/unit (v4.00)
Change in DEER Electric Use and Demand impacts

Database for Energy Efficiency Resources: 2011 Update
Itron, Inc. A-18 Appendix A-1
Figure 4. Showing the decrease in gas savings per kBTUh capacity of the hot water system for the Small Office Building, Existing vintage prototype For the residential models, the largest change in the results is due to the DOE2.2 bug-fix that corrected the amount of outside air associated with duct losses to the outside. Figure 5 shows a significant drop in the demand and energy savings in most climate zones for a SEER 14 HVAC measure applied to the mobile home prototype. The earlier database savings values were exaggerated, especially in the hotter climate zones, due to the bug that increased the cooling and heating loads and made the duct system appear to be extremely inefficient. The mobile home prototype is assumed to have no return ductwork, thus all duct leakage is lost to the outside. The DOE2.2 code was basically doubling duct air losses to the outside before the bug fix. This issue did not impact the single-family residence to the same degree, as a smaller fraction of the total duct air loss is assumed to be to the outside. Figure 6 shows the same impacts for the single-family residence; in this case the savings increase overall, and the largest decrease is on the order of a few percent.
0.000
0.100
0.200
0.300
0.400
0.500
0.600
0.700
w01 w02 w03 w04 w05 w06 w07 w08 w09 w10 w11 w12 w13 w14 w15 w16
ther
ms
per u
nit
Clmate Zone
DHW - High Efficiency Large Gas Storage Water Heater - 0.90 Et
Gas Impact therm/unit (v4.00)
Change in DEER natural gas impacts

Database for Energy Efficiency Resources: 2011 Update
Itron, Inc. A-19 Appendix A-1
Figure 5. Showing a significant decrease in electricity energy and demand savings for an HVAC measures applied to the Mobile Home, Existing Vintage prototype
Figure 6. Showing a small change in electricity energy and demand savings for an HVAC measures applied to the Single-Family, Existing Vintage prototype
0.0
20.0
40.0
60.0
80.0
100.0
120.0
140.0
160.0
180.0
200.0
0.0
20.0
40.0
60.0
80.0
100.0
120.0
140.0
160.0
180.0
w01 w02 w03 w04 w05 w06 w07 w08 w09 w10 w11 w12 w13 w14 w15 w16
dem
and
(kW
) im
pact
per
uni
t
ener
g (k
Wh)
impa
ct p
er u
nit
Climate Zone
HVAC - SEER 14 split system with gas furnace
Energy Impact kWh/unit (4.00) Energy Impact kWh/unit (2.05) Demand Impact W/unit (4.00)
Change in DEER Electric Use and Demand impacts
0.0
10.0
20.0
30.0
40.0
50.0
60.0
70.0
80.0
90.0
100.0
0.0
10.0
20.0
30.0
40.0
50.0
60.0
w01 w02 w03 w04 w05 w06 w07 w08 w09 w10 w11 w12 w13 w14 w15 w16
dem
and
(kW
) im
pact
per
uni
t
ener
g (k
Wh)
impa
ct p
er u
nit
Climate Zone
HVAC - SEER 14 split system with gas furnace
Energy Impact kWh/unit (4.00) Energy Impact kWh/unit (2.05) Demand Impact W/unit (4.00)
Change in DEER Electric Use and Demand impacts
Database for Energy Efficiency Resources: 2011 Update
Itron, Inc. A-20 Appendix A-1
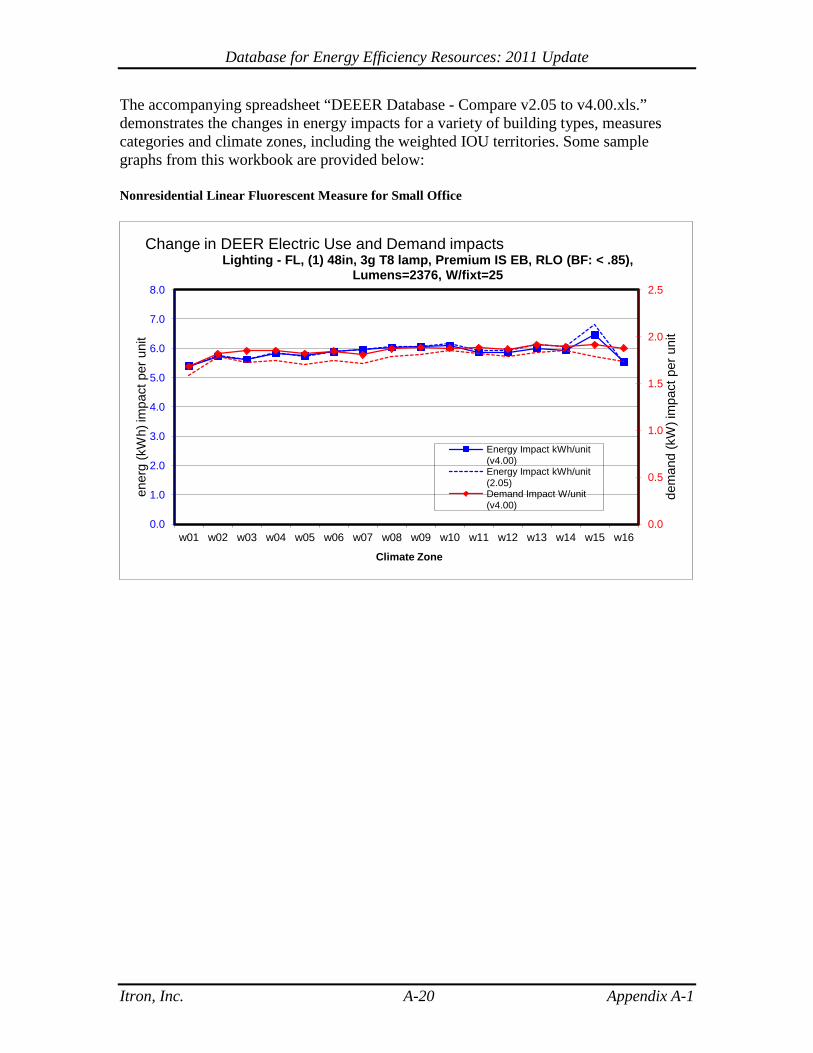
The accompanying spreadsheet “DEEER Database - Compare v2.05 to v4.00.xls.” demonstrates the changes in energy impacts for a variety of building types, measures categories and climate zones, including the weighted IOU territories. Some sample graphs from this workbook are provided below:
Nonresidential Linear Fluorescent Measure for Small Office
0.0
0.5
1.0
1.5
2.0
2.5
0.0
1.0
2.0
3.0
4.0
5.0
6.0
7.0
8.0
w01 w02 w03 w04 w05 w06 w07 w08 w09 w10 w11 w12 w13 w14 w15 w16
dem
and
(kW
) im
pact
per
uni
t
ener
g (k
Wh)
impa
ct p
er u
nit
Climate Zone
Lighting - FL, (1) 48in, 3g T8 lamp, Premium IS EB, RLO (BF: < .85), Lumens=2376, W/fixt=25
Energy Impact kWh/unit (v4.00) Energy Impact kWh/unit (2.05) Demand Impact W/unit (v4.00)
Change in DEER Electric Use and Demand impacts

Database for Energy Efficiency Resources: 2011 Update
Itron, Inc. A-21 Appendix A-1
CFL Measure for Small Retail
Package HVAC Measure for Small Office
0.0
10.0
20.0
30.0
40.0
50.0
60.0
0.0
50.0
100.0
150.0
200.0
250.0
300.0
w01 w02 w03 w04 w05 w06 w07 w08 w09 w10 w11 w12 w13 w14 w15 w16
dem
and
(kW
) im
pact
per
uni
t
ener
g (k
Wh)
impa
ct p
er u
nit
Climate Zone
Lighting - CFL, 20W, Indoor, Non-Reflector
Energy Impact kWh/unit (v4.00) Energy Impact kWh/unit (2.05) Demand Impact W/unit (v4.00)
Change in DEER Electric Use and Demand impacts
0.0
20.0
40.0
60.0
80.0
100.0
120.0
140.0
160.0
180.0
200.0
0.0
50.0
100.0
150.0
200.0
250.0
300.0
350.0
400.0
450.0
500.0
w01 w02 w03 w04 w05 w06 w07 w08 w09 w10 w11 w12 w13 w14 w15 w16
dem
and
(kW
) im
pact
per
uni
t
ener
g (k
Wh)
impa
ct p
er u
nit
Climate Zone
HVAC - Pkg AC EER = 12.0 (90-134 kBtuh)
Energy Impact kWh/unit (v4.00) Energy Impact kWh/unit (2.05) Demand Impact W/unit (v4.00)
Change in DEER Electric Use and Demand impacts

Database for Energy Efficiency Resources: 2011 Update
Itron, Inc. A-22 Appendix A-1
Chiller Measure for Large Office
New Refrigerator Measure for Single Family
0.0
20.0
40.0
60.0
80.0
100.0
120.0
0.0
50.0
100.0
150.0
200.0
250.0
w01 w02 w03 w04 w05 w06 w07 w08 w09 w10 w11 w12 w13 w14 w15 w16
dem
and
(kW
) im
pact
per
uni
t
ener
g (k
Wh)
impa
ct p
er u
nit
Climate Zone
HVAC - Water cooled centrifugal chiller (150-299 tons, 0.507 kW/ton)
Energy Impact kWh/unit (v4.00) Energy Impact kWh/unit (2.05) Demand Impact W/unit (v4.00)
Change in DEER Electric Use and Demand impacts
0.0
10.0
20.0
30.0
40.0
50.0
60.0
0.0
50.0
100.0
150.0
200.0
250.0
300.0
w01 w02 w03 w04 w05 w06 w07 w08 w09 w10 w11 w12 w13 w14 w15 w16
dem
and
(kW
) im
pact
per
uni
t
ener
g (k
Wh)
impa
ct p
er u
nit
Climate Zone
Appliance - Large Top Freezer Refrigerator
Energy Impact kWh/unit (4.00) Energy Impact kWh/unit (2.05) Demand Impact W/unit (4.00)
Change in DEER Electric Use and Demand impacts

Database for Energy Efficiency Resources: 2011 Update
Itron, Inc. A-23 Appendix A-1
Package HVAC Measure for Single Family
0.0
10.0
20.0
30.0
40.0
50.0
60.0
70.0
80.0
90.0
100.0
0.0
10.0
20.0
30.0
40.0
50.0
60.0
w01 w02 w03 w04 w05 w06 w07 w08 w09 w10 w11 w12 w13 w14 w15 w16
dem
and
(kW
) im
pact
per
uni
t
ener
g (k
Wh)
impa
ct p
er u
nit
Climate Zone
HVAC - SEER 14 split system with gas furnace
Energy Impact kWh/unit (4.00) Energy Impact kWh/unit (2.05) Demand Impact W/unit (4.00)
Change in DEER Electric Use and Demand impacts
Database for Energy Efficiency Resources: 2011 Update
Itron, Inc. A-24 Appendix A-1
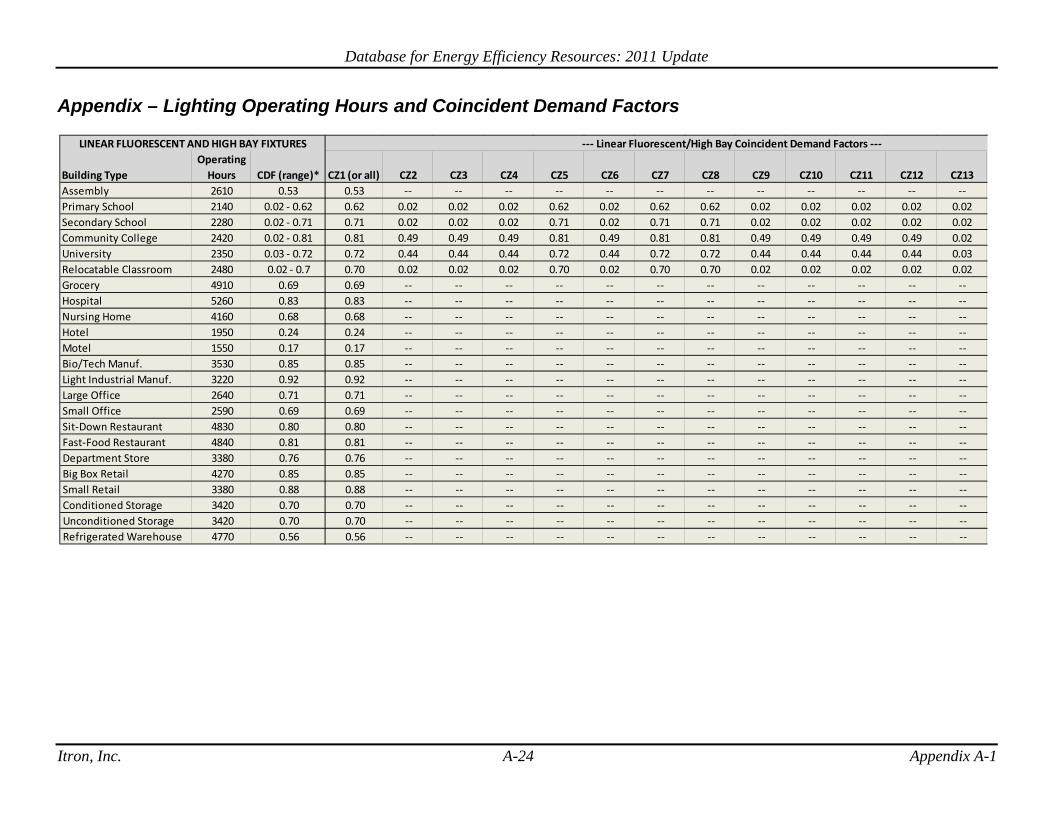
Appendix – Lighting Operating Hours and Coincident Demand Factors
Building TypeOperating
Hours CDF (range)* CZ1 (or all) CZ2 CZ3 CZ4 CZ5 CZ6 CZ7 CZ8 CZ9 CZ10 CZ11 CZ12 CZ13Assembly 2610 0.53 0.53 -- -- -- -- -- -- -- -- -- -- -- -- Primary School 2140 0.02 - 0.62 0.62 0.02 0.02 0.02 0.62 0.02 0.62 0.62 0.02 0.02 0.02 0.02 0.02Secondary School 2280 0.02 - 0.71 0.71 0.02 0.02 0.02 0.71 0.02 0.71 0.71 0.02 0.02 0.02 0.02 0.02Community College 2420 0.02 - 0.81 0.81 0.49 0.49 0.49 0.81 0.49 0.81 0.81 0.49 0.49 0.49 0.49 0.02University 2350 0.03 - 0.72 0.72 0.44 0.44 0.44 0.72 0.44 0.72 0.72 0.44 0.44 0.44 0.44 0.03Relocatable Classroom 2480 0.02 - 0.7 0.70 0.02 0.02 0.02 0.70 0.02 0.70 0.70 0.02 0.02 0.02 0.02 0.02Grocery 4910 0.69 0.69 -- -- -- -- -- -- -- -- -- -- -- -- Hospital 5260 0.83 0.83 -- -- -- -- -- -- -- -- -- -- -- -- Nursing Home 4160 0.68 0.68 -- -- -- -- -- -- -- -- -- -- -- -- Hotel 1950 0.24 0.24 -- -- -- -- -- -- -- -- -- -- -- -- Motel 1550 0.17 0.17 -- -- -- -- -- -- -- -- -- -- -- -- Bio/Tech Manuf. 3530 0.85 0.85 -- -- -- -- -- -- -- -- -- -- -- -- Light Industrial Manuf. 3220 0.92 0.92 -- -- -- -- -- -- -- -- -- -- -- -- Large Office 2640 0.71 0.71 -- -- -- -- -- -- -- -- -- -- -- -- Small Office 2590 0.69 0.69 -- -- -- -- -- -- -- -- -- -- -- -- Sit-Down Restaurant 4830 0.80 0.80 -- -- -- -- -- -- -- -- -- -- -- -- Fast-Food Restaurant 4840 0.81 0.81 -- -- -- -- -- -- -- -- -- -- -- -- Department Store 3380 0.76 0.76 -- -- -- -- -- -- -- -- -- -- -- -- Big Box Retail 4270 0.85 0.85 -- -- -- -- -- -- -- -- -- -- -- -- Small Retail 3380 0.88 0.88 -- -- -- -- -- -- -- -- -- -- -- -- Conditioned Storage 3420 0.70 0.70 -- -- -- -- -- -- -- -- -- -- -- -- Unconditioned Storage 3420 0.70 0.70 -- -- -- -- -- -- -- -- -- -- -- -- Refrigerated Warehouse 4770 0.56 0.56 -- -- -- -- -- -- -- -- -- -- -- --
LINEAR FLUORESCENT AND HIGH BAY FIXTURES --- Linear Fluorescent/High Bay Coincident Demand Factors ---

Database for Energy Efficiency Resources: 2011 Update
Itron, Inc. A-25 Appendix A-1
Building TypeOperating
Hours CDF (range)* CZ1 (or all) CZ2 CZ3 CZ4 CZ5 CZ6 CZ7 CZ8 CZ9 CZ10 CZ11 CZ12 CZ13Assembly 2300 0.41 0.41 -- -- -- -- -- -- -- -- -- -- -- -- Primary School 2240 0.02 - 0.63 0.63 0.02 0.02 0.02 0.62 0.02 0.62 0.62 0.02 0.02 0.02 0.02 0.02Secondary School 2330 0.02 - 0.72 0.72 0.02 0.02 0.02 0.71 0.02 0.71 0.71 0.02 0.02 0.02 0.02 0.02Community College 2420 0.02 - 0.81 0.65 0.42 0.49 0.49 0.81 0.49 0.81 0.81 0.49 0.49 0.49 0.49 0.02University 2370 0.03 - 0.72 0.67 0.44 0.44 0.44 0.72 0.44 0.72 0.72 0.44 0.44 0.44 0.44 0.03Relocatable Classroom 2600 0.02 - 0.73 0.73 0.02 0.02 0.02 0.70 0.02 0.70 0.70 0.02 0.02 0.02 0.02 0.02Grocery 3890 0.49 0.49 -- -- -- -- -- -- -- -- -- -- -- -- Hospital 4200 0.72 0.72 -- -- -- -- -- -- -- -- -- -- -- -- Nursing Home 3570 0.56 0.56 -- -- -- -- -- -- -- -- -- -- -- -- Hotel 1670 0.20 0.20 -- -- -- -- -- -- -- -- -- -- -- -- Motel 1370 0.15 0.15 -- -- -- -- -- -- -- -- -- -- -- -- Bio/Tech Manuf. 3090 0.78 0.78 -- -- -- -- -- -- -- -- -- -- -- -- Light Industrial Manuf. 2580 0.78 0.78 -- -- -- -- -- -- -- -- -- -- -- -- Large Office 3000 0.63 0.63 -- -- -- -- -- -- -- -- -- -- -- -- Small Office 2980 0.68 0.68 -- -- -- -- -- -- -- -- -- -- -- -- Sit-Down Restaurant 4830 0.80 0.80 -- -- -- -- -- -- -- -- -- -- -- -- Fast-Food Restaurant 4810 0.81 0.81 -- -- -- -- -- -- -- -- -- -- -- -- Department Store 3710 0.63 0.63 -- -- -- -- -- -- -- -- -- -- -- -- Big Box Retail 4350 0.69 0.69 -- -- -- -- -- -- -- -- -- -- -- -- Small Retail 4010 0.70 0.70 -- -- -- -- -- -- -- -- -- -- -- -- Conditioned Storage 2760 0.57 0.57 -- -- -- -- -- -- -- -- -- -- -- -- Unconditioned Storage 2760 0.57 0.57 -- -- -- -- -- -- -- -- -- -- -- -- Refrigerated Warehouse 4730 0.55 0.55 -- -- -- -- -- -- -- -- -- -- -- --
COMPACT FLUORESCENT LAMPS --- Compact Fluorescent Coincident Demand Factors ---
Database for Energy Efficiency Resources: 2011 Update
Itron, Inc. A-26 Appendix A-1
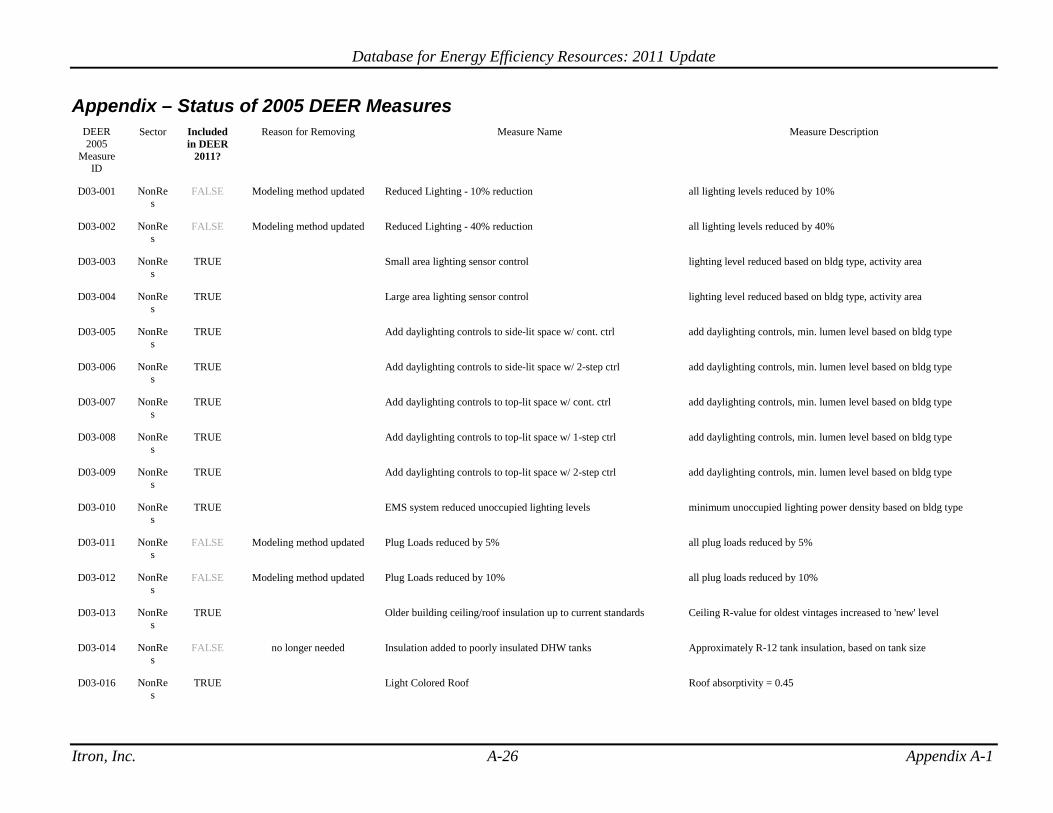
Appendix – Status of 2005 DEER Measures DEER 2005
Measure ID
Sector Included in DEER
2011?
Reason for Removing Measure Name Measure Description
D03-001 NonRes
FALSE Modeling method updated Reduced Lighting - 10% reduction all lighting levels reduced by 10%
D03-002 NonRes
FALSE Modeling method updated Reduced Lighting - 40% reduction all lighting levels reduced by 40%
D03-003 NonRes
TRUE Small area lighting sensor control lighting level reduced based on bldg type, activity area
D03-004 NonRes
TRUE Large area lighting sensor control lighting level reduced based on bldg type, activity area
D03-005 NonRes
TRUE Add daylighting controls to side-lit space w/ cont. ctrl add daylighting controls, min. lumen level based on bldg type
D03-006 NonRes
TRUE Add daylighting controls to side-lit space w/ 2-step ctrl add daylighting controls, min. lumen level based on bldg type
D03-007 NonRes
TRUE Add daylighting controls to top-lit space w/ cont. ctrl add daylighting controls, min. lumen level based on bldg type
D03-008 NonRes
TRUE Add daylighting controls to top-lit space w/ 1-step ctrl add daylighting controls, min. lumen level based on bldg type
D03-009 NonRes
TRUE Add daylighting controls to top-lit space w/ 2-step ctrl add daylighting controls, min. lumen level based on bldg type
D03-010 NonRes
TRUE EMS system reduced unoccupied lighting levels minimum unoccupied lighting power density based on bldg type
D03-011 NonRes
FALSE Modeling method updated Plug Loads reduced by 5% all plug loads reduced by 5%
D03-012 NonRes
FALSE Modeling method updated Plug Loads reduced by 10% all plug loads reduced by 10%
D03-013 NonRes
TRUE Older building ceiling/roof insulation up to current standards Ceiling R-value for oldest vintages increased to 'new' level
D03-014 NonRes
FALSE no longer needed Insulation added to poorly insulated DHW tanks Approximately R-12 tank insulation, based on tank size
D03-016 NonRes
TRUE Light Colored Roof Roof absorptivity = 0.45

Database for Energy Efficiency Resources: 2011 Update
Itron, Inc. A-27 Appendix A-1
D03-017 NonRes
TRUE North glass SHGC 15% less than required North glass SHGC 15% less than required by T-24
D03-018 NonRes
TRUE East glass SHGC 20% less than required East glass SHGC 20% less than required by T-24
D03-019 NonRes
TRUE South glass SHGC 20% less than required South glass SHGC 20% less than required by T-24
D03-020 NonRes
TRUE West glass SHGC 20% less than required West glass SHGC 20% less than required by T-24
D03-021 NonRes
TRUE North glass SHGC 20% less than required North glass SHGC 20% less than required by T-24
D03-022 NonRes
TRUE East glass SHGC 30% less than required East glass SHGC 30% less than required by T-24
D03-023 NonRes
TRUE South glass SHGC 30% less than required South glass SHGC 30% less than required by T-24
D03-024 NonRes
TRUE West glass SHGC 30% less than required West glass SHGC 30% less than required by T-24
D03-025 NonRes
TRUE High perf glass (PI 1.15) and cont dayltg ctrls in side-lit spaces glass w/ indicated performance index in daylit spaces, cont. ctrl
D03-026 NonRes
TRUE High perf glass (PI 1.26) and cont dayltg ctrls in side-lit spaces glass w/ indicated performance index in daylit spaces, cont. ctrl
D03-027 NonRes
TRUE High perf glass (PI 1.38) and cont dayltg ctrls in side-lit spaces glass w/ indicated performance index in daylit spaces, cont. ctrl
D03-028 NonRes
TRUE High perf glass (PI 1.15) and 2-step dayltg ctrls in side-lit spaces glass w/ indicated performance index in daylit spaces, 2-step ctrl
D03-029 NonRes
TRUE High perf glass (PI 1.26) and 2-step dayltg ctrls in side-lit spaces glass w/ indicated performance index in daylit spaces, 2-step ctrl
D03-030 NonRes
TRUE High perf glass (PI 1.38) and 2-step dayltg ctrls in side-lit spaces glass w/ indicated performance index in daylit spaces, 2-step ctrl
D03-031 NonRes
TRUE High perf glass (PI 0.81) and cont dayltg ctrls in top-lit spaces skylight w/ indicated performance index & T24 reqmts in daylit spaces, cont. ctrl
D03-032 NonRes
TRUE High perf glass (PI 0.92) and cont dayltg ctrls in top-lit spaces skylight w/ indicated performance index & T24 reqmts in daylit spaces, cont. ctrl
D03-033 NonRes
TRUE High perf glass (PI 1.03) and cont dayltg ctrls in top-lit spaces skylight w/ indicated performance index & T24 reqmts in daylit spaces, cont. ctrl
D03-034 NonRe TRUE High perf glass (PI 0.81) and 1-step dayltg ctrls in top-lit spaces skylight w/ indicated performance index & T24 reqmts in daylit

Database for Energy Efficiency Resources: 2011 Update
Itron, Inc. A-28 Appendix A-1
s spaces, 1-step ctrl
D03-035 NonRes
TRUE High perf glass (PI 0.92) and 1-step dayltg ctrls in top-lit spaces skylight w/ indicated performance index & T24 reqmts in daylit spaces, 1-step ctrl
D03-036 NonRes
TRUE High perf glass (PI 1.03) and 1-step dayltg ctrls in top-lit spaces skylight w/ indicated performance index & T24 reqmts in daylit spaces, 1-step ctrl
D03-037 NonRes
TRUE High perf glass (PI 0.81) and 2-step dayltg ctrls in top-lit spaces skylight w/ indicated performance index & T24 reqmts in daylit spaces, 2-step ctrl
D03-038 NonRes
TRUE High perf glass (PI 0.92) and 2-step dayltg ctrls in top-lit spaces skylight w/ indicated performance index & T24 reqmts in daylit spaces, 2-step ctrl
D03-039 NonRes
TRUE High perf glass (PI 1.03) and 2-step dayltg ctrls in top-lit spaces skylight w/ indicated performance index & T24 reqmts in daylit spaces, 2-step ctrl
D03-040 NonRes
FALSE Updated in v4.00 Centrifugal chillers (< 150 tons) with improved kW/ton Water cooled centrifugal chiller (0.560 kW/ton)
D03-041 NonRes
FALSE Updated in v4.00 Reciprocating air-cooled chillers with improved kW/ton Air cooled package reciprocating chiller (1.008 kW/ton)
D03-042 NonRes
FALSE Updated in v4.00 VSD Centrifugal Chiller (< 150 tons) w/Load control tower Water cooled VSD centrifugal chiller (0.560 kW/ton), load control tower
D03-043 NonRes
FALSE no longer needed Gas Absorption Central Chiller (direct fired) Gas absorption chiller (direct fired) (0.0071 EIR, 1.0 HIR)
D03-044 NonRes
TRUE Chilled Water Loop temperature control Chilled water loop temperature set to 'Load Reset'
D03-045 NonRes
TRUE Hot Water Loop temperature control Hot water loop temperature set to 'Load Reset'
D03-046 NonRes
TRUE Replace 3-way valves in CHW loop with 2-way 2-way valves, with single speed pump
D03-047 NonRes
TRUE Variable speed drive for chilled water loop add variable speed pump to chilled water loop
D03-048 NonRes
TRUE Replace 3-way valves in HW loop with 2-way 2-way valves, with single speed pump
D03-049 NonRes
TRUE Variable speed drive for hot water loop add variable speed pump to hot water loop
D03-050 NonRes
TRUE VAV box retrofit on constant volume system damper controlled VAV with 30% min-cfm-ratio
D03-051 NonRes
TRUE Variable Frequency Drive motors use on VAV fans VFD with 30% min-cfm-ratio

Database for Energy Efficiency Resources: 2011 Update
Itron, Inc. A-29 Appendix A-1
D03-052 NonRes
FALSE no longer needed Convert VAVS system to PIU system Convert VAVS sytem to PIU system
D03-053 NonRes
TRUE Make-up Air Indirect Evaporative cooling indirect evap cooling for make-up air only, 65% effectiveness
D03-054 NonRes
TRUE Make-up Air Indirect Evaporative cooling indirect evap cooling for make-up air only, 65% effectiveness
D03-055 NonRes
TRUE Base ventilation rate 25% higher than required standard ventilation rate
D03-056 NonRes
TRUE heat recovery from exhaust hoods 70% heat recovery effectiveness
D03-057 NonRes
TRUE rotary air-to-air enthalpy heat recovery 70% sensible and latent recovery effectiveness
D03-058 NonRes
TRUE Packaged system Economizer retrofit Add econo with Econo-Lockout=NO, DB limit = 68, Max OSA = 100%
D03-059 NonRes
TRUE Central HVAC system Economizer retrofit Add ecomizer with Econo-Lockout=NO, DB limit = 68, Max OSA = 100%
D03-060 NonRes
TRUE Restore degraded economizer performance ecomizer with Econo-Lockout=NO, DB limit = 68, Max OSA = 100%
D03-061 NonRes
FALSE requires update Dirty Air-cooled condenser coils are cleaned standard equipment efficiency
D03-062 NonRes
TRUE Convert Air-Cooled Condenser to Water-Cooled packaged system with water cooled condenser
D03-063 NonRes
TRUE Two-Speed Tower Fans replace Single-Speed Two-speed tower fans on all central plants
D03-064 NonRes
TRUE Variable-Speed Tower Fans replace Two-Speed Variable-speed tower fans on all central plants
D03-065 NonRes
TRUE High efficiency gas furnace replace std efficiency packaged system with 94 AFUE furnace
D03-066 NonRes
FALSE Updated in v4.00 High efficiency Large boiler (>300 kBTU/hr) Central boiler with efficiency of 85%
D03-067 NonRes
FALSE Updated in v4.00 High efficiency Small boiler (<300 kBTU/hr) Central boiler with efficiency of 84.5%
D03-068 NonRes
FALSE Updated in v4.00 High efficiency Steam boiler (<300 kBTU/hr) Central steam boiler with efficiency of 84%
D03-069 NonRe TRUE High efficiency WLHP system for Large Office WLHP system with 14.0 EER / 4.6 COP

Database for Energy Efficiency Resources: 2011 Update
Itron, Inc. A-30 Appendix A-1
s
D03-070 NonRes
TRUE Variable flow hydronic water loop 2-way valves, with VSD pumping
D03-071 NonRes
TRUE time clocks control packaged system operation Supply fan operation matches building operation
D03-072 NonRes
FALSE requires update Suite of EMS measures CHW & HW reset, reduced nighttime lighting levels
D03-073 NonRes
TRUE Install programmable thermostats in older bldgs unoccupied period has heating setback/cooling setup
D03-075 NonRes
TRUE Increased duct insulation in older vintages Old vintage increases duct insulation to R-4.2, 78-91 vintage to R-8
D03-076 NonRes
FALSE Updated in v4.00 High eff. packaged split system A/C (< 65k, single phase) 14 SEER (12.15 EER) Split-System Air Conditioner
D03-077 NonRes
FALSE Updated in v4.00 High eff. packaged split system HP (< 65k, single phase) 14 SEER (12.19 EER) / 8.6 HSPF (3.52 COP) A/C Heat Pump
D03-078 NonRes
FALSE Updated in v4.00 High eff. packaged unitary system A/C (< 65k, single phase) 14 SEER (12.15 EER) Package Air Conditioner
D03-079 NonRes
FALSE Updated in v4.00 High eff. packaged unitary system A/C (65-134k) 11 EER Package Air Conditioner
D03-080 NonRes
FALSE Updated in v4.00 High eff. packaged unitary system HP (< 65k, single phase) 14 SEER (12.19 EER) / 8.6 HSPF (3.52 COP) Package A/C Heat Pump
D03-081 NonRes
FALSE Updated in v4.00 High eff. packaged unitary system HP (65-134k) 11 EER / 3.4 COP Split/Package A/C Heat Pump
D03-082 NonRes
TRUE High eff. packaged system with evap cooled cond (< 65k) 14 EER Water-Cooled Package Air Conditioner
D03-083 NonRes
TRUE High eff. packaged system with evap cooled cond (>= 65k) 14 EER Water-Cooled Package Air Conditioner
D03-084 NonRes
TRUE High eff. packaged terminal air-conditioner (< 7k) 11.29 EER (based on vintage) package terminal A/C
D03-085 NonRes
TRUE High eff. packaged terminal heat pump (< 7k) 11.17 EER / 3.3 COP (based on vintage) package terminal HP
D03-086 NonRes
TRUE removed older vintages Premium efficiency of better motors used for application premium motor efficiency based on typical motor size
D03-087 NonRes
TRUE removed older vintages Premium efficiency of better motors used for application premium motor efficiency based on typical motor size

Database for Energy Efficiency Resources: 2011 Update
Itron, Inc. A-31 Appendix A-1
D03-088 NonRes
TRUE removed older vintages Premium efficiency of better motors used for application premium motor efficiency based on typical motor size
D03-089 NonRes
TRUE removed older vintages Premium efficiency of better motors used for application premium motor efficiency based on typical motor size
D03-090 NonRes
TRUE removed older vintages Premium efficiency of better motors used for application premium motor efficiency based on typical motor size
D03-091 NonRes
TRUE removed older vintages Premium efficiency of better motors used for application premium motor efficiency based on typical motor size
D03-094 NonRes
FALSE Updated in v4.00 tankless electric hot water system zero tank loss
D03-095 NonRes
TRUE DHW circulation pump contolled by timeclock DHW circulation pump turns off during low operation hours
D03-098 NonRes
TRUE Add water economizer heat exchanger to CW Loop Non integrated evaporator precooler heat exchanger
D03-099 NonRes
TRUE High eff. packaged terminal air-conditioner (7-15k) 10.27 EER (based on vintage) package terminal A/C
D03-100 NonRes
TRUE High eff. packaged terminal air-conditioner (> 15k) 9.25 EER (based on vintage) package terminal A/C
D03-101 NonRes
TRUE High eff. packaged terminal heat pump (7-15k) 10.15 EER / 3.1 COP (based on vintage) package terminal HP
D03-102 NonRes
TRUE High eff. packaged terminal heat pump (> 15k) 9.13 EER / 3.0 COP (based on vintage) package terminal HP
D03-103 NonRes
FALSE Updated in v4.00 High eff. packaged unitary system A/C (135-239k) 10.8 EER Package Air Conditioner
D03-104 NonRes
FALSE Updated in v4.00 High eff. packaged unitary system A/C (240-759k) 10.0 EER Package Air Conditioner
D03-105 NonRes
FALSE Updated in v4.00 High eff. packaged unitary system A/C (>= 760k) 10.0 EER Package Air Conditioner
D03-106 NonRes
FALSE Updated in v4.00 High eff. packaged unitary system HP (135-239k) 10.8 EER / 3.4 COP Package A/C Heat Pump
D03-107 NonRes
FALSE Updated in v4.00 High eff. packaged unitary system HP (240-759k) 10.0 EER / 3.4 COP Package A/C Heat Pump
D03-108 NonRes
FALSE Updated in v4.00 High eff. packaged split system A/C (< 65k, 3 phase before 2008) 12 SEER three phase split-system A/C
D03-109 NonRe FALSE Updated in v4.00 High eff. packaged unitary system A/C (< 65k, 12 SEER, 3 phase 12 SEER three phase package A/C

Database for Energy Efficiency Resources: 2011 Update
Itron, Inc. A-32 Appendix A-1
s before 2008)
D03-110 NonRes
FALSE Not needed High eff. packaged unitary system A/C (< 65k, 13 SEER, 3 phase before 2008)
13 SEER three phase package A/C
D03-111 NonRes
FALSE Updated in v4.00 High eff. packaged split system HP (< 65k, 3 phase before 2008) 12 SEER / 7.4 HSPF three phase split-system A/C heat pump
D03-112 NonRes
FALSE Updated in v4.00 High eff. packaged unitary system HP (< 65k, 12 SEER, 3 phase before 2008)
12 SEER / 7.4 HSPF three phase package A/C Heat Pump
D03-113 NonRes
FALSE Updated in v4.00 High eff. packaged unitary system HP (< 65k, 13 SEER, 3 phase before 2008)
13 SEER / 7.7 HSPF three phase package A/C Heat Pump
D03-114 NonRes
FALSE Updated in v4.00 Air-cooled screw chiller with improved kw/ton Air cooled screw chiller (1.008 kW/ton)
D03-115 NonRes
FALSE Updated in v4.00 Reciprocating water-cooled chillers with improved kW/ton Water cooled reciprocating chiller (0.672 kW/ton)
D03-116 NonRes
FALSE Updated in v4.00 Centrifugal chillers (150-299 tons) with improved kW/ton Water cooled centrifugal chiller (0.507 kW/ton)
D03-117 NonRes
FALSE Updated in v4.00 Centrifugal chillers (>= 300 tons) with improved kW/ton Water cooled centrifugal chiller (0.461 kW/ton)
D03-118 NonRes
FALSE Updated in v4.00 Water-cooled screw chiller (< 150 tons) with improved kw/ton Water cooled screw chiller (0.632 kW/ton)
D03-119 NonRes
FALSE Updated in v4.00 Water-cooled screw chiller (150-299 tons) with improved kw/ton Water cooled screw chiller (0.574 kW/ton)
D03-120 NonRes
FALSE Updated in v4.00 Water-cooled screw chiller (>= 300 tons) with improved kw/ton Water cooled screw chiller (0.511 kW/ton)
D03-121 NonRes
FALSE Updated in v4.00 VSD Centrifugal Chiller (150-299 tons) w/Load control tower Water cooled VSD centrifugal chiller (0.507 kW/ton), load control tower
D03-122 NonRes
FALSE Updated in v4.00 VSD Centrifugal Chiller (>= 300 tons) w/Load control tower Water cooled VSD centrifugal chiller (0.461 kW/ton), load control tower
D03-123 NonRes
TRUE Floor insulation raised to 2005 levels Floor insulation raised to 2005 levels
D03-124 NonRes
TRUE High eff. packaged unitary system HP (>= 760k) 9.7 EER / 3.3 COP Package A/C Heat Pump
D03-201 NonRes
FALSE no longer needed Air-cooled multiplex system w/extensive refrigeration equipment maintenance
Normal setpoints, representing tighter control
D03-202 NonRes
FALSE no longer needed Substitute high efficiency motors for standard efficiency Utilizes a PSC motor

Database for Energy Efficiency Resources: 2011 Update
Itron, Inc. A-33 Appendix A-1
D03-203 NonRes
FALSE no longer needed Substitute high efficiency motors for standard efficiency Utilizes an EC motor
D03-204 NonRes
FALSE no longer needed Adds an 85°F holdback valve, active only when needed Heat reclaim with SCT controlled to 85°F via holdback valve when heat is needed
D03-205 NonRes
TRUE Cover open MT cases between 1-5 a.m. Night cover reduces infiltration by 50% for 4 hours/night
D03-206 NonRes
TRUE Retrofit glass doors on open MT cases; additional lighting Open fixture is retrofitted with doors and additional lighting
D03-207 NonRes
TRUE Replace open MT case with new case with doors Replace open fixtures with fixtures having doors
D03-208 NonRes
FALSE Workpaper Install automatic door closer on walk-in cooler doors Applies a multiplier of 60% to the base-case infiltration
D03-209 NonRes
FALSE Workpaper Install automatic door closer on walk-in freezer doors Applies a multiplier of 60% to the base-case infiltration
D03-210 NonRes
FALSE no longer needed Cycle fan off with thermostat; duty cycle occasionally when off Evaporator fan cycles w/ thermostat; when off cycles on peridoically
D03-211 NonRes
FALSE no longer needed Replace multiplex air-cooled condenser with evaporative condenser Evaporative condenser of T24 efficiency, 2-speed fan, 80°SCT
D03-212 NonRes
FALSE no longer needed Upgrade from 53 Btu/Watt @ 10°F TD to 85 Btu/Watt Same capacity condenser, sized at 10°F TD, and efficiency of 85 Btu/Watt, 80°F SCT
D03-213 NonRes
FALSE no longer needed Reduce design SCT by ~5°F and improve efficiency Same capacity condenser but ~5°F lower SCT, 200 Btu/Watt, 80°F SCT
D03-214 NonRes
FALSE no longer needed Replace single-compressor system with subcooled multiplex Multiplex system, air-cooled, subcooler on both LT & MT circuits, floating head
D03-215 NonRes
FALSE no longer needed Replace single-compressor system with subcooled multiplex Multiplex system, evap-cooled, subcooler on both LT & MT circuits, floating head
D03-216 NonRes
FALSE no longer needed Replace single-compressor system with subcooled multiplex (high efficiency)
Multiplex system, hi-eff air-cooled, subcooler on both LT and MT circuits
D03-217 NonRes
FALSE no longer needed Replace single-compressor system with subcooled multiplex (high efficiency)
Multiplex system, hi-eff evap-cooled, subcooler on both LT and MT circuits
D03-218 NonRes
TRUE Addition of a LT subcooler to an air-cooled multiplex Low-temp subcooler (50°F) powered by medium-temp suction group
D03-219 NonRes
TRUE Addition of LT and MT subcoolers to an air-cooled multiplex Low- and medium-temp subcoolers powered by a new high-temp suction group
D03-220 NonRe TRUE Floating SST control on LT and MT suction groups SST setpoint reset based on worst-case demand

Database for Energy Efficiency Resources: 2011 Update
Itron, Inc. A-34 Appendix A-1
s
D03-221 NonRes
TRUE Floating SCT controlled to 70°F SCT controlled to 70°F
D03-222 NonRes
TRUE Floating SCT controlled to 70°F SCT controlled to 70°F
D03-223 NonRes
TRUE Ambient following SCT setpoint, 70°F minimum Control SCT to ambient + 12°F TD, 70°F min, backflood setpoint of 68°F
D03-224 NonRes
TRUE Wetbulb following SCT setpoint, 70°F minimum Control SCT to wetbulb + 17°F TD, 70°F min, backflood setpoint of 68°F
D03-225 NonRes
TRUE Ambient following SCT setpoint, 70°F minimum, variable-spd condenser fan
Control SCT to ambient + 12°F TD, 70°F min, backflood setpt of 68°F, var-spd cond
D03-226 NonRes
TRUE Wetbulb following SCT setpoint, 70°F minimum, variable-spd condenser fan
Control SCT to wetbulb + 17°F TD, 70°F min, backflood setpt of 68°F, var-spd cond
D03-227 NonRes
FALSE Workpaper Turn off fixture lights when store closed Turn off lights between midnight and 6 a.m.
D03-228 NonRes
FALSE no longer needed Eliminate anti-sweat heaters from doors Eliminate door heaters, 54W/door frame heat only, fixed output
D03-301 NonRes
FALSE no longer needed Extensive refrigeration equipment maintenance Normal setpoints, representing tighter control
D03-302 NonRes
FALSE no longer needed Size condenser to ~5°F lower TD, 400 Btu/Watt Condenser sized at ~18°F TD, 400 Btu/watt fan & pump, 80°F SCT setpoint
D03-303 NonRes
FALSE no longer needed Size condenser to ~5°F lower TD, efficient fans & pump, WB following setpt
Condenser sized at ~ 18°F TD, 400 Btu/watt fan & pump, WB-following SCT setpnt
D03-304 NonRes
FALSE no longer needed Add variable-speed control to one compressor in each suction group
Variable-speed drive to trim one compressor, remainder stage fully loaded
D03-305 NonRes
FALSE no longer needed Add mechanical subcooler to LT liquid line, fed by MT system Subcooler on LT liquid circuit, provided by MT circuit, controlled to 50°F
D03-306 NonRes
TRUE Floating SST control on LT and MT suction groups SST setpoint reset based on worst-case demand
D03-307 NonRes
TRUE Floating SCT controlled to 70°F SCT controlled to 70°F, 68°F backflood control setpoint
D03-308 NonRes
TRUE Wetbulb following SCT setpoint, 70°F minimum Control SCT to wetbulb + 9°F TD, 70°F minimum, backflood setpoint of 68°F
D03-309 NonRes
TRUE Wetbulb following SCT setpoint, 70°F min, variable-spd condenser fan
Control SCT to wetbulb + 9°F TD, 70°F min, backflood setpt of 68°F, var-spd cond

Database for Energy Efficiency Resources: 2011 Update
Itron, Inc. A-35 Appendix A-1
D03-401 Res TRUE Programmable Thermostat Programmable Thermostat
D03-402 Res FALSE Updated in v4.00 13 SEER (11.09 EER) Split System Air Conditioner 13 SEER (11.09 EER) Split System Air Conditioner
D03-403 Res FALSE Updated in v4.00 14 SEER (11.99 EER) Split-System Air Conditioner 14 SEER (11.99 EER) Split-System Air Conditioner
D03-404 Res FALSE Updated in v4.00 15 SEER (12.72 EER) Split-System Air Conditioner 15 SEER (12.72 EER) Split-System Air Conditioner
D03-405 Res TRUE Direct Evaporative Cooler Direct Evaporative Cooler
D03-406 Res TRUE Indirect Evaporative Cooler Indirect Evaporative Cooler
D03-407 Res TRUE Direct-Indirect Evaporative Cooler Direct-Indirect Evaporative Cooler
D03-408 Res FALSE Updated in v4.00 Typical Refrigerant Charge Adjustment (< ±20% rated charge) Standard Cooling Performance (proper refrigerant charge)
D03-409 Res FALSE Updated in v4.00 High Refrigerant Charge Adjustment (>= ±20% rated charge) Standard Cooling Performance (proper refrigerant charge)
D03-410 Res FALSE Updated in v4.00 Condensing 90 AFUE (1.11 HIR) Furnace Condensing 90 AFUE (1.11 HIR) Furnace
D03-411 Res FALSE Updated in v4.00 Condensing 92 AFUE (1.08 HIR) Furnace Condensing 92 AFUE (1.08 HIR) Furnace
D03-412 Res FALSE Updated in v4.00 Condensing 94 AFUE (1.06 HIR) Furnace Condensing 94 AFUE (1.06 HIR) Furnace
D03-413 Res FALSE Updated in v4.00 Condensing 96 AFUE (1.03 HIR) Furnace Condensing 96 AFUE (1.03 HIR) Furnace
D03-414 Res FALSE Updated in v4.00 13 SEER (11.07 EER) / 8.1 HSPF (3.28 COP) A/C Heat pump 13 SEER (11.07 EER) / 8.1 HSPF (3.28 COP) A/C Heat pump
D03-415 Res FALSE Updated in v4.00 14 SEER (12.19 EER) / 8.6 HSPF (3.52 COP) A/C Heat Pump 14 SEER (12.19 EER) / 8.6 HSPF (3.52 COP) A/C Heat Pump
D03-416 Res FALSE Updated in v4.00 15 SEER (12.70 EER) / 8.8 HSPF (3.74 COP) A/C Heat Pump 15 SEER (12.70 EER) / 8.8 HSPF (3.74 COP) A/C Heat Pump
D03-417 Res FALSE Updated in v4.00 18 SEER (12.8 EER) / 9.2 HSPF (3.66 COP) A/C Heat Pump 18 SEER (12.88 EER) / 8.5 HSPF (3.32 COP) A/C Heat Pump
D03-418 Res FALSE Updated in v4.00 Duct Sealing (Total Leakage Reduced from 40% of AHU flow to 12%)
Duct Sealing (Total Leakage Reduced from 40% of AHU flow to 12%)
D03-420 Res FALSE Updated in v4.00 Ceiling R-0 to R-30 Insulation-Batts Ceiling R-0 to R-30 Insulation-Batts
D03-421 Res FALSE Updated in v4.00 Ceiling R-0 to R-38 Insulation-Batts Ceiling R-0 to R-38 Insulation-Batts
D03-422 Res FALSE Updated in v4.00 Ceiling Vintage to R-30 Insulation-Batts Ceiling Vintage to R-30 Insulation-Batts
D03-423 Res FALSE Updated in v4.00 Ceiling Vintage to R-38 Insulation-Batts Ceiling Vintage to R-38 Insulation-Batts
D03-424 Res FALSE Updated in v4.00 Ceiling Vintage to R-49 Insulation-Batts Ceiling Vintage to R-49 Insulation-Batts
D03-426 Res TRUE Floor R-0 to R-19 Insulation Batts Floor R-0 to R-19 Insulation Batts
D03-427 Res TRUE Floor R-0 to R-30 Insulation Batts Floor R-0 to R-30 Insulation Batts
D03-428 Res TRUE Floor R-19 to R-30 Insulation-Batts Floor R-19 to R-30 Insulation-Batts

Database for Energy Efficiency Resources: 2011 Update
Itron, Inc. A-36 Appendix A-1
D03-429 Res TRUE Wall 2x4 R-15 Insulation-Batts Wall 2x4 R-15 Insulation-Batts
D03-430 Res TRUE Wall 2x6 R-19 Insulation-Batts Wall 2x6 R-19 Insulation-Batts
D03-431 Res TRUE Wall 2x6 R-21 Insulation-Batts Wall 2x6 R-21 Insulation-Batts
D03-435 Res TRUE Wall 2x4 R-13 Batts + R-5 Rigid Wall 2x4 R-13 Batts + R-5 Rigid
D03-436 Res TRUE Wall 2x6 R-19 Batts + R-5 Rigid Wall 2x6 R-19 Batts + R-5 Rigid
D03-437 Res TRUE Wall 2x6 R-21 Batts + R-5 Rigid Wall 2x6 R-21 Batts + R-5 Rigid
D03-438 Res FALSE Updated in v4.00 Wall Blow-In R-0 to R-13 Insulation Wall Blow-In R-0 to R-13 Insulation
D03-439 Res FALSE no longer needed Low-Income Weatherization w/out Evaporative Cooler Infiltration of 0.35 Air Changes per Hour
D03-440 Res FALSE no longer needed Low-Income Weatherization w/ Evaporative Cooler Direct Evap Cooling with Infiltration of 0.35 Air Changes per Hour
D03-441 Res TRUE Whole House Fans Whole House Fans
D03-442 Res FALSE requires update Default Window With Sunscreen Default Window With Sunscreen
D03-443 Res FALSE requires update Single Pane Clear Glass With Reflective Film Single Pane Clear Glass With Reflective Film
D03-444 Res FALSE requires update Single Pane Clear Glass With Spectrally Selective Film Single Pane Clear Glass With Spectrally Selective Film
D03-445 Res FALSE requires update Single Pane Clear Glass With Standard Film Single Pane Clear Glass With Standard Film
D03-446 Res FALSE requires update U-0.50 / SHGC-0.65 (clear) Window U-0.50 / SHGC-0.65 (clear) Window
D03-447 Res FALSE requires update U-0.40 / SHGC-0.65 (clear) Window U-0.40 / SHGC-0.65 (clear) Window
D03-448 Res FALSE requires update U-0.35 / SHGC-0.55 (clear) Window U-0.35 / SHGC-0.55 (clear) Window
D03-449 Res FALSE requires update U-0.25 / SHGC-0.35 (clear) Window U-0.25 / SHGC-0.35 (clear) Window
D03-450 Res FALSE requires update U-0.50 / SHGC-0.40 (tint) Window U-0.50 / SHGC-0.40 (tint) Window
D03-451 Res FALSE requires update U-0.40 / SHGC-0.40 (tint) Window U-0.40 / SHGC-0.40 (tint) Window
D03-452 Res FALSE requires update U-0.35 / SHGC-0.32 (tint) Window U-0.35 / SHGC-0.32 (tint) Window
D03-453 Res FALSE requires update U-0.25 / SHGC-0.22 (tint) Window U-0.25 / SHGC-0.22 (tint) Window
D03-458 Res FALSE Updated in v4.00 Duct Sealing (Total Leakage Reduced from 24% of AHU flow to 12%)
Duct Sealing (Total Leakage Reduced from 24% of AHU flow to 12%)
D03-459 Res FALSE Updated in v4.00 Typical Refrigerant Charge Adjustment (< ±20% rated charge) + Duct Sealing
Standard Cooling Performance, reduced duct loss
D03-460 Res FALSE Updated in v4.00 High Refrigerant Charge Adjustment (>= ±20% rated charge) + Duct Sealing
Standard Cooling Performance, reduced duct loss

Database for Energy Efficiency Resources: 2011 Update
Itron, Inc. A-37 Appendix A-1
D03-461 Res FALSE Updated in v4.00 Basic Furnace Upgrade to 81% AFUE Basic Furnace Upgrade to 81% AFUE
D03-462 Res FALSE Updated in v4.00 Mobile Home Duct Sealing (Supply Leakage Reduced from 35% of AHU flow to 15%)
Mobile Home Duct Sealing (Supply Leakage Reduced from 35% of AHU flow to 15%)
D03-463 Res FALSE Updated in v4.00 16 SEER (11.61 EER) Split System Air Conditioner 16 SEER (11.61 EER) Split System Air Conditioner
D03-464 Res FALSE Updated in v4.00 17 SEER (12.28 EER) Split-System Air Conditioner 17 SEER (12.28 EER) Split-System Air Conditioner
D03-465 Res FALSE Updated in v4.00 18 SEER (13.37 EER) Split-System Air Conditioner 18 SEER (13.37 EER) Split-System Air Conditioner
D03-466 Res FALSE Updated in v4.00 16 SEER (12.06 EER) / 8.4 HSPF (3.48 COP) A/C Heat Pump 16 SEER (12.06 EER) / 8.4 HSPF (3.48 COP) A/C Heat Pump
D03-467 Res FALSE Updated in v4.00 17 SEER (12.52 EER) / 8.6 HSPF (3.26 COP) A/C Heat Pump 17 SEER (12.52 EER) / 8.6 HSPF (3.26 COP) A/C Heat Pump
D03-468 Res FALSE Updated in v4.00 Mobile Home Duct Sealing (Supply Leakage Reduced from 25% of AHU flow to 15%)
Mobile Home Duct Sealing (Supply Leakage Reduced from 25% of AHU flow to 15%)
D03-801 Res FALSE Updated in v4.00 13 Watt Intergral CFL - Outdoor 13 Watt < 800 Lumens - screw-in - Outdoor
D03-802 Res FALSE Updated in v4.00 13 Watt Intergral CFL - Outdoor 13 Watt >=800 Lumens - screw-in - Outdoor
D03-803 Res FALSE Updated in v4.00 14 Watt Intergral CFL - Outdoor 14 Watt - screw-in - Outdoor
D03-804 Res FALSE Updated in v4.00 15 Watt Intergral CFL - Outdoor 15 Watt - screw-in - Outdoor
D03-805 Res FALSE Updated in v4.00 16 Watt Intergral CFL - Outdoor 16 Watt - screw-in - Outdoor
D03-806 Res FALSE Updated in v4.00 18 Watt Intergral CFL - Outdoor 18 Watt < 1,100 Lumens - screw-in - Outdoor
D03-807 Res FALSE Updated in v4.00 18 Watt Intergral CFL - Outdoor 18 Watt >=1,100 Lumens - screw-in - Outdoor
D03-808 Res FALSE Updated in v4.00 19 Watt Intergral CFL - Outdoor 19 Watt >=1,100 Lumens - screw-in - Outdoor
D03-809 Res FALSE Updated in v4.00 20 Watt Intergral CFL - Outdoor 20 Watt - screw-in - Outdoor
D03-810 Res FALSE Updated in v4.00 23 Watt Intergral CFL - Outdoor 23 Watt - screw-in - Outdoor
D03-811 Res FALSE Updated in v4.00 25 Watt Intergral CFL - Outdoor 25 Watt <1,600 Lumens - screw-in - Outdoor
D03-812 Res FALSE Updated in v4.00 25 Watt Intergral CFL - Outdoor 25 Watt >=1,600 Lumens - screw-in - Outdoor
D03-813 Res FALSE Updated in v4.00 26 Watt Intergral CFL - Outdoor 26 Watt <1,600 Lumens - screw-in - Outdoor
D03-814 Res FALSE Updated in v4.00 26 Watt Intergral CFL - Outdoor 26 Watt >=1,600 Lumens - screw-in - Outdoor
D03-815 Res FALSE Updated in v4.00 28 Watt Intergral CFL - Outdoor 28 Watt - screw-in - Outdoor
D03-816 Res FALSE Updated in v4.00 30 Watt Intergral CFL - Outdoor 30 Watt - screw-in - Outdoor
D03-817 Res FALSE Updated in v4.00 36 Watt Intergral CFL - Outdoor 36 Watt - screw-in - Outdoor
D03-818 Res FALSE Updated in v4.00 40 Watt Intergral CFL - Outdoor 40 Watt - screw-in - Outdoor

Database for Energy Efficiency Resources: 2011 Update
Itron, Inc. A-38 Appendix A-1
D03-819 Res FALSE Updated in v4.00 13 Watt Fixture CFL - Outdoor 13 Watt < 800 Lumens - pin based hardwire fixture - Outdoor
D03-820 Res FALSE Updated in v4.00 13 Watt Fixture CFL - Outdoor 13 Watt >=800 Lumens - pin based hardwire fixture - Outdoor
D03-821 Res FALSE Updated in v4.00 14 Watt Fixture CFL - Outdoor 14 Watt - pin based hardwire fixture - Outdoor
D03-822 Res FALSE Updated in v4.00 15 Watt Fixture CFL - Outdoor 15 Watt - pin based hardwire fixture - Outdoor
D03-823 Res FALSE Updated in v4.00 16 Watt Fixture CFL - Outdoor 16 Watt - pin based hardwire fixture - Outdoor
D03-824 Res FALSE Updated in v4.00 18 Watt Fixture CFL - Outdoor 18 Watt < 1,100 Lumens - pin based hardwire fixture - Outdoor
D03-825 Res FALSE Updated in v4.00 18 Watt Fixture CFL - Outdoor 18 Watt >=1,100 Lumens - pin based hardwire fixture - Outdoor
D03-826 Res FALSE Updated in v4.00 19 Watt Fixture CFL - Outdoor 19 Watt >=1,100 Lumens - pin based hardwire fixture - Outdoor
D03-827 Res FALSE Updated in v4.00 20 Watt Fixture CFL - Outdoor 20 Watt - pin based hardwire fixture - Outdoor
D03-828 Res FALSE Updated in v4.00 23 Watt Fixture CFL - Outdoor 23 Watt - pin based hardwire fixture - Outdoor
D03-829 Res FALSE Updated in v4.00 25 Watt Fixture CFL - Outdoor 25 Watt <1,600 Lumens - pin based hardwire fixture - Outdoor
D03-830 Res FALSE Updated in v4.00 25 Watt Fixture CFL - Outdoor 25 Watt >=1,600 Lumens - pin based hardwire fixture - Outdoor
D03-831 Res FALSE Updated in v4.00 26 Watt Fixture CFL - Outdoor 26 Watt <1,600 Lumens - pin based hardwire fixture - Outdoor
D03-832 Res FALSE Updated in v4.00 26 Watt Fixture CFL - Outdoor 26 Watt >=1,600 Lumens - pin based hardwire fixture - Outdoor
D03-833 Res FALSE Updated in v4.00 28 Watt Fixture CFL - Outdoor 28 Watt - pin based hardwire fixture - Outdoor
D03-834 Res FALSE Updated in v4.00 30 Watt Fixture CFL - Outdoor 30 Watt - pin based hardwire fixture - Outdoor
D03-835 Res FALSE Updated in v4.00 40 Watt Fixture CFL - Outdoor 40 Watt - pin based hardwire fixture - Outdoor
D03-836 Res FALSE Updated in v4.00 55 Watt Fixture CFL - Outdoor 55 Watt - pin based hardwire fixture - Outdoor
D03-837 Res FALSE Updated in v4.00 65 Watt Fixture CFL - Outdoor 65 Watt - pin based hardwire fixture - Outdoor
D03-838 Res FALSE Updated in v4.00 20W CFL Table Lamp 20W CFL Table Lamp - pin based
D03-839 Res FALSE Updated in v4.00 25W CFL Table Lamp 25W CFL Table Lamp - pin based
D03-840 Res FALSE Updated in v4.00 30W CFL Table Lamp 30W CFL Table Lamp - pin based
D03-841 Res FALSE Updated in v4.00 55W CFL Table Lamp 55W CFL Table Lamp - pin based
D03-842 Res FALSE Updated in v4.00 55W CFL Torchiere 55W CFL Torchiere - pin based
D03-843 Res FALSE Updated in v4.00 70W CFL Torchiere (two LAMPs) 70W CFL Torchiere (two LAMPs) - pin based
D03-844 NonRes
FALSE Updated in v4.00 50W Metal Halide 50W Metal Halide

Database for Energy Efficiency Resources: 2011 Update
Itron, Inc. A-39 Appendix A-1
D03-845 NonRes
FALSE Updated in v4.00 75W Metal Halide 75W Metal Halide
D03-846 NonRes
FALSE Updated in v4.00 100W Metal Halide 100W Metal Halide
D03-852 NonRes
FALSE Updated in v4.00 Premium T8 El Ballast Four ft. 2 lamp fixture, ballast factor of less than or equal to 0.77
D03-853 NonRes
FALSE Updated in v4.00 T8 32W Dimming El Ballast Four ft. 2 lamp fixture
D03-854 NonRes
FALSE Updated in v4.00 De-lamp from 4', 4 lamp/fixture Four ft. 4 lamp fixture
D03-855 NonRes
FALSE Updated in v4.00 De-lamp from 8', 4 lamp/fixture Eight ft. 4 lamp fixture
D03-856 NonRes
FALSE update required Occ-Sensor - Wall box Assume control 3 2-lamp fixtures w/T8 34W EL Ballast
D03-857 NonRes
FALSE update required Occ-Sensor - Plug loads Assume control 50W of task lighting and a computer monitor
D03-858 NonRes
FALSE update required Timeclock: Controling 4 - 70W (95W w/ballast) HPS fixtures
D03-859 NonRes
FALSE update required Photocell: Assume in conjunction with time-clock controling 4 - 70W (95W w/ballast) HPS fixtures
D03-901 NonRes
FALSE no longer needed High Efficiency Copier 0-20 copies/minute
D03-902 NonRes
FALSE no longer needed High Efficiency Copier 21 44copies/minute
D03-903 NonRes
FALSE no longer needed High Efficiency Copier Over 45 copies/minute
D03-904 NonRes
FALSE Workpaper High Efficiency Gas Fryer Base use = 25 kBtu/hour; Eff use = 15 kBtu/hour
D03-905 NonRes
FALSE Workpaper High Efficiency Gas Griddle Base use = 25 kBtu/hour; Eff use = 20 kBtu/hour
D03-906 NonRes
FALSE Workpaper High Efficiency Electric Fryer Base use = 2.8 kW/hour; Eff use = 2.4 kW/hour
D03-907 NonRes
FALSE Workpaper Hot Food Holding Cabinet Base use = 1.35 kW/hour; Eff use = 0.43 kW/hour
D03-908 NonRe FALSE Workpaper Connectionless Steamer Base use = 1.0 kW/hour; Eff use = 0.5 kW/hour

Database for Energy Efficiency Resources: 2011 Update
Itron, Inc. A-40 Appendix A-1
s
D03-909 NonRes
FALSE no longer needed Point of Use Water Heat Point of Use Water Heat
D03-910 NonRes
FALSE no longer needed Circulation Pump Timeclock Circulation Pump Timeclock
D03-911 NonRes
FALSE Updated in v4.00 High Eff. Water Heater, EF=0.64 High Eff. Water Heater
D03-912 NonRes
FALSE Workpaper Vending Machine Controller Cold Drink Vending Machine
D03-913 NonRes
FALSE Workpaper Vending Machine Controller Uncooled Snack Machine
D03-914 NonRes
FALSE is current code requirement Premium Efficiency Motor - 1 HP Open Drip Proof: 2076 Hours of Operation
D03-915 NonRes
FALSE is current code requirement Premium Efficiency Motor - 5 HP Open Drip Proof: 2076 Hours of Operation
D03-916 NonRes
FALSE is current code requirement Premium Efficiency Motor - 10 HP Open Drip Proof: 2076 Hours of Operation
D03-917 NonRes
FALSE is current code requirement Premium Efficiency Motor - 15 HP Open Drip Proof: 2076 Hours of Operation
D03-918 NonRes
FALSE is current code requirement Premium Efficiency Motor - 20 HP Open Drip Proof: 2820 Hours of Operation
D03-919 NonRes
FALSE is current code requirement Premium Efficiency Motor - 25 HP Open Drip Proof: 2820 Hours of Operation
D03-920 NonRes
FALSE is current code requirement Premium Efficiency Motor - 50 HP Open Drip Proof: 2820 Hours of Operation
D03-921 NonRes
FALSE is current code requirement Premium Efficiency Motor - 100 HP Open Drip Proof: 2820 Hours of Operation
D03-922 NonRes
FALSE is current code requirement Premium Efficiency Motor - 150 HP Open Drip Proof: 2820 Hours of Operation
D03-923 NonRes
FALSE is current code requirement Premium Efficiency Motor - 200 HP Open Drip Proof: 2215 Hours of Operation
D03-924 NonRes
FALSE is current code requirement Premium Efficiency Motor - 1 HP Closed Drip Proof: 2076 Hours of Operation
D03-925 NonRes
FALSE is current code requirement Premium Efficiency Motor - 5 HP Closed Drip Proof: 2076 Hours of Operation

Database for Energy Efficiency Resources: 2011 Update
Itron, Inc. A-41 Appendix A-1
D03-926 NonRes
FALSE is current code requirement Premium Efficiency Motor - 10 HP Closed Drip Proof: 2076 Hours of Operation
D03-927 NonRes
FALSE is current code requirement Premium Efficiency Motor - 15 HP Closed Drip Proof: 2076 Hours of Operation
D03-928 NonRes
FALSE is current code requirement Premium Efficiency Motor - 20 HP Closed Drip Proof: 2820 Hours of Operation
D03-929 NonRes
FALSE is current code requirement Premium Efficiency Motor - 25 HP Closed Drip Proof: 2820 Hours of Operation
D03-930 NonRes
FALSE is current code requirement Premium Efficiency Motor - 50 HP Closed Drip Proof: 2820 Hours of Operation
D03-931 NonRes
FALSE is current code requirement Premium Efficiency Motor - 100 HP Closed Drip Proof: 2820 Hours of Operation
D03-932 NonRes
FALSE is current code requirement Premium Efficiency Motor - 150 HP Closed Drip Proof: 2820 Hours of Operation
D03-933 NonRes
FALSE is current code requirement Premium Efficiency Motor - 200 HP Closed Drip Proof: 2215 Hours of Operation
D03-934 Res FALSE Workpaper Faucet Aerators Faucet Aerators
D03-935 Res FALSE update required Heat Pump Water Heater Heat pump water heater, EF=2.9
D03-936 Res FALSE update required Pipe Wrap Pipe wrap
D03-937 Res FALSE Workpaper Low Flow Showerhead Low Flow Showerhead
D03-938 Res FALSE Updated in v4.00 High Efficiency Water Heater High Efficiency Water Heater - Gas, EF = 0.63
D03-939 Res FALSE Updated in v4.00 High Efficiency Water Heater High Efficiency Water Heater - Electric, EF=0.93
D03-940 Res FALSE no longer needed Point of Use Water Heat Point of Use Water Heat
D03-941 Res FALSE out-of-date Efficient Clothes Dryer High Efficiency Electric Clothes Dryer with Moisture Sensor.
D03-942 Res FALSE out-of-date Efficient Clothes Dryer High Efficiency Gas Clothes Dryer with Moisture Sensor.
D03-943 Res FALSE Updated in v4.00 Energy Star Clothes Washer - 1.5 cf CEE Tier 1: MEF=1.42, 1.5 cf Capacity
D03-944 Res FALSE Updated in v4.00 Energy Star Clothes Washer - 1.5 cf CEE Tier 2: MEF=1.60, 1.5 cf capacity
D03-945 Res FALSE Updated in v4.00 Energy Star Clothes Washer - 1.5 cf CEE Tier 3: MEF=1.80, 1.5 cf capacity
D03-946 Res FALSE Updated in v4.00 Energy Star Clothes Washer - 2.65 cf CEE Tier 1: MEF=1.42, 2.65 cf capacity
D03-947 Res FALSE Updated in v4.00 Energy Star Clothes Washer - 2.65 cf CEE Tier 2: MEF=1.60, 2.65 cf capacity
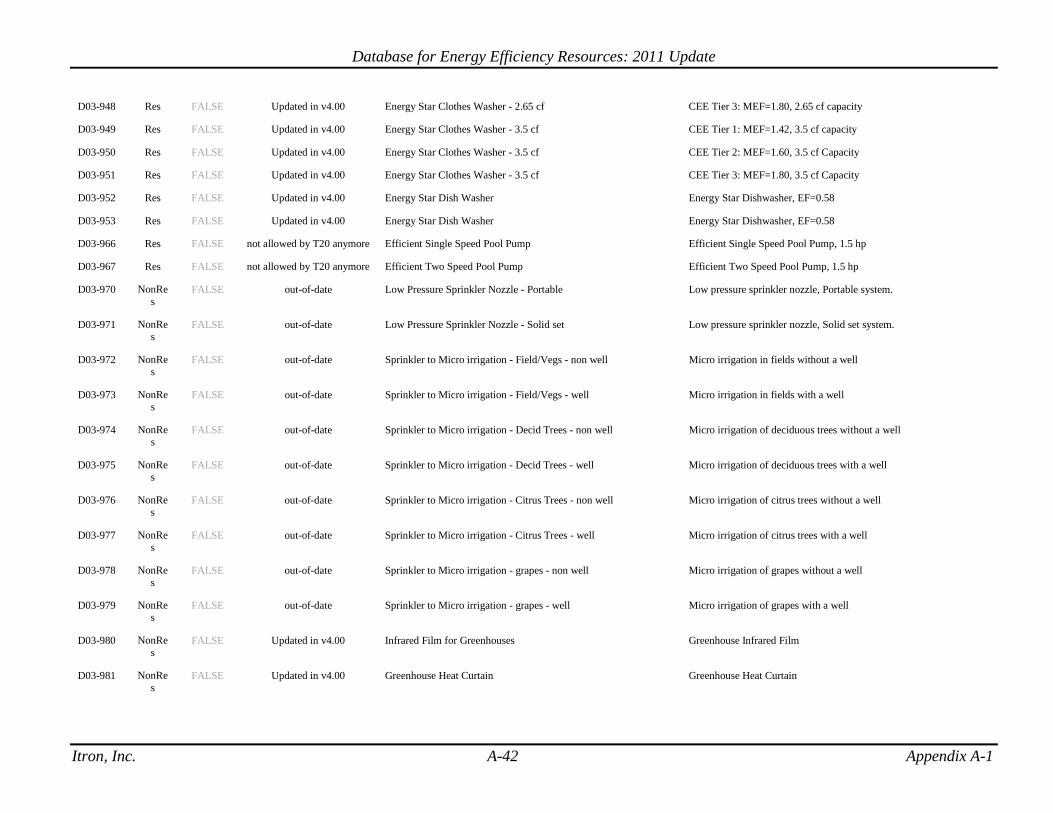
Database for Energy Efficiency Resources: 2011 Update
Itron, Inc. A-42 Appendix A-1
D03-948 Res FALSE Updated in v4.00 Energy Star Clothes Washer - 2.65 cf CEE Tier 3: MEF=1.80, 2.65 cf capacity
D03-949 Res FALSE Updated in v4.00 Energy Star Clothes Washer - 3.5 cf CEE Tier 1: MEF=1.42, 3.5 cf capacity
D03-950 Res FALSE Updated in v4.00 Energy Star Clothes Washer - 3.5 cf CEE Tier 2: MEF=1.60, 3.5 cf Capacity
D03-951 Res FALSE Updated in v4.00 Energy Star Clothes Washer - 3.5 cf CEE Tier 3: MEF=1.80, 3.5 cf Capacity
D03-952 Res FALSE Updated in v4.00 Energy Star Dish Washer Energy Star Dishwasher, EF=0.58
D03-953 Res FALSE Updated in v4.00 Energy Star Dish Washer Energy Star Dishwasher, EF=0.58
D03-966 Res FALSE not allowed by T20 anymore Efficient Single Speed Pool Pump Efficient Single Speed Pool Pump, 1.5 hp
D03-967 Res FALSE not allowed by T20 anymore Efficient Two Speed Pool Pump Efficient Two Speed Pool Pump, 1.5 hp
D03-970 NonRes
FALSE out-of-date Low Pressure Sprinkler Nozzle - Portable Low pressure sprinkler nozzle, Portable system.
D03-971 NonRes
FALSE out-of-date Low Pressure Sprinkler Nozzle - Solid set Low pressure sprinkler nozzle, Solid set system.
D03-972 NonRes
FALSE out-of-date Sprinkler to Micro irrigation - Field/Vegs - non well Micro irrigation in fields without a well
D03-973 NonRes
FALSE out-of-date Sprinkler to Micro irrigation - Field/Vegs - well Micro irrigation in fields with a well
D03-974 NonRes
FALSE out-of-date Sprinkler to Micro irrigation - Decid Trees - non well Micro irrigation of deciduous trees without a well
D03-975 NonRes
FALSE out-of-date Sprinkler to Micro irrigation - Decid Trees - well Micro irrigation of deciduous trees with a well
D03-976 NonRes
FALSE out-of-date Sprinkler to Micro irrigation - Citrus Trees - non well Micro irrigation of citrus trees without a well
D03-977 NonRes
FALSE out-of-date Sprinkler to Micro irrigation - Citrus Trees - well Micro irrigation of citrus trees with a well
D03-978 NonRes
FALSE out-of-date Sprinkler to Micro irrigation - grapes - non well Micro irrigation of grapes without a well
D03-979 NonRes
FALSE out-of-date Sprinkler to Micro irrigation - grapes - well Micro irrigation of grapes with a well
D03-980 NonRes
FALSE Updated in v4.00 Infrared Film for Greenhouses Greenhouse Infrared Film
D03-981 NonRes
FALSE Updated in v4.00 Greenhouse Heat Curtain Greenhouse Heat Curtain

Database for Energy Efficiency Resources: 2011 Update
Itron, Inc. A-43 Appendix A-1
D03-982 NonRes
FALSE out-of-date Variable Frequency Drives with feedback controls for Dairy Pumps
Add VFD to Dairy Vacuum Pump
D03-983 NonRes
FALSE out-of-date Ventilation Fans or Box Fans (6) High efficiency ventilation fan
D03-984 NonRes
FALSE out-of-date High Volume Low Speed Fans 16 Ft Diameter (4) 16 Foot Diameter fan with 35 Ft Spacing Free Stall Barn
D03-985 NonRes
FALSE out-of-date High Volume Low Speed Fans 18 Ft Diameter (3) 18 Foot Diameter fan with 40 Ft Spacing Free Stall Barn
D03-986 NonRes
FALSE out-of-date High Volume Low Speed Fans 20 Ft Diameter (3) 20 Foot Diameter fan with 50 Ft Spacing Free Stall Barn
D03-987 NonRes
FALSE out-of-date High Volume Low Speed Fans 24 Ft Diameter (2) 24 Foot Diameter fan with 60 Ft Spacing Free Stall Barn

Itron, Inc. A-2-1 DEER EFLH and CF Description
Appendix A-2
This appendix describes how the building type effective full-load hours (EFLH) and coincident factor (CF) values were developed using data gathered as part of the 2006-2008 Small Commercial Contract Group evaluation (Small Com evaluation). It also describes how the activity area distributions were calculated.
EFLH and CF Calculations Setup (applies to both the EFLH and CF calculations)
The Small Commercial evaluation involved the installation of nearly 7,000 lighting loggers in over 1,200 commercial buildings throughout California. Extensive training and QC procedures were applied to the lighting logger installations, as is documented in the Small Com report.
The ON/OFF transition data from each lighting logger was processed into a percent ON per hour format. Each logger was then extrapolated into an 8760 lighting use shape, as described in the Small Com report. Since some sites saw multiple loggers installed in the same activity areas, the 8760 use shapes were averaged together to create a single 8760 for each activity area at each site. The number of lamps represented by each logger was used as a weight to create this site level activity area shape.
The first step in calculating the EFLH and CF values for this DEER update was the creation of the weekly usage profiles. Each site level activity area 8760 was collapsed to an 8-day use shape (five weekdays, 2 weekends and an eighth day for holidays). These site level activity area 8-day shapes were then averaged together to make an 8-day shape for each building type - activity area that was reported in Small Com. The total number of lamps logged within each activity area at each site was used as a weight to create these building type - activity area shapes.
In this way, we arrived at a percent ON value for each hour (0-23) of each weekday (1-8) at each building type – activity area. To explain in symbols, if we let where 𝐻𝑅ℎ,𝑤,𝑏,𝑎 be the average hours ON during hour h on weekday w at building type b and activity area a, then we have:
𝐻𝑅ℎ,𝑤,𝑏,𝑎 =∑ �𝑤𝑠,𝑎 ∙ 𝐻𝑅𝑠,ℎ,𝑤,𝑎�𝑠
∑ 𝑤𝑠,𝑎𝑠
where the sums are taken over all sites s such that s has building type b and activity area a.

DEER EFLH and CF Description
Itron, Inc. A-2-2 DEER EFLH and CF Description
The term 𝑤𝑠,𝑎 represents the total number of lamps at site s in activity area a. So, in this case, ∑ 𝑤𝑠,𝑎𝑠 would represent the total number of lamps in activity areas a in sites with building type b. The term 𝐻𝑅𝑠,ℎ,𝑤,𝑎 represents the percent ON in activity area a site s during hour h on weekday w.
EFLH Calculation
The calculation of the EFLH value at building type b (𝐸𝐹𝐿𝐻𝑏) is most clearly described by the following equations:
𝐸𝐹𝐿𝐻𝑏 = ��𝑃𝑐𝑡𝐴𝐴𝑏,𝑎 ∙ 𝐸𝐹𝐿𝐻𝑏,𝑎�𝑎
where the sum is taken over all activity areas a such that building type b has activity area a as a final reported activity area.
The term 𝑃𝑐𝑡𝐴𝐴𝑏,𝑎 represents the percentage that activity area a takes up in building type b (so we have ∑ 𝑃𝑐𝑡𝐴𝐴𝑏,𝑎 = 1𝑎 for each b; the calculation of these 𝑃𝑐𝑡𝐴𝐴𝑏,𝑎 terms is described in the next section).
The term 𝐸𝐹𝐿𝐻𝑏,𝑎 is the EFLH at building type b and activity area a, as defined by1:
𝐸𝐹𝐿𝐻𝑏,𝑎 = 354 �∑ 𝐷𝑎𝑦𝑇𝑜𝑡𝑤,𝑏,𝑎7𝑤=1
7� + 11�𝐷𝑎𝑦𝑇𝑜𝑡8,𝑏,𝑎�
The term 𝐷𝑎𝑦𝑇𝑜𝑡𝑤,𝑏,𝑎 represents the average daily hours ON for weekday w (Sunday=1, Monday=2,…,Saturday=7, and Holiday=8), at building type b and activity area a. It is defined as
𝐷𝑎𝑦𝑇𝑜𝑡𝑤,𝑏,𝑎 = � 𝐻𝑅ℎ,𝑤,𝑏,𝑎
23
ℎ=0
where 𝐻𝑅ℎ,𝑤,𝑏,𝑎 is the average hours ON during hour h (0 ≤ ℎ ≤ 23) on weekday w at building type b and activity area a, as described in the section above. Note, 0 ≤ 𝐻𝑅ℎ,𝑤,𝑏,𝑎 ≤ 1.
CF Calculation
The DEER Peak Definition is as follows:
1 The numbers 11 and 354 appear in this calculation because we assume there are 11 holidays and 354 non-
holidays in a year.
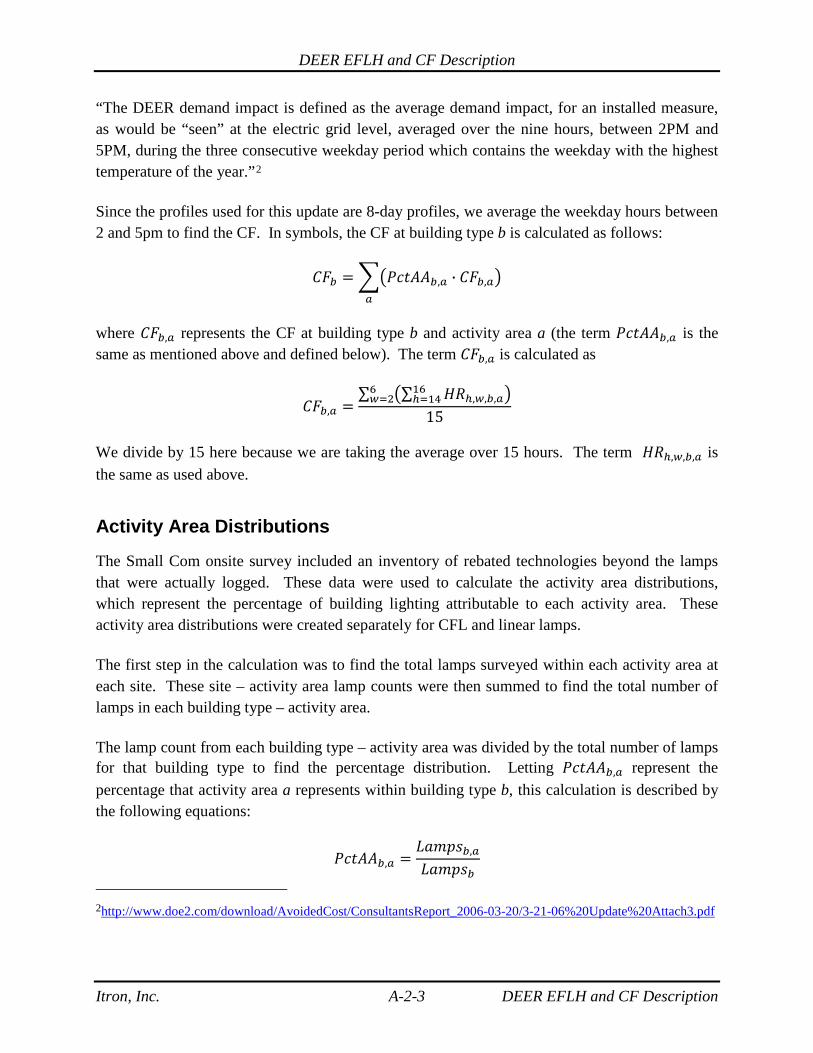
DEER EFLH and CF Description
Itron, Inc. A-2-3 DEER EFLH and CF Description
“The DEER demand impact is defined as the average demand impact, for an installed measure, as would be “seen” at the electric grid level, averaged over the nine hours, between 2PM and 5PM, during the three consecutive weekday period which contains the weekday with the highest temperature of the year.”2
Since the profiles used for this update are 8-day profiles, we average the weekday hours between 2 and 5pm to find the CF. In symbols, the CF at building type b is calculated as follows:
𝐶𝐹𝑏 = ��𝑃𝑐𝑡𝐴𝐴𝑏,𝑎 ∙ 𝐶𝐹𝑏,𝑎�𝑎
where 𝐶𝐹𝑏,𝑎 represents the CF at building type b and activity area a (the term 𝑃𝑐𝑡𝐴𝐴𝑏,𝑎 is the same as mentioned above and defined below). The term 𝐶𝐹𝑏,𝑎 is calculated as
𝐶𝐹𝑏,𝑎 =∑ �∑ 𝐻𝑅ℎ,𝑤,𝑏,𝑎
16ℎ=14 �6
𝑤=2
15
We divide by 15 here because we are taking the average over 15 hours. The term 𝐻𝑅ℎ,𝑤,𝑏,𝑎 is the same as used above.
Activity Area Distributions
The Small Com onsite survey included an inventory of rebated technologies beyond the lamps that were actually logged. These data were used to calculate the activity area distributions, which represent the percentage of building lighting attributable to each activity area. These activity area distributions were created separately for CFL and linear lamps.
The first step in the calculation was to find the total lamps surveyed within each activity area at each site. These site – activity area lamp counts were then summed to find the total number of lamps in each building type – activity area.
The lamp count from each building type – activity area was divided by the total number of lamps for that building type to find the percentage distribution. Letting 𝑃𝑐𝑡𝐴𝐴𝑏,𝑎 represent the percentage that activity area a represents within building type b, this calculation is described by the following equations:
𝑃𝑐𝑡𝐴𝐴𝑏,𝑎 =𝐿𝑎𝑚𝑝𝑠𝑏,𝑎
𝐿𝑎𝑚𝑝𝑠𝑏
2http://www.doe2.com/download/AvoidedCost/ConsultantsReport_2006-03-20/3-21-06%20Update%20Attach3.pdf

DEER EFLH and CF Description
Itron, Inc. A-2-4 DEER EFLH and CF Description
where 𝐿𝑎𝑚𝑝𝑠𝑏 = ∑ 𝐿𝑎𝑚𝑝𝑠𝑏,𝑎𝑎 (with the sum being taken over all activity areas a contained within building type b) represents the total number of lamps found at all sites having building type b. Likewise, the term 𝐿𝑎𝑚𝑝𝑠𝑏,𝑎 represents the total number of lamps found in activity areas a at sites with building type b. It is calculated as
𝐿𝑎𝑚𝑝𝑠𝑏,𝑎 = �𝐿𝑎𝑚𝑝𝑠𝑠,𝑎𝑠
where the sum is taken over all sites s with building type b. The term 𝐿𝐴𝑚𝑝𝑠𝑠,𝑎 represents the total number of lamps surveyed in activity area a at site s.
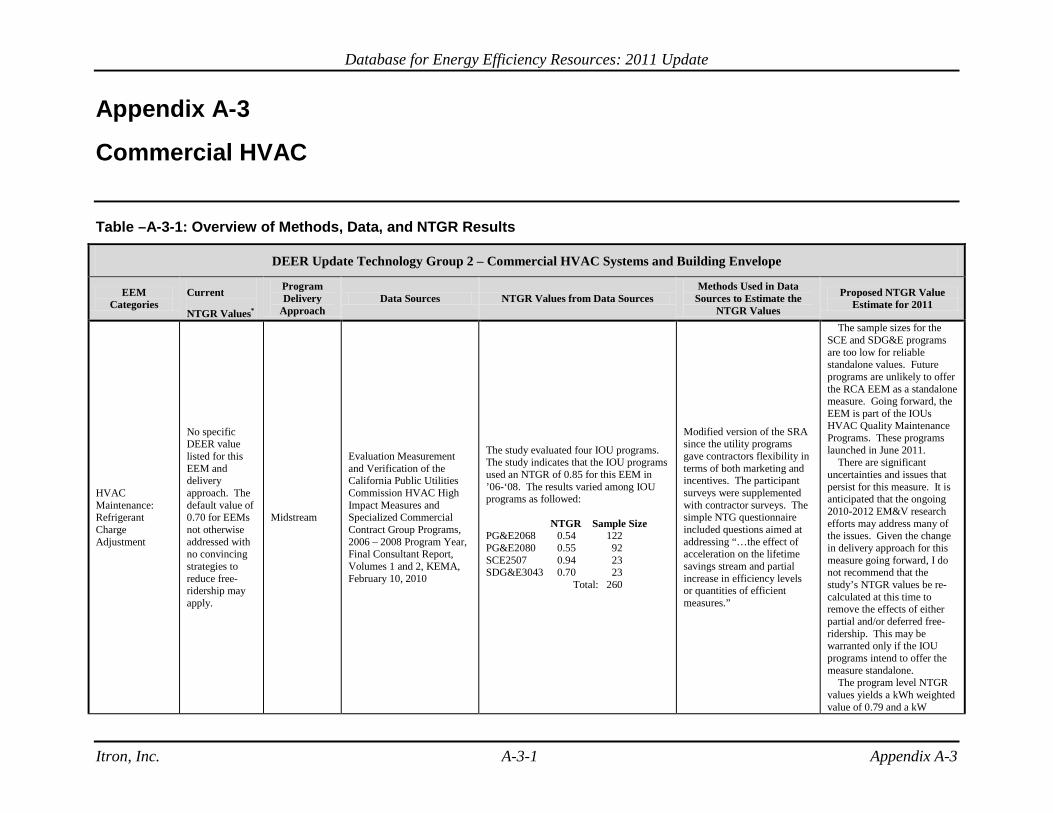
Database for Energy Efficiency Resources: 2011 Update
Itron, Inc. A-3-1 Appendix A-3
Appendix A-3
Commercial HVAC
Table –A-3-1: Overview of Methods, Data, and NTGR Results
DEER Update Technology Group 2 – Commercial HVAC Systems and Building Envelope
EEM Categories
Current
NTGR Values*
Program Delivery
Approach Data Sources NTGR Values from Data Sources
Methods Used in Data Sources to Estimate the
NTGR Values
Proposed NTGR Value Estimate for 2011
HVAC Maintenance: Refrigerant Charge Adjustment
No specific DEER value listed for this EEM and delivery approach. The default value of 0.70 for EEMs not otherwise addressed with no convincing strategies to reduce free-ridership may apply.
Midstream
Evaluation Measurement and Verification of the California Public Utilities Commission HVAC High Impact Measures and Specialized Commercial Contract Group Programs, 2006 – 2008 Program Year, Final Consultant Report, Volumes 1 and 2, KEMA, February 10, 2010
The study evaluated four IOU programs. The study indicates that the IOU programs used an NTGR of 0.85 for this EEM in ’06-‘08. The results varied among IOU programs as followed: NTGR Sample Size PG&E2068 0.54 122 PG&E2080 0.55 92 SCE2507 0.94 23 SDG&E3043 0.70 23 Total: 260
Modified version of the SRA since the utility programs gave contractors flexibility in terms of both marketing and incentives. The participant surveys were supplemented with contractor surveys. The simple NTG questionnaire included questions aimed at addressing “…the effect of acceleration on the lifetime savings stream and partial increase in efficiency levels or quantities of efficient measures.”
The sample sizes for the SCE and SDG&E programs are too low for reliable standalone values. Future programs are unlikely to offer the RCA EEM as a standalone measure. Going forward, the EEM is part of the IOUs HVAC Quality Maintenance Programs. These programs launched in June 2011.
There are significant uncertainties and issues that persist for this measure. It is anticipated that the ongoing 2010-2012 EM&V research efforts may address many of the issues. Given the change in delivery approach for this measure going forward, I do not recommend that the study’s NTGR values be re-calculated at this time to remove the effects of either partial and/or deferred free-ridership. This may be warranted only if the IOU programs intend to offer the measure standalone.
The program level NTGR values yields a kWh weighted value of 0.79 and a kW
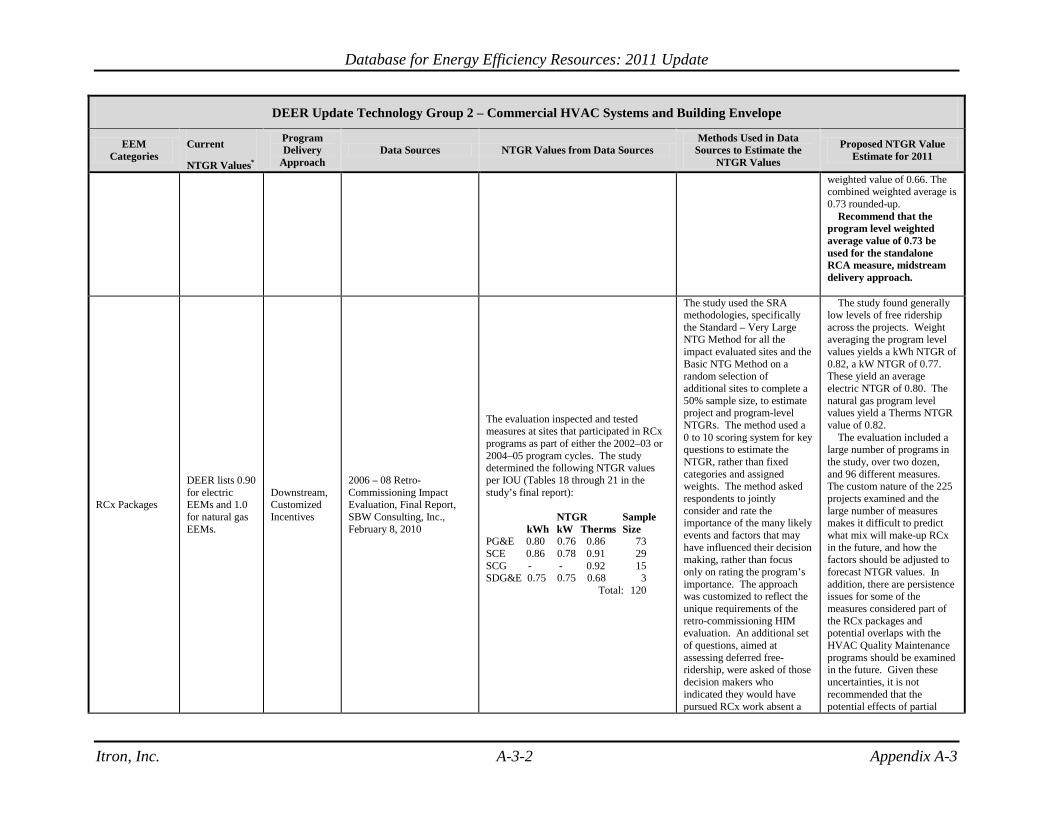
Database for Energy Efficiency Resources: 2011 Update
Itron, Inc. A-3-2 Appendix A-3
DEER Update Technology Group 2 – Commercial HVAC Systems and Building Envelope
EEM Categories
Current
NTGR Values*
Program Delivery
Approach Data Sources NTGR Values from Data Sources
Methods Used in Data Sources to Estimate the
NTGR Values
Proposed NTGR Value Estimate for 2011
weighted value of 0.66. The combined weighted average is 0.73 rounded-up.
Recommend that the program level weighted average value of 0.73 be used for the standalone RCA measure, midstream delivery approach.
RCx Packages
DEER lists 0.90 for electric EEMs and 1.0 for natural gas EEMs.
Downstream, Customized Incentives
2006 – 08 Retro-Commissioning Impact Evaluation, Final Report, SBW Consulting, Inc., February 8, 2010
The evaluation inspected and tested measures at sites that participated in RCx programs as part of either the 2002–03 or 2004–05 program cycles. The study determined the following NTGR values per IOU (Tables 18 through 21 in the study’s final report): NTGR Sample kWh kW Therms Size PG&E 0.80 0.76 0.86 73 SCE 0.86 0.78 0.91 29 SCG - - 0.92 15 SDG&E 0.75 0.75 0.68 3 Total: 120
The study used the SRA methodologies, specifically the Standard – Very Large NTG Method for all the impact evaluated sites and the Basic NTG Method on a random selection of additional sites to complete a 50% sample size, to estimate project and program-level NTGRs. The method used a 0 to 10 scoring system for key questions to estimate the NTGR, rather than fixed categories and assigned weights. The method asked respondents to jointly consider and rate the importance of the many likely events and factors that may have influenced their decision making, rather than focus only on rating the program’s importance. The approach was customized to reflect the unique requirements of the retro-commissioning HIM evaluation. An additional set of questions, aimed at assessing deferred free-ridership, were asked of those decision makers who indicated they would have pursued RCx work absent a
The study found generally low levels of free ridership across the projects. Weight averaging the program level values yields a kWh NTGR of 0.82, a kW NTGR of 0.77. These yield an average electric NTGR of 0.80. The natural gas program level values yield a Therms NTGR value of 0.82.
The evaluation included a large number of programs in the study, over two dozen, and 96 different measures. The custom nature of the 225 projects examined and the large number of measures makes it difficult to predict what mix will make-up RCx in the future, and how the factors should be adjusted to forecast NTGR values. In addition, there are persistence issues for some of the measures considered part of the RCx packages and potential overlaps with the HVAC Quality Maintenance programs should be examined in the future. Given these uncertainties, it is not recommended that the potential effects of partial

Database for Energy Efficiency Resources: 2011 Update
Itron, Inc. A-3-3 Appendix A-3
DEER Update Technology Group 2 – Commercial HVAC Systems and Building Envelope
EEM Categories
Current
NTGR Values*
Program Delivery
Approach Data Sources NTGR Values from Data Sources
Methods Used in Data Sources to Estimate the
NTGR Values
Proposed NTGR Value Estimate for 2011
program. and/or deferred free-ridership be removed from this measure at this time.
Recommend that we use the overall weighted average values of NTGR for electric and natural gas, 0.80 and 0.82, for the RCx Packages EEM.
Water-Cooled Chillers: Centrifugal, Screw, Scroll, Reciprocating, Centrifugal with VSD, Screw with VSD, “Frictionless” with VSD Air-Cooled Chillers: Screw, Scroll, Reciprocating, Screw with VSD, “Frictionless” with VSD
DEER listing for “All HVAC” for Large Non-residential Customized Incentives is 0.64. (This is the same value adopted for all Large Non-Residential Custom Measures.)
Customized Incentives
Major Commercial Contract Group, Volume I, Final Impact Evaluation Report, 2006 – 2008 Program Years, SBW Consulting, Inc., February 10, 2010
The study determined the following NTGR for IOU programs that included Custom HVAC measures in the results mix: NTGR Sample kWh kW Sizes SCE2517 0.59 0.57 47 SDGE3010 0.70 0.68 33 SDGE3025 0.56 0.54 27 Total: 107
The study used the SRA methodology to estimate the NTGR values. Three levels of analysis methodologies were used: the Standard – Very Large applied to the largest and most complex projects. The Standard NTGR approach involves a less detailed level of analysis, was applied to projects with moderately high levels of gross savings. The Basic NTGR was applied to all remaining projects.
The paid incentive was the main determinant used to assign a project to an assigned rigor level. Sites with incentives of $200,000 or more were assigned to the Standard Very Large rigor level and sites with incentives less than $50,000 were assigned to the Basic rigor level. All other sites were assigned to the Standard rigor level. Supplemental Decision Maker questions were posed to those sites assigned to the Standard and Standard Very Large rigor levels.
The NTGR values were calculated as the average of
There are two ways to derive a representative Chiller Replacement NTGR: (1) Weight averaging the program level values that contain Custom HVAC. This approach yields a kWh weighted value of 0.60, a kW weighted value of 0.59, and an overall average of 0.59. (2) Use the project level NTGR values for chiller projects found among the samples. The main drawback is the low number of chiller projects (14). Averaging the project level values yields an NTGR of 0.56. Thus, the two approaches yield values within a very narrow range, from 0.56 to 0.59.
The study does not indicate that there are adjustments for partial free-ridership. However, deferred free-ridership adjustments are apparent in the chiller project level values, but given the low sample size, unaddressed free-ridership issues in the Custom Incentive Programs, and the narrow range of the weighted averages, and the ongoing efforts of the Custom and Ex

Database for Energy Efficiency Resources: 2011 Update
Itron, Inc. A-3-4 Appendix A-3
DEER Update Technology Group 2 – Commercial HVAC Systems and Building Envelope
EEM Categories
Current
NTGR Values*
Program Delivery
Approach Data Sources NTGR Values from Data Sources
Methods Used in Data Sources to Estimate the
NTGR Values
Proposed NTGR Value Estimate for 2011
three scores: (1) Timing and Selection, (2) Program Influence, and (3) No-Program. The No-Program score includes adjustments for deferred free-ridership.
Ante reviews, removing the effect of deferred free-ridership is not warranted.
Recommend that the mid-point of the range, rounded up to 0.58, be used as the Chiller Replacement NTGR value for the Customized Incentive delivery approach.
Water- and Air-Cooled Package Heat Pumps and Air Conditioners Air-Cooled Split System Air Conditioners and Heat Pumps
The DEER uses the default NTGR of 0.85 for the Upstream Prescriptive Rebates for Packaged AC Systems from 65 - 135 kBTU/hr in size. For Downstream Prescriptive Rebates, the DEER lists a value of 0.50 for packaged systems under Other HVAC.
Upstream, Downstream
Evaluation Measurement and Verification of the California Public Utilities Commission HVAC High Impact Measures and Specialized Commercial Contract Group Programs, 2006 – 2008 Program Year, Final Consultant Report, Volumes 1 and 2, KEMA, February 10, 2010
The study estimated NTGR values for the following IOU programs based on vendor surveys only (Table 6-44): NTGR Sample Program kWh kW Sizes PGE2080 0.94 0.94 10 SCE2507 0.96 0.96 10 SDGE3029 0.94 0.94 10 Total: 30 The actual vendor survey sample sizes were found in the study’s Appendix G.
The SRA methodologies were employed along with vendor surveys for several programs. If no customer survey was implemented for the evaluated program, the vendor survey results were used for the NTGR estimates. If a customer survey was implemented, the vendor survey score replaced the Timing and Selection score from the customer survey. Vendor surveys were conducted for all the non-residential programs. A customer survey was conducted only for the SDGE 3029 program. The survey was considered not a good fit for the customer class since it produced a 97% free-ridership value, diametrically the opposite result of the vendor surveys. Hence, the study NTGR results use only the vendor surveys to produce a consistent set of NTGR values.
The report does not separate and present the results by the upstream and downstream delivery approaches. Appendix G indicates that the participating distributors surveyed were from the upstream programs. Also, the study relied solely on the vendor surveys for its results, which tend to produce high NTGR values. The study does not clearly indicate whether the non-residential results were adjusted for either partial and/or deferred free-ridership. The presented NTGR values are the result of only vendor surveys and the VMAX score. It is difficult to conclude that the study results are a reliable indicator of the program’s free-ridership due to the small sample sizes and sole reliance on the vendor surveys.
Recommend that no adjustments to the NTGR values for Packaged and Split Systems AC Replacements be made based on the study’s results.

Database for Energy Efficiency Resources: 2011 Update
Itron, Inc. A-3-5 Appendix A-3
Table A-3-1: Weight Averaged 2006 – 2008 NTGR Values for the 2011 DEER Update
RCA EEM Ex Post kWh Savings NTGR by kWh Col C * Col D Ex Post kW Reduction NTGR by kW Col F * Col G
PGE2068 2,172,294 0.54 1,173,039 1,923 0.54 1,038 PGE2080 1,814,383 0.55 997,911 13,339 0.55 7,336 SCE2507 7,020,259 0.94 6,599,043 5,923 0.94 5,568 SDGE3043 619,598 0.70 433,719 2,183 0.70 1,528
Totals: 11,626,534 9,203,711 23,368 15,471 kWh Weighted Average: 0.79 kW Weighted Average: 0.66
0.73
RCx EEM
Number of Projects Ex Post kWh Savings NTGR by kWh Col C * Col D Ex Post kW Reduction NTGR by kW Col F * Col G Ex Post Therms Savings NTGR Col I * Col J
PG&E 135 24,077,925 0.80 19,262,340 1,755 0.76 1,334 990,090 0.76 752,468 SCE 58 22,255,296 0.86 19,139,555 1,740 0.78 1,357 26,796 0.91 24,384 SCG 28 - - - - 664,580 0.92 611,414 SDG&E 4 2,427,396 0.75 1,820,547 516 0.75 387 45,816 0.68 31,155
Totals: 225 48,760,617 40,222,442 4,011 3,078 1,727,282 1,419,421 kWh Weighted Average: 0.82 kW Weighted Average: 0.77 Therms Weighted Average: 0.82
0.80
Custom EEM (Proxy for Chiller Replacement EEM)
Number of Projects Ex Post kWh Savings NTGR by kWh Col C * Col D Ex Post kW Reduction NTGR by kW Col F * Col G
SCE2517 1,397 384,031,109 0.59 226,578,354 57,277 0.57 32,648 SDGE3010 719 80,812,005 0.70 56,568,404 12,223 0.68 8,312 SDGE3025 343 57,426,089 0.54 31,010,088 7,203 0.56 4,034
- - - -
Totals: 2459 522,269,203 314,156,846 76,703 44,993 kWh Weighted Average: 0.60 kW Weighted Average: 0.59
0.59

Database for Energy Efficiency Resources: 2011 Update
Itron, Inc. A-3-6 Appendix A-3
Table 53: SCE2517 SPC NTGR Scoring Componen Table 56: SDGE3025-Electric NTGR ScoringComponents and Final Score for Sampled Table 58: SDGE3010-Electric NTGR Sc SBW ID M00490 M00502 M00535 M25098 M01208 M01315 M01323 M01326 M49222 M01357 M49153 M48838 M49024 M48711IOU Measure ID 2006-535 2006-520 2006-281 2007-703 1/1/3023 1/2/3197 1/1/3024 1/1/3197 1/1/3483 1/1/3216 1/1/3357 3518-2650-3518-2971 3518-2411-1HIM N/A N/A N/A Custom HVAC N/A N/A N/A N/A N/A Custom HVAC Custom HVAC N/A N/A Custom HVACCase Weight 152 152 152 152 85.3 27 27 27 3 3 3 14 73.5 14Measure Description Turbocor Co Chiller VS 75-200 Ton Replace two 26 230 ton Ch High Effici Chiller RepHigh Effici Chiller 1- 365 ton Chill chiller replacemConvert ai 400-TON S Retrofit with T Timing and Selection - Decision Maker Survey 8 10 10 10 9 6 10 5 6 10 10 8 9 10Program Influence - Decision Maker Survey 3.5 8 3 10 5 4 8 4 4 8 2 6 4 3No-Program - Decision Maker Survey 3 4.3 7.7 0 5.7 5.2 9.4 5.2 0 4.3 0 6.6 3 4Standard Scoring NTGR 0.48 0.74 0.69 0.5 0.66 0.51 0.91 0.47 0.2 0.74 0.1 0.69 0.53 0.57Timing and Selection - Adjusted or Concensus N/A N/A N/A N/A N/A N/A N/A N/A N/A N/A N/A 8 N/A N/AProgram Influence - Adjusted or Concensus N/A N/A N/A N/A N/A N/A N/A N/A N/A N/A N/A 6 N/A N/ANo-Program - Adjusted or Concensus N/A N/A N/A N/A N/A N/A N/A N/A N/A N/A N/A 6.6 N/A N/AWas Standard Very Large (Y/N) N N N N N N N N N N N Y N N Current NTGR: 0.64 Scoring Overridden by other information (Y/N) N N N N N N N N N N N N N N No. of Observations: 14 Final NTGR 0.48 0.74 0.69 0.50 0.66 0.51 0.91 0.47 0.20 0.74 0.10 0.69 0.53 0.57 As-is Average NTGR: 0.56
0.48 0.74 0.69 0.50 0.66 0.51 0.91 0.47 0.20 0.74 0.10 0.69 0.53 0.57 Recommended Mid-Point NTGR: 0.58

Database for Energy Efficiency Resources: 2011 Update
Itron, Inc. A-4-1 Appendix A-4
Appendix A-4
Commercial Refrigeration
Table A-4-0-1: Overview of Methods, Data and NTGR Results by Method DEER Updates Technology Group 5 – Commercial Refrigeration
EEM Categories
Current NTGRs
Program Delivery Approach
Data Sources NTGRs from Data Sources
Methods Used in Data Sources to Estimate the NTGR Values
Recommendations and Proposed Approaches to Estimate “Forward-Looking” NTGR Values
Door Gasket - Vertical & Horizontal Reach-In Refrigerated Display Cases, Walk-in Coolers & Freezers
DEER 0.46
Downstream Prescriptive
Commercial Facilities Contract Group 2006 – 2008 Direct Impact Evaluation Study, Volumes 1 and 3, February 18, 2010, ADM
NTGR of 0.19
The NTG method relied exclusively on the Self-Report Approach (SRA) using a telephone survey to estimate project and domain-level Net-to-Gross Ratios. The survey for door gaskets was a modified version of the standard net-to-gross battery due to either maintenance contracts for door gasket replacements, internal program for maintaining door gaskets, or door gaskets were provided at no charge. The net-to-gross ratio was formed by averaging the composite program summary influence score and likelihood score.
Use the 0608 study results even though The difference between the existing DEER
NTGR and the 0608 represents a 27%/37%
change and the review did not find any justification for
or discussion on the low NTGR. It is likely that the high free ridership may be due to the baseline issues.
Strip Door Curtains
DEER 0.76
Downstream Prescriptive
Commercial Facilities Contract Group 2006 – 2008 Direct Impact Evaluation Study, Volumes 1 and 3, February 18, 2010, ADM
NTGR of 0.40
The NTG method relied exclusively on the Self-Report Approach (SRA) using a telephone survey to estimate project and domain-level Net-to-Gross Ratios. The survey for strip curtains was a modified version of the standard net-to-gross battery. due to either maintenance contracts for door gasket replacements, internal program for maintaining door gaskets, or door
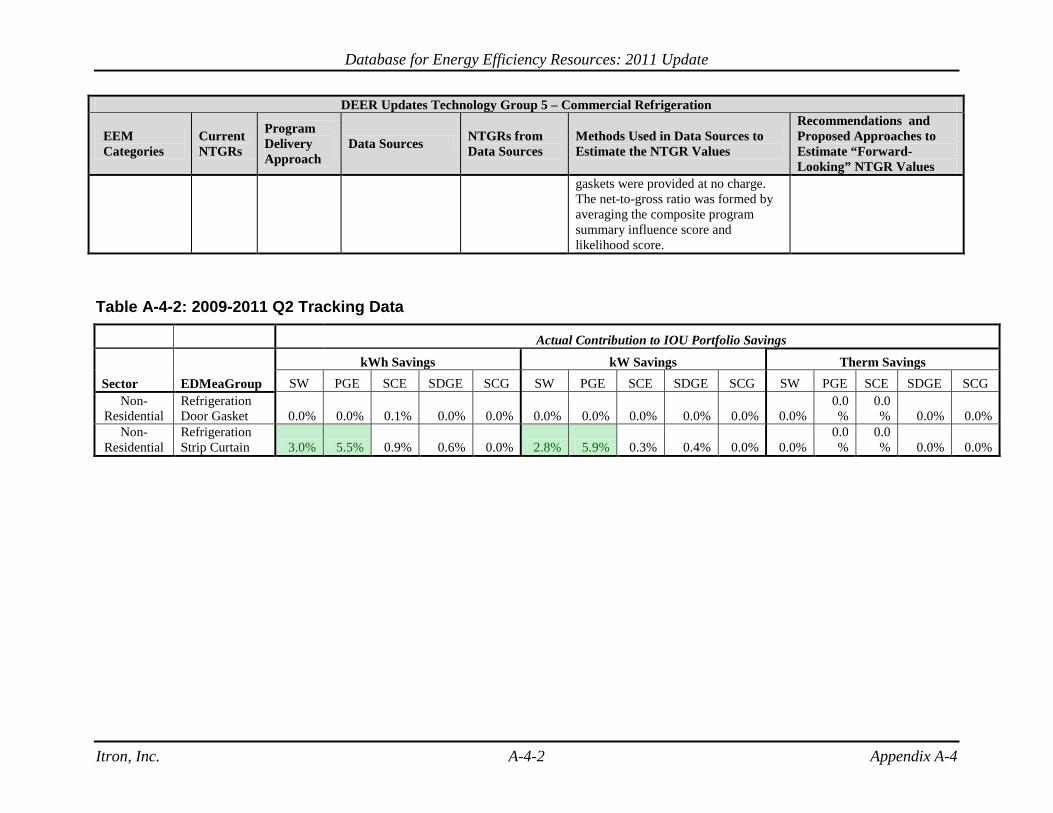
Database for Energy Efficiency Resources: 2011 Update
Itron, Inc. A-4-2 Appendix A-4
DEER Updates Technology Group 5 – Commercial Refrigeration
EEM Categories
Current NTGRs
Program Delivery Approach
Data Sources NTGRs from Data Sources
Methods Used in Data Sources to Estimate the NTGR Values
Recommendations and Proposed Approaches to Estimate “Forward-Looking” NTGR Values
gaskets were provided at no charge. The net-to-gross ratio was formed by averaging the composite program summary influence score and likelihood score.
Table A-4-2: 2009-2011 Q2 Tracking Data
Actual Contribution to IOU Portfolio Savings
kWh Savings kW Savings Therm Savings Sector EDMeaGroup SW PGE SCE SDGE SCG SW PGE SCE SDGE SCG SW PGE SCE SDGE SCG
Non- Residential
Refrigeration Door Gasket 0.0% 0.0% 0.1% 0.0% 0.0% 0.0% 0.0% 0.0% 0.0% 0.0% 0.0%
0.0%
0.0% 0.0% 0.0%
Non- Residential
Refrigeration Strip Curtain 3.0% 5.5% 0.9% 0.6% 0.0% 2.8% 5.9% 0.3% 0.4% 0.0% 0.0%
0.0%
0.0% 0.0% 0.0%

Database for Energy Efficiency Resources: 2011 Update
Itron, Inc. A-5-1 Appendix A-5
Appendix A-5
Residential HVAC
Table A-5-1: Overview of Methods, Data, and NTGR Results
DEER Update Technology Group 8 – Residential HVAC Systems and Building Envelope
EEM Categories
Current NTGR Values
Program Delivery
Approach Data Sources NTGR Values in Data Sources Methods Used in Data Sources
to Estimate the NTGR Values Proposed NTGR Value
Estimate for 2011
Room Air Conditioners 0.70 Downstream
EM&V of the CPUC Residential Retrofit High Impact Measure Evaluation Report and Appendices, February 8, 2010, The CADMUS Group [Ch. 12]
The study determined the following NTGR values for the IOU programs: kWh Sample PGE 0.41 91 SCE 0.36 629 SDG&E 0.31 377 Total: 1,097
Self-Report Approach was used to estimate the net-to-gross ratio. The NTG ratio was developed using a consistent method based on measure delivery channel with appropriate decision maker phone SR surveys administered to a representative sample.
The study states for RACs that “…the self-report NTG estimated free-ridership of 58%-74%. This high rate, however, is somewhat inconsistent with the market share data reported by the Department of Energy (DOE). The National ENERGY STAR Retailer Partners are required to annually provide sales data to the DOE for dishwashers, clothes washers, room air conditioners, and refrigerators. In 2006-2008 the National ENERGY STAR retailer partners reported the national market share data for ENERGY STAR room air conditioners was 36%, 50%, and 43%, respectively. While this is not an estimate of free-ridership, it is an indication that sales of ENERGY STAR room air conditioners were in the 36%-50% range throughout the U.S., substantially lower than the self-reported estimate of free-ridership in this study.”
The reported Energy Star RAC sales in California are 36% in 2009, 38% in 2008, 51% in 2007, and 21% in 2006. Although retail partners that provide data to Energy Star may vary year to year making reliable direct comparisons difficult, a review

Database for Energy Efficiency Resources: 2011 Update
Itron, Inc. A-5-2 Appendix A-5
DEER Update Technology Group 8 – Residential HVAC Systems and Building Envelope
EEM Categories
Current NTGR Values
Program Delivery
Approach Data Sources NTGR Values in Data Sources Methods Used in Data Sources
to Estimate the NTGR Values Proposed NTGR Value
Estimate for 2011
of the incremental cost trend and general availability of RAC units by EER level is warranted to consider an adjustment for the final recommended NTGR for the 2013-2014 timeframe.
In the interim, we recommend a 0.36 program level weighted average NTGR.
HVAC Maintenance: Duct Sealing
0.78 Free Tune-up/Repair
EM&V of the California Public Utilities Commission HVAC High Impact Measures and Specialized Commercial Contract Group Programs, 2006 – 2008 Program Year, Final Consultant Report, Volumes 1 and 2, KEMA, February 2010 [Ch. 7]
The electric energy savings weighted results are specific to the duct sealing measures within those programs and not reflective of the total program net-to-gross ratios. NTGR Sample PG&E2000 0.54 211 PGE2078 0.85 103 SCE2501 0.79 102 SCE2507 0.96 112 SDGE3035 0.80 102 Total: 630
Self-Report Approach was used to estimate the net-to-gross ratio. The program deliveries allowed flexibility to the contractor in terms of the marketing and incentive, especially for RCA and duct-sealing measures. This required a method that supplemented the participant self-report surveys with contractor surveys. The NTGR algorithm derived four separate measurements of free-ridership from different inquiry routes. These four measurements were averaged to derive the final free-ridership estimate at the measure level.
The study has errors in some of the tables for the measure install rates where the correct PASS value was not used. Our weighted averages used for the below review corrected for this problem.
An overall program level weighted average, including the CMMHP programs, yields an overall electric energy savings NTGR of 0.64 and a natural gas energy savings NTGR of 0.60. Excluding the CMMHP programs from the overall program averages yields an NTGR 0.58 for electric savings and 0.56 for natural gas savings. The weighted average of the CMMHP only programs yields an NTGR of 0.79 for electric savings and 0.80 for natural gas savings.
The NTGR result for the PG&E2000R program appears to be an outlier compared to the other programs. The study did not offer a direct explanation why there is such a large difference. Our review points to two possibilities. First, the PG&E2000R was the only survey with significant number of respondents to all four parts of the free-ridership measurements and the only one with enough respondents to part four (Table 7-13). Hence, it may be the only NTGR result that is based on the average of all four parts,

Database for Energy Efficiency Resources: 2011 Update
Itron, Inc. A-5-3 Appendix A-5
DEER Update Technology Group 8 – Residential HVAC Systems and Building Envelope
EEM Categories
Current NTGR Values
Program Delivery
Approach Data Sources NTGR Values in Data Sources Methods Used in Data Sources
to Estimate the NTGR Values Proposed NTGR Value
Estimate for 2011
while the others may be the average of two or three of the components.
Second, the PG&E2000R survey results had the highest proportion of respondents with an extreme “0.9 – 1” free-ridership ratio that isn’t offset by a higher proportion of respondents in the opposite extreme of “0-0.1” free-ridership ratio range. Not including the PG&E200R results in the program level weighted averages yields NTGR values close to 0.81 for both electric and natural gas savings.
The IOU level weighted averages
are also a possible alternative and they would be as follows:
IOU Electric Nat. Gas PG&E 0.56 0.57 SCE 0.83 - SCG - 0.79 SDG&E 0.80 0.80 Thus, the utility level values again
point to the PG&E result as a potential extreme.
Taking into consideration that the standalone DTS EEM may become a bundled EEM within the broader scope the IOUs HVAC Maintenance programs, and that it is difficult to judge, without detail examination of the survey responses and scoring, whether the PG&E2000R result is the one valid result and the other program results are outliers or vice-versa, the TG8 team believes that the ’06-’08 NTGR results should not be used to determine a revised NTGR for the standalone DTS EEM.
Recommend no change to the
current NTGR value of 0.78 for

Database for Energy Efficiency Resources: 2011 Update
Itron, Inc. A-5-4 Appendix A-5
DEER Update Technology Group 8 – Residential HVAC Systems and Building Envelope
EEM Categories
Current NTGR Values
Program Delivery
Approach Data Sources NTGR Values in Data Sources Methods Used in Data Sources
to Estimate the NTGR Values Proposed NTGR Value
Estimate for 2011
midstream and downstream delivery.
HVAC Maintenance: Refrigerant Charge Adjustment
0.78 Free Tune-up/Repair
Evaluation Measurement and Verification of the California Public Utilities Commission HVAC High Impact Measures and Specialized Commercial Contract Group Programs, 2006 – 2008 Program Year, Final Consultant Report, Volumes 1 and 2, KEMA, February 2010 [Ch. 5]
The study utilized telephone surveys to estimate the following: NTGR PG&E2000 0.63 PG&E2078R 0.78 SCE2502 0.78 SCE2507 0.97 SDGE3035 0.78
Similar to Duct Sealing NTG - A participant self-report approach was used to estimate the net-to-gross ratio. The program deliveries allowed flexibility to the contractor in terms of the marketing and incentive, especially for RCA and duct-sealing measures. This required a method that supplemented the participant self-report surveys with contractor surveys. The NTGR algorithm derived four separate measurements of free-ridership from different inquiry routes. These four measurements were averaged to derive the final free-ridership estimate at the measure level.
The program level NTGR results from this study yield an ex post energy weighted average value of 0.88 due primarily to the large ex post savings and high NTGR value for the SCE 2507 program (0.97). The differences among the program results are not well explained in the study. As with the DTS EEM, the PG&E 2000 program low results are affected by the extreme responses within the single family surveys (“0-0.1 FR ratio: 0% and 0.9-1 FR ratio 13.8%). Without the SCE result included in the average, the weighted average drops to 0.68. The midpoint between the two weighted average values is 0.78, the currently adopted value for this measure.
In addition, future programs are unlikely to offer the RCA EEM as a standalone measure. Going forward, the EEM is part of the HVAC Quality Maintenance Programs. The programs launched in June 2011.
There are significant uncertainties and issues that persist for this measure. It is anticipated that the ongoing 2010-2012 EM&V research efforts may address many of the issues. Given the change in delivery approach for this measure going forward, I do not recommend the study’s NTGR values be used to set the recommended 2011 NTGR value.
Recommend no change to the
existing NTGR value of 0.78 for midstream delivery.

Database for Energy Efficiency Resources: 2011 Update
Itron, Inc. A-5-5 Appendix A-5
DEER Update Technology Group 8 – Residential HVAC Systems and Building Envelope
EEM Categories
Current NTGR Values
Program Delivery
Approach Data Sources NTGR Values in Data Sources Methods Used in Data Sources
to Estimate the NTGR Values Proposed NTGR Value
Estimate for 2011
Roof and Wall Insulation 0.70 Downstream
EM&V of the CPUC Residential Retrofit HIM Evaluation Report and Appendices, February 8, 2010, The CADMUS Group [Ch. 10]
The study determined the following NTGR values for the IOU programs: kWh kW Therms PG&E 0.25 0.28 0.26 SCG 0.30 0.30 0.30 SDG&E 0.25 0.26 0.25
The evaluation used the Joint Simple SR NTG Method. The study provides little discussion about these NTGR results.
The study’s approach to determining the effective level of insulation levels was reasonable and the NTGR values all cluster about the same value. This measure has been offered for well over 30 years. The measure may eventually be offered only as part of the Whole House retrofit bundles in the future and cease as a standalone measure.
Recommend a program level
weighted average of 0.28 for downstream delivery.
Air Cooled Packaged and Split System Air Conditioners and Heat Pumps
0.67, SEER≥14 0.80, SEER≥15 for AC units 0.55 for Heat Pumps
Downstream Prescriptive
Evaluation Measurement and Verification of the California Public Utilities Commission HVAC High Impact Measures and Specialized Commercial Contract Group Programs, 2006 – 2008 Program Year, Final Consultant Report, Volumes 1 and 2, KEMA, February 2010 [Ch. 6]
Telephone and onsite surveys were used to estimate the following NTGRs by IOU: kWh kW SCE2507 0.56 0.56 SDGE3029 0.53 0.54
Self-Report Approach - The NTG ratio was developed using a consistent method based on measure delivery channel with appropriate decision maker surveys administered to a representative sample.
The two residential AC replacement programs, where the residential/small commercial NTG battery was administered, have consistent NTG ratios of 53% to 56% which are very reasonable considering the amount of “green” messaging from multiple sources during the last five years and the marketing around high efficiency air conditioners. The study provides no distinction by SEER level and system types. The study did determine differences in the savings by replace-on-burnout (ROB), new construction (NC), and early retirement (ER), but did not attempt to determine separate NTGR values by delivery method.
Weight averaging the program level NTGR values by energy savings and demand reduction Totals for Overall, ROB/NEW, or ER cluster about the value of 0.55.
Recommend the adoption of a
statewide value of 0.55.

Database for Energy Efficiency Resources: 2011 Update
Itron, Inc. A-5-6 Appendix A-5
Table A-5-2: Weight Averaged 2006 – 2008 NTGR Values for the 2011 DEER Update
Room AC EEMEx Post kWh Savings NTGR by kWh Col C * Col D Ex Post kW Reduction NTGR by kW Col F * Col G
PGE2000 710,100 0.41 291,141 1,102 0.41 452 SCE2501 7,767,934 0.36 2,796,456 7,150 0.36 2,574 SDGE3024 1,108,704 0.31 343,698 1,062 0.31 329
- -
Totals: 9,586,738 3,431,295 9,314 3,355 kWh Weighted Average: 0.36 kW Weighted Average: 0.36
'06-'08 Weighted Average: 0.36
Duct Seal EEMEx Ante kWh Savings Ex Post kWh Savings NTGR by kWh Col C * Col D Ex Post Therms Savings NTGR Col I * Col J
PGE2000R 6,148,183 3,320,019 0.54 1,792,810.16 478,929 0.54 258,621 PGE2078 414,452 169,925 0.85 144,436.52 28,952 0.85 24,609
CMMHP SCE2502/SCG3539 2,245,083 920,484 0.79 727,182.38 34,641 0.79 27,366 SCE2507 508,596 249,721 0.96 239,731.81 - 0.96 -
CMMHP SDGE3035 900,668 369,274 0.80 295,419.10 80,235 0.80 64,188
Totals: 10,216,982 5,029,423 3,199,579.98 622,757 374,785 kWh Weighted Average: 0.64 Therms Weighted Average: 0.60

Database for Energy Efficiency Resources: 2011 Update
Itron, Inc. A-5-7 Appendix A-5
RCA EEM Table 5-44 Ex Post kWh Savings NTGR by kWh Col C * Col D
PGE2000 4,114,962 0.63 2,592,426 PGE2078 406,930 0.78 317,405
CMMHP SCE2502 1,497,279 0.78 1,167,878 SCE2507 13,893,277 0.97 13,476,479
CMMHP SDGE3035 402,109 0.78 313,645
Totals: 20,314,557 17,867,833 kWh Weighted Average: 0.88
Without SCE2507: 0.68 Average: 0.78
Roof and Wall Insulation EEMsVerified SQFT Ex Post kWh Savings NTGR by kWh Col C * Col D Ex Post kW Reduction NTGR by kW Col F * Col G Ex Post Therms Savings NTGR Col I * Col J
PGE2000 17,119,510 1,561,946 0.25 390,486.47 3,258 0.28 912 890,215 0.26 231,456 SCG3517 16,148,192 3,808,147 0.30 1,142,444.14 2,012 0.30 604 823,558 0.29 238,832 SDGE3024 3,362,520 361,253 0.25 90,313.24 374 0.26 97 127,776 0.25 31,944
- - - - - -
Totals: 36,630,222 5,731,346 1,623,244 5,644 1,613 1,841,548 502,231 kWh Weighted Average: 0.28 kW Weighted Average: 0.29 Therms Weighted Average: 0.27
'06-'08 Weighted Average: 0.28
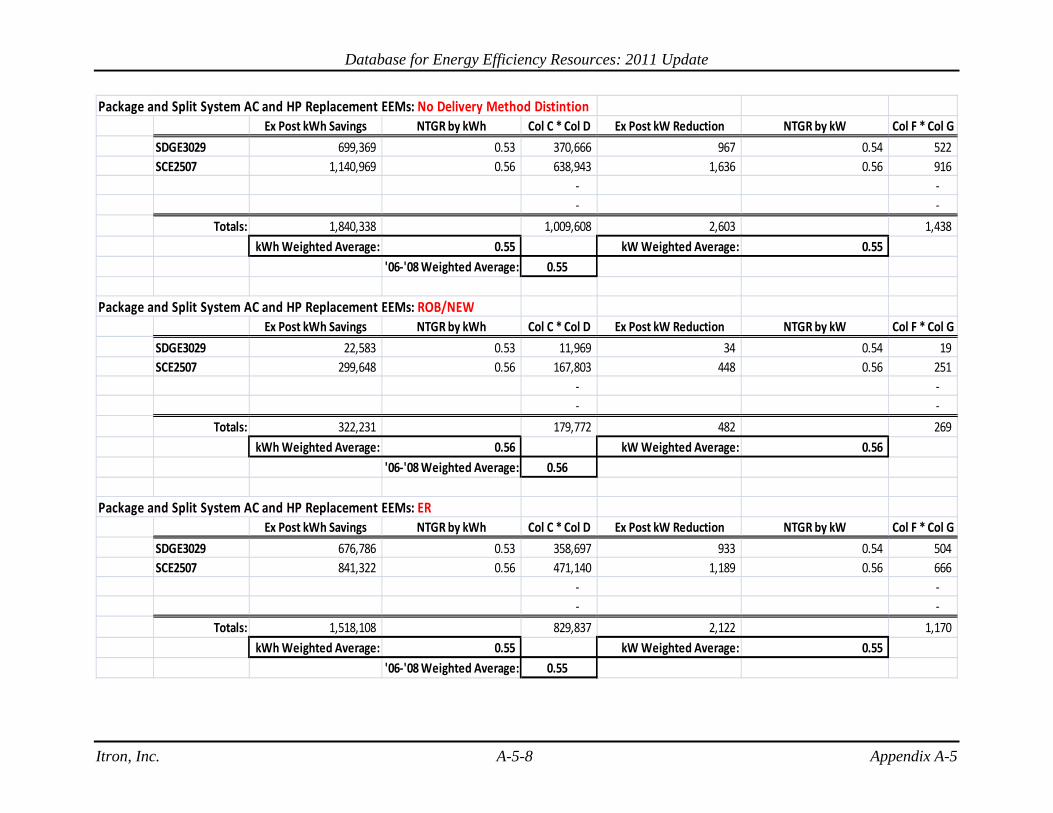
Database for Energy Efficiency Resources: 2011 Update
Itron, Inc. A-5-8 Appendix A-5
Package and Split System AC and HP Replacement EEMs: No Delivery Method DistintionEx Post kWh Savings NTGR by kWh Col C * Col D Ex Post kW Reduction NTGR by kW Col F * Col G
SDGE3029 699,369 0.53 370,666 967 0.54 522 SCE2507 1,140,969 0.56 638,943 1,636 0.56 916
- - - -
Totals: 1,840,338 1,009,608 2,603 1,438 kWh Weighted Average: 0.55 kW Weighted Average: 0.55
'06-'08 Weighted Average: 0.55
Package and Split System AC and HP Replacement EEMs: ROB/NEWEx Post kWh Savings NTGR by kWh Col C * Col D Ex Post kW Reduction NTGR by kW Col F * Col G
SDGE3029 22,583 0.53 11,969 34 0.54 19 SCE2507 299,648 0.56 167,803 448 0.56 251
- - - -
Totals: 322,231 179,772 482 269 kWh Weighted Average: 0.56 kW Weighted Average: 0.56
'06-'08 Weighted Average: 0.56
Package and Split System AC and HP Replacement EEMs: EREx Post kWh Savings NTGR by kWh Col C * Col D Ex Post kW Reduction NTGR by kW Col F * Col G
SDGE3029 676,786 0.53 358,697 933 0.54 504 SCE2507 841,322 0.56 471,140 1,189 0.56 666
- - - -
Totals: 1,518,108 829,837 2,122 1,170 kWh Weighted Average: 0.55 kW Weighted Average: 0.55
'06-'08 Weighted Average: 0.55

Database for Energy Efficiency Resources: 2011 Update
Itron, Inc. A-6-1 Appendix A-6
Appendix A-6 Residential & Non-Residential Water Heating
Table A-6-1: Overview of Methods, Data Sources, and NTGR Results by Measure DEER Updates Technology Group 3 – Residential and Commercial Water Heating
EEM Categories Current NTGRs
Program Delivery
Approach Data Sources NTGRs from Data
Sources
Methods Used in Data Sources to Estimate the
NTGR Values Proposed Approaches to Estimate “Forward-Looking” NTGR Values
Residential Aerators Direct Install
EM&V of the CPUC Residential Retrofit High Impact Measure Evaluation Report and Appendices, February 8, 2010, The CADMUS Group [Ch. 9]
The study evaluated two SDG&E programs. The evaluation results varied among the IOU programs as followed: NTGR SDGE3017 (MH) 0.59 SDG&E3035 (SF) 0.75
This evaluation determined NTG from participant self-report responses to a telephone survey. The instrument and algorithm used was the Joint Sample Self-Report NTG method. The study evaluated three programs for two IOUs. The final report does not indicate what value was used in the IOU program plans for 2009-2011. Evaluation results varied among the IOU Programs.
There are no new evaluation studies and additional primary data sources published since 2010 that are readily available to inform the short term updates. Data should be gathered on the market saturation of aerators in the latest RASS and new incremental cost information should be used to make an assessment of likely trends in NTGR in 2012. Residential
Showerheads DEER 0.85 Direct Install
EM&V of the CPUC Residential Retrofit High Impact Measure Evaluation Report and Appendices, February 8, 2010, The CADMUS Group [Ch. 9]
Results were the same when Weighted by Year and Therms NTGR SCG3517 (MH) 0.72 SDGE3017 (MF) 0.68 SDG&E3017 (SF) 0.70
Residential Gas Storage /Instantaneous Water Heater
DEER WH gas EF>0.62=0.58
Downstream Prescriptive
EM&V of the CPUC Residential Retrofit High Impact Measure Evaluation Report and Appendices, February 8, 2010, The CADMUS Group [Ch. 8]
SCG3517 (2006) 0.25 SCG3517 (2007) 0.30 PGE2000 0.17 SDGE3024 0.22
Evaluation determined NTG through the Joint Sample Self-Report NTG method. The evaluation relied on telephone surveys to determine NTGR – weighted by year and Therms; No 2008 data for SCG
Note: The evaluation found a high percentage of free-riders for high-efficiency gas water heaters and conducted a search for market share data to provide additional context for the current - but was unable to acquire secondary market share data for high-efficiency hot water heaters. 2012 evaluators and or Energy Star program should be asked to provide this data for the 2012 update.
Residential Electric Storage /Instantaneous Water Heater
.58 Downstream Prescriptive
No data available on trends in sales of more efficient systems and this measure is no longer actively promoted by utilities. New generation of heat pump water heaters suggests no update may be needed for NTGR.
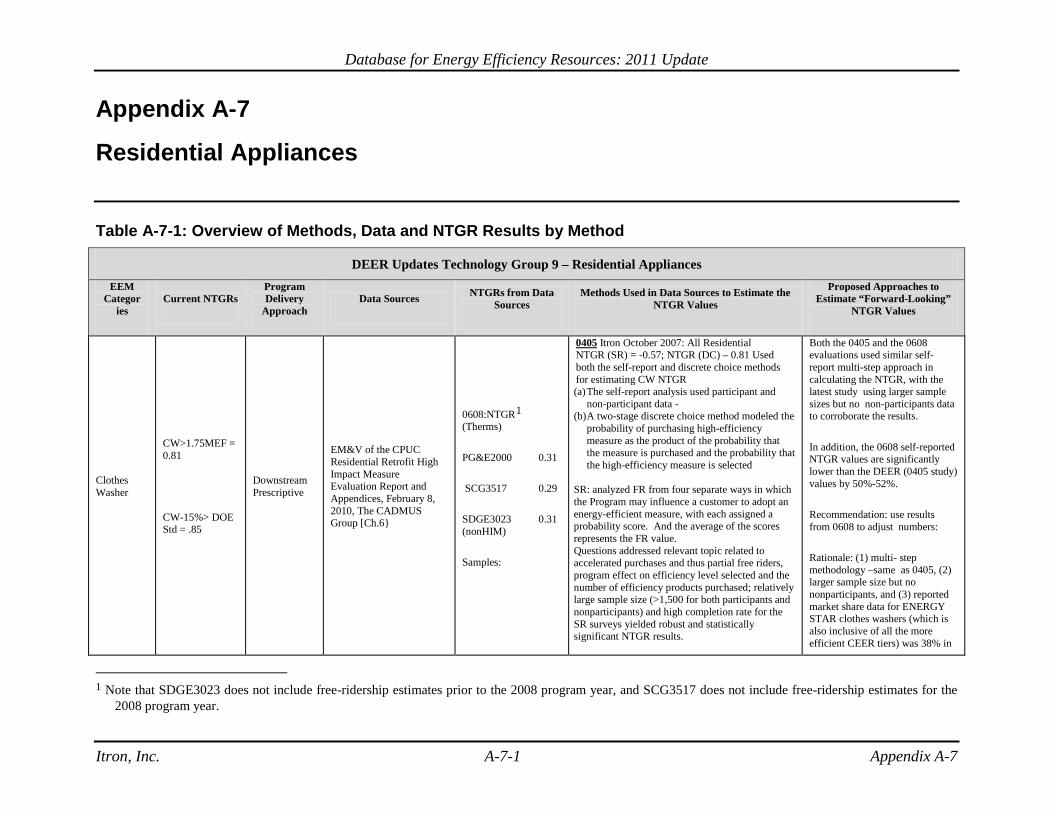
Database for Energy Efficiency Resources: 2011 Update
Itron, Inc. A-7-1 Appendix A-7
Appendix A-7
Residential Appliances
Table A-7-1: Overview of Methods, Data and NTGR Results by Method
DEER Updates Technology Group 9 – Residential Appliances EEM
Categories
Current NTGRs Program Delivery
Approach Data Sources NTGRs from Data
Sources Methods Used in Data Sources to Estimate the
NTGR Values
Proposed Approaches to Estimate “Forward-Looking”
NTGR Values
Clothes Washer
CW>1.75MEF = 0.81
CW-15%> DOE Std = .85
Downstream Prescriptive
EM&V of the CPUC Residential Retrofit High Impact Measure Evaluation Report and Appendices, February 8, 2010, The CADMUS Group [Ch.6}
0608:NTGR1 (Therms)
PG&E2000 0.31
SCG3517 0.29
SDGE3023 0.31 (nonHIM)
Samples:
0405 Itron October 2007: All Residential NTGR (SR) = -0.57; NTGR (DC) – 0.81 Used both the self-report and discrete choice methods for estimating CW NTGR (a) The self-report analysis used participant and
non-participant data - (b) A two-stage discrete choice method modeled the
probability of purchasing high-efficiency measure as the product of the probability that the measure is purchased and the probability that the high-efficiency measure is selected
SR: analyzed FR from four separate ways in which the Program may influence a customer to adopt an energy-efficient measure, with each assigned a probability score. And the average of the scores represents the FR value. Questions addressed relevant topic related to accelerated purchases and thus partial free riders, program effect on efficiency level selected and the number of efficiency products purchased; relatively large sample size (>1,500 for both participants and nonparticipants) and high completion rate for the SR surveys yielded robust and statistically significant NTGR results.
Both the 0405 and the 0608 evaluations used similar self-report multi-step approach in calculating the NTGR, with the latest study using larger sample sizes but no non-participants data to corroborate the results.
In addition, the 0608 self-reported NTGR values are significantly lower than the DEER (0405 study) values by 50%-52%.
Recommendation: use results from 0608 to adjust numbers:
Rationale: (1) multi- step methodology –same as 0405, (2) larger sample size but no nonparticipants, and (3) reported market share data for ENERGY STAR clothes washers (which is also inclusive of all the more efficient CEER tiers) was 38% in
1 Note that SDGE3023 does not include free-ridership estimates prior to the 2008 program year, and SCG3517 does not include free-ridership estimates for the
2008 program year.
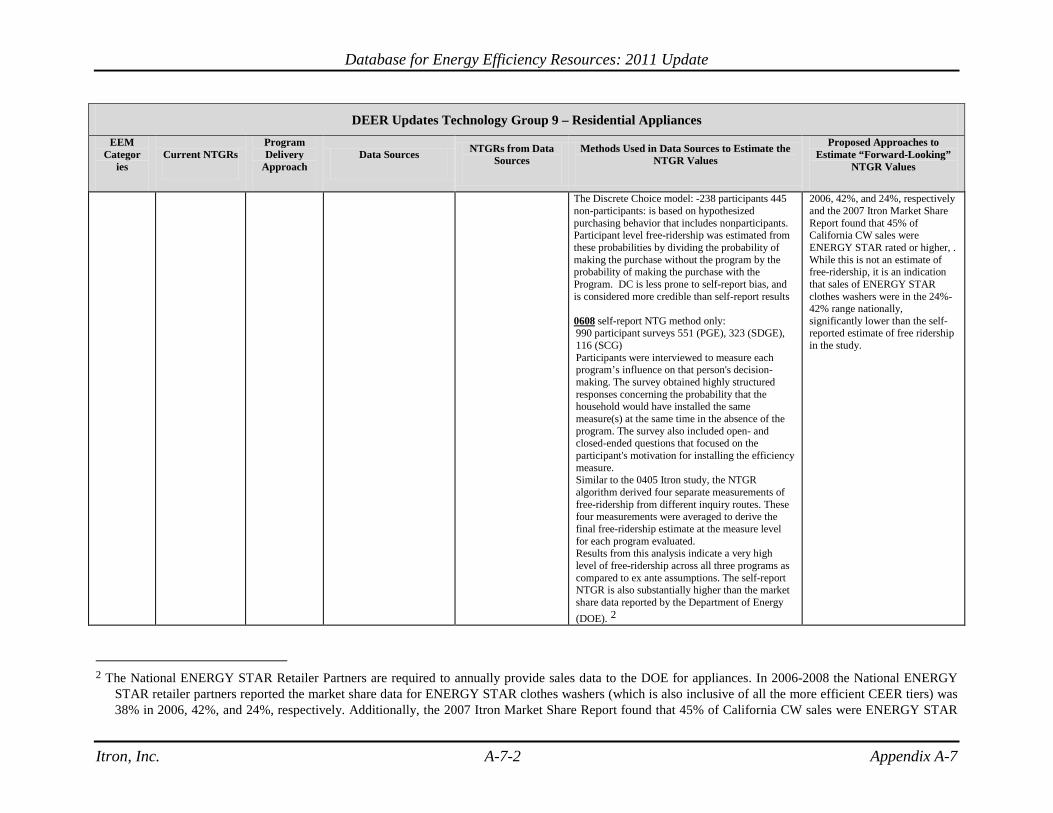
Database for Energy Efficiency Resources: 2011 Update
Itron, Inc. A-7-2 Appendix A-7
DEER Updates Technology Group 9 – Residential Appliances EEM
Categories
Current NTGRs Program Delivery
Approach Data Sources NTGRs from Data
Sources Methods Used in Data Sources to Estimate the
NTGR Values
Proposed Approaches to Estimate “Forward-Looking”
NTGR Values
The Discrete Choice model: -238 participants 445 non-participants: is based on hypothesized purchasing behavior that includes nonparticipants. Participant level free-ridership was estimated from these probabilities by dividing the probability of making the purchase without the program by the probability of making the purchase with the Program. DC is less prone to self-report bias, and is considered more credible than self-report results 0608 self-report NTG method only: 990 participant surveys 551 (PGE), 323 (SDGE), 116 (SCG) Participants were interviewed to measure each program’s influence on that person's decision-making. The survey obtained highly structured responses concerning the probability that the household would have installed the same measure(s) at the same time in the absence of the program. The survey also included open- and closed-ended questions that focused on the participant's motivation for installing the efficiency measure. Similar to the 0405 Itron study, the NTGR algorithm derived four separate measurements of free-ridership from different inquiry routes. These four measurements were averaged to derive the final free-ridership estimate at the measure level for each program evaluated. Results from this analysis indicate a very high level of free-ridership across all three programs as compared to ex ante assumptions. The self-report NTGR is also substantially higher than the market share data reported by the Department of Energy (DOE). 2
2006, 42%, and 24%, respectively and the 2007 Itron Market Share Report found that 45% of California CW sales were ENERGY STAR rated or higher, . While this is not an estimate of free-ridership, it is an indication that sales of ENERGY STAR clothes washers were in the 24%-42% range nationally, significantly lower than the self-reported estimate of free ridership in the study.
2 The National ENERGY STAR Retailer Partners are required to annually provide sales data to the DOE for appliances. In 2006-2008 the National ENERGY
STAR retailer partners reported the market share data for ENERGY STAR clothes washers (which is also inclusive of all the more efficient CEER tiers) was 38% in 2006, 42%, and 24%, respectively. Additionally, the 2007 Itron Market Share Report found that 45% of California CW sales were ENERGY STAR

Database for Energy Efficiency Resources: 2011 Update
Itron, Inc. A-7-3 Appendix A-7
DEER Updates Technology Group 9 – Residential Appliances EEM
Categories
Current NTGRs Program Delivery
Approach Data Sources NTGRs from Data
Sources Methods Used in Data Sources to Estimate the
NTGR Values
Proposed Approaches to Estimate “Forward-Looking”
NTGR Values
Refrigerator & Freezer
Refrig current standard = 0.57
Refrig 15% >=0.75
Refrig Rec =0.614
Parts=716; NParts=354
Freezer Rec = 0.70
Downstream
Turn-in Recycling
EM&V of the CPUC Residential Retrofit High Impact Measure Evaluation Report and Appendices, February 8, 2010, The CADMUS Group [Ch. 11]
NTGR by IOU for Refrigerator Recycling Programs
PGE2000 051
SCE2500 0.56
SDGE3028 058
To determine (refrigerator recycling) net-to-gross ratio for each utility, a methodology similar to that employed in the 2004-2005 statewide ARP evaluation was undertaken. The methodology utilizes surveys with participants, non-participants and market actors. A weighted average of participant and non-participant responses, as well as respondents discarding primary and secondary refrigerators was calculated. This average NTG serves as the evaluation’s final determination of program NTG for each utility
Surveys conducted: Participant Survey = 1857; nonparticipant survey = 1173; market actors = 81
Only the Refrigerator Recycling programs evaluated in 0608. NTG values were only provided at the IOU program level.
However, Controversy over the NGT values for Appliance Recycling suggests that updating this value should wait for the results of the 2010-2012 EM&V ARP study.
rated or higher. While this is not an estimate of free-ridership, it is an indication that sales of ENERGY STAR clothes washers were in the 24%-42% range throughout the U.S., (CADMUS, 2010)

Database for Energy Efficiency Resources: 2011 Update
Itron, Inc. A-7-4 Appendix A-7
Table A-7-2: CADMUS 2010 Table 134. Net-to-Gross Ratios by Utility Overall Net-To-Gross Ratio (Weighted Average of Primary/Secondary) Utility Participant Non-
participant Weighted Average
PGE 0.44 0.59 0.51 SCE 0.52 0.60 0.56 SDGE 0.51 0.64 0.58 Primary Net-To-Gross Ratio Utility Participant Non-
participant Weighted Average
PGE 0.41 0.56 0.45 SCE 0.49 0.55 0.48 SDGE 0.50 0.60 0.52 Secondary Net-To-Gross Ratio Utility Participant Non-
participant Weighted Average
PGE 0.48 0.73 0.62 SCE 0.57 0.87 0.78 SDGE 0.53 0.88 0.78