deere & company investor relations · recent earnings release and conference call ......
TRANSCRIPT

John DeereCommitted to Those Linked to the Land
Deere & CompanyJuly 2012

| Deere & Company | July 2012
Safe Harbor Statement & Disclosures
This presentation includes forward-looking comments subject to important risks and uncertainties. It may also contain financial measures that are not in conformance with accounting principles generally accepted in the United States of America (GAAP).
Refer to Deere’s reports filed on Forms 8-K (current), 10-Q (quarterly), and 10-K (annual) for information on factors that could cause actual results to differ materially from information in this presentation and for information reconciling financial measures to GAAP.
Guidance noted in the following slides was effective as of the company’s most recent earnings release and conference call (16 May 2012). Nothing in this presentation should be construed as reaffirming or disaffirming such guidance.
This presentation is not an offer to sell or a solicitation of offers to buy any of Deere’s securities.
2

|
Table of Contents
Slide #John Deere Strategy 4
Macroeconomic Tailwinds 19
Foundational Success Factors 26
Global Markets and Opportunities 38
John Deere Financial Services 69
John Deere Power Systems 75
Farm Fundamentals 78
Market and Currency Volatility 87
Appendix 90
Deere & Company | July 20123

John Deere Strategy

|5 Deere & Company | July 2012
| Deere & Company | July 2012
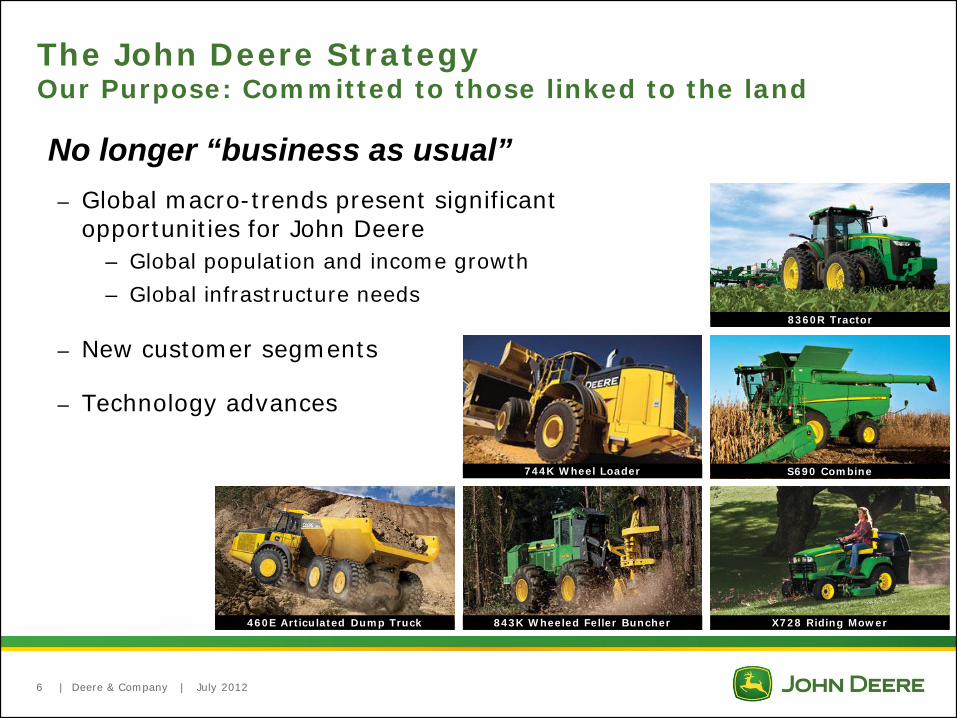
The John Deere StrategyOur Purpose: Committed to those linked to the land
6
– Global macro-trends present significant opportunities for John Deere
– Global population and income growth– Global infrastructure needs
– New customer segments
– Technology advances
No longer “business as usual”
744K Wheel Loader
460E Articulated Dump Truck
8360R Tractor
S690 Combine
X728 Riding Mower843K Wheeled Feller Buncher
|
Sustainable SVA growth is delivered by distinctively serving our customers, employees, and investors
Extend and enhance our financial and operating achievements of recent years
Our challenge: to capture anticipated tailwinds by attracting more customers to the John Deere Experience across our six key geographies (US/Canada, EU 27, Brazil, CIS/Russia, India, China) in a manner that meets local needs while leveraging our global scale
7 Deere & Company | July 2012
The John Deere StrategyRealizing Sustainable Growth Through Global Expansion

|
Agricultural Equipment Solutions Strategy– Defend and grow market share in
developed markets– Grow market share in developing
markets
Construction Equipment Solutions Strategy– Continue to grow strong #2 position in
North America– Globalize the business
8 Deere & Company | July 2012
The John Deere StrategyAgricultural and Construction Equipment Aspirations
6488 Combine - China
755K Crawler Loader - USA
9530T Tractor - USA
435 Backhoe Loader - India

|
Sales
– Enterprise net sales of $50 billion at mid-cycle by 2018
Profitability
– Operating margins of no less than 12% at mid-cycle by 2014
Asset Efficiency
– Asset turns of 2.5 times at mid-cycle by 2018
2010 Normal Volume$25 billion
2018 Normal Volume$50 billion
U.S. & Canada
BRIC
Rest of World
6.6%12.3% 13.0%
2009 2010 2011
1.9 2.2 2.3
2009 2010 2011
9 Deere & Company | July 2012
The John Deere StrategyPerformance Target Aspirations
Equi
pmen
tO
pera
tions
Equi
pmen
tO
pera
tions

|
The John Deere StrategyIntegrated Enterprise
Integrated portfolio of businesses, each with a vital and specific role
10 Deere & Company | July 2012
Global Growth BusinessesAgricultural and Construction Equipment Solutions– Invest in global expansion for profitable growth by
capitalizing on macro-trends
Complementary Businesses
Turf and Forestry Equipment Solutions– Defend and grow share, enhance SVA, strengthen the
channel of the Global Growth Businesses
Supporting Businesses
Financial Services, Power Systems, Worldwide Parts, and Intelligent Solutions Group– Strengthen and further differentiate our Global
Growth and Complementary Businesses
S660i Combine 310SJ Backhoe Loader
XUV 550 Gator 1170E Wheeled Harvester
Financial Services
Power Systems
Worldwide Parts
Intelligent Solutions

|
The John Deere StrategyFoundational and Critical Success Factors
Both Foundational and Critical Success Factors necessary…
…to ensure that Deere is the provider of choice across the
world
FOUNDATIONAL SUCCESS FACTORSBuilding on the core strengths that have guided our success
Exceptional Operating Performance
Disciplined SVA Growth
Aligned High-Performance Teamwork
CRITICAL SUCCESS FACTORSDeveloping the capabilities essential to reaching our goals
Deep Customer Understanding
Deliver Customer Value
World-Class Distribution System
Grow Extraordinary Talent
11 Deere & Company | July 2012

| Deere & Company | July 2012
*Excludes fiscal 2009 expenses related to goodwill impairment and voluntary employee-separation, for reconciliation to GAAP see “2009 OROA Reconciliation to GAAP” slide in Appendix.
The John Deere StrategyFoundational Success Factors
Exceptional Operating Performance - Equipment Operations29.8% OROA in 2011, a record high for the company
12%
20%
28%
2001
2002
2003
2004
20052006
20072008
2009
2009, adjusted*
20102011
0%
5%
10%
15%
20%
25%
30%
35%
% of Normal Volume
80%Low
100%Normal
120%High
12% OROA (SVA Neutral)
12

| Deere & Company | July 2012
Exceptional Operating Performance - Equipment OperationsSVA Model: Higher Net Cash Flow, More Consistently
The John Deere StrategyFoundational Success Factors
0
500
1,000
1,500
2,000
2,500
3,000
3,500
1991 1992 1993 1994 1995 1996 1997 1998 1999 2000 2001 2002 2003 2004 2005 2006 2007 2008 2009 2010 2011
$ M
illio
ns
Sale of Trade Receivables to Credit
Adoption of SVA Model
Over $7 billion in Pension/OPEB contributions, 2001-2011
13

| Deere & Company | July 2012
SVA
($ m
illio
ns)
Note: For reconciliation of SVA to GAAP, please see “Equipment Ops SVA Reconciliation to GAAP” slide in Appendix
Disciplined SVA Growth - Equipment OperationsSVA Journey, 1991 - 2011
-1,600
-1,200
-800
-400
0
400
800
1,200
1,600
2,000
2,400
2,800
1991 1992 1993 1994 1995 1996 1997 1998 1999 2000 2001 2002 2003 2004 2005 2006 2007 2008 2009 2010 2011
14
The John Deere StrategyFoundational Success Factors

| Deere & Company | July 2012
SVA
($ m
illio
ns)
Note: For reconciliation of SVA to GAAP, please see “Equipment Ops SVA Reconciliation to GAAP” slide in Appendix
Disciplined SVA Growth - EnterpriseSVA Journey, 2002 - 2011SVA in 2011 was ~ $2.5 billion – a record high for the company
-800
-400
0
400
800
1,200
1,600
2,000
2,400
2,800
2002 2003 2004 2005 2006 2007 2008 2009 2010 2011
15
The John Deere StrategyFoundational Success Factors

| Deere & Company | July 2012
Aligned High-Performance TeamworkIntegral part of strategy, reinforced with compensationGlobal Performance Management reinforces alignment Base pay changes linked to achieving goals
STI: Short-Term Incentive – Bonus focuses on OROA/ROECovers most worldwide salaried employeesApplies one enterprise-wide bonus metric
MTI: Mid-Term Incentive – Bonus driven by sustained SVA creationAbout 8,200 management employees eligible
LTI: Long-Term Incentive – Primarily stock options Top 900 employees eligibleMinimum stock holding requirements for senior management (~ top 125)
16
The John Deere StrategyFoundational Success Factors

|
Commitment to execute and monitor all initiatives critical to our successPerformance measures
– Traditional financial measures based on what we are delivering today to our stakeholders
Health measures – The qualities, attributes and actions being introduced to ensure the sustainability of our
performance over time
Deere & Company | July 2012
The John Deere StrategyMeasures
Metric Target
Sales Net Sales Growth Target $50B* (2018, at mid-cycle)
Profitability Return on Sales (Operating Margin) 12% (2014, at mid-cycle)
Asset Efficiency Asset Turns 2.5x (2018, at mid-cycle)
*Implies a CAGR of ~ 9% (2010 – 2018) vs. historical CAGR of 7-8%
17
Metric Target
Exceptional Operating Performance Quality % JDQPS certification
Disciplined SVA Growth Sales/SVA Mix by Geography % Non- U.S. & Canada
Aligned High- Performance Teamwork Employee Engagement Employee Survey’s
Engagement Index
| Deere & Company | July 2012
Accelerated emphasis on global growth –$50 billion mid-cycle sales by 2018–Approximately 50% outside of U.S. & Canada–Capitalize on increased global demand for food, shelter and infrastructure
Focus on improved profitability–12% mid-cycle margin by 2014
Continued adherence to OROA/SVA model–30% OROA at mid-cycle sales (12% at trough) with improved asset turns
Focus on two growth platforms–Global pre-eminence in agricultural-equipment solutions–Global construction-equipment operations (with presence in China)–Complementary/supporting businesses to help drive performance of global growth platforms
Revised metrics reflect strategic direction–“Performance” metrics align compensation to strategy–“Health” metrics introduced to monitor underlying factors (e.g., market share, quality) to ensure performance is sustainable
18
The John Deere StrategyIn Summary

Macroeconomic Tailwinds
Support John Deere’sGlobal Growth Businesses

|
Population growing in size and affluence• By 2050, world population will reach 9 billion, up from ~7 billion today, with
most of population growth in Asia and Africa• Large middle class developing in China and India
Opportunity #1: Feeding the world• Agricultural output must double by 2050• Gross output must increase 3.4% annually in the next 10 years vs. 2.4%
annual growth in past 10 years• Natural resources under strain, especially water
Opportunity #2: Massive urbanization• Migration from rural areas creates need for infrastructure development• 2010: For the first time in history, more than half the world population lives
in cities• 2050: More than 70 percent will live in cities
20 Deere & Company | July 2012
Long-Term Macroeconomic TailwindsSupport Global Growth Opportunities

|
17%
24%
26%
34%
34%
36%
36%
39%
46%
49%
58%
58%
61%
71%
71%
Health and Social Services
Real Estate and Business Activities
Social and Personal Services
Hotels and Restaurants
Education
Public Administration and Defense, Compulsory Social Security
Financial Intermediation
Wholesale and Retail Trade
Construction
Transport, Storage and Telecommunication
Utilities
Manufacturing
Mining
Agriculture
Private Household Services
88
289
321
331
351
381
462
575
647
757
1,052
1,315
1,805
2,301
Private Household Services
Hotels and Restaurants
Mining
Utilities
Social and Personal Services
Agriculture
Education
Public Administration and Defense, Compulsory Social Security
Health and Social Services
Construction
Financial Intermediation
Transport, Storage and Telecommunication
Wholesale and Retail Trade
Real Estate and Business Activities
Manufacturing
Deere & Company | July 2012
Sector
Agriculture and Construction amongst the Top 10 industry sectors in the G-20 countries . . .
Absolute increase in real value added 2009-18, $ Billions
CAGR 2009-18 Percent
3.1
2.3
5.3
2.9
5.2
4.0
4.1
3.0
3.2
3.4
2.9
2.7
4.8
3.8
3.8
. . . Significant growth in Agriculture and Construction between 2009-2018 will happen in the BRIC countries
Share of growth from BRIC1Sector
Note: G20 countries account for 73% and 89% of agriculture and construction segments respectively.Total global growth for agriculture is $520B and construction is $854B
1Brazil, Russia, India, ChinaSource: Global Insight World Industry Service
Real value-added 2005 USD
Strong Global Tailwinds in Ag & Construction Significant Growth from Developing Economies
3,625
21
|
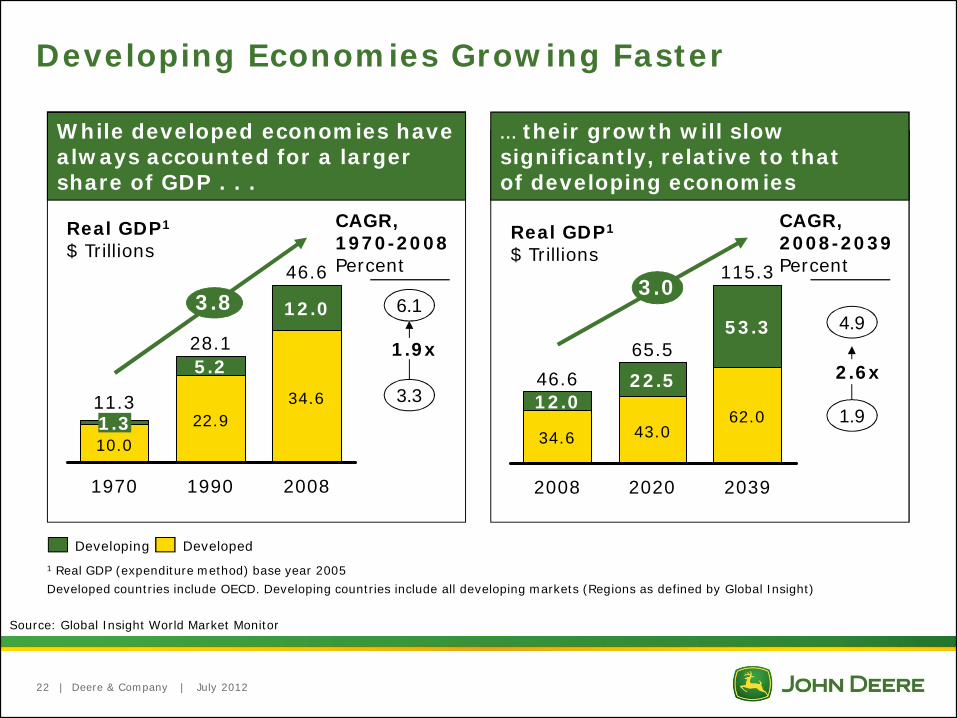
Developing Economies Growing Faster
While developed economies have always accounted for a larger share of GDP . . .
10.022.9
34.61.3
12.0
28.1
1990
5.2
11.3
1970
46.63.8
2008
Real GDP1
$ Trillions
6.1
CAGR,1970-2008Percent
3.3
34.6 43.062.0
12.0
3.0
203920202008
65.5
115.3
53.3
22.546.6
Real GDP1
$ Trillions
4.9
CAGR,2008-2039Percent
... their growth will slow significantly, relative to that of developing economies
1 Real GDP (expenditure method) base year 2005Developed countries include OECD. Developing countries include all developing markets (Regions as defined by Global Insight)
1.9x2.6x
1.9
Developing Developed
Deere & Company | July 2012
Source: Global Insight World Market Monitor
22

| Deere & Company | July 2012
Dynamics of Food Demand
Source: World Bank 2008
>$10 per day
27% of world’s population(Most hunger problems solved at
$2.50 threshold)
Services
Processed Products
Livestock Products
Commodities
Per CapitaIncome
20% of world’s population(2/3rds experience hunger &
malnutrition)
$2.50-10 per day
$1.25-2.50 per day
<$1.25 per day
23

| Deere & Company | July 2012
Global Construction and Infrastructure Needs
2,266
2,356
1,888
6,509
2008
2,998
3,555
3,361
9,915
2020
3.6%
Infrastructure is expected to be the fastest growing segment of construction
Estimated gross spending as a percent of 2008 global GDP
2.4
3.5
4.9
ResidentialNon-residentialInfrastructure
CAGR2008-2020Percent
WW Construction spendingGross output, $ 2008 Billions
Construction12%
Mining & Quarrying7% Ag, Hunting,
Forestry & Fishing7%
All Other74%
*Note: Construction and Mines & Quarries account for ~5% and ~4% of 2008 value-added WW GDP, respectivelySource: IHS Global Insight, March 2009; Off Highway Research; AEM; CCMA; Yengst; Deere analysis
24

|
Infrastructure
Non-residential
Residential
All Construction
Construction spending 2020 absolute, Top 10 (Billions of 2009 $s)
2,049
1,508
751
592
432
365
302
299
267
257
China
U.S. & Canada
India
Japan
U.K.
France
Germany
Brazil
Russia
Italy
China + U.S. & Canada 36% of 2020 absolute, compared to 30% todayChina + U.S. & Canada + Brazil, Russia, India 50% of 2020 absolute, compared to 40% today
Construction spending 2010-2020 change, Top 10 (Billions of 2009 $s)
1,128
534
437
168
106
103
95
92
60
57
China
U.S. & Canada
India
Brazil
Russia
U.K.
Japan
Indonesia
Mexico
Korea
Infrastructure
Non-residential
Residential
All Construction
Global Construction Spending in 2020Concentrated in a Small Number of Markets
Deere & Company | July 2012
Source: IHS Global Insight, Deere Analysis, August 2011
25

FoundationalSuccess Factors
Building on Core Strengths That Have Guided Our Success
| Deere & Company | July 2012
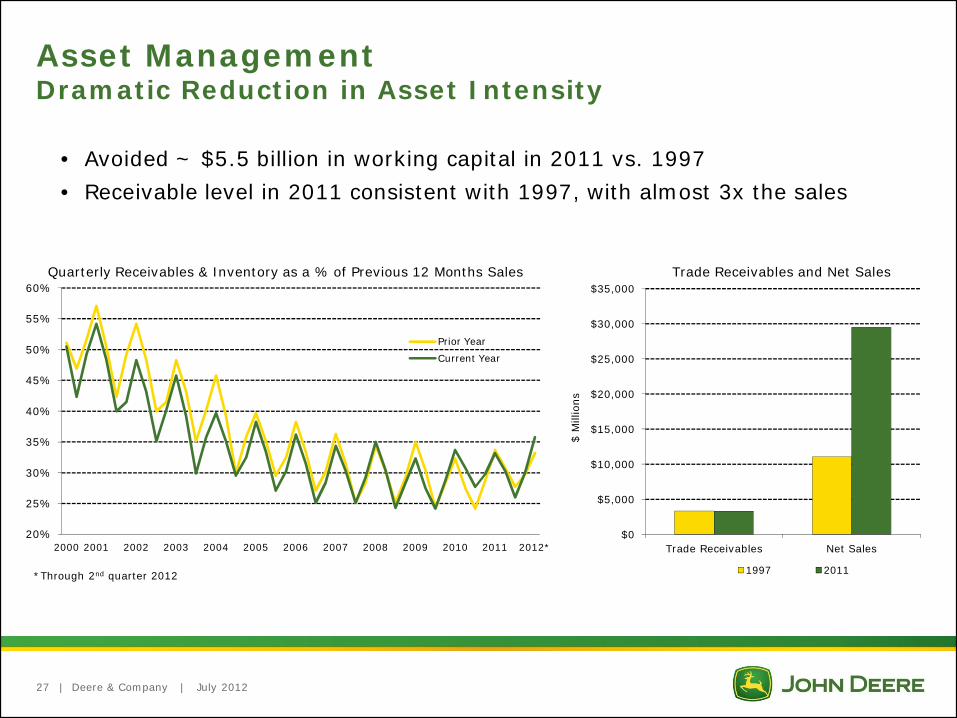
Asset Management Dramatic Reduction in Asset Intensity
20%
25%
30%
35%
40%
45%
50%
55%
60%
2000 2001 2002 2003 2004 2005 2006 2007 2008 2009 2010 2011 2012*
Prior Year
Current Year
Trade Receivables and Net Sales
$0
$5,000
$10,000
$15,000
$20,000
$25,000
$30,000
$35,000
Trade Receivables Net Sales
$ M
illio
ns1997 2011
• Avoided ~ $5.5 billion in working capital in 2011 vs. 1997• Receivable level in 2011 consistent with 1997, with almost 3x the sales
Quarterly Receivables & Inventory as a % of Previous 12 Months Sales
27
*Through 2nd quarter 2012

| Deere & Company | July 2012
Productivity Improvement ~ 6% CAGR over 30 Years
• Deere’s net sales and revenues per employee have increased at a CAGR of ~ 6% over last 30 years
Net Sales and Revenues per Employee
$0
$100
$200
$300
$400
$500
$600
1981 1983 1985 1987 1989 1991 1993 1995 1997 1999 2001 2003 2005 2007 2009 2011
$ Th
ousa
nds
28

| Deere & Company | July 2012
Manufacturing Efficiencies – Waterloo, IAJourney to a 6-Day Drive Train
Prod
uctio
n D
ays
0
5
10
15
20
25
30
35
40
45
50
Prior to 2005 2005 2006 2007 2008
Relocation of 412 machinesEliminated 155 machines
Total evacuation of multi-story buildingsNew heat treat fully operationalSet-up improvementOn-site forging storageInsourcing of core processes
Machining departments based on part familiesArranged machines using cellular conceptsStarted evacuation of multi-story buildings
Run size optimization and set-up improvementDaily run size parametersOutsourcing non-core processes
-12 Days
-2 Days
-10 Days
-14 Days
29
| Deere & Company | July 2012
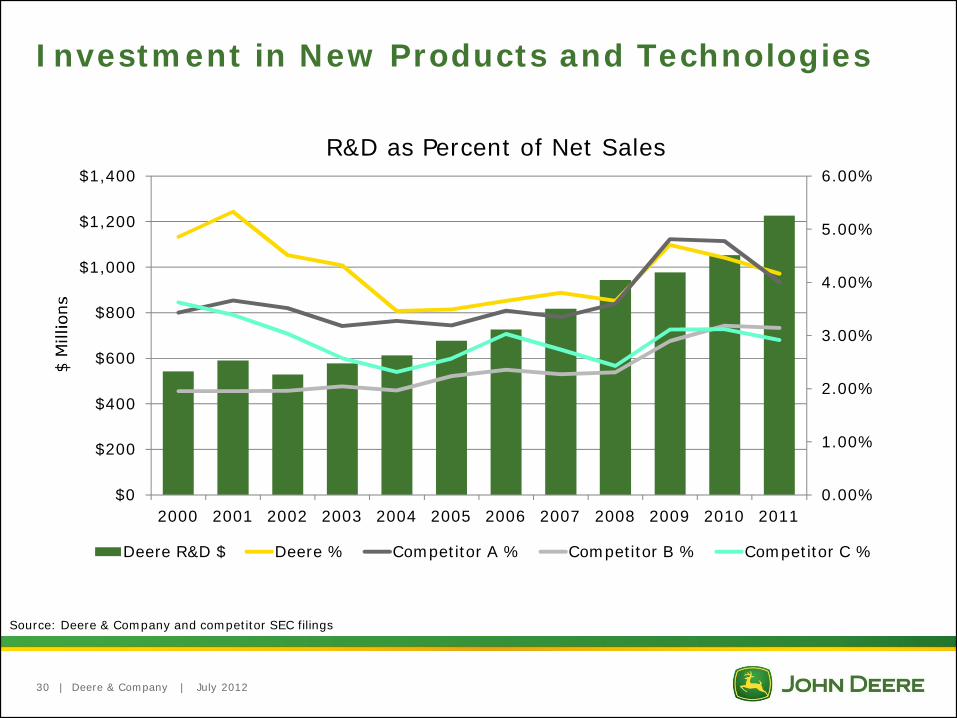
Investment in New Products and Technologies
R&D as Percent of Net Sales
Source: Deere & Company and competitor SEC filings
0.00%
1.00%
2.00%
3.00%
4.00%
5.00%
6.00%
$0
$200
$400
$600
$800
$1,000
$1,200
$1,400
2000 2001 2002 2003 2004 2005 2006 2007 2008 2009 2010 2011
Deere R&D $ Deere % Competitor A % Competitor B % Competitor C %
30

|
Net Sales by Product CategoryEquipment Operations - Fiscal Year 2011
Deere & Company | July 2012
Agriculture & Turf – $24.1B Construction & Forestry – $5.4B
Construction
Forestry
CWPOther
Large Ag
Small Ag
Turf
Other
31

| Deere & Company | July 2012
Committed Bank Group Supports Credit Facility• Average length of continuous relationship = ~29 Years• $5.00 billion credit facility supporting commercial paper
– $1.50 billion 61-month facility expiring in 2017– $2.75 billion 49-month facility expiring in 2015– $750 million 364-day facility expiring in 2013– Have not drawn on facility– $2.7 billion incremental capacity as of 30 April 2012
Credit Facility Size & Commercial Paper Outstanding
$ M
illio
ns
$0
$1,000
$2,000
$3,000
$4,000
$5,000
$6,000
1999 2000 2001 2002 2003 2004 2005 2006 2007 2008 2009 2010 2011
Total Facility CP Outstanding as of October 31
32

| Deere & Company | July 2012
Deere Use-of-Cash Priorities
Manage the balance sheet, including liquidity, to support a rating that provides access to low-cost and readily available short- and long-term funding mechanisms
Reflects the strategic nature of our financial services operation
Committed to “A” Rating
Cash from Operations
Fund Operating and Growth Needs
Common Stock Dividend
Share Repurchase
Fund value-creating investments in our businesses
Consistently and moderately raise dividend targeting a 25%-35% payout ratio of mid-cycle earnings
Consider share repurchase as a means to deploy excess cash to shareholders, once above requirements are met and repurchase is viewed as value-enhancing
33
| Deere & Company | July 2012
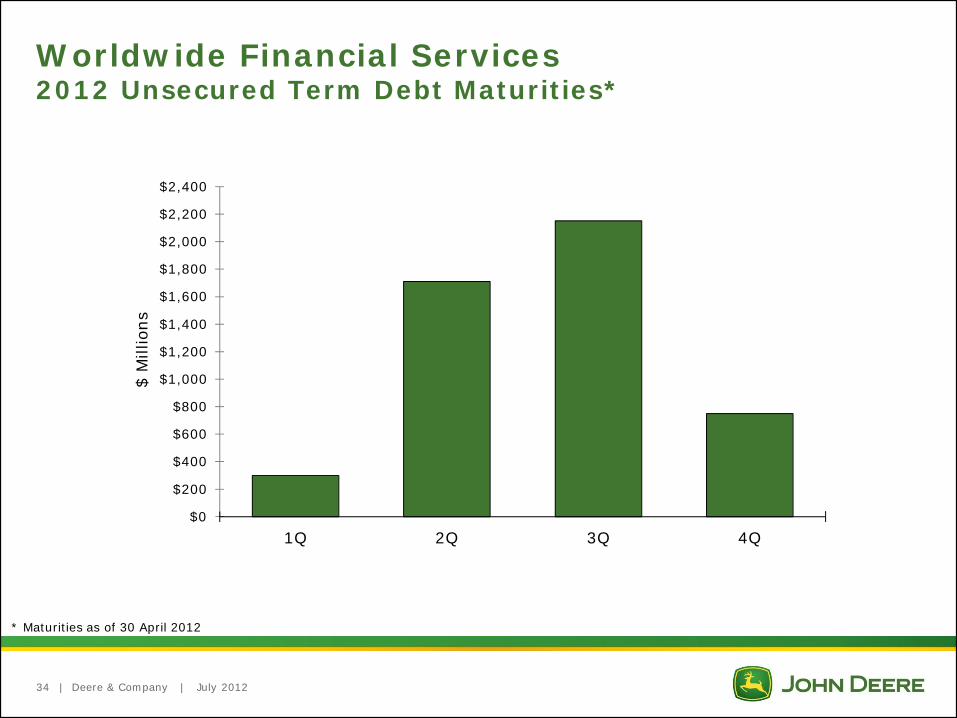
Worldwide Financial Services2012 Unsecured Term Debt Maturities*
* Maturities as of 30 April 2012
34
$ M
illio
ns
$0
$200
$400
$600
$800
$1,000
$1,200
$1,400
$1,600
$1,800
$2,000
$2,200
$2,400
1Q 2Q 3Q 4Q
| Deere & Company | July 2012
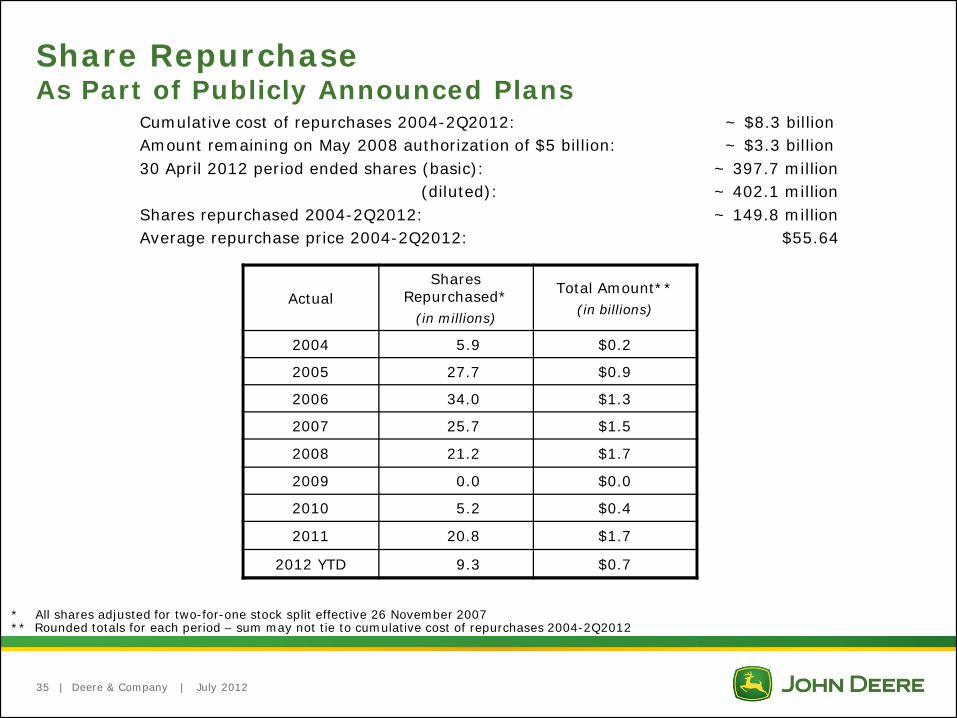
Share RepurchaseAs Part of Publicly Announced Plans
35
Actual Shares
Repurchased*(in millions)
Total Amount**(in billions)
2004 5.9 $0.2
2005 27.7 $0.9
2006 34.0 $1.3
2007 25.7 $1.5
2008 21.2 $1.7
2009 0.0 $0.0
2010 5.2 $0.4
2011 20.8 $1.7
2012 YTD 9.3 $0.7
Cumulative cost of repurchases 2004-2Q2012: ~ $8.3 billionAmount remaining on May 2008 authorization of $5 billion: ~ $3.3 billion 30 April 2012 period ended shares (basic): ~ 397.7 million
(diluted): ~ 402.1 millionShares repurchased 2004-2Q2012: ~ 149.8 millionAverage repurchase price 2004-2Q2012: $55.64
* All shares adjusted for two-for-one stock split effective 26 November 2007** Rounded totals for each period – sum may not tie to cumulative cost of repurchases 2004-2Q2012

|
$0.11$0.14
$0.16
$0.20$0.22
$0.25$0.28
$0.30
$0.35
$0.41
$0.46
$0.00
$0.05
$0.10
$0.15
$0.20
$0.25
$0.30
$0.35
$0.40
$0.45
$0.50
'03
Q1
Q2
Q3
Q4
'04
Q1
Q2
Q3
Q4
'05
Q1
Q2
Q3
Q4
'06
Q1
Q2
Q3
Q4
'07
Q1
Q2
Q3
Q4
'08
Q1
Q2
Q3
Q4
'09
Q1
Q2
Q3
Q4
'10
Q1
Q2
Q3
Q4
'11
Q1
Q2
Q3
Q4
'12
Q1
Q2
Q3
Deere & Company | July 2012
Deere Quarterly Dividends Declared* Q1 2003 – Q3 2012
* Adjusted for 2 for 1 stock split on 26 November 2007** See slide 5 for revised John Deere Strategy
36
Dividend raised 64% since launch of the revised John Deere Strategy in 2010**
| Deere & Company | July 2012
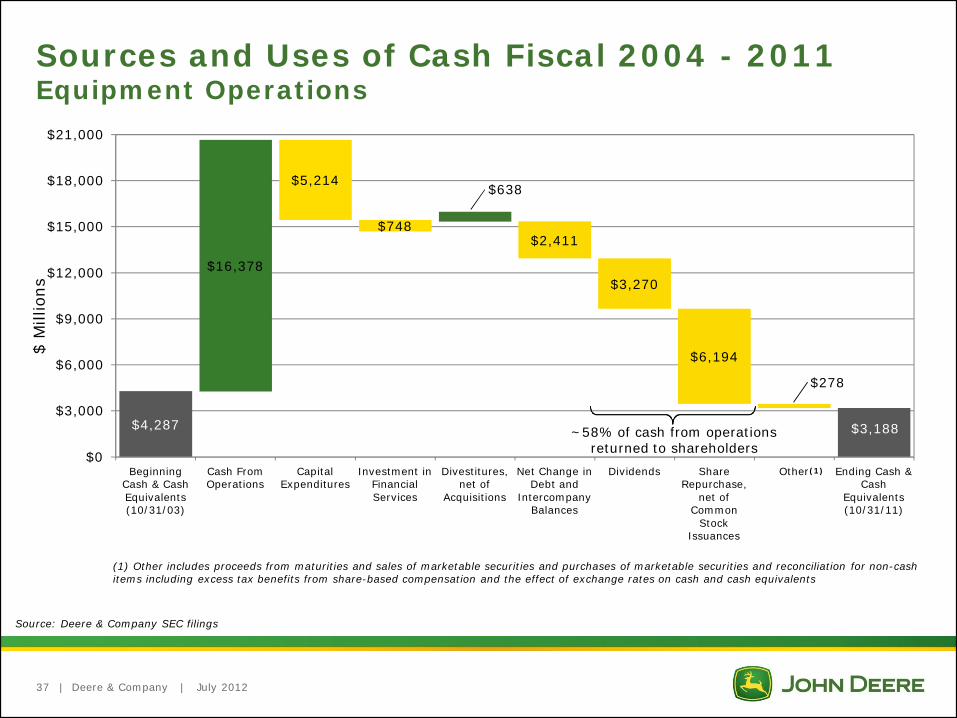
Sources and Uses of Cash Fiscal 2004 - 2011 Equipment Operations
(1) Other includes proceeds from maturities and sales of marketable securities and purchases of marketable securities and reconciliation for non-cash items including excess tax benefits from share-based compensation and the effect of exchange rates on cash and cash equivalents
Source: Deere & Company SEC filings
$4,287
$16,378
$5,214
$748
$638
$2,411
$3,270
$6,194
$278
$0
$3,000
$6,000
$9,000
$12,000
$15,000
$18,000
$21,000
Beginning Cash & Cash Equivalents (10/31/03)
Cash From Operations
Capital Expenditures
Investment in Financial Services
Divestitures, net of
Acquisitions
Net Change in Debt and
Intercompany Balances
Dividends Share Repurchase,
net of Common
Stock Issuances
Other Ending Cash & Cash
Equivalents (10/31/11)
~58% of cash from operations returned to shareholders
(1)
$ M
illio
ns
$3,188
37

Global Markets and Opportunities

| Deere & Company | July 2012
Growing Global Presence
• FY 2011 equipment net sales outside U.S. & Canada over 4x the level in FY 2000
20%
25%
30%
35%
40%
45%
50%
$0
$2,000
$4,000
$6,000
$8,000
$10,000
$12,000
$14,000
2000 2001 2002 2003 2004 2005 2006 2007 2008 2009 2010 2011
• FY 2011 equipment net sales outside U.S. & Canada over 4x the level in FY 2000
$ M
illio
ns
Net Sales Outside U.S. and Canada
Net Sales Outside U.S. & Canada % of Total Net Sales
39

| Deere & Company | July 2012
Net Sales by Major MarketsFiscal Years 2011, 2010, 2009, 2008
(in millions of dollars) 2011 2010%
Change 2009 2008
United States 15,029 13,026 +15% 11,568 13,166
Canada 2,329 1,767 +32% 1,454 1,902
Western Europe 4,382 3,360 +30% 3,427 4,610
Central Europe & CIS 1,407 746 +89% 749 1,874
Central & South America 3,612 2,623 +38% 1,787 2,577
Asia, Africa & Middle East 1,930 1,431 +35% 1,166 1,062
Asia Pacific, Australia & New Zealand 777 620 +25% 605 612
Total 29,466 23,573 +25% 20,756 25,803
40

|
U.S. and CanadaFactory Locations
Deere & Company | July 201241
Iowa, USA• Cotton Harvesting Equipment• Planting Equipment• Spraying Equipment• Tillage Equipment• Ag Tractors• Components• Foundry• Engines• Hay & Forage Equipment• Articulated Dump Trucks• 4WD Loaders• Motor Graders• Skidders• Wheeled Feller Bunchers• Backhoes• Compact Tracked Loaders• Crawler Dozers• High-Speed Dozers• Knuckleboom Loaders• Skid Steer Loaders• Tracked Feller Bunchers• Tracked Harvesters
Illinois, USA• Combine Harvesters• Headers• Planting Equipment• Hydraulic Cylinders
North Dakota, USA• Air Seeding Equipment• Electronics
North Carolina, USA• Commercial Mowers• Golf & Turf Mowers• Utility Vehicles• Hydraulic Excavators
Alberta, Canada• Remanufactured ComponentsBritish Columbia, Canada
• Log Loaders & Specialty Products
California, USA• Satellite Receivers
Kansas, USA• Power Transmission Equipment
Missouri, USA• Remanufactured Components
Louisiana, USA• Sugarcane Harvesting Equipment• Tractor Loaders• Scrapers• Cotton Strippers
Georgia, USA• Utility Tractors• Compact Utility Tractors
Tennessee, USA• Lawn Tractors
Wisconsin, USA• Lawn & Garden Equipment• Utility Vehicles• Golf & Turf Reel Mowers

| Deere & Company | July 2012
U.S. and CanadaRecent Announcements
• June 2012 – $47 million investment at Moline, IL cylinder operations to expand manufacturing capacity
• March 2012 – Final Tier 4/Stage IV solution to combine proven EGR Interim Tier 4 platform with customized selective catalytic reduction (SCR) system
• March 2012 – $70 million investment at Waterloo, IA factory to expand production of large farm tractors by 10%
• January 2012 – Strategic agreement with MacDon to manufacture self-propelled windrowers
• December 2011 – $85 million in capital improvements at Des Moines, IA factory to expand production of self-propelled sprayers
• August 2011 – Largest, most significant product introduction in the company’s history
42
2008-2010
2010-2012
2012-2013
25%
15%
10%
Waterloo Works Capacity Expansion
2008 to 2013
Deere & Company Forecast as of 16 May 2012

| Deere & Company | July 2012
EU 27Factory Locations
Joensuu, Finland• Wheel Forwarders• Wheel Harvesters• Forestry Attachments
Bruchsal, Germany• Tractor, Harvesting & Forestry Cabs
Mannheim, Germany• Tractors
Zweibrücken, Germany• Combine & Forage Harvesters• Material Handling Equipment
Arc-les-Gray, France• Forage Equipment• Balers• Material Handling Equipment
Saran, France• Engines
Madrid, Spain• Components
Horst, The Netherlands• Spraying Equipment
Stadtlohn, Germany• Forage Harvesters• Headers
Gummersbach, Germany• Walk-Behind Mowers
43

|
EU 27Economic Data
Deere & Company | July 2012
PPP: Purchasing Power ParitySource: FAO, Global Insight, The World Factbook
1.8%
25.0%
73.2%
GDP Composition
Agriculture Industry ServicesSource: The World Factbook, 2011 est.
4.7%
28.7%
66.6%
Labor Composition
Agriculture Industry ServicesSource: The World Factbook, 2010 est.
Production Net ExportsTotal Grains 15% 4%Wheat 20% 7%Barley 39% 39%Pork Meat 22% 30%Cow Milk 27% 22%
Source: USDA, 2011
• General (2010)• Population ~ 516 million• GDP (PPP) ~ $13.77 trillion• Top four economies based on GDP:
• Germany, UK, France, Italy
• Agricultural (2009)• Utilized agricultural area ~ 192 million hectares• Arable land ~ 111 million hectares
• Approximately 70 million hectares of permanent crop or grassland
• Share of the world market:
44

|
EU 27Economic Update
Deere & Company | July 2012
Deere & Company Forecast as of 16 May 2012
45
Optimism continues in the Agricultural sector• Farm business climate and mood remain at high levels
Farm income expected to be above long-term average levels• Grain, beef and milk prices at attractive levels
Demand for agricultural equipment remains strong• Sovereign debt and fiscal issues concentrated in Southern Europe
• Not key agricultural markets
Low levels of used equipment

|
• November 2011 – Awards received at Agritechnica 2011• 7280R – “Tractor of the Year 2012”• 6R tractor – “Machine of the Year”• Five silver medals
• June 2011 – Largest new product introduction for Region 2*• Over 100 new products
• 80% of large tractor and combine models new or updated
• Focus on Dealer of Tomorrow strategy
• May 2011 – John Deere and Kuhn Group sign strategic cooperation
• Provides large square balers into Region 2* in 2012
Deere & Company | July 2012
EU 27Recent Announcements
* Region 2: EU 27, CIS (including Russia), Mediterranean countries in Africa, and the Near and Middle East
46

|
0
10
20
30
40
50
60
70
1990 1995 2000 2005 2007 2008 2009 2010 2011 2012 2013 2014 2015 2016 2017 2018 2019 2020
EUR
bn
(nom
inal
pric
es)
Pillar I (Direct Payments + Market Expenditures) Pillar II (Rural Development)
2007-2013 2014-2020
Deere & Company | July 2012
EU 27Government Support of Agriculture
• Common Agricultural Policy proposed budget 2014-2020 frozen at 2007-2013 nominal levels• Rules generally known, eliminating uncertainty• Redistribution of direct payments in favor of new member states
Source: EU Commission, Agra Europe
47
|
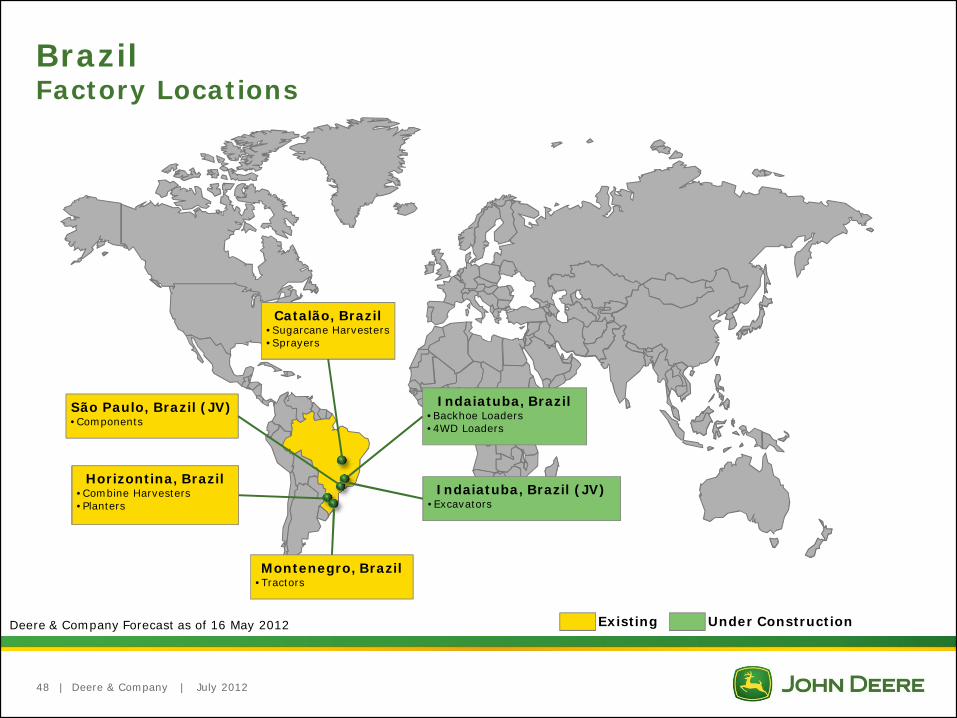
BrazilFactory Locations
Deere & Company | July 2012
São Paulo, Brazil (JV)• Components
Catalão, Brazil• Sugarcane Harvesters• Sprayers
Montenegro, Brazil• Tractors
Horizontina, Brazil• Combine Harvesters• Planters
Indaiatuba, Brazil• Backhoe Loaders• 4WD Loaders
Indaiatuba, Brazil (JV)• Excavators
Deere & Company Forecast as of 16 May 2012
48
Existing Under Construction

|
BrazilEconomic Data
Deere & Company | July 2012
• General (2010)• Population ~ 193 million• GDP (PPP) ~ $2.172 trillion• Top four cities based on population:
• São Paulo, Rio de Janeiro, Salvador and Brasília
• Agricultural• Brazil converted ~ 13 million hectares from pasture land into
crop land in the last 10 years• Soybean, Corn, Sorghum, Cotton, and Sugarcane
• Deere projects ~20 million hectares will be brought into production in the next decade
• Soybeans and corn• Deere projects ~5% CAGR in industry equipment sales through
the end of this decade
5.8%
26.8%
67.4%
GDP Composition
Agriculture Industry ServicesSource: Brazilian Institute of Geography and Statistics (IBGE), 2010
18%
24%58%
Labor Composition
Agriculture Industry ServicesSource: Brazilian Institute of Applied Economic Research (IPEA), 2008
PPP: Purchasing Power ParitySource: Brazilian Institute of Geography and Statistics (IBGE), The World Fact BookDeere & Company Forecast as of 16 May 2012
49

| Deere & Company | July 2012
BrazilRecent Announcements
• October 2011 – Two new factories in São Paulo to manufacture construction equipment• Solely-owned Deere factory
• Backhoe and four-wheel-drive loaders• Partner with Hitachi in second factory
• Excavators• Expect production to begin in 2013
Deere & Company Forecast as of 16 May 20121 Carta da Anfavea, November 2011
• Agriculture portfolio and dealer expansion• 50 new or updated products• Dealer locations roughly doubled since 2007• Achieved 4 points of tractor market share in
FY 20111
50

| Deere & Company | July 2012
BrazilGross Value of Production
Source: MAPA (Brazilian Ministry of Agriculture), May 2012
51
Gross Value of Agricultural Production*
* In Brazilian Real
Expected to increase 2.7% in 2012 over last season
2011 Mix by Crop
1997
1999
2001
2003
2005
2007
2009
2011
49%
16%
35%
Grains Sugarcane Other
| Deere & Company | July 2012
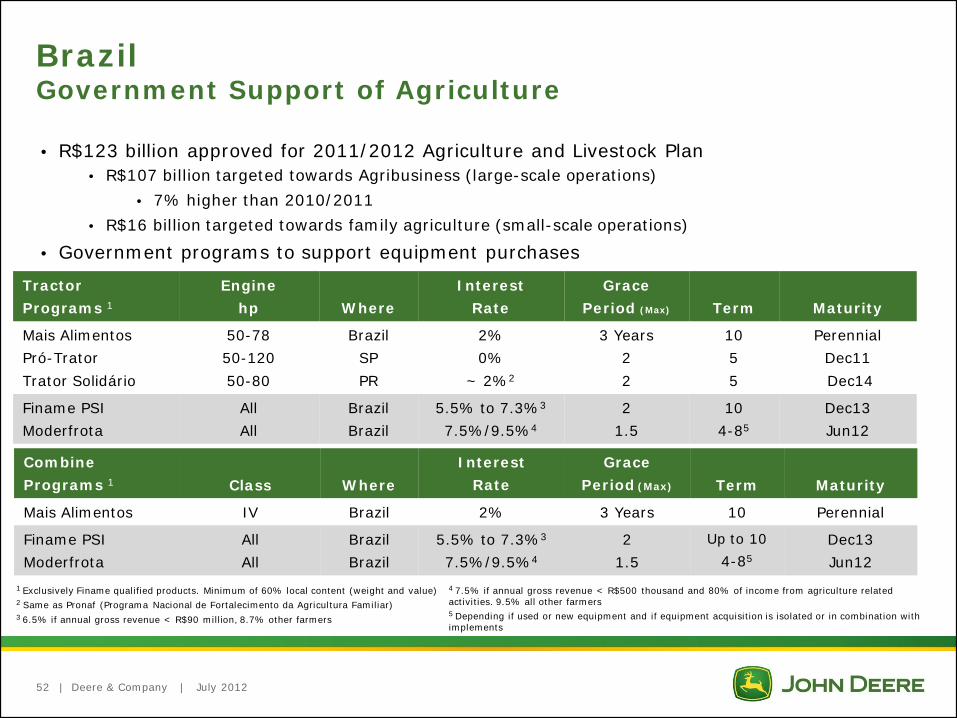
• R$123 billion approved for 2011/2012 Agriculture and Livestock Plan• R$107 billion targeted towards Agribusiness (large-scale operations)
• 7% higher than 2010/2011• R$16 billion targeted towards family agriculture (small-scale operations)
• Government programs to support equipment purchases
BrazilGovernment Support of Agriculture
52
Tractor Programs 1
Enginehp Where
InterestRate
GracePeriod (Max) Term Maturity
Mais AlimentosPró-TratorTrator Solidário
50-7850-12050-80
BrazilSPPR
2%0%
~ 2%2
3 Years22
1055
PerennialDec11Dec14
Finame PSIModerfrota
AllAll
BrazilBrazil
5.5% to 7.3%3
7.5%/9.5%4
2 1.5
104-85
Dec13Jun12
CombinePrograms 1 Class Where
InterestRate
GracePeriod (Max) Term Maturity
Mais Alimentos IV Brazil 2% 3 Years 10 Perennial
Finame PSIModerfrota
AllAll
BrazilBrazil
5.5% to 7.3%3
7.5%/9.5%4
2 1.5
Up to 104-85
Dec13Jun12
1 Exclusively Finame qualified products. Minimum of 60% local content (weight and value)2 Same as Pronaf (Programa Nacional de Fortalecimento da Agricultura Familiar)3 6.5% if annual gross revenue < R$90 million, 8.7% other farmers
4 7.5% if annual gross revenue < R$500 thousand and 80% of income from agriculture related activities. 9.5% all other farmers5 Depending if used or new equipment and if equipment acquisition is isolated or in combination with implements

|
CISFactory Locations
Orenburg, Russia• Seeding Equipment• Tillage Equipment• Spraying Equipment
Deere & Company | July 201253
Orenburg, Russia• Seeding Equipment• Tillage Equipment• Spraying Equipment
Domodedovo, Russia• Tractors• Combine Harvesters• Combine Front-End Equipment• Backhoes, Loaders, Graders• Log Forwarders, Skidders
Existing Under ConstructionDeere & Company Forecast as of 16 May 2012

|
CISEconomic Data
Deere & Company | July 2012
• General (2010)• Population ~ 279 million• GDP (PPP) ~ $2.81 trillion• Top four economies based on GDP:
• Russia, Ukraine, Kazakhstan and Belarus
• Agricultural (2009)• Utilized agricultural area ~ 560 million hectares• Arable land ~ 196 million hectares• Deere estimates “western-style” equipment used
<25% of farmed hectares
• Share of the world market:
PPP: Purchasing Power ParitySource: FAO, Global Insight, The World FactbookDeere & Company Forecast as of 16 May 2012
4.2%
37.0%58.8%
GDP Composition
Agriculture Industry ServicesSource: The World Factbook, 2011 est.
9.8%
27.5%62.7%
Labor Composition
Agriculture Industry ServicesSource: The World Factbook, 2010 est.
Production Net ExportsTotal Grains 10% 19%Wheat 16% 21%Barley 23% 15%Rapeseed 5% 14%Sunflower 49% 51%
Source: USDA, 2011
(Russia)
(Russia)
54

| Deere & Company | July 2012
CISRecent Announcements
• November 2011 – Orenburg, Russia• Move existing operations to a new, larger facility• Increase available manufacturing space by ~ 600 percent• Expand product offering from four to fifteen models
• March 2011 – Domodedovo, Russia• Double manufacturing space at the factory• Expand capacity for existing products• Enable addition of new products such as log
forwarders and front-end equipment
55

| Deere & Company | July 2012
CISGovernment Support of Agriculture
• Export barriers lifted• Russian grain export ban ended in July 2011• Ukraine’s wheat and corn export duty ended in October 2011
• Barley export duty ended in January 2012
• Russian Ag funding is expected to increase in 2012 by ~ 7% in nominal terms
• Annual Ag support in the Russian National Ag Program for 2013 - 2020 expected to more than double by 2020 in nominal terms, but can be shortened and/or restructured due to WTO requirements
• Ag modernization support, including machinery investments, expected to be $4.2 billion over 8 year period
• Loan interest rate subsidies may decline in favor of direct payments
56

|
IndiaFactory Locations
Deere & Company | July 2012
Gummidipoondi, India (JV)• Side-Shift Backhoes• 4WD Loaders (planned production 2013)
Pune, India• Engines• Transmissions• Tractors (36-75 hp)
Sirhind, India• Combine Harvesters
Dewas, India• Tractors (36-50 hp)
Deere & Company Forecast as of 16 May 2012
57
Existing Under Construction

|
IndiaEconomic Data
Deere & Company | July 2012
• General• Population ~ 1.205 billion (July 2012 est.)• GDP (PPP) ~ $4.463 trillion (2011 est.)• Top four cities based on population (2011 est.):
• Mumbai, Delhi, Bangalore and Hyderabad
• Agricultural• Total land area ~ 3.0 million sq km• Arable land ~ 1.5 million sq km (2005 est.)• Annual industry tractor sales >500,000 units• High interest rates• Commodity prices expected to soften against 2011 but remain
elevated due to strong demand• Increased focus from government for farm mechanization
• Infrastructure investment projected to be ~ 9% of GDP by 2012 (~5% in 2007)
18.9%
18.2%62.8%
GDP Composition
Agriculture Industry ServicesSource: IHS Global Insight, 2010 est.
52.0%
14.0%
34.0%
Labor Composition
Agriculture Industry ServicesSource: The World Factbook, 2009 est.
PPP: Purchasing Power ParitySource: The World Fact Book, Censusindia, Tractor Manufacturers Association of India
58

|
• January 2011 – New tractor factory in Dewas and expand current tractor facility in Pune
• ~ $100 million investment
• Expect production in Dewas to begin in 2013
• October 2010 – Ashok Leyland John Deere Construction Equipment Company inauguration
• Production of backhoes commenced in 2011
• Four-wheel-drive loader production expected in 2013
• September 2010 – New combine factory in Sirhind• Production commenced February 2012
• John Deere has been the largest exporter of tractors from India for past 8 years
Deere & Company | July 2012
IndiaRecent Announcements
Deere & Company Forecast as of 16 May 2012
59

| Deere & Company | July 2012
IndiaGovernment Support of Agriculture
159
185
262
325
766
530
623
672
610
258
231
240
313
438
560
638
728
750
35
40
60
123
143
170
195
237
180
194
197
207
275
36
56
48151
332
0 500 1,000 1,500 2,000 2,500
2004
2005
2006
2007
2008
2009
2010
2011
2012F
Rupees (in billions)
Fertilizer Subsidy
Food Subsidy (for households)
Interest Rate Subsidy (for farmers)
Irrigation Subsidy
Electricity Subsidy
Other Subsidies (mainly for seeds)
Source: India Ministry of Agriculture (2004-2009), India Ministry of Finance (2010-2012)
756
809
917
1,191
2,048
1,090
1,296
1,440
60
1,420

|
ChinaFactory Locations
Deere & Company | July 2012
Xuzhou, China (JV)• Excavators
Ningbo, China• Tractors (28-70 hp)• Small Combine Harvesters
Tianjin, China (JV)• Tractors (75-135 hp)
Tianjin (TEDA), China• Transmissions
Jiamusi, China• Large Combine Harvesters• Corn Pickers
Harbin, China• Combine Front-End Equipment• Tractors (150+ hp)• Planters• Sprayers• Irrigation Products
Tianjin (TEDA), China• 4WD Loaders• Excavators
Tianjin (TEDA), China• Engines
Deere & Company Forecast as of 16 May 2012
61
Existing Under Construction

|
ChinaEconomic Data
Deere & Company | July 2012
• General• Population ~ 1.343 billion (July 2012 est.)• GDP (PPP) ~ $11.3 trillion (2011 est.)• Top four cities based on population (2009):
• Shanghai, Beijing, Chongqing and Shenzhen
• Agricultural• Total land area ~ 9.6 million sq km• Arable land ~ 1.4 million sq km (2005 est.)
• Share of the world market:
10.1%
46.8%
43.1%
GDP Composition
Agriculture Industry ServicesSource: The World Factbook, 2011 est.
36.7%
28.7%
34.6%
Labor Composition
Agriculture Industry ServicesSource: The World Factbook, 2008 est.
PPP: Purchasing Power ParitySource: The World Factbook
ProductionTotal Grains 17%Wheat 17%Corn 22%Rice 30%Cotton 27%
62
Source: USDA, 2011

| Deere & Company | July 2012
ChinaRecent Announcements
Deere & Company Forecast as of 16 May 2012
Construction Equipment (New)
Engines (New)
ProductTest (PV&V)
Office (New)
Tianjin Economic-Technological Development Area (TEDA) Site
Drivetrain
• May 2011 – New engine facility in Tianjin• ~ $60 million investment
• Expect production to begin in 2013
• May 2011 – New factory in Harbin• ~ $80 million initial outlay
• Mid- and large-sized tractors
• Harvesting front-end equipment
• Planters and sprayers
• Irrigation products
• Expect production to begin in 2013
• December 2010 – New construction equipment factory in Tianjin• ~ $50 million investment
• Expect production to begin in 2013
63

| Deere & Company | July 2012
Source: China Ministry of Agriculture
ChinaGovernment Support of Agriculture
12
28
72
75
72
86
108
12
13
14
15
15
19
15
15
15
3
4
4
7
12
20
20
22
22
1
2
4
13
16
18
20
0 25 50 75 100 125 150 175
2004
2005
2006
2007
2008
2009
2010
2011
2012F
RMB (in billions)
Material Subsidy (basic subsidy for purchase of inputs)Grain Direct Subsidy (for growing encouraged crops)Seed Subsidy (for purchasing high-performing seed)Equipment Subsidy (for purchasing encouraged equipment)
141
15
17
31
52
103
127
123
64
165

|
Other RegionsFactory Locations
Deere & Company | July 201265
Kibbutz Beit Hashita, Israel• Cotton Picker Components
Rosario, Argentina• Engines• Tractors (planned)• Combines (planned)
Monterrey, Mexico• Rotary Cutters• Implements• Components
Ramos, Mexico• Ag Loaders• Compact Utility Tractor Loaders• Utility Tractor Cabs
Saltillo, Mexico• Ag Tractors• Transaxles
Torreon, Mexico• Axles• Engines• Electronics
Richards Bay, South Africa• Articulated Dump Trucks• Loaders
Tokoroa, New Zealand• Forestry Harvester Heads
Deere & Company Forecast as of 16 May 2012

|
Recent announcements:November 2011 – Bruchsal, Germany
Inauguration of new deconsolidation & packaging facility within European Parts Distribution Center
September 2011 – Rosario, ArgentinaConstruction of new, larger parts facility
Worldwide Parts ServicesSupporting the Global Growth of Our Equipment Operations
Deere & Company | July 2012
3 largest Parts Distribution CentersOther Parts Distribution locations
66

| Deere & Company | July 2012
Integrated wireless technology linking the equipment, owners, operators, dealers, and agricultural consultants to provide more productivity to a farm or business.
Machine OptimizationSolutions that get the most out of machineryUse of precision technology and wireless data networks Higher levels of productivity and increased uptime
Logistics Optimization Manage logistics and machinery from remote locationsFleet management solutions Increased machine-to-machine communication
Ag Decision Support User-friendly monitors, sensors, wireless networksEasy access to machinery and agronomic dataEnable proactive management decisions
John Deere FarmSightTM
67

| Deere & Company | July 2012
John Deere WaterLeveraging our leadership in global agriculture to provide innovative and efficient agricultural water management solutions, and increase agricultural productivity
Innovative solutionsEfficient irrigation and water managementSuperior channel partners
Integration of machinery and technologyConsistent application of the right amount of water at the right timeEnable increased yields and higher quality cropsImprove water use efficiency and reduce input costs
Partnering with our customersOptimize operations and outputEnable good stewardship of water resources
68

John Deere Financial Services

| Deere & Company | July 2012
John Deere Financial ServicesSupporting the Global Growth of Our Equipment Operations
Deere & Company Forecast as of 16 May 2012
New locations announced:China … began operations 4Q 2011
Russia … began operations 2Q 2012
Chile … operations expected to begin 2H 2012
India … operations expected to begin 2H 2012
Thailand … operations expected to begin 2H 2012
70
| Deere & Company | July 2012
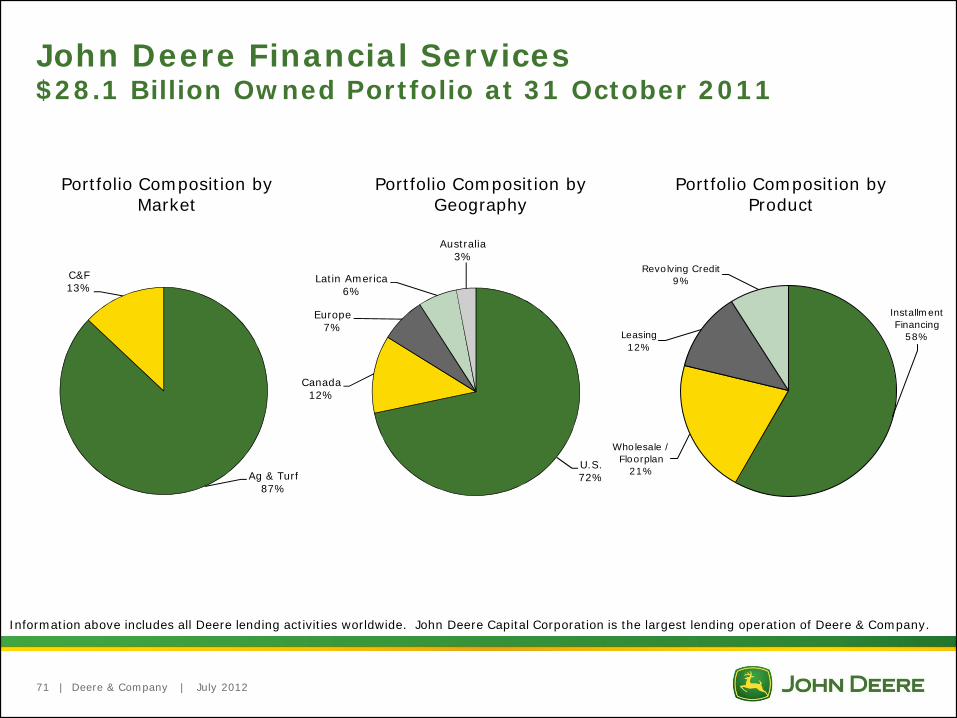
Portfolio Composition by Market
John Deere Financial Services$28.1 Billion Owned Portfolio at 31 October 2011
Portfolio Composition by Geography
Portfolio Composition by Product
Information above includes all Deere lending activities worldwide. John Deere Capital Corporation is the largest lending operation of Deere & Company.
Ag & Turf87%
C&F13%
U.S.72%
Canada12%
Europe7%
Latin America6%
Australia3%
Revolving Credit9%
Leasing12%
Installment Financing
58%
Wholesale / Floorplan
21%
71

| Deere & Company | July 2012
John Deere Capital CorporationProfitability and Growth
271 275 291 311282
149
319364
2004 2005 2006 2007 2008 2009 2010 2011
Net Income ($ Millions)
2004 2005 2006 2007 2008 2009 2010 2011
0.28% 0.16% 0.22% 0.29% 0.33%
0.70%
0.48%
0.12%
Write-offs/Average Owned Portfolio
2004 2005 2006 2007 2008 2009 2010 2011
16.417.7 18.6 19.0 19.1 19.3
21.123.3
Administered Portfolio Growth ($ Billions)
72

| Deere & Company | July 2012
John Deere Capital Corporation Retail Notes60+ Days Past Due vs. Write-offs
Agriculture & Turf1
• Extremely low write-offs; average less than 5 bps over last 10 years
• Even in severe Ag market of the 1980s, losses were comparatively low
Construction & Forestry• The performance and quality
of portfolio improved during 2011
-0.05%
0.45%
0.95%
1.45%
1.95%
2.45%
2.95%
3.45%
3.95%
'83 '86 '89 '92 '95 '98 '01 '04 '07 '10Net Write-offs (Ag) Installments 60+DPD (Ag)
-0.05%
0.45%
0.95%
1.45%
1.95%
2.45%
2.95%
3.45%
3.95%
'95 '98 '01 '04 '07 '10Net Write-offs (C&F) Installments 60+DPD (C&F)
(1) 1982 – 1985 includes Construction; 1986 - 1994 includes Lawn & Grounds Care; beginning in 2009 includes both Ag and Turf equipment; As % of Owned Losses After Dealer Reserve Charges
Source: 1982 – 1994 internal reporting, 1995 - 2010 JDCC 10-K filings, 2011 Deere & Company 8-K filed with SEC 23 November 2011
73

|
0%
10%
20%
30%
40%
50%
60%
70%
80%
90%
100%
110%
Year 0 Year 1 Year 2 Year 3 Year 4 Year 5 Year 6
Res
ale
Valu
e as
a %
of
Origi
nal
List
Price
Time Since Origination
2010 2009 2008 2007 2006 2005
Deere & Company | July 2012
U.S. Resale Value vs. Loan Balance7830 Tractor and 9670 Combine
(1) Model 7810 was replaced with Model 7820 in 2004. In 2007 the 7830 series was introduced to the market. Loan balance assumes a 30% down payment on the highest list price financed for 5 years with annual payments at a rate of 6.50%.
(2) Model 9650 was replaced with Model 9660 in 2004. Model 9660 was subsequently replaced with Model 9670 in 2006.Loan balance assumes a 30% down payment on the highest list price financed for 5 years with annual payments at a rate of 6.50%.
Source for equipment values: North American Equipment Dealers Association
0%
10%
20%
30%
40%
50%
60%
70%
80%
90%
100%
110%
Year 0 Year 1 Year 2 Year 3 Year 4 Year 5 Year 6
Res
ale
Val
ue a
s a
% o
f O
rigi
nal L
ist Pr
ice
Time Since Origination
2010 2009 2008 2007 2006 2005
Loan Balance
Model Year
7830 Tractor (1)
Model Year
9670 Combine (2)
Loan Balance
74
John DeerePower Systems
Engine Emissions and Technology

| Deere & Company | July 2012
Interim Tier 4 (IT4): • 50% Nitrogen Oxide (NOx) reduction• 90% Particulate Matter (PM) reduction
Final Tier 4 (FT4):• 80% NOx reduction
Tier 4 Engine Implementation
Final Tier 4
0
0.10
0.20
0.30
0.40
0.50
0 2.00 4.00 6.00 8.00 10.00 12.00
Tier 1
Tier 2
Tier 3
Interim Tier 4
NOx, g/kw-hr
PM
, g/
kw-h
r
76

| Deere & Company | July 2012
Final Tier 4Continuing Our Planned Building-Block Approach
Combines our customized selective catalytic reduction (SCR) system with our proven IT4 engine platform of cooled exhaust gas recirculation (EGR), diesel oxidation catalyst (DOC), and diesel particulate filter (DPF)
• An optimized solution – John Deere Integrated Emissions Control system– Meets Final Tier 4 emissions regulations– Uncompromised performance: power, torque, and responsiveness
• A fluid-efficient solution - maximum total fluid economy, not just fuel economy– Leverages the proven fuel efficiency of our PowerTech™ Plus engine platform– Low diesel exhaust fluid (DEF) dosing rates– Operate efficiently with low-sulfur diesel and B5-B20 blends
• A field-proven solution– Since 2005, our cooled EGR engines have a proven record of performance and durability– More than 5 million customer operating hours with our smart exhaust filter technology– Dedicated in-house aftertreatment team customizing our own SCR system
• An integrated vehicle solution– We design, manufacture, and service the engine, drivetrain, hydraulics, cooling, and electrical
systems• A fully supported solution
– John Deere’s proven worldwide dealer network is highly trained to provide service and support as well as increase productivity, reliability, and utilization of Deere machines
77

Farm Fundamentals

| Deere & Company | July 2012
U.S. Farm Cash ReceiptsOperating Cash Receipts and Government Payments
• Total cash receipts remain at historically high levels• Record levels expected for 2011
$0
$50
$100
$150
$200
$250
$300
$350
$400
1998 1999 2000 2001 2002 2003 2004 2005 2006 2007 2008 2009 2010 2011F 2012F
$ Bill
ions
Government Payments Total Cash Receipts
Source: 1998 – 2010: USDA 13 February 20122011F – 2012F: Deere & Company Forecast as of 16 May 2012
79

| Deere & Company | July 2012
U.S. Farm Balance Sheet Strong
10%
12%
14%
16%
18%
20%
22%
24%
26%
28%
30%
$0
$500
$1,000
$1,500
$2,000
$2,50019
7019
7119
7219
7319
7419
7519
7619
7719
7819
7919
8019
8119
8219
8319
8419
8519
8619
8719
8819
8919
9019
9119
9219
9319
9419
9519
9619
9719
9819
9920
0020
0120
0220
0320
0420
0520
0620
0720
0820
0920
1020
11F
2012
F
$ Bill
ions
Farm Debt Farm Equity Debt to Equity Ratio (%) Debt to Asset Ratio (%)
Source: 1970 – 2010: USDA 13 February 20122011F – 2012F: Deere & Company Forecast as of 16 May 2012
80

| Deere & Company | July 2012
Corn, Soybeans, Wheat and Cotton PricesNearby Futures: 10 July 2007 – 10 July 2012
Source: Chicago Board of Trade – Corn, Soybeans & Wheat; Intercontinental Exchange – Cotton
1.002.003.004.005.006.007.008.009.00
7/10/07 7/10/08 7/10/09 7/10/10 7/10/11 7/10/12
Do
llars
Per
Bu
shel
Corn
4.00
6.00
8.00
10.00
12.00
14.00
16.00
18.00
7/10/07 7/10/08 7/10/09 7/10/10 7/10/11 7/10/12
Dol
lars
per
Bu
shel
Soybeans
2.00
4.00
6.00
8.00
10.00
12.00
14.00
7/10/07 7/10/08 7/10/09 7/10/10 7/10/11 7/10/12
Do
llars
per
Bu
shel
Wheat
0.25
0.50
0.75
1.00
1.25
1.50
1.75
2.00
2.25
7/10/07 7/10/08 7/10/09 7/10/10 7/10/11 7/10/12
Dol
lars
per
Pou
nd
Cotton
81

| Deere & Company | July 2012
Agricultural Growth – Energy2007 U.S. Energy Bill
• Significantly expanded mandatory levels of renewable fuels
Source: Energy Independence and Security Act of 2007
0
5
10
15
20
25
30
35
40
2008 2010 2012 2014 2016 2018 2020 2022
Gal
lons
(bi
llion
s)
Corn-Based Starch Ethanol Advanced Biofuels
82

| Deere & Company | July 2012
Uses of U.S. Corn Crop 2010-2021Bus
hels
(m
illio
ns)
Source: USDA Agricultural Projections to 2021, February 2012
83
20.0%
23.0%
26.0%
29.0%
32.0%
35.0%
38.0%
41.0%
0
5,000
10,000
15,000
20,000
25,000
Feed & residual Ethanol & By-Products for fuel Food, Seed, & Industrial (Less Ethanol) ExportsEthanol & By-Products for Fuel as % of Total Corn Usage
|
0%
10%
20%
30%
40%
50%
60%
70%19
92
1993
1994
1995
1996
1997
1998
1999
2000
2001
2002
2003
2004
2005
2006
2007
2008
2009
2010
2011
E
2012
P
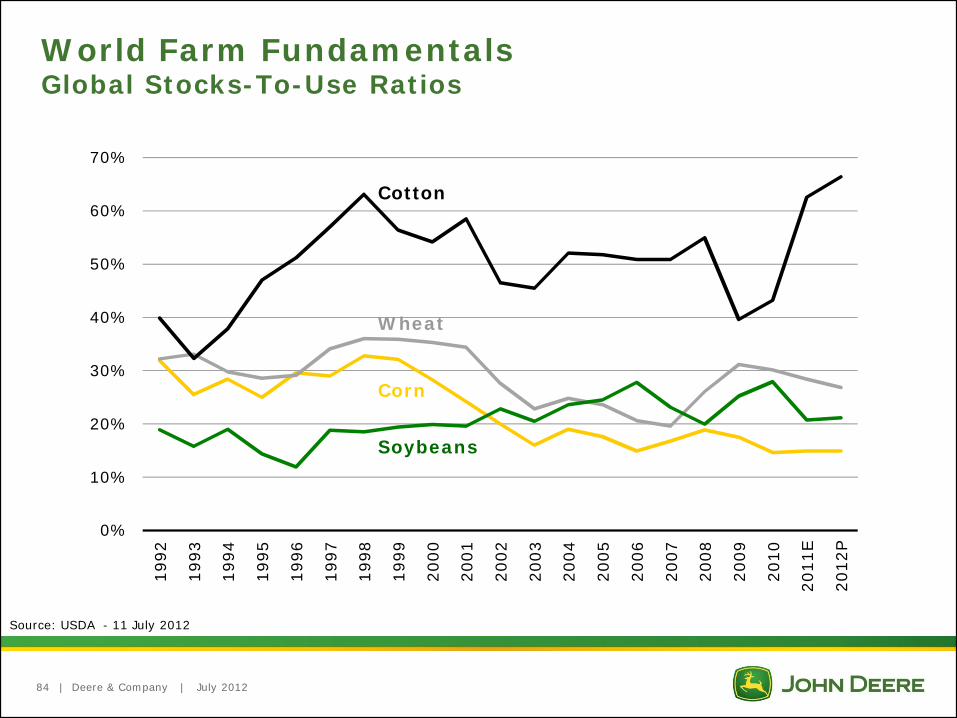
World Farm FundamentalsGlobal Stocks-To-Use Ratios
Source: USDA - 11 July 2012
Deere & Company | July 201284
Cotton
Wheat
Corn
Soybeans
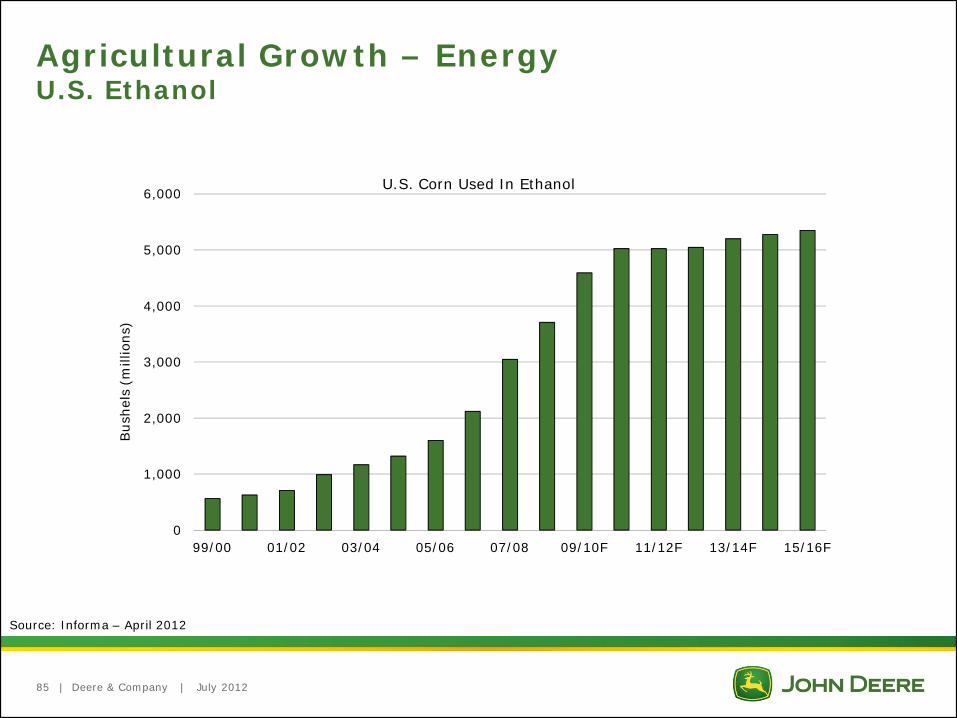
| Deere & Company | July 2012
Agricultural Growth – EnergyU.S. Ethanol
U.S. Corn Used In Ethanol
Source: Informa – April 2012
85
0
1,000
2,000
3,000
4,000
5,000
6,000
99/00 01/02 03/04 05/06 07/08 09/10F 11/12F 13/14F 15/16F
Bus
hels
(m
illio
ns)

| Deere & Company | July 2012
Daily Ethanol Margin Per Bushel Corn GrindBased on Nearby Futures Prices (Excl ITDA*)
*Interest, Tax, Depreciation and Amortization (ITDA) totals ~$0.50 and is often disregarded in margin calculations because it does not influence short term production decisionsSource: Informa – July 2012
($0.50)
$0.00
$0.50
$1.00
$1.50
$2.00
$2.50
$3.00
7/10
/08
10/1
0/08
1/10
/09
4/10
/09
7/10
/09
10/1
0/09
1/10
/10
4/10
/10
7/10
/10
10/1
0/10
1/10
/11
4/10
/11
7/10
/11
10/1
0/11
1/10
/12
4/10
/12
7/10
/12
86

Market and Currency Volatility
|
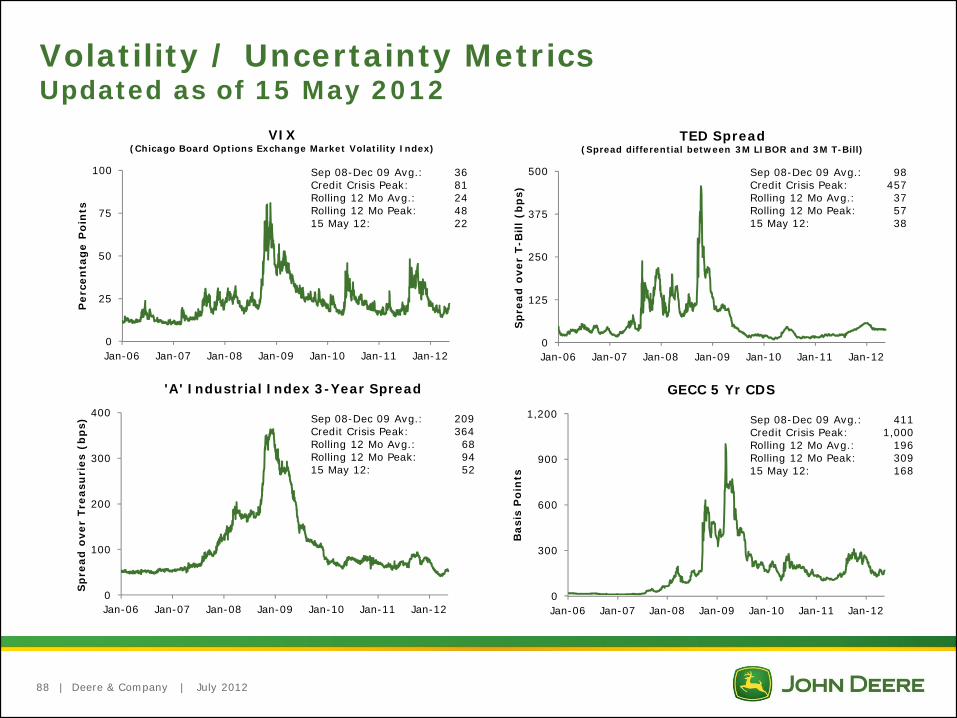
Volatility / Uncertainty MetricsUpdated as of 15 May 2012
Deere & Company | July 201288
Sep 08-Dec 09 Avg.: 36Credit Crisis Peak: 81Rolling 12 Mo Avg.: 24Rolling 12 Mo Peak: 4815 May 12: 22
Sep 08-Dec 09 Avg.: 411Credit Crisis Peak: 1,000Rolling 12 Mo Avg.: 196Rolling 12 Mo Peak: 30915 May 12: 168
Sep 08-Dec 09 Avg.: 209Credit Crisis Peak: 364 Rolling 12 Mo Avg.: 68Rolling 12 Mo Peak: 9415 May 12: 52
Sep 08-Dec 09 Avg.: 98Credit Crisis Peak: 457Rolling 12 Mo Avg.: 37Rolling 12 Mo Peak: 5715 May 12: 38
0
25
50
75
100
Jan-06 Jan-07 Jan-08 Jan-09 Jan-10 Jan-11 Jan-12
Per
cen
tag
e P
oin
ts
VIX(Chicago Board Options Exchange Market Volatility Index)
0
125
250
375
500
Jan-06 Jan-07 Jan-08 Jan-09 Jan-10 Jan-11 Jan-12
Sp
read
ove
r T
-Bill
(b
ps)
TED Spread(Spread differential between 3M LIBOR and 3M T-Bill)
0
100
200
300
400
Jan-06 Jan-07 Jan-08 Jan-09 Jan-10 Jan-11 Jan-12
Sp
read
ove
r T
reas
uri
es (
bp
s)
'A' Industrial Index 3-Year Spread
0
300
600
900
1,200
Jan-06 Jan-07 Jan-08 Jan-09 Jan-10 Jan-11 Jan-12
Bas
is P
oin
ts
GECC 5 Yr CDS

|
65
75
85
95
105
115
125
135
Ind
exed
Val
ue
EUR
GBP
AUD
JPY
CAD
BRL
Wea
ker
FCSt
rong
er F
C
Currency Movement Post Credit Crisis
Deere & Company | July 2012
FY 2008 FY 2009 FY 2010 FY 2011
89
FY 2007

Appendix

| Deere & Company | July 2012
Enterprise SVA Reconciliation to GAAP
Equipment Operations 2001 2002 2003 2004 2005 2006 2007 2008 2009 2010 2011Net Sales 11,077 11,703 13,349 17,673 19,401 19,884 21,489 25,803 20,756 23,573 29,466 Average Identifiable Assets
With Inventories at LIFO 8,743 6,229 5,965 6,482 7,248 7,546 8,092 9,652 9,647 9,196 11,516 With Inventories at Standard Cost 9,678 7,147 6,925 7,477 8,312 8,634 9,205 10,812 10,950 10,494 12,875
Operating Profit (46) 401 708 1,905 1,842 1,905 2,318 2,927 1,365 2,909 3,839 Percent of Net Sales -0.4% 3.4% 5.3% 10.8% 9.5% 9.6% 10.8% 11.3% 6.6% 12.3% 13.0%
Operating Return on AssetsWith Inventories at LIFO -0.5% 6.4% 11.9% 29.4% 25.4% 25.2% 28.6% 30.3% 14.1% 31.6% 33.3%With Inventories at Standard Cost -0.5% 5.6% 10.2% 25.5% 22.2% 22.1% 25.2% 27.1% 12.5% 27.7% 29.8%
SVA Cost of Assets (1,162) (858) (831) (897) (998) (1,036) (1,094) (1,284) (1,301) (1,259) (1,545) Equipment Operations SVA (1,208) (457) (123) 1,008 844 869 1,224 1,643 64 1,650 2,294
Financial ServicesNet Income 262 330 309 345 584 364 337 203 373 471Average Equity 2,115 2,177 2,265 2,227 2,466 2,524 2,355 2,732 3,064 3,194Return on Equity 12.40% 15.20% 13.60% 15.50% 23.70% 14.40% 14.30% 7.40% 12.20% 14.70%Operating Profit Continuing 416 504 466 491 521 553 493 242 499 725Change in Allowance for Doubtful Receivables 16 17 -8 -12 15 17 -4 68 -14 - SVA Income Continuing 432 521 458 479 536 570 489 310 485 725Average Equity Continuing Operations 2,115 2,177 2,163 2,110 2,424 2,524 2,355 2,732 3,064 3,194Average Allowance for Doubtful Receivables 161 160 165 150 148 167 183 195 232 - SVA Average Equity 2,276 2,337 2,328 2,260 2,572 2,691 2,538 2,927 3,296 3,194Cost of Equity -437 -431 -414 -410 -457 -480 -430 -458 -420 -492SVA Continuing Operations 44 69 79 90 59 -148 65 233SVA Discontinued Operations -11 25 - - - - - - Financial Services SVA (5) 90 44 69 79 90 59 (148) 65 233
Deere & Company - Enterprise SVA (462) (33) 1,052 913 948 1,314 1,702 (84) 1,715 2,527
(millions of dollars unless stated otherwise)
91

| Deere & Company | July 2012
Equipment Ops SVA Reconciliation to GAAP
Equipment Operations 1991 1992 1993 1994 1995 1996 1997 1998 1999 2000 2001Net Sales 5,848 5,723 6,479 7,663 8,830 9,640 11,082 11,926 9,701 11,169 11,077 Average Identifiable Assets
With Inventories at LIFO 5,585 5,765 5,449 5,551 6,187 6,502 6,682 7,672 7,724 8,069 8,743 With Inventories at Standard Cost 6,702 6,846 6,442 6,494 7,131 7,488 7,703 8,711 8,739 9,039 9,678
Operating Profit 16 77 242 847 1,006 1,125 1,402 1,476 272 693 (46) Percent of Net Sales 0.3% 1.3% 3.7% 11.1% 11.4% 11.7% 12.6% 12.4% 2.8% 6.2% -0.4%
Operating Return on AssetsWith Inventories at LIFO 0.3% 1.3% 4.4% 15.3% 16.3% 17.3% 21.0% 19.3% 3.5% 8.6% -0.5%With Inventories at Standard Cost 0.2% 1.1% 3.8% 13.0% 14.1% 15.0% 18.2% 16.9% 3.1% 7.7% -0.5%
SVA Cost of Assets (804) (821) (773) (780) (856) (898) (924) (1,045) (1,049) (1,085) (1,162) SVA (788) (744) (531) 67 150 227 477 431 (776) (392) (1,208)
Equipment Operations 2002 2003 2004 2005 2006 2007 2008 2009 2010 2011Net Sales 11,703 13,349 17,673 19,401 19,884 21,489 25,803 20,756 23,573 29,466 Average Identifiable Assets
With Inventories at LIFO 6,229 5,965 6,482 7,248 7,546 8,092 9,652 9,647 9,196 11,516 With Inventories at Standard Cost 7,147 6,925 7,477 8,312 8,634 9,205 10,812 10,950 10,494 12,875
Operating Profit 401 708 1,905 1,842 1,905 2,318 2,927 1,365 2,909 3,839 Percent of Net Sales 3.4% 5.3% 10.8% 9.5% 9.6% 10.8% 11.3% 6.6% 12.3% 13.0%
Operating Return on AssetsWith Inventories at LIFO 6.4% 11.9% 29.4% 25.4% 25.2% 28.6% 30.3% 14.1% 31.6% 33.3%With Inventories at Standard Cost 5.6% 10.2% 25.5% 22.2% 22.1% 25.2% 27.1% 12.5% 27.7% 29.8%
SVA Cost of Assets (858) (831) (897) (998) (1,036) (1,094) (1,284) (1,301) (1,259) (1,545) SVA (457) (123) 1,008 844 869 1,224 1,643 64 1,650 2,294
(millions of dollars unless stated otherwise)
92

| Deere & Company | July 2012
2009 OROA Reconciliation to GAAPEquipment Operations
Equipment Operations2009, as Reported
Exclude Goodwill Impairment &
Voluntary Employee-Separation
2009, as Adjusted
Net Sales 20,756 20,756 Average Identifiable Assets
With Inventories at LIFO 9,647 9,647 With Inventories at Standard Cost 10,950 10,950
Operating Profit 1,365 380 1,745 Percent of Net Sales 6.6% 8.4%
Operating Return on AssetsWith Inventories at LIFO 14.1% 18.1%With Inventories at Standard Cost 12.5% 15.9%
(millions of dollars unless stated otherwise)
93