default and recovery rates of european corporate … comment default and recovery rates of european...
TRANSCRIPT
Special Comment
New YorkPraveen Varma 1.212.553.1653Richard CantorDavid Hamilton LondonEric de Bodard 44.20.7772.5454Alice KeeganGuillaume Menuet
Contact Phone
March 2006
Default and Recovery Rates of European Corporate Bond Issuers: 1985-2005
This is Moody's fifth annual study of European corporate bond issuers and their default experience. Broad conclu-
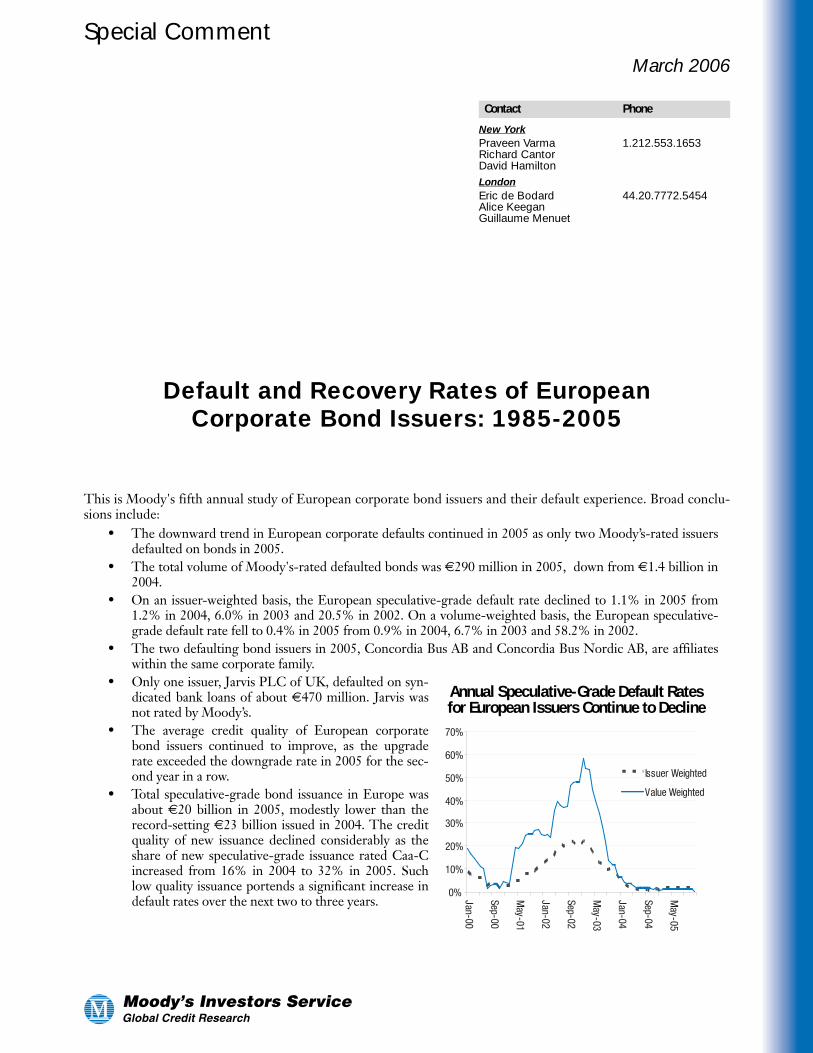
sions include:• The downward trend in European corporate defaults continued in 2005 as only two Moody’s-rated issuersdefaulted on bonds in 2005.
• The total volume of Moody's-rated defaulted bonds was €290 million in 2005, down from €1.4 billion in2004.
• On an issuer-weighted basis, the European speculative-grade default rate declined to 1.1% in 2005 from1.2% in 2004, 6.0% in 2003 and 20.5% in 2002. On a volume-weighted basis, the European speculative-grade default rate fell to 0.4% in 2005 from 0.9% in 2004, 6.7% in 2003 and 58.2% in 2002.
• The two defaulting bond issuers in 2005, Concordia Bus AB and Concordia Bus Nordic AB, are affiliateswithin the same corporate family.
• Only one issuer, Jarvis PLC of UK, defaulted on syn-dicated bank loans of about €470 million. Jarvis wasnot rated by Moody’s.
• The average credit quality of European corporatebond issuers continued to improve, as the upgraderate exceeded the downgrade rate in 2005 for the sec-ond year in a row.
• Total speculative-grade bond issuance in Europe wasabout €20 billion in 2005, modestly lower than therecord-setting €23 billion issued in 2004. The creditquality of new issuance declined considerably as theshare of new speculative-grade issuance rated Caa-Cincreased from 16% in 2004 to 32% in 2005. Suchlow quality issuance portends a significant increase indefault rates over the next two to three years.
0%
10%
20%
30%
40%
50%
60%
70%
Jan-00
Sep-00
May-01
Jan-02
Sep-02
May-03
Jan-04
Sep-04
May-05
Issuer Weighted
Value Weighted
Annual Speculative-Grade Default Rates for European Issuers Continue to Decline
Table of ContentsPage
2 Moody’s Special Comment
Introduction .............................................................................................................................................. 5
Database and Methodology ...................................................................................................................... 5
The 2005 European Corporate Default Experience .................................................................................... 7European Speculative-Grade Bond Default Rates ............................................................................................... 8Cumulative Default Rates................................................................................................................................... 9
Trends in Credit Quality .......................................................................................................................... 10Rating Migration Rates..................................................................................................................................... 10Upgrade-to-Downgrade Ratios......................................................................................................................... 12
Ratings Performance .............................................................................................................................. 13
Recovery Rates for European Defaulted Instruments ............................................................................... 14
Credit Losses.......................................................................................................................................... 14
Looking Ahead (2006-2008) ................................................................................................................... 15
Summary and Conclusions ..................................................................................................................... 16
Related Research ................................................................................................................................... 17
Appendix I - Methodology ....................................................................................................................... 18Estimated Senior Ratings ................................................................................................................................. 18Default Rate Calculations ................................................................................................................................. 18Recovery Rate Estimates ................................................................................................................................. 19
Appendix II – Supplemental Default and Transition Rates Tables for European Issuers ............................ 20
Moody’s Special Comment 3
Table of Exhibits
Exhibit 1 - Distribution of European Bond Issuers by Whole Letter Rating..............................................................6
Exhibit 2 - Countries of Domicile of European Moody’s-Rated Corporate Bond Issuers..........................................6
Exhibit 3 – European Bond Default Counts and Volumes.......................................................................................7
Exhibit 4 – List of the 2005 European Defaulters ..................................................................................................7
Exhibit 5 - European Issuer-Weighted and Volume-Weighted Speculative-Grade Bond Default Rates....................8
Exhibit 6 - Average Annual Speculative-Grade Default Rates for European and North American Issuers ................8
Exhibit 7 - European and North American Issuer-Weighted Cumulative Default Rates, 1985-2005........................9
Exhibit 8 - Broad Letter Grade One-Year-Average Ratings Transition for Europe and North America – 1985- 2005..........................................................................................................................10
Exhibit 9 - Broad Letter Grade 2005-Ratings Transition for Europe and North America .......................................11
Exhibit 10 – Upgrade-to-Downgrade Ratio and Counts of Upgrade and Downgrade for European Issuers ...........12
Exhibit 11 – Upgrade-to-Downgrade Ratios for European and North-American Issuers .......................................12
Exhibit 12 - European Fallen Angles in 2005 ......................................................................................................13
Exhibit 13 - 1-Year Horizon Cumulative Accuracy Plots, Europe vs. North America, 1985-2004 - Percent of Population, Ordered by Rating Category ..........................................................................................................13
Exhibit 14 - Issuer-Weighted Recovery Rates for European and North-American Issuers* ...................................14
Exhibit 15 - One-Year Credit Losses Based on Broad Letter Rating for European and North American Issuers (1985-2005) .......................................................................................................................................15
Exhibit 16 – Rise in Deep Speculative-Grade Issuance since 2000 .....................................................................15
Exhibit 17 - Average Annual Default Rates for European and North American Issuers .........................................20
Exhibit 18 - Trailing 12 Months Value Weighted Speculative-Grade Default Rates for Europe..............................21
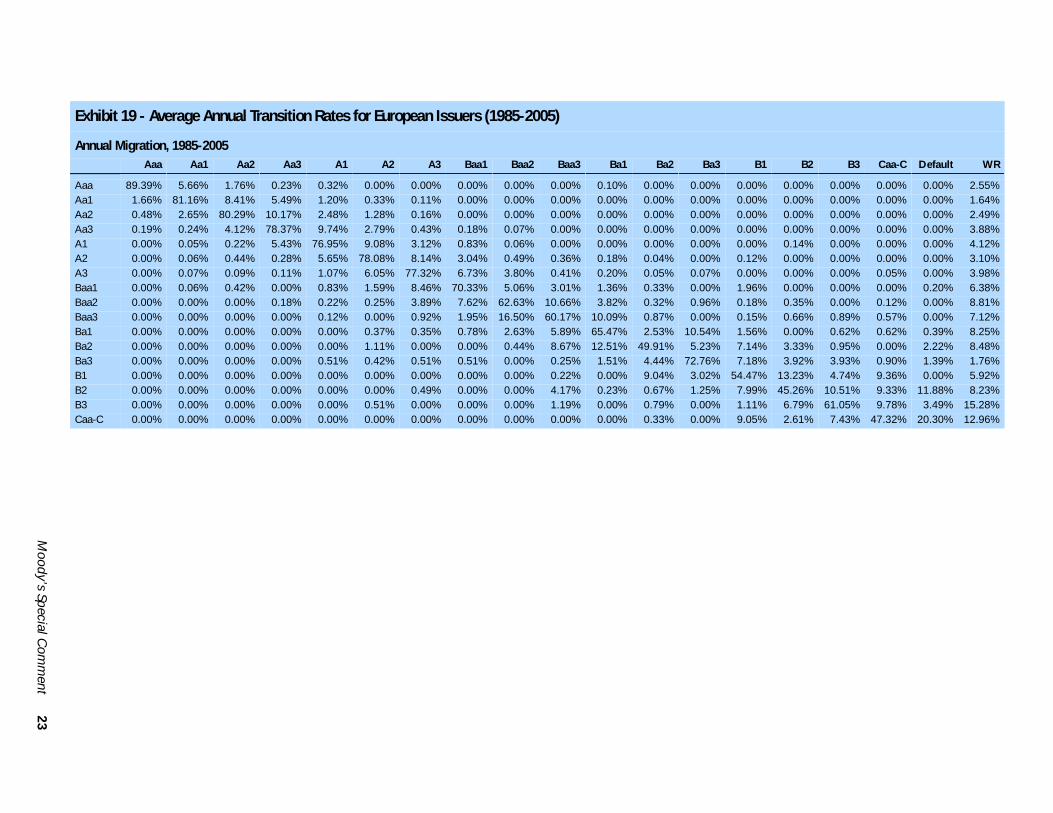
Exhibit 19 - Average Annual Transition Rates for European Issuers (1985-2005) ................................................23
Page

PAGE INTENTIONALLY LEFT BLANK
Introduction
By all accounts, 2005 was a benign year for corporate bond and loan defaults in Europe, which is consistent with thepositive global credit environment. Only two Moody’s-rated issuers in Europe defaulted on bonds (both companies areaffiliates within the same corporate family), and one company which was not rated by Moody’s defaulted on syndicatedloans. Following the peak in corporate defaults in 2002, defaults in Europe have been declining and speculative-gradedebt issuance has been increasing. With this backdrop, we present Moody’s fifth annual report on the credit anddefault experience of European corporate bond issuers. We examine the ratings transitions, default experience anddefault rates, recovery rates, and Moody’s rating performance, for the 1985-2005 period. Additionally, we discusstrends in debt issuance and changes in credit quality.
Database And Methodology
Moody’s corporate bond default research is derived from Moody's Default Risk Service Database (DRS), a compre-hensive database of corporate defaults, credit ratings and defaulted bond prices for industrial and transportation com-panies, utilities and financial institutions that have issued long-term debt to the public. As of year-end 2005, nearly1,200 European issuers held a Moody’s rating.
The basic unit of study in this report is the corporate bond issuer’s individual rating history.1 Moody’s intends itsratings to support credit decisions, which do not generally vary with either the size or number of bonds that a firm mayhave outstanding. In most cases, when an issuer defaults on one of its bonds, it defaults on all of them. Therefore,Moody’s normally reports its default statistics on an “issuer-weighted” basis, i.e., the fraction of issuers that default,rather than on an “issue-" or “volume-weighted” basis. To the extent that historical default experience is predictive offuture experience, issuer-weighted statistics are likely to provide the most reliable guides. If we were to weight our sta-tistics by the number of bond issues or their par amounts, we would be placing undue emphasis on the particular his-torical experiences of a few large or very frequent issuers of corporate bonds. For the purpose of this study, onlycorporate bond ratings on domestic- or foreign-currency denominated debt are considered. We exclude any debt thatwas backed by a guarantor outside the corporate family (e.g. a bond insurer).
Moody’s global default database, of which the data in this study are a subset, covers over 5,000 defaults by issuersboth rated and not rated by Moody’s worldwide. Moody’s has compiled this information using a variety of sources, var-ious print and online publishing sources, press releases, press clippings, internal memoranda, and records of analystcontacts with rated issuers. Moody’s default database includes nearly 250 long-term bond defaults by European issuers,both rated and non-rated, since 1980.
Moody’s Definition of Default Moody's definition of default is designed to capture credit events that result in impairments to bondholders' contrac-tual claims. Consequently, Moody’s definition is strict and includes three types of default events:
• A missed or delayed disbursement of interest and/or principal, including delayed payments made within agrace period;
• Filing for bankruptcy, administration, legal receivership, or other legal blocks (perhaps by regulators) to thetimely payment of interest and/or principal; or
• A distressed exchange occurs where: (i) the issuer offers bondholders a new security or package of securitiesthat amount to a diminished financial obligation (such as preferred or common stock, or debt with a lowercoupon or par amount); or (ii) the exchange had the apparent purpose of helping the borrower avoid immi-nent default.
This definition is intended to capture events that change the relationship between the bondholder and bond issuerfrom the relationship which was originally contracted, and which subject the bondholder to an economic loss. We seekto identify only those economic losses that are the result of a credit event.2 Technical defaults (covenant violations,etc.) are not included in Moody’s definition of default.
1. When available, an issuer’s senior unsecured rating is used as the reference rating. Absent such a rating, Moody’s infers an equivalent senior unsecured rating from the issuer’s other rated debt obligations. Additionally, when an issuer has rated debt obligations outstanding in domestic and foreign currency, the lower of the two actual or inferred senior unsecured ratings is used.
2. It is important to note that economic losses suffered by bondholders due to changes in market conditions only are not considered defaults. Nor are losses due to price changes associated with deterioration in the credit quality of the issuer, as long as the terms of the obligation are being met.
Moody’s Special Comment 5
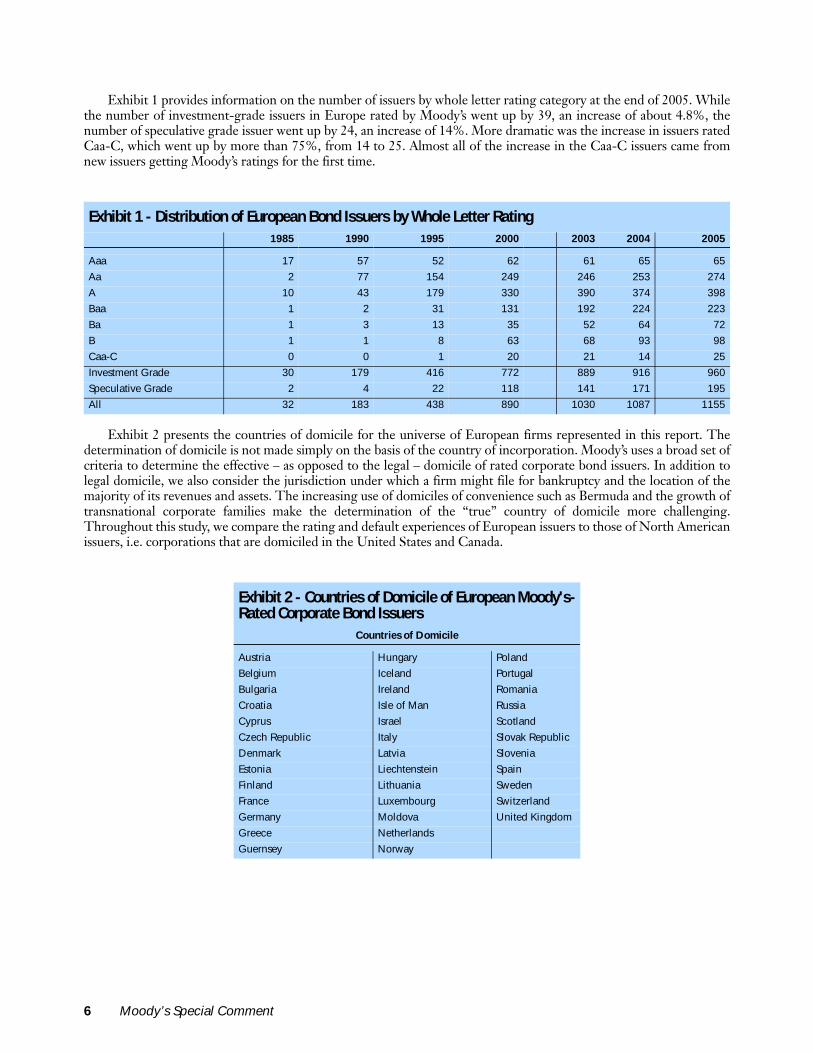
Exhibit 1 provides information on the number of issuers by whole letter rating category at the end of 2005. Whilethe number of investment-grade issuers in Europe rated by Moody’s went up by 39, an increase of about 4.8%, thenumber of speculative grade issuer went up by 24, an increase of 14%. More dramatic was the increase in issuers ratedCaa-C, which went up by more than 75%, from 14 to 25. Almost all of the increase in the Caa-C issuers came fromnew issuers getting Moody’s ratings for the first time.
Exhibit 2 presents the countries of domicile for the universe of European firms represented in this report. Thedetermination of domicile is not made simply on the basis of the country of incorporation. Moody’s uses a broad set ofcriteria to determine the effective – as opposed to the legal – domicile of rated corporate bond issuers. In addition tolegal domicile, we also consider the jurisdiction under which a firm might file for bankruptcy and the location of themajority of its revenues and assets. The increasing use of domiciles of convenience such as Bermuda and the growth oftransnational corporate families make the determination of the “true” country of domicile more challenging.Throughout this study, we compare the rating and default experiences of European issuers to those of North Americanissuers, i.e. corporations that are domiciled in the United States and Canada.
Exhibit 1 - Distribution of European Bond Issuers by Whole Letter Rating1985 1990 1995 2000 2003 2004 2005
Aaa 17 57 52 62 61 65 65
Aa 2 77 154 249 246 253 274
A 10 43 179 330 390 374 398
Baa 1 2 31 131 192 224 223
Ba 1 3 13 35 52 64 72
B 1 1 8 63 68 93 98
Caa-C 0 0 1 20 21 14 25
Investment Grade 30 179 416 772 889 916 960
Speculative Grade 2 4 22 118 141 171 195
All 32 183 438 890 1030 1087 1155
Exhibit 2 - Countries of Domicile of European Moody's-Rated Corporate Bond Issuers
Countries of Domicile
Austria Hungary Poland
Belgium Iceland Portugal
Bulgaria Ireland Romania
Croatia Isle of Man Russia
Cyprus Israel Scotland
Czech Republic Italy Slovak Republic
Denmark Latvia Slovenia
Estonia Liechtenstein Spain
Finland Lithuania Sweden
France Luxembourg Switzerland
Germany Moldova United Kingdom
Greece Netherlands
Guernsey Norway
6 Moody’s Special Comment
The 2005 European Corporate Default Experience
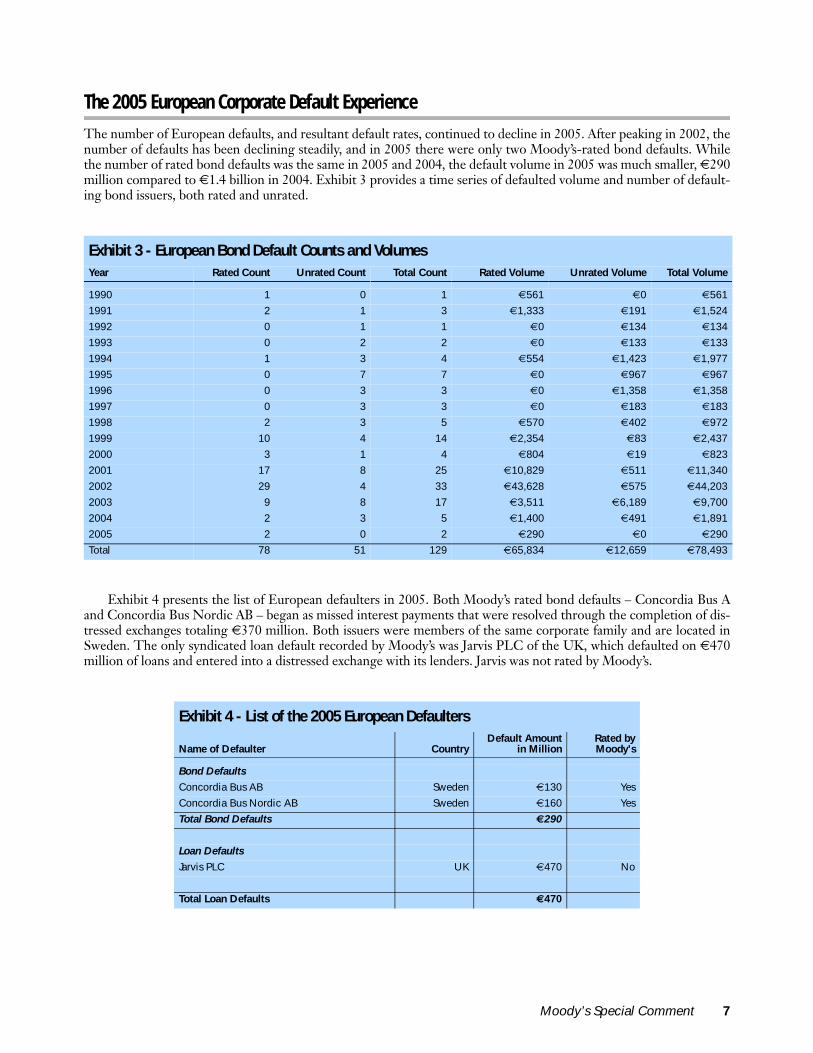
The number of European defaults, and resultant default rates, continued to decline in 2005. After peaking in 2002, thenumber of defaults has been declining steadily, and in 2005 there were only two Moody’s-rated bond defaults. Whilethe number of rated bond defaults was the same in 2005 and 2004, the default volume in 2005 was much smaller, €290million compared to €1.4 billion in 2004. Exhibit 3 provides a time series of defaulted volume and number of default-ing bond issuers, both rated and unrated.
Exhibit 4 presents the list of European defaulters in 2005. Both Moody’s rated bond defaults – Concordia Bus Aand Concordia Bus Nordic AB – began as missed interest payments that were resolved through the completion of dis-tressed exchanges totaling €370 million. Both issuers were members of the same corporate family and are located inSweden. The only syndicated loan default recorded by Moody’s was Jarvis PLC of the UK, which defaulted on €470million of loans and entered into a distressed exchange with its lenders. Jarvis was not rated by Moody’s.
Exhibit 3 - European Bond Default Counts and VolumesYear Rated Count Unrated Count Total Count Rated Volume Unrated Volume Total Volume
1990 1 0 1 €561 €0 €561
1991 2 1 3 €1,333 €191 €1,524
1992 0 1 1 €0 €134 €134
1993 0 2 2 €0 €133 €133
1994 1 3 4 €554 €1,423 €1,977
1995 0 7 7 €0 €967 €967
1996 0 3 3 €0 €1,358 €1,358
1997 0 3 3 €0 €183 €183
1998 2 3 5 €570 €402 €972
1999 10 4 14 €2,354 €83 €2,437
2000 3 1 4 €804 €19 €823
2001 17 8 25 €10,829 €511 €11,340
2002 29 4 33 €43,628 €575 €44,203
2003 9 8 17 €3,511 €6,189 €9,700
2004 2 3 5 €1,400 €491 €1,891
2005 2 0 2 €290 €0 €290
Total 78 51 129 €65,834 €12,659 €78,493
Exhibit 4 - List of the 2005 European Defaulters
Name of Defaulter CountryDefault Amount
in MillionRated byMoody's
Bond Defaults
Concordia Bus AB Sweden €130 Yes
Concordia Bus Nordic AB Sweden €160 Yes
Total Bond Defaults €290
Loan Defaults
Jarvis PLC UK €470 No
Total Loan Defaults €470
Moody’s Special Comment 7
European Speculative-Grade Bond Default Rates
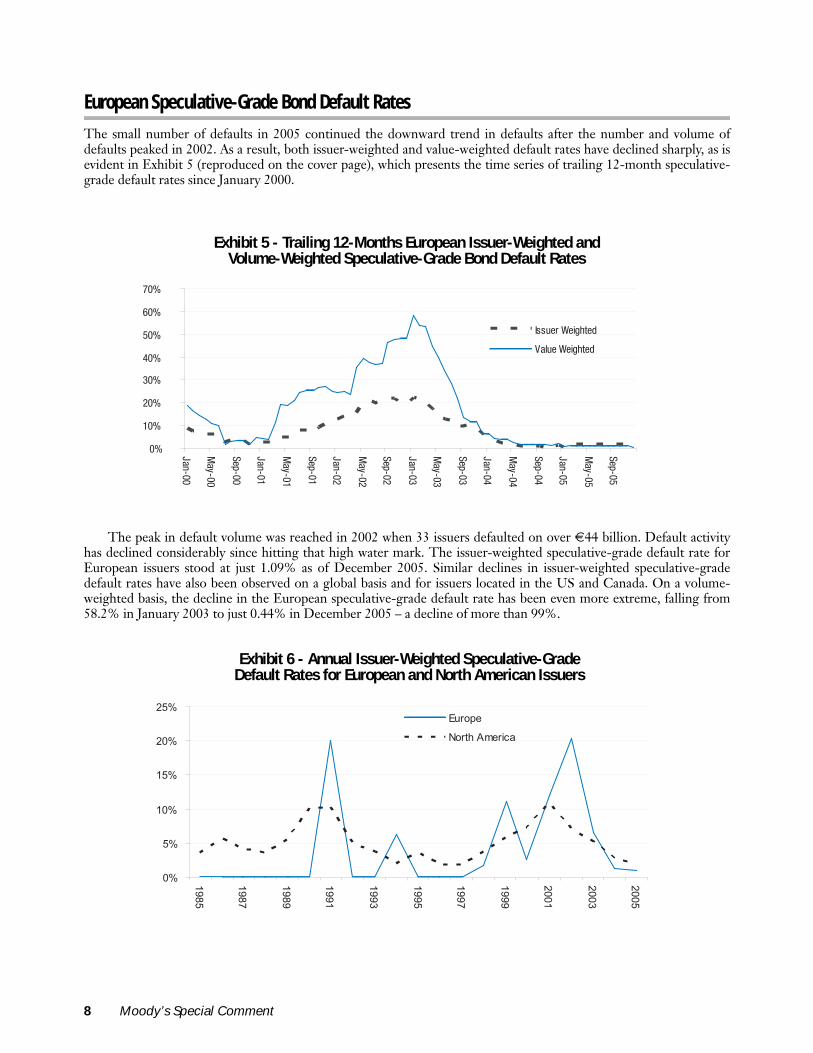
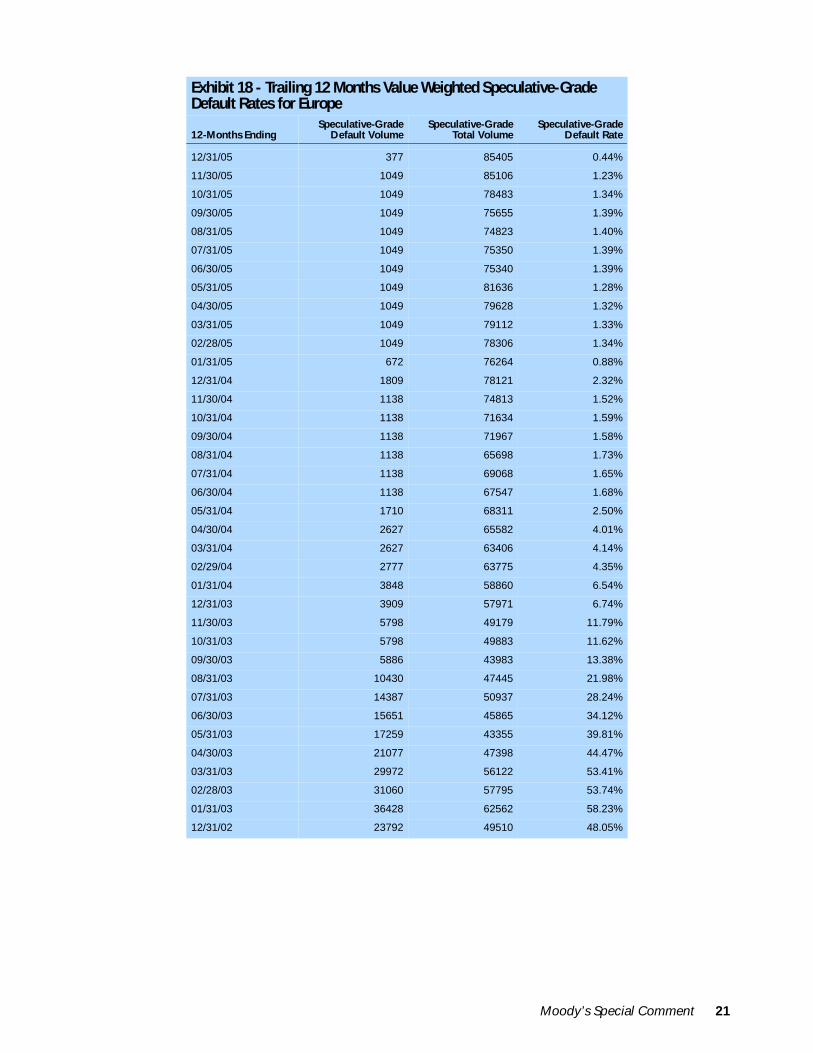
The small number of defaults in 2005 continued the downward trend in defaults after the number and volume ofdefaults peaked in 2002. As a result, both issuer-weighted and value-weighted default rates have declined sharply, as isevident in Exhibit 5 (reproduced on the cover page), which presents the time series of trailing 12-month speculative-grade default rates since January 2000.
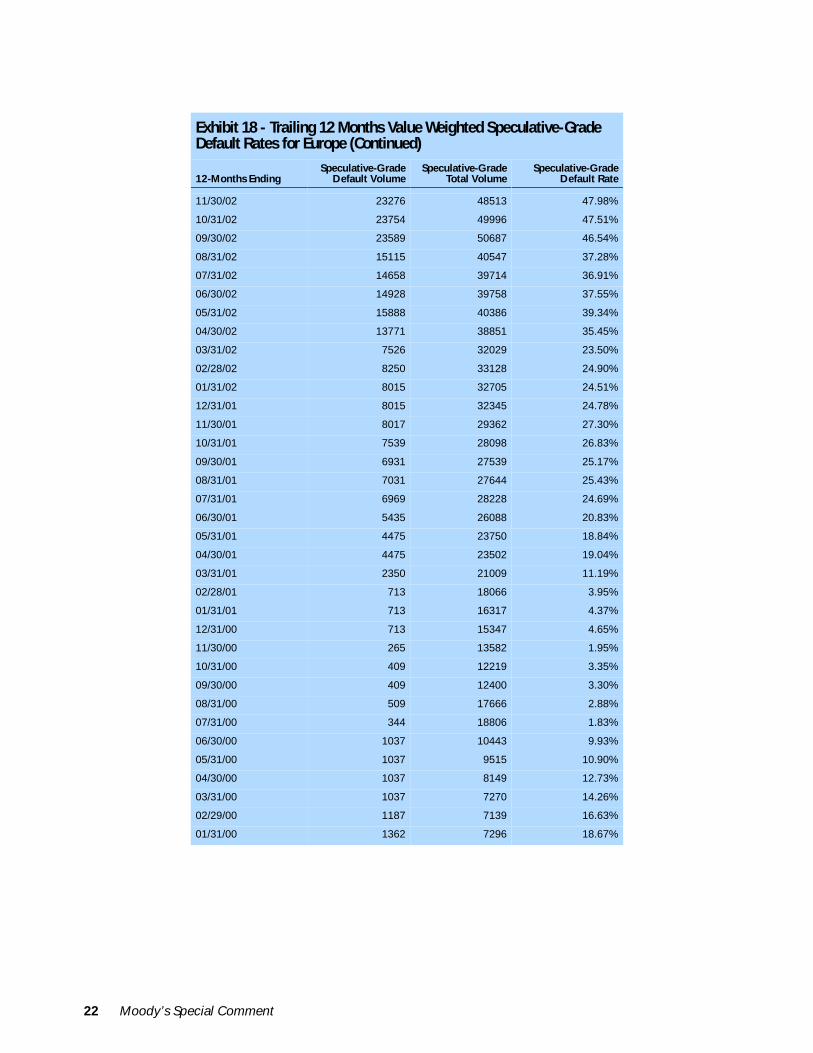
The peak in default volume was reached in 2002 when 33 issuers defaulted on over €44 billion. Default activityhas declined considerably since hitting that high water mark. The issuer-weighted speculative-grade default rate forEuropean issuers stood at just 1.09% as of December 2005. Similar declines in issuer-weighted speculative-gradedefault rates have also been observed on a global basis and for issuers located in the US and Canada. On a volume-weighted basis, the decline in the European speculative-grade default rate has been even more extreme, falling from58.2% in January 2003 to just 0.44% in December 2005 – a decline of more than 99%.
0%
10%
20%
30%
40%
50%
60%
70%
Jan-00
May-00
Sep-00
Jan-01
May-01
Sep-01
Jan-02
May-02
Sep-02
Jan-03
May-03
Sep-03
Jan-04
May-04
Sep-04
Jan-05
May-05
Sep-05
Issuer Weighted
Value Weighted
Exhibit 5 - Trailing 12-Months European Issuer-Weighted and Volume-Weighted Speculative-Grade Bond Default Rates
0%
5%
10%
15%
20%
25%
1985
1987
1989
1991
1993
1995
1997
1999
2001
2003
2005
Europe
North America
Exhibit 6 - Annual Issuer-Weighted Speculative-Grade Default Rates for European and North American Issuers
8 Moody’s Special Comment

Historically, European speculative-grade defaults rates have been more variable than those of North Americabecause the speculative-grade universe itself was very small in Europe prior to 1996. As such, a small number ofdefaults would result in a very high default rate. For example, the default rate in 1991 was 25% for Europe becausethere were only eight rated speculative-grade issuers, out of which two defaulted. However, with an increasing numberof speculative-grade issuers now issuing debt, the speculative-grade default rate for Europe is becoming a more mean-ingful indicator of the overall credit environment in Europe.
Cumulative Default Rates
Investors are also interested in default rates for investment horizons longer than one year. Exhibit 7 presents 1-yearthrough 5-year issuer-weighted average cumulative default rates for European issuers. Also presented are the NorthAmerican (US and Canada) statistics for comparison. In previous years, Moody's European default study has presentedhistorical average default and rating migration rates that were calculated using cohorts formed at annual frequencies.In this year's report, we increase the underlying sample by using a monthly cohort periodicity. Monthly cohorts havethe advantage of capturing rating changes that occur within a calendar year. The default rates are calculated based oncohorts of all issuers holding a given estimated senior rating at the start of a given month. The cohorts are dynamic inthat they change based on whether these issuers leave the cohort due to default or non credit-related reasons (e.g.,maturing of debt).
The dynamic nature of the cohorts allows the estimation of cumulative default risk over multi-year horizonswhich is free of survivorship bias. It also allows for the comparison and averaging of default rates over different peri-ods. By forming and tracking such cohorts of all Moody's-rated issuers with debt outstanding as of beginning of everymonth, we replicate the experience of a portfolio of both seasoned and new-issue bonds purchased in a month. Whilethe cohort frequency is monthly, the accumulation periodicity is still 12-months, in that we track default rates over hori-zons of 1-year, 2-year, 3-year, etc.3
3. See Appendix I for the detailed methodology.
Exhibit 7 - European and North American Issuer-Weighted Cumulative Default Rates, 1985-2005Europe Year 1 Year 2 Year 3 Year 4 Year 5
Aaa 0.00% 0.00% 0.00% 0.00% 0.00%
Aa 0.00% 0.00% 0.00% 0.00% 0.00%
A 0.02% 0.09% 0.14% 0.18% 0.26%
Baa 0.28% 0.70% 1.26% 1.82% 2.32%
Ba 1.22% 2.78% 4.16% 4.72% 4.97%
B 5.07% 13.50% 21.28% 28.51% 35.65%
Caa-C 28.73% 42.87% 55.95% 62.15% 62.80%
Investment-Grade 0.05% 0.14% 0.23% 0.31% 0.39%
Speculative-Grade 6.78% 13.36% 19.33% 23.62% 26.60%
All Corporates 0.75% 1.46% 2.02% 2.38% 2.63%
North America Year 1 Year 2 Year 3 Year 4 Year 5
Aaa 0.00% 0.00% 0.00% 0.00% 0.04%
Aa 0.00% 0.01% 0.06% 0.13% 0.18%
A 0.03% 0.14% 0.32% 0.50% 0.67%
Baa 0.23% 0.65% 1.17% 1.78% 2.39%
Ba 1.44% 4.01% 6.99% 9.92% 12.54%
B 5.86% 12.76% 19.29% 25.01% 30.33%
Caa-C 20.11% 32.32% 41.97% 50.17% 56.76%
Investment-Grade 0.09% 0.28% 0.55% 0.84% 1.12%
Speculative-Grade 5.33% 10.81% 15.95% 20.46% 24.42%
All Corporates 2.15% 4.34% 6.35% 8.06% 9.49%
Moody’s Special Comment 9
10 Moody’s Special Comment
A comparison between Europe and North America shows that while investment-grade default rates are lower inEurope, average speculative-grade default rates are somewhat higher for each investment horizon from 1 to 5 years.The differences in cumulative default rates between Europe and North America are explained by differences in the dis-tribution of rating in the two regions. Since the proportion of investment-grade issuers is larger in Europe and theyhave lower default rates when compared to issuers in the North America, the overall default rate has been lower inEurope than in North America.
Trends In Credit Quality
In addition to the default rates, rating migration rates and upgrade-to-downgrade ratios are also important indicatorsof changes in credit quality.
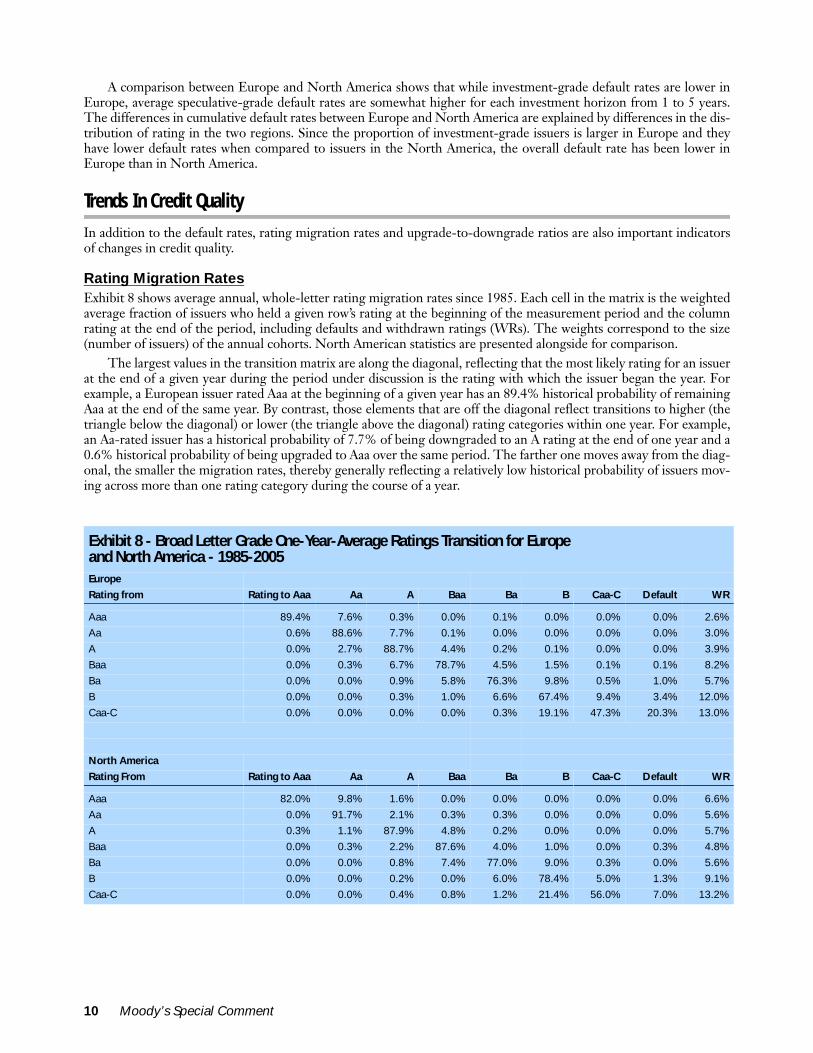
Rating Migration RatesExhibit 8 shows average annual, whole-letter rating migration rates since 1985. Each cell in the matrix is the weightedaverage fraction of issuers who held a given row’s rating at the beginning of the measurement period and the columnrating at the end of the period, including defaults and withdrawn ratings (WRs). The weights correspond to the size(number of issuers) of the annual cohorts. North American statistics are presented alongside for comparison.
The largest values in the transition matrix are along the diagonal, reflecting that the most likely rating for an issuerat the end of a given year during the period under discussion is the rating with which the issuer began the year. Forexample, a European issuer rated Aaa at the beginning of a given year has an 89.4% historical probability of remainingAaa at the end of the same year. By contrast, those elements that are off the diagonal reflect transitions to higher (thetriangle below the diagonal) or lower (the triangle above the diagonal) rating categories within one year. For example,an Aa-rated issuer has a historical probability of 7.7% of being downgraded to an A rating at the end of one year and a0.6% historical probability of being upgraded to Aaa over the same period. The farther one moves away from the diag-onal, the smaller the migration rates, thereby generally reflecting a relatively low historical probability of issuers mov-ing across more than one rating category during the course of a year.
Exhibit 8 - Broad Letter Grade One-Year-Average Ratings Transition for Europe and North America - 1985-2005Europe
Rating from Rating to Aaa Aa A Baa Ba B Caa-C Default WR
Aaa 89.4% 7.6% 0.3% 0.0% 0.1% 0.0% 0.0% 0.0% 2.6%
Aa 0.6% 88.6% 7.7% 0.1% 0.0% 0.0% 0.0% 0.0% 3.0%
A 0.0% 2.7% 88.7% 4.4% 0.2% 0.1% 0.0% 0.0% 3.9%
Baa 0.0% 0.3% 6.7% 78.7% 4.5% 1.5% 0.1% 0.1% 8.2%
Ba 0.0% 0.0% 0.9% 5.8% 76.3% 9.8% 0.5% 1.0% 5.7%
B 0.0% 0.0% 0.3% 1.0% 6.6% 67.4% 9.4% 3.4% 12.0%
Caa-C 0.0% 0.0% 0.0% 0.0% 0.3% 19.1% 47.3% 20.3% 13.0%
North America
Rating From Rating to Aaa Aa A Baa Ba B Caa-C Default WR
Aaa 82.0% 9.8% 1.6% 0.0% 0.0% 0.0% 0.0% 0.0% 6.6%
Aa 0.0% 91.7% 2.1% 0.3% 0.3% 0.0% 0.0% 0.0% 5.6%
A 0.3% 1.1% 87.9% 4.8% 0.2% 0.0% 0.0% 0.0% 5.7%
Baa 0.0% 0.3% 2.2% 87.6% 4.0% 1.0% 0.0% 0.3% 4.8%
Ba 0.0% 0.0% 0.8% 7.4% 77.0% 9.0% 0.3% 0.0% 5.6%
B 0.0% 0.0% 0.2% 0.0% 6.0% 78.4% 5.0% 1.3% 9.1%
Caa-C 0.0% 0.0% 0.4% 0.8% 1.2% 21.4% 56.0% 7.0% 13.2%

Moody’s Special Comment 11
European ratings display high degree of stability across various rating categories. On average, 85% of all ratedissuers retain their beginning-of-year ratings. European ratings have also exhibited somewhat greater stability thanNorth American ratings. For example, single A-rated European issuers have experienced a 4.4% historical probabilityof downgrade to a Baa rating, compared to a 4.8% probability for North American issuers. Moreover, most upgradesor downgrades in one year involve a change of just a single whole letter rating category.
In contrast to Exhibit 8, which focuses on the long-term historical average rating migration experience, Exhibit 9summarizes the one-year rating transition experience of European and North American issuers for just the year 2005.
The credit quality of European issuers continued to improve in 2005, as shown by the number of upgrades for var-ious rating categories. For example, 11.6% of the Baa-rated issuers were upgraded to single-A in 2005, considerablyhigher than the long-term historical upgrade rate of Baa issues, which is 6.7%. Similarly, 8.9% of the B-rated issuerswere upgraded to Ba, compared to 6.6% historically. A large portion (32%) of issuers rated Caa-C was upgraded to B,well above the long-term average of 19.1%.
Exhibit 9 - Broad Letter Grade 2005-Ratings Transition for Europe and North America Europe
Rating From: Rating to Aaa Aa A Baa Ba B Caa-C Default WR
Aaa 100.0% 0.0% 0.0% 0.0% 0.0% 0.0% 0.0% 0.0% 0.0%
Aa 0.0% 97.7% 0.0% 0.0% 0.0% 0.0% 0.0% 0.0% 2.3%
A 0.0% 1.7% 87.9% 7.2% 0.0% 0.0% 0.0% 0.0% 3.3%
Baa 0.0% 0.0% 11.6% 80.4% 1.7% 1.7% 0.0% 0.0% 4.6%
Ba 0.0% 0.0% 1.7% 6.8% 74.6% 5.1% 0.0% 0.0% 11.9%
B 0.0% 0.0% 0.0% 0.0% 8.9% 72.2% 3.3% 0.0% 15.6%
Caa-C 0.0% 0.0% 0.0% 0.0% 4.0% 32.0% 56.0% 8.0% 0.0%
North America
Rating From: Rating to Aaa Aa A Baa Ba B Caa-C Default WR
Aaa 82.0% 9.8% 1.6% 0.0% 0.0% 0.0% 0.0% 0.0% 6.6%
Aa 0.0% 91.7% 2.1% 0.3% 0.3% 0.0% 0.0% 0.0% 5.6%
A 0.3% 1.1% 87.9% 4.8% 0.2% 0.0% 0.0% 0.0% 5.7%
Baa 0.0% 0.3% 2.2% 87.6% 4.0% 1.0% 0.0% 0.3% 4.8%
Ba 0.0% 0.0% 0.8% 7.4% 77.0% 9.0% 0.3% 0.0% 5.6%
B 0.0% 0.0% 0.2% 0.0% 6.0% 78.4% 5.0% 1.3% 9.1%
Caa-C 0.0% 0.0% 0.4% 0.8% 1.2% 21.4% 56.0% 7.0% 13.2%
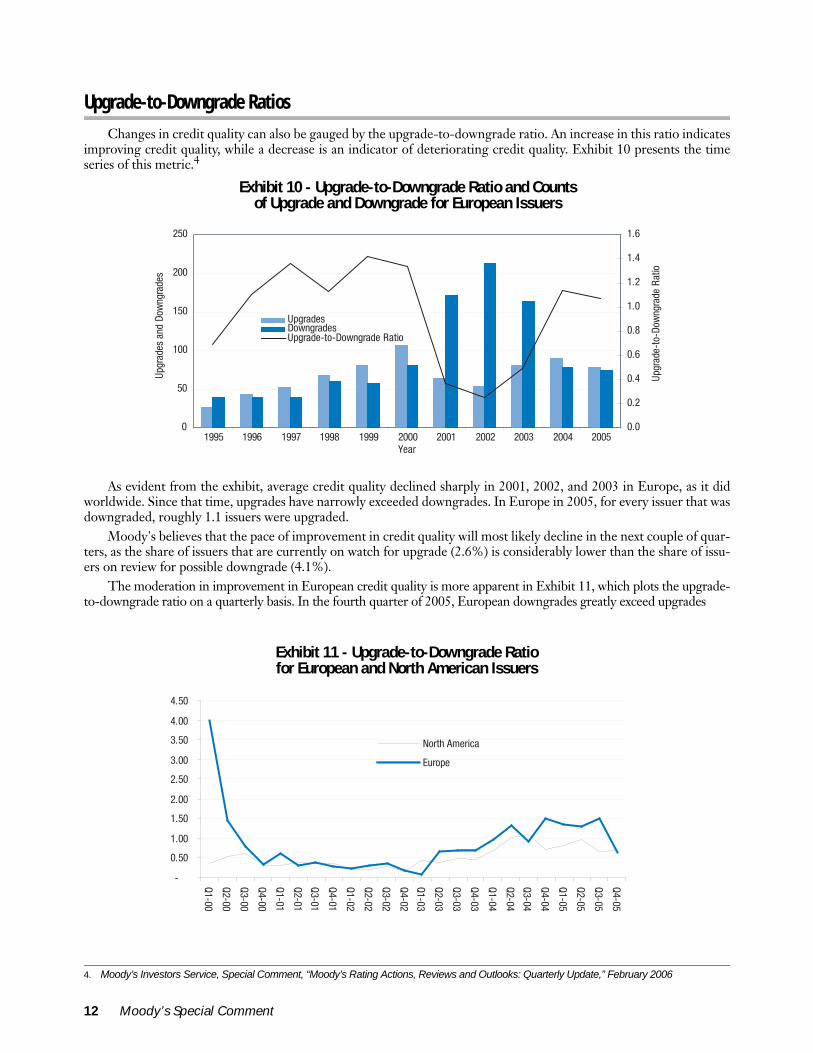
Upgrade-to-Downgrade Ratios
Changes in credit quality can also be gauged by the upgrade-to-downgrade ratio. An increase in this ratio indicatesimproving credit quality, while a decrease is an indicator of deteriorating credit quality. Exhibit 10 presents the timeseries of this metric.4
As evident from the exhibit, average credit quality declined sharply in 2001, 2002, and 2003 in Europe, as it didworldwide. Since that time, upgrades have narrowly exceeded downgrades. In Europe in 2005, for every issuer that wasdowngraded, roughly 1.1 issuers were upgraded.
Moody's believes that the pace of improvement in credit quality will most likely decline in the next couple of quar-ters, as the share of issuers that are currently on watch for upgrade (2.6%) is considerably lower than the share of issu-ers on review for possible downgrade (4.1%).
The moderation in improvement in European credit quality is more apparent in Exhibit 11, which plots the upgrade-to-downgrade ratio on a quarterly basis. In the fourth quarter of 2005, European downgrades greatly exceed upgrades
4. Moody’s Investors Service, Special Comment, “Moody’s Rating Actions, Reviews and Outlooks: Quarterly Update,” February 2006
0
50
100
150
200
250
1995 1996 1997 1998 1999 2000 2001 2002 2003 2004 2005Year
Upgr
ades
and
Dow
ngra
des
0.0
0.2
0.4
0.6
0.8
1.0
1.2
1.4
1.6
Upgr
ade-
to-D
owng
rade
Rat
io
UpgradesDowngradesUpgrade-to-Downgrade Ratio
Exhibit 10 - Upgrade-to-Downgrade Ratio and Counts of Upgrade and Downgrade for European Issuers
-
0.50
1.00
1.50
2.00
2.50
3.00
3.50
4.00
4.50
Q1-00
Q2-00
Q3-00
Q4-00
Q1-01
Q2-01
Q3-01
Q4-01
Q1-02
Q2-02
Q3-02
Q4-02
Q1-03
Q2-03
Q3-03
Q4-03
Q1-04
Q2-04
Q3-04
Q4-04
Q1-05
Q2-05
Q3-05
Q4-05
North America
Europe
Exhibit 11 - Upgrade-to-Downgrade Ratio for European and North American Issuers
12 Moody’s Special Comment
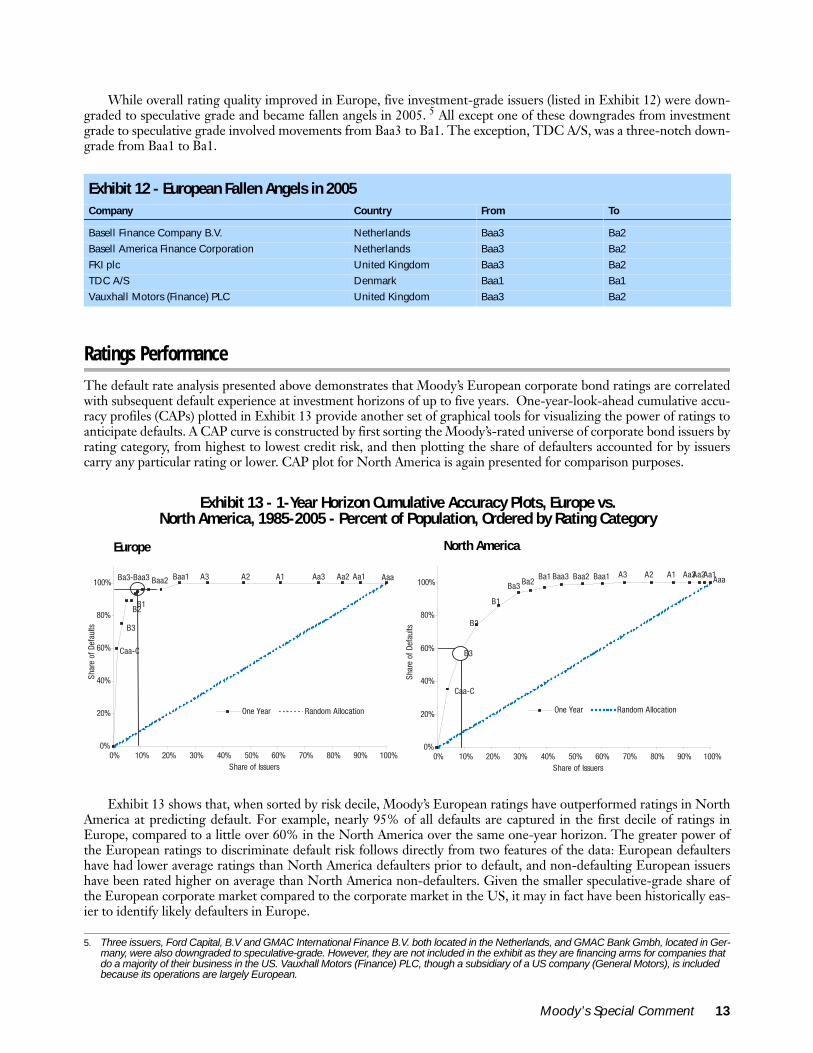
While overall rating quality improved in Europe, five investment-grade issuers (listed in Exhibit 12) were down-graded to speculative grade and became fallen angels in 2005. 5 All except one of these downgrades from investmentgrade to speculative grade involved movements from Baa3 to Ba1. The exception, TDC A/S, was a three-notch down-grade from Baa1 to Ba1.
Ratings Performance
The default rate analysis presented above demonstrates that Moody’s European corporate bond ratings are correlatedwith subsequent default experience at investment horizons of up to five years. One-year-look-ahead cumulative accu-racy profiles (CAPs) plotted in Exhibit 13 provide another set of graphical tools for visualizing the power of ratings toanticipate defaults. A CAP curve is constructed by first sorting the Moody’s-rated universe of corporate bond issuers byrating category, from highest to lowest credit risk, and then plotting the share of defaulters accounted for by issuerscarry any particular rating or lower. CAP plot for North America is again presented for comparison purposes.
Exhibit 13 shows that, when sorted by risk decile, Moody’s European ratings have outperformed ratings in NorthAmerica at predicting default. For example, nearly 95% of all defaults are captured in the first decile of ratings inEurope, compared to a little over 60% in the North America over the same one-year horizon. The greater power ofthe European ratings to discriminate default risk follows directly from two features of the data: European defaultershave had lower average ratings than North America defaulters prior to default, and non-defaulting European issuershave been rated higher on average than North America non-defaulters. Given the smaller speculative-grade share ofthe European corporate market compared to the corporate market in the US, it may in fact have been historically eas-ier to identify likely defaulters in Europe.
5. Three issuers, Ford Capital, B.V and GMAC International Finance B.V. both located in the Netherlands, and GMAC Bank Gmbh, located in Ger-many, were also downgraded to speculative-grade. However, they are not included in the exhibit as they are financing arms for companies that do a majority of their business in the US. Vauxhall Motors (Finance) PLC, though a subsidiary of a US company (General Motors), is included because its operations are largely European.
Exhibit 12 - European Fallen Angels in 2005Company Country From To
Basell Finance Company B.V. Netherlands Baa3 Ba2
Basell America Finance Corporation Netherlands Baa3 Ba2
FKI plc United Kingdom Baa3 Ba2
TDC A/S Denmark Baa1 Ba1
Vauxhall Motors (Finance) PLC United Kingdom Baa3 Ba2
0%
20%
40%
60%
80%
100%
0% 10% 20% 30% 40% 50% 60% 70% 80% 90% 100%Share of Issuers
Shar
e of
Def
aults
One Year Random Allocation
Caa-C
B3
B2B1
Ba3-Baa3 Baa2 Baa1 A3 A2 A1 Aa3 Aa2 Aa1 Aaa
0%
20%
40%
60%
80%
100%
0% 10% 20% 30% 40% 50% 60% 70% 80% 90% 100%Share of Issuers
Shar
e of
Def
aults
One Year Random Allocation
B1
Ba1 Baa2 Aa2Aa1Aaa
Caa-C
B3
B2
Aa3A1A2A3Baa1Baa3Ba2Ba3
Exhibit 13 - 1-Year Horizon Cumulative Accuracy Plots, Europe vs. North America, 1985-2005 - Percent of Population, Ordered by Rating Category
Europe North America
Moody’s Special Comment 13

Recovery Rates For European Defaulted Instruments
Moody’s ratings are statements about the probability of default and the expected loss severity rate (i.e., one minus theexpected recovery rate) in case of default. Since the probability of default is considered to be the same across the vari-ous obligations of an issuer, differences in ratings across an issuer’s capital structure primarily reflect different expecta-tions of recovery rates in the event of default.
Commensurate with our practice in our annual corporate bond default study, in Exhibit 14 we estimate recoveryrates using 30-day post-default bid prices on defaulted bonds, though no trades might have taken place at some ofthese prices. The data set includes both bonds rated by Moody's as well as non-rated issues where available. Since therewere no prices available for the only European defaulted bonds of 2005 (Concordia Bus AB and Concordia Bus Nordic AB),Exhibit 14 presents long-term historical averages and detail for 2003 and 2004 only.6
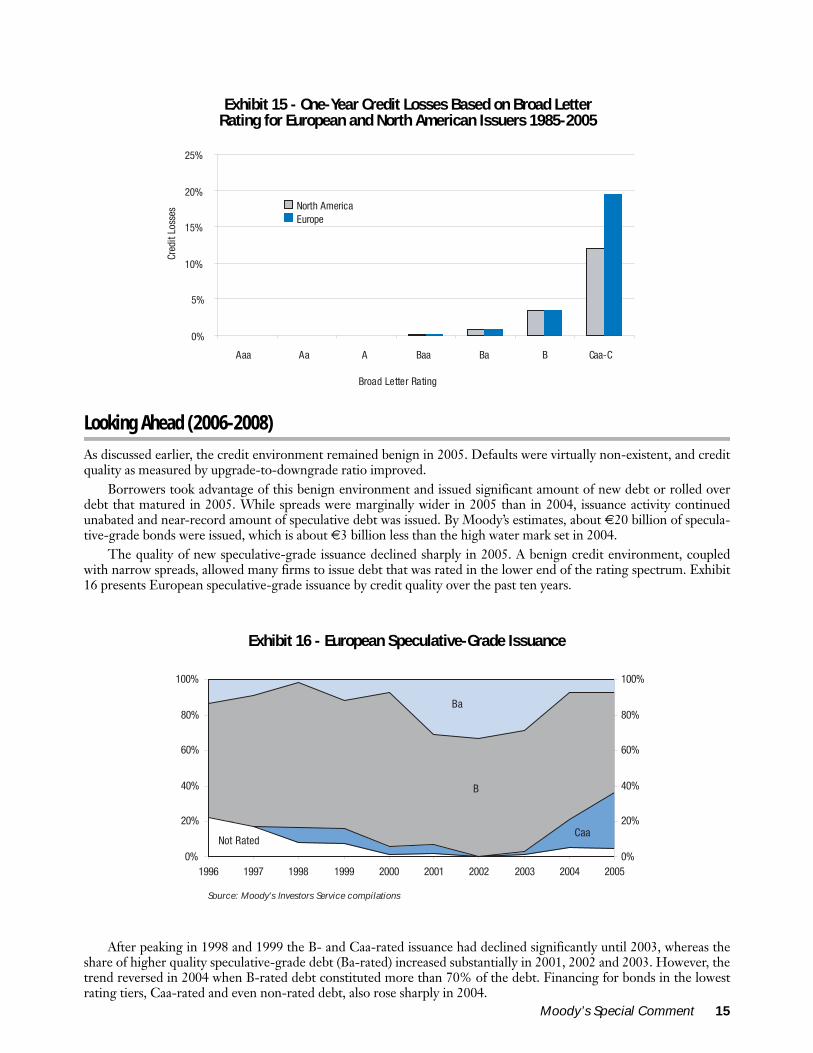
Credit Losses
In previous sections we dealt with two main components of credit loss, the probability of default and the severity ofloss given default (one minus recovery rate). We showed that Moody’s long-term credit ratings accurately rank orderdefault risk and default severity in a given time period. As the ratings decline, not only does the default probability goup, but the average loss severity increases on a portfolio basis. In this section, we bring these two concepts together todiscuss credit losses and how they are affected by default rates and recovery rates. Additionally, we demonstrate thatMoody’s ratings effectively differentiate credit loss rates.
Moody’s rating process is designed to produce a consistent measure of relative credit risk, which in large measureis determined by expected credit losses. Expected credit losses are defined mathematically as follows:
Credit Loss Rate= (Default Frequency)*(1-Recovery Rate)
Credit losses can be defined as the loss incurred in total return by a bond portfolio due to defaults. Exhibit 15 pre-sents average annual credit losses for portfolios based on broad letter rating categories.
While credit losses for Ba- and B-rated issuers are fairly similar across the two regions, loss rates for Caa-C ratedissuers in Europe are much higher than those for North American issuers due to two reasons: the one-year defaultrates for the Caa-C rated issuers are higher and recovery rates for defaulted European bonds are lower.
6. A restructuring plan was proposed by the two defaulting issuers where, depending on the participation of bondholders, all bondholders will receive equity worth only 25% of face value of debt in a new company. Additionally, the bondholders will have to forgo any interest accrued and any other claims related to these bond defaults.
Exhibit 14 - Issuer-Weighted Recovery Rates for European and North American Issuers 1982-2005* 2003 2004
Instrument EuropeNorth
America EuropeNorth
America EuropeNorth
America
Bonds
- Senior Secured Bonds 52.7% 62.6% 40.5% 66.4% N.A. 66.0%
- Senior Unsecured Bonds 26.0% 38.4% 16.6% 40.3% 95.8% 47.2%
- Sr. Subordinated Bonds 40.6% 32.0% N.A. 37.9% N.A. 49.3%
- Subordinated Bonds 35.3% 31.0% 8.8% 31.3% 98.8% N.A.
- Jr. Subordinated Bonds N.A. 23.9% N.A. N.A. N.A. N.A.
All Bonds 32.3% 40.1% 19.9% 39.8% 97.3% 51.4%
*The statistics reported for Europe are only for the 1982-2004 period as no prices for European bonds that defaulted in 2005 were available.
14 Moody’s Special Comment
Moody’s Special Comment 15
Looking Ahead (2006-2008)
As discussed earlier, the credit environment remained benign in 2005. Defaults were virtually non-existent, and creditquality as measured by upgrade-to-downgrade ratio improved.
Borrowers took advantage of this benign environment and issued significant amount of new debt or rolled overdebt that matured in 2005. While spreads were marginally wider in 2005 than in 2004, issuance activity continuedunabated and near-record amount of speculative debt was issued. By Moody’s estimates, about €20 billion of specula-tive-grade bonds were issued, which is about €3 billion less than the high water mark set in 2004.
The quality of new speculative-grade issuance declined sharply in 2005. A benign credit environment, coupledwith narrow spreads, allowed many firms to issue debt that was rated in the lower end of the rating spectrum. Exhibit16 presents European speculative-grade issuance by credit quality over the past ten years.
After peaking in 1998 and 1999 the B- and Caa-rated issuance had declined significantly until 2003, whereas theshare of higher quality speculative-grade debt (Ba-rated) increased substantially in 2001, 2002 and 2003. However, thetrend reversed in 2004 when B-rated debt constituted more than 70% of the debt. Financing for bonds in the lowestrating tiers, Caa-rated and even non-rated debt, also rose sharply in 2004.
0%
5%
10%
15%
20%
25%
Aaa Aa A Baa Ba B Caa-C
Broad Letter Rating
Cred
it Lo
sses
North AmericaEurope
Exhibit 15 - One-Year Credit Losses Based on Broad Letter Rating for European and North American Issuers 1985-2005
Source: Moody's Investors Service compilations
0%
20%
40%
60%
80%
100%
0%
20%
40%
60%
80%
100%
1996 1997 1998 1999 2000 2001 2002 2003 2004 2005
B
Ba
CaaNot Rated
Exhibit 16 - European Speculative-Grade Issuance

While the volume of speculative-grade issuance declined modestly in 2005, the deep speculative-grade portion ofthe issuance jumped dramatically. The Caa-rated share of the new issuance increased to over 30% in 2005, represent-ing a 100% increase in share over Caa issuance in 2004 and a 1500% increase over 2003 issuance. The jump in the Caaissuance came at the expense of single-B rated share of issuance, while the Ba-rated issuance shared remained approxi-mately same.
Moody’s has observed a negative correlation between the quality of issuance and subsequent default rates with alag of approximately 3-years. This lagged relationship (also known as the seasoning effect) has significant predictivepower in Moody’s global default rate forecasting model. For this and other reasons, Moody’s predicts that the globalspeculative-grade default rate will rise from 2005's 1.9% to 3.3% in 2006.7 While Moody’s does not forecast defaultrates regionally, changes in Moody's European default rate are historically positively correlated with changes in theglobal default rate. Hence, Moody's expects that the European default rate will likely follow the global trend, particu-larly as a result of the low quality of issuance observed in 2004 and 2005.
Summary And Conclusions
Commensurate with the benign global credit of the environment last year, issuers in Europe experienced extremelylow default activity. Moody’s recorded only two rated bond defaults and both issuers were part of the same corporatefamily. The total defaulted bond volume was €290 million in 2005. Only one loan default (by an issuer not rated byMoody’s) was recorded. The issuer-weighted speculative-grade bond default rate declined to about 1.1%, which iseven lower than the 1.2% default rate observed in 2004. On a volume-weighted basis, the default rate declined evenfurther, to less than 0.5%. No investment-grade default was recorded in 2005, resulting in the investment-gradedefault rate of 0% in Europe.
In 2005, average credit quality improved in Europe as evident from the ratio of upgrades to downgrades. Five issu-ers were downgraded from investment-grade to speculative-grade.
The improved credit environment allowed many speculative-grade issuers to issue debt in Europe in 2005, asroughly €20 billion of new debt was issued. Over 90% of this debt was rate B or below with Caa rated issuance jump-ing by more than 100% from its issuance level in 2004. Default activity will likely pick up in coming years, given thehigh levels of low speculative-grade issuance in 2004 and 2005, perhaps similar to the pattern of issuance and defaultobserved in 1999-2002.
7. Moody’s Investors Service Special Comment “Default and Recovery Rates of Corporate Bonds Issuers (1920-2005)”, January 2006
16 Moody’s Special Comment
Related Research
Special Comments:Predicting Default Rates: A Forecasting Model for Moody's Issuer-Based Default Rates, August 1999 (47729)Measuring the Performance of Corporate Bond Ratings, April 2003 (77916)Default and Recovery Rates of European Corporate Bond Issuers (1985-2004), March 2005 (91623)The Performance of Moody's Corporate Bond Ratings: December 2005 Quarterly Update, January 2006 (96330)Default and Recovery Rates of Corporate Bonds Issuers (1920-2005), February 2006 (96546)Moody's Rating Actions, Reviews and Outlooks: Quarterly Update - Fourth Quarter 2005, February 2006 (96554)
To access any of these reports, click on the entry above. Note that these references are current as of the date of publication of thisreport and that more recent reports may be available. All research may not be available to all clients.
Moody’s Special Comment 17
Appendix I - Methodology
REPRODUCED FROM MOODY’S SPECIAL COMMENT “DEFAULT AND RECOVERY RATES OF CORPORATE BONDS ISSUERS (1920-2005)” FEBRUARY 2006
Estimated Senior RatingsThe credit ratings used in Moody's annual default studies do not refer to the ratings of any specific debt obligations.Rather, they are notional, issuer-level ratings derived from each issuer's outstanding rated bonds. The resulting ratingsare called estimated senior unsecured ratings or, more concisely, estimated senior ratings. Estimated senior ratings arederived by a statistical algorithm: first, the rating on each company's senior unsecured bonds is used; if an issuer doesnot have any rated senior unsecured bonds, the estimated senior rating is derived by statistically implying such a ratingon the basis of rated subordinated or secured bonds, or senior implied ratings.
Deriving estimated senior ratings is necessary because Moody's credit ratings for corporate bonds are based onexpected credit loss, which is comprised of (1) the expected probability of default, as well as (2) the expected severity(loss of principal and interest) in the event of default. Therefore, in order to calculate historical default rates by ratingcategory which are estimates of the expected default probability component, one must hold severity considerationsconstant. In most cases, estimated senior ratings will yield an assessment of default risk that is relatively unaffected byspecial considerations of collateral or of position within the capital structure.
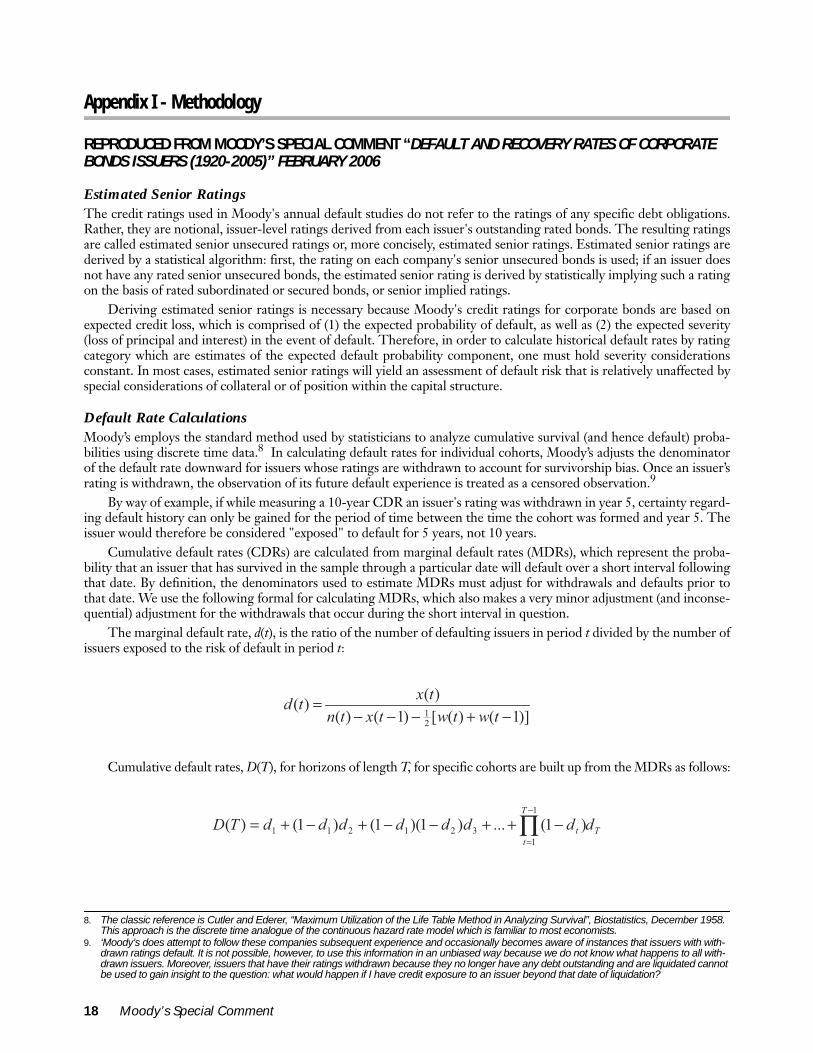
Default Rate CalculationsMoody’s employs the standard method used by statisticians to analyze cumulative survival (and hence default) proba-bilities using discrete time data.8 In calculating default rates for individual cohorts, Moody’s adjusts the denominatorof the default rate downward for issuers whose ratings are withdrawn to account for survivorship bias. Once an issuer’srating is withdrawn, the observation of its future default experience is treated as a censored observation.9
By way of example, if while measuring a 10-year CDR an issuer's rating was withdrawn in year 5, certainty regard-ing default history can only be gained for the period of time between the time the cohort was formed and year 5. Theissuer would therefore be considered "exposed" to default for 5 years, not 10 years.
Cumulative default rates (CDRs) are calculated from marginal default rates (MDRs), which represent the proba-bility that an issuer that has survived in the sample through a particular date will default over a short interval followingthat date. By definition, the denominators used to estimate MDRs must adjust for withdrawals and defaults prior tothat date. We use the following formal for calculating MDRs, which also makes a very minor adjustment (and inconse-quential) adjustment for the withdrawals that occur during the short interval in question.
The marginal default rate, d(t), is the ratio of the number of defaulting issuers in period t divided by the number ofissuers exposed to the risk of default in period t:
Cumulative default rates, D(T), for horizons of length T, for specific cohorts are built up from the MDRs as follows:
8. The classic reference is Cutler and Ederer, “Maximum Utilization of the Life Table Method in Analyzing Survival”, Biostatistics, December 1958. This approach is the discrete time analogue of the continuous hazard rate model which is familiar to most economists.
9. ‘Moody’s does attempt to follow these companies subsequent experience and occasionally becomes aware of instances that issuers with with-drawn ratings default. It is not possible, however, to use this information in an unbiased way because we do not know what happens to all with-drawn issuers. Moreover, issuers that have their ratings withdrawn because they no longer have any debt outstanding and are liquidated cannot be used to gain insight to the question: what would happen if I have credit exposure to an issuer beyond that date of liquidation?
)]1()([)1()()()(
21 −+−−−
=twtwtxtn
txtd
T
T
tt ddddddddTD ∏
−
=
−++−−+−+=1
1321211 )1(...)1)(1()1()(
18 Moody’s Special Comment

For example, the two year cumulative default rate is the sum of the marginal default rate in year one (d1) and themarginal default rate in year two (d2) for issuers that survived past year one, (1 – d1).
When calculating average CDRs over many cohorts, the above formula is also used, but the MDRs are construct-ing by averaging across cohorts. In this manner, when estimating long-term CDRs, information from recent cohortsneed not be ignored entirely. Rather, near-term cohorts are used to obtain more precise estimates of the near-termmarginal default rates used in deriving long-term CDRs.
Our default rate calculation method has two important advantages over the more simplistic so-called static poolmethod used by some researchers:
• If you expect to have a ten-year exposure to an issuer, you want an estimate of the risk of ten years of expo-sure. Our method produces an unbiased estimate of this risk; whereas, the static pool method producesdownwardly biased default rates estimates since it implicitly assumes that issuers that leave the samplewould never have defaulted if they had stayed in the sample.
• If you want to use all the available information in your dataset to estimate long-term CDRs, you need to usethe information from recent cohorts, not just cohorts that have history that span the entire horizon of theCDR calculation. Our method using such information in estimating short-term MDRs that enter into thelong-term CDR calculations; whereas, the static approach simply ignores that data.
Recovery Rate EstimatesMoody's generally measures recovery rates in this report using bid prices on defaulted debt obligations observedroughly 30 days after the date of default, specifically measured as a ratio of prices relative to par. Using a post-defaultprice to measure loss severity parallels common practice in the credit default swaps market. Moreover, recovery ratesmeasured in this way are most relevant for the many cash bond investors who liquidate their holdings shortly afterdefault as required by their portfolio governance rules or their own investment objectives. For investors holdingdefaulted securities until ultimate resolution, prices observed shortly after default are generally accepted as the mar-ket's discounted expected ultimate recovery rates.
The alternative approach – measuring ultimate recoveries realized in bankruptcy resolutions – presents a numberof estimation challenges including estimation of the discount rate to apply to each cash-flow, assumptions about thevalue of certain payments made during the process, and estimates of values of securities used to pay creditor claims,which may include illiquid new securities (e.g., equity and derivative instruments) as well as physical assets.
The table below defines the various ways Moody's sometimes calculates and presents its recovery rate estimates.For the purposes of measuring expected loss rates, we rely on issuer-weighted mean recovery rates.
Term Definition
Issuer-Weighted Mean Recovery Rates Issuer-weighted mean recovery rates are derived by estimating mean recovery rates for each issuer, then averaging them across issuers. They are useful for predicting recovery rates for portfolios that are well diversified across issuers.
Value-Weighted Mean Recovery Rates Value-weighted recovery rates represent the average of recovery rates on all defaulted issuers, weighted by the face value of those issues. These estimates are useful for predicting recovery rates on the market portfolio.
Issuer-Weighted Median Recovery Rates Issuer-weighted median recovery rates are estimated as median of issuer-weighted recovery rates and are used for predicting the most likely recovery rate for a randomly selected issuer.
Issue-Weighted Mean Recovery Rates Issue-weighted recovery rates are estimated using recovery rates for each issue and taking the average of all issues. While this measure is widely reported, it is useful only for predicting the average recovery rate on a portfolio of default bonds diversified across issues but without reference to issuer or issue size.
Moody’s Special Comment 19
20M
oody’s Special Com
ment
Appendix II - Supplemental Default and Transition Rates Tables for European Issuers
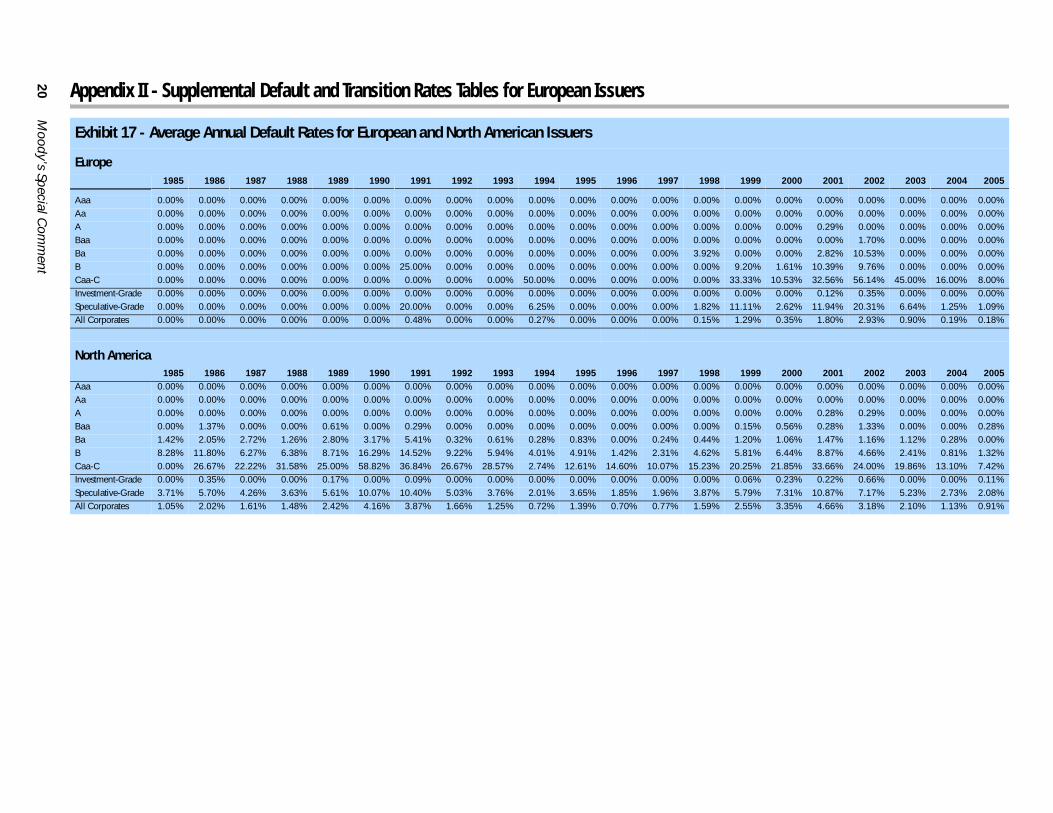
Exhibit 17 - Average Annual Default Rates for European and North American Issuers
Europe1985 1986 1987 1988 1989 1990 1991 1992 1993 1994 1995 1996 1997 1998 1999 2000 2001 2002 2003 2004 2005
Aaa 0.00% 0.00% 0.00% 0.00% 0.00% 0.00% 0.00% 0.00% 0.00% 0.00% 0.00% 0.00% 0.00% 0.00% 0.00% 0.00% 0.00% 0.00% 0.00% 0.00% 0.00%Aa 0.00% 0.00% 0.00% 0.00% 0.00% 0.00% 0.00% 0.00% 0.00% 0.00% 0.00% 0.00% 0.00% 0.00% 0.00% 0.00% 0.00% 0.00% 0.00% 0.00% 0.00%A 0.00% 0.00% 0.00% 0.00% 0.00% 0.00% 0.00% 0.00% 0.00% 0.00% 0.00% 0.00% 0.00% 0.00% 0.00% 0.00% 0.29% 0.00% 0.00% 0.00% 0.00%Baa 0.00% 0.00% 0.00% 0.00% 0.00% 0.00% 0.00% 0.00% 0.00% 0.00% 0.00% 0.00% 0.00% 0.00% 0.00% 0.00% 0.00% 1.70% 0.00% 0.00% 0.00%Ba 0.00% 0.00% 0.00% 0.00% 0.00% 0.00% 0.00% 0.00% 0.00% 0.00% 0.00% 0.00% 0.00% 3.92% 0.00% 0.00% 2.82% 10.53% 0.00% 0.00% 0.00%B 0.00% 0.00% 0.00% 0.00% 0.00% 0.00% 25.00% 0.00% 0.00% 0.00% 0.00% 0.00% 0.00% 0.00% 9.20% 1.61% 10.39% 9.76% 0.00% 0.00% 0.00%Caa-C 0.00% 0.00% 0.00% 0.00% 0.00% 0.00% 0.00% 0.00% 0.00% 50.00% 0.00% 0.00% 0.00% 0.00% 33.33% 10.53% 32.56% 56.14% 45.00% 16.00% 8.00%Investment-Grade 0.00% 0.00% 0.00% 0.00% 0.00% 0.00% 0.00% 0.00% 0.00% 0.00% 0.00% 0.00% 0.00% 0.00% 0.00% 0.00% 0.12% 0.35% 0.00% 0.00% 0.00%Speculative-Grade 0.00% 0.00% 0.00% 0.00% 0.00% 0.00% 20.00% 0.00% 0.00% 6.25% 0.00% 0.00% 0.00% 1.82% 11.11% 2.62% 11.94% 20.31% 6.64% 1.25% 1.09%All Corporates 0.00% 0.00% 0.00% 0.00% 0.00% 0.00% 0.48% 0.00% 0.00% 0.27% 0.00% 0.00% 0.00% 0.15% 1.29% 0.35% 1.80% 2.93% 0.90% 0.19% 0.18%
North America1985 1986 1987 1988 1989 1990 1991 1992 1993 1994 1995 1996 1997 1998 1999 2000 2001 2002 2003 2004 2005
Aaa 0.00% 0.00% 0.00% 0.00% 0.00% 0.00% 0.00% 0.00% 0.00% 0.00% 0.00% 0.00% 0.00% 0.00% 0.00% 0.00% 0.00% 0.00% 0.00% 0.00% 0.00%Aa 0.00% 0.00% 0.00% 0.00% 0.00% 0.00% 0.00% 0.00% 0.00% 0.00% 0.00% 0.00% 0.00% 0.00% 0.00% 0.00% 0.00% 0.00% 0.00% 0.00% 0.00%A 0.00% 0.00% 0.00% 0.00% 0.00% 0.00% 0.00% 0.00% 0.00% 0.00% 0.00% 0.00% 0.00% 0.00% 0.00% 0.00% 0.28% 0.29% 0.00% 0.00% 0.00%Baa 0.00% 1.37% 0.00% 0.00% 0.61% 0.00% 0.29% 0.00% 0.00% 0.00% 0.00% 0.00% 0.00% 0.00% 0.15% 0.56% 0.28% 1.33% 0.00% 0.00% 0.28%Ba 1.42% 2.05% 2.72% 1.26% 2.80% 3.17% 5.41% 0.32% 0.61% 0.28% 0.83% 0.00% 0.24% 0.44% 1.20% 1.06% 1.47% 1.16% 1.12% 0.28% 0.00%B 8.28% 11.80% 6.27% 6.38% 8.71% 16.29% 14.52% 9.22% 5.94% 4.01% 4.91% 1.42% 2.31% 4.62% 5.81% 6.44% 8.87% 4.66% 2.41% 0.81% 1.32%Caa-C 0.00% 26.67% 22.22% 31.58% 25.00% 58.82% 36.84% 26.67% 28.57% 2.74% 12.61% 14.60% 10.07% 15.23% 20.25% 21.85% 33.66% 24.00% 19.86% 13.10% 7.42%Investment-Grade 0.00% 0.35% 0.00% 0.00% 0.17% 0.00% 0.09% 0.00% 0.00% 0.00% 0.00% 0.00% 0.00% 0.00% 0.06% 0.23% 0.22% 0.66% 0.00% 0.00% 0.11%Speculative-Grade 3.71% 5.70% 4.26% 3.63% 5.61% 10.07% 10.40% 5.03% 3.76% 2.01% 3.65% 1.85% 1.96% 3.87% 5.79% 7.31% 10.87% 7.17% 5.23% 2.73% 2.08%All Corporates 1.05% 2.02% 1.61% 1.48% 2.42% 4.16% 3.87% 1.66% 1.25% 0.72% 1.39% 0.70% 0.77% 1.59% 2.55% 3.35% 4.66% 3.18% 2.10% 1.13% 0.91%
Moody’s Special Comment 21
Exhibit 18 - Trailing 12 Months Value Weighted Speculative-Grade Default Rates for Europe
12-Months EndingSpeculative-Grade
Default VolumeSpeculative-Grade
Total VolumeSpeculative-Grade
Default Rate
12/31/05 377 85405 0.44%
11/30/05 1049 85106 1.23%
10/31/05 1049 78483 1.34%
09/30/05 1049 75655 1.39%
08/31/05 1049 74823 1.40%
07/31/05 1049 75350 1.39%
06/30/05 1049 75340 1.39%
05/31/05 1049 81636 1.28%
04/30/05 1049 79628 1.32%
03/31/05 1049 79112 1.33%
02/28/05 1049 78306 1.34%
01/31/05 672 76264 0.88%
12/31/04 1809 78121 2.32%
11/30/04 1138 74813 1.52%
10/31/04 1138 71634 1.59%
09/30/04 1138 71967 1.58%
08/31/04 1138 65698 1.73%
07/31/04 1138 69068 1.65%
06/30/04 1138 67547 1.68%
05/31/04 1710 68311 2.50%
04/30/04 2627 65582 4.01%
03/31/04 2627 63406 4.14%
02/29/04 2777 63775 4.35%
01/31/04 3848 58860 6.54%
12/31/03 3909 57971 6.74%
11/30/03 5798 49179 11.79%
10/31/03 5798 49883 11.62%
09/30/03 5886 43983 13.38%
08/31/03 10430 47445 21.98%
07/31/03 14387 50937 28.24%
06/30/03 15651 45865 34.12%
05/31/03 17259 43355 39.81%
04/30/03 21077 47398 44.47%
03/31/03 29972 56122 53.41%
02/28/03 31060 57795 53.74%
01/31/03 36428 62562 58.23%
12/31/02 23792 49510 48.05%
22 Moody’s Special Comment
Exhibit 18 - Trailing 12 Months Value Weighted Speculative-Grade Default Rates for Europe (Continued)
12-Months EndingSpeculative-Grade
Default VolumeSpeculative-Grade
Total VolumeSpeculative-Grade
Default Rate
11/30/02 23276 48513 47.98%
10/31/02 23754 49996 47.51%
09/30/02 23589 50687 46.54%
08/31/02 15115 40547 37.28%
07/31/02 14658 39714 36.91%
06/30/02 14928 39758 37.55%
05/31/02 15888 40386 39.34%
04/30/02 13771 38851 35.45%
03/31/02 7526 32029 23.50%
02/28/02 8250 33128 24.90%
01/31/02 8015 32705 24.51%
12/31/01 8015 32345 24.78%
11/30/01 8017 29362 27.30%
10/31/01 7539 28098 26.83%
09/30/01 6931 27539 25.17%
08/31/01 7031 27644 25.43%
07/31/01 6969 28228 24.69%
06/30/01 5435 26088 20.83%
05/31/01 4475 23750 18.84%
04/30/01 4475 23502 19.04%
03/31/01 2350 21009 11.19%
02/28/01 713 18066 3.95%
01/31/01 713 16317 4.37%
12/31/00 713 15347 4.65%
11/30/00 265 13582 1.95%
10/31/00 409 12219 3.35%
09/30/00 409 12400 3.30%
08/31/00 509 17666 2.88%
07/31/00 344 18806 1.83%
06/30/00 1037 10443 9.93%
05/31/00 1037 9515 10.90%
04/30/00 1037 8149 12.73%
03/31/00 1037 7270 14.26%
02/29/00 1187 7139 16.63%
01/31/00 1362 7296 18.67%
Moody’s Special C
omm
ent23
Exhibit 19 - Average Annual Transition Rates for European Issuers (1985-2005)
Annual Migration, 1985-2005Aaa Aa1 Aa2 Aa3 A1 A2 A3 Baa1 Baa2 Baa3 Ba1 Ba2 Ba3 B1 B2 B3 Caa-C Default WR
Aaa 89.39% 5.66% 1.76% 0.23% 0.32% 0.00% 0.00% 0.00% 0.00% 0.00% 0.10% 0.00% 0.00% 0.00% 0.00% 0.00% 0.00% 0.00% 2.55%Aa1 1.66% 81.16% 8.41% 5.49% 1.20% 0.33% 0.11% 0.00% 0.00% 0.00% 0.00% 0.00% 0.00% 0.00% 0.00% 0.00% 0.00% 0.00% 1.64%Aa2 0.48% 2.65% 80.29% 10.17% 2.48% 1.28% 0.16% 0.00% 0.00% 0.00% 0.00% 0.00% 0.00% 0.00% 0.00% 0.00% 0.00% 0.00% 2.49%Aa3 0.19% 0.24% 4.12% 78.37% 9.74% 2.79% 0.43% 0.18% 0.07% 0.00% 0.00% 0.00% 0.00% 0.00% 0.00% 0.00% 0.00% 0.00% 3.88%A1 0.00% 0.05% 0.22% 5.43% 76.95% 9.08% 3.12% 0.83% 0.06% 0.00% 0.00% 0.00% 0.00% 0.00% 0.14% 0.00% 0.00% 0.00% 4.12%A2 0.00% 0.06% 0.44% 0.28% 5.65% 78.08% 8.14% 3.04% 0.49% 0.36% 0.18% 0.04% 0.00% 0.12% 0.00% 0.00% 0.00% 0.00% 3.10%A3 0.00% 0.07% 0.09% 0.11% 1.07% 6.05% 77.32% 6.73% 3.80% 0.41% 0.20% 0.05% 0.07% 0.00% 0.00% 0.00% 0.05% 0.00% 3.98%Baa1 0.00% 0.06% 0.42% 0.00% 0.83% 1.59% 8.46% 70.33% 5.06% 3.01% 1.36% 0.33% 0.00% 1.96% 0.00% 0.00% 0.00% 0.20% 6.38%Baa2 0.00% 0.00% 0.00% 0.18% 0.22% 0.25% 3.89% 7.62% 62.63% 10.66% 3.82% 0.32% 0.96% 0.18% 0.35% 0.00% 0.12% 0.00% 8.81%Baa3 0.00% 0.00% 0.00% 0.00% 0.12% 0.00% 0.92% 1.95% 16.50% 60.17% 10.09% 0.87% 0.00% 0.15% 0.66% 0.89% 0.57% 0.00% 7.12%Ba1 0.00% 0.00% 0.00% 0.00% 0.00% 0.37% 0.35% 0.78% 2.63% 5.89% 65.47% 2.53% 10.54% 1.56% 0.00% 0.62% 0.62% 0.39% 8.25%Ba2 0.00% 0.00% 0.00% 0.00% 0.00% 1.11% 0.00% 0.00% 0.44% 8.67% 12.51% 49.91% 5.23% 7.14% 3.33% 0.95% 0.00% 2.22% 8.48%Ba3 0.00% 0.00% 0.00% 0.00% 0.51% 0.42% 0.51% 0.51% 0.00% 0.25% 1.51% 4.44% 72.76% 7.18% 3.92% 3.93% 0.90% 1.39% 1.76%B1 0.00% 0.00% 0.00% 0.00% 0.00% 0.00% 0.00% 0.00% 0.00% 0.22% 0.00% 9.04% 3.02% 54.47% 13.23% 4.74% 9.36% 0.00% 5.92%B2 0.00% 0.00% 0.00% 0.00% 0.00% 0.00% 0.49% 0.00% 0.00% 4.17% 0.23% 0.67% 1.25% 7.99% 45.26% 10.51% 9.33% 11.88% 8.23%B3 0.00% 0.00% 0.00% 0.00% 0.00% 0.51% 0.00% 0.00% 0.00% 1.19% 0.00% 0.79% 0.00% 1.11% 6.79% 61.05% 9.78% 3.49% 15.28%Caa-C 0.00% 0.00% 0.00% 0.00% 0.00% 0.00% 0.00% 0.00% 0.00% 0.00% 0.00% 0.33% 0.00% 9.05% 2.61% 7.43% 47.32% 20.30% 12.96%
© Copyright 2006, Moody’s Investors Service, Inc. and/or its licensors and affiliates including Moody’s Assurance Company, Inc. (together, "MOODY’S"). All rights reserved. ALLINFORMATION CONTAINED HEREIN IS PROTECTED BY COPYRIGHT LAW AND NONE OF SUCH INFORMATION MAY BE COPIED OR OTHERWISE REPRODUCED, REPACKAGED,FURTHER TRANSMITTED, TRANSFERRED, DISSEMINATED, REDISTRIBUTED OR RESOLD, OR STORED FOR SUBSEQUENT USE FOR ANY SUCH PURPOSE, IN WHOLE OR IN PART, INANY FORM OR MANNER OR BY ANY MEANS WHATSOEVER, BY ANY PERSON WITHOUT MOODY’S PRIOR WRITTEN CONSENT. All information contained herein is obtained byMOODY’S from sources believed by it to be accurate and reliable. Because of the possibility of human or mechanical error as well as other factors, however, such information is provided “asis” without warranty of any kind and MOODY’S, in particular, makes no representation or warranty, express or implied, as to the accuracy, timeliness, completeness, merchantability or fitnessfor any particular purpose of any such information. Under no circumstances shall MOODY’S have any liability to any person or entity for (a) any loss or damage in whole or in part caused by,resulting from, or relating to, any error (negligent or otherwise) or other circumstance or contingency within or outside the control of MOODY’S or any of its directors, officers, employees oragents in connection with the procurement, collection, compilation, analysis, interpretation, communication, publication or delivery of any such information, or (b) any direct, indirect,special, consequential, compensatory or incidental damages whatsoever (including without limitation, lost profits), even if MOODY’S is advised in advance of the possibility of suchdamages, resulting from the use of or inability to use, any such information. The credit ratings and financial reporting analysis observations, if any, constituting part of the informationcontained herein are, and must be construed solely as, statements of opinion and not statements of fact or recommendations to purchase, sell or hold any securities. NO WARRANTY,EXPRESS OR IMPLIED, AS TO THE ACCURACY, TIMELINESS, COMPLETENESS, MERCHANTABILITY OR FITNESS FOR ANY PARTICULAR PURPOSE OF ANY SUCH RATING OR OTHEROPINION OR INFORMATION IS GIVEN OR MADE BY MOODY’S IN ANY FORM OR MANNER WHATSOEVER. Each rating or other opinion must be weighed solely as one factor in anyinvestment decision made by or on behalf of any user of the information contained herein, and each such user must accordingly make its own study and evaluation of each security and ofeach issuer and guarantor of, and each provider of credit support for, each security that it may consider purchasing, holding or selling. MOODY’S hereby discloses that most issuers of debt securities (including corporate and municipal bonds, debentures, notes and commercial paper) and preferred stock rated byMOODY’S have, prior to assignment of any rating, agreed to pay to MOODY’S for appraisal and rating services rendered by it fees ranging from $1,500 to $2,400,000. Moody’s Corporation(MCO) and its wholly-owned credit rating agency subsidiary, Moody’s Investors Service (MIS), also maintain policies and procedures to address the independence of MIS’s ratings and ratingprocesses. Information regarding certain affiliations that may exist between directors of MCO and rated entities, and between entities who hold ratings from MIS and have also publiclyreported to the SEC an ownership interest in MCO of more than 5%, is posted annually on Moody’s website at www.moodys.com under the heading “Shareholder Relations — CorporateGovernance — Director and Shareholder Affiliation Policy.” Moody’s Investors Service Pty Limited does not hold an Australian financial services licence under the Corporations Act. This credit rating opinion has been prepared without taking intoaccount any of your objectives, financial situation or needs. You should, before acting on the opinion, consider the appropriateness of the opinion having regard to your own objectives,financial situation and needs.
24 Moody’s Special Comment
To order reprints of this report (100 copies minimum), please call 1.212.553.1658.Report Number: 97015
Author Production Associate
Praveen Varma Tara Cheparev