defect engineering for control of wake-up effect in hfo
TRANSCRIPT

Defect engineering for control of wake-up effect in HfO2-based ferroelectrics
Alireza Kashir*, Seungyeol Oh, Hyunsang Hwang**
Center for Single Atom–based Semiconductor Device and Department of Materials Science and
Engineering, Pohang University of Science and Technology (POSTECH), Pohang, Republic of Korea
E-mail:
Wake-up effect is still an obstacle in the commercialization of hafnia-based ferroelectric thin films.
In this work, we investigate the effect of defects, controlled by ozone dosage, on the field cycling
behavior of the atomic layer deposited Hf0.5Zr0.5O2 (HZO) films. A nearly wake-up free device
was achieved after reduction of carbon contamination and oxygen defects by increasing the ozone
dosage. The sample which was grown at 30 sec ozone pulse duration shows about 98% of the
woken-up Pr at the pristine state while those grown below 5 sec ozone pulse time show a pinched
hysteresis loop, undergone a large wake-up effect. This behavior is attributed to the increase in
oxygen vacancy and carbon concentration in the films deposited at insufficient O3 dosage which
was confirmed by x-ray photoelectron spectroscopy (XPS). X-ray diffraction (XRD) scan shows
that the increase of ozone pulse time yields in the reduction of tetragonal phase; therefore, the
dielectric constant reduces. The I-V measurements reveal the increase of current density as the
ozone dosage decreases which might be due to the generation of oxygen vacancies in the deposited
film. Finally, we have investigated the dynamics of wake-up effect and it appears to be explained
well by Johnson-Mehl-Avrami-Kolmogoroff model which is based on structural phase
transformation.
Keywords: Wake-up effect; HfO2; Defect engineering; Ferroelectrics; Carbon content; X-ray
photoelectron spectroscopy; Johnson-Mehl-Avrami-Kolmogoroff model; Leakage current;
Introduction
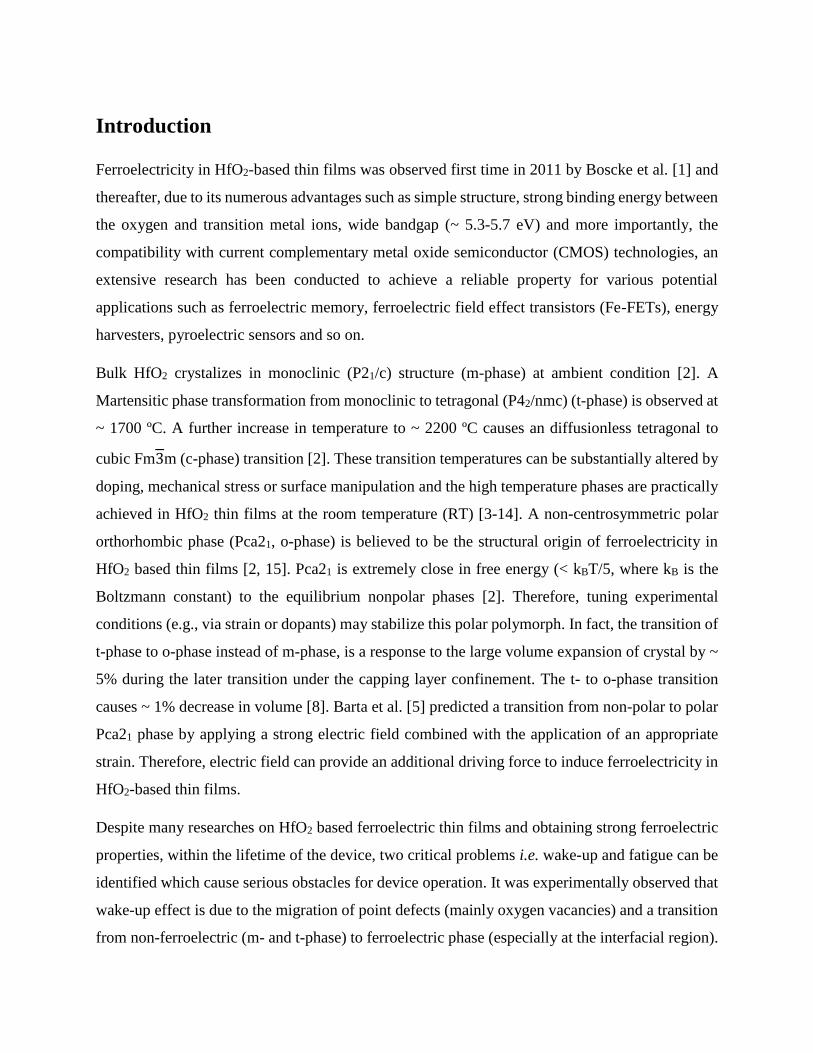
Ferroelectricity in HfO2-based thin films was observed first time in 2011 by Boscke et al. [1] and
thereafter, due to its numerous advantages such as simple structure, strong binding energy between
the oxygen and transition metal ions, wide bandgap (~ 5.3-5.7 eV) and more importantly, the
compatibility with current complementary metal oxide semiconductor (CMOS) technologies, an
extensive research has been conducted to achieve a reliable property for various potential
applications such as ferroelectric memory, ferroelectric field effect transistors (Fe-FETs), energy
harvesters, pyroelectric sensors and so on.
Bulk HfO2 crystalizes in monoclinic (P21/c) structure (m-phase) at ambient condition [2]. A
Martensitic phase transformation from monoclinic to tetragonal (P42/nmc) (t-phase) is observed at
~ 1700 ºC. A further increase in temperature to ~ 2200 ºC causes an diffusionless tetragonal to
cubic Fm3m (c-phase) transition [2]. These transition temperatures can be substantially altered by
doping, mechanical stress or surface manipulation and the high temperature phases are practically
achieved in HfO2 thin films at the room temperature (RT) [3-14]. A non-centrosymmetric polar
orthorhombic phase (Pca21, o-phase) is believed to be the structural origin of ferroelectricity in
HfO2 based thin films [2, 15]. Pca21 is extremely close in free energy (< kBT/5, where kB is the
Boltzmann constant) to the equilibrium nonpolar phases [2]. Therefore, tuning experimental
conditions (e.g., via strain or dopants) may stabilize this polar polymorph. In fact, the transition of
t-phase to o-phase instead of m-phase, is a response to the large volume expansion of crystal by ~
5% during the later transition under the capping layer confinement. The t- to o-phase transition
causes ~ 1% decrease in volume [8]. Barta et al. [5] predicted a transition from non-polar to polar
Pca21 phase by applying a strong electric field combined with the application of an appropriate
strain. Therefore, electric field can provide an additional driving force to induce ferroelectricity in
HfO2-based thin films.
Despite many researches on HfO2 based ferroelectric thin films and obtaining strong ferroelectric
properties, within the lifetime of the device, two critical problems i.e. wake-up and fatigue can be
identified which cause serious obstacles for device operation. It was experimentally observed that
wake-up effect is due to the migration of point defects (mainly oxygen vacancies) and a transition
from non-ferroelectric (m- and t-phase) to ferroelectric phase (especially at the interfacial region).

Both mechanisms can be driven under application of a strong cycling electric field. A locally
distributed inhomogeneous internal field originated from the spatially unevenly distributed
charged defects, such as oxygen vacancies can be an origin of the internal field in the pristine
material [16-21]. During the electric field cycling process, the oxygen vacancies may diffuse into
the bulk regions of the ferroelectric-HfO2-based films, in which case the wake-up process will
occur. Starschich et al. [21] showed that even a DC pulse with an adequate length wakes up the
doped HfO2 capacitors. Thus, the total pulse length may be critical for the wake-up effect, implying
a time-dependent phenomenon. Another mechanism which is responsible for wake-up effect is
the structural transition from non-ferroelectric (m or t) to ferroelectric (o) phase driven by a strong
electric field [22-23]. Therefore, wake-up effect can be substantially reduced by reduction of m-
and t-phase during the thin film processing [24]. Goh et al. [25] evaluated the effect of metal oxide
(as an electrode) on the wake-up behavior of the Hf0.5Zr0.5O2 (HZO) film and they observed an
improve in wake-up behavior which could be due to the suppression of oxygen vacancy at the
interfacial region. Oxide metal electrode can provide additional oxygen to the HZO layer to hinder
the oxygen vacancy generation during the application of electric field. Therefore, reduction of
oxygen vacancies (in both bulk and interfacial regions) and suppression of non-ferroelectric (m
and t) phases during HfO2-based thin film processing, are the promising paths towards wake-up
free devices.
The ozone O3 pulses during the atomic layer deposition (ALD) of HfO2-based thin film have two
major roles [26]. The primary role is to infuse oxygen into Hf and Zr layers to form HfO2 and ZrO2
compounds. Thus, the pulse length is a crucial parameter to provide enough oxygen for
stoichiometric phase formation and avoiding the generation of oxygen vacancies. But it should be
noticed that the C−O bonds removal out of the sample by applying O3 pulses can remarkably
change the subsequent annealing behavior of the as-grown film [26]. Carbon is an inevitable part
of the ALD grown films as the precursors are usually organic compounds. Cho et al. [26] observed
the appearance of tetragonal phase as the ozone dosage decreases which was attributed to the effect
of carbonate bonds on the annealing behavior of HfO2 films. The C-O bonds remain between pure
HfO2 domains due to the incomplete chemical reaction of the precursors which subsequently
prevent the agglomeration of the nanoscale domains which result in the stabilization of tetragonal

phase [26-28]. Therefore, ozone dosage can drive the wake-up effect directly by oxygen vacancy
generation and indirectly by carbon-induce t-phase formation.
As a proper capping electrode, tungsten (W) shows the lowest thermal expansion coefficient α
among the widely used metal electrodes, inducing an in-plane tensile strain to HZO film during
the rapid thermal annealing (RTA), which facilitates the formation of o-phase [29]. In-plane tensile
strain stresses on c-axis of t-phase in favor of the phase change from t- to o-phase. Moreover, WO2
and WO3 formation enthalpy is almost two times higher than that of HfO2 and ZrO2, preventing
the formation of interfacial oxide during atomic layer deposition of HZO which in turn facilitates
the deposition of stoichiometric Hf0.5Zr0.5O2 by an appropriate tuning of ozone dosage.
Considering these facts, we investigate the effect of O3 pulse time (ozone dosage) during atomic
layer deposition of the ~ 10 nm HZO films, on the wake-up behavior of W/HZO/W capacitors.
The both major roles of oxygen will be considered. We will precisely study the effect of remaining
carbon and O3 pulse length on the ferroelectric behavior of the HZO thin films. Finally, the kinetics
of wake-up effect is explained by Johnson-Mehl-Avrami-Kolmogoroff model.
Experiments
The ~ 10 nm HZO films were deposited on 50-nm thick W bottom electrode sputtered on SiO2/Si
substrate using ALD technique. Different ozone pulse durations 𝑡𝑂3= 2 to 30 sec were applied for
each deposition. The substrate temperature was kept at 250 ºC during the deposition of all films in
this work. The Hf[N-(C2H5)CH3]4 and Zr[N-(C2H5)CH3]4 precursors were used as the Hf and Zr
metals sources, respectively. The growth rate of HfO2 and ZrO2 were almost same (~ 1 Å/cycle).
After deposition, all films were capped with 50-nm W electrode using rf-sputtering technique to
fabricate MIM capacitors. Finally, W/HZO/W capacitors with different electrode area were passed
through an annealing process in N2 ambient at 500 ºC for 30 sec.
The crystalline structures of films were investigated using an x-ray diffractometer (XRD) within a
grazing incidence geometry. For elemental analysis we used x-ray photoelectron spectroscopy
(XPS) on as-grown samples (not capped). The ferroelectric properties of MIM capacitors were
measured by LCII ferroelectric precision tester (Radiant Technologies) and the dielectric

permittivity and I–V characteristics were evaluated using Keysight B1500A semiconductor device
parameter analyzer. All measurements were conducted at room temperature.
Results and Discussion
Figure 1 shows the pristine P-E hysteresis curves for the samples grown at different 𝑡𝑂3. Increasing
𝑡𝑂3 results in a more open (depinched) loop. Therefore, the pristine 2Pr value increases as the
samples are grown at longer ozone pulse length. The P-E curves at the wake-up state for two
samples deposited at 𝑡𝑂3=5 and 30 sec are shown in figure 2. It revealed that the sample which was
grown at lower 𝑡𝑂3undergoes a large wake-up effect, while the sample grown at higher 𝑡𝑂3
is
almost wake-up free and its pristine 2Pr value is about 97% of the wake-up state (Table 1). This is
only 63% in case of the sample grown at 𝑡𝑂3=5 sec. Lee et al. [19] using Monte Carlo simulation
demonstrated that the ferroelectric hysteresis of a doped HfO2 thin film with a lower defect ratio
exhibits an increase in both Pr and the coercive field Ec. Defects can pin the ferroelectric domains
and strongly affect the ferroelectric properties of thin film. As we discussed, two major sources
which lead to the wake-up effect were recognized; the charged oxygen vacancies and the structural
phase transition from non-ferroelectric to ferroelectric phase. On the other hand, the oxygen
vacancy movement during the field cycling causes a local phase transition in different region, as
the stability of different polymorphs in HfO2-based thin films depends on the amount of oxygen
vacancy [30-31]. In a recent work, based on the DFT calculation, it was predicted that even m-
phase which is originally non-ferroelectric phase shows ferroelectricity by introduction of oxygen
vacancy [32]. Therefore, the oxygen vacancy and its movement during electric field cycling has
one of the major contributions in wake-up effect (either by pinning of ferroelectric domain walls
or by stabilizing o-phase). The decrease of O3 dosage during the deposition of HZO might induce
point defects, dominantly oxygen vacancies, and subsequently trigger the mechanisms of wake-up
during the electric field cycling.
Figure 3 revealed the effect of O3 dosage on the leakage current of HZO samples. At 1 MV/cm,
the sample which was grown at 5 sec O3 pulse shows the electric current density of ~ 2.5 times
higher than that of grown at 30 sec. This behavior implies the role of ozone dosage in the reduction
of defects and subsequently improving the insulating characteristics of HZO films.

It should be noted that the removing of C−O bonds out of the sample by applying O3 pulse can
remarkably influences the subsequent annealing behavior of the as-grown film [26-28]. This
behavior becomes much more important and crucial when the ferroelectricity of HfO2-based thin
film is the major concern. Figure 4 shows the XPS spectra of the samples grown at two different
O3 pulse duration. The Zr/Hf ratio was almost 1 for both sample, indicating the (Zr0.5Hf0.5)O2-x
composition. In case of the sample grown at 𝑡𝑂3= 5 sec, we detected smaller fraction of oxygen (~
1%) compared to the sample which was grown at 𝑡𝑂3=30 sec (Figure 4c). The sample with more
oxygen deficiency shows higher amount of carbon (Figure 4d). The XPS measurement revealed
around 2.1% carbon in the sample which was grown at 𝑡𝑂3= 5 sec, while the sample grown at
higher O3 dosage were almost free of carbon. These measurements revealed the role of O3 pulse
time in the generation of oxygen defects and carbon contaminants in the atomic layer deposited
films.
It was shown that the less O3 pulse time causes higher amount of carbon in the as-grown sample
because of the insufficient precursor oxidation, which subsequently influences the grain size of
crystallized film. The smaller grain size would result in the t-phase formation due to its lower grain
boundary energy compared to m- and even o-phases (Figure 5) [26-28]. The formation of t-phase
and its transformation to o-phase under strong electric field is another cause for wake-up effect.
Therefore, applying longer O3 pulses can decrease the amount of oxygen defects and carbon
content in the as-grown film which consequently hinder the mechanisms of wake-up effect.
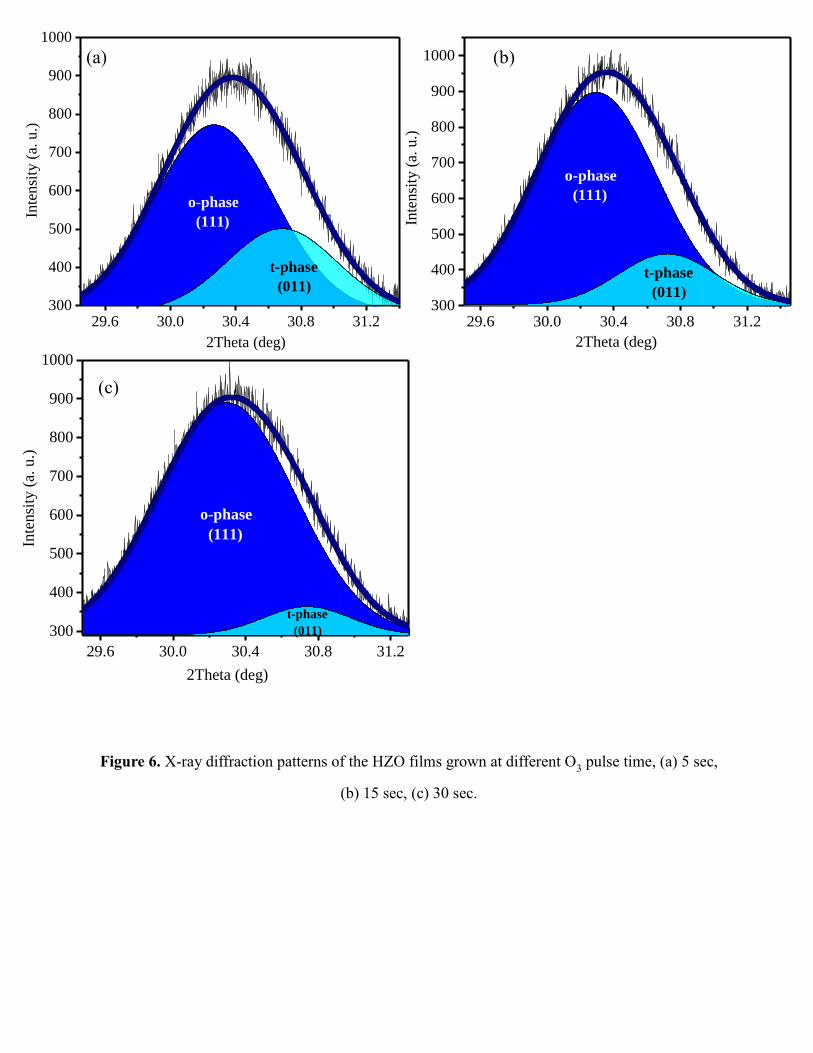
XRD scans clearly demonstrate the decrease of t-phase and increase of o-phase with increasing
the ozone dosage during the growth (Figure 6). For clear visualization, we showed a limited range
of 2θ in which the evolution of HZO o- and t-phase Bragg peaks versus ozone dosage are clearly
observable. Increasing the ozone dosage from 5 to 30 seconds results in a decrease in t-phase from
29% to 7% which considerably affect the ferroelectric properties (Table 2). On the other hand, the
existence of t-phase introduces more grain boundaries which is accompanied by more defective
structure. These defects can cause the wake-up effect by pinning the ferroelectric domain walls
[24]. The formation of m-phase was totally suppressed during RTA under the capping electrode
confinement (not sown here). All films contained t- and o-phases, possibly arising from the in-
plane tensile strain applied to the HZO film during thermal annealing. Mechanical stress induced

by the W-capping layer during the RTA is believed to be the driving force for the t- to o-phase
transition [29]. In fact, the in-plane tensile strain, which is developed during the annealing process,
substantially suppresses the formation of the m-phase by preventing the necessary twin
deformations required to form the m-phase. Therefore, the TEC of the capping material
substantially alters the structural properties of HZO films.
The Capacitance versus voltage measurement shows that the sample which was grown at lower O3
pulse time has higher dielectric constant εr which can be partially due to the space-charge
polarization induced by defects (Figure 7a). The initial rise in permittivity with DC field is
probably due to increased movement of the domain walls which become free from defects which
lock them at zero-DC field [33]. From these points of view, the sample grown at lower ozone
dosage contains more defects. Increasing the 𝑡𝑂3 during the growth results in HZO films with
lower dielectric constant εr. This is in agreement with the XRD result. It was already observed that
the carbon stabilizes the tetragonal phase in HfO2 base thin film and subsequently increases εr [30-
32]. The t-phase has higher εr than m- and even o-phase in HZO films. This behavior combined
with the P-E measurement (Figure 7b) suggests two possible interpretations. The samples which
were grown at higher oxygen dosage contain less oxygen vacancy, therefore, less density of built-
in bias electric field and finally undergo less wake–up effect. The another possible explanation is
the carbon induced t-phase formation which can consequently cause the phase transition to o-phase
during the field cycling. On the other hand, as it was mentioned previously, the oxygen vacancy
movement provides a driving force for phase transition during the field cycling from t- to o-phase.
Finally, the effect of oxygen vacancy induced ferroelectricity in m-phase should be considered.
Therefore, O3 pulse duration has a critical contribution to the deposition of wake-up free devices
through impeding different possible mechanisms of wake-up effect.
To investigate the nature of wake-up effect, we studied the dynamics of wake-up behavior in
different samples. Figure 8a shows the evolution of Pr of a sample, which was grown at the lowest
O3 pulse duration (2 sec), under electric field cycles. The number of cycles to reach a given Pr
strongly depends on the applied frequency. As the frequency of the applied electric field increases,
the number of cycles for achieving a given Pr increases. By plotting the Pr over the duration of the

applied field i.e. 𝑐𝑦𝑐𝑙𝑒
𝑓𝑟𝑒𝑞𝑢𝑒𝑛𝑐𝑦, the curves at different frequencies show the same dependence. Thus,
not the amount of cycles but the duration of the applied electrical field is essential for the wake-
up. That means that 100 cycles at 100 Hz show the same Pr as 500 cycles at 500 Hz. Figure 8b
revealed that the evolution of Pr versus 𝑐𝑦𝑐𝑙𝑒
𝑓𝑟𝑒𝑞𝑢𝑒𝑛𝑐𝑦 is totally independent of the applied frequency
and it is a time-dependent phenomenon [21]. It can be the direct electric field induced structural
change, electric filed driven oxygen vacancy movement (redistribution) or oxygen vacancy
induced phase transition. All these three mechanisms are driven by cycling field and the progress
of these processes are time-dependent. The increase in coercive field Ec for different samples also
shows the same behavior. Here, we plot the Ec versus tapp for the sample which was grown at 30
sec O3 pulse time as an example (figure 8c). Considering the structural change during the electric
field cycling (either through oxygen redistribution or direct electric field driven structural
transformation) as the major reason for wake-up effect, we investigate the kinetics of the phase
transition explained by Johnson-Mehl-Avrami-Kolmogoroff (JMAK) model [34] (equation 1)
𝑓 = 1 − exp(−𝑘𝑡𝑛) equation 1
Where f is the fraction of transferred volume, t is time, k is a constant and n is an integer or half-
integer which is called Avrami exponent and describes the rate and geometry of nucleation and
growth. Therefore
𝑙𝑛(−𝑙𝑛(1 − 𝑓)) = 𝑙𝑛(𝑘) + 𝑛𝑙𝑛(𝑡)
We correlated the increase in Pr to f using the equation 2,
𝑓 =𝑃𝑟−𝑃𝑃𝑟𝑖
𝑃𝑊−𝑃𝑃𝑟𝑖 equation 2
Where Ppri and PW are the values of Pr at pristine and wake-up states, respectively. Therefore,
𝑓 = {0, 𝑎𝑡 𝑝𝑟𝑖𝑠𝑡𝑖𝑛𝑒 𝑠𝑡𝑎𝑡𝑒1, 𝑎𝑡 𝑤𝑎𝑘𝑒 − 𝑢𝑝 𝑠𝑡𝑎𝑡𝑒
Figure 9 shows a linear plot for different samples during the wake-up transition with almost same
slope (~ 0.5). This behavior indicates that the phase transition during the field cycling might have
the dominant role in wake-up effect. The phase transition during wake-up process can originate
from different mechanisms. A strong electric field induces structural change in hafnia-based thin

films. Indeed, the transition from m- and t- to o-phase were observed by different research groups
[22-23], which increase the Pr in HfO2-based ferroelectrics. Moreover, the oxygen vacancy
diffusion into different region changes the relative stability of polymorphs and consequently
causes phase transition. It can stabilize the ferroelectric phase and consequently increase the
remnant polarization and wake up the ferroelectric HZO.
Conclusion
The ferroelectric behavior of ~ 10 nm ALD grown HZO thin films at different ozone pulse duration
was investigated. To induce an in-plane tensile stress and achieve m-phase-free thin film, we used
W electrode which has a relatively low thermal expansion coefficient. It was observed that the
samples which were deposited at 𝑡𝑂3< 5 sec undergo a large wake-up effect. The XRD pattern of
all samples revealed the total suppression of m-phase formation during the RTA. The fraction of
t-phase decreased as the 𝑡𝑂3 increased which subsequently reduced the εr of HZO films. XPS study
revealed ~ 2.1% carbon in the sample grown at 5 sec O3 pulse time while the sample which was
grown at 30 sec O3 pulse time was almost free of carbon. The carbon can stabilize tetragonal phase.
The leakage current was reduced by increasing of 𝑡𝑂3which could be due to the decrease of defect
in HZO film. Therefore, both carbon contaminants and oxygen vacancies caused a large wake-up
effect in the samples grown at insufficient ozone environment. Tuning the oxygen pulse length
during the deposition of HZO, an almost wake-up free ferroelectric thin film was achieved. Finally,
we investigated the kinetics of wake-up effect based on the phase transition explained by JMAK
model. All samples followed the JMAK model with almost same slope. This behavior suggests the
phase transition as a major cause of wake-up effect.
Acknowledgments
This work was supported by the National Research Foundation of Korea funded by the Korea
government (MSIT), Grant No. NRF-2018R1A3B1052693.
References
[1] T. S. Böscke, J. Müller, D. Bräuhaus, U. Schröder, U. Böttger, Appl. Phys. Lett. 2011, 99, 102903.
[2] T. D. Huan, V. Sharma, G. A. Rossetti, R. Ramprasad, Phys. Rev. B - Condens. Matter Mater. Phys.
2014, 90, 064111.

[3] M. H. Park, Y. H. Lee, H. J. Kim, Y. J. Kim, T. Moon, K. Do Kim, J. Müller, A. Kersch, U. Schroeder,
T. Mikolajick, C. S. Hwang, Adv. Mater. 2015, 27, 1811.
[4] A. Parija, G. R. Waetzig, J. L. Andrews, S. Banerjee, J. Phys. Chem. C 2018, 122, 25709.
[5] R. Batra, T. D. Huan, J. L. Jones, G. Rossetti, R. Ramprasad, J. Phys. Chem. C 2017, 121, 4139.
[6] M. H. Park, Y. H. Lee, T. Mikolajick, U. Schroeder, C. S. Hwang, Adv. Electron. Mater. 2019, 5,
1800522.
[7] M. Shandalov, P. C. McIntyre, J. Appl. Phys. 2009, 106, 084322.
[8] M. Dogan, N. Gong, T. P. Ma, S. Ismail-Beigi, Phys. Chem. Chem. Phys. 2019, 21, 12150.
[9] R. Batra, H. D. Tran, R. Ramprasad, Appl. Phys. Lett. 2016, 108, 172902.
[10] M. H. Park, Y. H. Lee, H. J. Kim, Y. J. Kim, T. Moon, K. Do Kim, S. D. Hyun, T. Mikolajick, U.
Schroeder, C. S. Hwang, Nanoscale 2018, 10, 716.
[11] R. Materlik, C. Kunneth, A. Kersch, J. Appl. Phys. 2015, 117, 134109.
[12] A. Navrotsky, J. Mater. Chem. 2005, 15, 1883.
[13] P. Fan, Y. K. Zhang, Q. Yang, J. Jiang, L. M. Jiang, M. Liao, Y. C. Zhou, J. Phys. Chem. C 2019, 123,
21743.
[14] G. Sharma, S. V. Ushakov, A. Navrotsky, J. Am. Ceram. Soc. 2018, 101, 31.
[15] X. Sang, E. D. Grimley, T. Schenk, U. Schroeder, J. M. Lebeau, Appl. Phys. Lett. 2015, 106, 162905.
[16] T. Schenk, U. Schroeder, M. Pešić, M. Popovici, Y. V. Pershin, T. Mikolajick, ACS Appl. Mater.
Interfaces 2014, 6, 19744.
[17] T. Schenk, M. Hoffmann, J. Ocker, M. Pešić, T. Mikolajick, U. Schroeder, ACS Appl. Mater.
Interfaces 2015, 7, 20224.
[18] M. Pešić, F. P. G. Fengler, L. Larcher, A. Padovani, T. Schenk, E. D. Grimley, X. Sang, J. M. LeBeau,
S. Slesazeck, U. Schroeder, T. Mikolajick, Adv. Funct. Mater. 2016, 26, 4601.
[19] T. Y. Lee, K. Lee, H. H. Lim, M. S. Song, S. M. Yang, H. K. Yoo, D. I. Suh, Z. Zhu, A. Yoon, M. R.
Macdonald, X. Lei, H. Y. Jeong, D. Lee, K. Park, J. Park, S. C. Chae, ACS Appl. Mater. Interfaces 2019,
11, 3142.

[20] M. Pešic, S. Slesazeck, T. Schenk, U. Schroeder, T. Mikolajick, Phys. Status Solidi Appl. Mater. Sci.
2016, 213, 270.
[21] S. Starschich, S. Menzel, U. Böttger, Appl. Phys. Lett. 2016, 108, 032903.
[22] E. D. Grimley, T. Schenk, X. Sang, M. Pešić, U. Schroeder, T. Mikolajick, J. M. LeBeau, Adv.
Electron. Mater. 2016, 2, 1600173.
[23] A. Chouprik, S. Zakharchenko, M. Spiridonov, S. Zarubin, A. Chernikova, R. Kirtaev, P. Buragohain,
A. Gruverman, A. Zenkevich, D. Negrov, ACS Appl. Mater. Interfaces 2018, 10, 8818.
[24] J. Bouaziz, P. R. Romeo, N. Baboux, and B. Vilquin, ACS Appl. Electron. Mater. 2019, 1, 1740.
[25] Y. Goh, S. H. Cho, S. H. K. Park, S. Jeon, Nanoscale 2020, 12, 9024.
[26] D. Y. Cho, H. S. Jung, I. H. Yu, J. H. Yoon, H. K. Kim, S. Y. Lee, S. H. Jeon, S. Han, J. H. Kim, T. J.
Park, B. G. Park, C. S. Hwang, Chem. Mater. 2012, 24, 3534.
[27] B. S. Kim, S. D. Hyun, T. Moon, K. Do Kim, Y. H. Lee, H. W. Park, Y. Bin Lee, J. Roh, B. Y. Kim,
H. H. Kim, M. H. Park, C. S. Hwang, Nanoscale Res. Lett. 2020, 15, 72.
[28] H.-S. Jung, S. H. Jeon, H. K. Kim, I.-H. Yu, S. Y. Lee, J. Lee, Y. J. Chung, D.-Y. Cho, N.-I. Lee, T.
J. Park, J.-H. Choi, S. Han, C. S. Hwang, ECS J. Solid State Sci. Technol. 2012, 1, N33.
[29] R. Cao, Y. Wang, S. Zhao, Y. Yang, X. Zhao, W. Wang, X. Zhang, H. Lv, Q. Liu, M. Liu, IEEE
Electron Device Lett. 2018, 39, 8, 1207.
[30] M. Hoffmann, U. Schroeder, T. Schenk, T. Shimizu, H. Funakubo, O. Sakata, D. Pohl, M. Drescher,
C. Adelmann, R. Materlik, A. Kersch, T. Mikolajick, J. Appl. Phys. 2015, 118, 072006.
[31] A. Pal, V. K. Narasimhan, S. Weeks, K. Littau, D. Pramanik, T. Chiang, Appl. Phys. Lett. 2017, 110,
022903.
[32] C. Liu, F. Liu, Q. Luo, P. Huang, X. X. Xu, H. B. Lv, Y. D. Zhao, X. Y. Liu, J. F. Kang, Tech. Dig. -
Int. Electron Devices Meet. IEDM 2018, 16.4.1.
[33] D. Damjanovic, Rep. Prog. Phys. 1998, 61, 1267.
[34] M. C. Weinberg, D. P. BirnieIII, V. A. Shneidman, Journal of Non-Crystalline Solids, 1997, 219, 89.

Figure 1. Polarization-Electric field curves of ~ 10 nm HZO films grown at different ozone pulse
duration.
-3 -2 -1 0 1 2 3
-30
-20
-10
0
10
20
30
Electric Field (MV/cm)
P (
C/c
m2)
2 sec
5 sec
15 sec
30 sec

Figure 2. The pristine (P) and woken-up (W) Polarization-Electric field curves of ~ 10 nm HZO
films grown at O3 pulses.
-3 -2 -1 0 1 2 3
-30
-20
-10
0
10
20
30
P (
C/c
m2)
Electric Field (MV/cm)
5 sec (P)
5 sec (W)
30 sec (P)
30 sec (W)

Figure 3. The current density vs electric field of HZO films grown at different O3 pulse time.
0.0 0.2 0.4 0.6 0.8 1.00.0
0.1
0.2
0.3
0.4
0.5
0.6
Curr
ent
den
sity
(
A/c
m2)
Electric Field (MV/cm)
5 sec
15 sec
30 sec

Figure 4. (a) Zr 3d, (b) Hf 4f, (c) O 1s, and (d) C 1s XPS spectra of the as-grown HZO thin films
deposited at different O3 pulse time.
190 188 186 184 182 180 178
Zr-O
Zr3d5/2
Zr 3d
Inte
nsi
ty (
a. u
.)
Binding Energy (eV)
Zr3d3/2
5 sec
30 sec
22 20 18 16 14
Hf4f7/2
Inte
nsi
ty (
a. u
.)
Binding Energy (eV)
5 sec
30 sec
Hf 4f
Hf-OHf4f5/2
536 534 532 530 528
Inte
nsi
ty (
a. u
.)
Binding Energy (eV)
O 1s
O-C or O-O
O-Zr or O-Hf 5 sec
30 sec
287 286 285 284 283
Inte
nsi
ty (
a. u
.)
Binding Energy (eV)
5 sec
30 secC 1sC-C or C-H
(a) (b)
(c)
(d)

Figure 5. Schematic of the effect of carbon contamination (●) on the stabilization of the t-phase
in a HZO thin film. Carbon removal by a sufficient oxygen supply results in the optimum growth
of grain to form the ferroelectric o-phase during the cooling step of the annealing process.
T T T
T TT
T
T
T TTT
T T
T
T
T
T
T T TTT
O O O O O
O O O O
O O O O O
O O O O
O O O O O
Carbon Removal
C-O
C-O
C-O
C-O C-O
29.6 30.0 30.4 30.8 31.2300
400
500
600
700
800
900
1000
o-phase
(111)
t-phase
(011)
Inte
nsi
ty (
a. u
.)
2Theta (deg)
29.6 30.0 30.4 30.8 31.2300
400
500
600
700
800
900
1000
Inte
nsi
ty (
a. u
.)
2Theta (deg)
o-phase
(111)
t-phase
(011)
29.6 30.0 30.4 30.8 31.2
300
400
500
600
700
800
900
1000
Inte
nsi
ty (
a. u
.)
2Theta (deg)
o-phase
(111)
t-phase
(011)
(a) (b)
(c)
Figure 6. X-ray diffraction patterns of the HZO films grown at different O3 pulse time, (a) 5 sec,
(b) 15 sec, (c) 30 sec.

5 10 15 20 25 3032
34
36
38
40
42
44
46
2Pr
r
2P
r (
C/c
m2)
O3 pulse duration (sec)
r
25
26
27
28
29
30
31
32
33
-2 -1 0 1 220
30
40
50
60
70
5 sec
15 sec
30 sec
r
Electric Field (MV/cm)
(a) (b)
Figure 7. (a) The pristine dielectric constant vs electric field of the HZO thin film grown at
different O3 pulse time measured at 10 kHz. (b) The changes in pristine remnant polarization 2P
r
(blue) (calculated from Figure 1) and dielectric constant εr (red) of HZO films versus O
3 pulse
time.

Figure 8. Evolution of the ferroelectric remnant polarization Pr during bipolar cycling as a
function of (a) cycles, (b) cycle/frequency. (c) Evolution of the ferroelectric coercive field during
bipolar cycling as a function of cycle/frequency measured on HZO ferroelectric capacitor.
0 1k 2k 3k 4k 5k 6k34
36
38
40
42
44
46
2
Pr (
C/c
m2)
Cycles
50 Hz
100 Hz
500 Hz
1000 Hz
0 5 10 15 20 25 30 35 4034
36
38
40
42
44
46
48
2P
r (
C/c
m2)
Cycle/Frequency (tapp
) (sec)
50 Hz
100 Hz
500 Hz
1000 Hz
0 10 20 30 40 50 60 70 80
0.95
1.00
1.05
1.10
1.15
1.20
Cycle/Frequency (tapp
) (sec)
Co
erci
eve
Fie
ld (
MV
/cm
)
50 Hz
100 Hz
500 Hz
1000 Hz
(a) (b)
(c)

Figure 9. the linear plot of the fraction of transformed phase versus electric field applied time.
1.0 1.5 2.0 2.5 3.0 3.5 4.0 4.5-2.0
-1.5
-1.0
-0.5
0.0
0.5
1.0
1.5
2.0
ln (t)
ln (
-ln (
1-f
) )
5 sec
10 sec
15 sec
30 sec

Table 1. The Pristine to woken-up 2Pr ratio of the HZO films grown at different ozone dosage.
Ozone pulse duration 2 sec 5 sec 15 sec 30 sec
Pristine to woken-up 2Pr 63% 63% 90% 97%
Table 2. The fraction of tetragonal phase in HZO film deposited at different ozone dosage.
Ozone pulse duration 5 sec 15 sec 30 sec
Tetragonal phase fraction 29% 16% 7%