defect reduction for the defibrillator - st. cloud state
TRANSCRIPT

St. Cloud State UniversitytheRepository at St. Cloud StateCulminating Projects in Mechanical andManufacturing Engineering
Department of Mechanical and ManufacturingEngineering
8-2016
Defect Reduction for the DefibrillatorSaqib Burhan Matto
Follow this and additional works at: https://repository.stcloudstate.edu/mme_etds
This Starred Paper is brought to you for free and open access by the Department of Mechanical and Manufacturing Engineering at theRepository at St.Cloud State. It has been accepted for inclusion in Culminating Projects in Mechanical and Manufacturing Engineering by an authorized administratorof theRepository at St. Cloud State. For more information, please contact [email protected].
Recommended CitationMatto, Saqib Burhan, "Defect Reduction for the Defibrillator" (2016). Culminating Projects in Mechanical and ManufacturingEngineering. 55.https://repository.stcloudstate.edu/mme_etds/55

1
Defect Reduction for the Defibrillator
by
Saqib Burhan Matto
A Starred Paper
Submitted to the Graduate Faculty of
St. Cloud State University
in Partial Fulfillment of the Requirements
for the Degree of
Master of Science
In Engineering Management
August, 2016
Starred Paper Committee: Dr. Hiral Shah, Chairperson
Dr. Ben Baliga Dr. Balasubramanian Kasi
2
Abstract
The report includes Corrective and Preventive Actions implemented as a result of
a customer product complaint. Customer product complaint was received related to
cosmetic defects of the Dura-Padz assembly. The defects found were scratches, dents,
molding flash, de-bonding and stains. Supplier Corrective Action Report (SCAR) was
issued by the customer to figure out the root cause of the problem and implement
effective measures to address the root cause of the defects. The purpose of the project
was to determine the root cause of the above mentioned defects and take corrective
and preventive actions to address the root cause. 5 why methodology and
Measurement System Analysis (attribute gage R&R) was used to determine the root
cause of each of the defects. After the root cause was determined for the defects,
corrective and preventive actions were implemented to address the root cause. After the
implementation of corrective and preventive actions, effectiveness check was performed
to see if the actions implemented were effective in addressing the root causes. The
results from the effectiveness check showed that all the corrective and preventive
actions implemented were effective in addressing the root causes.

3
Acknowledgements
This project was completed with the help of Product Development Engineers,
Process Engineer and Management team at Company ABC.

4
Table of Contents
Page
LIST OF TABLE ............................................................................................................. 5
LIST OF FIGURES......................................................................................................... 6
Chapter
I. INTRODUCTION.............................................................................................. 8
Introduction........................................................................................... 8
Problem Statement............................................................................... 8
Nature and Significance of the Problem............................................... 8
Objective of the Project......................................................................... 14
Project Questions..................................................................................14
Limitations of the Project...................................................................... 14
Definition of Terms................................................................................ 14
Summary............................................................................................... 15
II. BACKGROUND AND REVIEW OF LITERATURE.......................................... 16
Introduction .......................................................................................... 16
Background Related to the Problem..................................................... 16
Literature Related to the Problem......................................................... 17
Literature Related to the Methodology.................................................. 18
Summary............................................................................................... 19
III. METHODOLOGY............................................................................................ 20
Introduction........................................................................................... 20

5
Design of the Study...............................................................................20
Data Collection......................................................................................23
Data Analysis........................................................................................ 24
Budget...................................................................................................24
Timeline................................................................................................ 24
Summary............................................................................................... 25
IV. DATA PRESENTATION AND ANALYSIS...................................................... 26
Introduction........................................................................................... 26
Data Presentation................................................................................. 26
Data Analysis........................................................................................ 26
Summary............................................................................................... 33
V. RESULTS, CONCLUSION, AND RECOMMENDATIONS.............................. 34
Introduction........................................................................................... 34
Results.................................................................................................. 34
Conclusion............................................................................................ 35
Recommendations................................................................................ 35
REFERENCES.................................................................................................... 36
APPENDIX........................................................................................................... 37

6
List of Table
Table Page
1. Itemized cost of the product........................................................................................ 24

7
List of Figures
Figure Page
1. Scratches.................................................................................................................... 9
2. Dents.......................................................................................................................... 10
3. Flash........................................................................................................................... 11
4. De-bonding................................................................................................................. 12
5. Stain............................................................................................................................ 13
6. Dura-padz assembly attached to a human body........................................................ 18
7. Flow Chart for methodology of the project.................................................................. 21
8. Dura-padz with polyimide stickers.............................................................................. 23
9. Gantt chart.................................................................................................................. 25
10. Summary Report (Before Implementing Corrective Action)...................................... 28
11. Misclassification Report (Before Implementing Corrective Action).......................... 29
12. Accuracy Report (Before Implementing Corrective Action)...................................... 30
13. Attribute Agreement Summary Report (After Implementation
of Corrective Action).............................................................................................. 31
14. Accuracy Report (After Implementation of Corrective action).................................. 32
15. Misclassification Report ((After Implementation of Corrective Action)..................... 33

8
Chapter I: INTRODUCTION
Introduction
Dura-padz is one the products that the company manufacturers. This product
could be used during a sudden cardiac arrest. The customer product complaint was
received on this product. In order to address this complaint a corrective / preventive
Action (CAPA) Report was created. The project report covers the description of product
complaint, the root cause analysis of the complaint, the corrective action taken, the
preventive action taken to address the root cause and verification of effectiveness check
for the implemented preventive actions.
Problem Statement
Customer product complaint was received related to cosmetic defects of the
dura-padz assembly. The defects include: Scratches, dents, molding flash, de-bonding
and stains. Supplier corrective action report (SCAR) was issued by the customer to
figure out the root cause of the problem and implement effective measures to address
the root cause of the defects.
Nature and Significance of the Problem
Fifty percent of the Dura-pads assembles shipped to the customer were rejected
because of the cosmetic defects. These defects were responsible for impacting the
functionality of the device and hence it is essential to take Corrective/ Preventive
Actions to address the root causes of these defects. Figure 1 shows scratches on the
electrodes, Figure 2 shows the dents, Figure 3 shows the molding flash which is a result
of injection molding process, Figure 4 shows that electrode is not bonded well with the

9
pad. This defect can be seen when the electrodes are pushed outwards and Figure 5
shows the stains on the electrodes.
A) Scratches
Figure 1: Scratches

10
B) Dents
Figure 2: Dents

11
C) Molding Flash
Figure 3: Flash

12
D) De-bonding:
Figure 4: De-bonding

13
E) Stains:
Figure 5: Stain

14
Objective of the Project
A) Determine the root cause of the defects.
B) Determine Corrective Actions to address the root cause.
C) Propose Preventive Actions to address the root cause.
D) Implement Preventive Actions.
E) Verify Preventive Actions were effective in addressing the root cause.
F) Review Inspection Procedure and Training and verify the effectiveness of
training. Propose improvements in inspection if required.
Project Questions
A) What was the root cause of the defects?
B) What Preventive Actions were implemented to address the root cause?
C) Were the Preventive Actions implemented effective in addressing the root
cause?
D) Was the inspection effective in catching the defects?
Limitations of the Project
Due to the limitations in the design of electrodes, dents can still be caused during
inspection. Surface of the electrodes is really delicate and dents could still be easily
caused during inspection if the operators are not careful while handling the product.
Definition of Terms
Lean Manufacturing: An overall methodology that seeks to minimize the
resources required for production by eliminating waste (non-value added activities) that
inflate costs, lead times and inventory requirements.
15
Corrective Actions: Actions taken to avoid any undesirable events or defects
immediately (Ingram, 1997, p. 463).
Preventive Actions: Actions taken to avoid any undesirable events or defects in
near future (Ingram, 1997, p. 463).
Accuracy: Overall agreement of the measured value with the true value
Repeatability: The variation observed when the same operator measures the same
item repeatedly with the same device.
Reproducibility: The variation observed when different operators measure the
same parts using the same device, sometimes it can be the same operator using different
devices.
Attribute agreement analysis:
If the operators agree with himself on all trials?
If the operators agree with the known standard on all trials.
Summary
Chapter I covered the introduction about the project, describing the nature and
significance of the problem. Chapter 1 also covered the objectives of the project and its
limitations. Chapter II covers the literature about the device about which the customer
product compliant was received.

16
Chapter II: BACKGROUND AND REVIEW OF LITERATURE
Introduction
Chapter II covers the literature about the problem and the methodologies used.
Background Related to the Problem
The company is the leading provider of outsourced, customized interconnect and
cable solutions, having successfully designed, developed and manufactured ENT and
plastic surgery solutions such as: Power/control cables for electromechanical devices
Signal cables for patient interface measurement. Design & Manufacturing Capabilities
include:
Injection molding / over-molding
Custom design cable capabilities
Ultrasonic welding
Internal PCB assemblies
Custom connectors Device packaging & sterilization
Resistance welding Liquid Silicone Rubber (LSR)
Silicone transfer molding
Parylene coating
The product complaint was received for the Dura-padz assembly shown in figure6.
Dura-padz assemblies are used in making external defibrillator used in the treatment of
sudden cardiac arrests. Each assembly consists of two pads and a connector. Each pad
consists of 9 electrodes. These electrodes provide electrical shock to restore normal sinus

17
rhythm of heart in case of a cardiac arrest. Each pad is manufacturing using injection
molding technique. Electrodes are placed into the mold cavity and silicone is injected into
the mold. This process is followed by cooling down the pads. Figure 6 shows the dura-
padz on a human body during a cardiac arrest.
Figure 6: Dura-padz assembly attached to a human body
Literature Related to the Problem
Literature consisted of the articles on injection molding defects.

18
A) Injection Molding Defects.
The various injection molding defects include sinks, Foreign Material, Shor Short,
flow lines and flash. The defects can be directly a result of the process parameters
such as the flow speed, temperature, cooling time and pressure. Adjusting the
process parameters can significantly reduce these defects (Tabi, 2015, p.394-
400).
Literature Related to the Methodology
A) 5 why’s
The ‘5 whys’ methodology is a process that begins with identifying specific problem
an. This next step is asking; why the problem happens. If the answer given does
not identify the root cause of the problem, the engineers keep asking why until the
root cause of the problem is identified. Although the name implies asking why a
total of five times, in some cases fewer or more than five questions may be required
to determine the root cause of the problem (Chen, li, & Shady, 2010, p.1073).
B) Gage R&R
Gage R&R or Measurement System Analysis is the technique to determine the
repeatability and reproducibility of a process. Repeatability of Gage R&R refers to
whether same operator is able to make same judgment call while analyzing the
same part or assembly at different times. Reproducibility comes into play in
deterring whether different operators are able to make same judgment call while
analyzing the same criteria (Murphy, Moeller, Page, Cerqua & Boarman, 2009,
p.569).

19
Summary
Chapter II covered the details about the literature reviewed for completing the
project. Chapter II covers literature about the injection molding defects, 5 Why’s
methodology to determine the root cause of the complaint and Gage R&R to determine if
the inspection training was effective in catching the defective parts.

20
Chapter III: METHODOLOGY
Introduction
Chapter III covers the methodology adopted for completing the project. Flow chart
defines each step of the project. The chapter also covers the Corrective Actions, Root
cause determination exercise using the 5Why methodology and Preventive Actions. The
chapter also describes how data was collected and analyzed.
Design of the Study
1) All product returned from the customer was analyzed to verify the defects.
2) Root cause for the defects was determined using 5 Whys Diagram Methodology.
Measurement System Analysis was done to determine the root cause (Andersen
and Fagerhaug, 2009, p.11).
3) Corrective Actions were proposed and implemented.
4) Manufacturing process was reviewed for the better understating of the process.
5) After identifying of the root cause for the defects, Preventive Actions were
proposed to address the root cause for these defects.
6) After Preventive Actions are approved, all the actions were implemented.
7) After preventive actions were implemented, operators were retrained for
Inspection. Measurement System Analysis (Gage R&R) was performed to
determine that training is effective to inspect the assemblies.
8) After Implementing the Preventive Actions, verification of effectiveness shall be done
to see whether the changes were effective in addressing the root cause of the
defects.
21
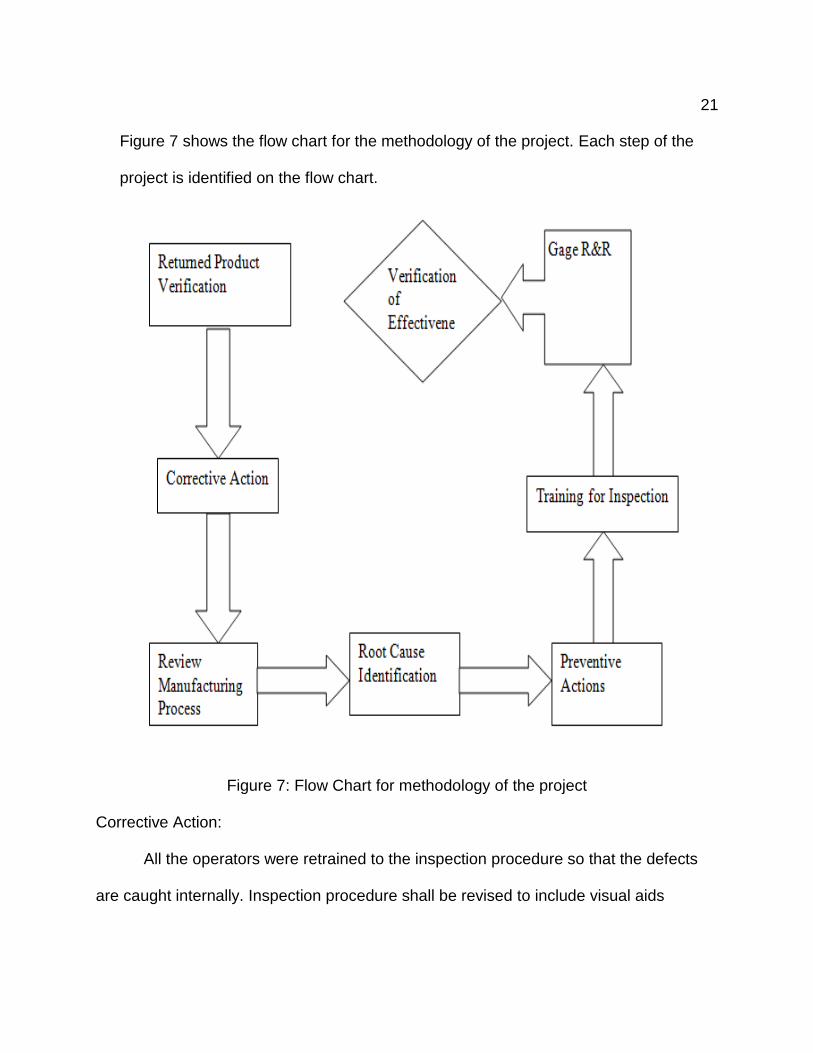
Figure 7 shows the flow chart for the methodology of the project. Each step of the
project is identified on the flow chart.
Figure 7: Flow Chart for methodology of the project
Corrective Action:
All the operators were retrained to the inspection procedure so that the defects
are caught internally. Inspection procedure shall be revised to include visual aids

22
Root cause determination:
Root cause was determined using the 5Why methodology. 5 Why Methodology
to determine the root cause is illustrated below.
1) Why are parts defective?
Answer) Parts have dents, stains, molding flash and scratches.
2) Why do parts have dents, stains, molding flash and scratches?
Answer) Inspection Procedure is not effective in catching the defects.
3) Why is inspection procedure ineffective in catching the defects?
Answer) Inspection lacks visual aids for the operators to look at while they are
inspecting the parts.
Preventive Action:
Defects were caused during removing the molding flash from the surface of the
electrodes. Parts shall be covered by polyamide stickers before they are molded. These
polyamide stickers shall be removed from the surface of the electrodes after they are
molding process is completed.
Figure 8 shows the stickers put on the surface of the electrodes.

23
Figure 8: Dura-padz with polyimide stickers.
Data Collection
Minitab was used to create the format of the gage R&R study. In order to remove
any operator bias from the study, data was collected in a blinded fashion. Operators were
given the parts without knowing what part number it is. This was done to eliminate any
kind of bias from the study (Vasudev, 2013, p. 2).
Study was created for 3 operators, 12 parts, each inspecting the part 3 times. Thus
the total number of observations or Run orders for the study was 108. The study consisted

24
of 6 known good and bad parts. Each defect type was included in the study. Attribute
gage R&R study was done
Data Analysis
Statistical software Minitab was used to collect and analyze the data.
Budget
Table 1 below shows the itemized cost for the project. The Company provided
Minitab Software was used to collect and analyze the data.
Table 1: Itemized cost of the product
Item# Description Cost
1 Polyamide stickers $5/packet
2 Minitab Free/ Company Provided
3 Packaging Testing $500/shipping box
Timeline
Figure 9 below shows the Gantt chart defining the timeline to complete the project.
The project was completed on May/2/2016.

25
Figure 9: Gantt chart
Summary
Chapter III describes how the data was collected and analyzed. Chapter III also
describes the timeline and the itemized budget of the project.

26
Chapter IV: DATA PRESENTATION AND ANALYSIS
Introduction
The chapter will cover the actual data collected before and after implementing
corrective Action. The chapter also covers the analysis done for the Gage R&R study
before and after implementing the corrective actions.
Data Presentation
Table 2 (See Appendix) shows the data collected for the gage R&R study before
implementing the corrective action. Data was collected using the Minitab. Column 1
shows the order in which the study was conducted, Column 2 shows the operator that
involved, Column 3 shows the number of trails, Column 4 shows the part number , Column
5 shows the results of the study and Column 6 shows the standard result.
Table 3 (See Appendix) shows the data collected for the gage R&R study after
implementing the corrective Action. Data was collected using the Minitab. Column 1
shows the order in which the study was conducted, Column 2 shows the operator that
involved, Column 3 shows the number of trails, Column 4 shows the part number , Column
5 shows the results of the study and Column 6 shows the standard result.
Data Analysis
Analysis of the data was done before and after implementing the corrective
Actions.
Before Implementation of Corrective Action:
Figure 10 shows the overall accuracy of 88.9%, the percentage of good parts that
were classified as bad was 22.2 %, percentage of bad parts that were classified as good

27
was 0% and the percentage for the parts to be classified either ways was 0%. From the
figure 10, operator 1 had an accuracy of 66.7% while the operators 2 and 3 have an
accuracy rated at 100%.
Figure 11 shows that operator 1 had problems identifying the good parts as bad.
Further items 8,9,10 and 11 were all identified as bad parts by operator 1. The overall
error rate was 11.1%. It was clear that operator 1 needed more training or the inspection
procedure was inadequate. From this data it was clear that operator 1 needed more
training or the inspection procedure was inadequate.
Figure 12 shows the accuracy report by standard, error and trail. All the bad parts
were identified correctly, problems lied in identifying the good parts.

28
Figure 10: Summary Report (Before Implementing Corrective Action)

29
Figure 11: Misclassification Report (Before Implementing Corrective Action)

30
Figure12: Accuracy Report (Before Implementing Corrective Action)
After Implementation of Corrective Action
Analysis of the data was done using the Minitab. Figure 13 shows the overall
accuracy was be 99.1%, the percentage of good parts that were classified as bad was 0

31
%, percentage of bad parts that were classified as good was 1.9% and the percentage
for the parts to be classified either ways was 2.8%.
Figure 13: Attribute Agreement Summary Report (After Implementation of Corrective
Action)
Figure 14 shows the agreement analysis by operators, standard, trail and by standard.
After the completion of the training operator 1 had significantly improved and all the good
parts were identified correctly however one of the bad parts was identified incorrectly.

32
Figure 14: Accuracy Report (After Implementation of Corrective Action)
Figure 15 shows the Misclassification Report. All the good parts were classified
correctly. Item 1 was classified incorrectly as a good part. None of the good parts were
classified as bad by any of the operators, thus the misclassification rate for good parts
that were rated bad is zero for all the operators.
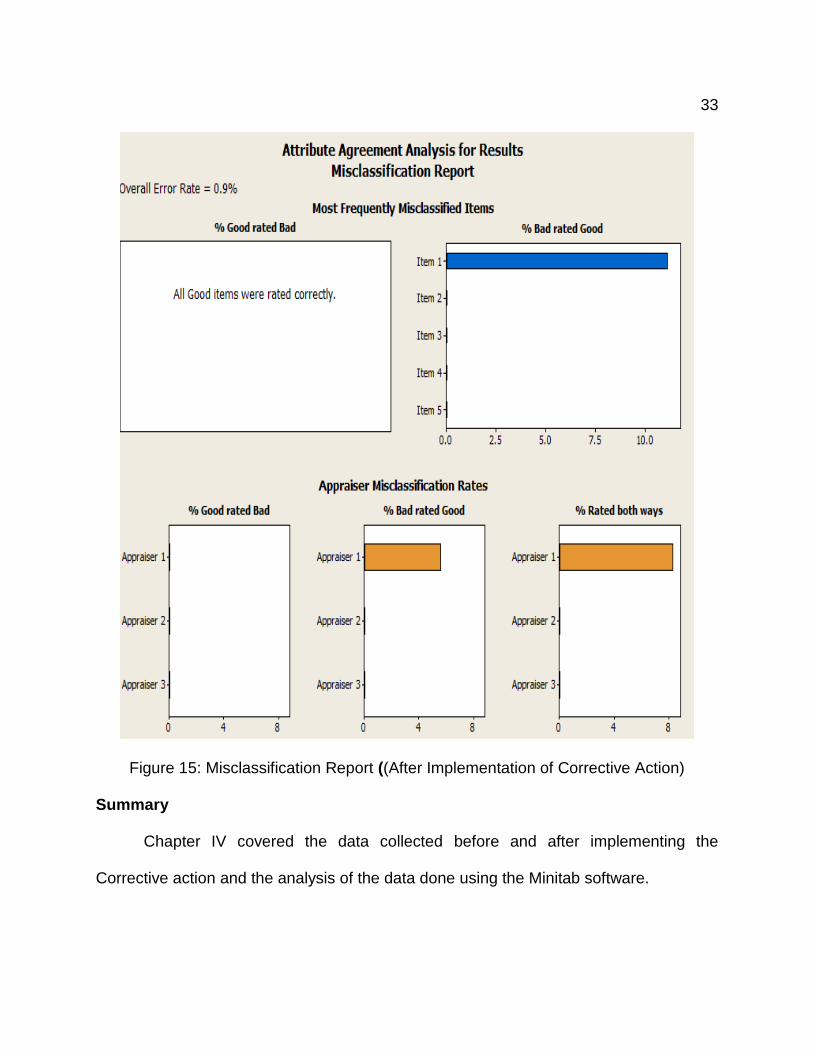
33
Figure 15: Misclassification Report ((After Implementation of Corrective Action)
Summary
Chapter IV covered the data collected before and after implementing the
Corrective action and the analysis of the data done using the Minitab software.
34
Chapter V: RESULTS, CONCLUSION, AND RECOMMENDATION
Introduction
This chapter will cover the results, conclusion and recommendation for the project.
Results
The project questions were answered in the following manner:
A) What was the root cause of the defects?
Answer) Root cause for the defects was determined to be that inspection
procedure was inadequate in catching the defects. Inspection procedure lacked
any visual aids which made it harder for the operator 1 to distinguish bad parts
from the good ones.
B) What Preventive Actions were implemented to address the root cause?
Answer) Parts shall be covered by polyamide stickers before they are molded.
These polyamide stickers shall be removed from the surface of the electrodes after
they are molding process is complete.
C) Were the Preventive Actions implemented effective in addressing the root cause?
Answer) Yes the Preventive actions were effective in addressing the root cause as
no defects were found in the next 3 lots of the product that was shipped to the
customer.
D) Was the inspection effective in catching the defects?
Answer) Yes Inspection was determined to be effective in catching the defects as
the overall accuracy of the operators was found to be 99.1%. Overall accuracy of
the operators to catch the defects significantly increased from 88 to 99% after the

35
operators were trained to the revised inspection procedure which included the
visual aids.
Conclusion
The project was done to determine the root cause of the Customer Product
Complaint and propose Corrective and Preventive Actions to address the root cause.
Root cause was determined by using 5 why methodology and conducting an attribute
gage R&R study. From the study conducted it was determined that inspection procedure
was inadequate and needed to be revised to include visual aids. Also in order to eliminate
the process of inspection, preventative action of using the polyamide stickers before the
molding process proposed.
Recommendations
1) Increase the material thickness of the electrodes so dents are not easily
caused. Currently electrodes are really thin and could be dented very easily
handling if the operators are not careful while handling the product.
2) Parts shall be covered by polyamide stickers before they are molded. These
polyamide stickers shall be removed from the surface of the electrodes after
they are molding process is complete.

36
References
Andersen, B., & Fagerhaug, T. (2009). Root cause analysis: Simplified tools and
techniques (2nd ed., pp. 11-14). Milwaukee: American Society for Quality Press.
Chen, J. C., Li, Y., & Shady, B. D. (2010). From value stream mapping toward a
lean/sigma continuous improvement process: An industrial case study.
International Journal of Production Research, 48(4), 1069-1086. Retrieved from
https://www.researchgate.net/publication/233502517_From_value_stream_mapp
ing_toward_a_leansigma_continuous_improvement_process_an_industrial_case
_study_Int_J_Prod_Res. 15 Jan. 2016.
Ingram, S. T. (1997, May). QS-9000 corrective and preventive action system. Annual
Quality Congress, 51(0), 463-469.
Murphy, S. A., Moeller, S. E., Page, J. R., Cerqua, J., & Boarman, M. (2009).
Leveraging measurement system analysis (MSA) to improve library assessment:
The attribute gage R&R. College & Research Libraries, 70(6), 568-577.
Tabi, T. (2015). The analysis of injection molding defects caused by gate vestiges.
Express Polymlett Express Polymer Letters, 9(4), 394-400.
Vasudev, K. (2013, July 3). Comparative study of lean manufacturing. Iaeng.org. Web.
3 Feb. 2016.

37
Appendix
Table 2 below shows the data collected for the gage R&R study before
implementing the corrective action.
Table 2: Data collected before implementation of corrective action
Run Order Appraisers Trials Test Items Results Standards
1 Appraiser 1 1 Item 8 Bad Good
2 Appraiser 1 1 Item 10 Bad Good
3 Appraiser 1 1 Item 11 Bad Good
4 Appraiser 1 1 Item 1 Bad Bad
5 Appraiser 1 1 Item 9 Bad Good
6 Appraiser 1 1 Item 6 Bad Bad
7 Appraiser 1 1 Item 7 Good Good
8 Appraiser 1 1 Item 12 Good Good
9 Appraiser 1 1 Item 4 Bad Bad
10 Appraiser 1 1 Item 5 Bad Bad
11 Appraiser 1 1 Item 2 Bad Bad
12 Appraiser 1 1 Item 3 Bad Bad

38
13 Appraiser 2 1 Item 9 Good Good
14 Appraiser 2 1 Item 2 Bad Bad
15 Appraiser 2 1 Item 10 Good Good
16 Appraiser 2 1 Item 1 Bad Bad
17 Appraiser 2 1 Item 5 Bad Bad
18 Appraiser 2 1 Item 8 Good Good
19 Appraiser 2 1 Item 11 Good Good
20 Appraiser 2 1 Item 6 Bad Bad
21 Appraiser 2 1 Item 12 Good Good
22 Appraiser 2 1 Item 4 Bad Bad
23 Appraiser 2 1 Item 7 Good Good
24 Appraiser 2 1 Item 3 Bad Bad
25 Appraiser 3 1 Item 2 Bad Bad
26 Appraiser 3 1 Item 10 Good Good
27 Appraiser 3 1 Item 5 Bad Bad
28 Appraiser 3 1 Item 12 Good Good

39
29 Appraiser 3 1 Item 9 Good Good
30 Appraiser 3 1 Item 3 Bad Bad
31 Appraiser 3 1 Item 7 Good Good
32 Appraiser 3 1 Item 11 Good Good
33 Appraiser 3 1 Item 6 Bad Bad
34 Appraiser 3 1 Item 1 Bad Bad
35 Appraiser 3 1 Item 4 Bad Bad
36 Appraiser 3 1 Item 8 Good Good
37 Appraiser 1 2 Item 2 Bad Bad
38 Appraiser 1 2 Item 5 Bad Bad
39 Appraiser 1 2 Item 8 Bad Good
40 Appraiser 1 2 Item 3 Bad Bad
41 Appraiser 1 2 Item 9 Bad Good
42 Appraiser 1 2 Item 12 Good Good
43 Appraiser 1 2 Item 4 Bad Bad
44 Appraiser 1 2 Item 1 Bad Bad

40
45 Appraiser 1 2 Item 10 Bad Good
46 Appraiser 1 2 Item 6 Bad Bad
47 Appraiser 1 2 Item 7 Good Good
48 Appraiser 1 2 Item 11 Bad Good
49 Appraiser 2 2 Item 11 Good Good
50 Appraiser 2 2 Item 2 Bad Bad
51 Appraiser 2 2 Item 7 Good Good
52 Appraiser 2 2 Item 12 Good Good
53 Appraiser 2 2 Item 6 Bad Bad
54 Appraiser 2 2 Item 9 Good Good
55 Appraiser 2 2 Item 8 Good Good
56 Appraiser 2 2 Item 5 Bad Bad
57 Appraiser 2 2 Item 3 Bad Bad
58 Appraiser 2 2 Item 10 Good Good
59 Appraiser 2 2 Item 1 Bad Bad
60 Appraiser 2 2 Item 4 Bad Bad

41
61 Appraiser 3 2 Item 3 Bad Bad
62 Appraiser 3 2 Item 8 Good Good
63 Appraiser 3 2 Item 5 Bad Bad
64 Appraiser 3 2 Item 7 Good Good
65 Appraiser 3 2 Item 1 Bad Bad
66 Appraiser 3 2 Item 4 Bad Bad
67 Appraiser 3 2 Item 2 Bad Bad
68 Appraiser 3 2 Item 11 Good Good
69 Appraiser 3 2 Item 12 Good Good
70 Appraiser 3 2 Item 10 Good Good
71 Appraiser 3 2 Item 9 Good Good
72 Appraiser 3 2 Item 6 Bad Bad
73 Appraiser 1 3 Item 5 Bad Bad
74 Appraiser 1 3 Item 3 Bad Bad
75 Appraiser 1 3 Item 11 Bad Good
76 Appraiser 1 3 Item 9 Bad Good

42
77 Appraiser 1 3 Item 7 Good Good
78 Appraiser 1 3 Item 1 Bad Bad
79 Appraiser 1 3 Item 10 Bad Good
80 Appraiser 1 3 Item 2 Bad Bad
81 Appraiser 1 3 Item 6 Bad Bad
82 Appraiser 1 3 Item 4 Bad Bad
83 Appraiser 1 3 Item 8 Bad Good
84 Appraiser 1 3 Item 12 Good Good
85 Appraiser 2 3 Item 10 Good Good
86 Appraiser 2 3 Item 3 Bad Bad
87 Appraiser 2 3 Item 9 Good Good
88 Appraiser 2 3 Item 6 Bad Bad
89 Appraiser 2 3 Item 4 Bad Bad
90 Appraiser 2 3 Item 8 Good Good
91 Appraiser 2 3 Item 2 Bad Bad
92 Appraiser 2 3 Item 12 Good Good

43
93 Appraiser 2 3 Item 1 Bad Bad
94 Appraiser 2 3 Item 5 Bad Bad
95 Appraiser 2 3 Item 7 Good Good
96 Appraiser 2 3 Item 11 Good Good
97 Appraiser 3 3 Item 4 Bad Bad
98 Appraiser 3 3 Item 9 Good Good
99 Appraiser 3 3 Item 7 Good Good
100 Appraiser 3 3 Item 2 Bad Bad
101 Appraiser 3 3 Item 5 Bad Bad
102 Appraiser 3 3 Item 1 Bad Bad
103 Appraiser 3 3 Item 3 Bad Bad
104 Appraiser 3 3 Item 8 Good Good
105 Appraiser 3 3 Item 12 Good Good
106 Appraiser 3 3 Item 11 Good Good
107 Appraiser 3 3 Item 10 Good Good
108 Appraiser 3 3 Item 6 Bad Bad

44
Table 3 below shows the data collected for the gage R&R study after implementing the
corrective action.
Table 3: Data collected after implementation of corrective action
RunOrder Appraisers Trials Test Items Results Standards
1 Appraiser 1 1 Item 9 Good Good
2 Appraiser 1 1 Item 1 Good Bad
3 Appraiser 1 1 Item 7 Good Good
4 Appraiser 1 1 Item 8 Good Good
5 Appraiser 1 1 Item 11 Good Good
6 Appraiser 1 1 Item 5 Bad Bad
7 Appraiser 1 1 Item 12 Good Good
8 Appraiser 1 1 Item 3 Bad Bad
9 Appraiser 1 1 Item 10 Good Good
10 Appraiser 1 1 Item 4 Bad Bad
11 Appraiser 1 1 Item 6 Bad Bad
12 Appraiser 1 1 Item 2 Bad Bad

45
13 Appraiser 2 1 Item 1 Bad Bad
14 Appraiser 2 1 Item 3 Bad Bad
15 Appraiser 2 1 Item 7 Good Good
16 Appraiser 2 1 Item 9 Good Good
17 Appraiser 2 1 Item 6 Bad Bad
18 Appraiser 2 1 Item 4 Bad Bad
19 Appraiser 2 1 Item 2 Bad Bad
20 Appraiser 2 1 Item 11 Good Good
21 Appraiser 2 1 Item 8 Good Good
22 Appraiser 2 1 Item 5 Bad Bad
23 Appraiser 2 1 Item 12 Good Good
24 Appraiser 2 1 Item 10 Good Good
25 Appraiser 3 1 Item 5 Bad Bad
26 Appraiser 3 1 Item 1 Bad Bad
27 Appraiser 3 1 Item 7 Good Good
28 Appraiser 3 1 Item 9 Good Good

46
29 Appraiser 3 1 Item 2 Bad Bad
30 Appraiser 3 1 Item 10 Good Good
31 Appraiser 3 1 Item 11 Good Good
32 Appraiser 3 1 Item 6 Bad Bad
33 Appraiser 3 1 Item 8 Good Good
34 Appraiser 3 1 Item 3 Bad Bad
35 Appraiser 3 1 Item 4 Bad Bad
36 Appraiser 3 1 Item 12 Good Good
37 Appraiser 1 2 Item 9 Good Good
38 Appraiser 1 2 Item 7 Good Good
39 Appraiser 1 2 Item 8 Good Good
40 Appraiser 1 2 Item 4 Bad Bad
41 Appraiser 1 2 Item 6 Bad Bad
42 Appraiser 1 2 Item 2 Bad Bad
43 Appraiser 1 2 Item 1 Bad Bad
44 Appraiser 1 2 Item 11 Good Good

47
45 Appraiser 1 2 Item 12 Good Good
46 Appraiser 1 2 Item 3 Bad Bad
47 Appraiser 1 2 Item 5 Bad Bad
48 Appraiser 1 2 Item 10 Good Good
49 Appraiser 2 2 Item 8 Good Good
50 Appraiser 2 2 Item 1 Bad Bad
51 Appraiser 2 2 Item 3 Bad Bad
52 Appraiser 2 2 Item 4 Bad Bad
53 Appraiser 2 2 Item 2 Bad Bad
54 Appraiser 2 2 Item 9 Good Good
55 Appraiser 2 2 Item 5 Bad Bad
56 Appraiser 2 2 Item 10 Good Good
57 Appraiser 2 2 Item 12 Good Good
58 Appraiser 2 2 Item 6 Bad Bad
59 Appraiser 2 2 Item 11 Good Good
60 Appraiser 2 2 Item 7 Good Good

48
61 Appraiser 3 2 Item 3 Bad Bad
62 Appraiser 3 2 Item 7 Good Good
63 Appraiser 3 2 Item 1 Bad Bad
64 Appraiser 3 2 Item 2 Bad Bad
65 Appraiser 3 2 Item 6 Bad Bad
66 Appraiser 3 2 Item 8 Good Good
67 Appraiser 3 2 Item 4 Bad Bad
68 Appraiser 3 2 Item 10 Good Good
69 Appraiser 3 2 Item 5 Bad Bad
70 Appraiser 3 2 Item 11 Good Good
71 Appraiser 3 2 Item 9 Good Good
72 Appraiser 3 2 Item 12 Good Good
73 Appraiser 1 3 Item 3 Bad Bad
74 Appraiser 1 3 Item 4 Bad Bad
75 Appraiser 1 3 Item 8 Good Good
76 Appraiser 1 3 Item 9 Good Good

49
77 Appraiser 1 3 Item 10 Good Good
78 Appraiser 1 3 Item 6 Bad Bad
79 Appraiser 1 3 Item 12 Good Good
80 Appraiser 1 3 Item 2 Bad Bad
81 Appraiser 1 3 Item 11 Good Good
82 Appraiser 1 3 Item 1 Bad Bad
83 Appraiser 1 3 Item 7 Good Good
84 Appraiser 1 3 Item 5 Bad Bad
85 Appraiser 2 3 Item 3 Bad Bad
86 Appraiser 2 3 Item 9 Good Good
87 Appraiser 2 3 Item 12 Good Good
88 Appraiser 2 3 Item 10 Good Good
89 Appraiser 2 3 Item 5 Bad Bad
90 Appraiser 2 3 Item 8 Good Good
91 Appraiser 2 3 Item 1 Bad Bad
92 Appraiser 2 3 Item 7 Good Good

50
93 Appraiser 2 3 Item 6 Bad Bad
94 Appraiser 2 3 Item 2 Bad Bad
95 Appraiser 2 3 Item 4 Bad Bad
96 Appraiser 2 3 Item 11 Good Good
97 Appraiser 3 3 Item 8 Good Good
98 Appraiser 3 3 Item 2 Bad Bad
99 Appraiser 3 3 Item 5 Bad Bad
100 Appraiser 3 3 Item 4 Bad Bad
101 Appraiser 3 3 Item 11 Good Good
102 Appraiser 3 3 Item 12 Good Good
103 Appraiser 3 3 Item 3 Bad Bad
104 Appraiser 3 3 Item 9 Good Good
105 Appraiser 3 3 Item 6 Bad Bad
106 Appraiser 3 3 Item 7 Good Good
107 Appraiser 3 3 Item 1 Bad Bad
108 Appraiser 3 3 Item 10 Good Good