defense working capital fund - comptroller.defense.gov · defense-wide working capital fund cash...
TRANSCRIPT

DEFENSE WORKING CAPITAL FUND
DEFENSE-WIDE FISCAL YEAR (FY) FY 2014
BUDGET ESTIMATES
OPERATING AND CAPITAL BUDGETS
APRIL 2013
CONGRESSIONAL DATA
DEFENSE-WIDE WORKING CAPITAL FUND (DWWCF)
FISCAL YEAR (FY) 2013 PRESIDENT’S BUDGET
APRIL 2013
DEFENSE-WIDE SUMMARY
The DWWCF consists of six activity groups. The Defense Logistics
Agency (DLA) operates three of these activity groups, the Defense
Information Systems Agency (DISA) operates two activity groups, and
Defense Finance and Accounting Service (DFAS) operates one activity
group.
The DFAS was formed in January 1991 from the Military Services
finance and accounting functions. The mission of the DFAS is to
lead the Department of Defense (DoD) in finance and accounting by
ensuring the delivery of efficient, exceptional quality pay and
financial information.
The DISA was reorganized in 1991 from the former Defense
Communications Agency. The mission of the DISA is to engineer and
provide command and control capabilities and enterprise
infrastructure to continuously operate and assure a global net-
centric enterprise in direct support to joint warfighters, National
level leaders, and other mission and coalition partners across the
full spectrum of operations.
The DLA, formed in the early 1960s, operates the Supply Chain
Management (SCM), Energy Management, and Document Services activity
groups. The DLA SCM manages the materiel from initial acquisition,
to storage and distribution, and then finally reutilization or
disposal. The DLA Energy Management provides comprehensive
worldwide energy support for the military services and other
authorized customers. The DLA Document Services provides time
sensitive, competitively priced, and high quality printing and
digital services. The mission of the DLA is to provide effective
and efficient worldwide support to warfighters and our other
customers.
DEFENSE-WIDE WORKING CAPITAL FUND CASH
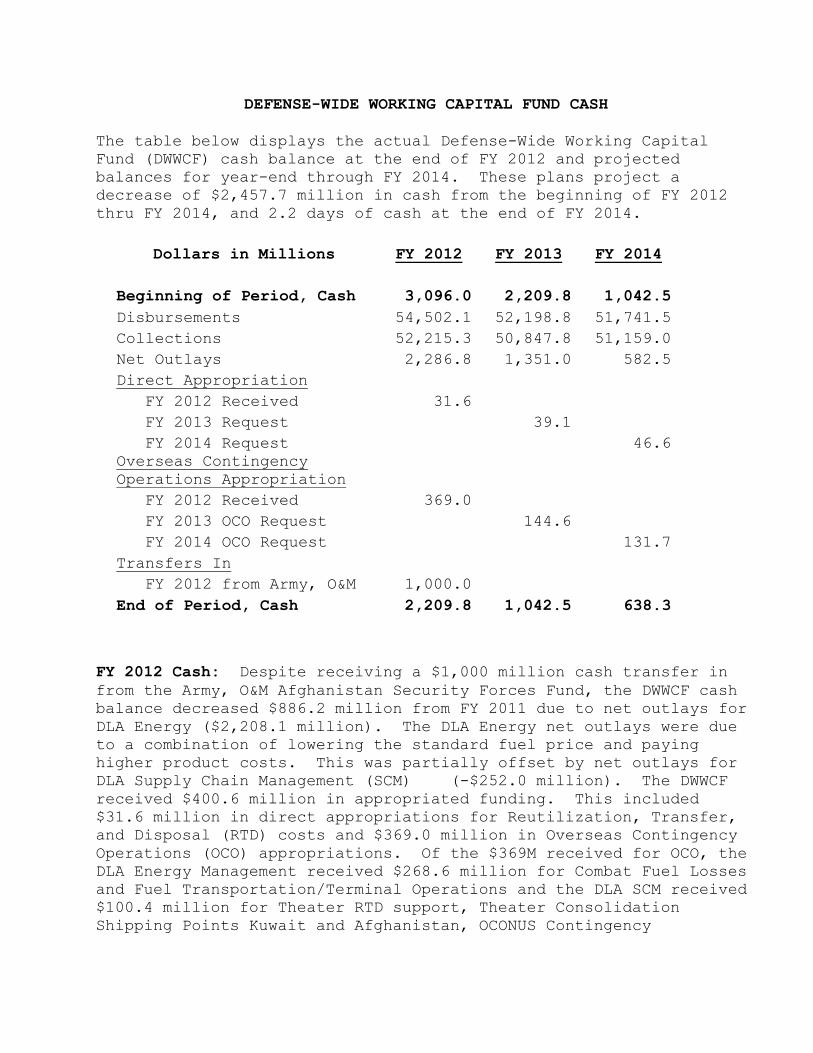
The table below displays the actual Defense-Wide Working Capital
Fund (DWWCF) cash balance at the end of FY 2012 and projected
balances for year-end through FY 2014. These plans project a
decrease of $2,457.7 million in cash from the beginning of FY 2012
thru FY 2014, and 2.2 days of cash at the end of FY 2014.
Dollars in Millions FY 2012 FY 2013 FY 2014
Beginning of Period, Cash 3,096.0 2,209.8 1,042.5
Disbursements 54,502.1 52,198.8 51,741.5
Collections 52,215.3 50,847.8 51,159.0
Net Outlays 2,286.8 1,351.0 582.5
Direct Appropriation
FY 2012 Received 31.6
FY 2013 Request
39.1
FY 2014 Request
46.6
Overseas Contingency
Operations Appropriation
FY 2012 Received 369.0
FY 2013 OCO Request
144.6
FY 2014 OCO Request
131.7
Transfers In
FY 2012 from Army, O&M 1,000.0
End of Period, Cash 2,209.8 1,042.5 638.3
FY 2012
FY 2012 Cash: Despite receiving a $1,000 million cash transfer in
from the Army, O&M Afghanistan Security Forces Fund, the DWWCF cash
balance decreased $886.2 million from FY 2011 due to net outlays for
DLA Energy ($2,208.1 million). The DLA Energy net outlays were due
to a combination of lowering the standard fuel price and paying
higher product costs. This was partially offset by net outlays for
DLA Supply Chain Management (SCM) (-$252.0 million). The DWWCF
received $400.6 million in appropriated funding. This included
$31.6 million in direct appropriations for Reutilization, Transfer,
and Disposal (RTD) costs and $369.0 million in Overseas Contingency
Operations (OCO) appropriations. Of the $369M received for OCO, the
DLA Energy Management received $268.6 million for Combat Fuel Losses
and Fuel Transportation/Terminal Operations and the DLA SCM received
$100.4 million for Theater RTD support, Theater Consolidation
Shipping Points Kuwait and Afghanistan, OCONUS Contingency
Operations, and Information Technology Communications. The FY 2012
ending cash balance was $2,209.8 million, or 8.0 days of cash.
FY 2013 Cash: The DWWCF projects net outlays of $1,351.0 million
primarily due to DLA Supply Chain Management ($1,169.9 million).
Net outlays for DLA SCM are due to projected disbursements
associated with
(1) audit readiness contracts
(2) payments to the Military Services for pipeline stock
associated with Consumable Item Transfers (CIT)
(3) payments to the Navy for the pipeline stock associated
with the logistics re-assignment of the F/A-18 Performance
Based Logistics contract
(4) payments to the Navy for the stock associated with the
Fleet Readiness Centers transfer
(5) correcting a customer price change issue
(6) the return of a portion of Accumulated Operating Results
(AOR) to customers
Also, DLA Supply Chain Management is projecting collections to be
negatively impacted by lower sales. The DLA Energy net outlays are
projected to be $64.5 million. The DWWCF requested $39.1 million in
direct appropriations for Reutilization, Transfer, and Disposal
(RTD) costs and $144.6 million in Overseas Contingency Operations
(OCO) funding. Of the $144.6 million requested for OCO, the DLA
Energy Management requested $80.0 million for Combat Fuel Losses and
Fuel Transportation/ Terminal Operations and the DLA Supply Chain
Management requested $64.6 million for Theater RTD support, Theater
Consolidation Shipping Point Kuwait, OCONUS Contingency Operations,
Kuwait and Afghanistan Distribution Centers, and Information
Technology Communications. The FY 2013 ending cash balance is
projected to be $1,042.5 million, or 4.1 days of cash.
FY 2014: The DWWCF projects net outlays of $582.5 million due to
DLA Supply Chain Management ($767.2 million). This is projected to
be partially offset by DLA Energy (-$137.4 million). Projected net
outlays for DLA SCM are due to
(1) lower sales projections and associated collections
caused by a decreasing customer Operations Tempo
(2) residual disbursements to the Military Services for
CIT stock
(3) residual disbursements for pipeline stock associated
with the logistics re-assignment of the F/A-18 Performance
Based Logistics contract
(4) AOR return to customers
This submission requests $46.6 million in direct appropriations for
RTD costs and a total of $131.7 million in OCO funding. Of the
$131.7 million requested for OCO, the DLA Energy Management is

requesting $85.0 million for Combat Fuel Losses and Fuel
Transportation/Terminal Operations and the DLA Supply Chain
Management is requesting $46.7 million for OCONUS Contingency
Operations, Afghanistan Distribution Center, and Information
Technology Communications. The FY 2014 ending cash balance is
projected to be $638.3 million or 2.2 days of cash.
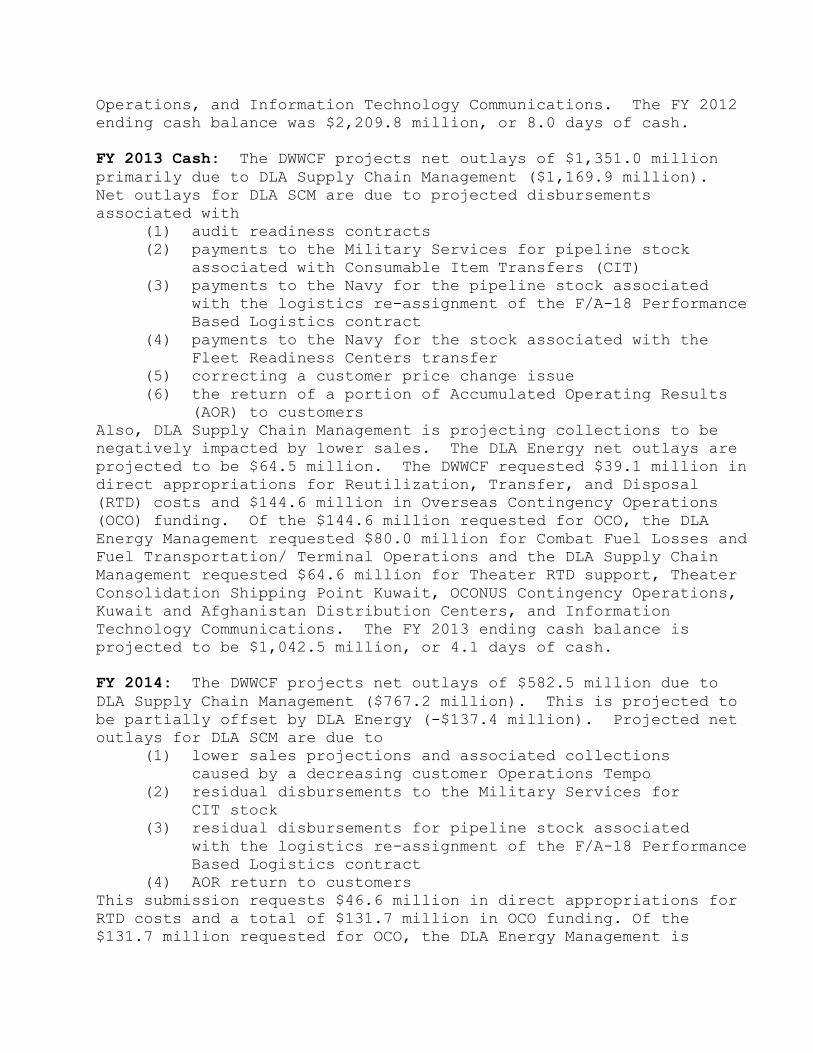
FY 2012 FY 2013 FY 2014
1. New Orders:
a. Orders from DoD Components
Army 15,648.6 14,396.4 14,036.3
Navy 9,716.3 9,835.5 9,684.1
Air Force 14,600.5 15,353.4 14,960.2
Marine Corps 1,363.9 1,130.7 1,098.6
Other 3,906.1 4,177.5 4,816.8
b. Orders from Other Fund Activity Groups 3,163.7 2,806.6 2,807.0
c. Total DoD 48,399.1 47,700.1 47,403.0
d. Other Orders:
Other Federal Agencies 1,646.4 1,807.1 1,768.9
Trust Fund 53.7 34.7 40.7
Exchange Activities 0.0 0.0 0.0
Non Federal Agencies 1,181.7 1,155.2 1,110.1
Foreign Military Sales 944.5 1,667.7 1,603.2
2. Carry-In Orders 3,600.3 3,357.1 3,011.4
3. Total Gross Orders 55,825.7 55,721.9 54,937.3
4. Carry-Out Orders -3,342.9 -2,953.2 -2,862.3
5. Funded Carry Over 53.1 58.2 47.4
6. DRMS Sales Proceeds 84.8 71.0 67.4
7. Total Gross Sales 52,514.5 52,781.5 52,095.0
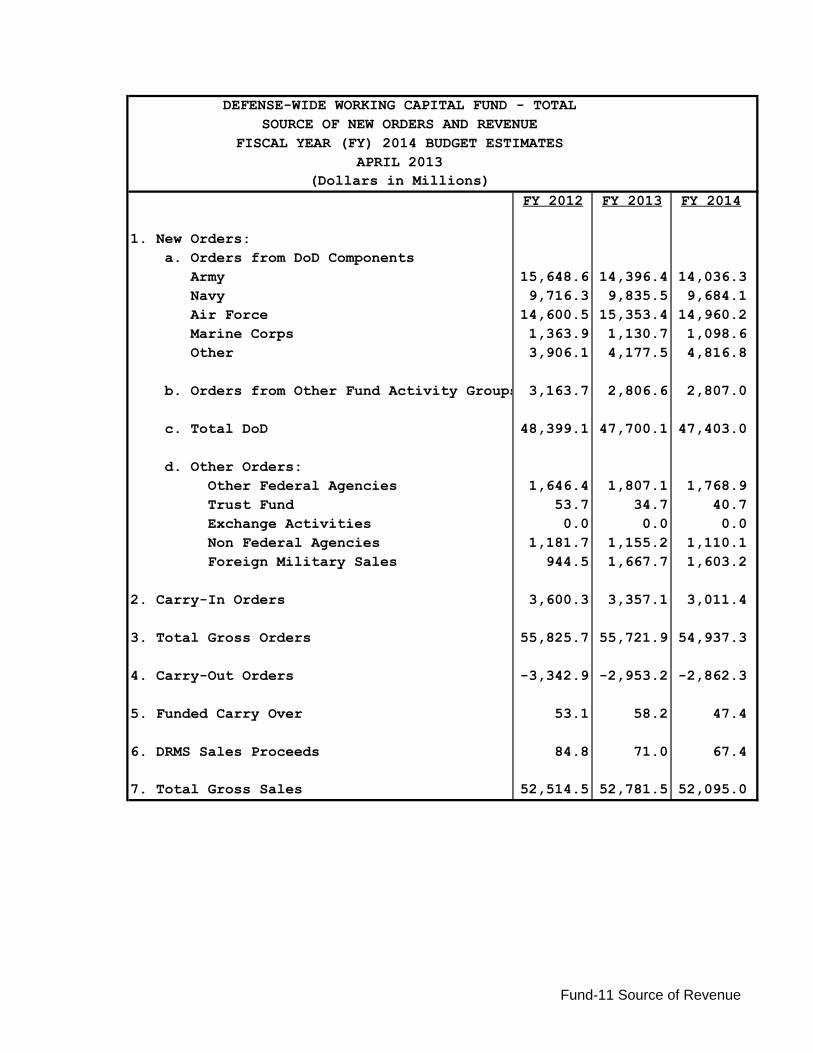
(Dollars in Millions)
DEFENSE-WIDE WORKING CAPITAL FUND - TOTAL
SOURCE OF NEW ORDERS AND REVENUE
FISCAL YEAR (FY) 2014 BUDGET ESTIMATES
APRIL 2013
Fund-11 Source of Revenue
FY 2012 FY 2013 FY 2014
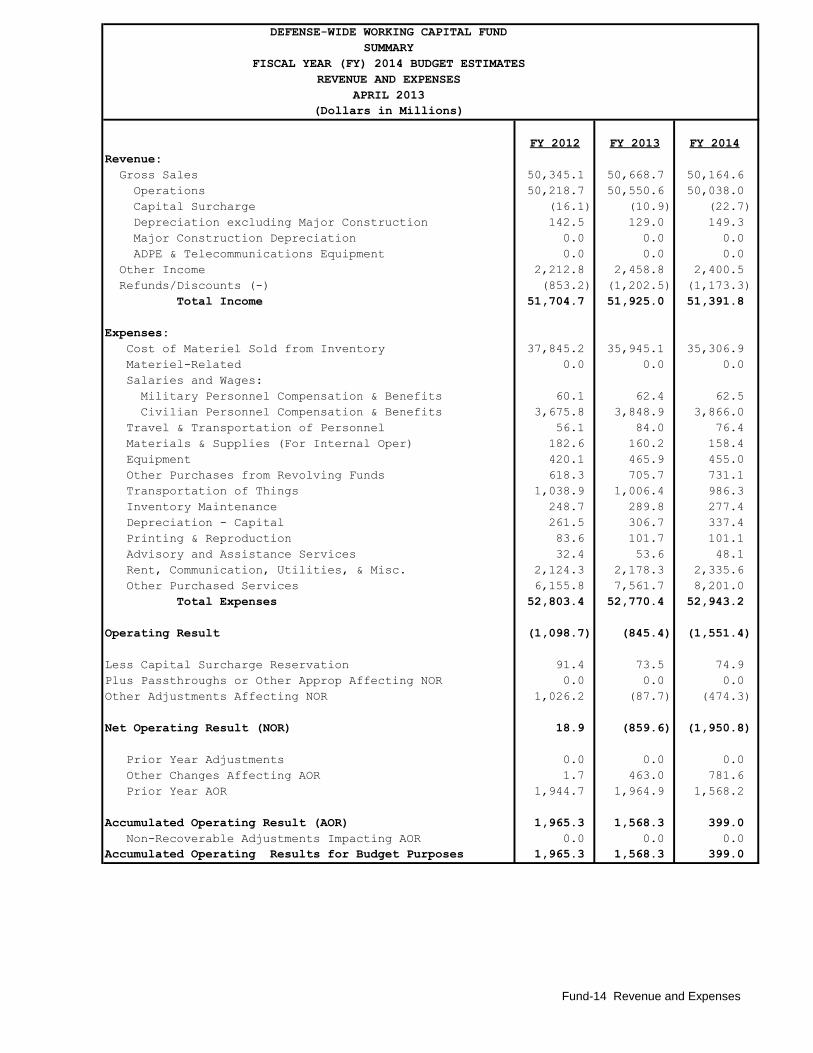
Revenue:
Gross Sales 50,345.1 50,668.7 50,164.6
Operations 50,218.7 50,550.6 50,038.0
Capital Surcharge (16.1) (10.9) (22.7)
Depreciation excluding Major Construction 142.5 129.0 149.3
Major Construction Depreciation 0.0 0.0 0.0
ADPE & Telecommunications Equipment 0.0 0.0 0.0
Other Income 2,212.8 2,458.8 2,400.5
Refunds/Discounts (-) (853.2) (1,202.5) (1,173.3)
Total Income 51,704.7 51,925.0 51,391.8
Expenses:
Cost of Materiel Sold from Inventory 37,845.2 35,945.1 35,306.9
Materiel-Related 0.0 0.0 0.0
Salaries and Wages:
Military Personnel Compensation & Benefits 60.1 62.4 62.5
Civilian Personnel Compensation & Benefits 3,675.8 3,848.9 3,866.0
Travel & Transportation of Personnel 56.1 84.0 76.4
Materials & Supplies (For Internal Oper) 182.6 160.2 158.4
Equipment 420.1 465.9 455.0
Other Purchases from Revolving Funds 618.3 705.7 731.1
Transportation of Things 1,038.9 1,006.4 986.3
Inventory Maintenance 248.7 289.8 277.4
Depreciation - Capital 261.5 306.7 337.4
Printing & Reproduction 83.6 101.7 101.1
Advisory and Assistance Services 32.4 53.6 48.1
Rent, Communication, Utilities, & Misc. 2,124.3 2,178.3 2,335.6
Other Purchased Services 6,155.8 7,561.7 8,201.0
Total Expenses 52,803.4 52,770.4 52,943.2
Operating Result (1,098.7) (845.4) (1,551.4)
Less Capital Surcharge Reservation 91.4 73.5 74.9
Plus Passthroughs or Other Approp Affecting NOR 0.0 0.0 0.0
Other Adjustments Affecting NOR 1,026.2 (87.7) (474.3)
Net Operating Result (NOR) 18.9 (859.6) (1,950.8)
Prior Year Adjustments 0.0 0.0 0.0
Other Changes Affecting AOR 1.7 463.0 781.6
Prior Year AOR 1,944.7 1,964.9 1,568.2
Accumulated Operating Result (AOR) 1,965.3 1,568.3 399.0
Non-Recoverable Adjustments Impacting AOR 0.0 0.0 0.0
Accumulated Operating Results for Budget Purposes 1,965.3 1,568.3 399.0
(Dollars in Millions)
DEFENSE-WIDE WORKING CAPITAL FUND
SUMMARY
FISCAL YEAR (FY) 2014 BUDGET ESTIMATES
REVENUE AND EXPENSES
APRIL 2013
Fund-14 Revenue and Expenses

Defense Finance and Accounting Service
Fiscal Year (FY) 2014 Budget Estimates Defense Working Capital Fund (DWCF)
President’s Budget Submission April 2013
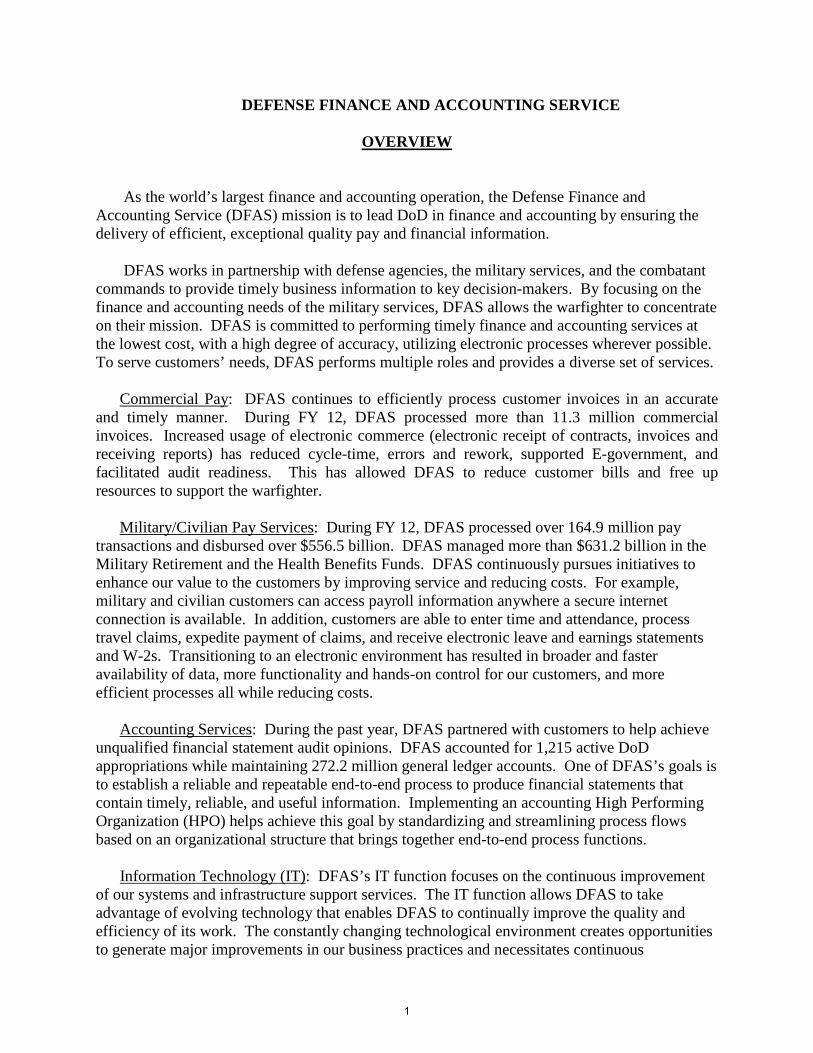
DEFENSE FINANCE AND ACCOUNTING SERVICE
OVERVIEW
As the world’s largest finance and accounting operation, the Defense Finance and Accounting Service (DFAS) mission is to lead DoD in finance and accounting by ensuring the delivery of efficient, exceptional quality pay and financial information.
DFAS works in partnership with defense agencies, the military services, and the combatant commands to provide timely business information to key decision-makers. By focusing on the finance and accounting needs of the military services, DFAS allows the warfighter to concentrate on their mission. DFAS is committed to performing timely finance and accounting services at the lowest cost, with a high degree of accuracy, utilizing electronic processes wherever possible. To serve customers’ needs, DFAS performs multiple roles and provides a diverse set of services.
Commercial Pay: DFAS continues to efficiently process customer invoices in an accurate
and timely manner. During FY 12, DFAS processed more than 11.3 million commercial invoices. Increased usage of electronic commerce (electronic receipt of contracts, invoices and receiving reports) has reduced cycle-time, errors and rework, supported E-government, and facilitated audit readiness. This has allowed DFAS to reduce customer bills and free up resources to support the warfighter.
Military/Civilian Pay Services: During FY 12, DFAS processed over 164.9 million pay transactions and disbursed over $556.5 billion. DFAS managed more than $631.2 billion in the Military Retirement and the Health Benefits Funds. DFAS continuously pursues initiatives to enhance our value to the customers by improving service and reducing costs. For example, military and civilian customers can access payroll information anywhere a secure internet connection is available. In addition, customers are able to enter time and attendance, process travel claims, expedite payment of claims, and receive electronic leave and earnings statements and W-2s. Transitioning to an electronic environment has resulted in broader and faster availability of data, more functionality and hands-on control for our customers, and more efficient processes all while reducing costs.
Accounting Services: During the past year, DFAS partnered with customers to help achieve unqualified financial statement audit opinions. DFAS accounted for 1,215 active DoD appropriations while maintaining 272.2 million general ledger accounts. One of DFAS’s goals is to establish a reliable and repeatable end-to-end process to produce financial statements that contain timely, reliable, and useful information. Implementing an accounting High Performing Organization (HPO) helps achieve this goal by standardizing and streamlining process flows based on an organizational structure that brings together end-to-end process functions.
Information Technology (IT): DFAS’s IT function focuses on the continuous improvement of our systems and infrastructure support services. The IT function allows DFAS to take advantage of evolving technology that enables DFAS to continually improve the quality and efficiency of its work. The constantly changing technological environment creates opportunities to generate major improvements in our business practices and necessitates continuous
1
management focus on IT planning, systems development & maintenance, and daily infrastructure operations.
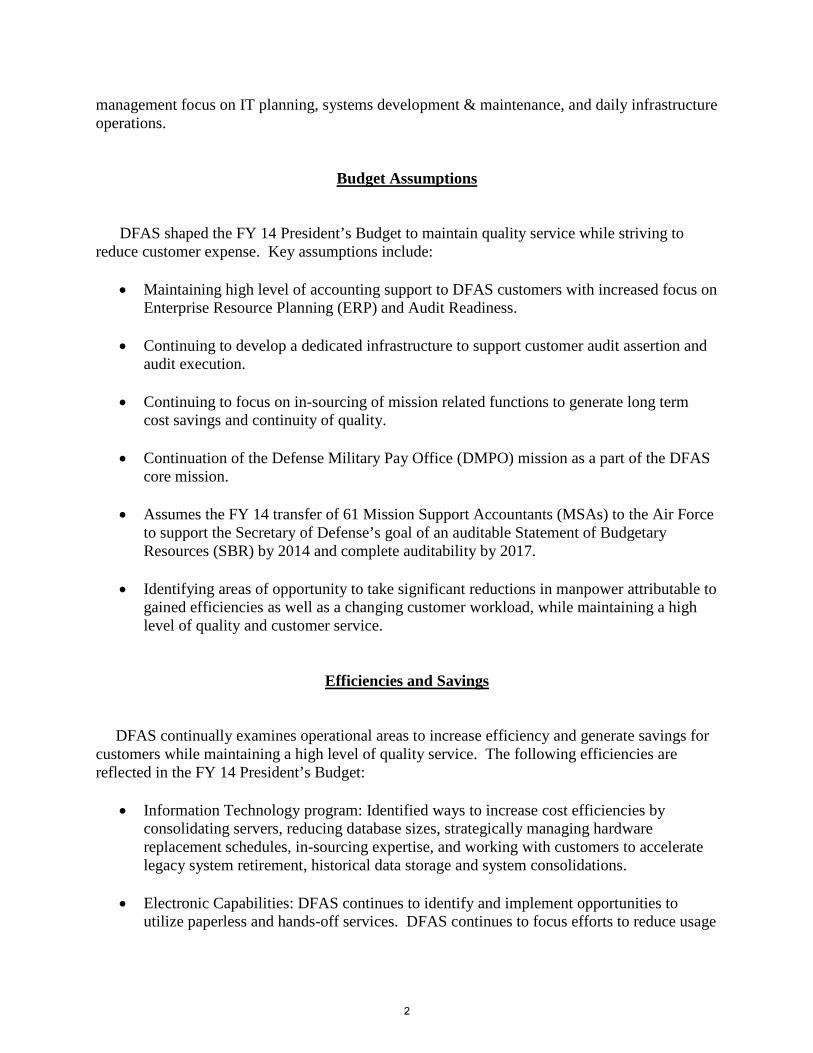
Budget Assumptions DFAS shaped the FY 14 President’s Budget to maintain quality service while striving to
reduce customer expense. Key assumptions include:
• Maintaining high level of accounting support to DFAS customers with increased focus on Enterprise Resource Planning (ERP) and Audit Readiness.
• Continuing to develop a dedicated infrastructure to support customer audit assertion and audit execution.
• Continuing to focus on in-sourcing of mission related functions to generate long term cost savings and continuity of quality.
• Continuation of the Defense Military Pay Office (DMPO) mission as a part of the DFAS core mission.
• Assumes the FY 14 transfer of 61 Mission Support Accountants (MSAs) to the Air Force to support the Secretary of Defense’s goal of an auditable Statement of Budgetary Resources (SBR) by 2014 and complete auditability by 2017.
• Identifying areas of opportunity to take significant reductions in manpower attributable to
gained efficiencies as well as a changing customer workload, while maintaining a high level of quality and customer service.
Efficiencies and Savings
DFAS continually examines operational areas to increase efficiency and generate savings for customers while maintaining a high level of quality service. The following efficiencies are reflected in the FY 14 President’s Budget:
• Information Technology program: Identified ways to increase cost efficiencies by consolidating servers, reducing database sizes, strategically managing hardware replacement schedules, in-sourcing expertise, and working with customers to accelerate legacy system retirement, historical data storage and system consolidations.
• Electronic Capabilities: DFAS continues to identify and implement opportunities to
utilize paperless and hands-off services. DFAS continues to focus efforts to reduce usage
2

of paper statements, vouchers, and invoices that will in turn reduce the cost of postage, printing, and labor.
• Enterprise Resource Planning (ERP) Implementation: Increased usage of customer
specific ERPs has resulted in efficiencies and cost savings to customers across the FYDP. DFAS is working to develop customer specific billing rates which will further reduce costs to customers as usage increases.
Budget Summary
The following table provides the DFAS Defense Working Capital Fund (DWCF) and Capital Purchases Program (CPP) estimates for Obligation Authority (OA) and Personnel data. The obligation authority considers the impact of budget estimates for customer workload as well as various initiatives to reduce cost by increasing efficiency.
FY 12 FY 13 FY 14
Authority Operating $1,388.2 $1,479.8 $1,416.5 Less Depreciation $-63.3 $-35.7 $-39.1 Operating Authority $1,324.9 $1,444.1 $1,377.4 Capital $33.4 $30.9 $33.6 People Civilian FTE’s 12,019 12,294 12,183 Civilian End Strength 12,001 12,375 12,014 Military End Strength 25 29 29
Financial Operations (Dollars in Millions)
3

The DFAS budget reflects a focus on embracing new technology, the use of more efficient systems, and the reduced reliance upon more costly contractor staff. As customers continue to move to electronic commerce for payment processing and with the continued troop drawdown, DFAS anticipates further reductions and cost savings to customers.
DFAS reduced our customer bills in FY 12 by returning a positive AOR in excess of $120M
resulting in a planned loss. In addition, unanticipated reductions in customer workload in FY 12 resulted in driving additional losses requiring rate adjustments to the budget in FY 14.
Due to execution projections for FY 13, continued uncertainty with customer workload, and the current fiscal environment; DFAS projects a moderate risk of a negative NOR in FY 13. As a result, DFAS has adjusted FY 14 rates towards a positive AOR to account for this risk and to ensure proper cash levels.
The DFAS capital program has identified reduced requirements in FY 12 to FY 14 in the area of ADPE and Telecommunications Equipment, decreasing from $21.7M in FY 12 to $17.0M in FY 13 and $15.6M in FY 14, primarily in the unified communications programs.
The software development program, consistent in FY 12 and FY 13, is experiencing growth
in FY 14 due to the Defense MilPay Office (DMO) and the Mechanization of Contract
FY 12 FY 13 FY 14
Capital Baseline $40.8 $30.4 $33.6 Capital Requirement $33.4 $30.9 $33.6
Capital Investment Program (Dollars in Millions)
FY 13 FY 14 Revenue $1,158.4 $1,495.3 $1,469.7 Cost of Operations $1,388.2 $1,479.8 $1,416.5 Operating Results $-229.8 $15.4 $53.2 Adjustments – Other 11.0 0.0 0.0 Net Operating Results (NOR) $-218.9 $15.4 $53.2
Accumulated Operating Results (AOR) – Beginning $177.7 $-41.2 $ -25.7 Adjustments 0.0 0.0 0.0 AOR - Final $-41.2 $-25.7 $27.5
Revenue and Expenses (Dollars in Millions)
FY 12
4
Administrative Services (MOCAS). DMO upgrades to interface tools are required to provide modernization techniques to support our customers’ operational and business practices. MOCAS has become classified as a Target Business Feeder System which had been previously identified as a legacy system with no targeted replacement.
Minor construction improvements have remained consistent with FY 14 projects focusing on
improvements at building entrances in Columbus, mailroom consolidation, and hardened walls in the sub-basement at Cleveland.
5
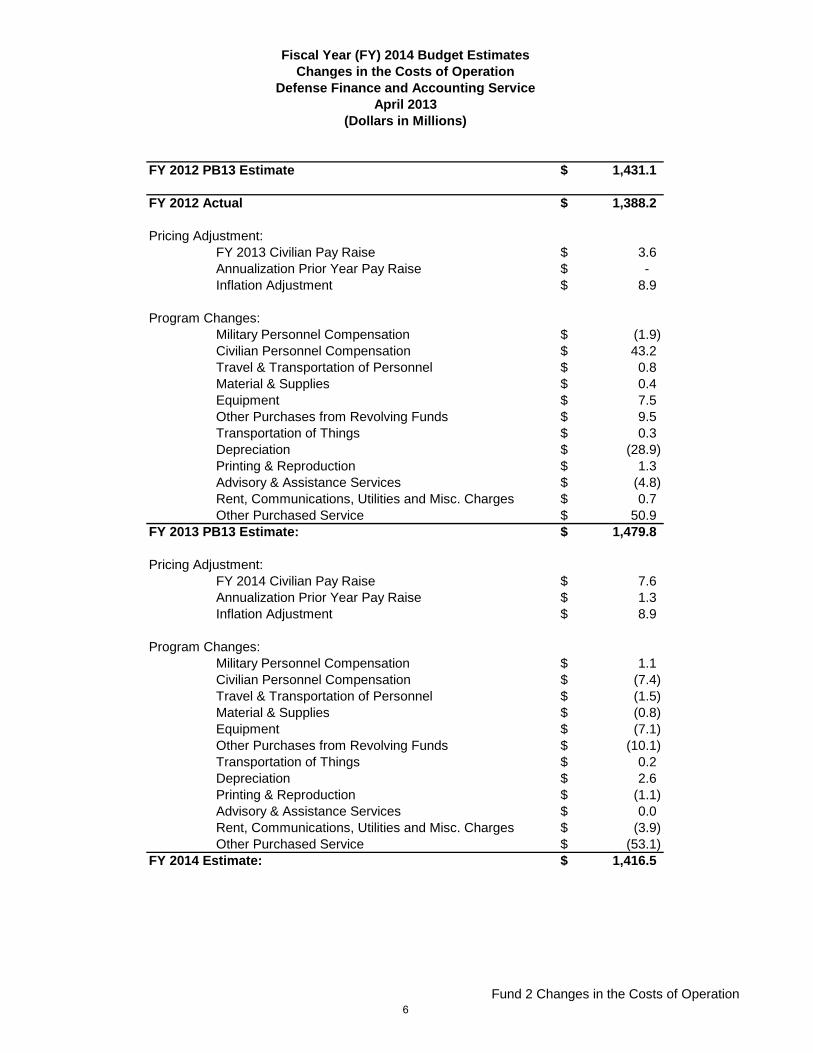
Fund 2 Changes in the Costs of Operation
FY 2012 PB13 Estimate 1,431.1$
FY 2012 Actual 1,388.2$
Pricing Adjustment:FY 2013 Civilian Pay Raise 3.6$ Annualization Prior Year Pay Raise -$ Inflation Adjustment 8.9$
Program Changes:Military Personnel Compensation (1.9)$ Civilian Personnel Compensation 43.2$ Travel & Transportation of Personnel 0.8$ Material & Supplies 0.4$ Equipment 7.5$ Other Purchases from Revolving Funds 9.5$ Transportation of Things 0.3$ Depreciation (28.9)$ Printing & Reproduction 1.3$ Advisory & Assistance Services (4.8)$ Rent, Communications, Utilities and Misc. Charges 0.7$ Other Purchased Service 50.9$
FY 2013 PB13 Estimate: 1,479.8$
Pricing Adjustment:FY 2014 Civilian Pay Raise 7.6$ Annualization Prior Year Pay Raise 1.3$ Inflation Adjustment 8.9$
Program Changes:Military Personnel Compensation 1.1$ Civilian Personnel Compensation (7.4)$ Travel & Transportation of Personnel (1.5)$ Material & Supplies (0.8)$ Equipment (7.1)$ Other Purchases from Revolving Funds (10.1)$ Transportation of Things 0.2$ Depreciation 2.6$ Printing & Reproduction (1.1)$ Advisory & Assistance Services 0.0$ Rent, Communications, Utilities and Misc. Charges (3.9)$ Other Purchased Service (53.1)$
FY 2014 Estimate: 1,416.5$
Fiscal Year (FY) 2014 Budget EstimatesChanges in the Costs of Operation
Defense Finance and Accounting ServiceApril 2013
(Dollars in Millions)
6
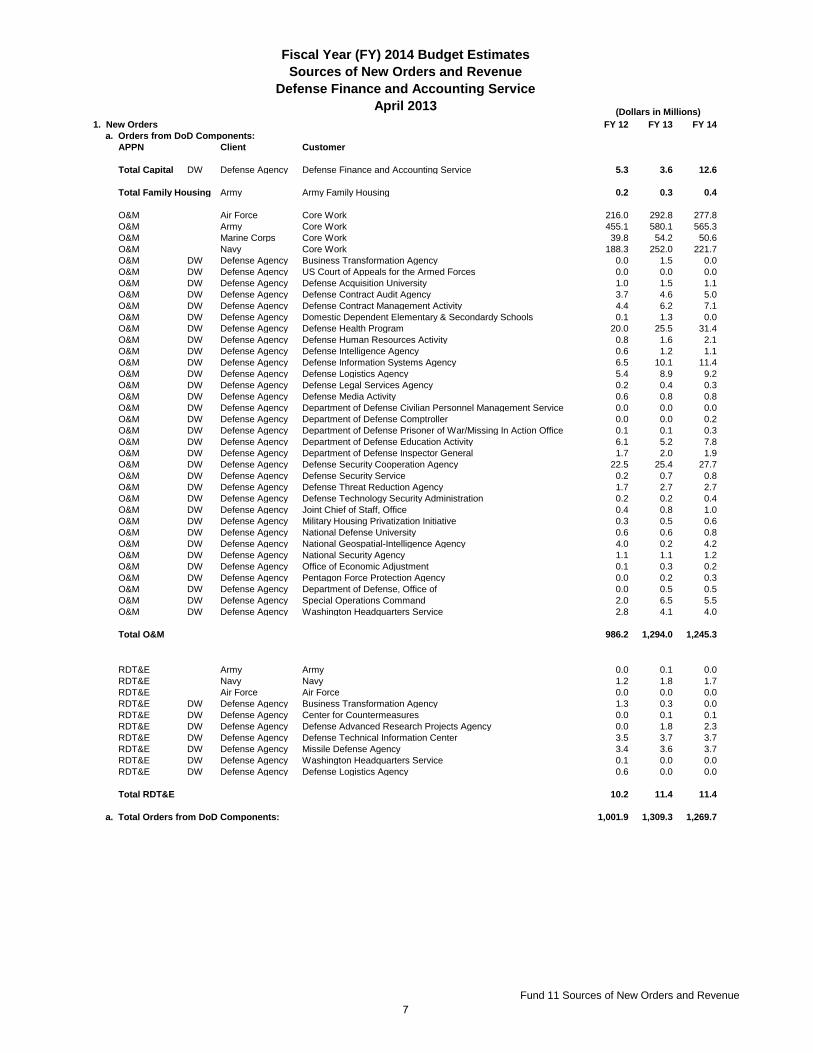
Fiscal Year (FY) 2014 Budget EstimatesSources of New Orders and Revenue
Defense Finance and Accounting ServiceApril 2013
Fund 11 Sources of New Orders and Revenue
1. New Orders FY 12 FY 13 FY 14a. Orders from DoD Components:
APPN Client Customer
Total Capital DW Defense Agency Defense Finance and Accounting Service 5.3 3.6 12.6
Total Family Housing Army Army Family Housing 0.2 0.3 0.4
O&M Air Force Core Work 216.0 292.8 277.8O&M Army Core Work 455.1 580.1 565.3O&M Marine Corps Core Work 39.8 54.2 50.6O&M Navy Core Work 188.3 252.0 221.7O&M DW Defense Agency Business Transformation Agency 0.0 1.5 0.0O&M DW Defense Agency US Court of Appeals for the Armed Forces 0.0 0.0 0.0O&M DW Defense Agency Defense Acquisition University 1.0 1.5 1.1O&M DW Defense Agency Defense Contract Audit Agency 3.7 4.6 5.0O&M DW Defense Agency Defense Contract Management Activity 4.4 6.2 7.1O&M DW Defense Agency Domestic Dependent Elementary & Secondardy Schools 0.1 1.3 0.0O&M DW Defense Agency Defense Health Program 20.0 25.5 31.4O&M DW Defense Agency Defense Human Resources Activity 0.8 1.6 2.1O&M DW Defense Agency Defense Intelligence Agency 0.6 1.2 1.1O&M DW Defense Agency Defense Information Systems Agency 6.5 10.1 11.4O&M DW Defense Agency Defense Logistics Agency 5.4 8.9 9.2O&M DW Defense Agency Defense Legal Services Agency 0.2 0.4 0.3O&M DW Defense Agency Defense Media Activity 0.6 0.8 0.8O&M DW Defense Agency Department of Defense Civilian Personnel Management Service 0.0 0.0 0.0O&M DW Defense Agency Department of Defense Comptroller 0.0 0.0 0.2O&M DW Defense Agency Department of Defense Prisoner of War/Missing In Action Office 0.1 0.1 0.3O&M DW Defense Agency Department of Defense Education Activity 6.1 5.2 7.8O&M DW Defense Agency Department of Defense Inspector General 1.7 2.0 1.9O&M DW Defense Agency Defense Security Cooperation Agency 22.5 25.4 27.7O&M DW Defense Agency Defense Security Service 0.2 0.7 0.8O&M DW Defense Agency Defense Threat Reduction Agency 1.7 2.7 2.7O&M DW Defense Agency Defense Technology Security Administration 0.2 0.2 0.4O&M DW Defense Agency Joint Chief of Staff, Office 0.4 0.8 1.0O&M DW Defense Agency Military Housing Privatization Initiative 0.3 0.5 0.6O&M DW Defense Agency National Defense University 0.6 0.6 0.8O&M DW Defense Agency National Geospatial-Intelligence Agency 4.0 0.2 4.2O&M DW Defense Agency National Security Agency 1.1 1.1 1.2O&M DW Defense Agency Office of Economic Adjustment 0.1 0.3 0.2O&M DW Defense Agency Pentagon Force Protection Agency 0.0 0.2 0.3O&M DW Defense Agency Department of Defense, Office of 0.0 0.5 0.5O&M DW Defense Agency Special Operations Command 2.0 6.5 5.5O&M DW Defense Agency Washington Headquarters Service 2.8 4.1 4.0
Total O&M 986.2 1,294.0 1,245.3
RDT&E Army Army 0.0 0.1 0.0RDT&E Navy Navy 1.2 1.8 1.7RDT&E Air Force Air Force 0.0 0.0 0.0RDT&E DW Defense Agency Business Transformation Agency 1.3 0.3 0.0RDT&E DW Defense Agency Center for Countermeasures 0.0 0.1 0.1RDT&E DW Defense Agency Defense Advanced Research Projects Agency 0.0 1.8 2.3RDT&E DW Defense Agency Defense Technical Information Center 3.5 3.7 3.7RDT&E DW Defense Agency Missile Defense Agency 3.4 3.6 3.7RDT&E DW Defense Agency Washington Headquarters Service 0.1 0.0 0.0RDT&E DW Defense Agency Defense Logistics Agency 0.6 0.0 0.0
Total RDT&E 10.2 11.4 11.4
a. Total Orders from DoD Components: 1,001.9 1,309.3 1,269.7
(Dollars in Millions)
7
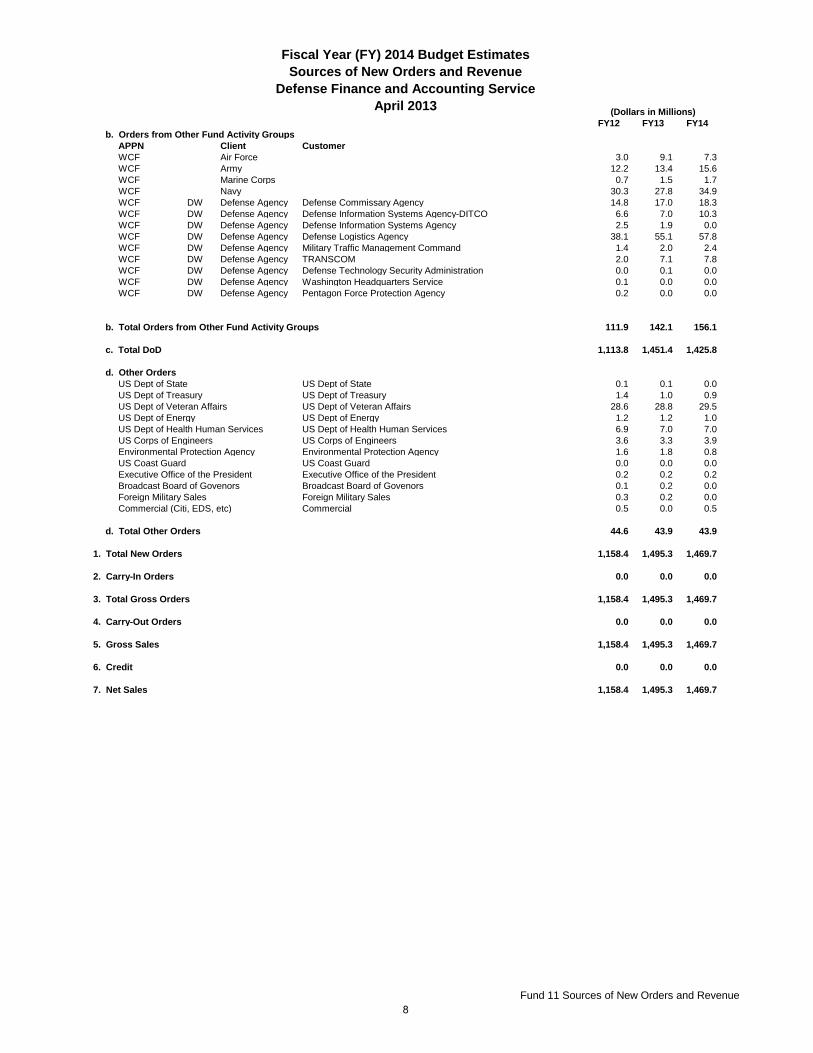
Fiscal Year (FY) 2014 Budget EstimatesSources of New Orders and Revenue
Defense Finance and Accounting ServiceApril 2013
Fund 11 Sources of New Orders and Revenue
FY12 FY13 FY14b. Orders from Other Fund Activity Groups
APPN Client CustomerWCF Air Force 3.0 9.1 7.3WCF Army 12.2 13.4 15.6WCF Marine Corps 0.7 1.5 1.7WCF Navy 30.3 27.8 34.9WCF DW Defense Agency Defense Commissary Agency 14.8 17.0 18.3WCF DW Defense Agency Defense Information Systems Agency-DITCO 6.6 7.0 10.3WCF DW Defense Agency Defense Information Systems Agency 2.5 1.9 0.0WCF DW Defense Agency Defense Logistics Agency 38.1 55.1 57.8WCF DW Defense Agency Military Traffic Management Command 1.4 2.0 2.4WCF DW Defense Agency TRANSCOM 2.0 7.1 7.8WCF DW Defense Agency Defense Technology Security Administration 0.0 0.1 0.0WCF DW Defense Agency Washington Headquarters Service 0.1 0.0 0.0WCF DW Defense Agency Pentagon Force Protection Agency 0.2 0.0 0.0
b. Total Orders from Other Fund Activity Groups 111.9 142.1 156.1
c. Total DoD 1,113.8 1,451.4 1,425.8
d. Other OrdersUS Dept of State US Dept of State 0.1 0.1 0.0US Dept of Treasury US Dept of Treasury 1.4 1.0 0.9US Dept of Veteran Affairs US Dept of Veteran Affairs 28.6 28.8 29.5US Dept of Energy US Dept of Energy 1.2 1.2 1.0US Dept of Health Human Services US Dept of Health Human Services 6.9 7.0 7.0US Corps of Engineers US Corps of Engineers 3.6 3.3 3.9Environmental Protection Agency Environmental Protection Agency 1.6 1.8 0.8US Coast Guard US Coast Guard 0.0 0.0 0.0Executive Office of the President Executive Office of the President 0.2 0.2 0.2Broadcast Board of Govenors Broadcast Board of Govenors 0.1 0.2 0.0Foreign Military Sales Foreign Military Sales 0.3 0.2 0.0Commercial (Citi, EDS, etc) Commercial 0.5 0.0 0.5
d. Total Other Orders 44.6 43.9 43.9
1. Total New Orders 1,158.4 1,495.3 1,469.7
2. Carry-In Orders 0.0 0.0 0.0
3. Total Gross Orders 1,158.4 1,495.3 1,469.7
4. Carry-Out Orders 0.0 0.0 0.0
5. Gross Sales 1,158.4 1,495.3 1,469.7
6. Credit 0.0 0.0 0.0
7. Net Sales 1,158.4 1,495.3 1,469.7
(Dollars in Millions)
8
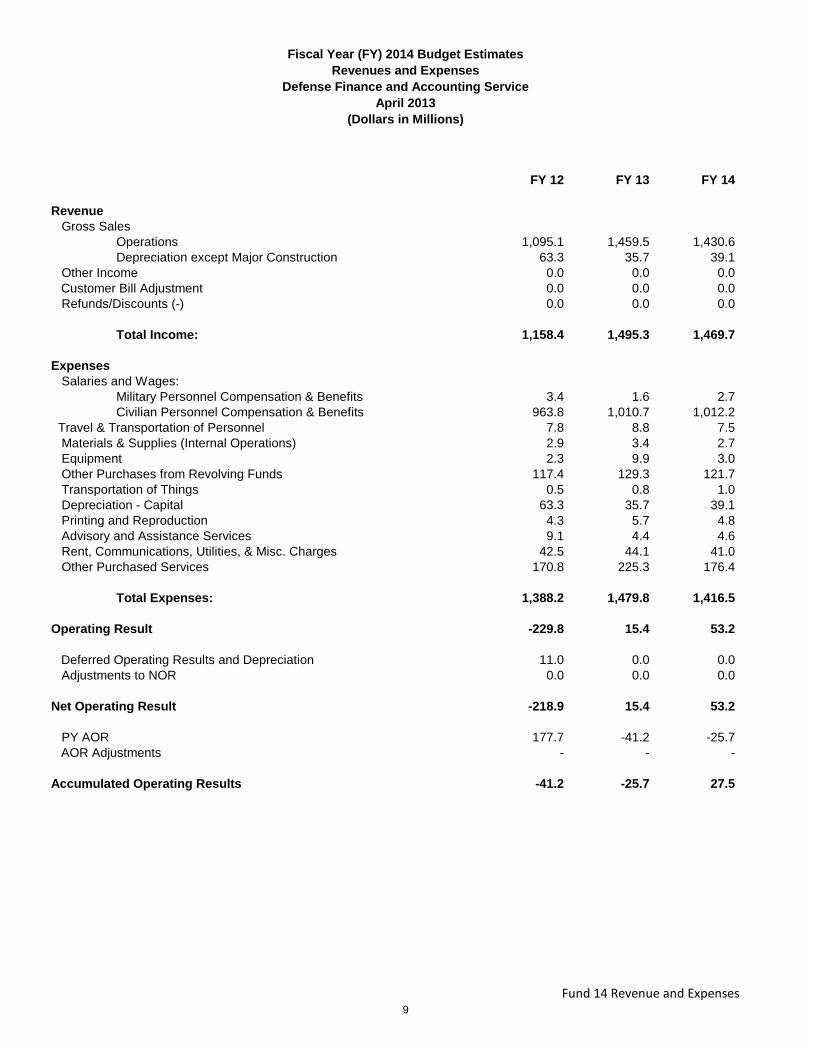
Fiscal Year (FY) 2014 Budget EstimatesRevenues and Expenses
Defense Finance and Accounting Service April 2013
(Dollars in Millions)
Fund 14 Revenue and Expenses
FY 12 FY 13 FY 14
Revenue Gross Sales
Operations 1,095.1 1,459.5 1,430.6Depreciation except Major Construction 63.3 35.7 39.1
Other Income 0.0 0.0 0.0Customer Bill Adjustment 0.0 0.0 0.0
Refunds/Discounts (-) 0.0 0.0 0.0
Total Income: 1,158.4 1,495.3 1,469.7
Expenses Salaries and Wages:
Military Personnel Compensation & Benefits 3.4 1.6 2.7Civilian Personnel Compensation & Benefits 963.8 1,010.7 1,012.2
Travel & Transportation of Personnel 7.8 8.8 7.5 Materials & Supplies (Internal Operations) 2.9 3.4 2.7 Equipment 2.3 9.9 3.0 Other Purchases from Revolving Funds 117.4 129.3 121.7 Transportation of Things 0.5 0.8 1.0 Depreciation - Capital 63.3 35.7 39.1 Printing and Reproduction 4.3 5.7 4.8 Advisory and Assistance Services 9.1 4.4 4.6 Rent, Communications, Utilities, & Misc. Charges 42.5 44.1 41.0 Other Purchased Services 170.8 225.3 176.4
Total Expenses: 1,388.2 1,479.8 1,416.5
Operating Result -229.8 15.4 53.2
Deferred Operating Results and Depreciation 11.0 0.0 0.0 Adjustments to NOR 0.0 0.0 0.0
Net Operating Result -218.9 15.4 53.2
PY AOR 177.7 -41.2 -25.7AOR Adjustments - - -
Accumulated Operating Results -41.2 -25.7 27.5
9

DEFENSE INFORMATION SYSTEMS AGENCY
FISCAL YEAR (FY) 2014
BUDGET ESTIMATES
DEFENSE WORKING CAPITAL FUND
INFORMATION SERVICES
April 2013
DEPARTMENT OF DEFENSE DEFENSE INFORMATION SYSTEMS AGENCY
Defense Working Capital Fund
Information Services Activity Group: Overview
FISCAL YEAR (FY) 2014 BUDGET ESTIMATES
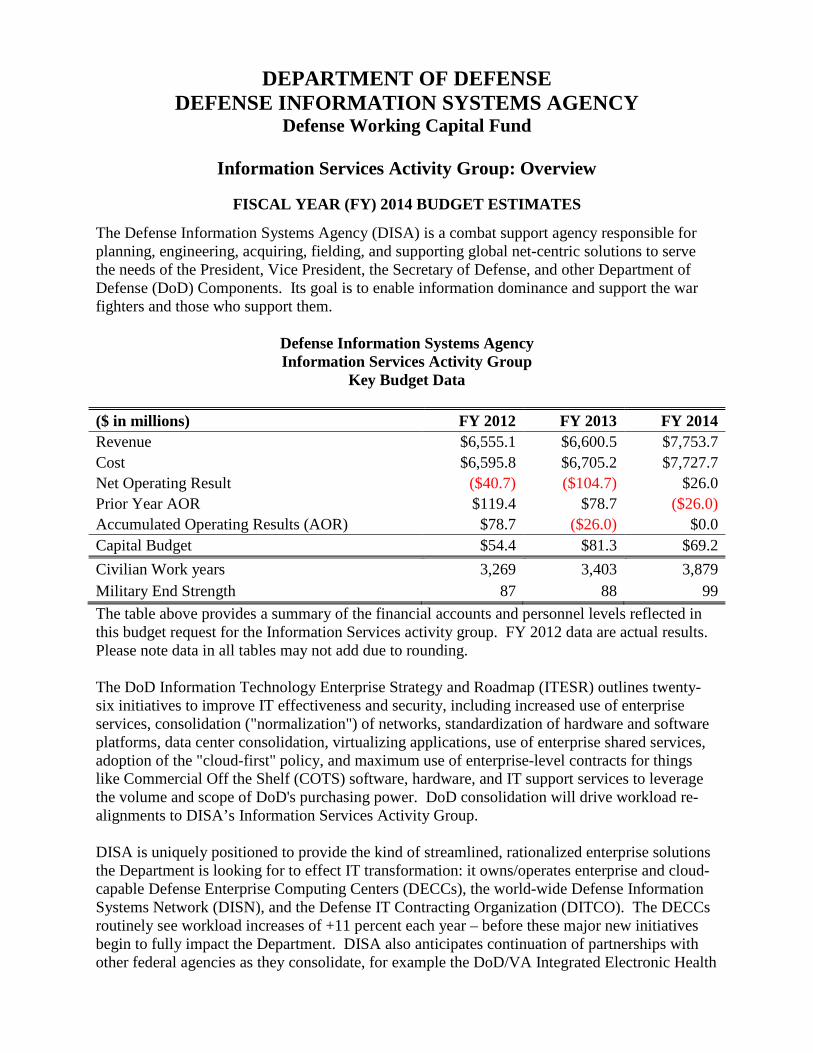
The Defense Information Systems Agency (DISA) is a combat support agency responsible for planning, engineering, acquiring, fielding, and supporting global net-centric solutions to serve the needs of the President, Vice President, the Secretary of Defense, and other Department of Defense (DoD) Components. Its goal is to enable information dominance and support the war fighters and those who support them.
Defense Information Systems Agency Information Services Activity Group
Key Budget Data ($ in millions) FY 2012 FY 2013 FY 2014 Revenue $6,555.1 $6,600.5 $7,753.7 Cost $6,595.8 $6,705.2 $7,727.7 Net Operating Result ($40.7) ($104.7) $26.0 Prior Year AOR $119.4 $78.7 ($26.0) Accumulated Operating Results (AOR) $78.7 ($26.0) $0.0 Capital Budget $54.4 $81.3 $69.2 Civilian Work years 3,269 3,403 3,879 Military End Strength 87 88 99 The table above provides a summary of the financial accounts and personnel levels reflected in this budget request for the Information Services activity group. FY 2012 data are actual results. Please note data in all tables may not add due to rounding. The DoD Information Technology Enterprise Strategy and Roadmap (ITESR) outlines twenty-six initiatives to improve IT effectiveness and security, including increased use of enterprise services, consolidation ("normalization") of networks, standardization of hardware and software platforms, data center consolidation, virtualizing applications, use of enterprise shared services, adoption of the "cloud-first" policy, and maximum use of enterprise-level contracts for things like Commercial Off the Shelf (COTS) software, hardware, and IT support services to leverage the volume and scope of DoD's purchasing power. DoD consolidation will drive workload re-alignments to DISA’s Information Services Activity Group. DISA is uniquely positioned to provide the kind of streamlined, rationalized enterprise solutions the Department is looking for to effect IT transformation: it owns/operates enterprise and cloud-capable Defense Enterprise Computing Centers (DECCs), the world-wide Defense Information Systems Network (DISN), and the Defense IT Contracting Organization (DITCO). The DECCs routinely see workload increases of +11 percent each year – before these major new initiatives begin to fully impact the Department. DISA also anticipates continuation of partnerships with other federal agencies as they consolidate, for example the DoD/VA Integrated Electronic Health

Record (iEHR) agreement to host all medical records in the DECCs, and the recent OMB mandate that DoD provide Public Key Infrastructure (PKI) services to other federal agencies on a reimbursable basis. We continue to move forward on enterprise email for Army, Joint Staff, and others, we have completed an agreement with Army to consolidate optical networks in Europe with other geographical regions to follow, and we have initiated an Enterprise License Agreement (ELA) line of business with a low fee of 0.5 percent. This budget anticipates DoD’s successful implementation of these IT efficiency initiatives by projecting likely workload increases for Defense Enterprise Email (DEE), Defense Enterprise Portal System (DEPS), and cloud computing consistent with federal and departmental goals. Additionally, the DoD CIO has established DISA as the service provider for DoD Cloud Broker Services as well as DoD Mobility. As the DoD Cloud Broker, DISA will establish and maintain comprehensive knowledge of all DoD cloud requirements as well as all commercial and government cloud service providers. DISA will serve as the single DoD point of entry for all DoD cloud services, and maintain/monitor the use, performance, and delivery of all DoD cloud services. As the DoD Mobility service provider, DISA will engineer, test, build-out, and operate eight commercial gateways at DISA DECCs using appropriated resources. The gateways will support both unclassified and classified mobile communications using multiple types of devices. Sustainment costs for Mobile Device Management hardware, the Mobile Application Store, as well as other servers, software licenses, and 24x7 operational support will be recovered on a reimbursable basis through the DWCF. The DISA operates the Information Services Activity Group within the Defense-Wide Working Capital Fund (DWCF). DISA DWCF consists of two components, the Computing Services (CS) and the Telecommunications Services/Enterprise Acquisition Services (TS/EAS) Groups. As our business areas continue to evolve, they are interdependent cost centers of an integrated technical architecture. As a result, this legacy division of the Information Services Activity Group is moving toward full integration into a single business entity pending replacement of legacy systems. For rate setting purposes, DISA assesses profit/loss factors holistically. In this budget, the Information Services activity group achieves zero accumulated profits by allowing accumulated profits and losses in the two main business areas to offset each other, thus minimizing rate fluctuations.
Rate Changes for Major Programs
FY 2014 Rate/Fee Percent Change DISN Subscription Services Share Price $148,753 4.1% Standard Contracting Fee 2.0% 0.0% Enterprise License Agreement Contracting Fee 0.5% 0.0% Computing Services Composite Change - 3.3%
IBM Mainframe - 1.2% Unisys Mainframe - 0.5% Server - 4.8% Storage - -3.1% Other - -0.4%
DEPARTMENT OF DEFENSE DEFENSE INFORMATION SYSTEMS AGENCY
Defense Working Capital Fund Computing Services
FISCAL YEAR (FY) 2014 BUDGET ESTIMATES
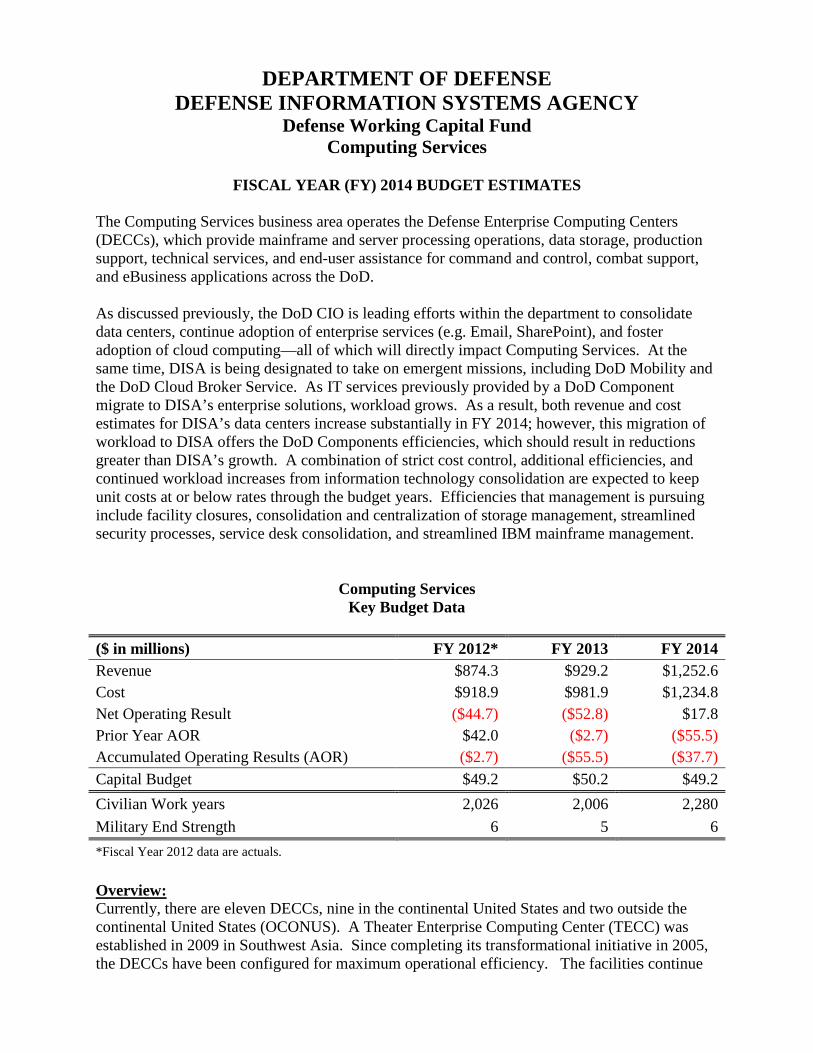
The Computing Services business area operates the Defense Enterprise Computing Centers (DECCs), which provide mainframe and server processing operations, data storage, production support, technical services, and end-user assistance for command and control, combat support, and eBusiness applications across the DoD. As discussed previously, the DoD CIO is leading efforts within the department to consolidate data centers, continue adoption of enterprise services (e.g. Email, SharePoint), and foster adoption of cloud computing—all of which will directly impact Computing Services. At the same time, DISA is being designated to take on emergent missions, including DoD Mobility and the DoD Cloud Broker Service. As IT services previously provided by a DoD Component migrate to DISA’s enterprise solutions, workload grows. As a result, both revenue and cost estimates for DISA’s data centers increase substantially in FY 2014; however, this migration of workload to DISA offers the DoD Components efficiencies, which should result in reductions greater than DISA’s growth. A combination of strict cost control, additional efficiencies, and continued workload increases from information technology consolidation are expected to keep unit costs at or below rates through the budget years. Efficiencies that management is pursuing include facility closures, consolidation and centralization of storage management, streamlined security processes, service desk consolidation, and streamlined IBM mainframe management.
Computing Services Key Budget Data
($ in millions) FY 2012* FY 2013 FY 2014 Revenue $874.3 $929.2 $1,252.6 Cost $918.9 $981.9 $1,234.8 Net Operating Result ($44.7) ($52.8) $17.8 Prior Year AOR $42.0 ($2.7) ($55.5) Accumulated Operating Results (AOR) ($2.7) ($55.5) ($37.7) Capital Budget $49.2 $50.2 $49.2 Civilian Work years 2,026 2,006 2,280 Military End Strength 6 5 6 *Fiscal Year 2012 data are actuals. Overview: Currently, there are eleven DECCs, nine in the continental United States and two outside the continental United States (OCONUS). A Theater Enterprise Computing Center (TECC) was established in 2009 in Southwest Asia. Since completing its transformational initiative in 2005, the DECCs have been configured for maximum operational efficiency. The facilities continue

to be highly accessible and secure data processing centers with dual high-capacity Defense Information Systems Network connectivity and organic defense in depth, resulting in a secure and robust computing infrastructure. They feature automated systems management to control computing resources and to gain economies of scale. Additionally, Computing Services provides “assured computing”, whereby all mission-critical data is continuously available to customers. The Computing Centers employ highly skilled and experienced teams of government and contractor personnel to manage hardware and software applications encompassing a broad spectrum of computing, storage, and communications technologies. The facilities have been designed and are managed to provide secure, available, and interoperable environments for both classified and unclassified processing under military control. Collectively these facilities provide a robust enterprise computing environment to over four million users through:
• Twenty-three mainframes • Over ten thousand servers • 19,500 terabytes of storage • Approximately 450,000 square feet of raised floor • Redundant connectivity to the Defense Information System Network core
The table below displays their locations.
DECC Locations Mechanicsburg, PA Montgomery, AL
Oklahoma City, OK Ogden, UT
Columbus, OH San Antonio, TX
St. Louis, MO Huntsville, AL
Warner Robins, GA OCONUS Pacific OCONUS Europe
OCONUS Bahrain
The Computing Services business area provides information processing for the entire gamut of combat support functions, such as transportation, logistics, maintenance, munitions, engineering, acquisition, finance, medical, and military personnel readiness. The applications hosted on the mainframes and servers enable the armed forces and agencies to:
• Provide for the command and control of operating forces
• Ensure weapon systems availability through management and control of maintenance and supply
• Ensure global force mobility through management and maintenance of the airlift and tanker fleets
• Provide sustainment through resupply and reorder capabilities

• Provide operating forces with information on the location, movement, status, and identity of units, personnel, equipment and supplies
• Manage the information for the medical environment and patient care
• Support DoD business, contracting, financial, payroll and eBusiness applications Following guidance from DoD CIO and Departmental strategies for data center consolidation and cloud computing, DISA plans to evolve the existing data centers’ capabilities to establish the primary foundation for DoD’s Core data centers under the Joint Information Environment (JIE) concept. This budget submission includes alignment of the DECC footprint to the core and regional data center strategy outlined in the DoD Information Technology Enterprise Services Roadmap(ITESR) initial implementation plan. Each of the DISA data centers will meet the standards outlined in the ITESR to include facilities/physical attributes, delivery of enterprise services, security/information assurance attributes, standardized operations/performance, and formation of an Enterprise “Cloud” through an integrated data center infrastructure management capability. Highlights Computing Services provides a variety of enterprise infrastructure services that continue to move the Department’s data processing toward more centralized and standardized solutions. Enterprise infrastructure enables a collaborative environment and trusted information sharing end-to-end that can adapt to rapidly changing conditions with the goal of protected data on protected networks. DoD Enterprise Email, DoD Enterprise Portal Service, Secure Technology Application eXecution, Rapid Access Computing Environment, GIG Content Delivery Service, and Cloud Product Framework are six capabilities that align with this strategic vision and leverage the power of the DECCs on the Global Information Grid. These services are discussed in further detail below: DoD Enterprise Email (DEE) provides enterprise email capability to the end user from any location globally in a secure manner. Computing Services has developed an email service for customers who require seamless collaboration across an entire Department, as well as email capabilities that are both network-enabled and commander-centric. DISA’s design provides redundancy both locally and remotely for all components of the system. The solution is further designed to initially support 1.6 million users and is scalable to support 5 million DoD user personas. The email service features Pods which are the primary core of the service, and Mini-Pods providing coverage to the edge. Pods contain the distributed capacity architecture across seven Continental United States (CONUS) DECCs as well as the two OCONUS DECCs, while the mini-Pods are hosted at non-DECC customer sites. Mini-Pod infrastructure may be deployed as-needed to customer sites to alleviate network distance constraints and bandwidth congestion. Each current Pod allows for approximately 50,000–75,000 business class users and 27,000–30,000 remote users. Mini-Pods have the capacity to service approximately 30,000 users and are scalable to suit customer requirements. Additionally, optional capabilities such as journaling and mobile device support are being added to the portfolio to enhance the DEE service offering. Journaling is a service that permanently saves each message that a specified user sends or receives and may be required for some flag officers or high ranking appointees. DEE includes a Journaling entitlement to allow customers to specify these users. Furthermore, DISA is offering a service to provide mobile support to

customers billed on a per device basis. Currently, this service only supports blackberry devices. Going forward, the Computing Services efforts to support mobile devices will be coordinated with the DoD Mobility service currently being developed for deployment in FY 2014. DoD Enterprise Portal Service (DEPS) DISA is completing development of a Software as a Service (SaaS) offering that will be capable of providing a flexible, web-based collaboration capability to the DoD enterprise. DEPS administrators will create site collections and provide DoD Components the ability to independently create and manage their organization, community and mission-focused sites.
Subscribing organizations will brand their sites and manage their content in order to satisfy mission requirements. The platform will include a suite of MS Office Web applications – the Web browser versions of Word, PowerPoint, Excel and OneNote. DEPS will provide location and device-independent access to documents and will preserve the user interface across end user devices.
Secure Technology Application eXecution (STAX) (formerly known as Platform as a Service) is a commercial-style cloud services model similar to Google App Engine or Microsoft Azure. It provides application runtime environments and data store for Java or Microsoft .Net Web applications. STAX enables the deployment of customer-created or acquired Web services using programming languages, libraries, services, and tools supported by the platform. Unlike Rapid Access Computing Environment (RACE), the customer does not manage or control the underlying OS or middleware, but only has control over the deployed application code and data. This approach enforces a rigorous set of standards that substantially reduce infrastructure delivery and management costs. Since STAX supports the full lifecycle of application development and operations by providing bundled development, test, pre-production, and production environments, it enables agile development and rapid prototyping. STAX supports both new development and the Federal Datacenter Consolidation Initiative (FDCCI). As a new enterprise service STAX will evolve rapidly in response to customer demand to provide additional capabilities such as integration with other enterprise services, large distributed data, and scalability across the NIPRNet (OCONUS) and SIPRNet. Rapid Access Computing Environment (RACE) is an Infrastructure as a Service (IaaS) product supporting development and test for DoD hosted systems. RACE capabilities include the self-service provisioning of processor, storage, networks, and other fundamental computing resources that permit the customer to deploy and run arbitrary software on the provided Operating System (OS). The customer has control over operating systems, storage, and deployed applications. RACE provides accelerated acquisition of virtual computing infrastructure for short or long-term use, using Operations & Maintenance (O&M), Research Development Test & Evaluation (RDT&E) funding, or any credit card accepted by Pay.gov. Specific RACE priorities, driven by customer demand, include broadening the range of test and development server operating environments, improving speed of delivery through further automation, and portal enhancements to fix known bugs, improve functionality, and integrate with key business systems for pricing, service order fulfillment and billing. GIG Content Delivery Service (GCDS) provides the capability to bring web content and applications closer to the end-user, minimizing download times and increasing connection speed
by forward-staging information across the Defense Information Systems Network (DISN). The service currently covers fifty regions and is in twenty five cities and twelve countries. In certain cases, GCDS hardware is hosted at Defense Enterprise Computing Centers. The sustainment costs of the service are included in the DISN subscription share price, as the network performance gains that GCDS is able to deliver benefit DISN customers. Customers requiring customization of their GCDS environment work with Computing Services and are charged on a reimbursable basis for implementation costs, including consulting and advanced engineering services.
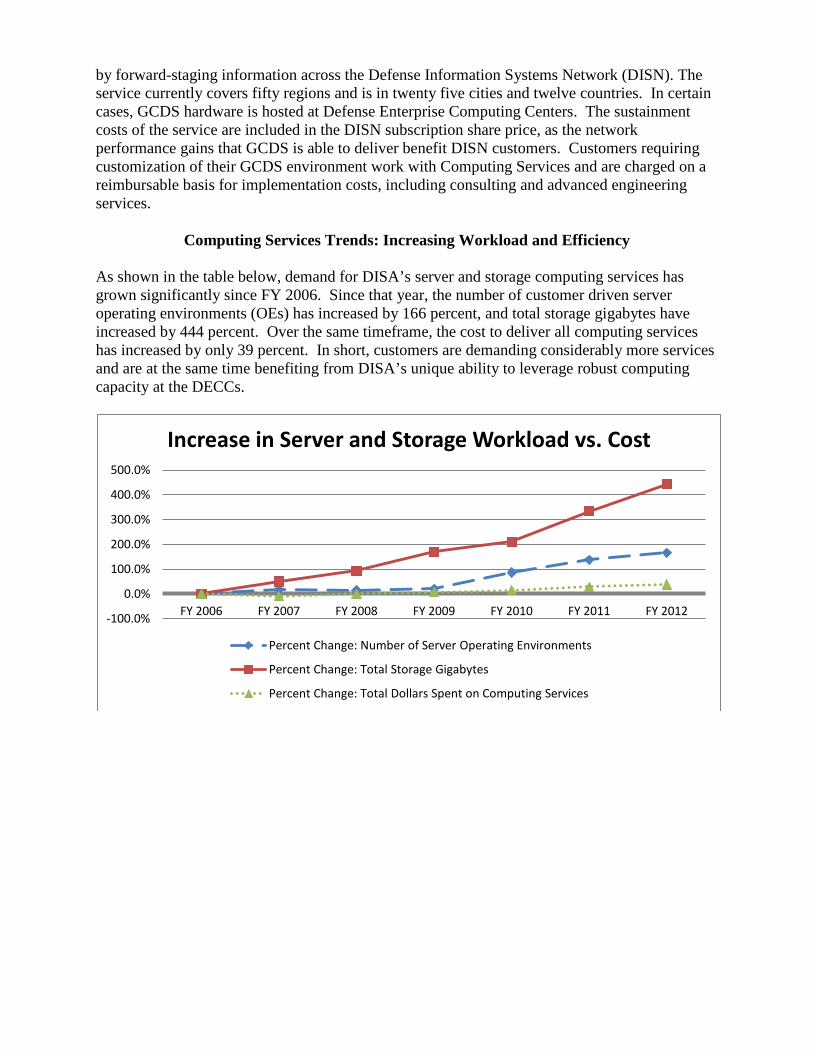
Computing Services Trends: Increasing Workload and Efficiency As shown in the table below, demand for DISA’s server and storage computing services has grown significantly since FY 2006. Since that year, the number of customer driven server operating environments (OEs) has increased by 166 percent, and total storage gigabytes have increased by 444 percent. Over the same timeframe, the cost to deliver all computing services has increased by only 39 percent. In short, customers are demanding considerably more services and are at the same time benefiting from DISA’s unique ability to leverage robust computing capacity at the DECCs.
-100.0%
0.0%
100.0%
200.0%
300.0%
400.0%
500.0%
FY 2006 FY 2007 FY 2008 FY 2009 FY 2010 FY 2011 FY 2012
Increase in Server and Storage Workload vs. Cost
Percent Change: Number of Server Operating Environments
Percent Change: Total Storage Gigabytes
Percent Change: Total Dollars Spent on Computing Services
MAJOR CHANGES BETWEEN FISCAL YEAR ESTIMATES Computing Services Cost of Operations
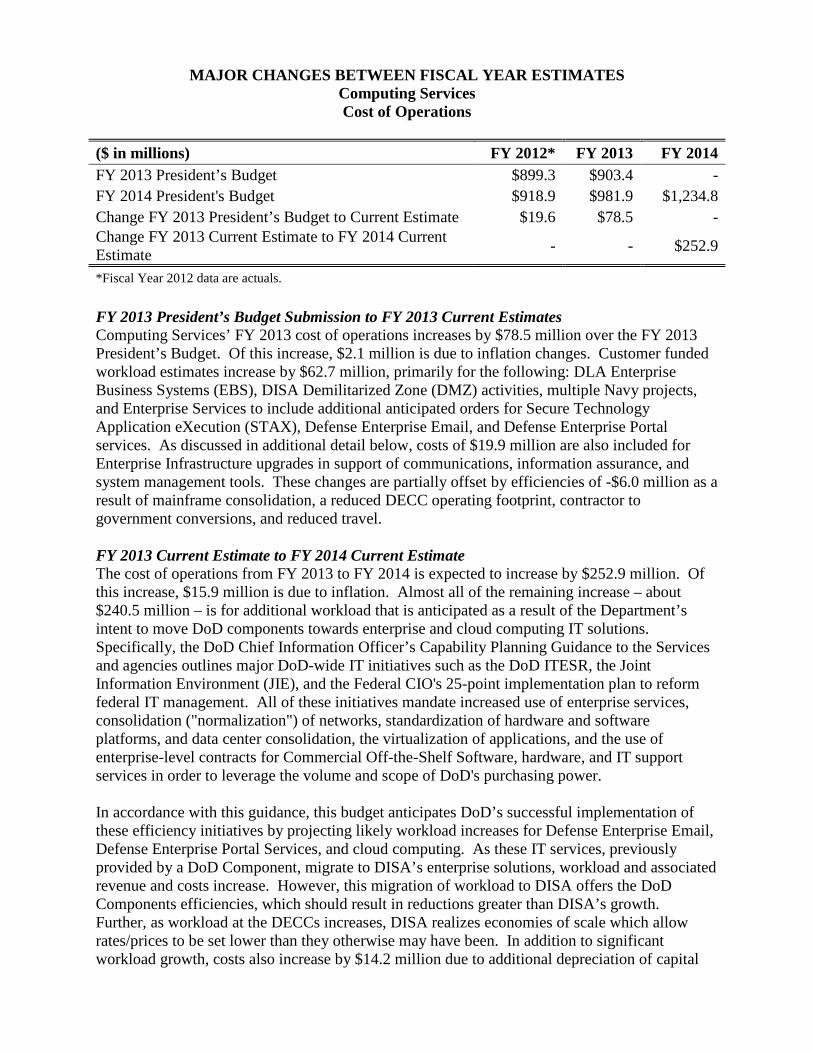
($ in millions) FY 2012* FY 2013 FY 2014 FY 2013 President’s Budget $899.3 $903.4 - FY 2014 President's Budget $918.9 $981.9 $1,234.8 Change FY 2013 President’s Budget to Current Estimate $19.6 $78.5 - Change FY 2013 Current Estimate to FY 2014 Current Estimate - - $252.9
*Fiscal Year 2012 data are actuals. FY 2013 President’s Budget Submission to FY 2013 Current Estimates Computing Services’ FY 2013 cost of operations increases by $78.5 million over the FY 2013 President’s Budget. Of this increase, $2.1 million is due to inflation changes. Customer funded workload estimates increase by $62.7 million, primarily for the following: DLA Enterprise Business Systems (EBS), DISA Demilitarized Zone (DMZ) activities, multiple Navy projects, and Enterprise Services to include additional anticipated orders for Secure Technology Application eXecution (STAX), Defense Enterprise Email, and Defense Enterprise Portal services. As discussed in additional detail below, costs of $19.9 million are also included for Enterprise Infrastructure upgrades in support of communications, information assurance, and system management tools. These changes are partially offset by efficiencies of -$6.0 million as a result of mainframe consolidation, a reduced DECC operating footprint, contractor to government conversions, and reduced travel. FY 2013 Current Estimate to FY 2014 Current Estimate The cost of operations from FY 2013 to FY 2014 is expected to increase by $252.9 million. Of this increase, $15.9 million is due to inflation. Almost all of the remaining increase – about $240.5 million – is for additional workload that is anticipated as a result of the Department’s intent to move DoD components towards enterprise and cloud computing IT solutions. Specifically, the DoD Chief Information Officer’s Capability Planning Guidance to the Services and agencies outlines major DoD-wide IT initiatives such as the DoD ITESR, the Joint Information Environment (JIE), and the Federal CIO's 25-point implementation plan to reform federal IT management. All of these initiatives mandate increased use of enterprise services, consolidation ("normalization") of networks, standardization of hardware and software platforms, and data center consolidation, the virtualization of applications, and the use of enterprise-level contracts for Commercial Off-the-Shelf Software, hardware, and IT support services in order to leverage the volume and scope of DoD's purchasing power. In accordance with this guidance, this budget anticipates DoD’s successful implementation of these efficiency initiatives by projecting likely workload increases for Defense Enterprise Email, Defense Enterprise Portal Services, and cloud computing. As these IT services, previously provided by a DoD Component, migrate to DISA’s enterprise solutions, workload and associated revenue and costs increase. However, this migration of workload to DISA offers the DoD Components efficiencies, which should result in reductions greater than DISA’s growth. Further, as workload at the DECCs increases, DISA realizes economies of scale which allow rates/prices to be set lower than they otherwise may have been. In addition to significant workload growth, costs also increase by $14.2 million due to additional depreciation of capital

assets, the transition to a new storage contract, and a net increase in the number of apprenticeships to develop IT skill-sets needed to continue operations as older employees retire. These costs are entirely offset by efficiencies of $17.6 million as a result of a reduction to the DECC operational footprint, manpower efficiencies, and the implementation of technical best practices across all data centers.
Capital Investment Program Summary: Computing Services ($ in millions) FY 2012* FY 2013 FY 2014 Equipment $34.4 $37.0 $36.0 ADPE and Telecom $0.0 $1.1 $0.5 Software $13.4 $9.5 $10.0 Minor Construction $1.5 $2.7 $2.7 Total Program Authority $49.2 $50.2 $49.2 FY 2013 President's Budget $43.5 $42.6 - Change FY 2013 President’s Budget to Current Estimates - $7.6 - Change FY 2013 Current Estimate to FY 2014 Current Estimate - - ($1.1)
*Fiscal Year 2012 data are actuals. FY 2013 President’s Budget to FY 2013 Current Estimates The FY 2013 current estimate increases $7.6 million over the FY 2013 President’s Budget estimate. Of this increase, $5.4 million is due to increased DECC software requirements to improve network administrators ability to manage server security and provisioning and to better monitor and address performance issues. Additionally, $1.7 million is required to support facilities upgrades for things such as mechanical cooling towers and Uninterruptable Power Supply units. An additional $0.5 million is required due to pricing changes for several minor construction projects. Together, these facility and data center administration tool upgrades will aid in better aligning the DECC footprint with the goals set forth in the DoD Information Technology Enterprise Services Roadmap FY 2013 Current Estimates to FY 2014 Current Estimates There is a slight reduction in anticipated contract authority of $1.1 million from FY 2013 to FY 2014, largely due to a small decrease in projected facility upgrades.
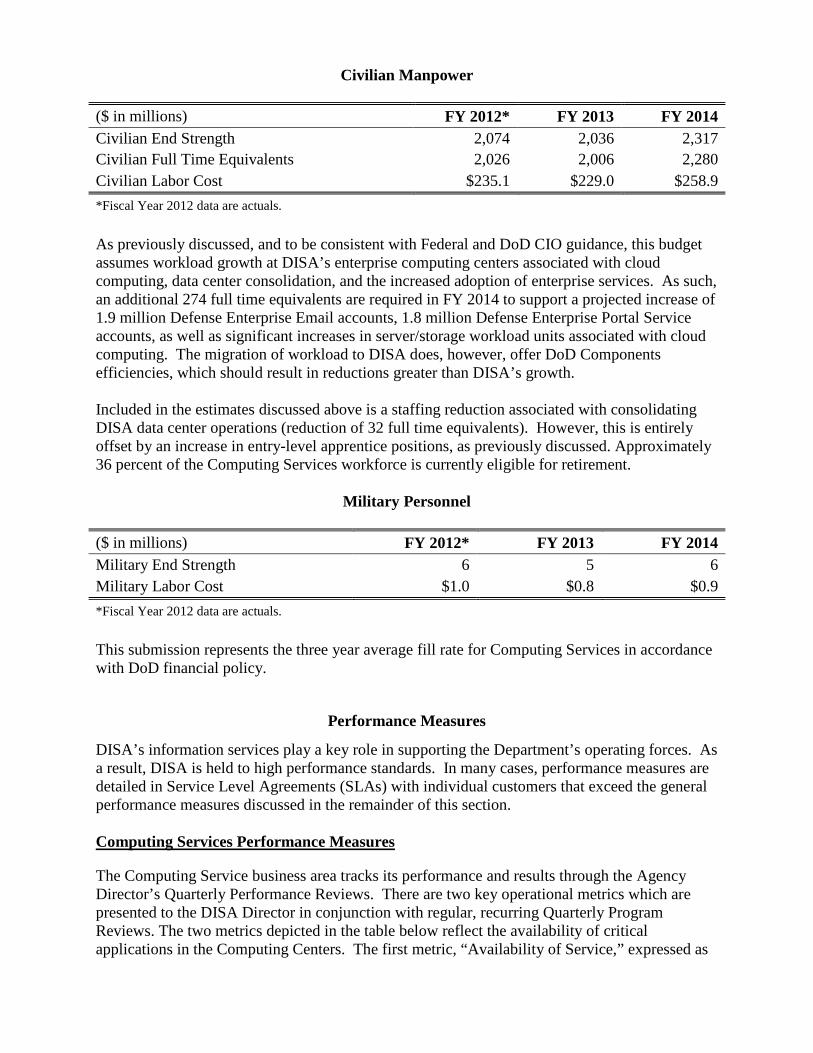
Civilian Manpower ($ in millions) FY 2012* FY 2013 FY 2014 Civilian End Strength 2,074 2,036 2,317 Civilian Full Time Equivalents 2,026 2,006 2,280 Civilian Labor Cost $235.1 $229.0 $258.9 *Fiscal Year 2012 data are actuals. As previously discussed, and to be consistent with Federal and DoD CIO guidance, this budget assumes workload growth at DISA’s enterprise computing centers associated with cloud computing, data center consolidation, and the increased adoption of enterprise services. As such, an additional 274 full time equivalents are required in FY 2014 to support a projected increase of 1.9 million Defense Enterprise Email accounts, 1.8 million Defense Enterprise Portal Service accounts, as well as significant increases in server/storage workload units associated with cloud computing. The migration of workload to DISA does, however, offer DoD Components efficiencies, which should result in reductions greater than DISA’s growth. Included in the estimates discussed above is a staffing reduction associated with consolidating DISA data center operations (reduction of 32 full time equivalents). However, this is entirely offset by an increase in entry-level apprentice positions, as previously discussed. Approximately 36 percent of the Computing Services workforce is currently eligible for retirement.
Military Personnel
($ in millions) FY 2012* FY 2013 FY 2014 Military End Strength 6 5 6 Military Labor Cost $1.0 $0.8 $0.9 *Fiscal Year 2012 data are actuals.
This submission represents the three year average fill rate for Computing Services in accordance with DoD financial policy.
Performance Measures
DISA’s information services play a key role in supporting the Department’s operating forces. As a result, DISA is held to high performance standards. In many cases, performance measures are detailed in Service Level Agreements (SLAs) with individual customers that exceed the general performance measures discussed in the remainder of this section. Computing Services Performance Measures
The Computing Service business area tracks its performance and results through the Agency Director’s Quarterly Performance Reviews. There are two key operational metrics which are presented to the DISA Director in conjunction with regular, recurring Quarterly Program Reviews. The two metrics depicted in the table below reflect the availability of critical applications in the Computing Centers. The first metric, “Availability of Service,” expressed as
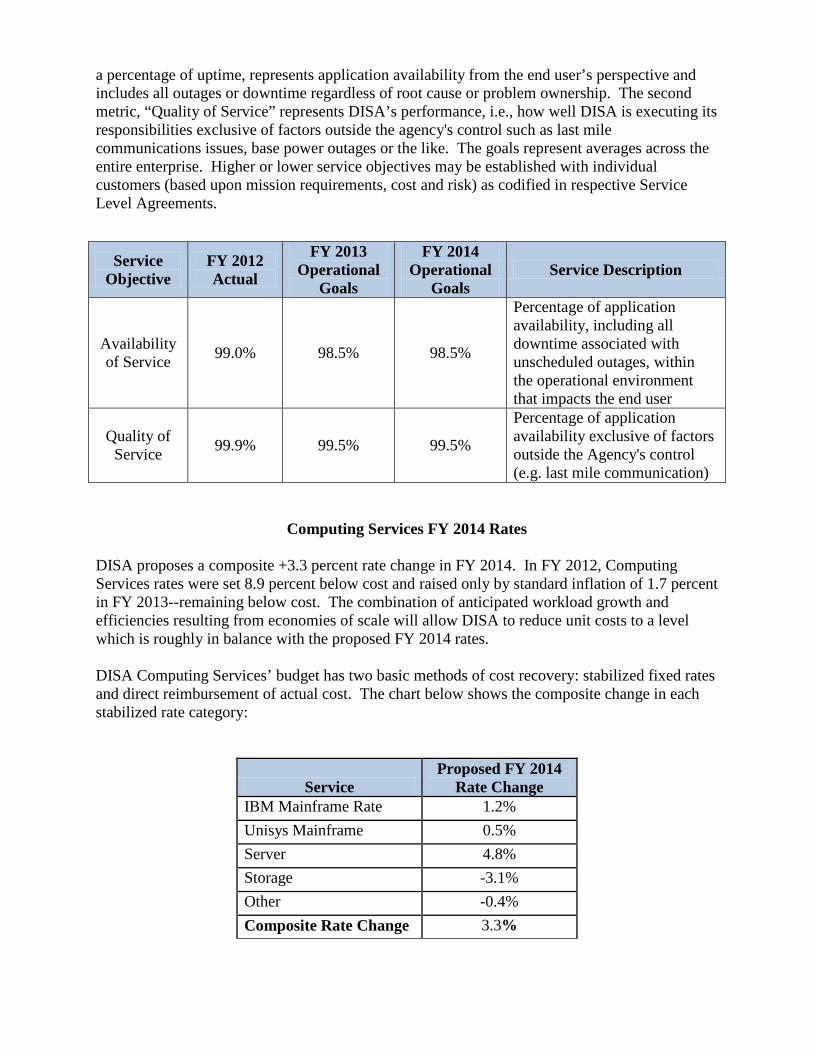
a percentage of uptime, represents application availability from the end user’s perspective and includes all outages or downtime regardless of root cause or problem ownership. The second metric, “Quality of Service” represents DISA’s performance, i.e., how well DISA is executing its responsibilities exclusive of factors outside the agency's control such as last mile communications issues, base power outages or the like. The goals represent averages across the entire enterprise. Higher or lower service objectives may be established with individual customers (based upon mission requirements, cost and risk) as codified in respective Service Level Agreements.
Service Objective
FY 2012 Actual
FY 2013 Operational
Goals
FY 2014 Operational
Goals Service Description
Availability of Service 99.0% 98.5% 98.5%
Percentage of application availability, including all downtime associated with unscheduled outages, within the operational environment that impacts the end user
Quality of Service 99.9% 99.5% 99.5%
Percentage of application availability exclusive of factors outside the Agency's control (e.g. last mile communication)
Computing Services FY 2014 Rates DISA proposes a composite +3.3 percent rate change in FY 2014. In FY 2012, Computing Services rates were set 8.9 percent below cost and raised only by standard inflation of 1.7 percent in FY 2013--remaining below cost. The combination of anticipated workload growth and efficiencies resulting from economies of scale will allow DISA to reduce unit costs to a level which is roughly in balance with the proposed FY 2014 rates. DISA Computing Services’ budget has two basic methods of cost recovery: stabilized fixed rates and direct reimbursement of actual cost. The chart below shows the composite change in each stabilized rate category:
Service Proposed FY 2014
Rate Change IBM Mainframe Rate 1.2% Unisys Mainframe 0.5% Server 4.8% Storage -3.1% Other -0.4% Composite Rate Change 3.3%
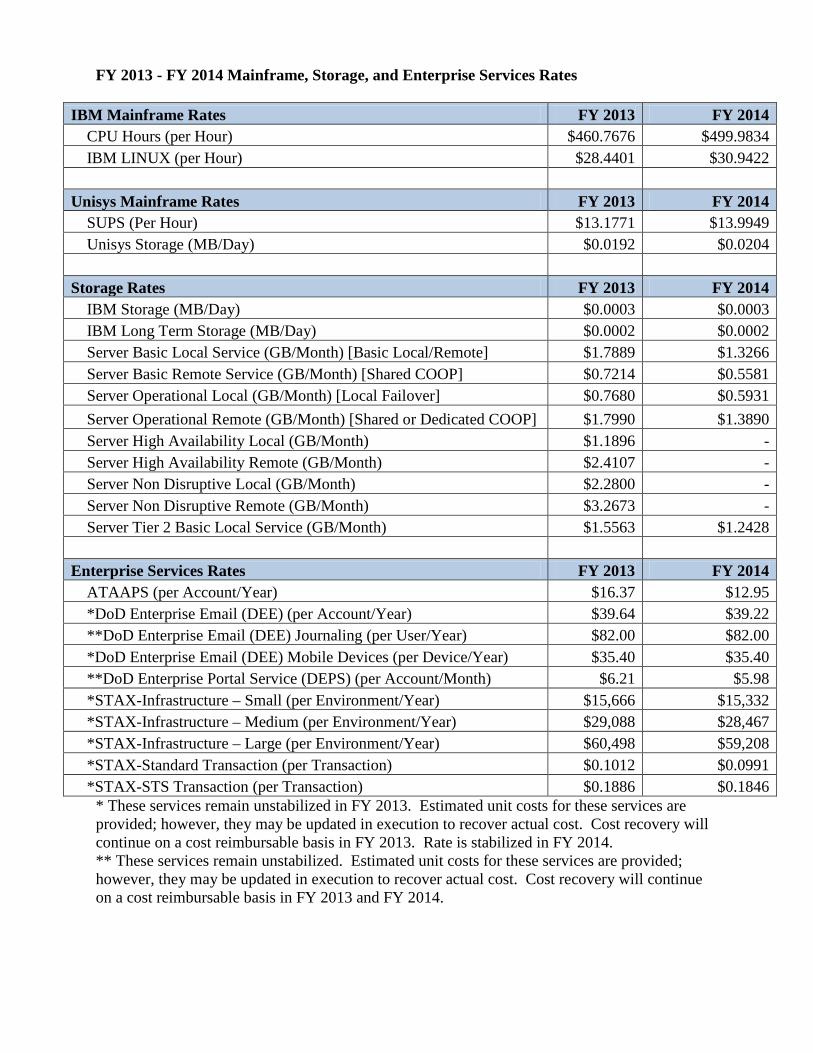
FY 2013 - FY 2014 Mainframe, Storage, and Enterprise Services Rates
IBM Mainframe Rates FY 2013 FY 2014 CPU Hours (per Hour) $460.7676 $499.9834 IBM LINUX (per Hour) $28.4401 $30.9422
Unisys Mainframe Rates FY 2013 FY 2014 SUPS (Per Hour) $13.1771 $13.9949 Unisys Storage (MB/Day) $0.0192 $0.0204
Storage Rates FY 2013 FY 2014 IBM Storage (MB/Day) $0.0003 $0.0003 IBM Long Term Storage (MB/Day) $0.0002 $0.0002 Server Basic Local Service (GB/Month) [Basic Local/Remote] $1.7889 $1.3266 Server Basic Remote Service (GB/Month) [Shared COOP] $0.7214 $0.5581 Server Operational Local (GB/Month) [Local Failover] $0.7680 $0.5931 Server Operational Remote (GB/Month) [Shared or Dedicated COOP] $1.7990 $1.3890 Server High Availability Local (GB/Month) $1.1896 - Server High Availability Remote (GB/Month) $2.4107 - Server Non Disruptive Local (GB/Month) $2.2800 - Server Non Disruptive Remote (GB/Month) $3.2673 - Server Tier 2 Basic Local Service (GB/Month) $1.5563 $1.2428
Enterprise Services Rates FY 2013 FY 2014 ATAAPS (per Account/Year) $16.37 $12.95 *DoD Enterprise Email (DEE) (per Account/Year) $39.64 $39.22 **DoD Enterprise Email (DEE) Journaling (per User/Year) $82.00 $82.00 *DoD Enterprise Email (DEE) Mobile Devices (per Device/Year) $35.40 $35.40 **DoD Enterprise Portal Service (DEPS) (per Account/Month) $6.21 $5.98 *STAX-Infrastructure – Small (per Environment/Year) $15,666 $15,332 *STAX-Infrastructure – Medium (per Environment/Year) $29,088 $28,467 *STAX-Infrastructure – Large (per Environment/Year) $60,498 $59,208 *STAX-Standard Transaction (per Transaction) $0.1012 $0.0991 *STAX-STS Transaction (per Transaction) $0.1886 $0.1846
* These services remain unstabilized in FY 2013. Estimated unit costs for these services are provided; however, they may be updated in execution to recover actual cost. Cost recovery will continue on a cost reimbursable basis in FY 2013. Rate is stabilized in FY 2014. ** These services remain unstabilized. Estimated unit costs for these services are provided; however, they may be updated in execution to recover actual cost. Cost recovery will continue on a cost reimbursable basis in FY 2013 and FY 2014.
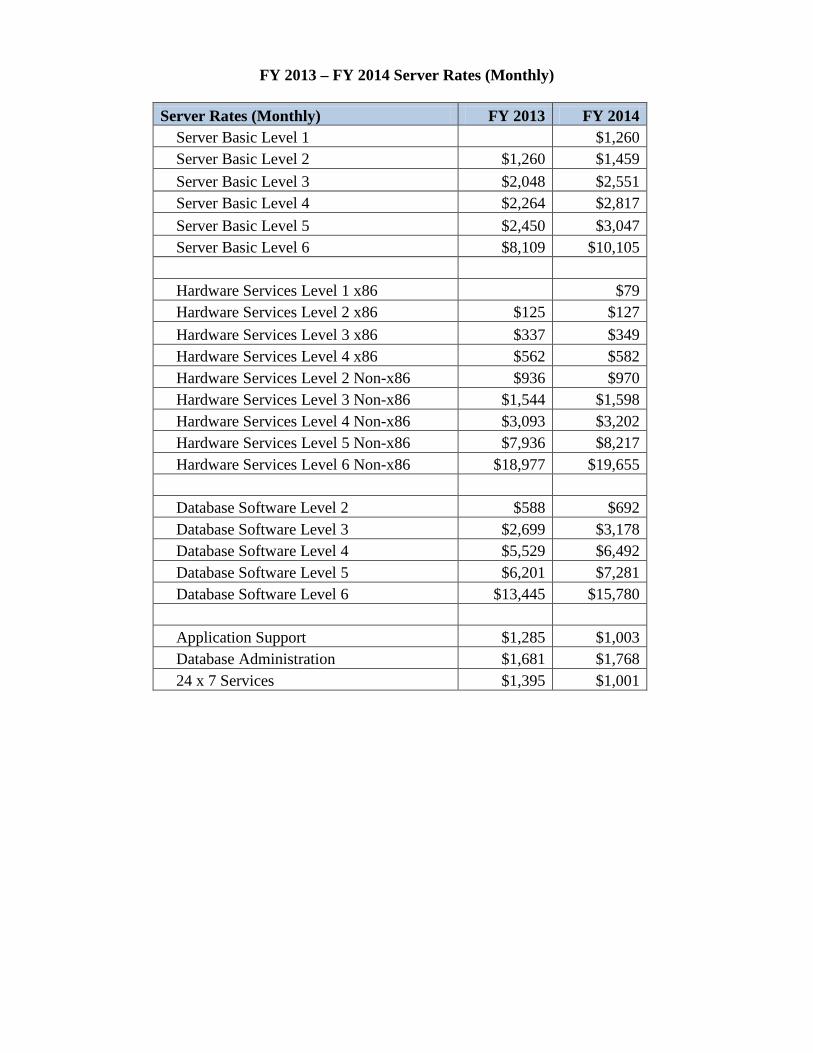
FY 2013 – FY 2014 Server Rates (Monthly)
Server Rates (Monthly) FY 2013 FY 2014 Server Basic Level 1
$1,260
Server Basic Level 2 $1,260 $1,459 Server Basic Level 3 $2,048 $2,551 Server Basic Level 4 $2,264 $2,817 Server Basic Level 5 $2,450 $3,047 Server Basic Level 6 $8,109 $10,105 Hardware Services Level 1 x86
$79
Hardware Services Level 2 x86 $125 $127 Hardware Services Level 3 x86 $337 $349 Hardware Services Level 4 x86 $562 $582 Hardware Services Level 2 Non-x86 $936 $970 Hardware Services Level 3 Non-x86 $1,544 $1,598 Hardware Services Level 4 Non-x86 $3,093 $3,202 Hardware Services Level 5 Non-x86 $7,936 $8,217 Hardware Services Level 6 Non-x86 $18,977 $19,655
Database Software Level 2 $588 $692 Database Software Level 3 $2,699 $3,178 Database Software Level 4 $5,529 $6,492 Database Software Level 5 $6,201 $7,281 Database Software Level 6 $13,445 $15,780
Application Support $1,285 $1,003 Database Administration $1,681 $1,768 24 x 7 Services $1,395 $1,001
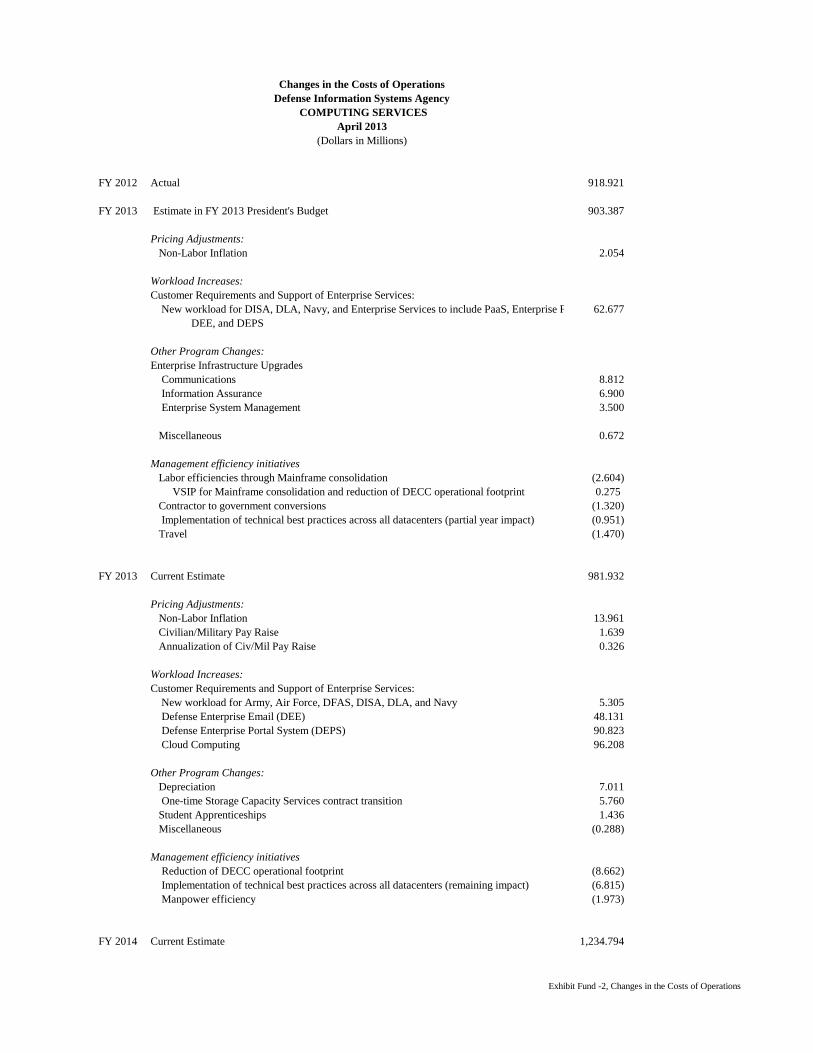
FY 2012 Actual 918.921
FY 2013 Estimate in FY 2013 President's Budget 903.387
Pricing Adjustments:
Non-Labor Inflation 2.054
Workload Increases:
Customer Requirements and Support of Enterprise Services:
New workload for DISA, DLA, Navy, and Enterprise Services to include PaaS, Enterprise File Sharing,62.677
DEE, and DEPS
Other Program Changes:
Enterprise Infrastructure Upgrades
Communications 8.812
Information Assurance 6.900
Enterprise System Management 3.500
Miscellaneous 0.672
Management efficiency initiatives
Labor efficiencies through Mainframe consolidation (2.604)
VSIP for Mainframe consolidation and reduction of DECC operational footprint 0.275
Contractor to government conversions (1.320)
Implementation of technical best practices across all datacenters (partial year impact) (0.951)
Travel (1.470)
FY 2013 Current Estimate 981.932
Pricing Adjustments:
Non-Labor Inflation 13.961
Civilian/Military Pay Raise 1.639
Annualization of Civ/Mil Pay Raise 0.326
Workload Increases:
Customer Requirements and Support of Enterprise Services:
New workload for Army, Air Force, DFAS, DISA, DLA, and Navy 5.305
Defense Enterprise Email (DEE) 48.131
Defense Enterprise Portal System (DEPS) 90.823
Cloud Computing 96.208
Other Program Changes:
Depreciation 7.011
One-time Storage Capacity Services contract transition 5.760
Student Apprenticeships 1.436
Miscellaneous (0.288)
Management efficiency initiatives
Reduction of DECC operational footprint (8.662)
Implementation of technical best practices across all datacenters (remaining impact) (6.815)
Manpower efficiency (1.973)
FY 2014 Current Estimate 1,234.794
Changes in the Costs of Operations
Defense Information Systems Agency
COMPUTING SERVICES
April 2013
(Dollars in Millions)
Exhibit Fund -2, Changes in the Costs of Operations
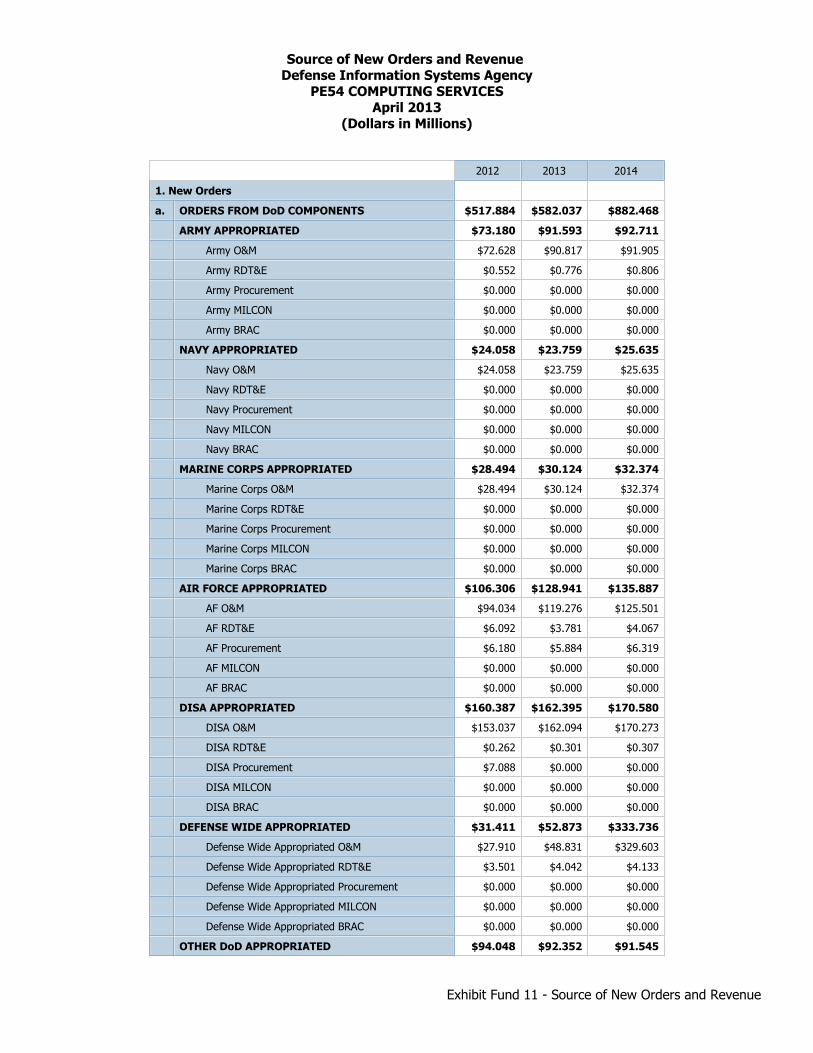
Source of New Orders and Revenue Defense Information Systems Agency
PE54 COMPUTING SERVICESApril 2013
(Dollars in Millions)
2012 2013 2014
1. New Orders
a. ORDERS FROM DoD COMPONENTS $517.884 $582.037 $882.468
ARMY APPROPRIATED $73.180 $91.593 $92.711
Army O&M $72.628 $90.817 $91.905
Army RDT&E $0.552 $0.776 $0.806
Army Procurement $0.000 $0.000 $0.000
Army MILCON $0.000 $0.000 $0.000
Army BRAC $0.000 $0.000 $0.000
NAVY APPROPRIATED $24.058 $23.759 $25.635
Navy O&M $24.058 $23.759 $25.635
Navy RDT&E $0.000 $0.000 $0.000
Navy Procurement $0.000 $0.000 $0.000
Navy MILCON $0.000 $0.000 $0.000
Navy BRAC $0.000 $0.000 $0.000
MARINE CORPS APPROPRIATED $28.494 $30.124 $32.374
Marine Corps O&M $28.494 $30.124 $32.374
Marine Corps RDT&E $0.000 $0.000 $0.000
Marine Corps Procurement $0.000 $0.000 $0.000
Marine Corps MILCON $0.000 $0.000 $0.000
Marine Corps BRAC $0.000 $0.000 $0.000
AIR FORCE APPROPRIATED $106.306 $128.941 $135.887
AF O&M $94.034 $119.276 $125.501
AF RDT&E $6.092 $3.781 $4.067
AF Procurement $6.180 $5.884 $6.319
AF MILCON $0.000 $0.000 $0.000
AF BRAC $0.000 $0.000 $0.000
DISA APPROPRIATED $160.387 $162.395 $170.580
DISA O&M $153.037 $162.094 $170.273
DISA RDT&E $0.262 $0.301 $0.307
DISA Procurement $7.088 $0.000 $0.000
DISA MILCON $0.000 $0.000 $0.000
DISA BRAC $0.000 $0.000 $0.000
DEFENSE WIDE APPROPRIATED $31.411 $52.873 $333.736
Defense Wide Appropriated O&M $27.910 $48.831 $329.603
Defense Wide Appropriated RDT&E $3.501 $4.042 $4.133
Defense Wide Appropriated Procurement $0.000 $0.000 $0.000
Defense Wide Appropriated MILCON $0.000 $0.000 $0.000
Defense Wide Appropriated BRAC $0.000 $0.000 $0.000
OTHER DoD APPROPRIATED $94.048 $92.352 $91.545
Exhibit Fund 11 - Source of New Orders and Revenue

Source of New Orders and Revenue Defense Information Systems Agency
PE54 COMPUTING SERVICESApril 2013
(Dollars in Millions)
2012 2013 2014
Other DoD Appropriated O&M $90.370 $89.061 $88.116
Other DoD Appropriated RDT&E $3.647 $3.258 $3.401
Other DoD Appropriated Procurement $0.031 $0.033 $0.028
Other DoD Appropriated MILCON $0.000 $0.000 $0.000
Other DoD Appropriated BRAC $0.000 $0.000 $0.000
b. ORDERS FROM DWCF/REVOLVING FUNDS $352.078 $344.051 $367.018
ARMY - WCF $1.717 $1.022 $1.080
Army Industrial Operations $1.717 $1.022 $1.080
NAVY - WCF $14.228 $12.949 $13.664
Navy Depot Maintenance $0.000 $0.000 $0.000
Navy Base Support $0.000 $0.000 $0.000
Navy Supply Management $13.638 $12.295 $12.982
Marine Corps Supply $0.000 $0.000 $0.000
Marine Corps Depot Maintenance $0.000 $0.000 $0.000
Other Navy Activity Groups $0.590 $0.654 $0.682
AIR FORCE - WCF $37.121 $36.227 $38.786
Consolidated Sustainment Activity Group (CSAG) $17.043 $17.228 $18.649
U.S. Transportation Command (TRANSCOM) $20.078 $18.999 $20.137
DEFENSE WIDE WCF $297.517 $292.662 $312.283
DISA Telecomm Svcs/Ent Acquisition Svcs (TS/EAS) $28.183 $27.075 $29.345
DISA Computing Services (CSD) $0.000 $0.000 $0.000
Defense Finance and Accounting Service (DFAS) $97.003 $100.467 $109.593
DLA Energy Management $0.000 $0.000 $0.000
DLA Defense Automated Printing Services (DAPS) $0.005 $0.012 $0.014
DLA Supply Chain Management $172.326 $165.108 $173.331
DEFENSE COMMISSARY AGENCY (DECA) $0.000 $0.000 $0.000
DECA Operations $0.000 $0.000 $0.000
DECA Resale $0.000 $0.000 $0.000
OTHER - WORKING CAPITAL $1.495 $1.191 $1.205
OTHER REVOLVING FUNDS $0.000 $0.000 $0.000
Corps of Engineers $0.000 $0.000 $0.000
National Defense Stockpile Transaction Fund $0.000 $0.000 $0.000
Pentagon Reservation Maintenance Revolving Fund $0.000 $0.000 $0.000
PRMRF/BMF $0.000 $0.000 $0.000
c. TOTAL DoD ORDERS $869.962 $926.088 $1,249.486
d. OTHER ORDERS $4.293 $3.080 $3.114
Exhibit Fund 11 - Source of New Orders and Revenue
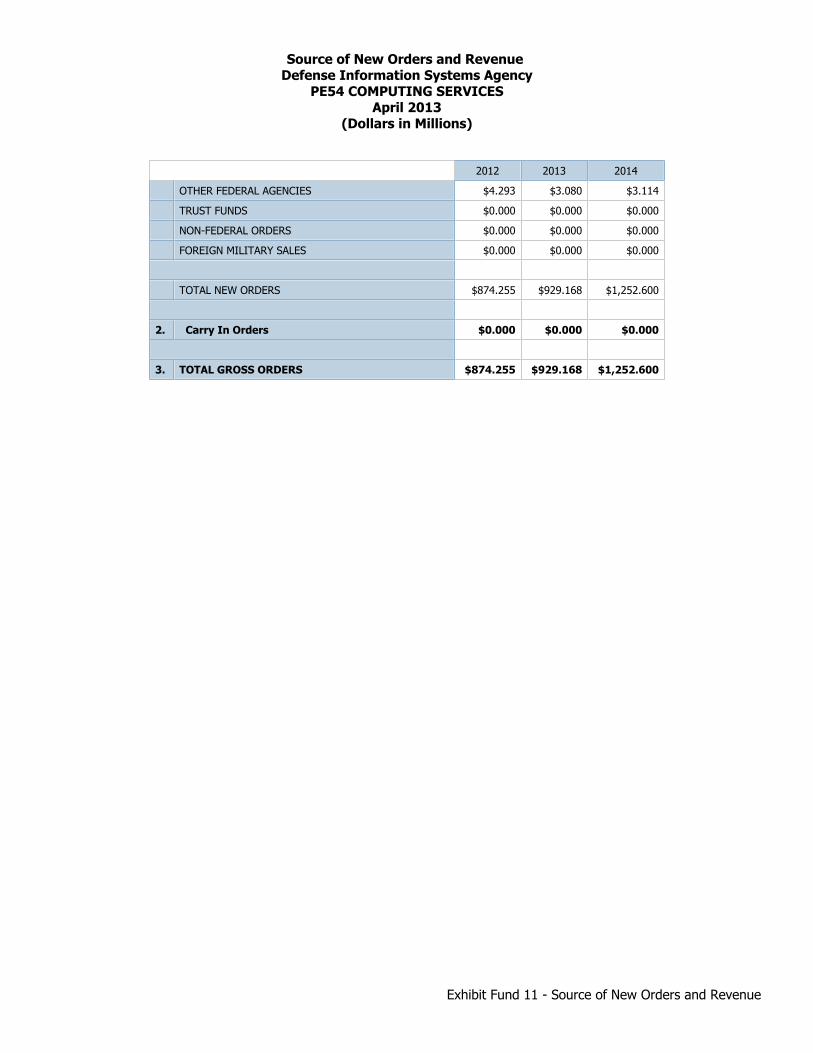
Source of New Orders and Revenue Defense Information Systems Agency
PE54 COMPUTING SERVICESApril 2013
(Dollars in Millions)
2012 2013 2014
OTHER FEDERAL AGENCIES $4.293 $3.080 $3.114
TRUST FUNDS $0.000 $0.000 $0.000
NON-FEDERAL ORDERS $0.000 $0.000 $0.000
FOREIGN MILITARY SALES $0.000 $0.000 $0.000
TOTAL NEW ORDERS $874.255 $929.168 $1,252.600
2. Carry In Orders $0.000 $0.000 $0.000
3. TOTAL GROSS ORDERS $874.255 $929.168 $1,252.600
Exhibit Fund 11 - Source of New Orders and Revenue
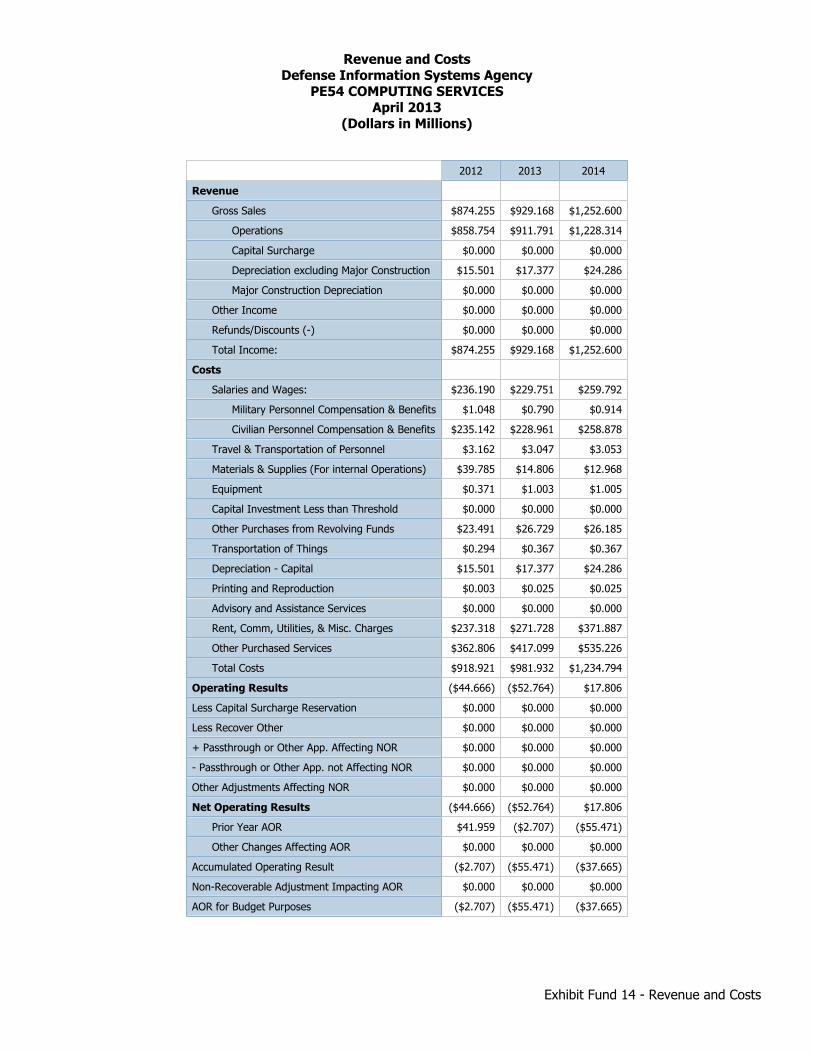
Revenue and CostsDefense Information Systems Agency
PE54 COMPUTING SERVICESApril 2013
(Dollars in Millions)
2012 2013 2014
Revenue
Gross Sales $874.255 $929.168 $1,252.600
Operations $858.754 $911.791 $1,228.314
Capital Surcharge $0.000 $0.000 $0.000
Depreciation excluding Major Construction $15.501 $17.377 $24.286
Major Construction Depreciation $0.000 $0.000 $0.000
Other Income $0.000 $0.000 $0.000
Refunds/Discounts (-) $0.000 $0.000 $0.000
Total Income: $874.255 $929.168 $1,252.600
Costs
Salaries and Wages: $236.190 $229.751 $259.792
Military Personnel Compensation & Benefits $1.048 $0.790 $0.914
Civilian Personnel Compensation & Benefits $235.142 $228.961 $258.878
Travel & Transportation of Personnel $3.162 $3.047 $3.053
Materials & Supplies (For internal Operations) $39.785 $14.806 $12.968
Equipment $0.371 $1.003 $1.005
Capital Investment Less than Threshold $0.000 $0.000 $0.000
Other Purchases from Revolving Funds $23.491 $26.729 $26.185
Transportation of Things $0.294 $0.367 $0.367
Depreciation - Capital $15.501 $17.377 $24.286
Printing and Reproduction $0.003 $0.025 $0.025
Advisory and Assistance Services $0.000 $0.000 $0.000
Rent, Comm, Utilities, & Misc. Charges $237.318 $271.728 $371.887
Other Purchased Services $362.806 $417.099 $535.226
Total Costs $918.921 $981.932 $1,234.794
Operating Results ($44.666) ($52.764) $17.806
Less Capital Surcharge Reservation $0.000 $0.000 $0.000
Less Recover Other $0.000 $0.000 $0.000
+ Passthrough or Other App. Affecting NOR $0.000 $0.000 $0.000
- Passthrough or Other App. not Affecting NOR $0.000 $0.000 $0.000
Other Adjustments Affecting NOR $0.000 $0.000 $0.000
Net Operating Results ($44.666) ($52.764) $17.806
Prior Year AOR $41.959 ($2.707) ($55.471)
Other Changes Affecting AOR $0.000 $0.000 $0.000
Accumulated Operating Result ($2.707) ($55.471) ($37.665)
Non-Recoverable Adjustment Impacting AOR $0.000 $0.000 $0.000
AOR for Budget Purposes ($2.707) ($55.471) ($37.665)
Exhibit Fund 14 - Revenue and Costs
DEPARTMENT OF DEFENSE
DEFENSE INFORMATION SYSTEMS AGENCY Defense Working Capital Fund
Telecommunications Services/Enterprise Acquisition Services (TS/EAS)
FISCAL YEAR (FY) 2014 BUDGET ESTIMATES
The Telecommunications Services component provides a set of high quality, reliable, survivable,
and secure telecommunications services to meet the Department’s command and control
requirements. The major component of Telecommunications Services is the Defense Information
System Network (DISN). The DISN provides the interoperable telecommunications connectivity
and value-added services required to plan, implement, and support operational missions through
dynamic routing of voice, data, text, imagery (both still and full motion), and bandwidth services.
The robustness of this telecommunications infrastructure has been demonstrated by DISA’s
repeated ability to meet terrestrial and satellite surge requirements in Southwest Asia while
supporting disaster relief and recovery efforts throughout the world. Overall, the DISN provides
the lowest possible customer price through bulk quantity purchases, economies of scale and
reengineering of current communication services. Some of the DISN services are provided to
customers in pre-defined packages and sold on a subscription basis, while other services are sold
individually on a cost reimbursable basis. This budget reflects several major changes to this
business area, to include moving enduring costs for the DISN previously funded with Overseas
Contingency Operations accounts to the baseline (i.e. incurring these costs in the DISN share price).
Additionally, this budget includes several new programs, including DoD Mobility to support both
classified and unclassified mobile users (replaces SME-PED), Public Key Infrastructure as a service
to other federal agencies, and a new mobile satellite service offering known as the Mobile Satellite
Service – Broadband Global Access Network (BGAN). These initiatives/new programs are
discussed in greater detail on the following pages.
The Enterprise Acquisition Services component includes multiple organizations that provide cross-
functional support to various contracting and service provider efforts. This component is the
Department’s ideal source for procurement of best-value and commercially competitive information
technology. Enterprise Acquisition Services provides contracting services for information
technology and telecommunications acquisitions from the commercial sector and provides
contracting support to the DISN programs, as well as to other DISA, DoD, and authorized non-
Defense customers. Additionally, DoD has directed DISA to serve as the main service provider for
the DoD Cloud Broker Service. This new mission requires DISA to manage the use, performance,
and delivery of cloud services and to negotiate the relationships between cloud providers and cloud
consumers. The DISA will populate the Enterprise Cloud Service Catalog, assess the cloud
services acquisition plan, and facilitate access to Enterprise Cloud Services.
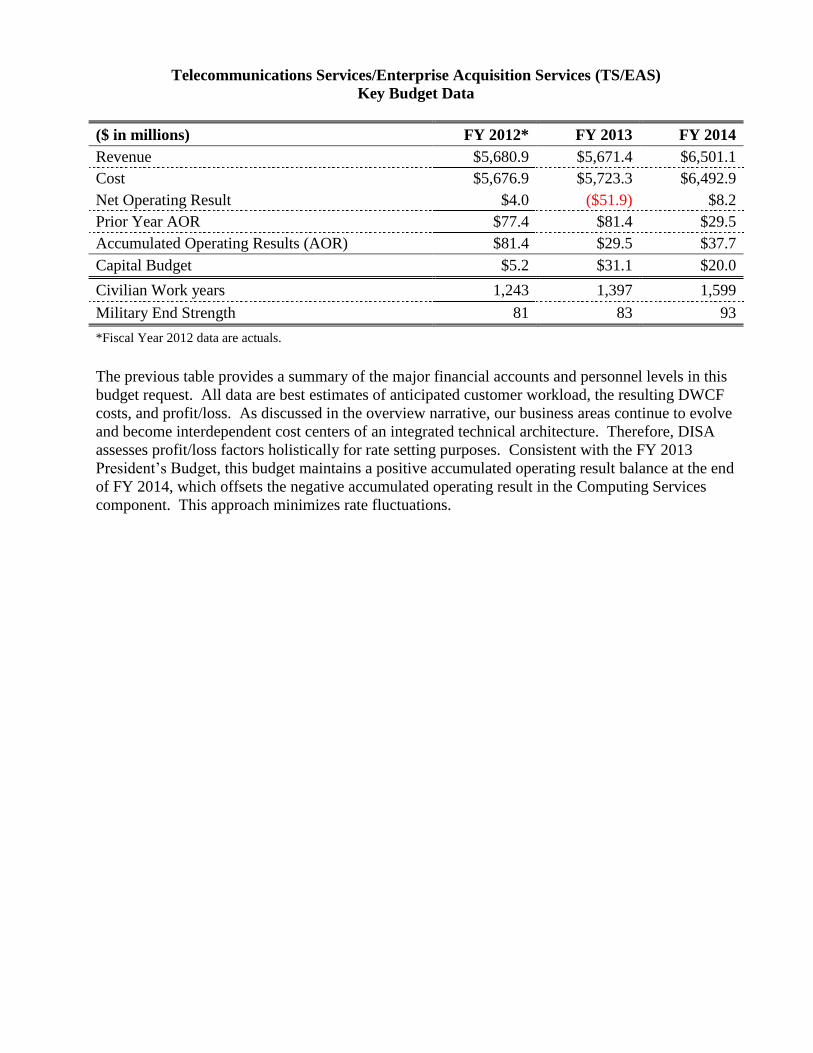
Telecommunications Services/Enterprise Acquisition Services (TS/EAS)
Key Budget Data
($ in millions) FY 2012* FY 2013 FY 2014
Revenue $5,680.9 $5,671.4 $6,501.1
Cost $5,676.9 $5,723.3 $6,492.9
Net Operating Result $4.0 ($51.9) $8.2
Prior Year AOR $77.4 $81.4 $29.5
Accumulated Operating Results (AOR) $81.4 $29.5 $37.7
Capital Budget $5.2 $31.1 $20.0
Civilian Work years 1,243 1,397 1,599
Military End Strength 81 83 93
*Fiscal Year 2012 data are actuals.
The previous table provides a summary of the major financial accounts and personnel levels in this
budget request. All data are best estimates of anticipated customer workload, the resulting DWCF
costs, and profit/loss. As discussed in the overview narrative, our business areas continue to evolve
and become interdependent cost centers of an integrated technical architecture. Therefore, DISA
assesses profit/loss factors holistically for rate setting purposes. Consistent with the FY 2013
President’s Budget, this budget maintains a positive accumulated operating result balance at the end
of FY 2014, which offsets the negative accumulated operating result in the Computing Services
component. This approach minimizes rate fluctuations.
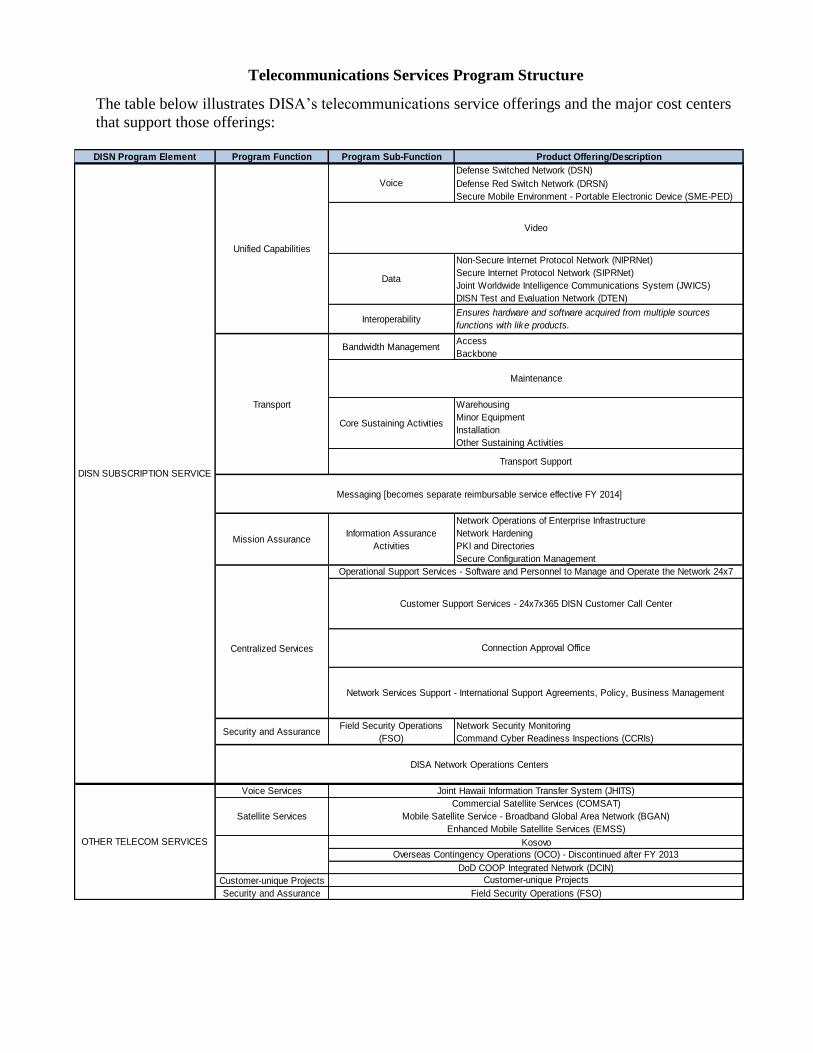
Telecommunications Services Program Structure
The table below illustrates DISA’s telecommunications service offerings and the major cost centers
that support those offerings:
DISN Program Element Program Function Program Sub-Function Product Offering/Description
Defense Switched Network (DSN)
Defense Red Switch Network (DRSN)
Secure Mobile Environment - Portable Electronic Device (SME-PED)
Non-Secure Internet Protocol Network (NIPRNet)
Secure Internet Protocol Network (SIPRNet)
Joint Worldwide Intelligence Communications System (JWICS)
DISN Test and Evaluation Network (DTEN)
Access
Backbone
Warehousing
Minor Equipment
Installation
Other Sustaining Activities
Network Operations of Enterprise Infrastructure
Network Hardening
PKI and Directories
Secure Configuration Management
Network Security Monitoring
Command Cyber Readiness Inspections (CCRIs)
Voice Services Joint Hawaii Information Transfer System (JHITS)
Kosovo
DoD COOP Integrated Network (DCIN)
Customer-unique Projects
Security and Assurance Field Security Operations (FSO)
Unified Capabilities
Commercial Satellite Services (COMSAT)
Mobile Satellite Service - Broadband Global Area Network (BGAN)
Enhanced Mobile Satellite Services (EMSS)
Messaging [becomes separate reimbursable service effective FY 2014]
Customer Support Services - 24x7x365 DISN Customer Call Center
Connection Approval Office
Network Services Support - International Support Agreements, Policy, Business Management
Operational Support Services - Software and Personnel to Manage and Operate the Network 24x7
OTHER TELECOM SERVICES
Satellite Services
DISA Network Operations Centers
Mission AssuranceInformation Assurance
Activities
Centralized Services
DISN SUBSCRIPTION SERVICE
Voice
Data
Interoperability
Transport
Bandwidth Management
Core Sustaining Activities
Security and AssuranceField Security Operations
(FSO)
Overseas Contingency Operations (OCO) - Discontinued after FY 2013
Customer-unique Projects
Video
Transport Support
Ensures hardware and software acquired from multiple sources
functions with like products.
Maintenance
DISN Subscription Services
The DISN Subscription Services consist of the following:
Transport Services provide a robust worldwide capability to transmit voice, video, data and
message traffic for the Combatant Commanders, Military Departments and Defense
Agencies. Transport Services provide the information transport for other services described
subsequently, as well as for specialized services. This budget includes two major changes to
transport services that will impact the cost of the DISN: First, enduring transport costs that
are currently funded out of DISA, Army, and Air Force Overseas Contingency Operations
(OCO) accounts are transferred to the baseline at a total cost impact of +$57.1 million.
Second, this budget reflects the joint DISA/Army effort to consolidate optical networks in
Europe, known as the Joint Enterprise Network (JEN). The project consolidates Army-
specific infrastructure at 50 sites in Europe into the DISN. Through this effort, the
Department reduces complexity, increases security and robustness of the network, and
reduces cost – in this case for the Army. As stated in the Information Technology
Enterprise Services Roadmap (ITESR), the JEN also serves as a use case for the Joint
Information Environment effort, which provides a vision of a single, secure information
environment.
Voice Services provide day-to-day commercially competitive services plus unique secure military
requirements. Voice Services include the operation of the unclassified Defense Switched
Network, the classified Defense Red Switch Network, and the gateway for the classified
mobile voice capability known as the Secure Mobile Environment – Portable Electronic
Device (SME-PED). DISA continues to refresh/install equipment to provide both legacy
voice services (DSN and DRSN) and Voice over IP/Secure Voice over IP services. In
addition, this budget reflects a major change in the way DISA will offer mobile voice
services. The Multi-carrier Entry Points currently utilized by the SME-PED program will
be re-purposed to support a new DoD Mobility service offering by the end of FY 2013.
Beginning in FY 2014, DISA will provide both a secure and unclassified enterprise mobility
capability to the Department, consistent with DoD CIO guidance. This new enterprise
service offering is discussed further in the reimbursable services section.
Video Services provide both unclassified and classified video teleconference capabilities for the
DoD and other government agencies. Enduring video costs that are currently funded out of
DISA and Army OCO accounts are transferred to the baseline at a total cost impact of
+$12.0 million, partially offset by efficiencies. In addition, and consistent with the ITESR,
DISA is working with industry to develop an architecture for Enterprise Voice over Internet
Protocol Services to provide over four million users with a collaboration, conferencing, and
mobility solution.
Data Services provide Secure Internet Protocol Router Network as well as Non-classified Internet
Protocol Router Network capabilities. Additionally, Data Services provide IP transport for
the Defense Intelligence Agency managed Joint Worldwide Intelligence Communications
System by providing comprehensive, worldwide, secure high-speed multimedia, Top
Secret/Sensitive Compartmented Information communications services for the DoD
intelligence community and other federal agencies. Data Services also provide DISN Test
and Evaluation Network support, which is used by the command, control, intelligence, and
mission support communities to conduct development, certification, and operational test and
evaluation activities to ensure programs meet network requirements prior to deployment.
Messaging Services provide day-to-day organizational messaging capabilities for the DoD. The
system provides top secret, secret and unclassified messaging capabilities using four
regional nodes managed by two Network Operations Centers. Funding is to maintain the
critical information exchange functions that this messaging service provides, including
interoperability within the DoD, with our allies, with the intelligence community, and with
the nuclear command and control community. Beginning in FY 2014, this service will
transition out of subscription services and become a separate reimbursable service. DISA is
modifying the existing service to provide only mission critical messaging traffic in support
of our allies and coalition partners as well as nuclear command and control functions.
The following items describe the activities necessary to maintain the DISN’s operational capability
and achieve the high-availability, secure, and robust service that our DoD customers require.
Operational Support Services provides the tools necessary to automate the operations,
administration, maintenance, and provisioning/engineering activities for the DISN. These
same tools give network managers/monitors the capability to “see” the network in real-time,
a critical capability necessary to resolve crisis and other network events.
Mission Assurance activities support the DISN by designing and deploying proactive protections,
deploying attack detection, and performing information assurance operations to ensure that
adequate security is provided for information collected, processed, transmitted, stored, or
disseminated on the Global Information Grid (GIG). These efforts include tasks associated
with affording protection to telecommunications, information systems, and information
technology that process sensitive and classified data as well as efforts to ensure the
confidentiality, authenticity, integrity, and availability of the information and the systems.
Security and Assurance Services are provided by DISA’s Field Security Operations (FSO) to
enhance the security and availability of the GIG by ensuring adherence to Information
Assurance and Network Operations policies. This budget includes a functional transfer of
security and assurance workload of $67.3 million and 116 full time equivalents into the
DWCF in FY 2014, a portion of which ($19.5 million and 25 full time equivalents) will
impact DISN subscription services. The services to be recovered via the DISN share price
are network security monitoring and oversight of sensors installed on the DISN backbone
and Command Cyber Readiness Inspections. Additional security and assurance services are
described in subsequent sections.
Centralized Services are a group of critical mission support activities that support all DISN services
by providing network connection approval, 24x7 monitoring of network traffic and events,
and an entry point for customers to report network and connectivity issues. The group
includes:
The Connection Approval Office approves secure interoperable connections in support
of the operating forces and mission partners for applications, information systems and
networks authorized to operate on the enterprise infrastructure.
Customer Support Services operates the DISN Customer Call Center, located at
Columbus, Ohio, to respond to customer incidents and connection issues 24 hours per
day, 365 days per year.
The DISA Network Operations Centers monitor and react to real-time network traffic
and events. Network Operations Centers are located in the Continental United States,

Southwest Asia, the Pacific, and in Europe. These Centers are staffed 24 hours per day,
365 days per year.
As previously discussed, DISN services are bundled together and sold on a subscription package
basis. The Department of Defense uses the matrix shown below to distribute costs to users based
on two factors; the services they receive and the bandwidth DISA is required to provision in order
to deliver those services. Each DISN site is assigned a number of shares based on the matrix, which
combined with the per-share price, determines the total annual “subscription” for the military
departments/agencies. The DISA updates the DISN site list annually based on input from the DoD
components.
Bandwidth Size
Subscription Service Package Small Medium Large Mega
≤DS3 >DS3 to ≤OC3 >OC3 to ≤OC12 >OC12
Transport/ISR Only: No DISN Services 1 1 1 1
Nu
mb
er o
f S
hare
s
Mission Essential: Any of the following -
SIPRNet, NIPRNet, Unclassified Voice,
Messaging, Video Services
1 2 6 8
Command and Control (C2): Any of the
following with some form of Diversity -
SIPRNet, NIPRNet, Unclassified Voice,
Messaging, Video Services
2 8 24 36
C2 Plus: C2 with Joint Worldwide
Intelligence Communications System or
Classified Voice
5 10 30 40
C2ISR: C2, Joint Worldwide Intelligence
Communications System, Classified
Voice, and Intelligence, Surveillance, and
Reconnaissance (ISR)
8 16 48 72

The table below provides a synopsis of DISN Subscription Services financial data for this budget,
including the calculated share price:
($ in millions) FY 2012* FY 2013 FY 2014
Transport $473.6 $475.3 $545.7
Real Time Services (voice, video, data, interoperability) $179.0 $178.4 $181.8
Messaging $44.9 $47.8 $0.0
Mission Assurance $150.0 $187.7 $211.1
Centralized Services
Operational Support Services $212.8 $223.7 $231.8
Other Centralized Services $82.5 $111.7 $108.0
DISA Network Operations Centers $33.6 $34.6 $38.4
Total DISN Subscription Services Costs $1,176.4 $1,259.2 $1,317.0
Number of Sites 361 348 347
Number of Shares 8,260 8,445 8,778
Price Per Share $140,505 $142,894 $148,753
Unit Cost Per Share $142,427 $149,101 $150,036
*Fiscal Year 2012 data are actuals.
The table below shows the distribution of all subscription services shares by customer, as well as
the associated cost to each customer for FY 2013 and FY 2014.
Agency ($ in Millions) FY 2013
Shares
FY 2013
Cost
FY 2014
Shares
FY 2014
Cost
Air Force 3,430 $490.1 3,614 $537.6
Army 2,142 $306.1 2,177 $323.8
Navy 1,784 $254.9 1,852 $275.5
Marine Corps 418 $59.7 458 $68.1
Defense Agencies 330 $47.2 278 $41.4
Other DOD 206 $29.4 264 $39.3
Other Federal and Non-Federal Agencies 135 $19.3 135 $20.1
TOTAL 8,445 $1,206.7 8,778 $1,305.8
TS/EAS Trends: Increased Customer Demand for Network Services
As previously discussed, specific network services are packaged together and sold on a subscription
basis. After consultation and coordination with subscription services customers, DISA develops a
subscription services site and shares list each year. The number of shares assigned to a specific
customer (at any particular site) are directly related to the amount of bandwidth provisioned at a site
in order to meet the customer’s demand, and the types of DISN services that the customer requires
at the site. Therefore, an increase in shares is an indication of increased customer demand for
bandwidth and/or DISN services.
The following table shows 15.4 percent growth in customer demand over the most recent three-year
period:
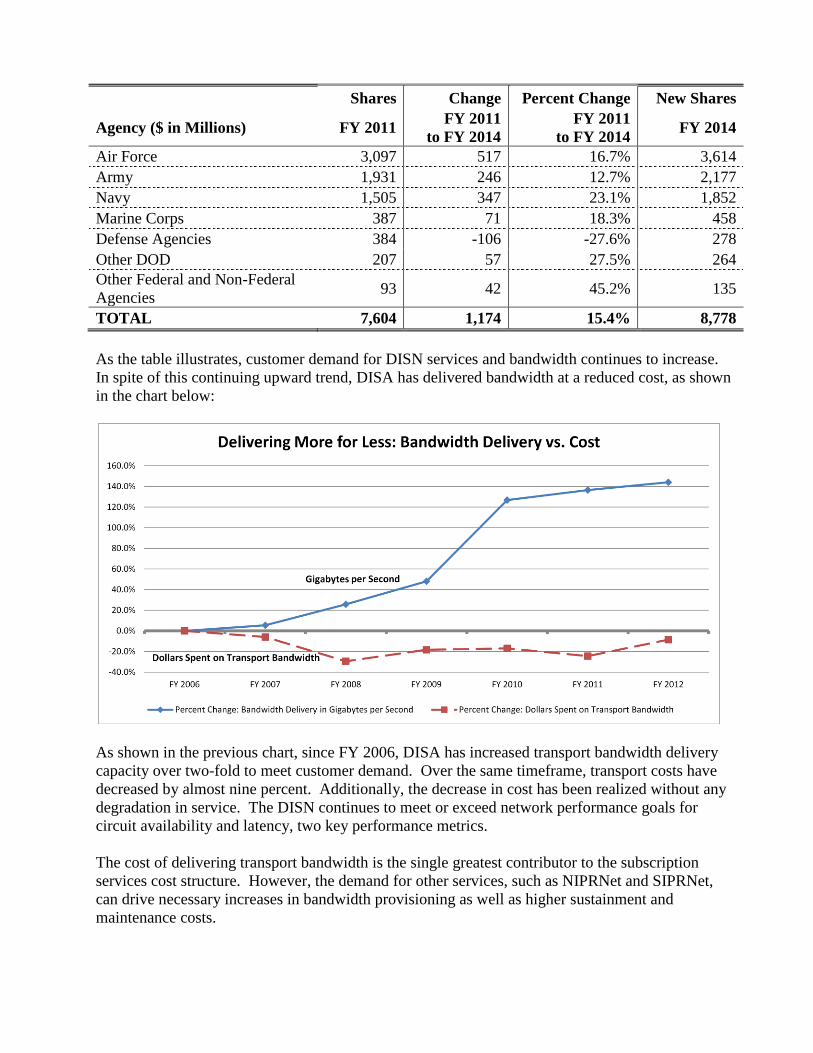
Shares Change Percent Change New Shares
Agency ($ in Millions) FY 2011 FY 2011
to FY 2014
FY 2011
to FY 2014 FY 2014
Air Force 3,097 517 16.7% 3,614
Army 1,931 246 12.7% 2,177
Navy 1,505 347 23.1% 1,852
Marine Corps 387 71 18.3% 458
Defense Agencies 384 -106 -27.6% 278
Other DOD 207 57 27.5% 264
Other Federal and Non-Federal
Agencies 93 42 45.2% 135
TOTAL 7,604 1,174 15.4% 8,778
As the table illustrates, customer demand for DISN services and bandwidth continues to increase.
In spite of this continuing upward trend, DISA has delivered bandwidth at a reduced cost, as shown
in the chart below:
As shown in the previous chart, since FY 2006, DISA has increased transport bandwidth delivery
capacity over two-fold to meet customer demand. Over the same timeframe, transport costs have
decreased by almost nine percent. Additionally, the decrease in cost has been realized without any
degradation in service. The DISN continues to meet or exceed network performance goals for
circuit availability and latency, two key performance metrics.
The cost of delivering transport bandwidth is the single greatest contributor to the subscription
services cost structure. However, the demand for other services, such as NIPRNet and SIPRNet,
can drive necessary increases in bandwidth provisioning as well as higher sustainment and
maintenance costs.
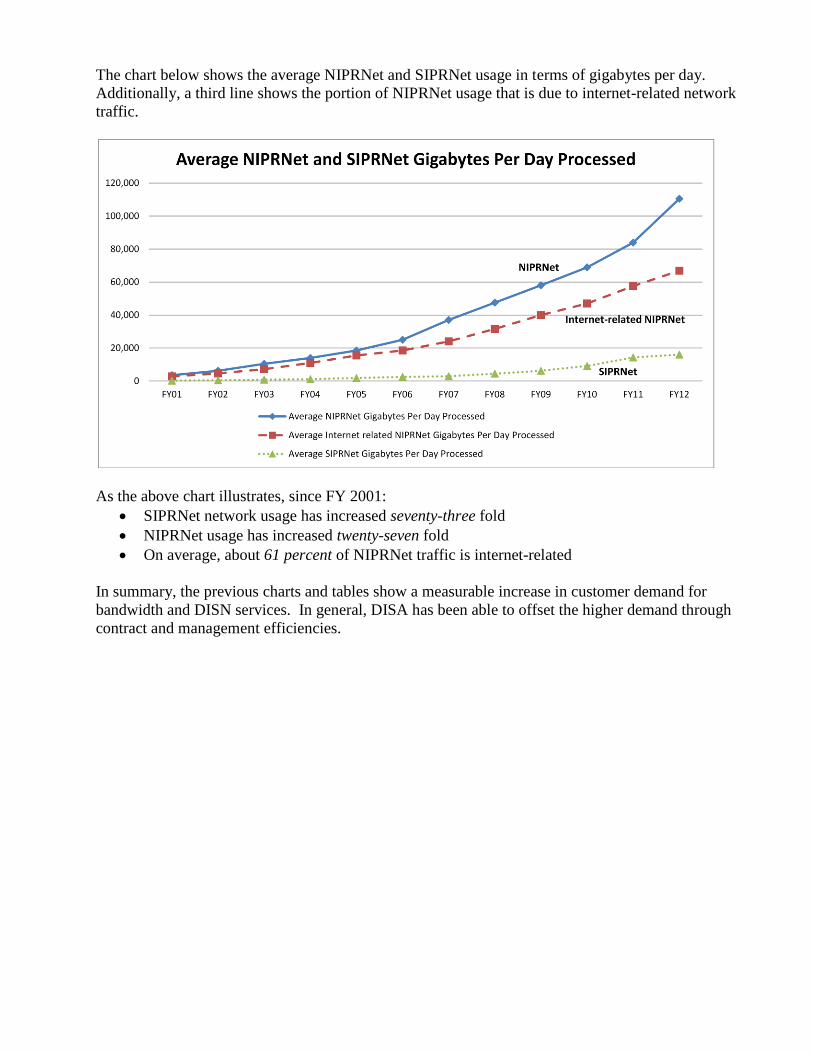
The chart below shows the average NIPRNet and SIPRNet usage in terms of gigabytes per day.
Additionally, a third line shows the portion of NIPRNet usage that is due to internet-related network
traffic.
As the above chart illustrates, since FY 2001:
SIPRNet network usage has increased seventy-three fold
NIPRNet usage has increased twenty-seven fold
On average, about 61 percent of NIPRNet traffic is internet-related
In summary, the previous charts and tables show a measurable increase in customer demand for
bandwidth and DISN services. In general, DISA has been able to offset the higher demand through
contract and management efficiencies.
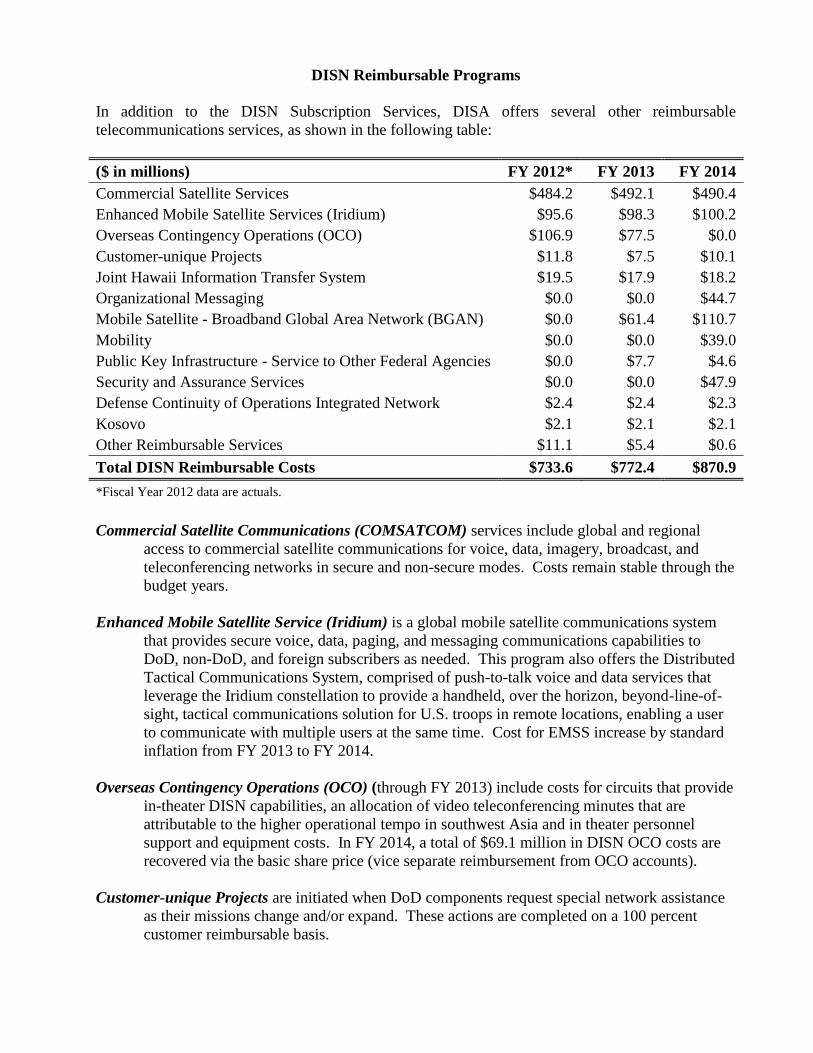
DISN Reimbursable Programs
In addition to the DISN Subscription Services, DISA offers several other reimbursable
telecommunications services, as shown in the following table:
($ in millions) FY 2012* FY 2013 FY 2014
Commercial Satellite Services $484.2 $492.1 $490.4
Enhanced Mobile Satellite Services (Iridium) $95.6 $98.3 $100.2
Overseas Contingency Operations (OCO) $106.9 $77.5 $0.0
Customer-unique Projects $11.8 $7.5 $10.1
Joint Hawaii Information Transfer System $19.5 $17.9 $18.2
Organizational Messaging $0.0 $0.0 $44.7
Mobile Satellite - Broadband Global Area Network (BGAN) $0.0 $61.4 $110.7
Mobility $0.0 $0.0 $39.0
Public Key Infrastructure - Service to Other Federal Agencies $0.0 $7.7 $4.6
Security and Assurance Services $0.0 $0.0 $47.9
Defense Continuity of Operations Integrated Network $2.4 $2.4 $2.3
Kosovo $2.1 $2.1 $2.1
Other Reimbursable Services $11.1 $5.4 $0.6
Total DISN Reimbursable Costs $733.6 $772.4 $870.9
*Fiscal Year 2012 data are actuals.
Commercial Satellite Communications (COMSATCOM) services include global and regional
access to commercial satellite communications for voice, data, imagery, broadcast, and
teleconferencing networks in secure and non-secure modes. Costs remain stable through the
budget years.
Enhanced Mobile Satellite Service (Iridium) is a global mobile satellite communications system
that provides secure voice, data, paging, and messaging communications capabilities to
DoD, non-DoD, and foreign subscribers as needed. This program also offers the Distributed
Tactical Communications System, comprised of push-to-talk voice and data services that
leverage the Iridium constellation to provide a handheld, over the horizon, beyond-line-of-
sight, tactical communications solution for U.S. troops in remote locations, enabling a user
to communicate with multiple users at the same time. Cost for EMSS increase by standard
inflation from FY 2013 to FY 2014.
Overseas Contingency Operations (OCO) (through FY 2013) include costs for circuits that provide
in-theater DISN capabilities, an allocation of video teleconferencing minutes that are
attributable to the higher operational tempo in southwest Asia and in theater personnel
support and equipment costs. In FY 2014, a total of $69.1 million in DISN OCO costs are
recovered via the basic share price (vice separate reimbursement from OCO accounts).
Customer-unique Projects are initiated when DoD components request special network assistance
as their missions change and/or expand. These actions are completed on a 100 percent
customer reimbursable basis.
The Joint Hawaii Information Transfer System (JHITS) provides voice, video, and data services
to military bases in the state of Hawaii. Costs remain stable through the budget years.
Organizational Messaging provides top secret, secret and unclassified messaging capabilities using
four regional nodes managed by two Network Operations Centers for the DoD, the
Intelligence Community, and allied/coalition partners. As previously discussed, this
program transitions to direct-reimbursable beginning FY 2014, and the service will be
modified to provide only mission critical messaging traffic in support of our allies and
coalition partners as well as nuclear command and control functions. Other elements of the
service will no longer be supported.
The Mobile Satellite Service - Broadband Global Area Network (BGAN) is the newest Internet
Protocol-based mobile satellite service offering from Inmarsat. It will provide a secure,
managed, DoD enterprise capability that will give users reach-back connectivity to the
DISN.
DoD Mobility is an enterprise service DISA will provide beginning FY 2014. The new service will
support both unclassified and classified mobile communications using multiple types of
devices. The DISA will provide the commercial carrier gateway for both 3G and 4G
network traffic, hosted at DISA DECCs, to facilitate moving the commercial carrier traffic
through the DISN to access user email, DoD web sites, a DoD application store, and other
DoD-specific applications. This new capability will replace legacy services that will no
longer be supported by industry (such as the SME-PED and Sectera communications).
Sustainment costs driven by customer-specific requirements, such as Mobile Device
Management hardware and the Mobile Application Store, as well as other servers, software
licenses, and 24x7 operational support will be recovered on a reimbursable basis through the
DWCF. Basic infrastructure costs, such as the commercial gateways operated at DISA
DECCs, will be funded with appropriated resources.
PKI as a Service to other federal agencies will allow federal entities to utilize DoD’s PKI
infrastructure for user authentication. The service provides access credentials to support
identity authentication, data integrity, and communications privacy on Secret level
networks. The DISA will be the National Security System (NSS) Common Service Provider
(CSP), and will provide PKI service to the requesting agency on a reimbursable basis. The
service is being established in FY 2013. In FY 2014, sustainment costs and Tier II level
support are estimated at $4.6 million.
Security and Assurance Services are transferred into the DWCF in FY 2014. As discussed
previously, costs for security and assurance services benefitting all DISN users will be
recovered via the DISN share price, while costs for services requested by specific customers
will be recovered via direct reimbursement. Certain services will be provided as stand-alone
offerings, while others will be bundled into subscriptions. Examples of services requiring
direct reimbursement include the certification of systems, Computer Network Defense
Service Provider (CNDSP) inspections, IA readiness reviews, and malware analysis.
The Defense Continuity of Operations Integrated Network (DCIN) is a classified network. Its
costs remain stable through the budget years.
Costs for Kosovo support the sustainment of communications infrastructure in the region, including
service leases and non-capital equipment purchases.
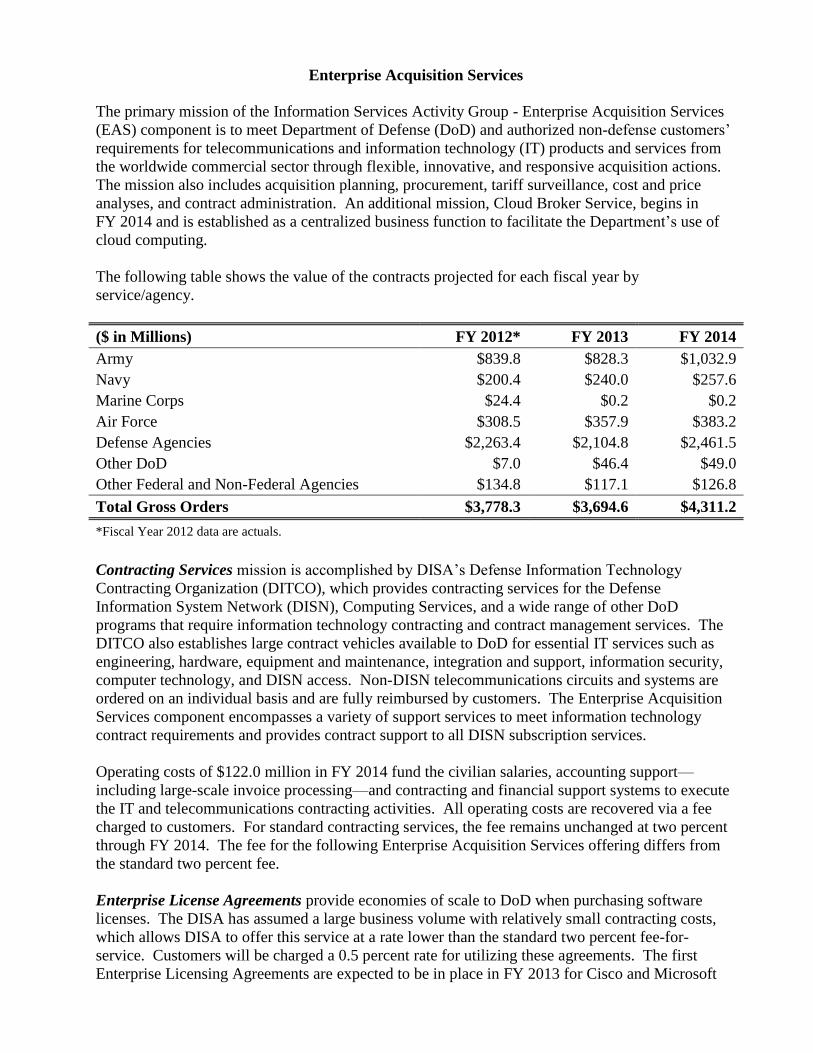
Enterprise Acquisition Services
The primary mission of the Information Services Activity Group - Enterprise Acquisition Services
(EAS) component is to meet Department of Defense (DoD) and authorized non-defense customers’
requirements for telecommunications and information technology (IT) products and services from
the worldwide commercial sector through flexible, innovative, and responsive acquisition actions.
The mission also includes acquisition planning, procurement, tariff surveillance, cost and price
analyses, and contract administration. An additional mission, Cloud Broker Service, begins in
FY 2014 and is established as a centralized business function to facilitate the Department’s use of
cloud computing.
The following table shows the value of the contracts projected for each fiscal year by
service/agency.
($ in Millions) FY 2012* FY 2013 FY 2014
Army $839.8 $828.3 $1,032.9
Navy $200.4 $240.0 $257.6
Marine Corps $24.4 $0.2 $0.2
Air Force $308.5 $357.9 $383.2
Defense Agencies $2,263.4 $2,104.8 $2,461.5
Other DoD $7.0 $46.4 $49.0
Other Federal and Non-Federal Agencies $134.8 $117.1 $126.8
Total Gross Orders $3,778.3 $3,694.6 $4,311.2
*Fiscal Year 2012 data are actuals.
Contracting Services mission is accomplished by DISA’s Defense Information Technology
Contracting Organization (DITCO), which provides contracting services for the Defense
Information System Network (DISN), Computing Services, and a wide range of other DoD
programs that require information technology contracting and contract management services. The
DITCO also establishes large contract vehicles available to DoD for essential IT services such as
engineering, hardware, equipment and maintenance, integration and support, information security,
computer technology, and DISN access. Non-DISN telecommunications circuits and systems are
ordered on an individual basis and are fully reimbursed by customers. The Enterprise Acquisition
Services component encompasses a variety of support services to meet information technology
contract requirements and provides contract support to all DISN subscription services.
Operating costs of $122.0 million in FY 2014 fund the civilian salaries, accounting support—
including large-scale invoice processing—and contracting and financial support systems to execute
the IT and telecommunications contracting activities. All operating costs are recovered via a fee
charged to customers. For standard contracting services, the fee remains unchanged at two percent
through FY 2014. The fee for the following Enterprise Acquisition Services offering differs from
the standard two percent fee.
Enterprise License Agreements provide economies of scale to DoD when purchasing software
licenses. The DISA has assumed a large business volume with relatively small contracting costs,
which allows DISA to offer this service at a rate lower than the standard two percent fee-for-
service. Customers will be charged a 0.5 percent rate for utilizing these agreements. The first
Enterprise Licensing Agreements are expected to be in place in FY 2013 for Cisco and Microsoft
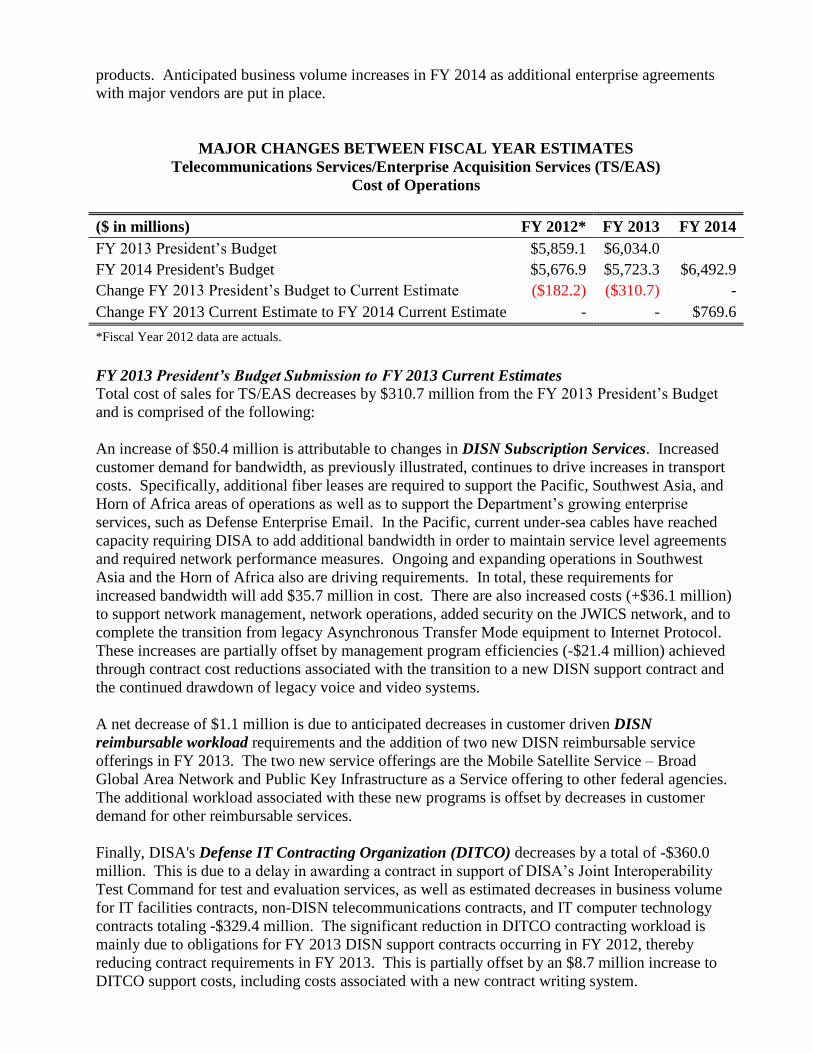
products. Anticipated business volume increases in FY 2014 as additional enterprise agreements
with major vendors are put in place.
MAJOR CHANGES BETWEEN FISCAL YEAR ESTIMATES
Telecommunications Services/Enterprise Acquisition Services (TS/EAS)
Cost of Operations
($ in millions) FY 2012* FY 2013 FY 2014
FY 2013 President’s Budget $5,859.1 $6,034.0
FY 2014 President's Budget $5,676.9 $5,723.3 $6,492.9
Change FY 2013 President’s Budget to Current Estimate ($182.2) ($310.7) -
Change FY 2013 Current Estimate to FY 2014 Current Estimate - - $769.6
*Fiscal Year 2012 data are actuals.
FY 2013 President’s Budget Submission to FY 2013 Current Estimates Total cost of sales for TS/EAS decreases by $310.7 million from the FY 2013 President’s Budget
and is comprised of the following:
An increase of $50.4 million is attributable to changes in DISN Subscription Services. Increased
customer demand for bandwidth, as previously illustrated, continues to drive increases in transport
costs. Specifically, additional fiber leases are required to support the Pacific, Southwest Asia, and
Horn of Africa areas of operations as well as to support the Department’s growing enterprise
services, such as Defense Enterprise Email. In the Pacific, current under-sea cables have reached
capacity requiring DISA to add additional bandwidth in order to maintain service level agreements
and required network performance measures. Ongoing and expanding operations in Southwest
Asia and the Horn of Africa also are driving requirements. In total, these requirements for
increased bandwidth will add $35.7 million in cost. There are also increased costs (+$36.1 million)
to support network management, network operations, added security on the JWICS network, and to
complete the transition from legacy Asynchronous Transfer Mode equipment to Internet Protocol.
These increases are partially offset by management program efficiencies (-$21.4 million) achieved
through contract cost reductions associated with the transition to a new DISN support contract and
the continued drawdown of legacy voice and video systems.
A net decrease of $1.1 million is due to anticipated decreases in customer driven DISN
reimbursable workload requirements and the addition of two new DISN reimbursable service
offerings in FY 2013. The two new service offerings are the Mobile Satellite Service – Broad
Global Area Network and Public Key Infrastructure as a Service offering to other federal agencies.
The additional workload associated with these new programs is offset by decreases in customer
demand for other reimbursable services.
Finally, DISA's Defense IT Contracting Organization (DITCO) decreases by a total of -$360.0
million. This is due to a delay in awarding a contract in support of DISA’s Joint Interoperability
Test Command for test and evaluation services, as well as estimated decreases in business volume
for IT facilities contracts, non-DISN telecommunications contracts, and IT computer technology
contracts totaling -$329.4 million. The significant reduction in DITCO contracting workload is
mainly due to obligations for FY 2013 DISN support contracts occurring in FY 2012, thereby
reducing contract requirements in FY 2013. This is partially offset by an $8.7 million increase to
DITCO support costs, including costs associated with a new contract writing system.
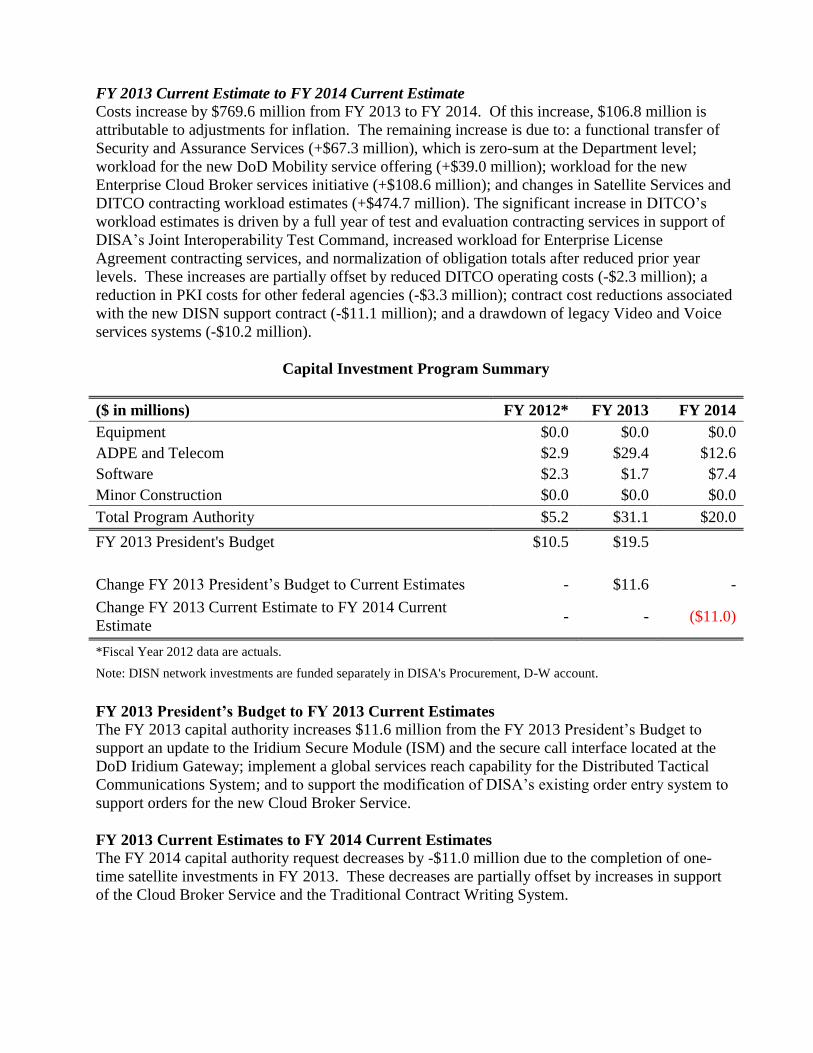
FY 2013 Current Estimate to FY 2014 Current Estimate
Costs increase by $769.6 million from FY 2013 to FY 2014. Of this increase, $106.8 million is
attributable to adjustments for inflation. The remaining increase is due to: a functional transfer of
Security and Assurance Services (+$67.3 million), which is zero-sum at the Department level;
workload for the new DoD Mobility service offering (+$39.0 million); workload for the new
Enterprise Cloud Broker services initiative (+$108.6 million); and changes in Satellite Services and
DITCO contracting workload estimates (+$474.7 million). The significant increase in DITCO’s
workload estimates is driven by a full year of test and evaluation contracting services in support of
DISA’s Joint Interoperability Test Command, increased workload for Enterprise License
Agreement contracting services, and normalization of obligation totals after reduced prior year
levels. These increases are partially offset by reduced DITCO operating costs (-$2.3 million); a
reduction in PKI costs for other federal agencies (-$3.3 million); contract cost reductions associated
with the new DISN support contract (-$11.1 million); and a drawdown of legacy Video and Voice
services systems (-$10.2 million).
Capital Investment Program Summary
($ in millions) FY 2012* FY 2013 FY 2014
Equipment $0.0 $0.0 $0.0
ADPE and Telecom $2.9 $29.4 $12.6
Software $2.3 $1.7 $7.4
Minor Construction $0.0 $0.0 $0.0
Total Program Authority $5.2 $31.1 $20.0
FY 2013 President's Budget $10.5 $19.5
Change FY 2013 President’s Budget to Current Estimates - $11.6 -
Change FY 2013 Current Estimate to FY 2014 Current
Estimate - - ($11.0)
*Fiscal Year 2012 data are actuals.
Note: DISN network investments are funded separately in DISA's Procurement, D-W account.
FY 2013 President’s Budget to FY 2013 Current Estimates The FY 2013 capital authority increases $11.6 million from the FY 2013 President’s Budget to
support an update to the Iridium Secure Module (ISM) and the secure call interface located at the
DoD Iridium Gateway; implement a global services reach capability for the Distributed Tactical
Communications System; and to support the modification of DISA’s existing order entry system to
support orders for the new Cloud Broker Service.
FY 2013 Current Estimates to FY 2014 Current Estimates The FY 2014 capital authority request decreases by -$11.0 million due to the completion of one-
time satellite investments in FY 2013. These decreases are partially offset by increases in support
of the Cloud Broker Service and the Traditional Contract Writing System.
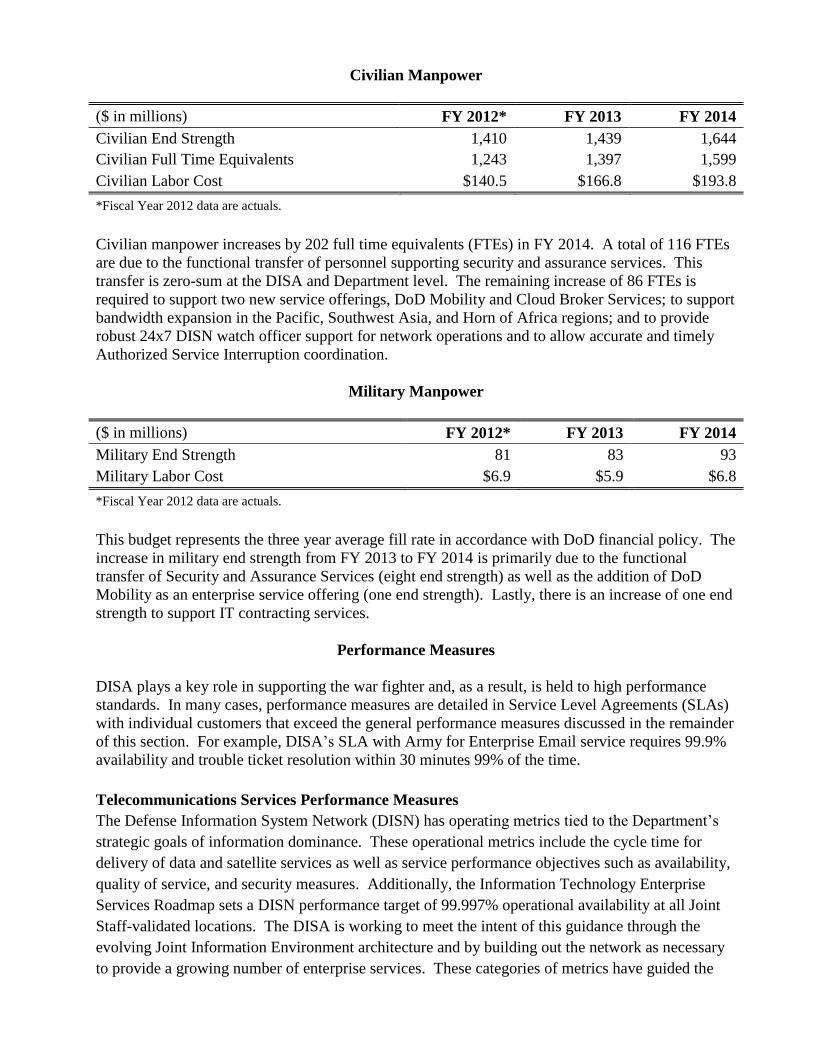
Civilian Manpower
($ in millions) FY 2012* FY 2013 FY 2014
Civilian End Strength 1,410 1,439 1,644
Civilian Full Time Equivalents 1,243 1,397 1,599
Civilian Labor Cost $140.5 $166.8 $193.8
*Fiscal Year 2012 data are actuals.
Civilian manpower increases by 202 full time equivalents (FTEs) in FY 2014. A total of 116 FTEs
are due to the functional transfer of personnel supporting security and assurance services. This
transfer is zero-sum at the DISA and Department level. The remaining increase of 86 FTEs is
required to support two new service offerings, DoD Mobility and Cloud Broker Services; to support
bandwidth expansion in the Pacific, Southwest Asia, and Horn of Africa regions; and to provide
robust 24x7 DISN watch officer support for network operations and to allow accurate and timely
Authorized Service Interruption coordination.
Military Manpower
($ in millions) FY 2012* FY 2013 FY 2014
Military End Strength 81 83 93
Military Labor Cost $6.9 $5.9 $6.8
*Fiscal Year 2012 data are actuals.
This budget represents the three year average fill rate in accordance with DoD financial policy. The
increase in military end strength from FY 2013 to FY 2014 is primarily due to the functional
transfer of Security and Assurance Services (eight end strength) as well as the addition of DoD
Mobility as an enterprise service offering (one end strength). Lastly, there is an increase of one end
strength to support IT contracting services.
Performance Measures
DISA plays a key role in supporting the war fighter and, as a result, is held to high performance
standards. In many cases, performance measures are detailed in Service Level Agreements (SLAs)
with individual customers that exceed the general performance measures discussed in the remainder
of this section. For example, DISA’s SLA with Army for Enterprise Email service requires 99.9%
availability and trouble ticket resolution within 30 minutes 99% of the time.
Telecommunications Services Performance Measures
The Defense Information System Network (DISN) has operating metrics tied to the Department’s
strategic goals of information dominance. These operational metrics include the cycle time for
delivery of data and satellite services as well as service performance objectives such as availability,
quality of service, and security measures. Additionally, the Information Technology Enterprise
Services Roadmap sets a DISN performance target of 99.997% operational availability at all Joint
Staff-validated locations. The DISA is working to meet the intent of this guidance through the
evolving Joint Information Environment architecture and by building out the network as necessary
to provide a growing number of enterprise services. These categories of metrics have guided the

development of the Telecommunication Services budget submission. Shown below are major
performance and performance improvement measures:
SERVICE OBJECTIVE FY 2012 Actual
FY 2013
Operational Goal
FY 2014 Operational
Goal
Non-Secure Internet Protocol
Router Network access circuit
availability
99.87% 98.50% 98.50%
Secure Internet Protocol Router
Network latency (measurement
of network delay) in the
continental United States
49 milliseconds Not to exceed 100
milliseconds
Not to exceed 100
milliseconds
DISN Video Services
availability 99.92% 99.60% 99.60%
Defense Red-Switch Network
switch availability 99.95% 99.90% 99.90%
SME-PED Multi-Carrier Entry
Point availability/up-time 99.99% 99.50% N/A
Defense Switched Network
Grade-of-Service
(Intra-theater)
P.007
<P.07 (defined as
probability seven
calls per one hundred
are blocked)
<P.07 (defined as
probability seven calls
per one hundred are
blocked)
Enterprise Acquisition Services Performance Measures
The following performance measures apply for Enterprise Acquisition Services (EAS):
SERVICE OBJECTIVE
FY 2012
Actual
FY 2013
Operational Goal
FY 2014 Operational
Goal
Percent of total eligible contract
dollars competed 84.5% 84.5% 84.5 %
Percent of total eligible contract
dollars awarded to small
businesses
25% 25% 25%
Rates
DISN Subscription Services Share Price
The table on the following page shows changes in the number of sites, shares, total cost and cost per
share. As previously discussed, the change in the number of shares is directly correlated to
customer demand for services and bandwidth, a key factor in the overall cost of the network.
The subscription share price in FY 2014 increases by 4.1%, largely due to the transition of enduring
costs previously funded by OCO accounts to the baseline. The share price also supports the
functional transfer of security and assurance services that benefit DISN customers from DISA’s
appropriated accounts to DWCF. This transfer is zero-sum at the Department level, i.e. DISA
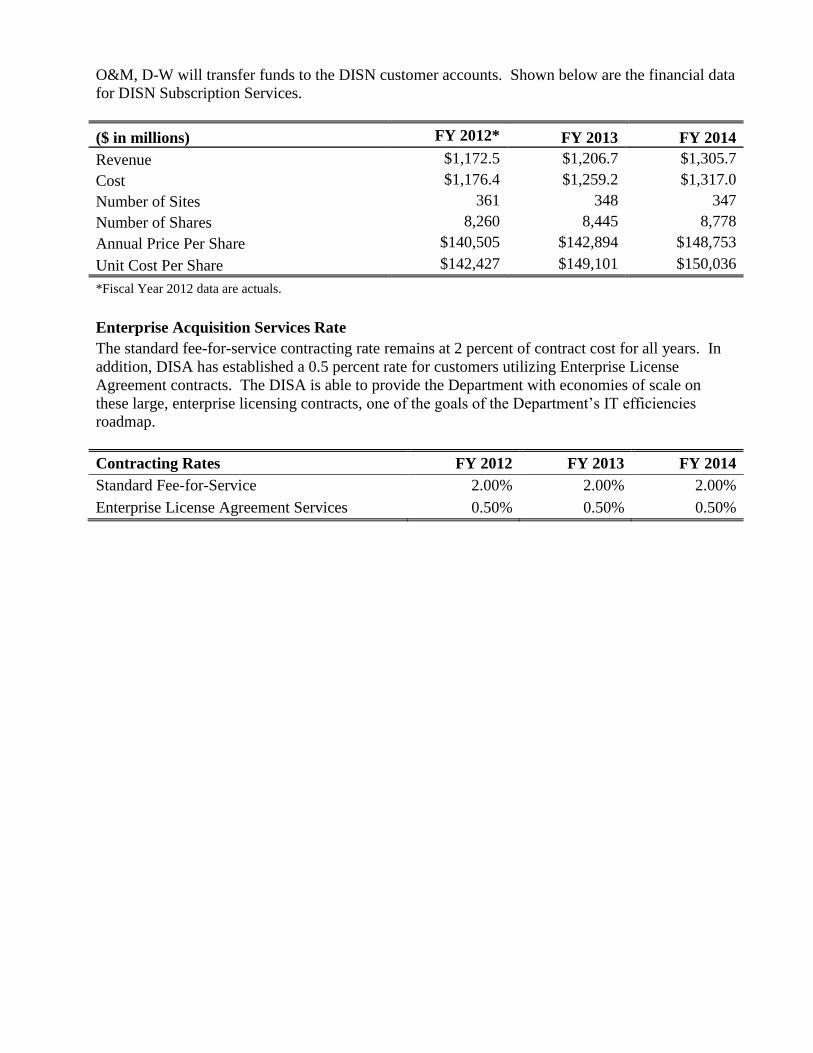
O&M, D-W will transfer funds to the DISN customer accounts. Shown below are the financial data
for DISN Subscription Services.
($ in millions) FY 2012* FY 2013 FY 2014
Revenue $1,172.5 $1,206.7 $1,305.7
Cost $1,176.4 $1,259.2 $1,317.0
Number of Sites 361 348 347
Number of Shares 8,260 8,445 8,778
Annual Price Per Share $140,505 $142,894 $148,753
Unit Cost Per Share $142,427 $149,101 $150,036
*Fiscal Year 2012 data are actuals.
Enterprise Acquisition Services Rate
The standard fee-for-service contracting rate remains at 2 percent of contract cost for all years. In
addition, DISA has established a 0.5 percent rate for customers utilizing Enterprise License
Agreement contracts. The DISA is able to provide the Department with economies of scale on
these large, enterprise licensing contracts, one of the goals of the Department’s IT efficiencies
roadmap.
Contracting Rates FY 2012 FY 2013 FY 2014
Standard Fee-for-Service 2.00% 2.00% 2.00%
Enterprise License Agreement Services 0.50% 0.50% 0.50%
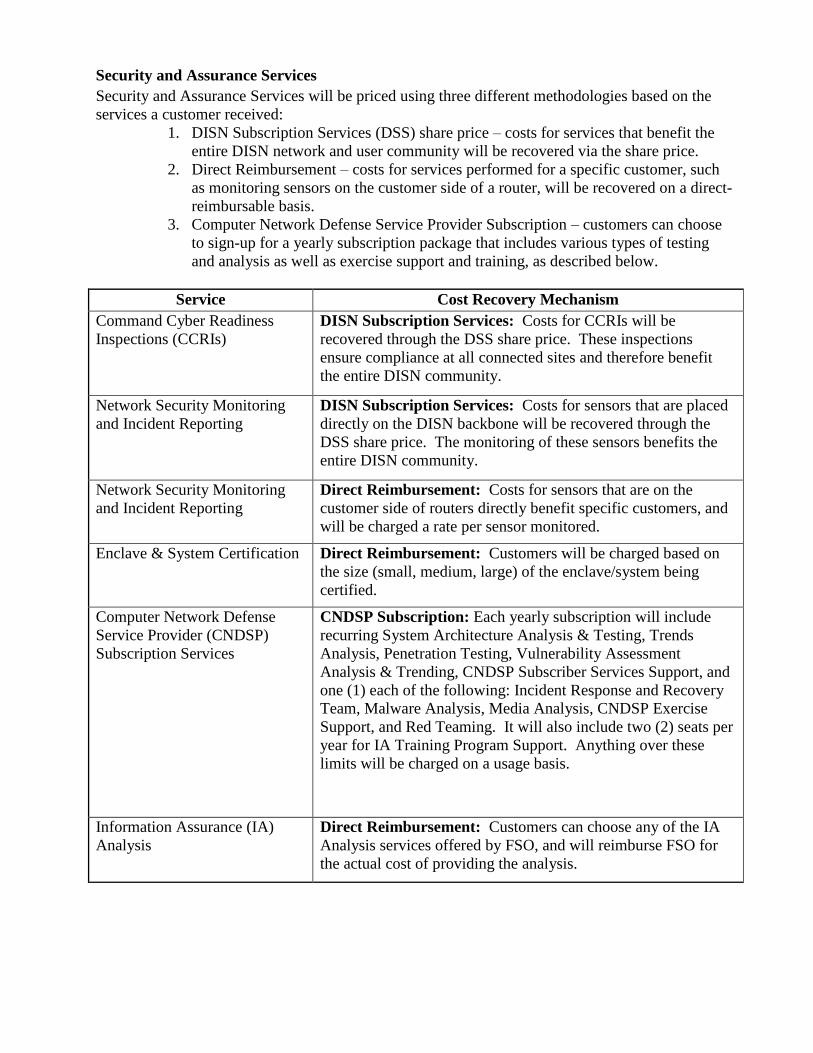
Security and Assurance Services
Security and Assurance Services will be priced using three different methodologies based on the
services a customer received:
1. DISN Subscription Services (DSS) share price – costs for services that benefit the
entire DISN network and user community will be recovered via the share price.
2. Direct Reimbursement – costs for services performed for a specific customer, such
as monitoring sensors on the customer side of a router, will be recovered on a direct-
reimbursable basis.
3. Computer Network Defense Service Provider Subscription – customers can choose
to sign-up for a yearly subscription package that includes various types of testing
and analysis as well as exercise support and training, as described below.
Service Cost Recovery Mechanism
Command Cyber Readiness
Inspections (CCRIs)
DISN Subscription Services: Costs for CCRIs will be
recovered through the DSS share price. These inspections
ensure compliance at all connected sites and therefore benefit
the entire DISN community.
Network Security Monitoring
and Incident Reporting
DISN Subscription Services: Costs for sensors that are placed
directly on the DISN backbone will be recovered through the
DSS share price. The monitoring of these sensors benefits the
entire DISN community.
Network Security Monitoring
and Incident Reporting
Direct Reimbursement: Costs for sensors that are on the
customer side of routers directly benefit specific customers, and
will be charged a rate per sensor monitored.
Enclave & System Certification Direct Reimbursement: Customers will be charged based on
the size (small, medium, large) of the enclave/system being
certified.
Computer Network Defense
Service Provider (CNDSP)
Subscription Services
CNDSP Subscription: Each yearly subscription will include
recurring System Architecture Analysis & Testing, Trends
Analysis, Penetration Testing, Vulnerability Assessment
Analysis & Trending, CNDSP Subscriber Services Support, and
one (1) each of the following: Incident Response and Recovery
Team, Malware Analysis, Media Analysis, CNDSP Exercise
Support, and Red Teaming. It will also include two (2) seats per
year for IA Training Program Support. Anything over these
limits will be charged on a usage basis.
Information Assurance (IA)
Analysis
Direct Reimbursement: Customers can choose any of the IA
Analysis services offered by FSO, and will reimburse FSO for
the actual cost of providing the analysis.

Changes in the Cost of Operations
Defense Information Systems Agency
TELECOMMUNICATIONS SERVICES AND ENTERPRISE ACQUISITION SERVICES
April 2013
(Dollars in Millions)
FY 2012 Actual FY 2012 $5,676.877
FY 2013 Estimate in FY 2013 President's Budget $6,034.017
Efficiencies:
Efficiencies achieved through contract cost reductions (14.170)
Drawdown of legacy Video and Voice Services Systems (7.180)
Program Changes:
Additional fiber leases required to support customer-driven requirements for more
bandwidth in Southwest Asia, the Pacific, and the Horn of Africa 28.726
Increased transport costs in support of the Department's expansion of enterprise services 7.013
Increased support for DISN engineering, network management, and 24x7 network
operations 33.333
Costs to complete the transition from legacy to IP technology as well as enhance security
on the Joint Worldwide Intelligence Communications System 2.718
Workload for the new Mobile Satellite Services - Broadband Global Area Network service
offering 61.441
Estimated workload for the new Public Key Infrastructure as a Service program, including
one-time implementation costs 7.733
Increased operating costs to support DISA's Defense IT Contracting Organization (DITCO),
including a business case and analysis of alternatives study for a new contract writing
system 8.692
Discontinued central management of Distributed Tactical Communications System radios
field support under the Enhanced Mobile Satellite Services program (25.740)
Reduced budget estimate for Overseas Contingency Operations circuit costs (26.213)
Anticipated reduction in customer-unique reimbursable projects (13.930)
Estimated reduction to customer-driven reimbursable Commercial Satellite Services orders
and Special Telecommunications projects (4.410)
Decreased business volume as a result of a delay in awarding a contract for test and
evaluation services in support of DISA's Joint Interoperability Test Command (39.339)
Reduction in DITCO workload estimates due to obligations for FY 2013 DISN support
contracts occurring in the prior year, thereby reducing contract requirements in FY 2013 (329.381)
FY 2013 Current Estimate $5,723.310
Exhibit Fund 2 - Changes in the Cost of Operations
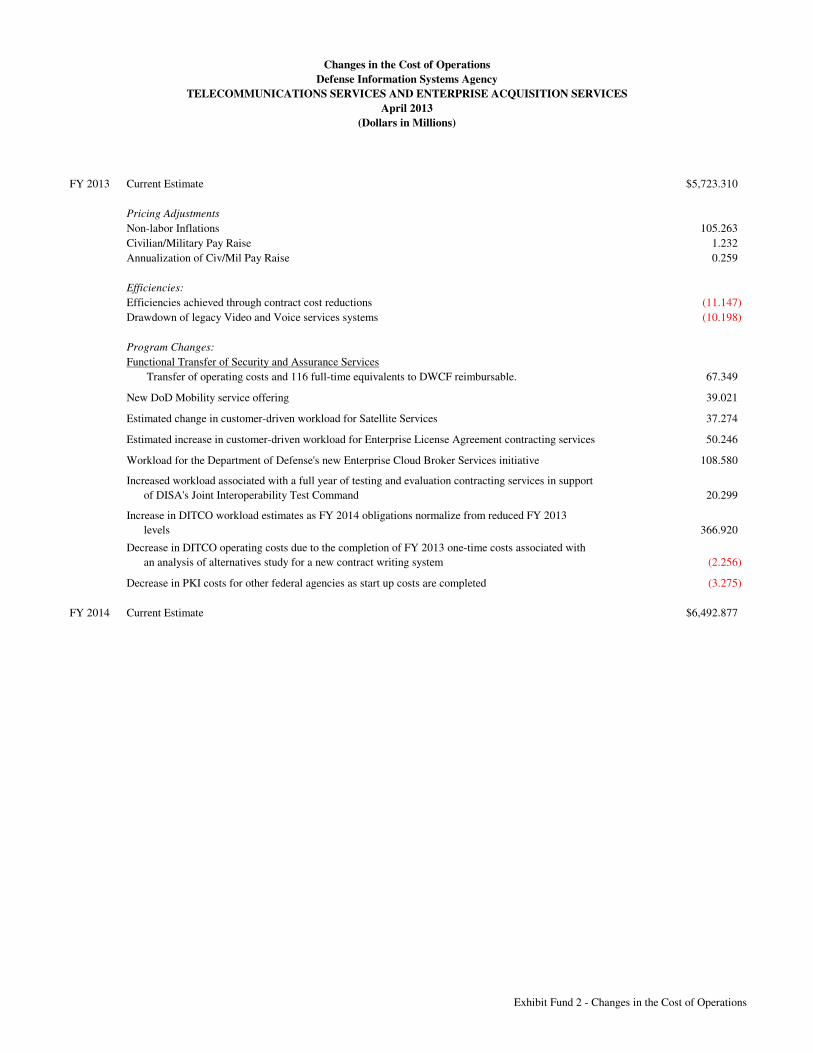
Changes in the Cost of Operations
Defense Information Systems Agency
TELECOMMUNICATIONS SERVICES AND ENTERPRISE ACQUISITION SERVICES
April 2013
(Dollars in Millions)
FY 2013 Current Estimate $5,723.310
Pricing Adjustments
Non-labor Inflations 105.263
Civilian/Military Pay Raise 1.232
Annualization of Civ/Mil Pay Raise 0.259
Efficiencies:
Efficiencies achieved through contract cost reductions (11.147)
Drawdown of legacy Video and Voice services systems (10.198)
Program Changes:
Functional Transfer of Security and Assurance Services
Transfer of operating costs and 116 full-time equivalents to DWCF reimbursable. 67.349
New DoD Mobility service offering 39.021
Estimated change in customer-driven workload for Satellite Services 37.274
Estimated increase in customer-driven workload for Enterprise License Agreement contracting services 50.246
Workload for the Department of Defense's new Enterprise Cloud Broker Services initiative 108.580
Increased workload associated with a full year of testing and evaluation contracting services in support
of DISA's Joint Interoperability Test Command 20.299
Increase in DITCO workload estimates as FY 2014 obligations normalize from reduced FY 2013
levels 366.920
Decrease in DITCO operating costs due to the completion of FY 2013 one-time costs associated with
an analysis of alternatives study for a new contract writing system (2.256)
Decrease in PKI costs for other federal agencies as start up costs are completed (3.275)
FY 2014 Current Estimate $6,492.877
Exhibit Fund 2 - Changes in the Cost of Operations
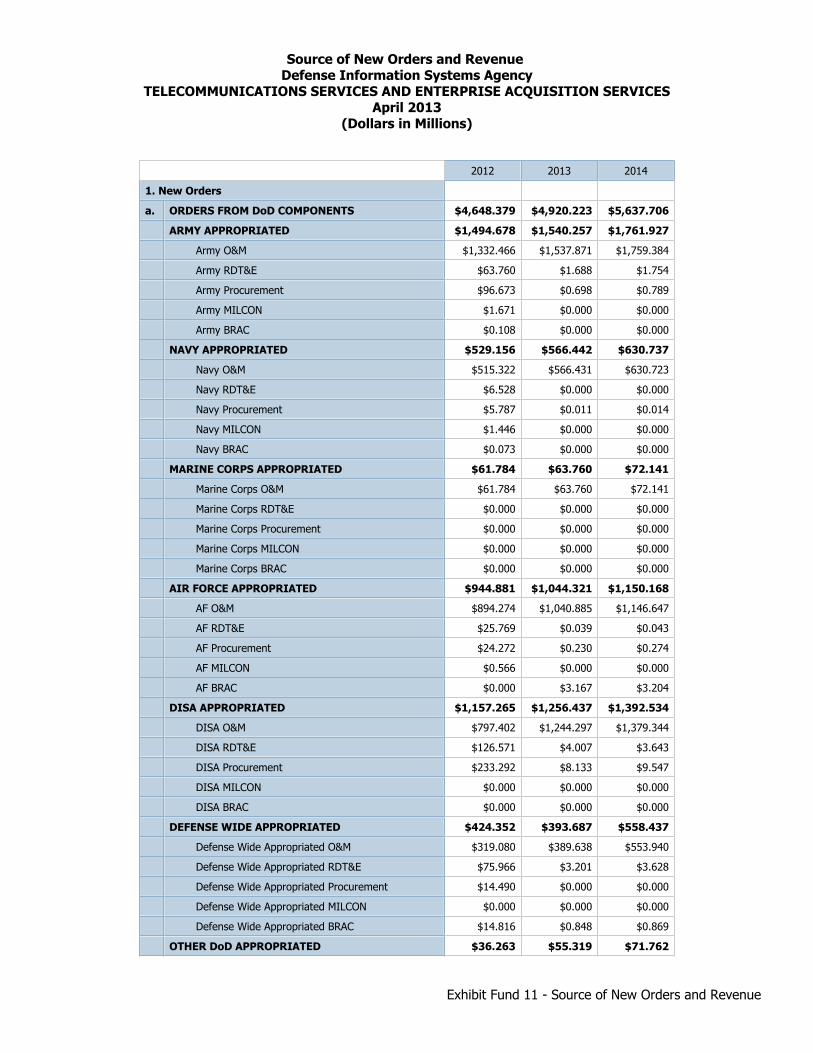
Source of New Orders and Revenue Defense Information Systems Agency
TELECOMMUNICATIONS SERVICES AND ENTERPRISE ACQUISITION SERVICESApril 2013
(Dollars in Millions)
2012 2013 2014
1. New Orders
a. ORDERS FROM DoD COMPONENTS $4,648.379 $4,920.223 $5,637.706
ARMY APPROPRIATED $1,494.678 $1,540.257 $1,761.927
Army O&M $1,332.466 $1,537.871 $1,759.384
Army RDT&E $63.760 $1.688 $1.754
Army Procurement $96.673 $0.698 $0.789
Army MILCON $1.671 $0.000 $0.000
Army BRAC $0.108 $0.000 $0.000
NAVY APPROPRIATED $529.156 $566.442 $630.737
Navy O&M $515.322 $566.431 $630.723
Navy RDT&E $6.528 $0.000 $0.000
Navy Procurement $5.787 $0.011 $0.014
Navy MILCON $1.446 $0.000 $0.000
Navy BRAC $0.073 $0.000 $0.000
MARINE CORPS APPROPRIATED $61.784 $63.760 $72.141
Marine Corps O&M $61.784 $63.760 $72.141
Marine Corps RDT&E $0.000 $0.000 $0.000
Marine Corps Procurement $0.000 $0.000 $0.000
Marine Corps MILCON $0.000 $0.000 $0.000
Marine Corps BRAC $0.000 $0.000 $0.000
AIR FORCE APPROPRIATED $944.881 $1,044.321 $1,150.168
AF O&M $894.274 $1,040.885 $1,146.647
AF RDT&E $25.769 $0.039 $0.043
AF Procurement $24.272 $0.230 $0.274
AF MILCON $0.566 $0.000 $0.000
AF BRAC $0.000 $3.167 $3.204
DISA APPROPRIATED $1,157.265 $1,256.437 $1,392.534
DISA O&M $797.402 $1,244.297 $1,379.344
DISA RDT&E $126.571 $4.007 $3.643
DISA Procurement $233.292 $8.133 $9.547
DISA MILCON $0.000 $0.000 $0.000
DISA BRAC $0.000 $0.000 $0.000
DEFENSE WIDE APPROPRIATED $424.352 $393.687 $558.437
Defense Wide Appropriated O&M $319.080 $389.638 $553.940
Defense Wide Appropriated RDT&E $75.966 $3.201 $3.628
Defense Wide Appropriated Procurement $14.490 $0.000 $0.000
Defense Wide Appropriated MILCON $0.000 $0.000 $0.000
Defense Wide Appropriated BRAC $14.816 $0.848 $0.869
OTHER DoD APPROPRIATED $36.263 $55.319 $71.762
Exhibit Fund 11 - Source of New Orders and Revenue

Source of New Orders and Revenue Defense Information Systems Agency
TELECOMMUNICATIONS SERVICES AND ENTERPRISE ACQUISITION SERVICESApril 2013
(Dollars in Millions)
2012 2013 2014
Other DoD Appropriated O&M $35.568 $54.399 $70.836
Other DoD Appropriated RDT&E $0.050 $0.000 $0.000
Other DoD Appropriated Procurement $0.645 $0.920 $0.926
Other DoD Appropriated MILCON $0.000 $0.000 $0.000
Other DoD Appropriated BRAC $0.000 $0.000 $0.000
b. ORDERS FROM DWCF/REVOLVING FUNDS $862.561 $592.095 $694.644
ARMY - WCF $0.821 $0.000 $0.000
Army Industrial Operations $0.821 $0.000 $0.000
NAVY - WCF $29.178 $0.128 $0.148
Navy Depot Maintenance $0.000 $0.000 $0.000
Navy Base Support $0.005 $0.000 $0.000
Navy Supply Management $0.860 $0.000 $0.000
Marine Corps Supply $0.000 $0.000 $0.000
Marine Corps Depot Maintenance $0.004 $0.000 $0.000
Other Navy Activity Groups $28.309 $0.128 $0.148
AIR FORCE - WCF $68.344 $0.077 $0.090
Consolidated Sustainment Activity Group (CSAG) $1.585 $0.000 $0.000
U.S. Transportation Command (TRANSCOM) $66.759 $0.077 $0.090
DEFENSE WIDE WCF $733.832 $562.912 $661.101
DISA Telecomm Svcs/Ent Acquisition Svcs (TS/EAS) ($0.140) $0.000 $0.000
DISA Computing Services (CSD) $669.610 $545.433 $642.958
Defense Finance and Accounting Service (DFAS) $4.364 $4.207 $4.806
DLA Energy Management $0.000 $0.000 $0.000
DLA Defense Automated Printing Services (DAPS) $5.990 $0.000 $0.000
DLA Supply Chain Management $54.008 $13.272 $13.337
DEFENSE COMMISSARY AGENCY (DECA) $30.315 $28.978 $33.305
DECA Operations $30.315 $27.563 $31.882
DECA Resale $0.000 $1.415 $1.423
OTHER - WORKING CAPITAL $0.000 $0.000 $0.000
OTHER REVOLVING FUNDS $0.071 $0.000 $0.000
Corps of Engineers $0.000 $0.000 $0.000
National Defense Stockpile Transaction Fund $0.000 $0.000 $0.000
Pentagon Reservation Maintenance Revolving Fund $0.071 $0.000 $0.000
PRMRF/BMF $0.000 $0.000 $0.000
c. TOTAL DoD ORDERS $5,510.940 $5,512.318 $6,332.350
d. OTHER ORDERS $169.918 $159.045 $168.725
Exhibit Fund 11 - Source of New Orders and Revenue
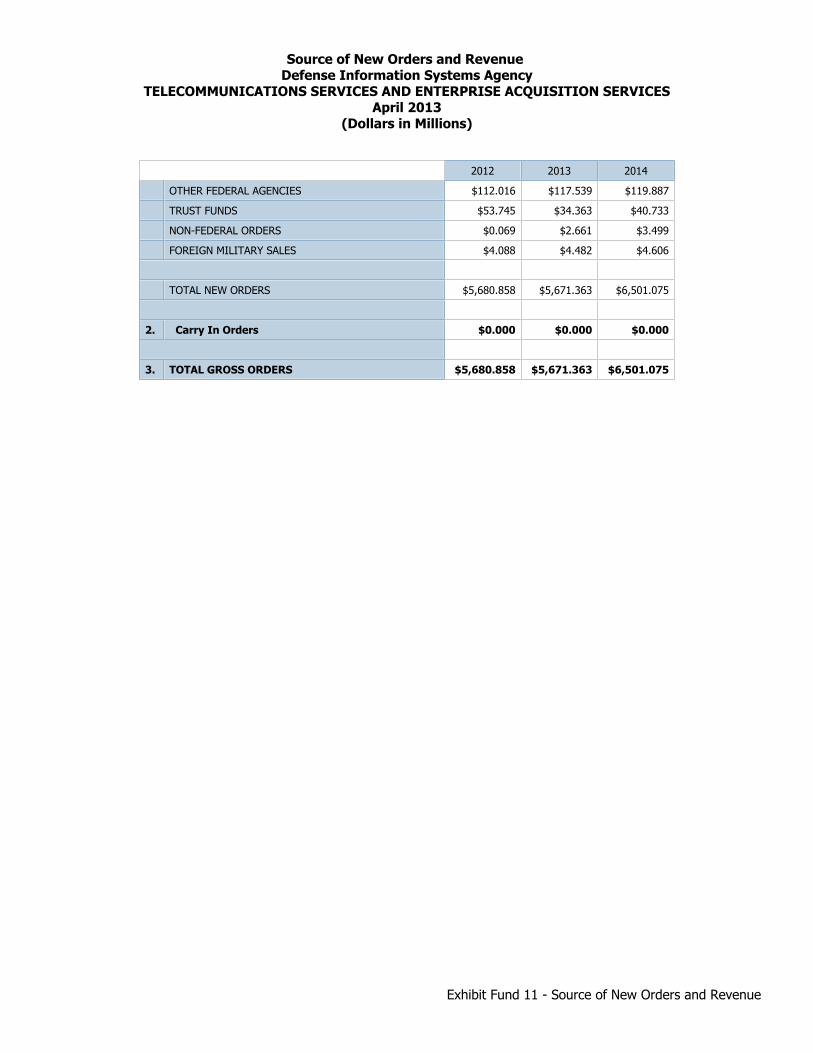
Source of New Orders and Revenue Defense Information Systems Agency
TELECOMMUNICATIONS SERVICES AND ENTERPRISE ACQUISITION SERVICESApril 2013
(Dollars in Millions)
2012 2013 2014
OTHER FEDERAL AGENCIES $112.016 $117.539 $119.887
TRUST FUNDS $53.745 $34.363 $40.733
NON-FEDERAL ORDERS $0.069 $2.661 $3.499
FOREIGN MILITARY SALES $4.088 $4.482 $4.606
TOTAL NEW ORDERS $5,680.858 $5,671.363 $6,501.075
2. Carry In Orders $0.000 $0.000 $0.000
3. TOTAL GROSS ORDERS $5,680.858 $5,671.363 $6,501.075
Exhibit Fund 11 - Source of New Orders and Revenue

Revenue and CostsDefense Information Systems Agency
TELECOMMUNICATIONS SERVICES AND ENTERPRISE ACQUISITION SERVICESApril 2013
(Dollars in Millions)
2012 2013 2014
Revenue
Gross Sales $5,680.858 $5,671.363 $6,501.075
Operations $5,666.320 $5,660.698 $6,490.635
Capital Surcharge $0.000 $0.000 $0.000
Depreciation excluding Major Construction $14.538 $10.665 $10.440
Major Construction Depreciation $0.000 $0.000 $0.000
Other Income $0.000 $0.000 $0.000
Refunds/Discounts (-) $0.000 $0.000 $0.000
Total Income: $5,680.858 $5,671.363 $6,501.075
Costs
Salaries and Wages: $147.341 $172.675 $200.553
Military Personnel Compensation & Benefits $6.889 $5.858 $6.777
Civilian Personnel Compensation & Benefits $140.452 $166.817 $193.776
Travel & Transportation of Personnel $4.894 $5.641 $6.950
Materials & Supplies (For internal Operations) $34.666 $25.423 $26.089
Equipment $247.443 $278.573 $279.330
Capital Investment Less than Threshold $0.000 $0.000 $0.000
Other Purchases from Revolving Funds $51.660 $86.795 $86.256
Transportation of Things $0.938 $0.325 $0.466
Depreciation - Capital $14.538 $10.665 $10.440
Printing and Reproduction $0.028 $0.023 $0.022
Advisory and Assistance Services $7.597 $11.938 $12.155
Rent, Comm, Utilities, & Misc. Charges $1,708.008 $1,681.898 $1,740.832
Other Purchased Services $3,459.764 $3,449.354 $4,129.784
Total Costs $5,676.877 $5,723.310 $6,492.877
Operating Results $3.981 ($51.947) $8.198
Less Capital Surcharge Reservation $0.000 $0.000 $0.000
Less Recover Other $0.000 $0.000 $0.000
+ Passthrough or Other App. Affecting NOR $0.000 $0.000 $0.000
- Passthrough or Other App. not Affecting NOR $0.000 $0.000 $0.000
Other Adjustments Affecting NOR $0.000 $0.000 $0.000
Net Operating Results $3.981 ($51.947) $8.198
Prior Year AOR $77.430 $81.411 $29.464
Other Changes Affecting AOR $0.000 $0.000 $0.000
Accumulated Operating Result $81.411 $29.464 $37.662
Non-Recoverable Adjustment Impacting AOR $0.000 $0.000 $0.000
AOR for Budget Purposes $81.411 $29.464 $37.662
Exhibit Fund 14 - Revenue and Costs
DEFENSE-WIDE WORKING CAPITAL FUND FISCAL YEAR (FY) 2014 BUDGET ESTIMATES
APRIL 2013 OVERVIEW
DEFENSE LOGISTICS AGENCY The Defense Logistics Agency (DLA) is America’s Combat Logistics Support Agency. We provide effective and efficient worldwide support to warfighters and our other customers. We provide full-spectrum logistics support to Soldiers, Sailors, Airmen, Marines, and civilians around the world, everyday. Wherever the diverse DoD global mission takes them, they share a common need for logistics supplies and services. We partner with the services, the combatant commanders (COCOMs), and private industry to provide full-spectrum support. If a Soldier, Sailor, Airman, or Marine wears or eats it, receives medical treatment with it, or uses it as fuel, it comes from our Agency and our sources. When military or civilian artisans need an item to build a new operating area or repair a weapon system, DLA is the foremost provider of those articles as well. We support deployed warfighters in every major conflict and contingency operation over the past five decades, from the Vietnam War to current operations in Iraq and Afghanistan. Our DLA Europe/Africa, Central, and Pacific organizations, along with our in-theater on-the-ground DLA support teams bring logistics products and services to warfighters worldwide and give DLA a global footprint. We support more than 1,600 weapons systems with organizational and intermediate level maintenance parts. Department of Defense (DoD) Supply, Storage and Distribution (SS&D) efforts, under BRAC, moved the Agency into a more prominent role to support service industrial level maintenance for aviation, maritime, and land parts. Our reach now extends to industrial support activities, the cornerstones of sustained long-term weapons systems readiness. In addition to providing military installations energy needs, DLA also furnishes vital logistics support to military hospitals, dining facilities and recruit training centers. Our service to these entities ensures the best in care, comfort and sustainment for the men and women of the Armed Forces. We are also the DoD prime logistics integrator. We provide an array of additional Supply Chain Management (SCM) services, including cataloging and technical information; planning,
forecasting and sourcing; acquisition of materiel and services; strategic tactical distribution functions including receipt, storage, issue, and shipment; retrograde, reutilization and disposal; and document automation and production. DLA is responsible for the entire retail supply chain for bulk petroleum, from the refinery to the consuming end item. We have eliminated the overwhelming majority of service-owned product and related fuels Service Working Capital Funds. A description of each activity group follows: Supply Chain Management The Defense Logistics Agency (DLA) Supply Chain Management Activity Group manages DLA materiel from initial purchase, to distribution and storage, and then finally reutilization or disposal. Costs include operations (salaries and expenses), materiel (items sold to the Military Services) and capital investments (purchase of equipment, software development and minor construction). The DLA Supply Chain Management Activity Group is broken into three business segments: DLA Materiel Supply Chains, DLA Distribution, and DLA Disposition Services. The Materiel Supply Chains fill nearly 28 million customer orders annually from the Military Services, other Federal Agencies, non-federal Agencies and Foreign Military for the 5.2 million consumable items managed by DLA. Also, DLA continues to integrate the BRAC initiatives, assuming procurement responsibility for BRAC Materiel Supply Chains Consumable Item Transfers (CIT), Depot Level Reparable (DLR), and Supply, Storage, and Distribution (SS&D). DLA assumed responsibility for DLR items from the Military Services as well as managing the SS&D functions at the Services’ industrial sites. In 2012, DLA began re-organizing the S&D piece of the SS&D sites, aligning the functions within DLA Distribution. In addition to these new missions, BRAC also directed the logistics re-assignment of over 86,000 consumable NSNs from the Military Services to DLA. DLA Distribution is responsible for the global distribution and warehousing of Military Service and DLA materiel line items. Major customers are the Supply Management Activity Groups of the Military Services and DLA. The Distribution network, which consists of 26 depots strategically located throughout the world, receives and issues over 18.4 million secondary lines and warehouses and maintains over 132.1 million cubic feet of materiel.
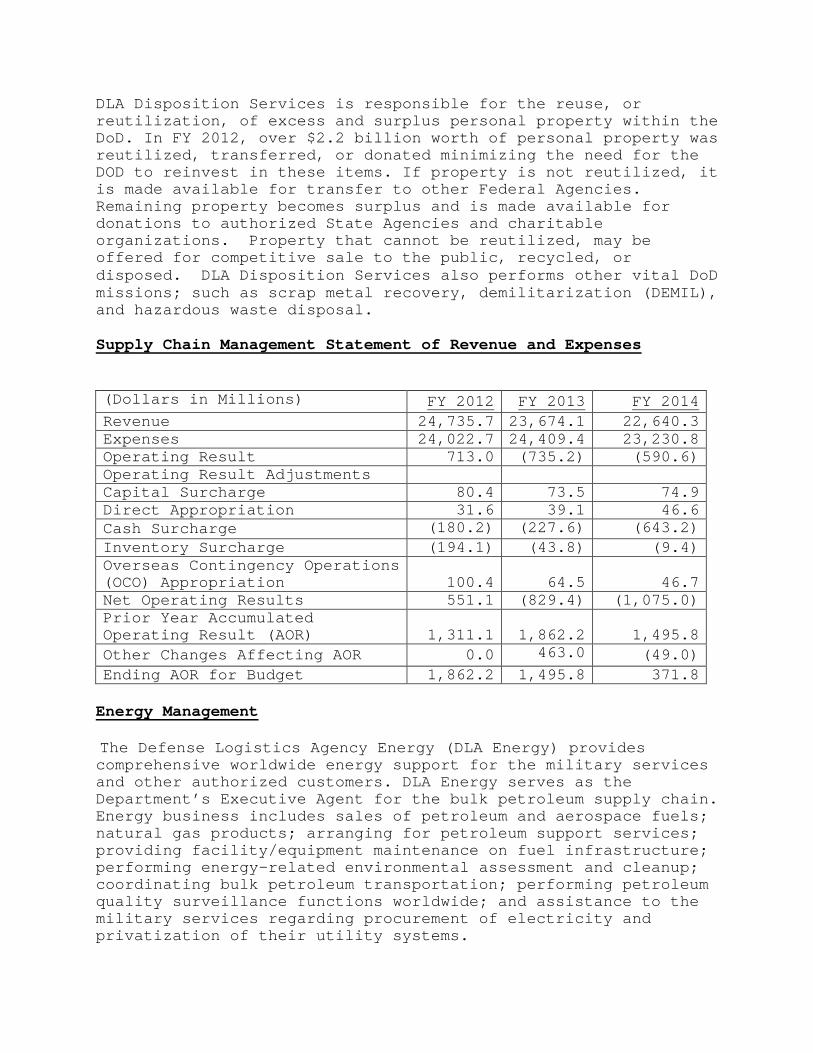
DLA Disposition Services is responsible for the reuse, or reutilization, of excess and surplus personal property within the DoD. In FY 2012, over $2.2 billion worth of personal property was reutilized, transferred, or donated minimizing the need for the DOD to reinvest in these items. If property is not reutilized, it is made available for transfer to other Federal Agencies. Remaining property becomes surplus and is made available for donations to authorized State Agencies and charitable organizations. Property that cannot be reutilized, may be offered for competitive sale to the public, recycled, or disposed. DLA Disposition Services also performs other vital DoD missions; such as scrap metal recovery, demilitarization (DEMIL), and hazardous waste disposal. Supply Chain Management Statement of Revenue and Expenses (Dollars in Millions) FY 2012 FY 2013 FY 2014 Revenue 24,735.7 23,674.1 22,640.3 Expenses 24,022.7 24,409.4 23,230.8 Operating Result 713.0 (735.2) (590.6) Operating Result Adjustments Capital Surcharge 80.4 73.5 74.9 Direct Appropriation 31.6 39.1 46.6 Cash Surcharge (180.2) (227.6) (643.2) Inventory Surcharge (194.1) (43.8) (9.4) Overseas Contingency Operations (OCO) Appropriation 100.4 64.5 46.7 Net Operating Results 551.1 (829.4) (1,075.0) Prior Year Accumulated Operating Result (AOR) 1,311.1 1,862.2 1,495.8 Other Changes Affecting AOR 0.0 463.0 (49.0) Ending AOR for Budget 1,862.2 1,495.8 371.8 Energy Management The Defense Logistics Agency Energy (DLA Energy) provides comprehensive worldwide energy support for the military services and other authorized customers. DLA Energy serves as the Department’s Executive Agent for the bulk petroleum supply chain. Energy business includes sales of petroleum and aerospace fuels; natural gas products; arranging for petroleum support services; providing facility/equipment maintenance on fuel infrastructure; performing energy-related environmental assessment and cleanup; coordinating bulk petroleum transportation; performing petroleum quality surveillance functions worldwide; and assistance to the military services regarding procurement of electricity and privatization of their utility systems.
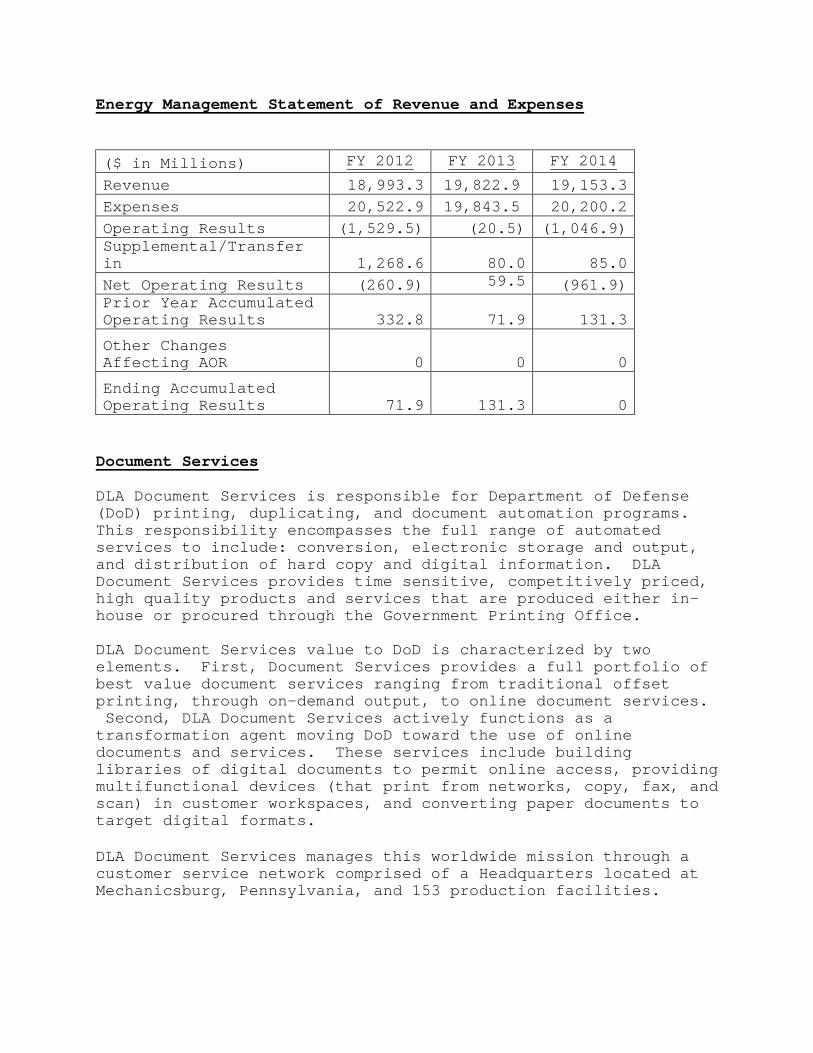
Energy Management Statement of Revenue and Expenses ($ in Millions) FY 2012 FY 2013 FY 2014
Revenue 18,993.3 19,822.9 19,153.3 Expenses 20,522.9 19,843.5 20,200.2 Operating Results (1,529.5) (20.5) (1,046.9) Supplemental/Transfer in 1,268.6
80.0
85.0
Net Operating Results (260.9) 59.5 (961.9) Prior Year Accumulated Operating Results 332.8 71.9 131.3
Other Changes Affecting AOR 0 0 0
Ending Accumulated Operating Results 71.9 131.3 0
Document Services DLA Document Services is responsible for Department of Defense (DoD) printing, duplicating, and document automation programs. This responsibility encompasses the full range of automated services to include: conversion, electronic storage and output, and distribution of hard copy and digital information. DLA Document Services provides time sensitive, competitively priced, high quality products and services that are produced either in-house or procured through the Government Printing Office. DLA Document Services value to DoD is characterized by two elements. First, Document Services provides a full portfolio of best value document services ranging from traditional offset printing, through on-demand output, to online document services. Second, DLA Document Services actively functions as a transformation agent moving DoD toward the use of online documents and services. These services include building libraries of digital documents to permit online access, providing multifunctional devices (that print from networks, copy, fax, and scan) in customer workspaces, and converting paper documents to target digital formats. DLA Document Services manages this worldwide mission through a customer service network comprised of a Headquarters located at Mechanicsburg, Pennsylvania, and 153 production facilities.
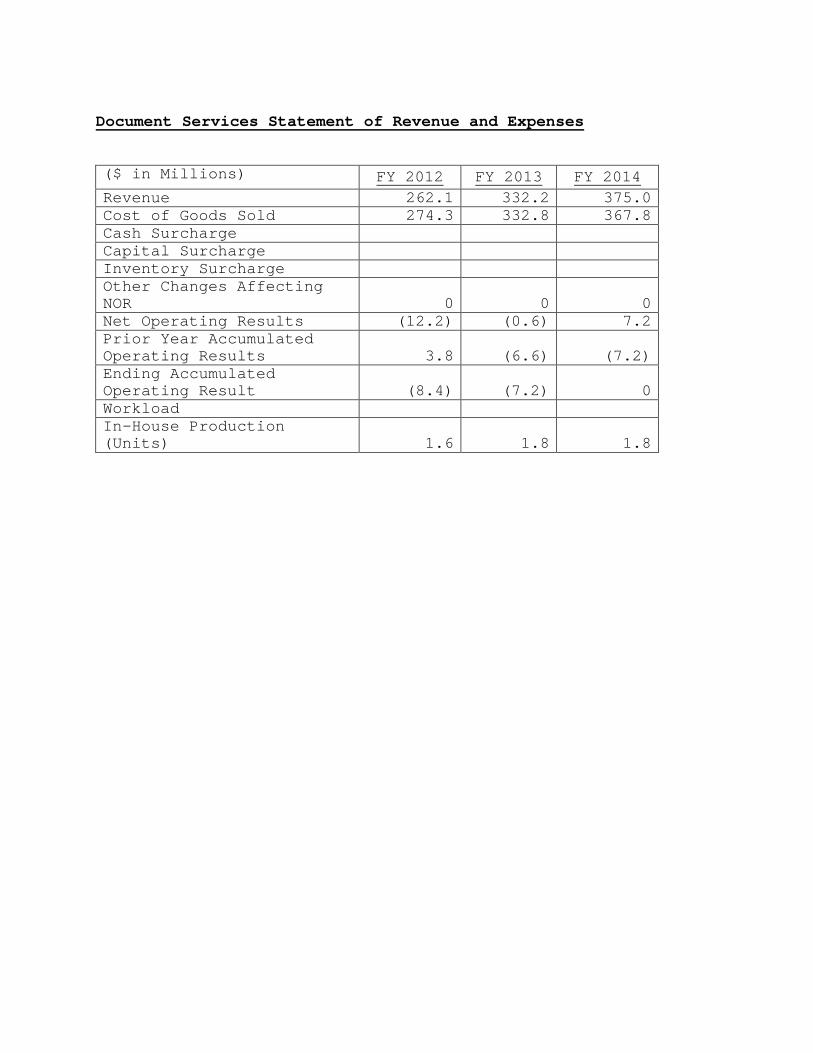
Document Services Statement of Revenue and Expenses ($ in Millions) FY 2012 FY 2013 FY 2014 Revenue 262.1 332.2 375.0 Cost of Goods Sold 274.3 332.8 367.8 Cash Surcharge Capital Surcharge Inventory Surcharge Other Changes Affecting NOR 0 0 0 Net Operating Results (12.2) (0.6) 7.2 Prior Year Accumulated Operating Results 3.8 (6.6) (7.2) Ending Accumulated Operating Result (8.4) (7.2) 0 Workload In-House Production (Units) 1.6 1.8 1.8
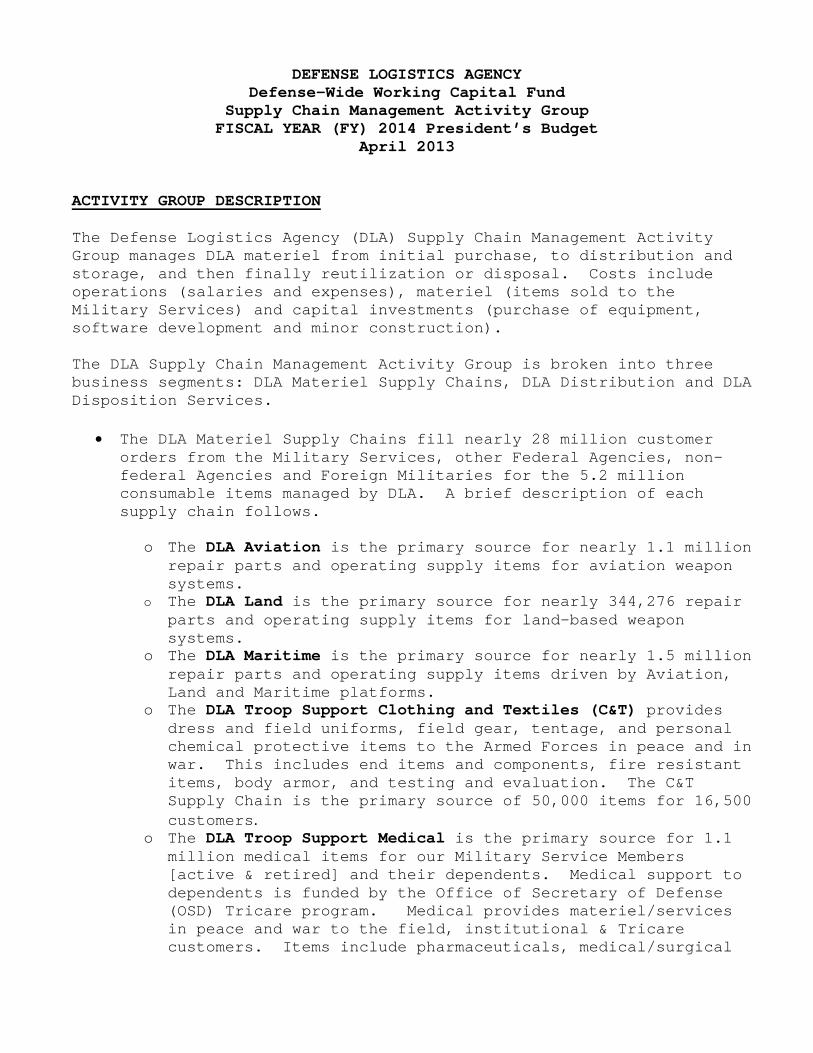
DEFENSE LOGISTICS AGENCY Defense-Wide Working Capital Fund
Supply Chain Management Activity Group FISCAL YEAR (FY) 2014 President’s Budget
April 2013 ACTIVITY GROUP DESCRIPTION The Defense Logistics Agency (DLA) Supply Chain Management Activity Group manages DLA materiel from initial purchase, to distribution and storage, and then finally reutilization or disposal. Costs include operations (salaries and expenses), materiel (items sold to the Military Services) and capital investments (purchase of equipment, software development and minor construction). The DLA Supply Chain Management Activity Group is broken into three business segments: DLA Materiel Supply Chains, DLA Distribution and DLA Disposition Services.
• The DLA Materiel Supply Chains fill nearly 28 million customer orders from the Military Services, other Federal Agencies, non-federal Agencies and Foreign Militaries for the 5.2 million consumable items managed by DLA. A brief description of each supply chain follows.
o The DLA Aviation is the primary source for nearly 1.1 million
repair parts and operating supply items for aviation weapon systems.
o The DLA Land is the primary source for nearly 344,276 repair parts and operating supply items for land-based weapon systems.
o The DLA Maritime is the primary source for nearly 1.5 million repair parts and operating supply items driven by Aviation, Land and Maritime platforms.
o The DLA Troop Support Clothing and Textiles (C&T) provides dress and field uniforms, field gear, tentage, and personal chemical protective items to the Armed Forces in peace and in war. This includes end items and components, fire resistant items, body armor, and testing and evaluation. The C&T Supply Chain is the primary source of 50,000 items for 16,500 customers.
o The DLA Troop Support Medical is the primary source for 1.1 million medical items for our Military Service Members [active & retired] and their dependents. Medical support to dependents is funded by the Office of Secretary of Defense (OSD) Tricare program. Medical provides materiel/services in peace and war to the field, institutional & Tricare customers. Items include pharmaceuticals, medical/surgical
supplies, instruments and services, equipment, and other health care items.
o The DLA Troop Support Subsistence is the primary source for 83,073 Subsistence items including fresh fruits and vegetables (frozen, chilled and dry), food fielding and food service equipment and operational ration items most notably the “Meals Ready-to-Eat”.
o The DLA Troop Support Construction and Equipment (C&E) gives our Armed Forces and other Federal Agencies a source for over 1.1 million National Stock Numbers (NSNs), and other essential products and associated services. The C&E product line is as diverse as light bulbs and bulldozers. It supplies items and services for force protection, safety and rescue, fire and emergencies, storage, Heating, Ventilating and Air Conditioning (HVAC), plumbing, heavy equipment, metals and lumber, nails, bolts, screws, locks, gaskets, imaging and telecommunication devices, targets for training, Automatic Data Processing (ADP) equipment and supplies, and retail replenishment services at major overhaul activities.
o DLA Distribution is responsible for the global distribution and warehousing of Military Service and DLA materiel line items. Major customers are the Supply Management Activity Groups of the Military Services and DLA. The Distribution network, which consists of 26 depots strategically located throughout the world, received and issued 18.4 million secondary lines and warehouses and maintained an estimated 132.1 million cubic feet of materiel in FY 2012.
o DLA Disposition Services is responsible for the reuse, or reutilization, of excess and surplus personal property within the Department of Defense (DoD). In FY 2012, an estimated $2.2 billion worth of personal property will be reutilized, transferred, or donated, minimizing the need for DoD to reinvest in these items. If property is not reutilized, it is made available for transfer to other Federal Agencies. Remaining property becomes surplus and is made available for donations to authorized State Agencies and charitable organizations. Property that cannot be reutilized, may be offered for competitive sale to the public, recycled, or disposed. DLA Disposition Services also performs other vital DoD missions; such as scrap metal recovery, demilitarization (DEMIL), and hazardous waste disposal.
In addition, DLA’s Supply Chain Management includes a small number of DoD Logistics Support Activities, such as the DLA Logistics Information Service and DLA Transaction Services.
• The DLA Logistics Information Service supports all logistics functions for DoD, other Federal and Civil Agencies, and international allied partners by managing and distributing
logistics data on over 6.5 million National Stock Numbers (NSNs) resident in the Federal Logistics Information System.
• The DLA Transaction Services designs, develops, and implements logistics solutions that improve customers’ requisition processing and logistics management processes worldwide. The primary mission is to receive, edit, and route logistics transactions for the Military Services and Federal Agencies. The DLA Transaction Services processes over 10 billion DoD logistics transactions per year, applies numerous DoD and Service/Agency edits and validations against these transactions, and routes the data to the appropriate destination.
ACTIVITY GROUP BUSINESS CHANGES DLA continues to integrate the BRAC initiatives, assuming procurement responsibility for BRAC Materiel Supply Chains Consumable Item Transfers (CIT), Depot Level Reparable (DLR), and Supply, Storage, and Distribution (SS&D). DLA assumed responsibility for DLR items from the Military Services as well as managing the SS&D functions at the Services’ industrial sites. In 2012, DLA began re-organizing the S&D piece of the SS&D sites, aligning the functions within DLA Distribution. In addition to these new missions, BRAC also directed the logistics re-assignment of over 86,000 consumable NSNs from the Military Services to DLA from 2007 to 2011.
• CIT - the Logistics Re-Assignments portion of the CIT were completed in 2011. DLA is continuing to reimburse the Military Services for open undelivered orders upon re-assignment of each item based on a joint validation process with each Military Service. We estimate this reimbursement to total roughly $720 million over the period. DLA has reimbursed the Military Services a total of $400 million ($235 million to the Air Force and $165 million to the Navy), of which $5 million was reimbursed in October 2012. In FY 2013, we are projecting $118 million will be reimbursed to the Army and $53 million to the Navy. In FY 2014, $154 million will be reimbursed to the Army.
• DLR - in support of the DLR initiative, DLA implemented a DLR Billable Hour Rate (DBR) reimbursement methodology in FY 2012. This rate-based reimbursement method was coordinated with the Military Services and represents a multiple year effort from a joint service Integrated Product Team (IPT).
• SS&D - DLA implemented the Local Recovery Rate (LRR) at the Air Force (AF) SS&D sites in FY 2011 and will evaluate using a similar methodology to convert Navy SS&D sites to an LRR in FY 2015.
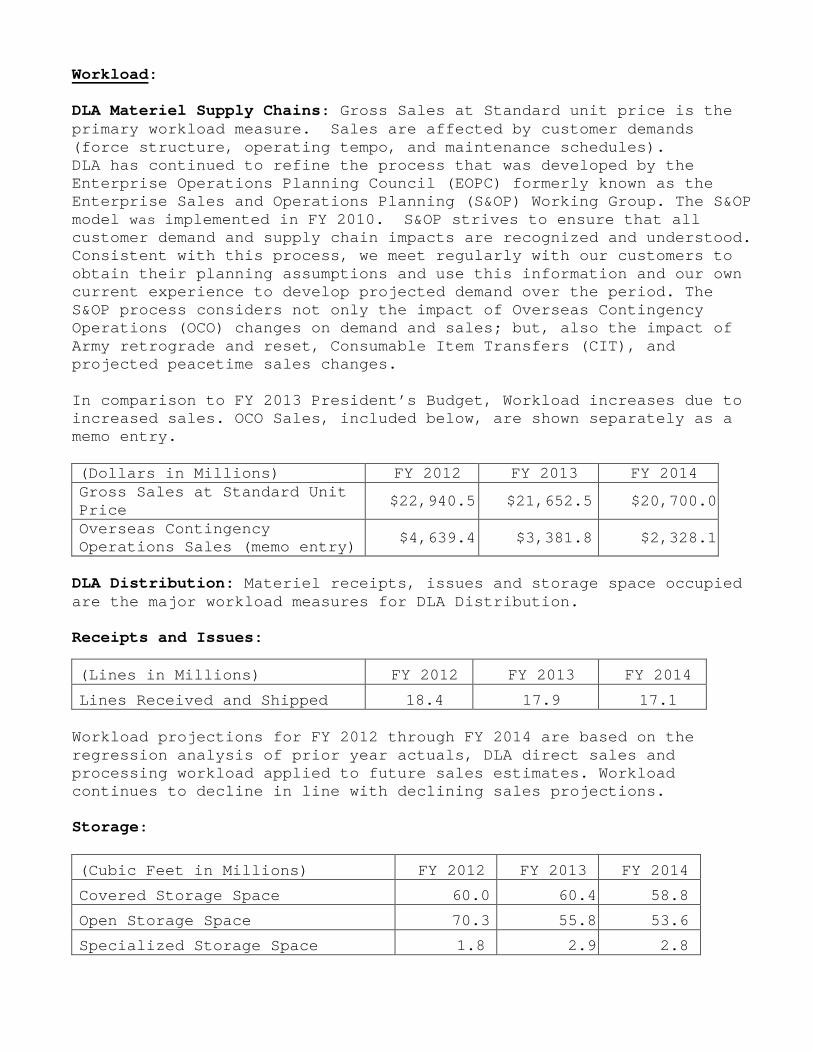
Workload: DLA Materiel Supply Chains: Gross Sales at Standard unit price is the primary workload measure. Sales are affected by customer demands (force structure, operating tempo, and maintenance schedules). DLA has continued to refine the process that was developed by the Enterprise Operations Planning Council (EOPC) formerly known as the Enterprise Sales and Operations Planning (S&OP) Working Group. The S&OP model was implemented in FY 2010. S&OP strives to ensure that all customer demand and supply chain impacts are recognized and understood. Consistent with this process, we meet regularly with our customers to obtain their planning assumptions and use this information and our own current experience to develop projected demand over the period. The S&OP process considers not only the impact of Overseas Contingency Operations (OCO) changes on demand and sales; but, also the impact of Army retrograde and reset, Consumable Item Transfers (CIT), and projected peacetime sales changes. In comparison to FY 2013 President’s Budget, Workload increases due to increased sales. OCO Sales, included below, are shown separately as a memo entry. (Dollars in Millions) FY 2012 FY 2013 FY 2014 Gross Sales at Standard Unit Price $22,940.5 $21,652.5 $20,700.0
Overseas Contingency Operations Sales (memo entry) $4,639.4 $3,381.8 $2,328.1
DLA Distribution: Materiel receipts, issues and storage space occupied are the major workload measures for DLA Distribution. Receipts and Issues:
(Lines in Millions) FY 2012 FY 2013 FY 2014
Lines Received and Shipped 18.4 17.9 17.1 Workload projections for FY 2012 through FY 2014 are based on the regression analysis of prior year actuals, DLA direct sales and processing workload applied to future sales estimates. Workload continues to decline in line with declining sales projections. Storage:
(Cubic Feet in Millions) FY 2012 FY 2013 FY 2014
Covered Storage Space 60.0 60.4 58.8
Open Storage Space 70.3 55.8 53.6
Specialized Storage Space 1.8 2.9 2.8

Storage workload projections are based on the previous twelve months of actual data. Workload for FY 2014 was adjusted in line with the Joint Logistics Board decision of February 2012 to reduce secondary items in storage. DLA Disposition Services: The line items and acquisition value are the two workload measures.
FY 2012 FY 2013 FY 2014
Line Items in Millions 3.6 3.2 3.2 Acquisition Value (Dollars in Billions) $31.0 $25.0 $23.1 Workload line items and acquisition value decrease from FY 2012 to FY 2014. The decrease is due to the force drawdown in Iraq. DLA Disposition Services anticipates a reduction in the value of the property to be received in Iraq from FY 2012 to FY 2014. Operational Performance Indicators:
The following are major measures that DLA uses to assess its performance:
• Perfect Order Fulfillment (POF) – is a comprehensive measure covering all orders received in the Materiel Supply Chains. POF incorporates four components:
1. Timeliness: Did the customer receive the order on time? 2. Quantity: Did the amount shipped match the amount requested? 3. Quality: Were there any customer complaints regarding the
quality of the product? 4. Documentation: Were there any customer complaints regarding
the documentation received with the product?
FY 2011 FY 2012 FY 2013 FY 2014 Goal 84.95 85.78 87.00 87.00 Actual 85.88 87.08 N/A N/A
A perfect order is one where all four components are met. The cumulative DLA FY 2013 goal is set at 87.00 percent. DLA’s actual cumulative performance as of 31 December 2012 was 86.30 percent. The current documented FY 2013 goal is being revised to be set at 87.00 percent based on FY 2012 performance.
As POF is a comprehensive metric that crosses DLA, United States Transportation Command (USTRANSCOM), and Combatant Commands (COCOMs), the following contributing metrics are used to focus on DLA’s contribution towards POF:
o Material Availability (MA) – is the immediate availability and release of DLA material, both stocked and under long term contracts/prime vendor arrangements, against received customer orders.
o Logistics Response Time (LRT) – measures the time it takes to complete a customer’s order-from creation to satisfaction (customer receipt) of that order. DLA measures and tracks the average LRT for its customers by number of days.
o Demand Plan Accuracy (DPA) – measures the degree of accuracy of a demand forecast compared to the actual demand.
o Attainment to Plan (ATP) – identifies the percentage of material deliveries generated through the supply planning process that meet three criteria: quantity, quality, and timeliness.
• High Priority Material Release Orders (Hi Pri MROs) – the standard for shipment of high priority MROs is one calendar day. DLA Distribution’s focus is on achieving the one day standard 85% of the time. For FY 2012 (i.e. the 12 month period concluding September 2012), DLA Distribution shipped 88.2% of high priority MROs to the one day standard. The goal for both FY 2013 and FY 2014 remains 85%. The high priority MRO metric excludes MRO transactions that do not conform to a one day standard, such as:
o Dedicated truck shipments - these shipments are based on schedules agreed to with the customer
o Foreign Military Sales (FMS) shipments
o Non-consumable Item Material Support Code (NIMSC) End Item shipments (NIMSC = 3)
o BRAC related material movements
• Routine Material Release Orders (Routine MROs) - the standard for shipment of routine priority MROs is three calendar days. DLA Distribution’s focus is on achieving the three day standard 85% of the time. For FY 2012 (i.e. the 12 month period concluding September 2012), DLA Distribution shipped 90.6% of routine MROs to the three day standard. The goal for both FY 2013 and FY 2014 remains 85%. The routine MRO metric excludes MRO transactions that do not conform to a three day standard, such as:
o Dedicated truck shipments - these shipments are based on schedules agreed to with the customer
o Foreign Military Sales (FMS) shipments
o Non-consumable Item Material Support Code (NIMSC) End Item shipments (NIMSC = 3)
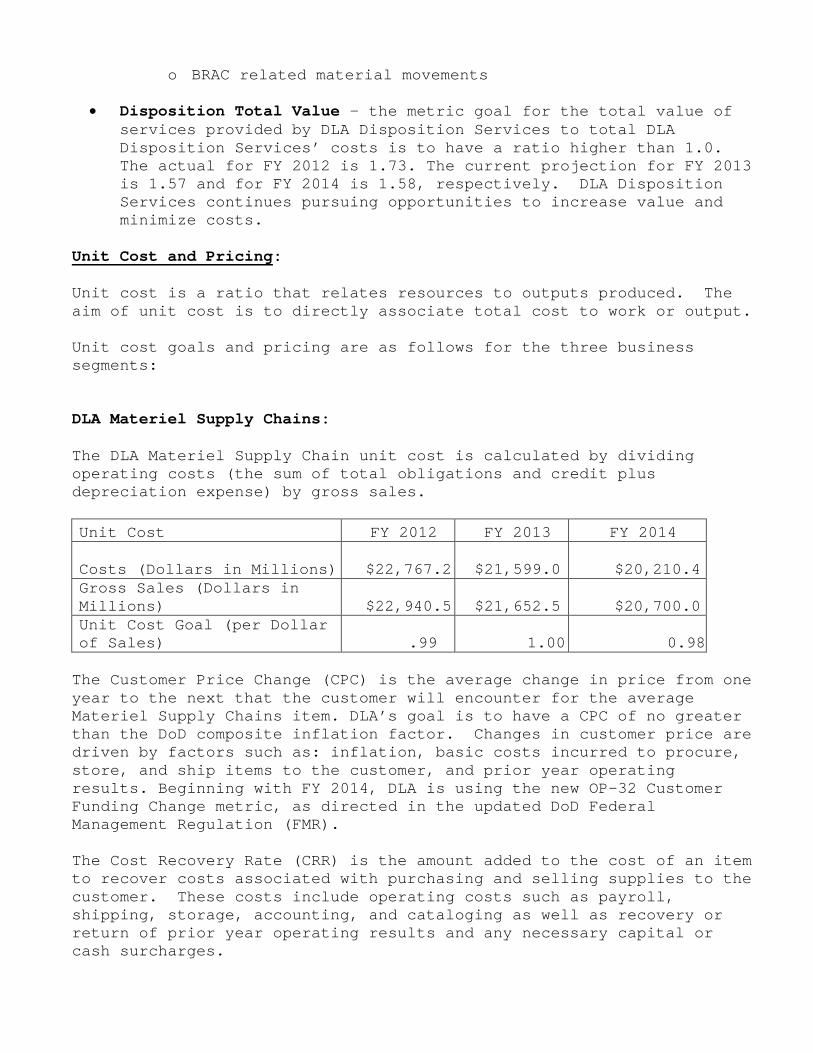
o BRAC related material movements
• Disposition Total Value - the metric goal for the total value of services provided by DLA Disposition Services to total DLA Disposition Services’ costs is to have a ratio higher than 1.0. The actual for FY 2012 is 1.73. The current projection for FY 2013 is 1.57 and for FY 2014 is 1.58, respectively. DLA Disposition Services continues pursuing opportunities to increase value and minimize costs.
Unit Cost and Pricing: Unit cost is a ratio that relates resources to outputs produced. The aim of unit cost is to directly associate total cost to work or output. Unit cost goals and pricing are as follows for the three business segments: DLA Materiel Supply Chains: The DLA Materiel Supply Chain unit cost is calculated by dividing operating costs (the sum of total obligations and credit plus depreciation expense) by gross sales. Unit Cost FY 2012 FY 2013 FY 2014
Costs (Dollars in Millions) $22,767.2
$21,599.0 $20,210.4 Gross Sales (Dollars in Millions) $22,940.5
$21,652.5 $20,700.0
Unit Cost Goal (per Dollar of Sales) .99 1.00 0.98 The Customer Price Change (CPC) is the average change in price from one year to the next that the customer will encounter for the average Materiel Supply Chains item. DLA’s goal is to have a CPC of no greater than the DoD composite inflation factor. Changes in customer price are driven by factors such as: inflation, basic costs incurred to procure, store, and ship items to the customer, and prior year operating results. Beginning with FY 2014, DLA is using the new OP-32 Customer Funding Change metric, as directed in the updated DoD Federal Management Regulation (FMR). The Cost Recovery Rate (CRR) is the amount added to the cost of an item to recover costs associated with purchasing and selling supplies to the customer. These costs include operating costs such as payroll, shipping, storage, accounting, and cataloging as well as recovery or return of prior year operating results and any necessary capital or cash surcharges.
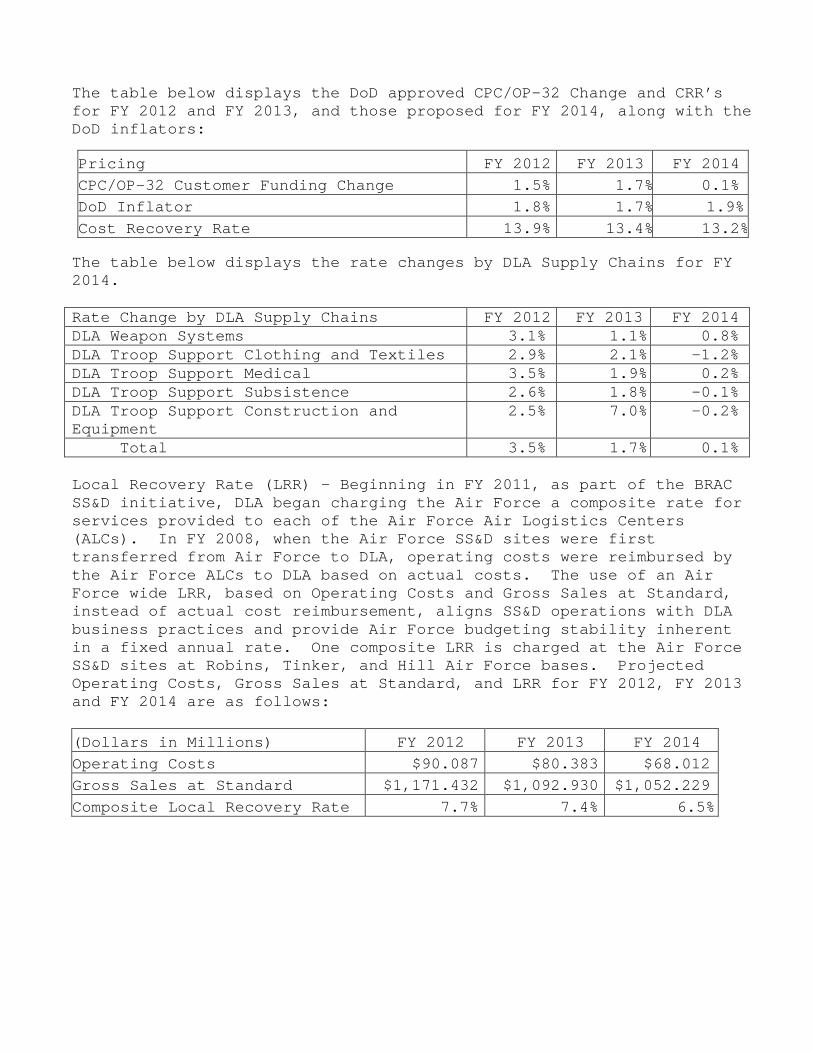
The table below displays the DoD approved CPC/OP-32 Change and CRR’s for FY 2012 and FY 2013, and those proposed for FY 2014, along with the DoD inflators:
Pricing FY 2012 FY 2013 FY 2014 CPC/OP-32 Customer Funding Change 1.5% 1.7% 0.1% DoD Inflator 1.8% 1.7% 1.9% Cost Recovery Rate 13.9% 13.4% 13.2% The table below displays the rate changes by DLA Supply Chains for FY 2014. Rate Change by DLA Supply Chains FY 2012 FY 2013 FY 2014 DLA Weapon Systems 3.1% 1.1% 0.8% DLA Troop Support Clothing and Textiles 2.9% 2.1% -1.2% DLA Troop Support Medical 3.5% 1.9% 0.2% DLA Troop Support Subsistence 2.6% 1.8% -0.1% DLA Troop Support Construction and Equipment
2.5% 7.0% -0.2%
Total 3.5% 1.7% 0.1% Local Recovery Rate (LRR) – Beginning in FY 2011, as part of the BRAC SS&D initiative, DLA began charging the Air Force a composite rate for services provided to each of the Air Force Air Logistics Centers (ALCs). In FY 2008, when the Air Force SS&D sites were first transferred from Air Force to DLA, operating costs were reimbursed by the Air Force ALCs to DLA based on actual costs. The use of an Air Force wide LRR, based on Operating Costs and Gross Sales at Standard, instead of actual cost reimbursement, aligns SS&D operations with DLA business practices and provide Air Force budgeting stability inherent in a fixed annual rate. One composite LRR is charged at the Air Force SS&D sites at Robins, Tinker, and Hill Air Force bases. Projected Operating Costs, Gross Sales at Standard, and LRR for FY 2012, FY 2013 and FY 2014 are as follows: (Dollars in Millions) FY 2012 FY 2013 FY 2014 Operating Costs $90.087 $80.383 $68.012 Gross Sales at Standard $1,171.432 $1,092.930 $1,052.229 Composite Local Recovery Rate 7.7% 7.4% 6.5%
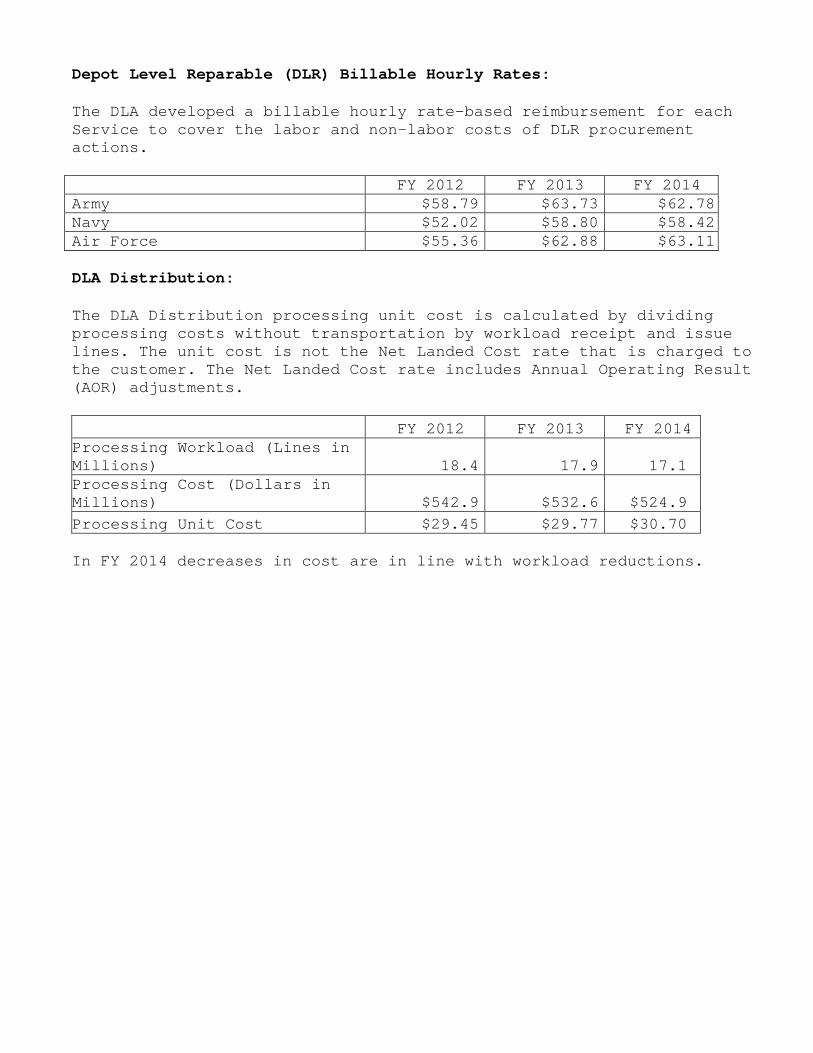
Depot Level Reparable (DLR) Billable Hourly Rates:
The DLA developed a billable hourly rate-based reimbursement for each Service to cover the labor and non-labor costs of DLR procurement actions.
FY 2012 FY 2013 FY 2014 Army $58.79 $63.73 $62.78 Navy $52.02 $58.80 $58.42 Air Force $55.36 $62.88 $63.11
DLA Distribution:
The DLA Distribution processing unit cost is calculated by dividing processing costs without transportation by workload receipt and issue lines. The unit cost is not the Net Landed Cost rate that is charged to the customer. The Net Landed Cost rate includes Annual Operating Result (AOR) adjustments.
FY 2012 FY 2013 FY 2014 Processing Workload (Lines in Millions) 18.4 17.9 17.1 Processing Cost (Dollars in Millions) $542.9 $532.6 $524.9 Processing Unit Cost $29.45 $29.77 $30.70 In FY 2014 decreases in cost are in line with workload reductions.
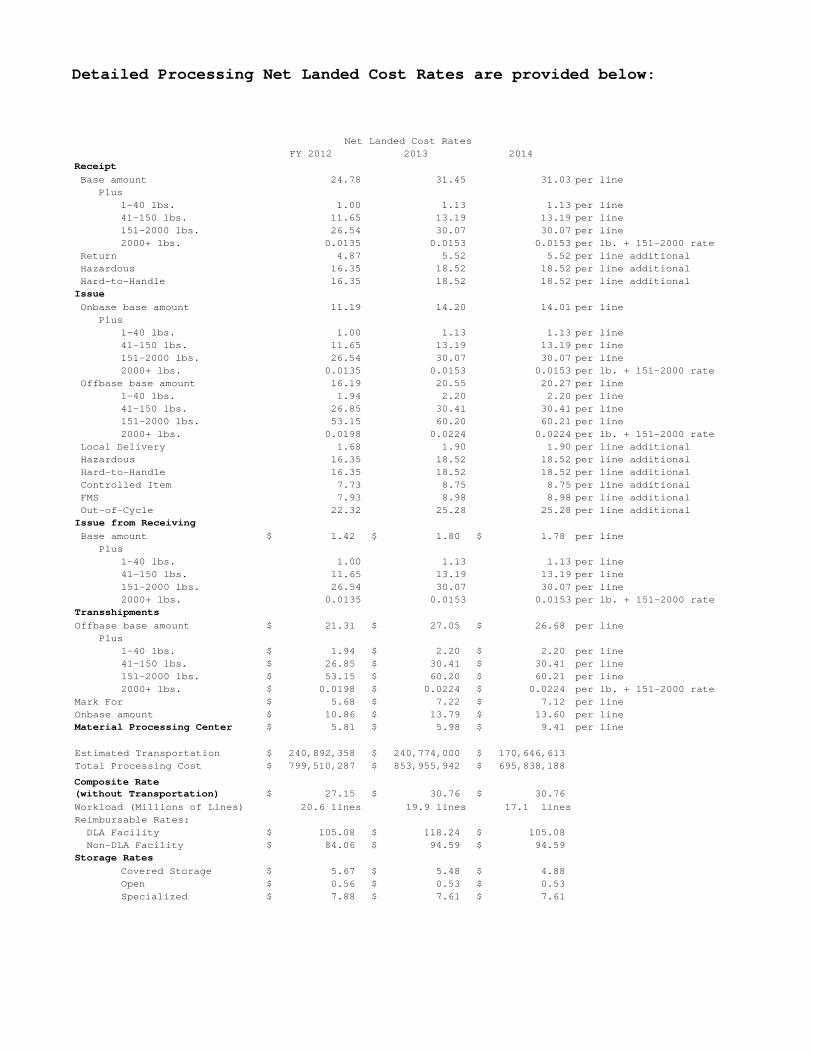
Detailed Processing Net Landed Cost Rates are provided below:
FY 2012 2013 2014Receipt Base amount 24.78 31.45 31.03 per line Plus
1-40 lbs. 1.00 1.13 1.13 per line41-150 lbs. 11.65 13.19 13.19 per line151-2000 lbs. 26.54 30.07 30.07 per line2000+ lbs. 0.0135 0.0153 0.0153 per lb. + 151-2000 rate
Return 4.87 5.52 5.52 per line additional Hazardous 16.35 18.52 18.52 per line additional Hard-to-Handle 16.35 18.52 18.52 per line additionalIssue Onbase base amount 11.19 14.20 14.01 per line Plus
1-40 lbs. 1.00 1.13 1.13 per line41-150 lbs. 11.65 13.19 13.19 per line151-2000 lbs. 26.54 30.07 30.07 per line2000+ lbs. 0.0135 0.0153 0.0153 per lb. + 151-2000 rate
Offbase base amount 16.19 20.55 20.27 per line1-40 lbs. 1.94 2.20 2.20 per line41-150 lbs. 26.85 30.41 30.41 per line151-2000 lbs. 53.15 60.20 60.21 per line2000+ lbs. 0.0198 0.0224 0.0224 per lb. + 151-2000 rate
Local Delivery 1.68 1.90 1.90 per line additional Hazardous 16.35 18.52 18.52 per line additional Hard-to-Handle 16.35 18.52 18.52 per line additional Controlled Item 7.73 8.75 8.75 per line additional FMS 7.93 8.98 8.98 per line additional Out-of-Cycle 22.32 25.28 25.28 per line additionalIssue from Receiving Base amount 1.42$ 1.80$ 1.78$ per line Plus
1-40 lbs. 1.00 1.13 1.13 per line41-150 lbs. 11.65 13.19 13.19 per line151-2000 lbs. 26.54 30.07 30.07 per line2000+ lbs. 0.0135 0.0153 0.0153 per lb. + 151-2000 rate
TransshipmentsOffbase base amount 21.31$ 27.05$ 26.68$ per line Plus
1-40 lbs. 1.94$ 2.20$ 2.20$ per line41-150 lbs. 26.85$ 30.41$ 30.41$ per line151-2000 lbs. 53.15$ 60.20$ 60.21$ per line2000+ lbs. 0.0198$ 0.0224$ 0.0224$ per lb. + 151-2000 rate
Mark For 5.68$ 7.22$ 7.12$ per lineOnbase amount 10.86$ 13.79$ 13.60$ per lineMaterial Processing Center 5.81$ 5.98$ 9.41$ per line
Estimated Transportation 240,892,358$ 240,774,000$ 170,646,613$ Total Processing Cost 799,510,287$ 853,955,942$ 695,838,188$
27.15$ 30.76$ 30.76$ Workload (Millions of Lines) 20.6 lines 19.9 lines 17.1 linesReimbursable Rates: DLA Facility 105.08$ 118.24$ 105.08$ Non-DLA Facility 84.06$ 94.59$ 94.59$ Storage Rates
Covered Storage 5.67$ 5.48$ 4.88$ Open 0.56$ 0.53$ 0.53$ Specialized 7.88$ 7.61$ 7.61$
Composite Rate (without Transportation)
Net Landed Cost Rates
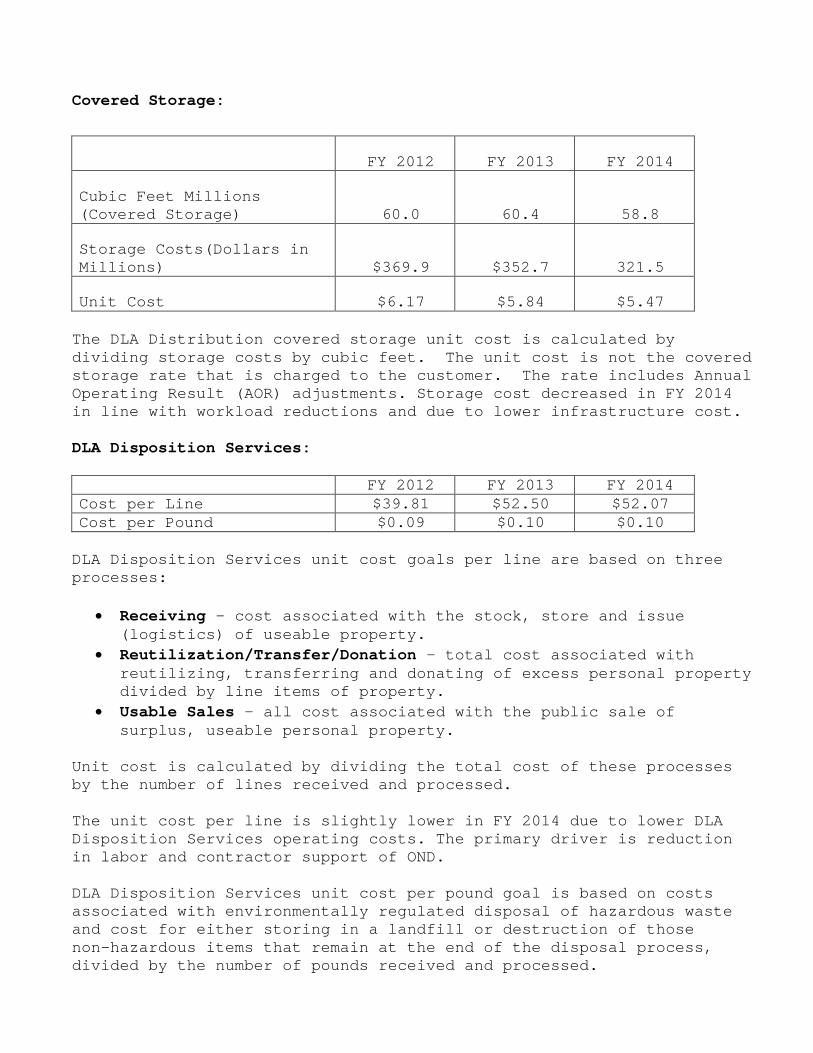
Covered Storage:
FY 2012 FY 2013 FY 2014
Cubic Feet Millions (Covered Storage) 60.0 60.4 58.8
Storage Costs(Dollars in Millions) $369.9 $352.7 321.5
Unit Cost $6.17 $5.84 $5.47
The DLA Distribution covered storage unit cost is calculated by dividing storage costs by cubic feet. The unit cost is not the covered storage rate that is charged to the customer. The rate includes Annual Operating Result (AOR) adjustments. Storage cost decreased in FY 2014 in line with workload reductions and due to lower infrastructure cost.
DLA Disposition Services: FY 2012 FY 2013 FY 2014 Cost per Line $39.81 $52.50 $52.07 Cost per Pound $0.09 $0.10 $0.10 DLA Disposition Services unit cost goals per line are based on three processes:
• Receiving – cost associated with the stock, store and issue (logistics) of useable property.
• Reutilization/Transfer/Donation – total cost associated with reutilizing, transferring and donating of excess personal property divided by line items of property.
• Usable Sales – all cost associated with the public sale of surplus, useable personal property.
Unit cost is calculated by dividing the total cost of these processes by the number of lines received and processed. The unit cost per line is slightly lower in FY 2014 due to lower DLA Disposition Services operating costs. The primary driver is reduction in labor and contractor support of OND. DLA Disposition Services unit cost per pound goal is based on costs associated with environmentally regulated disposal of hazardous waste and cost for either storing in a landfill or destruction of those non-hazardous items that remain at the end of the disposal process, divided by the number of pounds received and processed.
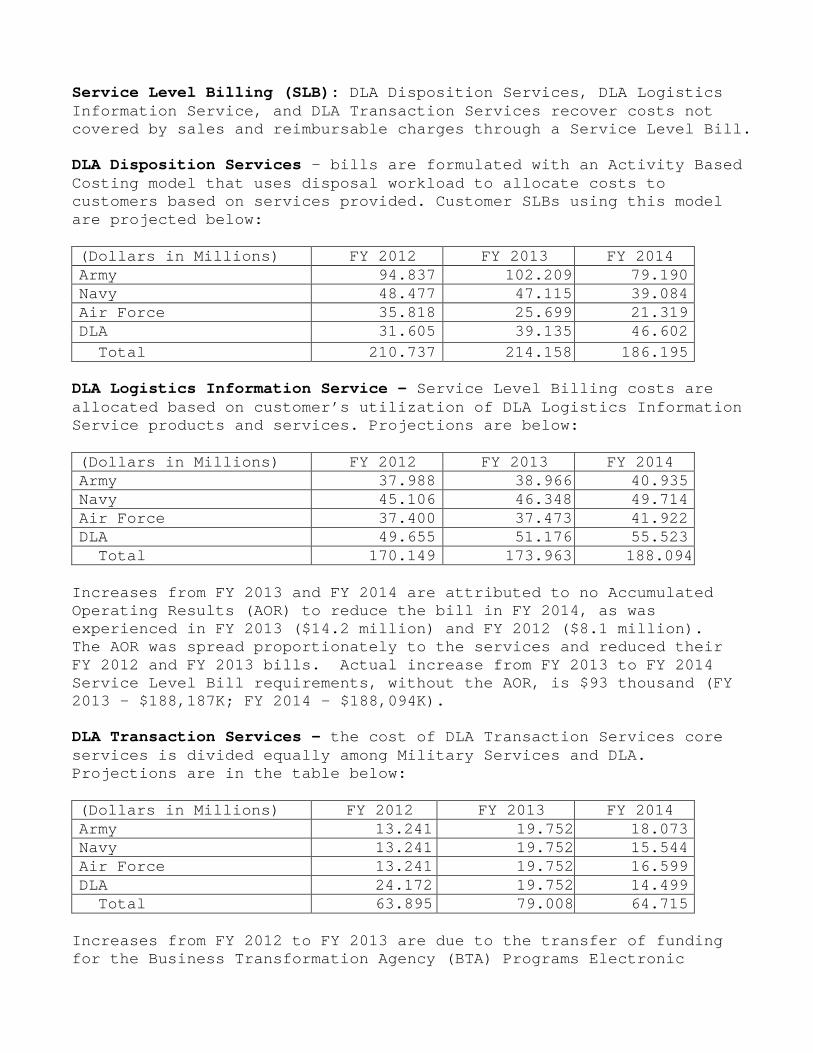
Service Level Billing (SLB): DLA Disposition Services, DLA Logistics Information Service, and DLA Transaction Services recover costs not covered by sales and reimbursable charges through a Service Level Bill. DLA Disposition Services – bills are formulated with an Activity Based Costing model that uses disposal workload to allocate costs to customers based on services provided. Customer SLBs using this model are projected below: (Dollars in Millions) FY 2012 FY 2013 FY 2014 Army 94.837 102.209 79.190 Navy 48.477 47.115 39.084 Air Force 35.818 25.699 21.319 DLA 31.605 39.135 46.602 Total 210.737 214.158 186.195 DLA Logistics Information Service – Service Level Billing costs are allocated based on customer’s utilization of DLA Logistics Information Service products and services. Projections are below: (Dollars in Millions) FY 2012 FY 2013 FY 2014 Army 37.988 38.966 40.935 Navy 45.106 46.348 49.714 Air Force 37.400 37.473 41.922 DLA 49.655 51.176 55.523 Total 170.149 173.963 188.094 Increases from FY 2013 and FY 2014 are attributed to no Accumulated Operating Results (AOR) to reduce the bill in FY 2014, as was experienced in FY 2013 ($14.2 million) and FY 2012 ($8.1 million). The AOR was spread proportionately to the services and reduced their FY 2012 and FY 2013 bills. Actual increase from FY 2013 to FY 2014 Service Level Bill requirements, without the AOR, is $93 thousand (FY 2013 - $188,187K; FY 2014 - $188,094K). DLA Transaction Services – the cost of DLA Transaction Services core services is divided equally among Military Services and DLA. Projections are in the table below: (Dollars in Millions) FY 2012 FY 2013 FY 2014 Army 13.241 19.752 18.073 Navy 13.241 19.752 15.544 Air Force 13.241 19.752 16.599 DLA 24.172 19.752 14.499 Total 63.895 79.008 64.715 Increases from FY 2012 to FY 2013 are due to the transfer of funding for the Business Transformation Agency (BTA) Programs Electronic
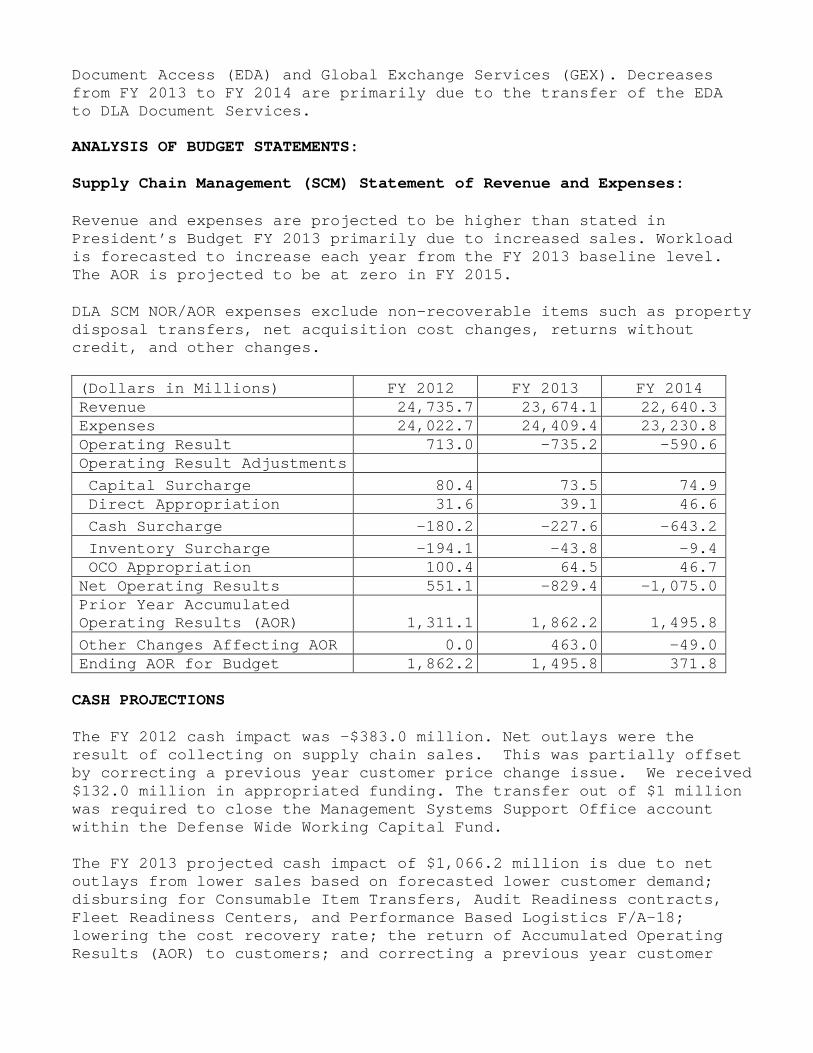
Document Access (EDA) and Global Exchange Services (GEX). Decreases from FY 2013 to FY 2014 are primarily due to the transfer of the EDA to DLA Document Services. ANALYSIS OF BUDGET STATEMENTS:
Supply Chain Management (SCM) Statement of Revenue and Expenses:
Revenue and expenses are projected to be higher than stated in President’s Budget FY 2013 primarily due to increased sales. Workload is forecasted to increase each year from the FY 2013 baseline level. The AOR is projected to be at zero in FY 2015.
DLA SCM NOR/AOR expenses exclude non-recoverable items such as property disposal transfers, net acquisition cost changes, returns without credit, and other changes.
(Dollars in Millions) FY 2012 FY 2013 FY 2014 Revenue 24,735.7 23,674.1 22,640.3 Expenses 24,022.7 24,409.4 23,230.8 Operating Result 713.0 -735.2 -590.6 Operating Result Adjustments Capital Surcharge 80.4 73.5 74.9 Direct Appropriation 31.6 39.1 46.6 Cash Surcharge -180.2 -227.6 -643.2 Inventory Surcharge -194.1 -43.8 -9.4 OCO Appropriation 100.4 64.5 46.7 Net Operating Results 551.1 -829.4 -1,075.0 Prior Year Accumulated Operating Results (AOR) 1,311.1 1,862.2 1,495.8 Other Changes Affecting AOR 0.0 463.0 -49.0 Ending AOR for Budget 1,862.2 1,495.8 371.8 CASH PROJECTIONS The FY 2012 cash impact was -$383.0 million. Net outlays were the result of collecting on supply chain sales. This was partially offset by correcting a previous year customer price change issue. We received $132.0 million in appropriated funding. The transfer out of $1 million was required to close the Management Systems Support Office account within the Defense Wide Working Capital Fund. The FY 2013 projected cash impact of $1,066.2 million is due to net outlays from lower sales based on forecasted lower customer demand; disbursing for Consumable Item Transfers, Audit Readiness contracts, Fleet Readiness Centers, and Performance Based Logistics F/A-18; lowering the cost recovery rate; the return of Accumulated Operating Results (AOR) to customers; and correcting a previous year customer
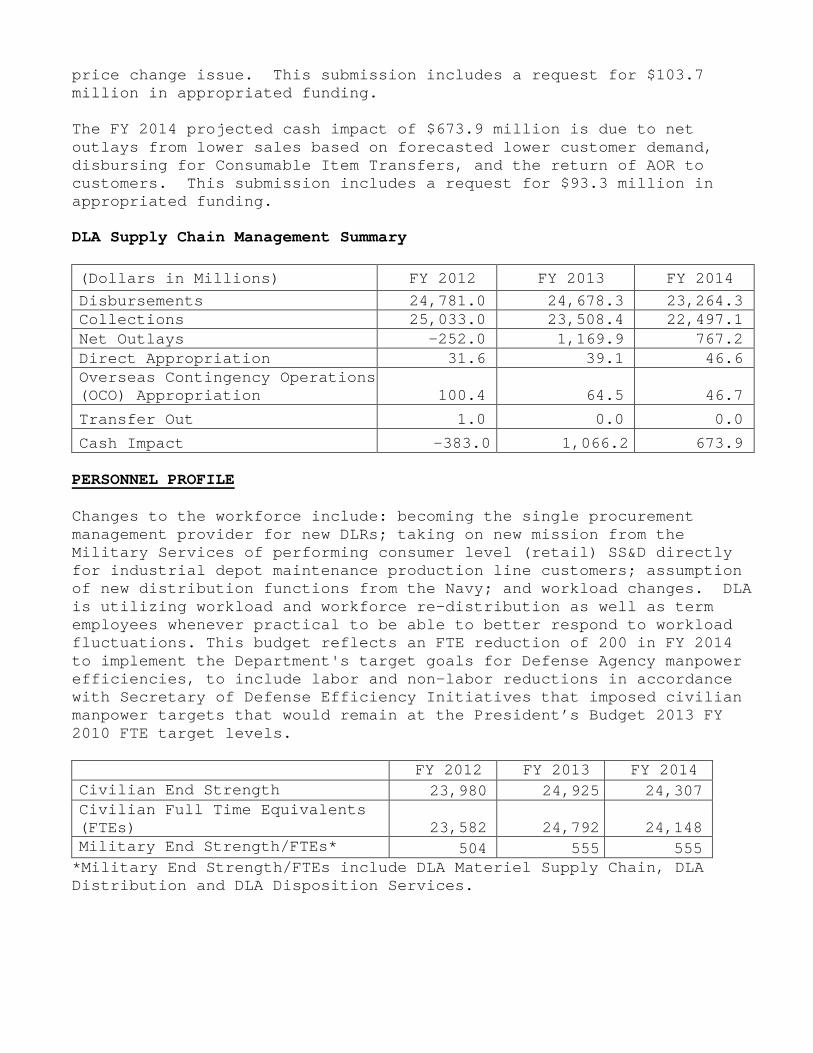
price change issue. This submission includes a request for $103.7 million in appropriated funding. The FY 2014 projected cash impact of $673.9 million is due to net outlays from lower sales based on forecasted lower customer demand, disbursing for Consumable Item Transfers, and the return of AOR to customers. This submission includes a request for $93.3 million in appropriated funding. DLA Supply Chain Management Summary
(Dollars in Millions) FY 2012 FY 2013 FY 2014 Disbursements 24,781.0 24,678.3 23,264.3 Collections 25,033.0 23,508.4 22,497.1 Net Outlays -252.0 1,169.9 767.2 Direct Appropriation 31.6 39.1 46.6 Overseas Contingency Operations (OCO) Appropriation 100.4 64.5 46.7
Transfer Out 1.0 0.0 0.0
Cash Impact -383.0 1,066.2 673.9 PERSONNEL PROFILE Changes to the workforce include: becoming the single procurement management provider for new DLRs; taking on new mission from the Military Services of performing consumer level (retail) SS&D directly for industrial depot maintenance production line customers; assumption of new distribution functions from the Navy; and workload changes. DLA is utilizing workload and workforce re-distribution as well as term employees whenever practical to be able to better respond to workload fluctuations. This budget reflects an FTE reduction of 200 in FY 2014 to implement the Department's target goals for Defense Agency manpower efficiencies, to include labor and non-labor reductions in accordance with Secretary of Defense Efficiency Initiatives that imposed civilian manpower targets that would remain at the President’s Budget 2013 FY 2010 FTE target levels. FY 2012 FY 2013 FY 2014 Civilian End Strength 23,980 24,925 24,307 Civilian Full Time Equivalents (FTEs) 23,582 24,792 24,148 Military End Strength/FTEs* 504 555 555 *Military End Strength/FTEs include DLA Materiel Supply Chain, DLA Distribution and DLA Disposition Services.
CAPITAL BUDGET
(Dollars in Millions) FY 2012 FY 2013 FY 2014
Equipment (non-ADP) 16.4 20.0 24.5 Equipment (ADP) 13.5 28.9 33.5
Software 80.0 83.6 76.2 Minor Construction 13.8 14.3 14.5
Total 123.7 146.8 148.7 The capital budget funds are investments that exceed the $250,000 expense/investment criteria for the Automated Data Processing Equipment (ADPE), non-ADPE, software development, and the minor construction category. Overall, the FY 2013 and FY 2014 capital budget estimates increased slightly by $1.9 million. The non-ADPE category increased in FY 2014 due primarily to security requirements at DLA Aviation. Investment in the ADPE category increased in FY 2014 due primarily to DLA Distribution infrastructure being completed. DLA will continue to expand the already deployed Enterprise Resource Planning (ERP) platform called Enterprise Business System (EBS) through enhanced capabilities provided by eProcurement. Also included in the software development category is funding for the critical system change requests and other enhancement initiatives to EBS, such as Real Property, Strategic Network Optimization, Chemical Management, Performance Based Logistics and Counterfeit Item Prevention.
The minor construction investments will construct new, replace existing, or modify current facilities to enhance mission performance. Minor construction projects include altering facilities to accommodate mission consolidation and relocation, upgrading security facilities (gates, fences, and lighting) to meet current Anti-Terrorism/Force Protection standards and renovating demilitarization facilities. Defense-Wide Working Capital Fund Appropriations (including all categories): Appropriations for FY 2012 through FY 2014 included in this submission are detailed in the following table and narrative.

DLA SCM Appropriations: (Dollars in Millions)
FY 2012 Enacted
FY 2013 Enacted
FY 2014 Request
Direct:
Reutilization, Transfer and Disposal Costs 31.6 39.1 46.6 Total Direct Appropriation 31.6 39.1 46.6
Overseas Contingency Operations(OCO) Appropriation: Theater Consolidation and Shipping Point(TCSP) Kuwait OCO 11.1 11.3 - DLA Distribution Kuwait (DDKS) Kuwait OCO 26.5 6.4 - Theater Distribution - Afghanistan 17.1 7.2 7.7 TCSP Afghanistan OCO – Deh Dadi - 4.0 - Disposition Services 41.6 32.8 35.5
IT Communications 3.6 2.4 3.0
IT Contractor Support .3 .4 .5
Corporate Support .2 - -
Total OCO Appropriation 100.4 64.5 46.7
Total DLA SCM 132.0 103.6 103.3 Direct Appropriation – Part of DLA Disposition Services mission is to reutilize, transfer, or donate to authorized DoD and non-DoD recipients excess DoD personal property. These actions result in lower sales proceeds and higher SLB which are contrary to private industry practices. To bring Materiel Supply Chain costs more in line with commercial business practices, these costs are being funded by a direct appropriation as a Military-unique cost.
OVERSEAS CONTINGENCY OPERATIONS (OCO) FY 2014 APPROPRIATION REQUEST OCO request provided in FY 2012 through FY 2014 is in support of Operation Enduring Freedom (OEF) and Operation New Dawn (OND) included in this budget estimate submission are detailed in the following charts and narrative:
(Dollars in Millions) Operation FY 2012 Enacted
FY 2013 Enacted
FY 2014 Request
A. Subactivity Group - Operations – Consolidated Shipping Point, Kuwait
5.8 Theater Distribution
OEF 7.791 11.265 - OND 3.339 - - Total 11.130 11.265 -
Narrative Justification: DLA performs distribution functions at the Theater Consolidation and Shipping Point (TCSP) in Kuwait for United States Central Command (USCENTCOM). Locating theater distribution functions with DLA Distribution Kuwait has increased the distribution systems efficiency and consolidated functions. The center serves as a central receiving and shipping point for inbound cargo shipments and trans-loading containers or palletized shipments for onward movements to units located in Kuwait, Iraq, and Afghanistan while improving in transit visibility.
Impact if not funded: The DWCF will bill the Military Services for the full cost of this operation in FY 2013 because it is a direct reimbursable cost. The Military Services have no funding programmed to reimburse DLA. As a result, the Military Services, particularly the Army and Marines, will have to decrement other programs to pay this bill that may impact readiness. If the Military Services do not pay the FY 2013 bill, the Defense Wide Working Capital Fund (DWWCF) cash corpus will suffer a loss in FY 2013 that cannot be recouped until the bill is paid in FY 2013 or later.
(Dollars in Millions) Operation FY 2012 Enacted
FY 2013 Enacted
FY 2014 Request
B. Subactivity Group - Operations – DLA Distribution Kuwait 5.8 Theater Distribution
OEF 15.878 6.445 - OND 10.585 - - Total 26.463 6.445 -
Narrative Justification: DLA Distribution Kuwait (DDKS) provides for logistical support, including the receipt, storage and issue of repair parts and consumable supplies, to Military Service customers operating in Southwest Asia (SWA). By positioning materiel forward, customer wait time is decreased and DoD transportation costs are significantly reduced by the use of surface versus air shipment mode. However,
operating this distribution center is 50 percent more expensive than other distribution depots to operate due to the geographic location and hostile operating environment. The requested funds are required to recoup these increased wartime costs and prevent Working Capital Fund losses. The average unit cost rate per transaction at DLA Distribution Susquehanna Pennsylvania (DDSP) is $22.54 compared to $136.44 for DLA Distribution Kuwait, a $113.90 per line difference. The requested funds are required to recoup these increased wartime costs and prevent Working Capital Fund losses. TCSP Kuwait and DDKS are scheduled to close in FY 2013. Impact if not funded: The DWCF will sustain a loss in the year of execution that would have to be recovered in future year’s DLA Distribution rates. Higher rates for distribution services may adversely impact Military Service programs and readiness accounts. In addition, the DWWCF cash corpus will suffer a loss in FY 2013 that cannot be recouped until price increases become effective in future years.
(Dollars in Millions) Operation FY 2012 Enacted
FY 2013 Enacted
FY 2014 Request
C. Subactivity Group – Operations – DLA Distribution Afghanistan 5.8 Theater Distribution
OEF 17.072 7.201 7.700 OND - - - Total 17.072 7.201 7.700
Narrative Justification: DLA Distribution Afghanistan supports Secretary of Defense (SECDEF) approved Request For Forces (RFF) dated 25 February 2010 directing DLA to establish a deployable depot capability in Kandahar by mid-summer 2010. Presently, DLA Distribution distributes Class II, III (P), IV and IX from distribution centers in Kuwait, Germany, CONUS, and from vendors across the US and Europe. Additionally, DLA Troop Support has established a Prime Vendor Contract to receive store and issue CL IV in Bagram and Kandahar for a cost of approximately $24 million per year. Objectives of the facility are: 1) provide distribution support to the OEF Theater per guidance issued by USCENTCOM and DLA, 2) relieve DLA Troop Support of the Prime Vendor distribution mission of Class IV; and 3) reduce customer wait times for surface intensive items like Class IV, III (P), and some Class II by up to 50 days. Criteria for success at acceptable risk are related to intra-theater distribution capability that allows for centralized receive/stow/issue capability at a single hub in Afghanistan. The requested funds are required to recoup increased wartime costs and prevent Working Capital Fund losses.
Impact if not funded: The primary risk is poor performance in surface intensive items such as Class IV and III (P). Surface Lines of Communication (LOCs) are congested and at risk for enemy attack. USCENTCOM and TRANSCOM are already mitigating through the use of
Northern Distribution Network. Longer surface times are mitigated currently via the Prime Vendor contract, but DLA Troop Support has assessed that option to be non-sustainable beyond FY 2010.
The DWCF will sustain a loss in the year of execution which will have to be recovered in future year’s Distribution rates. Higher rates for distribution services may adversely impact Military Service programs and readiness accounts. In addition, the DWWCF cash corpus will suffer a loss in FY 2013 that cannot be recouped until price increases become effective in future years.
(Dollars in Millions) Operation FY 2012 Enacted
FY 2013 Enacted
FY 2014 Request
D. Subactivity Group – Operations – Deh Dadi II, Consolidated Shipping Point, Afghanistan 5.8 DLA Theater Distribution
OEF - 4.000 - OND - - - Total - 4.000 -
Narrative Justification: The TCSP is located at Forward Operating Base (FOB) Deh Dabi, Northern Afghanistan and will provide distribution support capability to the United States Forces, Afghanistan and all operations within the USCENTCOM AOR. The primary mission of the Northern TCSP is to perform receipt, temporary storage, and trans-ship container functions, of Class II, III (P), IV, and IX material to supported United States Forces Afghanistan (USFOR-A) and Joint Sustainment Command-Afghanistan (JSC-A) customers, including cross-docking and/or trans-shipment operations utilized in support of CENTCOM theater logistics operations involving the Northern Distribution Network (NDN). The requirements and performance levels are identified by J-4 Future Operations along with theater specific Concept of Operations (CONOPS) requirements identified by CENTCOM, USFOR-A, and HQ DLA. The TSCP staff and ancillary functions identified are supported by DLA Distribution HQ Staff, DLA Distribution Depot Kandahar, Kuwait (DDKA) Staff in theater, HQ DLA, and elements of USFOR-A within USFOR-A within Combined Joint Operations Area-Afghanistan (CJOA-A), including life support and force protection. Impact if not funded: Successful execution of DLA capabilities in support of the OCO mission is critical to the Warfighter. Without the additional funding described above, DLA will be forced to curtail support to non-OCO missions and will not be in compliance with the direct response to the Request for Forces (RFF) approved by the SECDEF.
(Dollars in Millions) Operation FY 2012 Enacted
FY 2013 Enacted
FY 2014 Request
E. Subactivity Group – Operations – DLA Disposition Services 5.10 DLA Disposition Ops
OEF 16.640 32.800 35.500 OND 24.960 - - Total 41.600 32.800 35.500
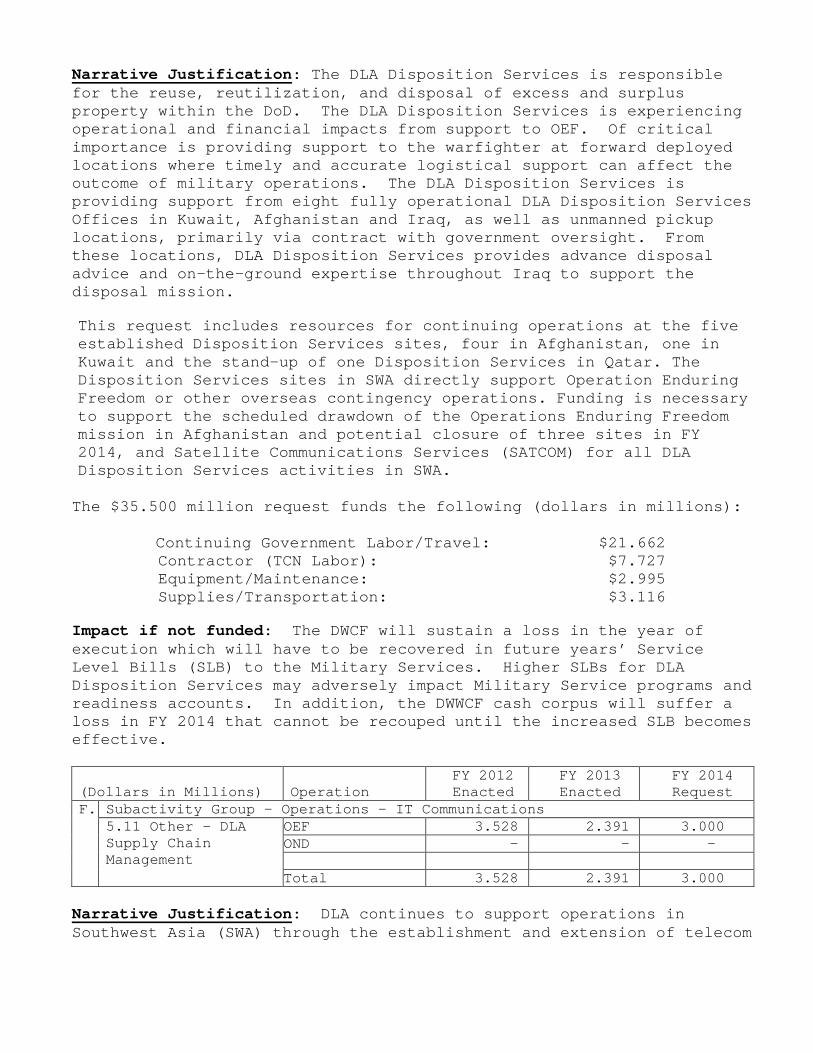
Narrative Justification: The DLA Disposition Services is responsible for the reuse, reutilization, and disposal of excess and surplus property within the DoD. The DLA Disposition Services is experiencing operational and financial impacts from support to OEF. Of critical importance is providing support to the warfighter at forward deployed locations where timely and accurate logistical support can affect the outcome of military operations. The DLA Disposition Services is providing support from eight fully operational DLA Disposition Services Offices in Kuwait, Afghanistan and Iraq, as well as unmanned pickup locations, primarily via contract with government oversight. From these locations, DLA Disposition Services provides advance disposal advice and on-the-ground expertise throughout Iraq to support the disposal mission.
This request includes resources for continuing operations at the five established Disposition Services sites, four in Afghanistan, one in Kuwait and the stand-up of one Disposition Services in Qatar. The Disposition Services sites in SWA directly support Operation Enduring Freedom or other overseas contingency operations. Funding is necessary to support the scheduled drawdown of the Operations Enduring Freedom mission in Afghanistan and potential closure of three sites in FY 2014, and Satellite Communications Services (SATCOM) for all DLA Disposition Services activities in SWA. The $35.500 million request funds the following (dollars in millions):
Continuing Government Labor/Travel: $21.662 Contractor (TCN Labor): $7.727 Equipment/Maintenance: $2.995 Supplies/Transportation: $3.116
Impact if not funded: The DWCF will sustain a loss in the year of execution which will have to be recovered in future years’ Service Level Bills (SLB) to the Military Services. Higher SLBs for DLA Disposition Services may adversely impact Military Service programs and readiness accounts. In addition, the DWWCF cash corpus will suffer a loss in FY 2014 that cannot be recouped until the increased SLB becomes effective.
(Dollars in Millions) Operation FY 2012 Enacted
FY 2013 Enacted
FY 2014 Request
F. Subactivity Group – Operations – IT Communications 5.11 Other - DLA Supply Chain Management
OEF 3.528 2.391 3.000 OND - - - Total 3.528 2.391 3.000
Narrative Justification: DLA continues to support operations in Southwest Asia (SWA) through the establishment and extension of telecom

and infrastructure capabilities to support operations in OEF of the following areas:
Afghanistan Communication Improvement/Expansion Plan supports DLA presence in Afghanistan. DLA in Afghanistan currently has line network/telecom capability and infrastructure in place. Current communications support is fragmented and equipment needs to be continually monitored for repairs and upgrades as needed.
DLA has established network hub sites at Bagram, Kandahar, Kabul, and Camp Leatherneck and extend Fusion Center capability to SWA for improved situational awareness and decision making capability. The requirement includes routers, switches, firewalls, backup generators, and other associated equipment, as well as labor and travel costs for installation of this equipment. DLA initiated projects in FY 2012 to repair or replace aging equipment. This included replacing aging switches, the purchase of riverbed network optimizers, and hardware back kits for each SATCOM and Terrestrial site. These efforts required the use of commercial flights and personnel to perform the work. The project included sustainment of the hub infrastructure, equipment refresh and the DISA hosting/circuit. Additional upgrades to routers, switches, firewalls, backup generators, and other associated equipment, as well as labor and travel costs for installation of this equipment is needed in FY 2013 in the amount of $1.069 million and FY 2014 $1.406 million to ensure the DLA network hub sites at Bagram, Kandahar, Kabul, and Camp Leatherneck continue to provide command and control and improved situational awareness and decision making capability in SWA.
Impact if not funded: DLA Central Support Teams, DLA Energy, DLA Distribution, DLA Troop Support, and DLA Disposition Services will essentially be without adequate telecommunications/ computer support in OEF. Satellite Communication Systems include communication support to DLA organizations operating at forward or exercise locations in Europe, Africa and South West and Central Asia. This support includes local network services, telephone, WAN accelerators, and wide-area connectivity using DISA contracted Commercial SATCOM systems. Due to the austere locations where DLA entities are located, there are no DISA land-line network circuits available to establish a land-based network, necessitating the need for satellite-based systems. The $1.078 million for FY 2013 and FY 2014 requests supports peripheral hardware and/or maintenance and recurring costs of systems which includes continued/expanded operations in Afghanistan, Central Asia and potentially Africa.
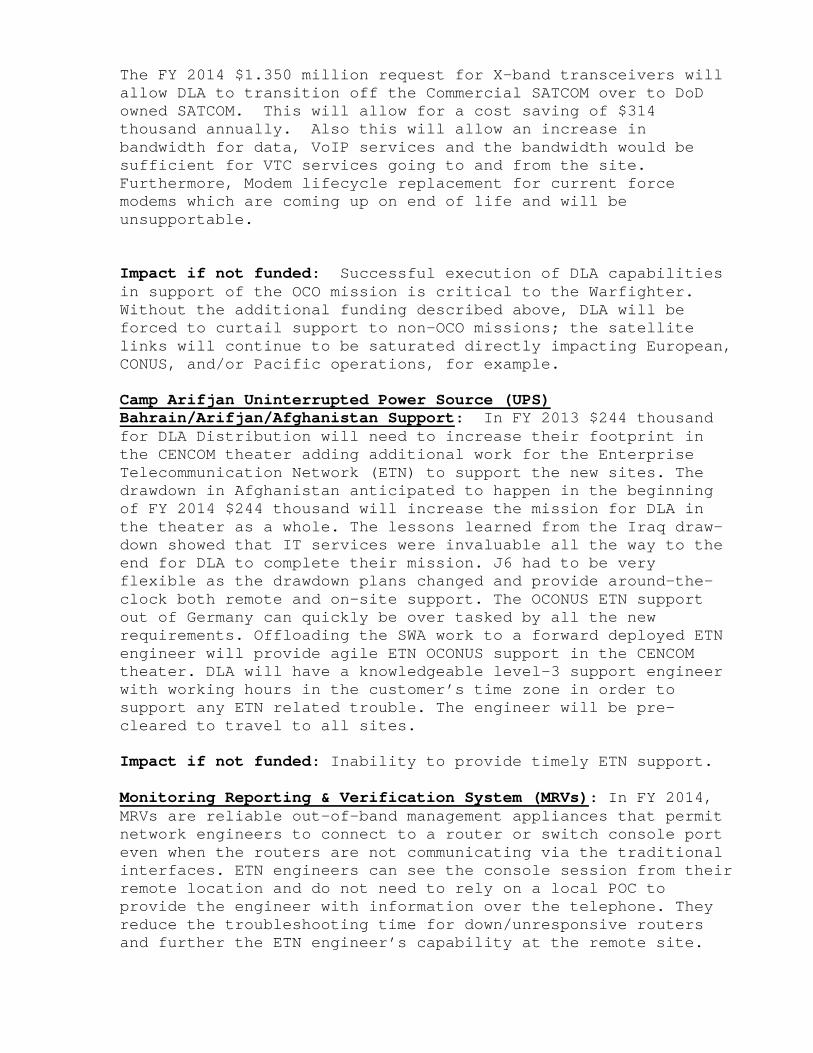
The FY 2014 $1.350 million request for X-band transceivers will allow DLA to transition off the Commercial SATCOM over to DoD owned SATCOM. This will allow for a cost saving of $314 thousand annually. Also this will allow an increase in bandwidth for data, VoIP services and the bandwidth would be sufficient for VTC services going to and from the site. Furthermore, Modem lifecycle replacement for current force modems which are coming up on end of life and will be unsupportable.
Impact if not funded: Successful execution of DLA capabilities in support of the OCO mission is critical to the Warfighter. Without the additional funding described above, DLA will be forced to curtail support to non-OCO missions; the satellite links will continue to be saturated directly impacting European, CONUS, and/or Pacific operations, for example. Camp Arifjan Uninterrupted Power Source (UPS) Bahrain/Arifjan/Afghanistan Support: In FY 2013 $244 thousand for DLA Distribution will need to increase their footprint in the CENCOM theater adding additional work for the Enterprise Telecommunication Network (ETN) to support the new sites. The drawdown in Afghanistan anticipated to happen in the beginning of FY 2014 $244 thousand will increase the mission for DLA in the theater as a whole. The lessons learned from the Iraq draw-down showed that IT services were invaluable all the way to the end for DLA to complete their mission. J6 had to be very flexible as the drawdown plans changed and provide around-the-clock both remote and on-site support. The OCONUS ETN support out of Germany can quickly be over tasked by all the new requirements. Offloading the SWA work to a forward deployed ETN engineer will provide agile ETN OCONUS support in the CENCOM theater. DLA will have a knowledgeable level-3 support engineer with working hours in the customer’s time zone in order to support any ETN related trouble. The engineer will be pre-cleared to travel to all sites.
Impact if not funded: Inability to provide timely ETN support.
Monitoring Reporting & Verification System (MRVs): In FY 2014, MRVs are reliable out-of-band management appliances that permit network engineers to connect to a router or switch console port even when the routers are not communicating via the traditional interfaces. ETN engineers can see the console session from their remote location and do not need to rely on a local POC to provide the engineer with information over the telephone. They reduce the troubleshooting time for down/unresponsive routers and further the ETN engineer’s capability at the remote site.
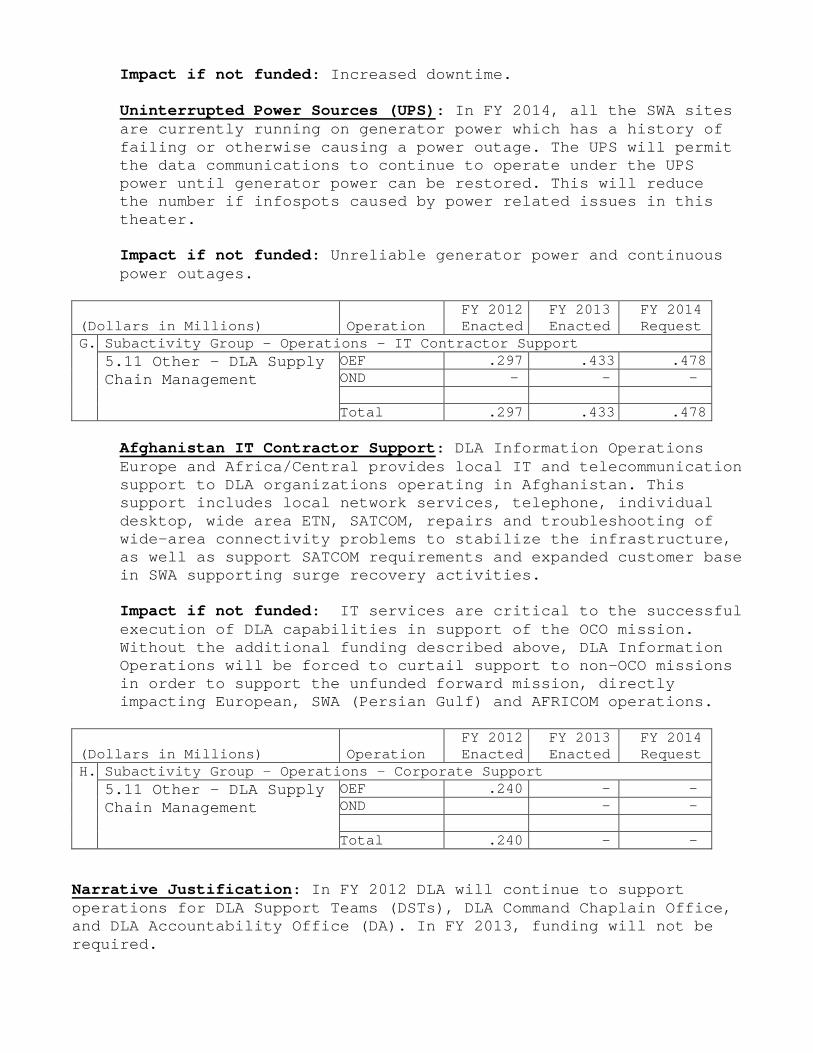
Impact if not funded: Increased downtime. Uninterrupted Power Sources (UPS): In FY 2014, all the SWA sites are currently running on generator power which has a history of failing or otherwise causing a power outage. The UPS will permit the data communications to continue to operate under the UPS power until generator power can be restored. This will reduce the number if infospots caused by power related issues in this theater.
Impact if not funded: Unreliable generator power and continuous power outages.
(Dollars in Millions) Operation FY 2012 Enacted
FY 2013 Enacted
FY 2014 Request
G. Subactivity Group – Operations – IT Contractor Support 5.11 Other - DLA Supply Chain Management
OEF .297 .433 .478 OND - - - Total .297 .433 .478
Afghanistan IT Contractor Support: DLA Information Operations Europe and Africa/Central provides local IT and telecommunication support to DLA organizations operating in Afghanistan. This support includes local network services, telephone, individual desktop, wide area ETN, SATCOM, repairs and troubleshooting of wide-area connectivity problems to stabilize the infrastructure, as well as support SATCOM requirements and expanded customer base in SWA supporting surge recovery activities.
Impact if not funded: IT services are critical to the successful execution of DLA capabilities in support of the OCO mission. Without the additional funding described above, DLA Information Operations will be forced to curtail support to non-OCO missions in order to support the unfunded forward mission, directly impacting European, SWA (Persian Gulf) and AFRICOM operations.
(Dollars in Millions) Operation FY 2012 Enacted
FY 2013 Enacted
FY 2014 Request
H. Subactivity Group – Operations – Corporate Support 5.11 Other - DLA Supply Chain Management
OEF .240 - - OND - - Total .240 - -
Narrative Justification: In FY 2012 DLA will continue to support operations for DLA Support Teams (DSTs), DLA Command Chaplain Office, and DLA Accountability Office (DA). In FY 2013, funding will not be required.
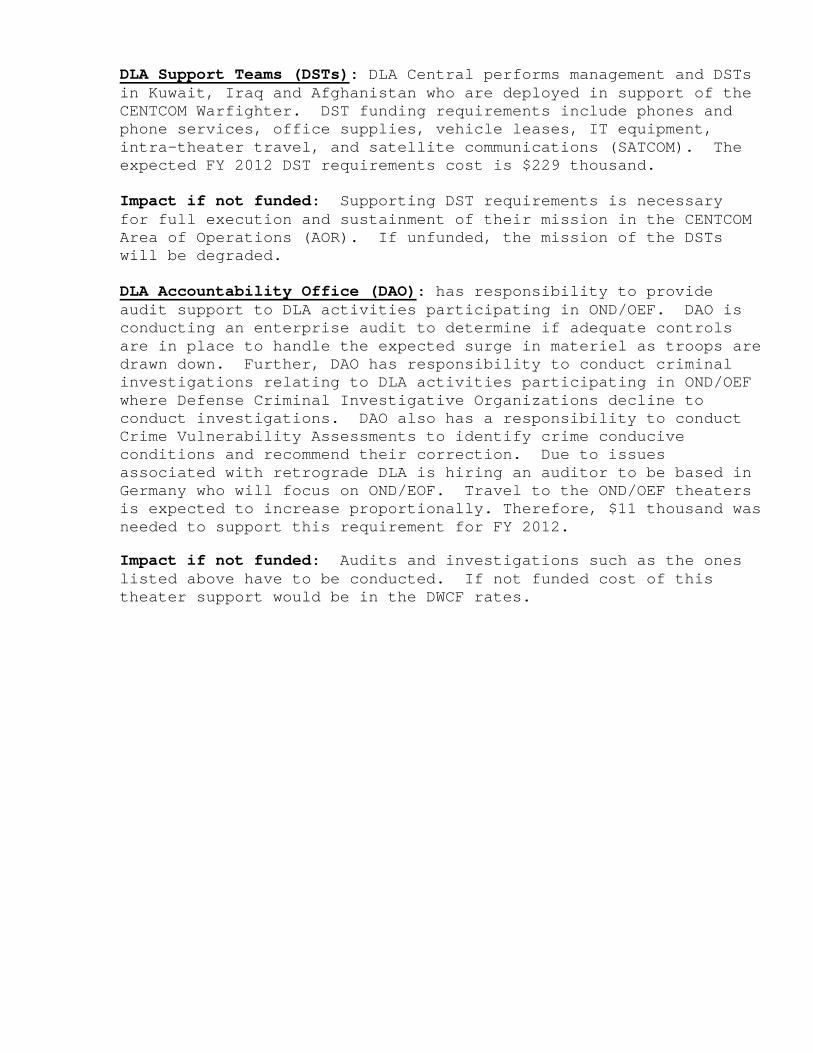
DLA Support Teams (DSTs): DLA Central performs management and DSTs in Kuwait, Iraq and Afghanistan who are deployed in support of the CENTCOM Warfighter. DST funding requirements include phones and phone services, office supplies, vehicle leases, IT equipment, intra-theater travel, and satellite communications (SATCOM). The expected FY 2012 DST requirements cost is $229 thousand.
Impact if not funded: Supporting DST requirements is necessary for full execution and sustainment of their mission in the CENTCOM Area of Operations (AOR). If unfunded, the mission of the DSTs will be degraded. DLA Accountability Office (DAO): has responsibility to provide audit support to DLA activities participating in OND/OEF. DAO is conducting an enterprise audit to determine if adequate controls are in place to handle the expected surge in materiel as troops are drawn down. Further, DAO has responsibility to conduct criminal investigations relating to DLA activities participating in OND/OEF where Defense Criminal Investigative Organizations decline to conduct investigations. DAO also has a responsibility to conduct Crime Vulnerability Assessments to identify crime conducive conditions and recommend their correction. Due to issues associated with retrograde DLA is hiring an auditor to be based in Germany who will focus on OND/EOF. Travel to the OND/OEF theaters is expected to increase proportionally. Therefore, $11 thousand was needed to support this requirement for FY 2012.
Impact if not funded: Audits and investigations such as the ones listed above have to be conducted. If not funded cost of this theater support would be in the DWCF rates.
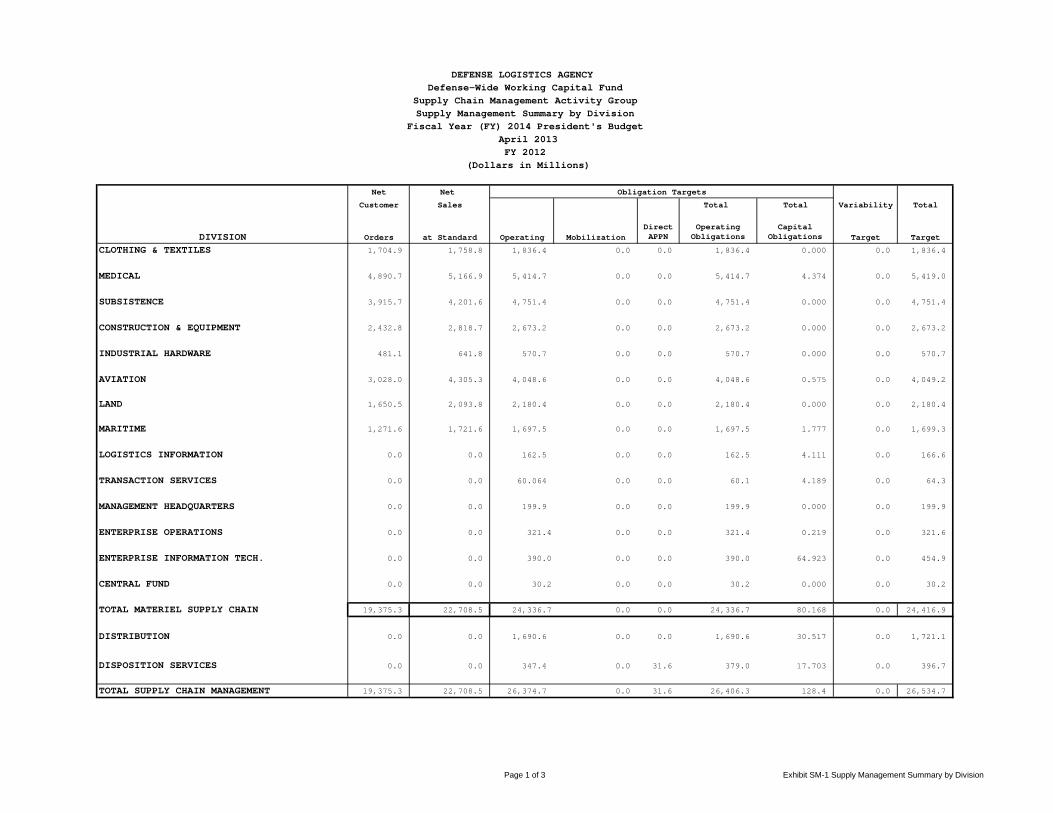
Page 1 of 3 Exhibit SM-1 Supply Management Summary by Division
Net Net
Customer Sales Total Total Variability Total
DIVISION Orders at Standard Operating MobilizationDirect APPN
Operating Obligations
Capital Obligations Target Target
CLOTHING & TEXTILES 1,704.9 1,758.8 1,836.4 0.0 0.0 1,836.4 0.000 0.0 1,836.4
MEDICAL 4,890.7 5,166.9 5,414.7 0.0 0.0 5,414.7 4.374 0.0 5,419.0
SUBSISTENCE 3,915.7 4,201.6 4,751.4 0.0 0.0 4,751.4 0.000 0.0 4,751.4
CONSTRUCTION & EQUIPMENT 2,432.8 2,818.7 2,673.2 0.0 0.0 2,673.2 0.000 0.0 2,673.2
INDUSTRIAL HARDWARE 481.1 641.8 570.7 0.0 0.0 570.7 0.000 0.0 570.7
AVIATION 3,028.0 4,305.3 4,048.6 0.0 0.0 4,048.6 0.575 0.0 4,049.2
LAND 1,650.5 2,093.8 2,180.4 0.0 0.0 2,180.4 0.000 0.0 2,180.4
MARITIME 1,271.6 1,721.6 1,697.5 0.0 0.0 1,697.5 1.777 0.0 1,699.3
LOGISTICS INFORMATION 0.0 0.0 162.5 0.0 0.0 162.5 4.111 0.0 166.6
TRANSACTION SERVICES 0.0 0.0 60.064 0.0 0.0 60.1 4.189 0.0 64.3
MANAGEMENT HEADQUARTERS 0.0 0.0 199.9 0.0 0.0 199.9 0.000 0.0 199.9
ENTERPRISE OPERATIONS 0.0 0.0 321.4 0.0 0.0 321.4 0.219 0.0 321.6
ENTERPRISE INFORMATION TECH. 0.0 0.0 390.0 0.0 0.0 390.0 64.923 0.0 454.9
CENTRAL FUND 0.0 0.0 30.2 0.0 0.0 30.2 0.000 0.0 30.2
TOTAL MATERIEL SUPPLY CHAIN 19,375.3 22,708.5 24,336.7 0.0 0.0 24,336.7 80.168 0.0 24,416.9
DISTRIBUTION 0.0 0.0 1,690.6 0.0 0.0 1,690.6 30.517 0.0 1,721.1
DISPOSITION SERVICES 0.0 0.0 347.4 0.0 31.6 379.0 17.703 0.0 396.7
TOTAL SUPPLY CHAIN MANAGEMENT 19,375.3 22,708.5 26,374.7 0.0 31.6 26,406.3 128.4 0.0 26,534.7
DEFENSE LOGISTICS AGENCY Defense-Wide Working Capital Fund
Supply Chain Management Activity Group
Fiscal Year (FY) 2014 President's Budget April 2013
Supply Management Summary by Division
FY 2012 (Dollars in Millions)
Obligation Targets

Page 2 of 3 Exhibit SM-1 Supply Management Summary by Division
Net Net
Customer Sales Total Total Variability Total
DIVISION Orders at Standard Operating MobilizationDirect APPN
Operating Obligations
Capital Obligations Target Target
CLOTHING & TEXTILES 1,361.5 2,053.2 2,028.5 0.0 2,028.5 0.5 445.9 2,474.9
MEDICAL 4,942.6 5,176.0 5,127.4 0.0 5,127.4 5.6 1,233.8 6,366.8
SUBSISTENCE 3,210.2 3,429.6 3,326.2 0.0 3,326.2 0.5 799.7 4,126.4
CONSTRUCTION & EQUIPMENT 2,500.6 2,673.7 2,552.2 0.0 2,552.2 0.6 605.8 3,158.6
INDUSTRIAL HARDWARE 491.2 739.9 587.1 0.0 587.1 0.0 126.0 713.1
AVIATION 3,088.3 4,062.3 4,048.8 0.0 4,048.8 3.9 781.6 4,834.3
LAND 1,313.1 1,687.6 1,537.5 0.0 1,537.5 0.0 320.3 1,857.8
MARITIME 1,197.2 1,567.8 1,422.3 0.0 1,422.3 60.5 288.2 1,771.0
LOGISTICS INFORMATION 0.0 0.0 217.0 0.0 217.0 0.0 0.0 217.0
TRANSACTION SERVICES 0.0 0.0 76.503 0.0 76.5 0.0 0.0 76.5
MANAGEMENT HEADQUARTERS 0.0 0.0 194.0 0.0 194.0 0.0 0.0 194.0
ENTERPRISE OPERATIONS 0.0 0.0 413.0 0.0 413.0 0.0 0.0 413.0
ENTERPRISE INFORMATION TECH. 0.0 0.0 382.1 0.0 382.1 0.0 0.0 382.1
CENTRAL FUND 0.0 0.0 573.2 0.0 573.2 0.0 0.0 573.2
TOTAL MATERIEL SUPPLY CHAIN 18,104.6 21,390.0 22,485.8 0.0 0.0 22,485.8 71.5 4,601.3 27,158.7
DISTRIBUTION 0.0 0.0 1,687.9 0.0 1,687.9 38.7 0.0 1,726.5
DISPOSITION SERVICES 0.0 0.0 405.1 0.0 39.1 444.3 8.3 0.0 452.5
TOTAL SUPPLY CHAIN MANAGEMENT 18,104.6 21,390.0 24,578.8 0.0 39.1 24,618.0 118.5 4,601.3 29,337.7
Defense-Wide Working Capital FundDEFENSE LOGISTICS AGENCY
Supply Chain Management Activity Group
Fiscal Year (FY) 2014 President's BudgetSupply Management Summary by Division
FY 2013 (Dollars in Millions)
Obligation Targets
April 2013
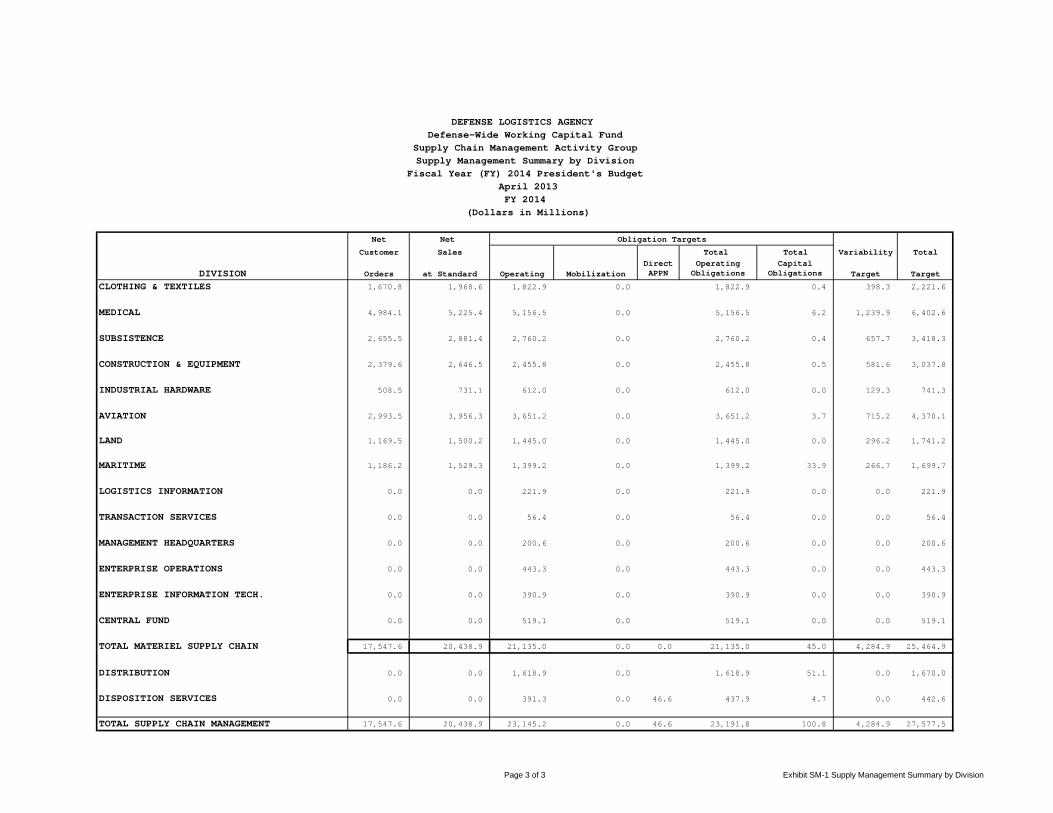
Page 3 of 3 Exhibit SM-1 Supply Management Summary by Division
Net Net
Customer Sales Total Total Variability Total
DIVISION Orders at Standard Operating MobilizationDirect APPN
Operating Obligations
Capital Obligations Target Target
CLOTHING & TEXTILES 1,670.8 1,968.6 1,822.9 0.0 1,822.9 0.4 398.3 2,221.6
MEDICAL 4,984.1 5,225.4 5,156.5 0.0 5,156.5 6.2 1,239.9 6,402.6
SUBSISTENCE 2,655.5 2,881.4 2,760.2 0.0 2,760.2 0.4 657.7 3,418.3
CONSTRUCTION & EQUIPMENT 2,379.6 2,646.5 2,455.8 0.0 2,455.8 0.5 581.6 3,037.8
INDUSTRIAL HARDWARE 508.5 731.1 612.0 0.0 612.0 0.0 129.3 741.3
AVIATION 2,993.5 3,956.3 3,651.2 0.0 3,651.2 3.7 715.2 4,370.1
LAND 1,169.5 1,500.2 1,445.0 0.0 1,445.0 0.0 296.2 1,741.2
MARITIME 1,186.2 1,529.3 1,399.2 0.0 1,399.2 33.9 266.7 1,699.7
LOGISTICS INFORMATION 0.0 0.0 221.9 0.0 221.9 0.0 0.0 221.9
TRANSACTION SERVICES 0.0 0.0 56.4 0.0 56.4 0.0 0.0 56.4
MANAGEMENT HEADQUARTERS 0.0 0.0 200.6 0.0 200.6 0.0 0.0 200.6
ENTERPRISE OPERATIONS 0.0 0.0 443.3 0.0 443.3 0.0 0.0 443.3
ENTERPRISE INFORMATION TECH. 0.0 0.0 390.9 0.0 390.9 0.0 0.0 390.9
CENTRAL FUND 0.0 0.0 519.1 0.0 519.1 0.0 0.0 519.1
TOTAL MATERIEL SUPPLY CHAIN 17,547.6 20,438.9 21,135.0 0.0 0.0 21,135.0 45.0 4,284.9 25,464.9
DISTRIBUTION 0.0 0.0 1,618.9 0.0 1,618.9 51.1 0.0 1,670.0
DISPOSITION SERVICES 0.0 0.0 391.3 0.0 46.6 437.9 4.7 0.0 442.6
TOTAL SUPPLY CHAIN MANAGEMENT 17,547.6 20,438.9 23,145.2 0.0 46.6 23,191.8 100.8 4,284.9 27,577.5
Fiscal Year (FY) 2014 President's Budget
Obligation Targets
DEFENSE LOGISTICS AGENCY Defense-Wide Working Capital Fund
FY 2014 (Dollars in Millions)
Supply Chain Management Activity GroupSupply Management Summary by Division
April 2013
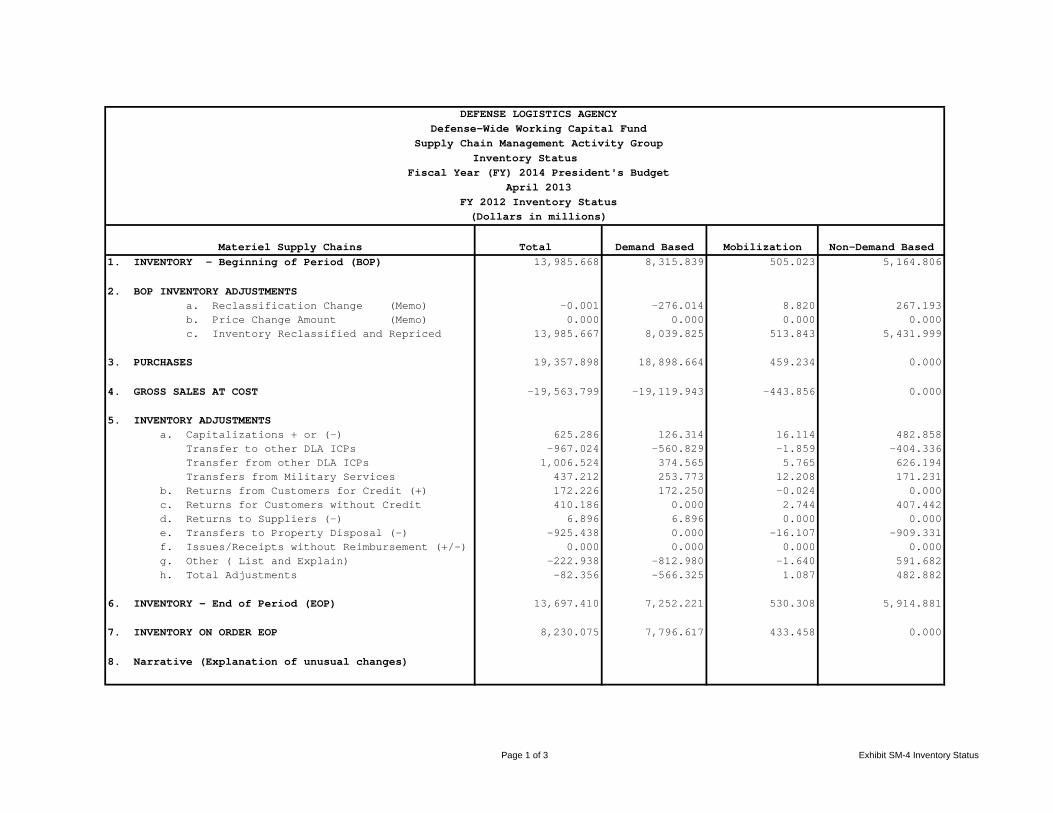
Page 1 of 3 Exhibit SM-4 Inventory Status
DEFENSE LOGISTICS AGENCYDefense-Wide Working Capital Fund
Supply Chain Management Activity Group
Fiscal Year (FY) 2014 President's BudgetApril 2013
FY 2012 Inventory Status(Dollars in millions)
Materiel Supply Chains Total Demand Based Mobilization Non-Demand Based1. INVENTORY - Beginning of Period (BOP) 13,985.668 8,315.839 505.023 5,164.806
2. BOP INVENTORY ADJUSTMENTS a. Reclassification Change (Memo) -0.001 -276.014 8.820 267.193 b. Price Change Amount (Memo) 0.000 0.000 0.000 0.000 c. Inventory Reclassified and Repriced 13,985.667 8,039.825 513.843 5,431.999
3. PURCHASES 19,357.898 18,898.664 459.234 0.000
4. GROSS SALES AT COST -19,563.799 -19,119.943 -443.856 0.000
5. INVENTORY ADJUSTMENTS a. Capitalizations + or (-) 625.286 126.314 16.114 482.858 Transfer to other DLA ICPs -967.024 -560.829 -1.859 -404.336 Transfer from other DLA ICPs 1,006.524 374.565 5.765 626.194 Transfers from Military Services 437.212 253.773 12.208 171.231 b. Returns from Customers for Credit (+) 172.226 172.250 -0.024 0.000 c. Returns for Customers without Credit 410.186 0.000 2.744 407.442 d. Returns to Suppliers (-) 6.896 6.896 0.000 0.000 e. Transfers to Property Disposal (-) -925.438 0.000 -16.107 -909.331 f. Issues/Receipts without Reimbursement (+/-) 0.000 0.000 0.000 0.000 g. Other ( List and Explain) -222.938 -812.980 -1.640 591.682 h. Total Adjustments -82.356 -566.325 1.087 482.882
6. INVENTORY - End of Period (EOP) 13,697.410 7,252.221 530.308 5,914.881
7. INVENTORY ON ORDER EOP 8,230.075 7,796.617 433.458 0.000
8. Narrative (Explanation of unusual changes)
Inventory Status

Page 2 of 3 Exhibit SM-4 Inventory Status
DEFENSE LOGISTICS AGENCYDefense-Wide Working Capital Fund
Fiscal Year (FY) 2014 President's BudgetApril 2013
FY 2013 Inventory Status(Dollars in millions)
Materiel Supply Chains Total Demand Based Mobilization Non-Demand Based1. INVENTORY - Beginning of Period (BOP) 13,697.410 7,252.221 530.308 5,914.881
2. BOP INVENTORY ADJUSTMENTS a. Reclassification Change (Memo) 0.000 -100.000 0.000 100.000 b. Price Change Amount (Memo) 0.000 0.000 0.000 0.000 c. Inventory Reclassified and Repriced 13,697.410 7,152.221 530.308 6,014.881
3. PURCHASES 18,702.332 18,378.521 323.811 0.000
4. GROSS SALES AT COST -18,713.900 -18,398.975 -314.925 0.000
5. INVENTORY ADJUSTMENTS a. Capitalizations + or (-) 400.362 330.187 0.000 70.175 Transfer to other DLA ICPs 0.000 0.000 0.000 0.000 Transfer from other DLA ICPs 0.000 0.000 0.000 0.000 Transfers from Military Services 400.362 330.187 0.000 70.175 b. Returns from Customers for Credit 197.089 197.089 0.000 0.000 c. Returns for Customers without Credit 444.965 0.000 3.000 441.965 d. Returns to Suppliers (-) 10.000 10.000 0.000 0.000 e. Transfers to Property Disposal (-) -698.443 0.000 -5.000 -693.443 f. Issues/Receipts without Reimbursement (+/-) -2.000 -4.600 0.000 2.600 g. Other ( List and Explain) 89.345 17.245 -1.900 74.000 h. Total Adjustments 441.318 549.921 -3.900 -104.703
6. INVENTORY - End of Period (EOP) 14,127.160 7,681.689 535.294 5,910.178
7. INVENTORY ON ORDER EOP 7,819.238 7,369.359 449.879 0.000
8. Narrative (Explanation of unusual changes)
Inventory StatusSupply Chain Management Activity Group
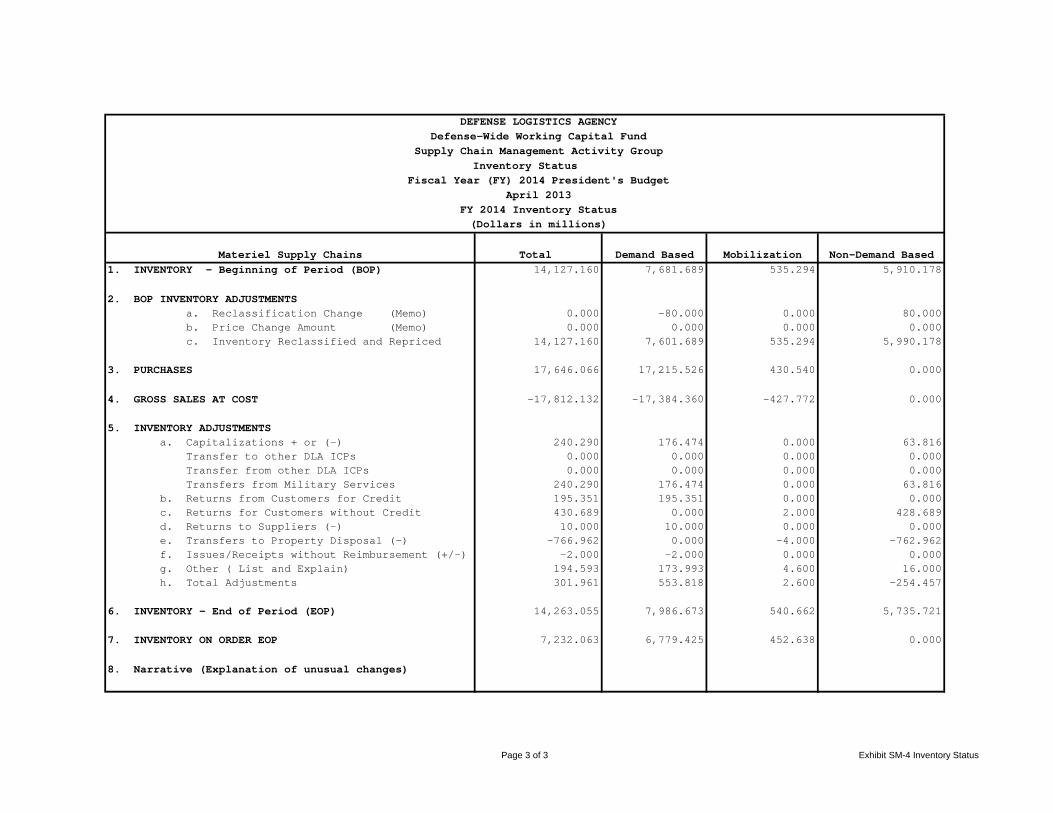
Page 3 of 3 Exhibit SM-4 Inventory Status
DEFENSE LOGISTICS AGENCYDefense-Wide Working Capital Fund
Supply Chain Management Activity Group
Fiscal Year (FY) 2014 President's BudgetApril 2013
FY 2014 Inventory Status(Dollars in millions)
Materiel Supply Chains Total Demand Based Mobilization Non-Demand Based1. INVENTORY - Beginning of Period (BOP) 14,127.160 7,681.689 535.294 5,910.178
2. BOP INVENTORY ADJUSTMENTS a. Reclassification Change (Memo) 0.000 -80.000 0.000 80.000 b. Price Change Amount (Memo) 0.000 0.000 0.000 0.000 c. Inventory Reclassified and Repriced 14,127.160 7,601.689 535.294 5,990.178
3. PURCHASES 17,646.066 17,215.526 430.540 0.000
4. GROSS SALES AT COST -17,812.132 -17,384.360 -427.772 0.000
5. INVENTORY ADJUSTMENTS a. Capitalizations + or (-) 240.290 176.474 0.000 63.816 Transfer to other DLA ICPs 0.000 0.000 0.000 0.000 Transfer from other DLA ICPs 0.000 0.000 0.000 0.000 Transfers from Military Services 240.290 176.474 0.000 63.816 b. Returns from Customers for Credit 195.351 195.351 0.000 0.000 c. Returns for Customers without Credit 430.689 0.000 2.000 428.689 d. Returns to Suppliers (-) 10.000 10.000 0.000 0.000 e. Transfers to Property Disposal (-) -766.962 0.000 -4.000 -762.962 f. Issues/Receipts without Reimbursement (+/-) -2.000 -2.000 0.000 0.000 g. Other ( List and Explain) 194.593 173.993 4.600 16.000 h. Total Adjustments 301.961 553.818 2.600 -254.457
6. INVENTORY - End of Period (EOP) 14,263.055 7,986.673 540.662 5,735.721
7. INVENTORY ON ORDER EOP 7,232.063 6,779.425 452.638 0.000
8. Narrative (Explanation of unusual changes)
Inventory Status
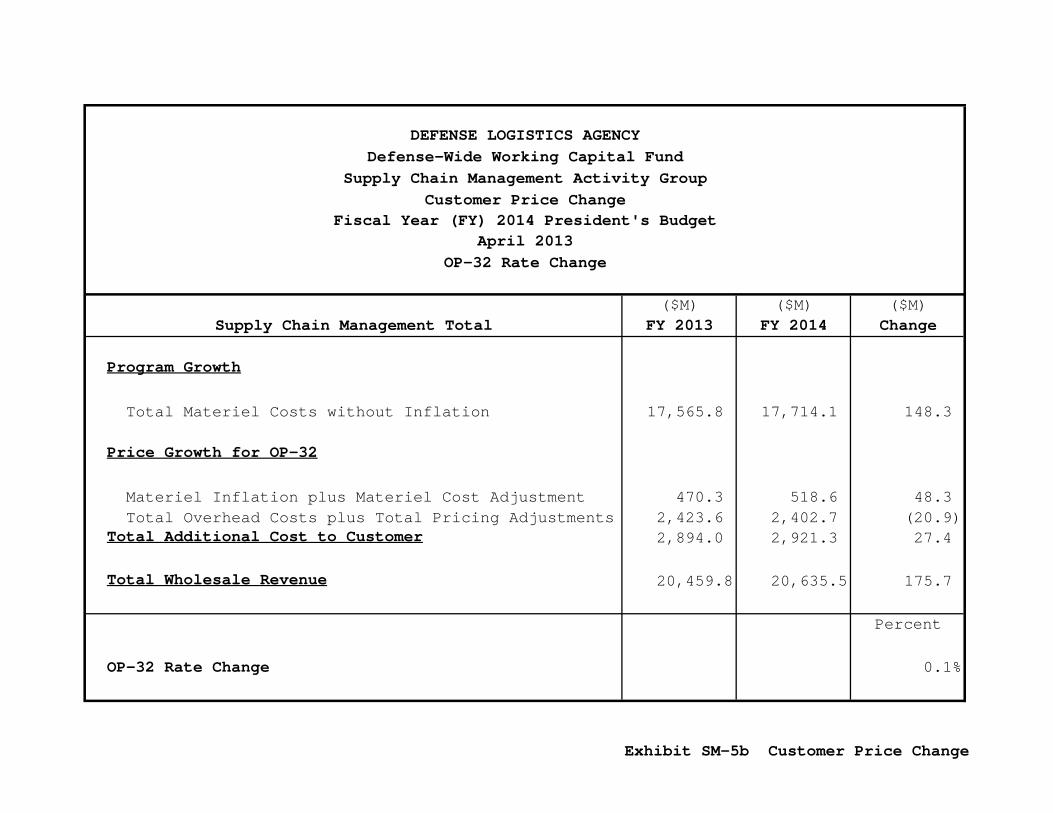
Exhibit SM-5b Customer Price Change
($M) ($M) ($M)Supply Chain Management Total FY 2013 FY 2014 Change
Program Growth
Total Materiel Costs without Inflation 17,565.8 17,714.1 148.3
Price Growth for OP-32
Materiel Inflation plus Materiel Cost Adjustment 470.3 518.6 48.3 Total Overhead Costs plus Total Pricing Adjustments 2,423.6 2,402.7 (20.9) Total Additional Cost to Customer 2,894.0 2,921.3 27.4
Total Wholesale Revenue 20,459.8 20,635.5 175.7
Percent
OP-32 Rate Change 0.1%
OP-32 Rate Change
DEFENSE LOGISTICS AGENCYDefense-Wide Working Capital Fund
Supply Chain Management Activity Group
Fiscal Year (FY) 2014 President's BudgetApril 2013
Customer Price Change
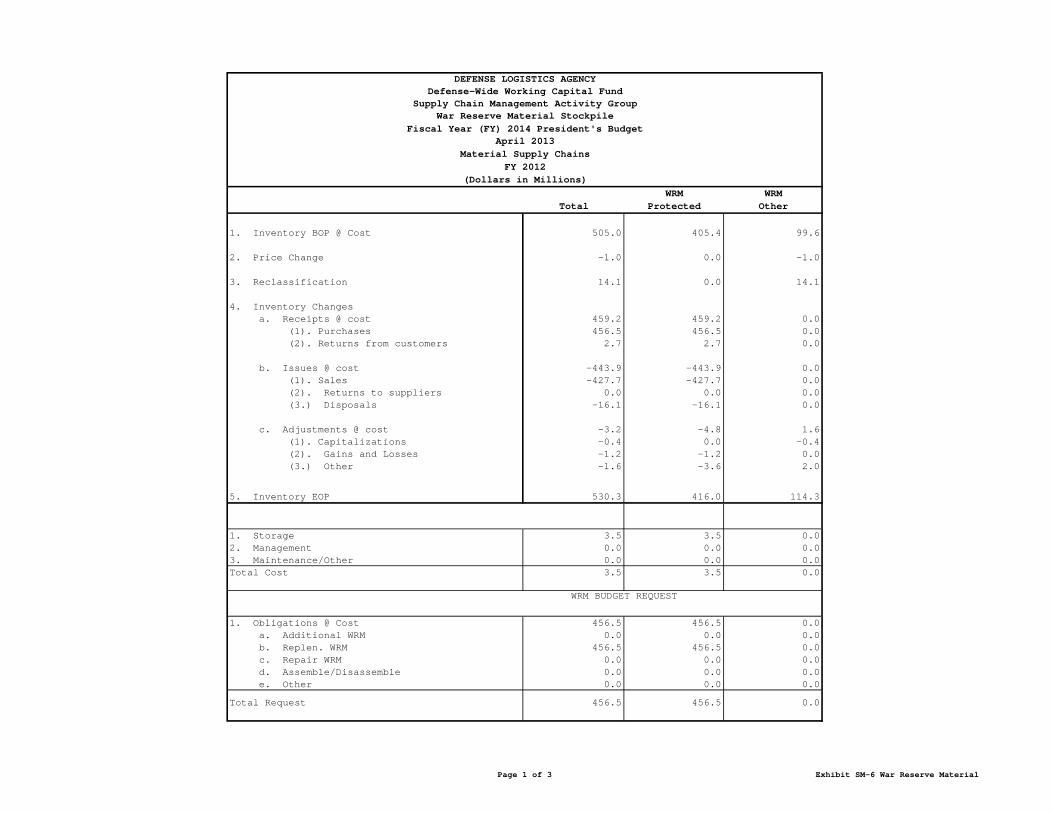
Page 1 of 3 Exhibit SM-6 War Reserve Material
WRM WRMTotal Protected Other
1. Inventory BOP @ Cost 505.0 405.4 99.6
2. Price Change -1.0 0.0 -1.0
3. Reclassification 14.1 0.0 14.1
4. Inventory Changes a. Receipts @ cost 459.2 459.2 0.0 (1). Purchases 456.5 456.5 0.0 (2). Returns from customers 2.7 2.7 0.0
b. Issues @ cost -443.9 -443.9 0.0 (1). Sales -427.7 -427.7 0.0 (2). Returns to suppliers 0.0 0.0 0.0 (3.) Disposals -16.1 -16.1 0.0
c. Adjustments @ cost -3.2 -4.8 1.6 (1). Capitalizations -0.4 0.0 -0.4 (2). Gains and Losses -1.2 -1.2 0.0 (3.) Other -1.6 -3.6 2.0
5. Inventory EOP 530.3 416.0 114.3
1. Storage 3.5 3.5 0.02. Management 0.0 0.0 0.03. Maintenance/Other 0.0 0.0 0.0Total Cost 3.5 3.5 0.0
WRM BUDGET REQUEST
1. Obligations @ Cost 456.5 456.5 0.0 a. Additional WRM 0.0 0.0 0.0 b. Replen. WRM 456.5 456.5 0.0 c. Repair WRM 0.0 0.0 0.0 d. Assemble/Disassemble 0.0 0.0 0.0 e. Other 0.0 0.0 0.0
Total Request 456.5 456.5 0.0
Material Supply ChainsFY 2012
(Dollars in Millions)
April 2013
DEFENSE LOGISTICS AGENCYDefense-Wide Working Capital Fund
Supply Chain Management Activity GroupWar Reserve Material Stockpile
Fiscal Year (FY) 2014 President's Budget
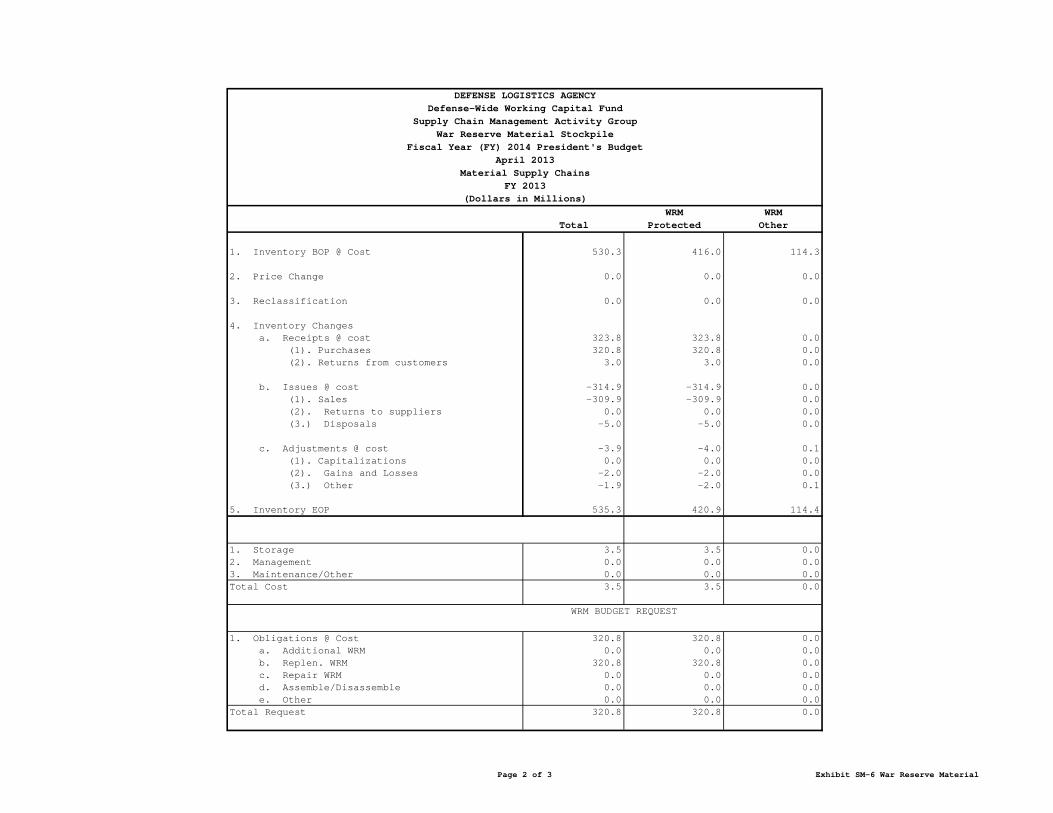
Page 2 of 3 Exhibit SM-6 War Reserve Material
WRM WRMTotal Protected Other
1. Inventory BOP @ Cost 530.3 416.0 114.3
2. Price Change 0.0 0.0 0.0
3. Reclassification 0.0 0.0 0.0
4. Inventory Changes a. Receipts @ cost 323.8 323.8 0.0 (1). Purchases 320.8 320.8 0.0 (2). Returns from customers 3.0 3.0 0.0
b. Issues @ cost -314.9 -314.9 0.0 (1). Sales -309.9 -309.9 0.0 (2). Returns to suppliers 0.0 0.0 0.0 (3.) Disposals -5.0 -5.0 0.0
c. Adjustments @ cost -3.9 -4.0 0.1 (1). Capitalizations 0.0 0.0 0.0 (2). Gains and Losses -2.0 -2.0 0.0 (3.) Other -1.9 -2.0 0.1 5. Inventory EOP 535.3 420.9 114.4
1. Storage 3.5 3.5 0.02. Management 0.0 0.0 0.03. Maintenance/Other 0.0 0.0 0.0Total Cost 3.5 3.5 0.0
WRM BUDGET REQUEST
1. Obligations @ Cost 320.8 320.8 0.0 a. Additional WRM 0.0 0.0 0.0 b. Replen. WRM 320.8 320.8 0.0 c. Repair WRM 0.0 0.0 0.0 d. Assemble/Disassemble 0.0 0.0 0.0 e. Other 0.0 0.0 0.0Total Request 320.8 320.8 0.0
(Dollars in Millions)
DEFENSE LOGISTICS AGENCYDefense-Wide Working Capital Fund
Supply Chain Management Activity GroupWar Reserve Material Stockpile
Fiscal Year (FY) 2014 President's BudgetApril 2013
Material Supply ChainsFY 2013

Page 3 of 3 Exhibit SM-6 War Reserve Material
WRM WRMTotal Protected Other
1. Inventory BOP @ Cost 535.3 420.9 114.4
2. Price Change 0.0 0.0 0.0
3. Reclassification 0.0 0.0 0.0
4. Inventory Changes a. Receipts @ cost 430.5 430.5 0.0 (1). Purchases 428.5 428.5 0.0 (2). Returns from customers 2.0 2.0 0.0
b. Issues @ cost -427.8 -427.8 0.0 (1). Sales -423.8 -423.8 0.0 (2). Returns to suppliers 0.0 0.0 0.0 (3.) Disposals -4.0 -4.0 0.0
c. Adjustments @ cost 2.6 2.5 0.1 (1). Capitalizations 0.0 0.0 0.0 (2). Gains and Losses -2.0 -2.0 0.0 (3.) Other 4.6 4.5 0.1 5. Inventory EOP 540.7 426.1 114.5
1. Storage 3.5 3.5 0.02. Management 0.0 0.0 0.03. Maintenance/Other 0.0 0.0 0.0Total Cost 3.5 3.5 0.0
WRM BUDGET REQUEST
1. Obligations @ Cost 428.5 428.5 0.0 a. Additional WRM 0.0 0.0 0.0 b. Replen. WRM 428.5 428.5 0.0 c. Repair WRM 0.0 0.0 0.0 d. Assemble/Disassemble 0.0 0.0 0.0 e. Other 0.0 0.0 0.0Total Request 428.5 428.5 0.0
Material Supply ChainsFY 2014
(Dollars in Millions)
DEFENSE LOGISTICS AGENCYDefense-Wide Working Capital Fund
Supply Chain Management Activity GroupWar Reserve Material Stockpile
Fiscal Year (FY) 2014 President's BudgetApril 2013
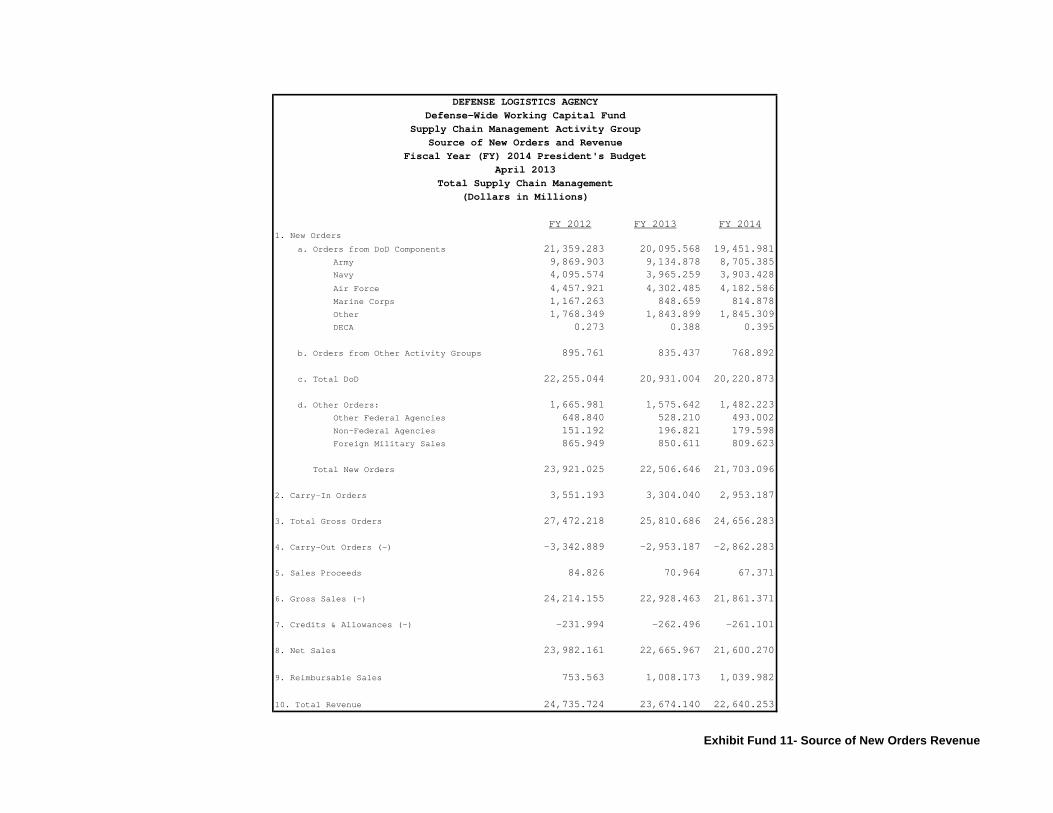
Exhibit Fund 11- Source of New Orders Revenue
FY 2012 FY 2013 FY 20141. New Orders
a. Orders from DoD Components 21,359.283 20,095.568 19,451.981 Army 9,869.903 9,134.878 8,705.385 Navy 4,095.574 3,965.259 3,903.428 Air Force 4,457.921 4,302.485 4,182.586 Marine Corps 1,167.263 848.659 814.878 Other 1,768.349 1,843.899 1,845.309 DECA 0.273 0.388 0.395
b. Orders from Other Activity Groups 895.761 835.437 768.892
c. Total DoD 22,255.044 20,931.004 20,220.873
d. Other Orders: 1,665.981 1,575.642 1,482.223 Other Federal Agencies 648.840 528.210 493.002 Non-Federal Agencies 151.192 196.821 179.598 Foreign Military Sales 865.949 850.611 809.623
Total New Orders 23,921.025 22,506.646 21,703.096
2. Carry-In Orders 3,551.193 3,304.040 2,953.187
3. Total Gross Orders 27,472.218 25,810.686 24,656.283
4. Carry-Out Orders (-) -3,342.889 -2,953.187 -2,862.283
5. Sales Proceeds 84.826 70.964 67.371
6. Gross Sales (-) 24,214.155 22,928.463 21,861.371
7. Credits & Allowances (-) -231.994 -262.496 -261.101
8. Net Sales 23,982.161 22,665.967 21,600.270
9. Reimbursable Sales 753.563 1,008.173 1,039.982
10. Total Revenue 24,735.724 23,674.140 22,640.253
Total Supply Chain Management(Dollars in Millions)
DEFENSE LOGISTICS AGENCYDefense-Wide Working Capital Fund
Supply Chain Management Activity GroupSource of New Orders and Revenue
Fiscal Year (FY) 2014 President's BudgetApril 2013
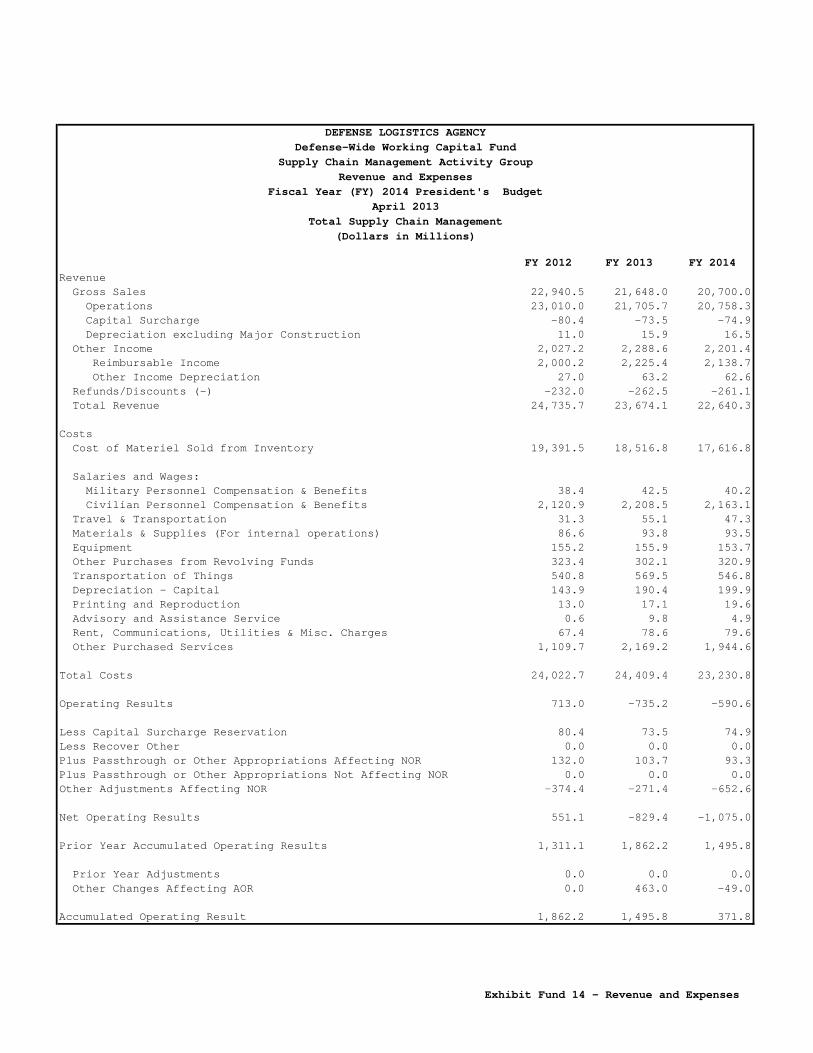
Exhibit Fund 14 - Revenue and Expenses
FY 2012 FY 2013 FY 2014Revenue Gross Sales 22,940.5 21,648.0 20,700.0 Operations 23,010.0 21,705.7 20,758.3 Capital Surcharge -80.4 -73.5 -74.9 Depreciation excluding Major Construction 11.0 15.9 16.5 Other Income 2,027.2 2,288.6 2,201.4 Reimbursable Income 2,000.2 2,225.4 2,138.7 Other Income Depreciation 27.0 63.2 62.6 Refunds/Discounts (-) -232.0 -262.5 -261.1 Total Revenue 24,735.7 23,674.1 22,640.3
Costs Cost of Materiel Sold from Inventory 19,391.5 18,516.8 17,616.8
Salaries and Wages: Military Personnel Compensation & Benefits 38.4 42.5 40.2 Civilian Personnel Compensation & Benefits 2,120.9 2,208.5 2,163.1 Travel & Transportation 31.3 55.1 47.3 Materials & Supplies (For internal operations) 86.6 93.8 93.5 Equipment 155.2 155.9 153.7 Other Purchases from Revolving Funds 323.4 302.1 320.9 Transportation of Things 540.8 569.5 546.8 Depreciation - Capital 143.9 190.4 199.9 Printing and Reproduction 13.0 17.1 19.6 Advisory and Assistance Service 0.6 9.8 4.9 Rent, Communications, Utilities & Misc. Charges 67.4 78.6 79.6 Other Purchased Services 1,109.7 2,169.2 1,944.6
Total Costs 24,022.7 24,409.4 23,230.8
Operating Results 713.0 -735.2 -590.6
Less Capital Surcharge Reservation 80.4 73.5 74.9Less Recover Other 0.0 0.0 0.0Plus Passthrough or Other Appropriations Affecting NOR 132.0 103.7 93.3Plus Passthrough or Other Appropriations Not Affecting NOR 0.0 0.0 0.0Other Adjustments Affecting NOR -374.4 -271.4 -652.6
Net Operating Results 551.1 -829.4 -1,075.0
Prior Year Accumulated Operating Results 1,311.1 1,862.2 1,495.8
Prior Year Adjustments 0.0 0.0 0.0 Other Changes Affecting AOR 0.0 463.0 -49.0
Accumulated Operating Result 1,862.2 1,495.8 371.8
DEFENSE LOGISTICS AGENCYDefense-Wide Working Capital Fund
Supply Chain Management Activity GroupRevenue and Expenses
Total Supply Chain Management
Fiscal Year (FY) 2014 President's BudgetApril 2013
(Dollars in Millions)
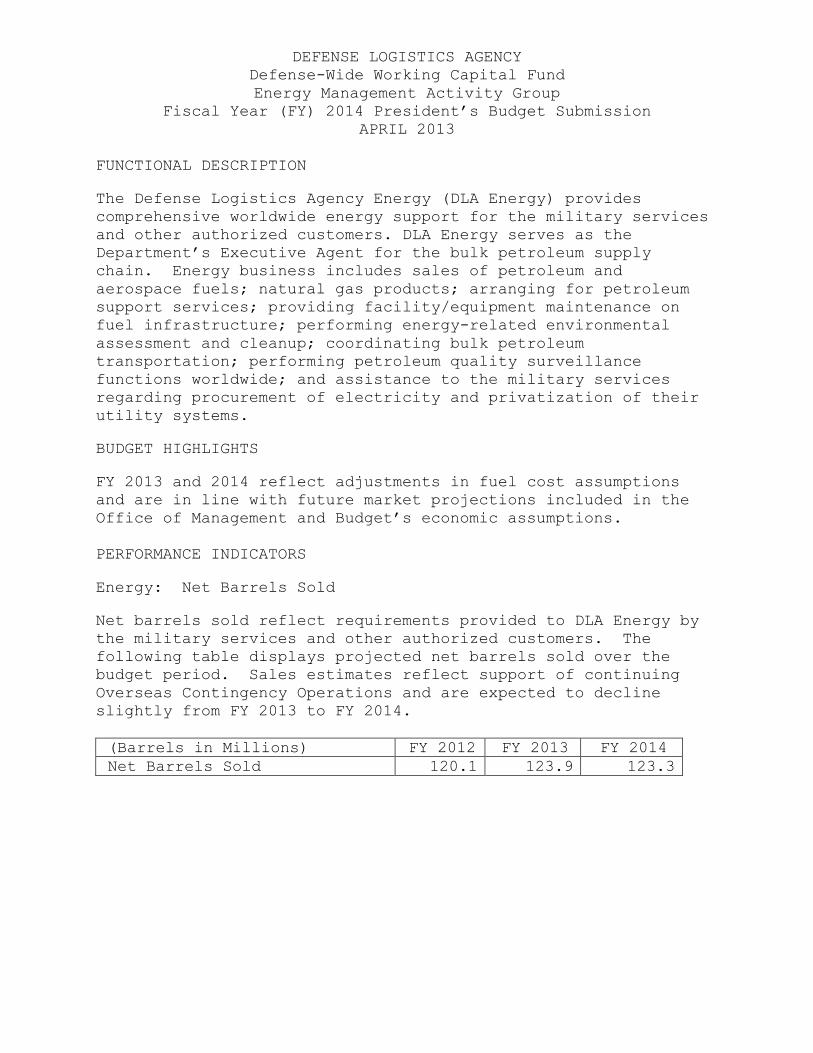
DEFENSE LOGISTICS AGENCY
Defense-Wide Working Capital Fund
Energy Management Activity Group
Fiscal Year (FY) 2014 President’s Budget Submission
APRIL 2013
FUNCTIONAL DESCRIPTION
The Defense Logistics Agency Energy (DLA Energy) provides
comprehensive worldwide energy support for the military services
and other authorized customers. DLA Energy serves as the
Department’s Executive Agent for the bulk petroleum supply
chain. Energy business includes sales of petroleum and
aerospace fuels; natural gas products; arranging for petroleum
support services; providing facility/equipment maintenance on
fuel infrastructure; performing energy-related environmental
assessment and cleanup; coordinating bulk petroleum
transportation; performing petroleum quality surveillance
functions worldwide; and assistance to the military services
regarding procurement of electricity and privatization of their
utility systems.
BUDGET HIGHLIGHTS
FY 2013 and 2014 reflect adjustments in fuel cost assumptions
and are in line with future market projections included in the
Office of Management and Budget’s economic assumptions.
PERFORMANCE INDICATORS
Energy: Net Barrels Sold
Net barrels sold reflect requirements provided to DLA Energy by
the military services and other authorized customers. The
following table displays projected net barrels sold over the
budget period. Sales estimates reflect support of continuing
Overseas Contingency Operations and are expected to decline
slightly from FY 2013 to FY 2014.
(Barrels in Millions) FY 2012 FY 2013 FY 2014
Net Barrels Sold 120.1 123.9 123.3

NET OPERATING RESULTS (NOR):
The NOR is the difference between revenue (including
reimbursements) and expenses. NOR includes, as applicable,
adjustments for supplemental and other income such as federal
and state excise taxes collected on sales.
Energy NOR
($ in Millions) FY 2012 FY 2013 FY 2014
Revenue 18,993.3 19,822.9 19,153.3
Expenses 20,522.9 19,843.5 20,200.2
Operating Results -1,529.5 -20.5 -1,046.9
Supplemental/Transfer In 1,268.6 80.0 85.0
Net Operating Results -260.9 59.5 -961.9
Prior Year Accumulated
Operating Results(AOR) 332.8 71.9 131.3
Other Changes Affecting AOR 0.0 0.0 830.6
Accumulated Operating Results 71.9 131.3 0.0
CASH:
Pricing decisions, market conditions, and workload estimates
result in projections for cash collections, disbursements, and
net outlays.
Energy Cash
($ in Millions) FY 2012 FY 2013 FY 2014
Disbursements 21,400.7 18,525.2 19,015.9
Collections 19,191.9 18,460.7 19,153.3
Net Outlays 2,208.8 64.5 -137.3
Appropriations/Transfer In 1,268.6 80.0 85.0
Transfers Out 0.0 0.0 0.0
Adjusted Outlays 940.2 -15.5 -222.4
Supplemental funding is projected to be received through direct
appropriations to offset some of the incremental costs
associated with the Overseas Contingency Operations (OCO).
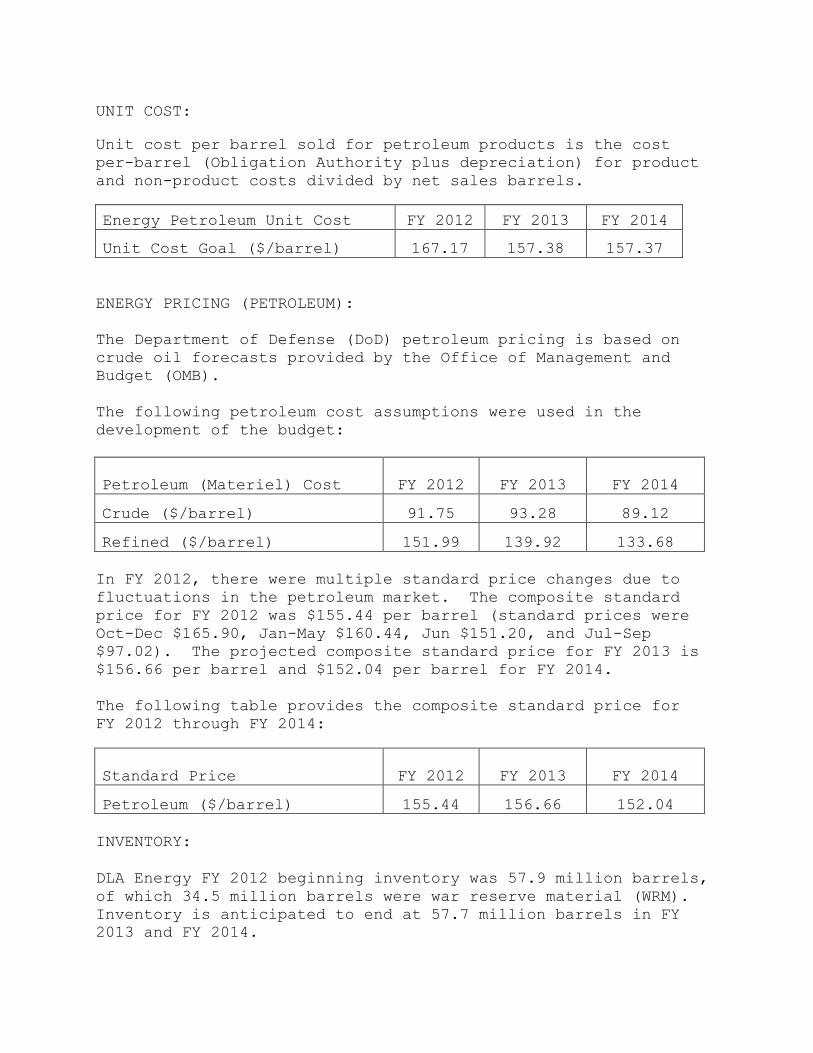
UNIT COST:
Unit cost per barrel sold for petroleum products is the cost
per-barrel (Obligation Authority plus depreciation) for product
and non-product costs divided by net sales barrels.
Energy Petroleum Unit Cost FY 2012 FY 2013 FY 2014
Unit Cost Goal ($/barrel) 167.17 157.38 157.37
ENERGY PRICING (PETROLEUM):
The Department of Defense (DoD) petroleum pricing is based on
crude oil forecasts provided by the Office of Management and
Budget (OMB).
The following petroleum cost assumptions were used in the
development of the budget:
Petroleum (Materiel) Cost FY 2012 FY 2013 FY 2014
Crude ($/barrel) 91.75 93.28 89.12
Refined ($/barrel) 151.99 139.92 133.68
In FY 2012, there were multiple standard price changes due to
fluctuations in the petroleum market. The composite standard
price for FY 2012 was $155.44 per barrel (standard prices were
Oct-Dec $165.90, Jan-May $160.44, Jun $151.20, and Jul-Sep
$97.02). The projected composite standard price for FY 2013 is
$156.66 per barrel and $152.04 per barrel for FY 2014.
The following table provides the composite standard price for
FY 2012 through FY 2014:
Standard Price FY 2012 FY 2013 FY 2014
Petroleum ($/barrel) 155.44 156.66 152.04
INVENTORY:
DLA Energy FY 2012 beginning inventory was 57.9 million barrels,
of which 34.5 million barrels were war reserve material (WRM).
Inventory is anticipated to end at 57.7 million barrels in FY
2013 and FY 2014.
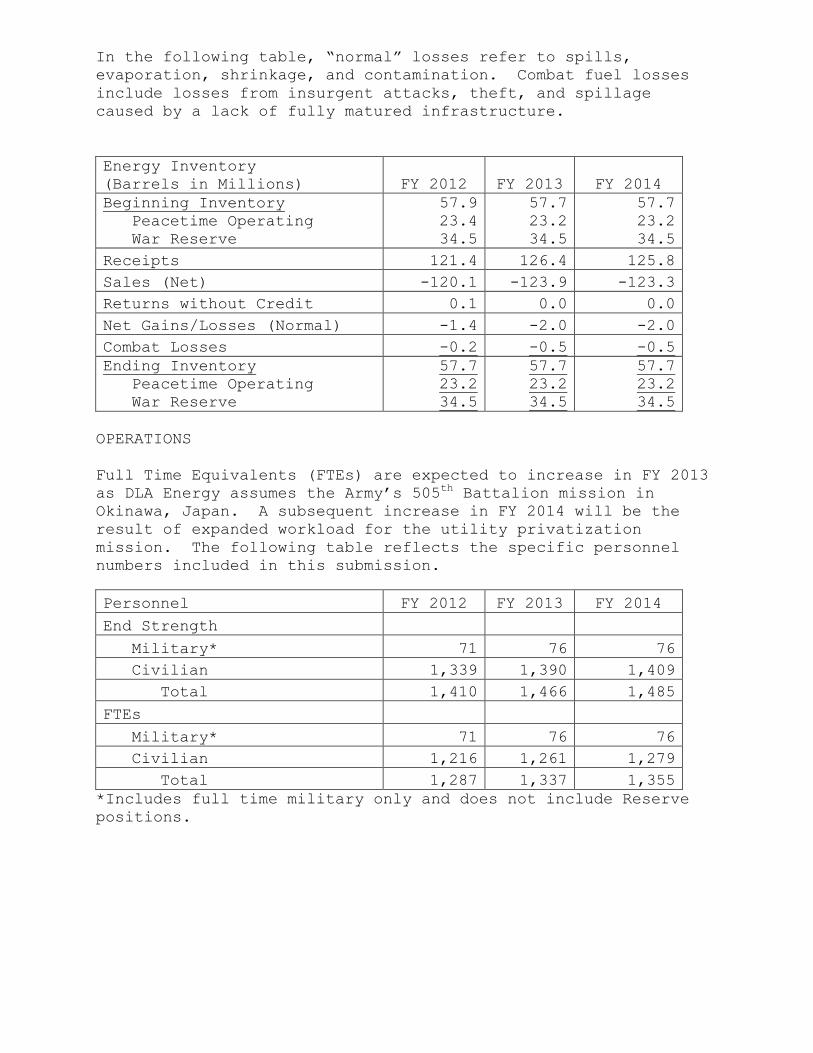
In the following table, “normal” losses refer to spills,
evaporation, shrinkage, and contamination. Combat fuel losses
include losses from insurgent attacks, theft, and spillage
caused by a lack of fully matured infrastructure.
Energy Inventory
(Barrels in Millions) FY 2012 FY 2013 FY 2014
Beginning Inventory
Peacetime Operating
War Reserve
57.9
23.4
34.5
57.7
23.2
34.5
57.7
23.2
34.5
Receipts 121.4 126.4 125.8
Sales (Net) -120.1 -123.9 -123.3
Returns without Credit 0.1 0.0 0.0
Net Gains/Losses (Normal) -1.4 -2.0 -2.0
Combat Losses -0.2 -0.5 -0.5
Ending Inventory
Peacetime Operating
War Reserve
57.7
23.2
34.5
57.7
23.2
34.5
57.7
23.2
34.5
OPERATIONS
Full Time Equivalents (FTEs) are expected to increase in FY 2013
as DLA Energy assumes the Army’s 505th Battalion mission in
Okinawa, Japan. A subsequent increase in FY 2014 will be the
result of expanded workload for the utility privatization
mission. The following table reflects the specific personnel
numbers included in this submission.
Personnel FY 2012 FY 2013 FY 2014
End Strength
Military* 71 76 76
Civilian 1,339 1,390 1,409
Total 1,410 1,466 1,485
FTEs
Military* 71 76 76
Civilian 1,216 1,261 1,279
Total 1,287 1,337 1,355
*Includes full time military only and does not include Reserve
positions.
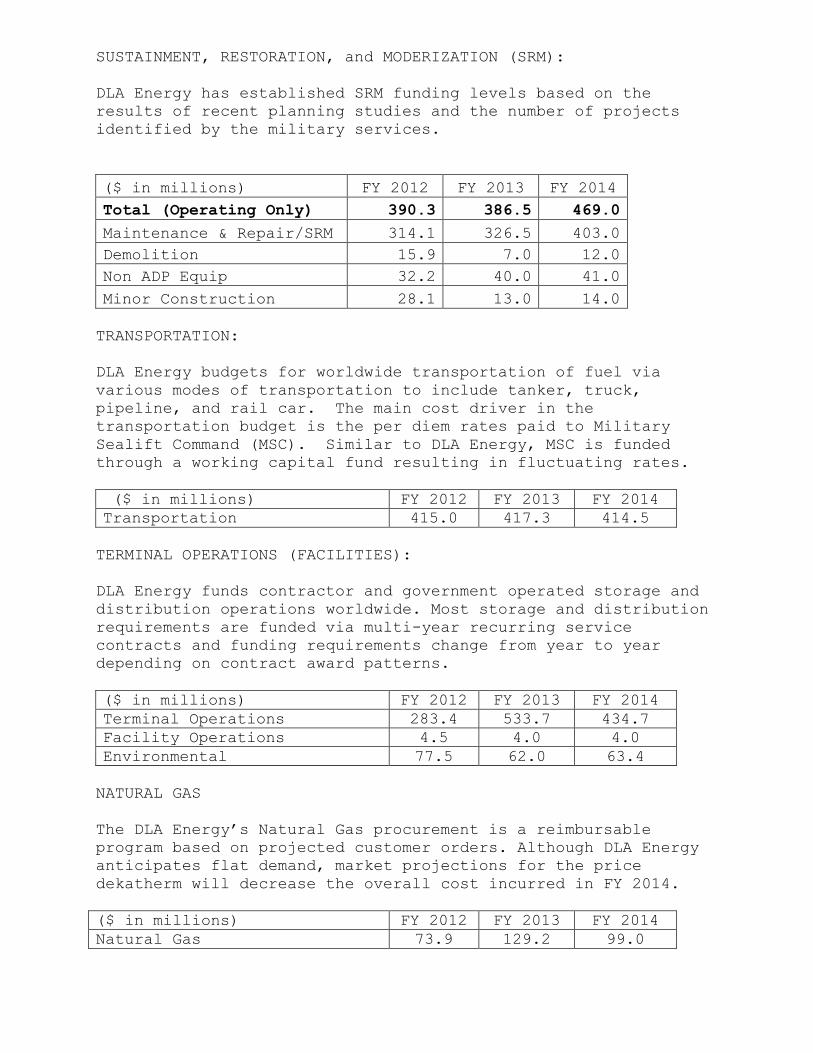
SUSTAINMENT, RESTORATION, and MODERIZATION (SRM):
DLA Energy has established SRM funding levels based on the
results of recent planning studies and the number of projects
identified by the military services.
($ in millions) FY 2012 FY 2013 FY 2014
Total (Operating Only) 390.3 386.5 469.0
Maintenance & Repair/SRM 314.1 326.5 403.0
Demolition 15.9 7.0 12.0
Non ADP Equip 32.2 40.0 41.0
Minor Construction 28.1 13.0 14.0
TRANSPORTATION:
DLA Energy budgets for worldwide transportation of fuel via
various modes of transportation to include tanker, truck,
pipeline, and rail car. The main cost driver in the
transportation budget is the per diem rates paid to Military
Sealift Command (MSC). Similar to DLA Energy, MSC is funded
through a working capital fund resulting in fluctuating rates.
($ in millions) FY 2012 FY 2013 FY 2014
Transportation 415.0 417.3 414.5
TERMINAL OPERATIONS (FACILITIES):
DLA Energy funds contractor and government operated storage and
distribution operations worldwide. Most storage and distribution
requirements are funded via multi-year recurring service
contracts and funding requirements change from year to year
depending on contract award patterns.
($ in millions) FY 2012 FY 2013 FY 2014
Terminal Operations 283.4 533.7 434.7
Facility Operations 4.5 4.0 4.0
Environmental 77.5 62.0 63.4
NATURAL GAS
The DLA Energy’s Natural Gas procurement is a reimbursable
program based on projected customer orders. Although DLA Energy
anticipates flat demand, market projections for the price
dekatherm will decrease the overall cost incurred in FY 2014.
($ in millions) FY 2012 FY 2013 FY 2014
Natural Gas 73.9 129.2 99.0

AEROSPACE ENERGY
In addition to petroleum based products, DLA Energy provides
fuel in the form of missile propellants & cryogenics to
customers worldwide. Costs for Aerospace Energy include
product, transportation, operations, and storage costs.
Aerospace Energy ($ millions) FY 2012 FY 2013 FY 2014
Sales 47.2 70.7 70.7
Obligations 57.3 55.6 51.8
CAPITAL:
Capital budget funds are investments that exceed the $250,000
investment criteria for the automated data processing equipment
(ADPE), non-ADPE, software development, and minor construction
categories. (Minor construction projects above $750,000 are
MILCON investments and are not included in this budget.)
CAPITAL BUDGET ($M) FY 2012 FY 2013 FY 2014
Equipment (non-ADP) 24.5 29.4 22.3
Software & ADP Equipment 36.5 18.1 12.1
Minor Construction 39.8 61.0 68.5
Total 100.7 108.5 103.0
The FY 2014 capital budget estimate of $103.0 million reflects
an overall decrease of $5.5 million from FY 2013. This decrease
is primarily driven by reductions in software development
investment for the Enterprise Business Systems (EBS) Energy
Convergence Program. Minor construction increases in FY 2013-
2014 are the result of requirements related to aging
infrastructure.
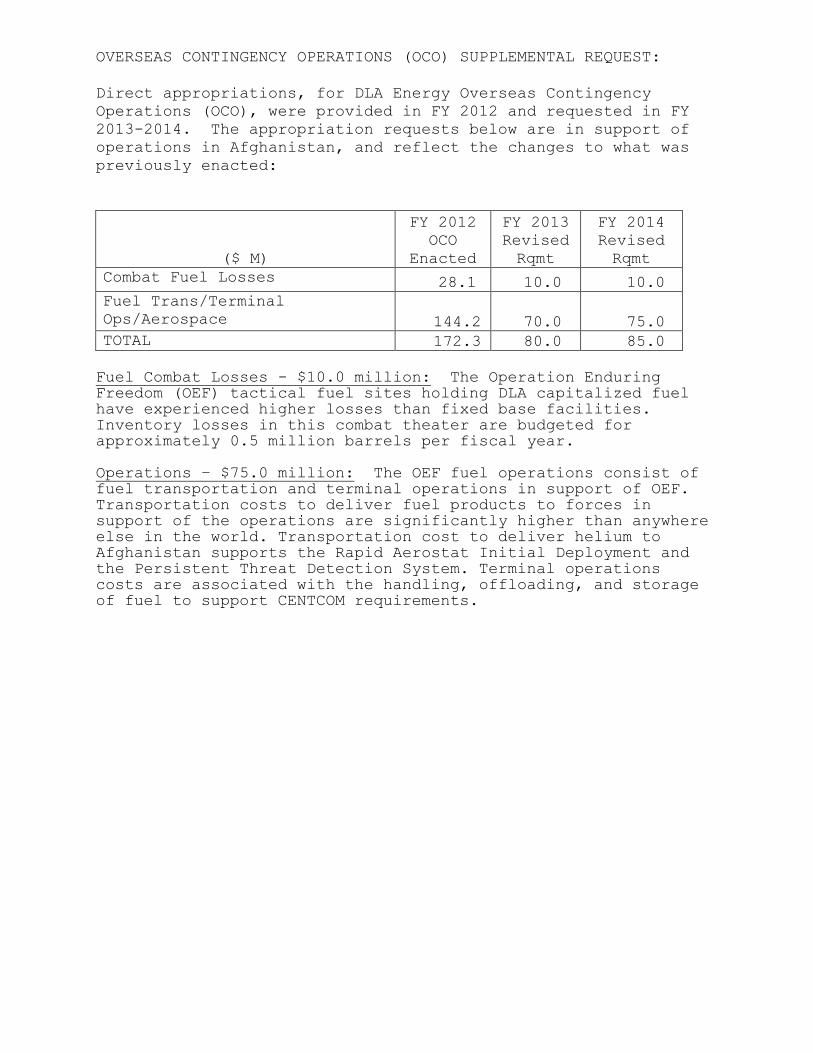
OVERSEAS CONTINGENCY OPERATIONS (OCO) SUPPLEMENTAL REQUEST:
Direct appropriations, for DLA Energy Overseas Contingency
Operations (OCO), were provided in FY 2012 and requested in FY
2013-2014. The appropriation requests below are in support of
operations in Afghanistan, and reflect the changes to what was
previously enacted:
($ M)
FY 2012
OCO
Enacted
FY 2013
Revised
Rqmt
FY 2014
Revised
Rqmt
Combat Fuel Losses 28.1 10.0 10.0
Fuel Trans/Terminal
Ops/Aerospace 144.2 70.0 75.0
TOTAL 172.3 80.0 85.0
Fuel Combat Losses - $10.0 million: The Operation Enduring Freedom (OEF) tactical fuel sites holding DLA capitalized fuel have experienced higher losses than fixed base facilities. Inventory losses in this combat theater are budgeted for approximately 0.5 million barrels per fiscal year. Operations – $75.0 million: The OEF fuel operations consist of fuel transportation and terminal operations in support of OEF. Transportation costs to deliver fuel products to forces in support of the operations are significantly higher than anywhere else in the world. Transportation cost to deliver helium to Afghanistan supports the Rapid Aerostat Initial Deployment and the Persistent Threat Detection System. Terminal operations
costs are associated with the handling, offloading, and storage of fuel to support CENTCOM requirements.
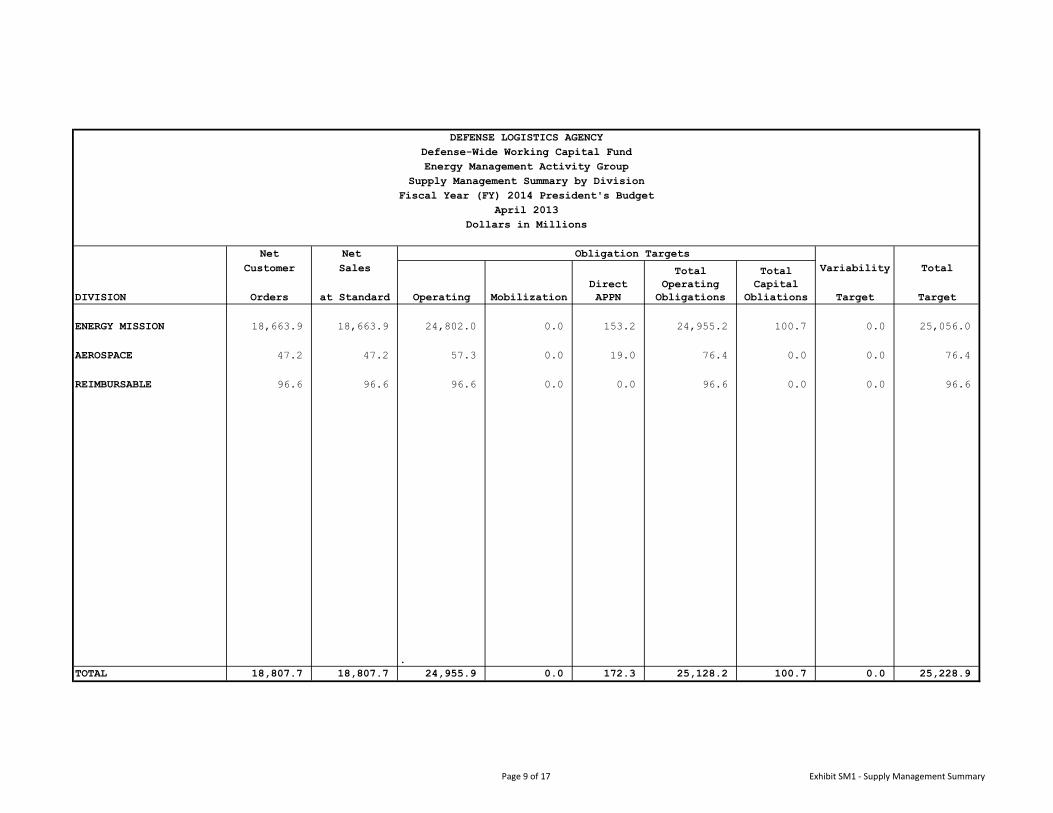
Net Net
Customer Sales Variability Total
DIVISION Orders at Standard Operating Mobilization Target Target
ENERGY MISSION 18,663.9 18,663.9 24,802.0 0.0 153.2 24,955.2 100.7 0.0 25,056.0
AEROSPACE 47.2 47.2 57.3 0.0 19.0 76.4 0.0 0.0 76.4
REIMBURSABLE 96.6 96.6 96.6 0.0 0.0 96.6 0.0 0.0 96.6
.
TOTAL 18,807.7 18,807.7 24,955.9 0.0 172.3 25,128.2 100.7 0.0 25,228.9
DEFENSE LOGISTICS AGENCY
Defense-Wide Working Capital Fund
Supply Management Summary by Division
Fiscal Year (FY) 2014 President's Budget
April 2013
Dollars in Millions
Energy Management Activity Group
Obligation Targets
Total
Capital
Obliations
Direct
APPN
Total
Operating
Obligations
Page 9 of 17 Exhibit SM1 - Supply Management Summary
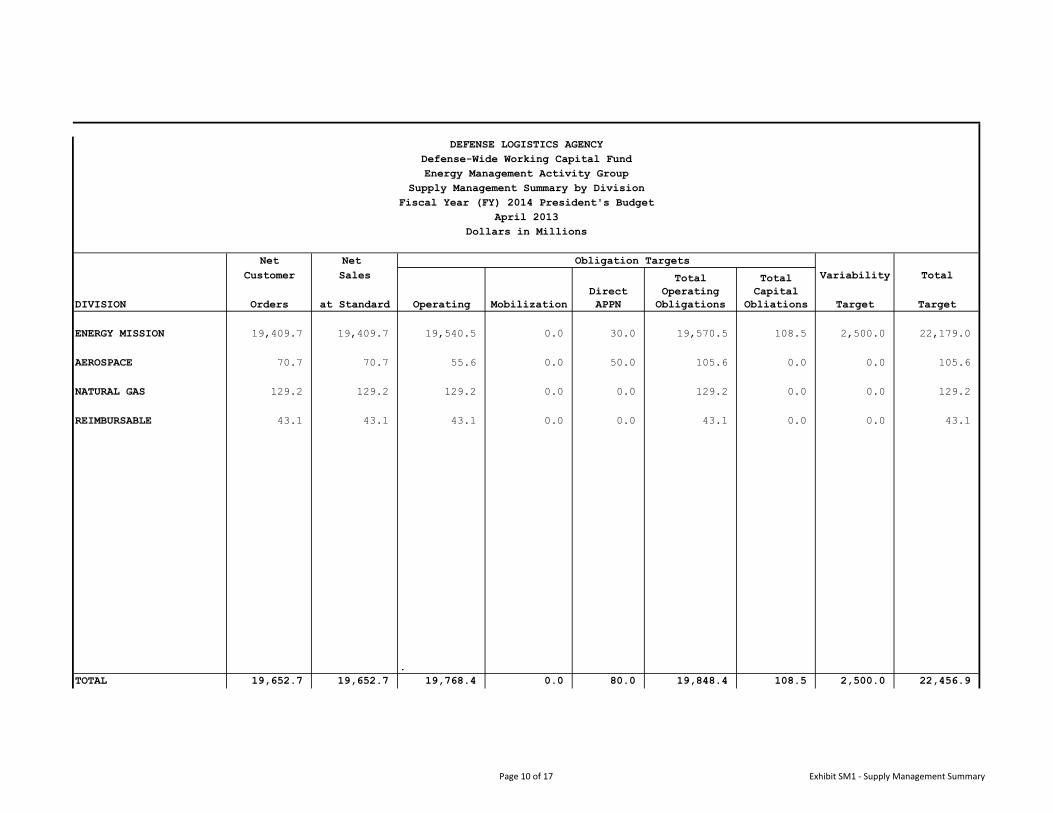
Net Net
Customer Sales Variability Total
DIVISION Orders at Standard Operating Mobilization Target Target
ENERGY MISSION 19,409.7 19,409.7 19,540.5 0.0 30.0 19,570.5 108.5 2,500.0 22,179.0
AEROSPACE 70.7 70.7 55.6 0.0 50.0 105.6 0.0 0.0 105.6
NATURAL GAS 129.2 129.2 129.2 0.0 0.0 129.2 0.0 0.0 129.2
REIMBURSABLE 43.1 43.1 43.1 0.0 0.0 43.1 0.0 0.0 43.1
.
TOTAL 19,652.7 19,652.7 19,768.4 0.0 80.0 19,848.4 108.5 2,500.0 22,456.9
Direct
APPN
Total
Operating
Obligations
Dollars in Millions
DEFENSE LOGISTICS AGENCY
Defense-Wide Working Capital Fund
Energy Management Activity Group
Supply Management Summary by Division
Fiscal Year (FY) 2014 President's Budget
Obligation Targets
Total
Capital
Obliations
April 2013
Page 10 of 17 Exhibit SM1 - Supply Management Summary
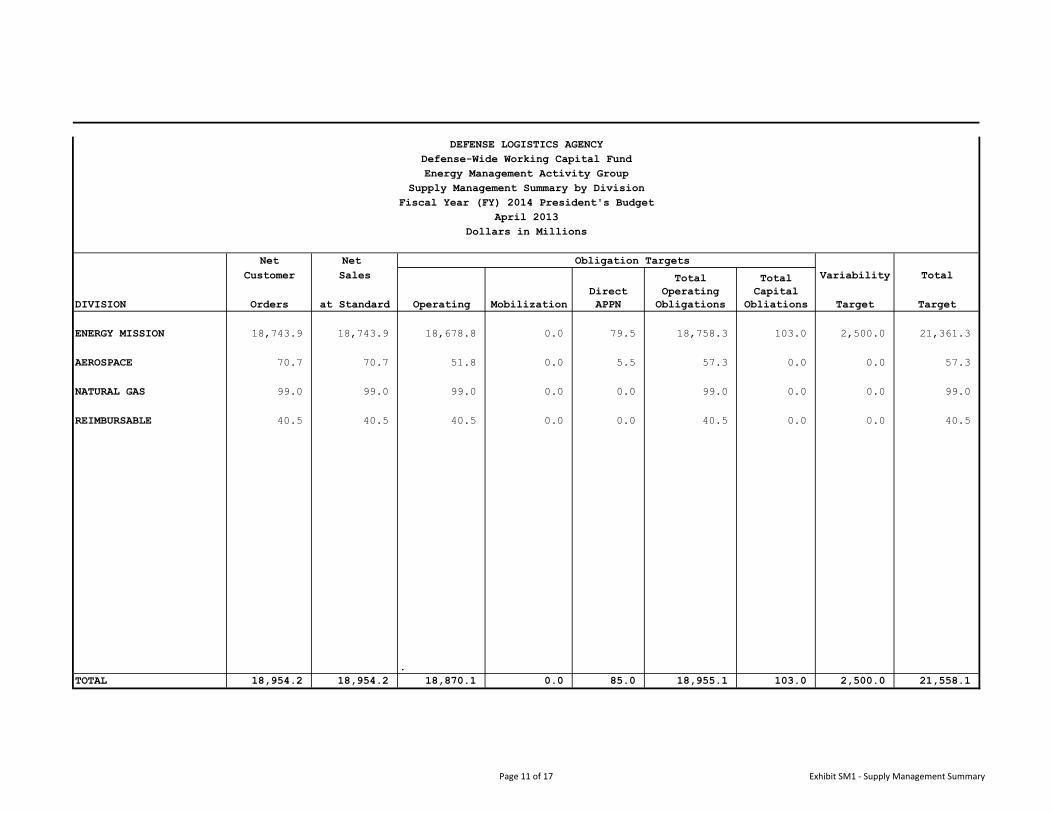
Net Net
Customer Sales Variability Total
DIVISION Orders at Standard Operating Mobilization Target Target
ENERGY MISSION 18,743.9 18,743.9 18,678.8 0.0 79.5 18,758.3 103.0 2,500.0 21,361.3
AEROSPACE 70.7 70.7 51.8 0.0 5.5 57.3 0.0 0.0 57.3
NATURAL GAS 99.0 99.0 99.0 0.0 0.0 99.0 0.0 0.0 99.0
REIMBURSABLE 40.5 40.5 40.5 0.0 0.0 40.5 0.0 0.0 40.5
.
TOTAL 18,954.2 18,954.2 18,870.1 0.0 85.0 18,955.1 103.0 2,500.0 21,558.1
April 2013
Dollars in Millions
Obligation Targets
Total
Capital
Obliations
Total
Operating
Obligations
Direct
APPN
DEFENSE LOGISTICS AGENCY
Defense-Wide Working Capital Fund
Energy Management Activity Group
Supply Management Summary by Division
Fiscal Year (FY) 2014 President's Budget
Page 11 of 17 Exhibit SM1 - Supply Management Summary

Non-Demand
Total Demand Based Mobilization Based
1. INVENTORY - Beginning of Period (BOP) 7,579.4 3,061.9 4,517.6 0.0
2. BOP INVENTORY ADJUSTMENTS
a. Reclassification Change (Memo) 0.0 0.0 0.0 0.0
b. Price Change Amount (Memo) 568.1 492.2 75.9 0.0
c. Inventory Reclassified and Repriced 8,147.6 3,554.1 4,593.5 0.0
3. PURCHASES 18,527.4 18,527.4 0.0 0.0
4. GROSS SALES AT COST -19,351.6 -19,351.6 0.0 0.0
5. INVENTORY ADJUSTMENTS
a. Capitalizations + or (-) 0.0 0.0 0.0 0.0
Transfer to other DLA ICPs 0.0 0.0 0.0 0.0
Transfer from other DLA ICPs 0.0 0.0 0.0 0.0
Transfer from Military Services 0.0 0.0 0.0 0.0
b. Returns from Customers for Credit (+) 607.5 607.5 0.0 0.0
c. Returns for Customers without Credit 0.0 0.0 0.0 0.0
d. Returns to Suppliers (-) 0.0 0.0 0.0 0.0
e. Transfers to Property Disposal (-) 0.0 0.0 0.0 0.0
f. Issues/Receipts without Reimbursement (+/-) 0.0 0.0 0.0 0.0
g. Other (List and Explain) -220.7 -220.7 0.0 0.0
g. Combat Losses (-) -28.1 -28.1 0.0 0.0
h. Total Adjustments 358.6 358.6 0.0 0.0
6. INVENTORY - End of Period (EOP) 7,681.9 3,088.4 4,593.5 0.0
7. INVENTORY ON ORDER EOP 7,681.9 3,088.4 4,593.5 0.0
8. Narrative (Explanation of unusutal changes)
Inventory Status - Energy
DEFENSE LOGISTICS AGENCY
Defense-Wide Working Capital Fund
Energy Management Activity Group
Fiscal Year (FY) 2014 President's Budget
April 2013
(Dollars in Millions)
DLA Energy
Page 12 of 17 Exhibit SM 4 - Inventory Status - Energy

Non-Demand
Total Demand Based Mobilization Based
1. INVENTORY - Beginning of Period (BOP) 7,681.9 3,088.4 4,593.5 0.0
2. BOP INVENTORY ADJUSTMENTS
a. Reclassification Change (Memo) 0.0 0.0 0.0 0.0
b. Price Change Amount (Memo) 390.9 157.2 233.7 0.0
c. Inventory Reclassified and Repriced 8,072.8 3,245.6 4,827.2 0.0
3. PURCHASES 17,731.3 17,731.3 0.0 0.0
4. GROSS SALES AT COST -18,211.1 -18,211.1 0.0 0.0
5. INVENTORY ADJUSTMENTS
a. Capitalizations + or (-) 0.0 0.0 0.0 0.0
Transfer to other DLA ICPs 0.0 0.0 0.0 0.0
Transfer from other DLA ICPs 0.0 0.0 0.0 0.0
Transfer from Military Services 0.0 0.0 0.0 0.0
b. Returns from Customers for Credit (+) 839.5 839.5 0.0 0.0
c. Returns for Customers without Credit 0.0 0.0 0.0 0.0
d. Returns to Suppliers (-) 0.0 0.0 0.0 0.0
e. Transfers to Property Disposal (-) 0.0 0.0 0.0 0.0
f. Issues/Receipts without Reimbursement (+/-) 0.0 0.0 0.0 0.0
g. Other (List and Explain) -279.8 -279.8 0.0 0.0
g. Combat Losses (-) -10.0 -10.0 0.0 0.0
h. Total Adjustments 549.7 549.7 0.0 0.0
6. INVENTORY - End of Period (EOP) 8,142.8 3,315.5 4,827.2 0.0
7. INVENTORY ON ORDER EOP 8,142.8 3,315.5 4,827.2 0.0
8. Narrative (Explanation of unusutal changes)
DEFENSE LOGISTICS AGENCY
Defense-Wide Working Capital Fund
Energy Management Activity Group
Inventory Status - Energy
Fiscal Year (FY) 2014 President's Budget
April 2013
(Dollars in Millions)
DLA Energy
Page 13 of 17 Exhibit SM 4 - Inventory Status - Energy
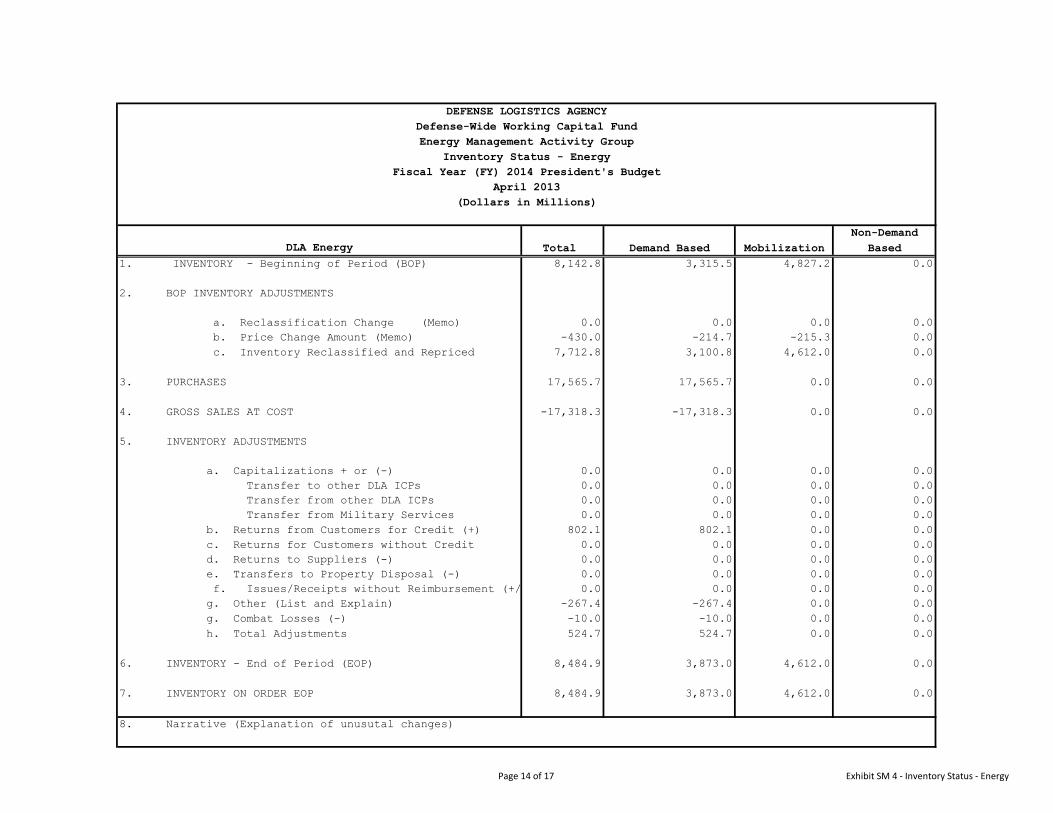
Non-Demand
Total Demand Based Mobilization Based
1. INVENTORY - Beginning of Period (BOP) 8,142.8 3,315.5 4,827.2 0.0
2. BOP INVENTORY ADJUSTMENTS
a. Reclassification Change (Memo) 0.0 0.0 0.0 0.0
b. Price Change Amount (Memo) -430.0 -214.7 -215.3 0.0
c. Inventory Reclassified and Repriced 7,712.8 3,100.8 4,612.0 0.0
3. PURCHASES 17,565.7 17,565.7 0.0 0.0
4. GROSS SALES AT COST -17,318.3 -17,318.3 0.0 0.0
5. INVENTORY ADJUSTMENTS
a. Capitalizations + or (-) 0.0 0.0 0.0 0.0
Transfer to other DLA ICPs 0.0 0.0 0.0 0.0
Transfer from other DLA ICPs 0.0 0.0 0.0 0.0
Transfer from Military Services 0.0 0.0 0.0 0.0
b. Returns from Customers for Credit (+) 802.1 802.1 0.0 0.0
c. Returns for Customers without Credit 0.0 0.0 0.0 0.0
d. Returns to Suppliers (-) 0.0 0.0 0.0 0.0
e. Transfers to Property Disposal (-) 0.0 0.0 0.0 0.0
f. Issues/Receipts without Reimbursement (+/-) 0.0 0.0 0.0 0.0
g. Other (List and Explain) -267.4 -267.4 0.0 0.0
g. Combat Losses (-) -10.0 -10.0 0.0 0.0
h. Total Adjustments 524.7 524.7 0.0 0.0
6. INVENTORY - End of Period (EOP) 8,484.9 3,873.0 4,612.0 0.0
7. INVENTORY ON ORDER EOP 8,484.9 3,873.0 4,612.0 0.0
8. Narrative (Explanation of unusutal changes)
DLA Energy
DEFENSE LOGISTICS AGENCY
Defense-Wide Working Capital Fund
Energy Management Activity Group
Inventory Status - Energy
Fiscal Year (FY) 2014 President's Budget
April 2013
(Dollars in Millions)
Page 14 of 17 Exhibit SM 4 - Inventory Status - Energy

WRM WRM
Total Protected Other
1. Inventory BOP @ Cost 4,517.6 4,517.6 0.0
2. Price Change (Memo) 75.9 75.9 0.0
3. Inventory Repriced 4,593.5 4,593.5 0.0
4. Inventory Changes
a. Receipts @ cost 0.0 0.0 0.0
(1). Purchases 0.0 0.0 0.0
(2). Returns from customers 0.0 0.0 0.0
b. Issues @ cost 0.0 0.0 0.0
(1). Sales 0.0 0.0
(2). Returns to suppliers 0.0 0.0 0.0
(3.) Disposals 0.0 0.0 0.0
c. Adjustments @ cost 0.0 0.0 0.0
(1). Capitalizations 0.0 0.0 0.0
(2). Gains and Losses 0.0 0.0 0.0
(3.) Other 0.0 0.0 0.0
5. Inventory EOP 4,593.5 4,593.5 0.0
WRM STOCKPILE COSTS
1. Storage 0.0
2. Management 0.0
3. Maintenance/Other 0.0
Total Cost 0.0 0.0 0.0
WRM BUDGET REQUEST
1. Obligations @ Cost 0.0 0.0 0.0
a. Additional WRM 0.0 0.0 0.0
b. Replen. WRM 0.0 0.0 0.0
c. Repair WRM 0.0 0.0 0.0
d. Assemble/Disassemble 0.0 0.0 0.0
e. Other 0.0 0.0 0.0
Total Request 0.0 0.0 0.0
War Reserve Material (WRM) Stockpile
DEFENSE LOGISTICS AGENCY
Defense-Wide Working Capital Fund
Energy Management Activity Group
Fiscal Year (FY) 2014 President's Budget
FY 2012
(Dollars in Millions)
April 2013
Page 15 of 17 Exhibit SM 6 - War Reserve Material (WRM) Stockpile
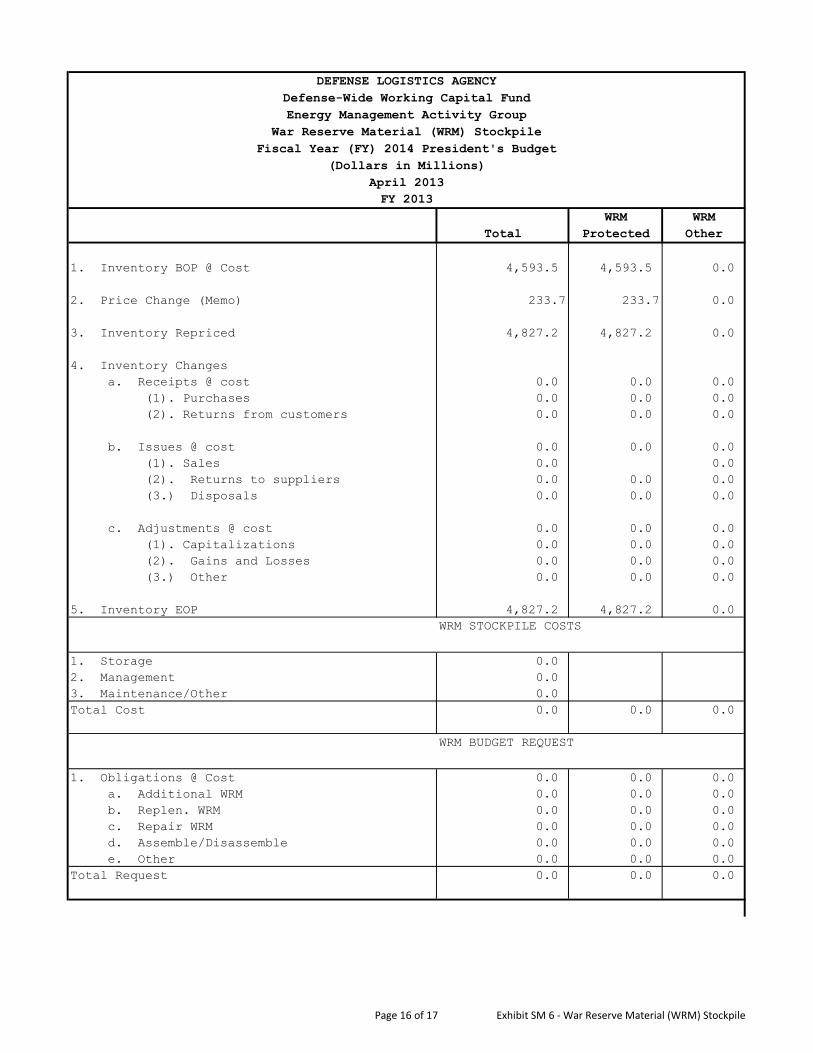
WRM WRM
Total Protected Other
1. Inventory BOP @ Cost 4,593.5 4,593.5 0.0
2. Price Change (Memo) 233.7 233.7 0.0
3. Inventory Repriced 4,827.2 4,827.2 0.0
4. Inventory Changes
a. Receipts @ cost 0.0 0.0 0.0
(1). Purchases 0.0 0.0 0.0
(2). Returns from customers 0.0 0.0 0.0
b. Issues @ cost 0.0 0.0 0.0
(1). Sales 0.0 0.0
(2). Returns to suppliers 0.0 0.0 0.0
(3.) Disposals 0.0 0.0 0.0
c. Adjustments @ cost 0.0 0.0 0.0
(1). Capitalizations 0.0 0.0 0.0
(2). Gains and Losses 0.0 0.0 0.0
(3.) Other 0.0 0.0 0.0
5. Inventory EOP 4,827.2 4,827.2 0.0
WRM STOCKPILE COSTS
1. Storage 0.0
2. Management 0.0
3. Maintenance/Other 0.0
Total Cost 0.0 0.0 0.0
WRM BUDGET REQUEST
1. Obligations @ Cost 0.0 0.0 0.0
a. Additional WRM 0.0 0.0 0.0
b. Replen. WRM 0.0 0.0 0.0
c. Repair WRM 0.0 0.0 0.0
d. Assemble/Disassemble 0.0 0.0 0.0
e. Other 0.0 0.0 0.0
Total Request 0.0 0.0 0.0
FY 2013
DEFENSE LOGISTICS AGENCY
Defense-Wide Working Capital Fund
Energy Management Activity Group
War Reserve Material (WRM) Stockpile
Fiscal Year (FY) 2014 President's Budget
(Dollars in Millions)
April 2013
Page 16 of 17 Exhibit SM 6 - War Reserve Material (WRM) Stockpile

WRM WRM
Total Protected Other
1. Inventory BOP @ Cost 4,827.2 4,827.2 0.0
2. Price Change (Memo) (215.3) (215.3) 0.0
3. Inventory Repriced 4,612.0 4,612.0 0.0
4. Inventory Changes
a. Receipts @ cost 0.0 0.0 0.0
(1). Purchases 0.0 0.0 0.0
(2). Returns from customers 0.0 0.0 0.0
b. Issues @ cost 0.0 0.0 0.0
(1). Sales 0.0 0.0
(2). Returns to suppliers 0.0 0.0 0.0
(3.) Disposals 0.0 0.0 0.0
c. Adjustments @ cost 0.0 0.0 0.0
(1). Capitalizations 0.0 0.0 0.0
(2). Gains and Losses 0.0 0.0 0.0
(3.) Other 0.0 0.0 0.0
5. Inventory EOP 4,612.0 4,612.0 0.0
WRM STOCKPILE COSTS
1. Storage 0.0
2. Management 0.0
3. Maintenance/Other 0.0
Total Cost 0.0 0.0 0.0
WRM BUDGET REQUEST
1. Obligations @ Cost 0.0 0.0 0.0
a. Additional WRM 0.0 0.0 0.0
b. Replen. WRM 0.0 0.0 0.0
c. Repair WRM 0.0 0.0 0.0
d. Assemble/Disassemble 0.0 0.0 0.0
e. Other 0.0 0.0 0.0
Total Request 0.0 0.0 0.0
FY 2014
(Dollars in Millions)
April 2013
Energy Management Activity Group
War Reserve Material (WRM) Stockpile
Fiscal Year (FY) 2014 President's Budget
DEFENSE LOGISTICS AGENCY
Defense-Wide Working Capital Fund
Page 17 of 17 Exhibit SM 6 - War Reserve Material (WRM) Stockpile

TOTAL ENERGY FY 2012 FY 2013 FY 2014
a. Orders from DoD Components $17,500.3 $17,723.1 $17,053.1
Army $3,694.3 $2,971.5 $2,824.0
Navy $4,815.7 $4,947.2 $4,808.9
Air Force $8,828.2 $9,525.1 $9,153.2
Marine Corps $66.5 $133.9 $128.6
Other $95.5 $145.3 $138.4
b. Orders from Other Activity Groups $0.0 $0.0 $0.0
c. Total DoD $17,500.3 $17,723.1 $17,053.1
d. Other Orders: $1,928.7 $2,869.6 $2,813.3
Other Federal Agencies $824.5 $1,101.9 $1,098.0
Non-Federal Agencies $1,029.7 $954.8 $926.4
Foreign Military Sales $74.5 $812.9 $788.9
Total New Orders $19,429.0 $20,592.7 $19,866.4
2. Carry-In Orders $0.0 $0.0 $0.0
3. Total Gross Orders $19,429.0 $20,592.7 $19,866.4
4. Funded Carry-Over $0.0 $0.0 $0.0
5. Total Gross Sales $19,429.0 $20,592.7 $19,866.4
6. Credits -$621.2 -$940.0 -$912.2
7. Net Sales $18,807.7 $19,652.7 $18,954.2
April 2013
(Dollars in Millions)
DEFENSE LOGISTICS AGENCY
Defense-Wide Working Capital Fund
Energy Management Activity Group
Details of Price, Program, and other Changes
Fiscal Year (FY) 2014 President's Budget
Exhibit Fund 11 - Details of Price, Program, and other Changes
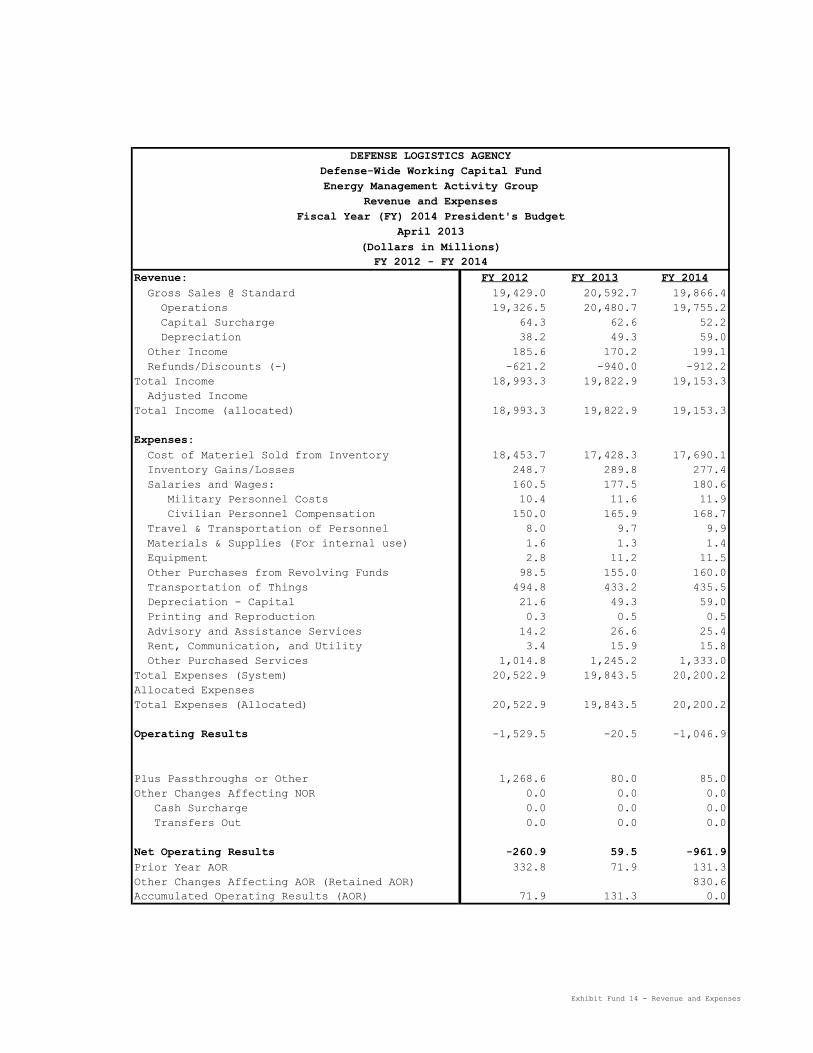
Revenue: FY 2012 FY 2013 FY 2014
Gross Sales @ Standard 19,429.0 20,592.7 19,866.4
Operations 19,326.5 20,480.7 19,755.2
Capital Surcharge 64.3 62.6 52.2
Depreciation 38.2 49.3 59.0
Other Income 185.6 170.2 199.1
Refunds/Discounts (-) -621.2 -940.0 -912.2
Total Income 18,993.3 19,822.9 19,153.3
Adjusted Income
Total Income (allocated) 18,993.3 19,822.9 19,153.3
Expenses:
Cost of Materiel Sold from Inventory 18,453.7 17,428.3 17,690.1
Inventory Gains/Losses 248.7 289.8 277.4
Salaries and Wages: 160.5 177.5 180.6
Military Personnel Costs 10.4 11.6 11.9
Civilian Personnel Compensation 150.0 165.9 168.7
Travel & Transportation of Personnel 8.0 9.7 9.9
Materials & Supplies (For internal use) 1.6 1.3 1.4
Equipment 2.8 11.2 11.5
Other Purchases from Revolving Funds 98.5 155.0 160.0
Transportation of Things 494.8 433.2 435.5
Depreciation - Capital 21.6 49.3 59.0
Printing and Reproduction 0.3 0.5 0.5
Advisory and Assistance Services 14.2 26.6 25.4
Rent, Communication, and Utility 3.4 15.9 15.8
Other Purchased Services 1,014.8 1,245.2 1,333.0
Total Expenses (System) 20,522.9 19,843.5 20,200.2
Allocated Expenses
Total Expenses (Allocated) 20,522.9 19,843.5 20,200.2
Operating Results -1,529.5 -20.5 -1,046.9
Plus Passthroughs or Other 1,268.6 80.0 85.0
Other Changes Affecting NOR 0.0 0.0 0.0
Cash Surcharge 0.0 0.0 0.0
Transfers Out 0.0 0.0 0.0
Net Operating Results -260.9 59.5 -961.9
Prior Year AOR 332.8 71.9 131.3
Other Changes Affecting AOR (Retained AOR) 830.6
Accumulated Operating Results (AOR) 71.9 131.3 0.0
April 2013
(Dollars in Millions)
FY 2012 - FY 2014
DEFENSE LOGISTICS AGENCY
Defense-Wide Working Capital Fund
Energy Management Activity Group
Revenue and Expenses
Fiscal Year (FY) 2014 President's Budget
Exhibit Fund 14 - Revenue and Expenses
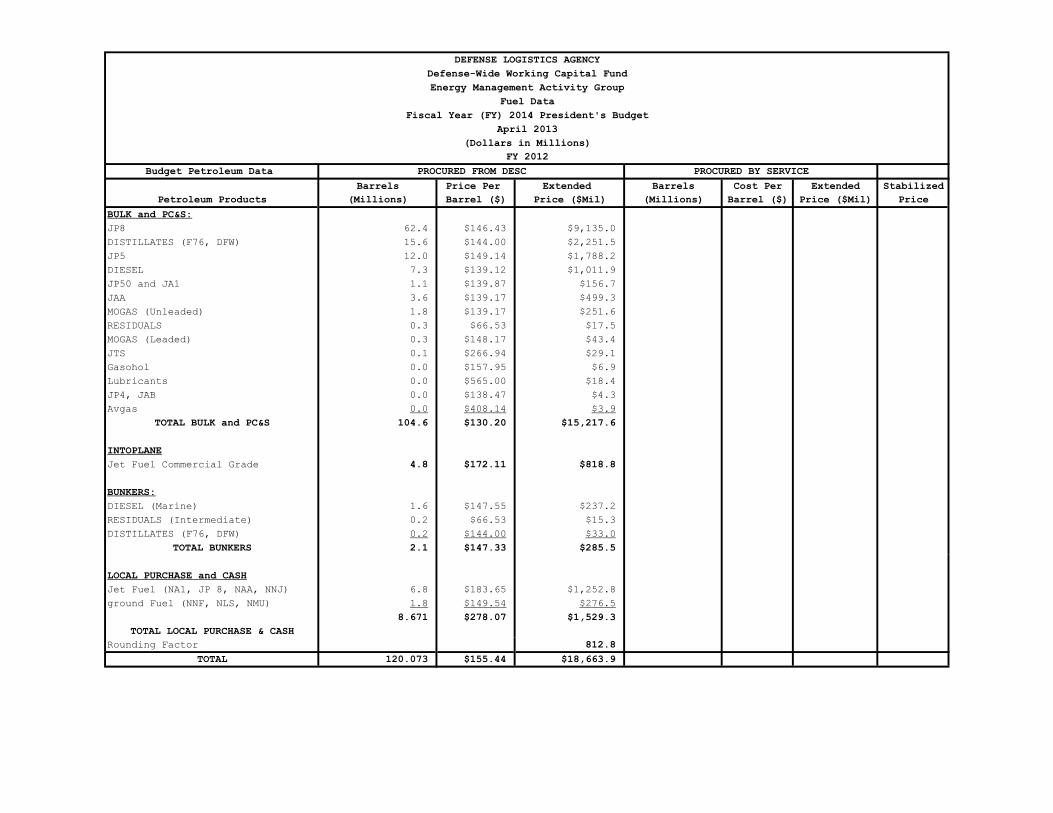
Budget Petroleum Data
Barrels Price Per Extended Barrels Cost Per Extended Stabilized
Petroleum Products (Millions) Barrel ($) Price ($Mil) (Millions) Barrel ($) Price ($Mil) Price
BULK and PC&S:
JP8 62.4 $146.43 $9,135.0
DISTILLATES (F76, DFW) 15.6 $144.00 $2,251.5
JP5 12.0 $149.14 $1,788.2
DIESEL 7.3 $139.12 $1,011.9
JP50 and JA1 1.1 $139.87 $156.7
JAA 3.6 $139.17 $499.3
MOGAS (Unleaded) 1.8 $139.17 $251.6
RESIDUALS 0.3 $66.53 $17.5
MOGAS (Leaded) 0.3 $148.17 $43.4
JTS 0.1 $266.94 $29.1
Gasohol 0.0 $157.95 $6.9
Lubricants 0.0 $565.00 $18.4
JP4, JAB 0.0 $138.47 $4.3
Avgas 0.0 $408.14 $3.9
TOTAL BULK and PC&S 104.6 $130.20 $15,217.6
INTOPLANE
Jet Fuel Commercial Grade 4.8 $172.11 $818.8
BUNKERS:
DIESEL (Marine) 1.6 $147.55 $237.2
RESIDUALS (Intermediate) 0.2 $66.53 $15.3
DISTILLATES (F76, DFW) 0.2 $144.00 $33.0
TOTAL BUNKERS 2.1 $147.33 $285.5
LOCAL PURCHASE and CASH
Jet Fuel (NA1, JP 8, NAA, NNJ) 6.8 $183.65 $1,252.8
ground Fuel (NNF, NLS, NMU) 1.8 $149.54 $276.5
8.671 $278.07 $1,529.3
TOTAL LOCAL PURCHASE & CASH
Rounding Factor 812.8
TOTAL 120.073 $155.44 $18,663.9
$17,851.13
Defense-Wide Working Capital Fund
DEFENSE LOGISTICS AGENCY
Energy Management Activity Group
Fuel Data
Fiscal Year (FY) 2014 President's Budget
April 2013
(Dollars in Millions)
FY 2012
PROCURED FROM DESC PROCURED BY SERVICE

Budget Petroleum Data
Barrels Price Per Extended Barrels Cost Per Extended Stabilized
Petroleum Products (Millions) Barrel ($) Price ($Mil) (Millions) Barrel ($) Price ($Mil) Price
BULK and PC&S:
JP8 73.1 $156.66 $11,458.9
DISTILLATES (F76, DFW) 14.5 $151.20 $2,198.8
JP5 10.3 $149.30 $1,544.6
DIESEL (DF2) 9.2 $139.12 $1,284.5
JP50 and JA1 0.2 $156.66 $30.6
JAA 0.2 $149.30 $29.1
MOGAS (Unleaded) 1.6 $150.63 $241.1
RESIDUALS 0.2 $98.23 $19.2
MOGAS (Leaded) 0.3 $148.17 $39.0
JTS 0.1 $268.45 $21.0
Gasohol 0.0 $157.95 $6.2
Lubricants 0.0 $565.00 $16.5
JP4, JAB 0.0 $150.58 $4.4
Avgas 0.0 $179.52 $5.3
TOTAL BULK and PC&S 109.9 $134.40 $16,899.2
INTOPLANE
Jet Fuel Commercial Grade 5.0 $184.59 $918.8
BUNKERS:
DIESEL (Marine) 1.9 $139.12 $258.0
RESIDUALS (Intermediate) 0.4 $98.23 $39.3
DISTILLATES (F76, DFW) 0.2 $151.20 $31.0
TOTAL BUNKERS 2.5 $131.88 $328.3
LOCAL PURCHASE and CASH
Jet Fuel (NA1, NAA) 5.4 $198.50 $1,065.5
ground Fuel (NLS, NMU) 1.2 $143.17 $167.7
6.5 $187.74 $1,233.2
TOTAL LOCAL PURCHASE & CASH
Rounding Factor 30.2
TOTAL 123.897 $156.66 $19,409.7
$19,379.50
Fiscal Year (FY) 2014 President's Budget
April 2013
(Dollars in Millions)
FY 2013
PROCURED FROM DESC PROCURED BY SERVICE
Fuel Data
DEFENSE LOGISTICS AGENCY
Defense-Wide Working Capital Fund
Energy Management Activity Group
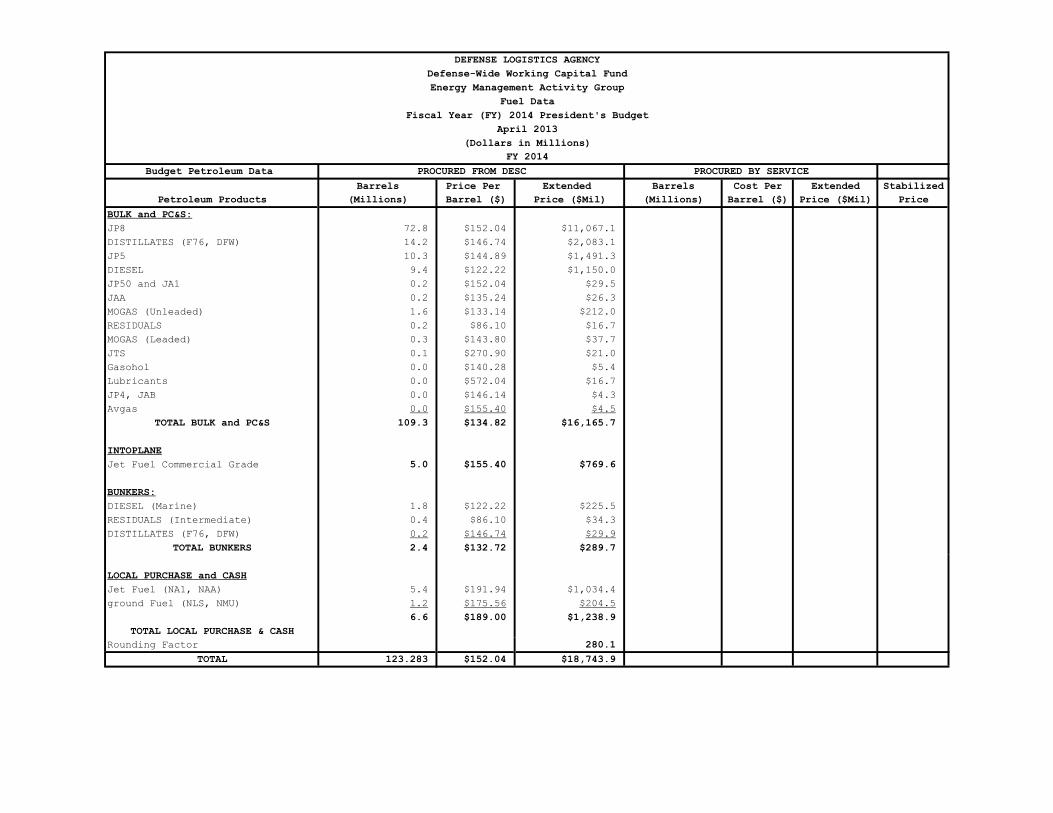
Budget Petroleum Data
Barrels Price Per Extended Barrels Cost Per Extended Stabilized
Petroleum Products (Millions) Barrel ($) Price ($Mil) (Millions) Barrel ($) Price ($Mil) Price
BULK and PC&S:
JP8 72.8 $152.04 $11,067.1
DISTILLATES (F76, DFW) 14.2 $146.74 $2,083.1
JP5 10.3 $144.89 $1,491.3
DIESEL 9.4 $122.22 $1,150.0
JP50 and JA1 0.2 $152.04 $29.5
JAA 0.2 $135.24 $26.3
MOGAS (Unleaded) 1.6 $133.14 $212.0
RESIDUALS 0.2 $86.10 $16.7
MOGAS (Leaded) 0.3 $143.80 $37.7
JTS 0.1 $270.90 $21.0
Gasohol 0.0 $140.28 $5.4
Lubricants 0.0 $572.04 $16.7
JP4, JAB 0.0 $146.14 $4.3
Avgas 0.0 $155.40 $4.5
TOTAL BULK and PC&S 109.3 $134.82 $16,165.7
INTOPLANE
Jet Fuel Commercial Grade 5.0 $155.40 $769.6
BUNKERS:
DIESEL (Marine) 1.8 $122.22 $225.5
RESIDUALS (Intermediate) 0.4 $86.10 $34.3
DISTILLATES (F76, DFW) 0.2 $146.74 $29.9
TOTAL BUNKERS 2.4 $132.72 $289.7
LOCAL PURCHASE and CASH
Jet Fuel (NA1, NAA) 5.4 $191.94 $1,034.4
ground Fuel (NLS, NMU) 1.2 $175.56 $204.5
6.6 $189.00 $1,238.9
TOTAL LOCAL PURCHASE & CASH
Rounding Factor 280.1
TOTAL 123.283 $152.04 $18,743.9
$18,463.81
April 2013
(Dollars in Millions)
FY 2014
PROCURED FROM DESC PROCURED BY SERVICE
DEFENSE LOGISTICS AGENCY
Defense-Wide Working Capital Fund
Energy Management Activity Group
Fuel Data
Fiscal Year (FY) 2014 President's Budget
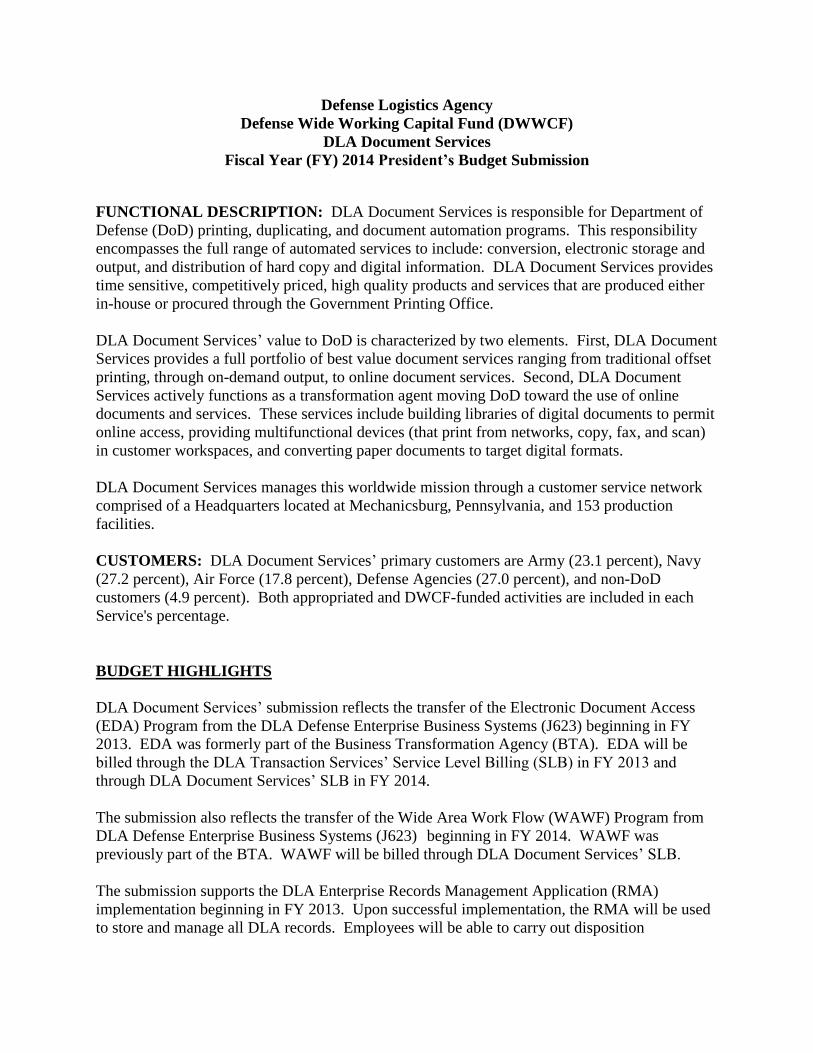
Defense Logistics Agency
Defense Wide Working Capital Fund (DWWCF)
DLA Document Services
Fiscal Year (FY) 2014 President’s Budget Submission
FUNCTIONAL DESCRIPTION: DLA Document Services is responsible for Department of
Defense (DoD) printing, duplicating, and document automation programs. This responsibility
encompasses the full range of automated services to include: conversion, electronic storage and
output, and distribution of hard copy and digital information. DLA Document Services provides
time sensitive, competitively priced, high quality products and services that are produced either
in-house or procured through the Government Printing Office.
DLA Document Services’ value to DoD is characterized by two elements. First, DLA Document
Services provides a full portfolio of best value document services ranging from traditional offset
printing, through on-demand output, to online document services. Second, DLA Document
Services actively functions as a transformation agent moving DoD toward the use of online
documents and services. These services include building libraries of digital documents to permit
online access, providing multifunctional devices (that print from networks, copy, fax, and scan)
in customer workspaces, and converting paper documents to target digital formats.
DLA Document Services manages this worldwide mission through a customer service network
comprised of a Headquarters located at Mechanicsburg, Pennsylvania, and 153 production
facilities.
CUSTOMERS: DLA Document Services’ primary customers are Army (23.1 percent), Navy
(27.2 percent), Air Force (17.8 percent), Defense Agencies (27.0 percent), and non-DoD
customers (4.9 percent). Both appropriated and DWCF-funded activities are included in each
Service's percentage.
BUDGET HIGHLIGHTS
DLA Document Services’ submission reflects the transfer of the Electronic Document Access
(EDA) Program from the DLA Defense Enterprise Business Systems (J623) beginning in FY
2013. EDA was formerly part of the Business Transformation Agency (BTA). EDA will be
billed through the DLA Transaction Services’ Service Level Billing (SLB) in FY 2013 and
through DLA Document Services’ SLB in FY 2014.
The submission also reflects the transfer of the Wide Area Work Flow (WAWF) Program from
DLA Defense Enterprise Business Systems (J623) beginning in FY 2014. WAWF was
previously part of the BTA. WAWF will be billed through DLA Document Services’ SLB.
The submission supports the DLA Enterprise Records Management Application (RMA)
implementation beginning in FY 2013. Upon successful implementation, the RMA will be used
to store and manage all DLA records. Employees will be able to carry out disposition
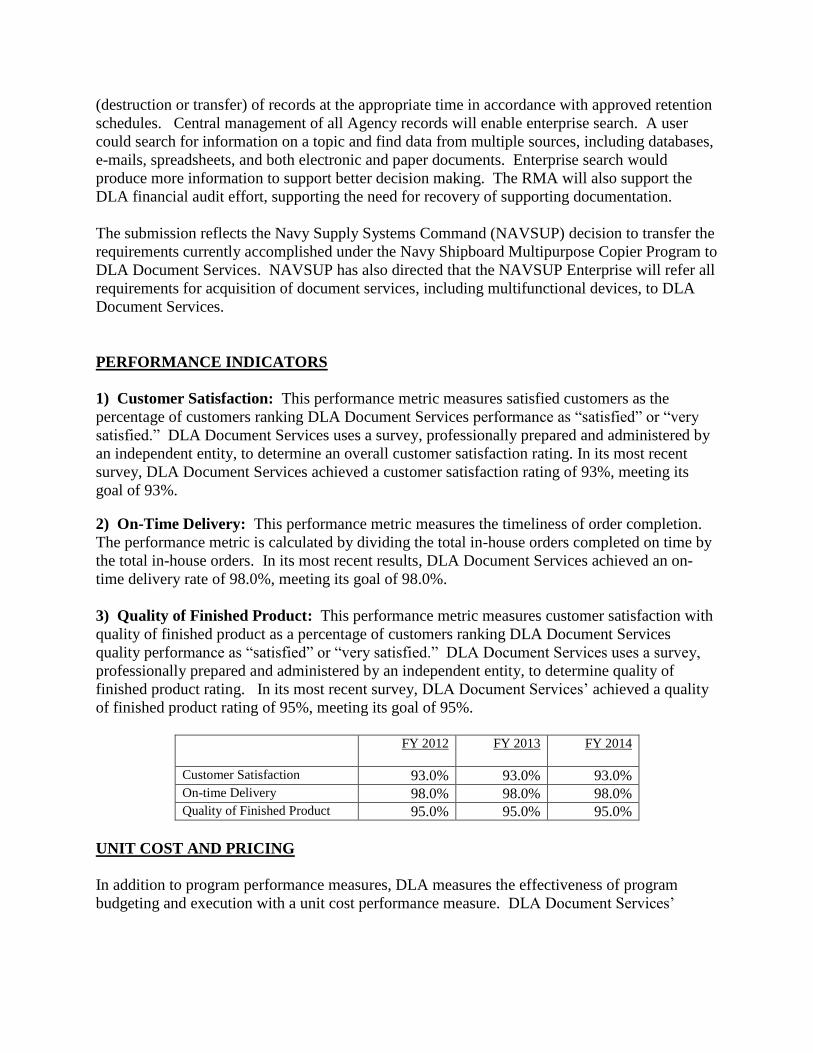
(destruction or transfer) of records at the appropriate time in accordance with approved retention
schedules. Central management of all Agency records will enable enterprise search. A user
could search for information on a topic and find data from multiple sources, including databases,
e-mails, spreadsheets, and both electronic and paper documents. Enterprise search would
produce more information to support better decision making. The RMA will also support the
DLA financial audit effort, supporting the need for recovery of supporting documentation.
The submission reflects the Navy Supply Systems Command (NAVSUP) decision to transfer the
requirements currently accomplished under the Navy Shipboard Multipurpose Copier Program to
DLA Document Services. NAVSUP has also directed that the NAVSUP Enterprise will refer all
requirements for acquisition of document services, including multifunctional devices, to DLA
Document Services.
PERFORMANCE INDICATORS
1) Customer Satisfaction: This performance metric measures satisfied customers as the
percentage of customers ranking DLA Document Services performance as “satisfied” or “very
satisfied.” DLA Document Services uses a survey, professionally prepared and administered by
an independent entity, to determine an overall customer satisfaction rating. In its most recent
survey, DLA Document Services achieved a customer satisfaction rating of 93%, meeting its
goal of 93%.
2) On-Time Delivery: This performance metric measures the timeliness of order completion.
The performance metric is calculated by dividing the total in-house orders completed on time by
the total in-house orders. In its most recent results, DLA Document Services achieved an on-
time delivery rate of 98.0%, meeting its goal of 98.0%.
3) Quality of Finished Product: This performance metric measures customer satisfaction with
quality of finished product as a percentage of customers ranking DLA Document Services
quality performance as “satisfied” or “very satisfied.” DLA Document Services uses a survey,
professionally prepared and administered by an independent entity, to determine quality of
finished product rating. In its most recent survey, DLA Document Services’ achieved a quality
of finished product rating of 95%, meeting its goal of 95%.
FY 2012 FY 2013 FY 2014
Customer Satisfaction 93.0% 93.0% 93.0%
On-time Delivery 98.0% 98.0% 98.0% Quality of Finished Product 95.0% 95.0% 95.0%
UNIT COST AND PRICING
In addition to program performance measures, DLA measures the effectiveness of program
budgeting and execution with a unit cost performance measure. DLA Document Services’
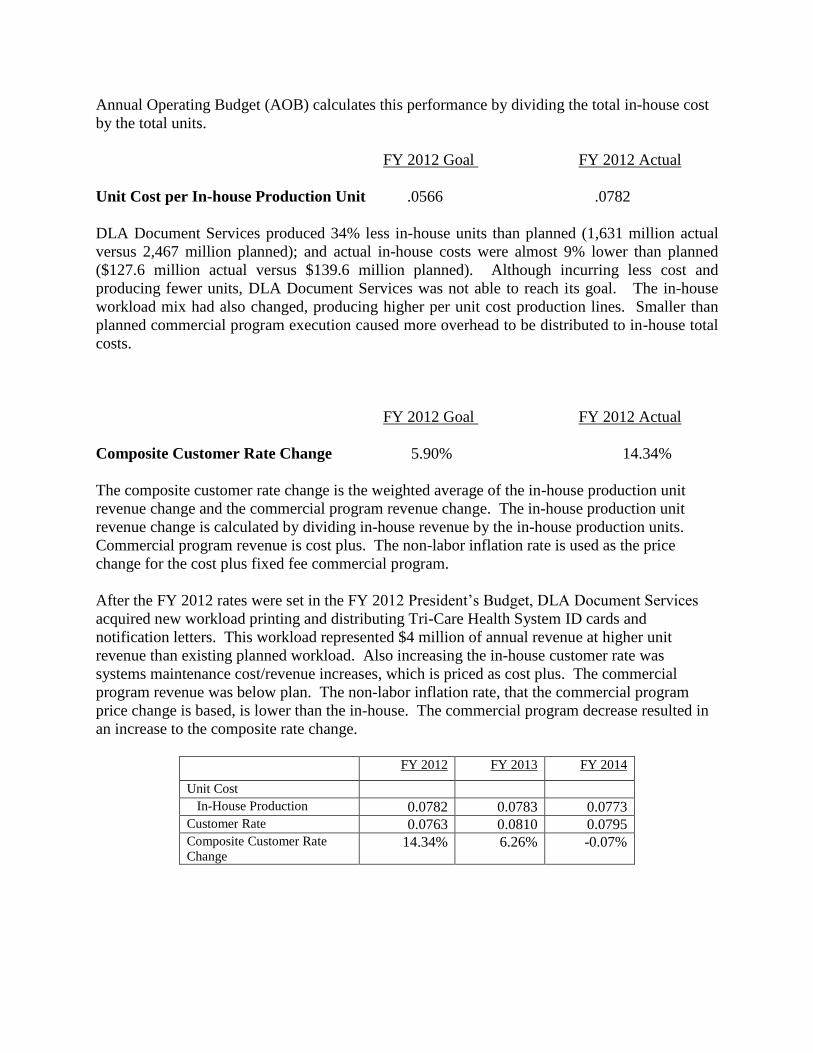
Annual Operating Budget (AOB) calculates this performance by dividing the total in-house cost
by the total units.
FY 2012 Goal FY 2012 Actual
Unit Cost per In-house Production Unit .0566 .0782
DLA Document Services produced 34% less in-house units than planned (1,631 million actual
versus 2,467 million planned); and actual in-house costs were almost 9% lower than planned
($127.6 million actual versus $139.6 million planned). Although incurring less cost and
producing fewer units, DLA Document Services was not able to reach its goal. The in-house
workload mix had also changed, producing higher per unit cost production lines. Smaller than
planned commercial program execution caused more overhead to be distributed to in-house total
costs.
FY 2012 Goal FY 2012 Actual
Composite Customer Rate Change 5.90% 14.34%
The composite customer rate change is the weighted average of the in-house production unit
revenue change and the commercial program revenue change. The in-house production unit
revenue change is calculated by dividing in-house revenue by the in-house production units.
Commercial program revenue is cost plus. The non-labor inflation rate is used as the price
change for the cost plus fixed fee commercial program.
After the FY 2012 rates were set in the FY 2012 President’s Budget, DLA Document Services
acquired new workload printing and distributing Tri-Care Health System ID cards and
notification letters. This workload represented $4 million of annual revenue at higher unit
revenue than existing planned workload. Also increasing the in-house customer rate was
systems maintenance cost/revenue increases, which is priced as cost plus. The commercial
program revenue was below plan. The non-labor inflation rate, that the commercial program
price change is based, is lower than the in-house. The commercial program decrease resulted in
an increase to the composite rate change.
FY 2012 FY 2013 FY 2014
Unit Cost In-House Production 0.0782 0.0783 0.0773 Customer Rate 0.0763 0.0810 0.0795 Composite Customer Rate
Change 14.34% 6.26% -0.07%
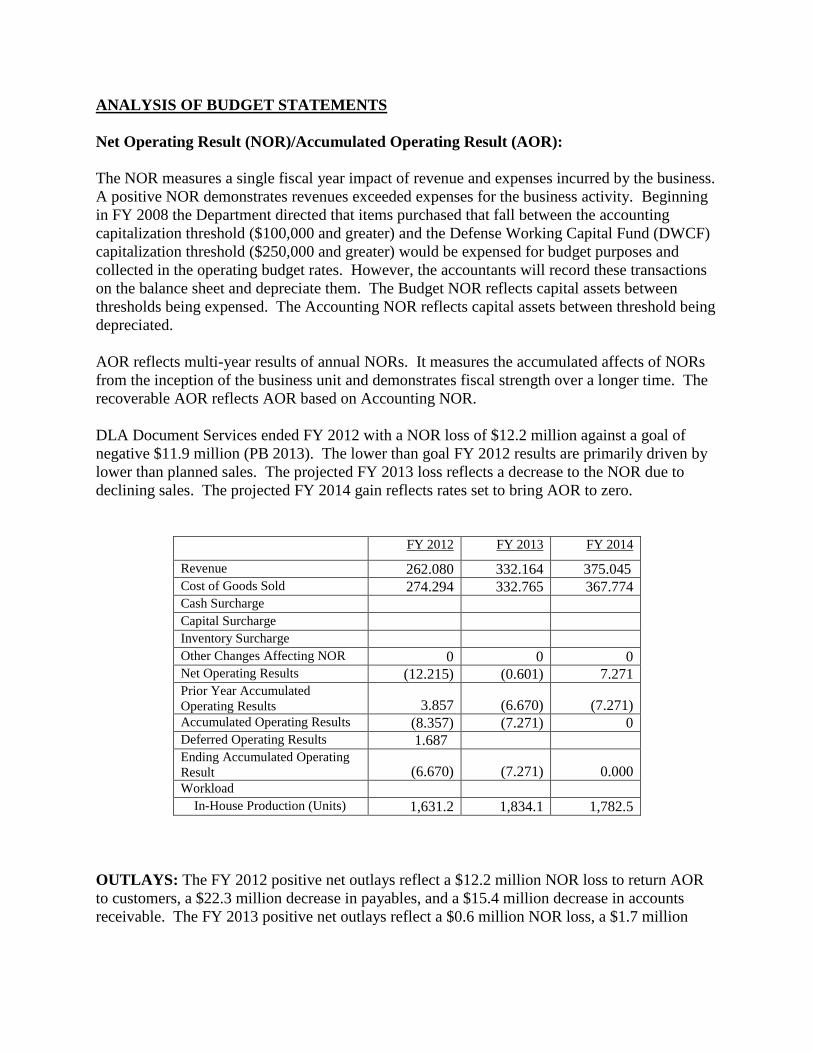
ANALYSIS OF BUDGET STATEMENTS
Net Operating Result (NOR)/Accumulated Operating Result (AOR):
The NOR measures a single fiscal year impact of revenue and expenses incurred by the business.
A positive NOR demonstrates revenues exceeded expenses for the business activity. Beginning
in FY 2008 the Department directed that items purchased that fall between the accounting
capitalization threshold ($100,000 and greater) and the Defense Working Capital Fund (DWCF)
capitalization threshold ($250,000 and greater) would be expensed for budget purposes and
collected in the operating budget rates. However, the accountants will record these transactions
on the balance sheet and depreciate them. The Budget NOR reflects capital assets between
thresholds being expensed. The Accounting NOR reflects capital assets between threshold being
depreciated.
AOR reflects multi-year results of annual NORs. It measures the accumulated affects of NORs
from the inception of the business unit and demonstrates fiscal strength over a longer time. The
recoverable AOR reflects AOR based on Accounting NOR.
DLA Document Services ended FY 2012 with a NOR loss of $12.2 million against a goal of
negative $11.9 million (PB 2013). The lower than goal FY 2012 results are primarily driven by
lower than planned sales. The projected FY 2013 loss reflects a decrease to the NOR due to
declining sales. The projected FY 2014 gain reflects rates set to bring AOR to zero.
FY 2012 FY 2013 FY 2014
Revenue 262.080 332.164 375.045 Cost of Goods Sold 274.294 332.765 367.774 Cash Surcharge Capital Surcharge Inventory Surcharge Other Changes Affecting NOR 0 0 0 Net Operating Results (12.215) (0.601) 7.271 Prior Year Accumulated
Operating Results 3.857 (6.670) (7.271) Accumulated Operating Results (8.357) (7.271) 0 Deferred Operating Results 1.687 Ending Accumulated Operating
Result (6.670) (7.271) 0.000 Workload In-House Production (Units) 1,631.2 1,834.1 1,782.5
OUTLAYS: The FY 2012 positive net outlays reflect a $12.2 million NOR loss to return AOR
to customers, a $22.3 million decrease in payables, and a $15.4 million decrease in accounts
receivable. The FY 2013 positive net outlays reflect a $0.6 million NOR loss, a $1.7 million
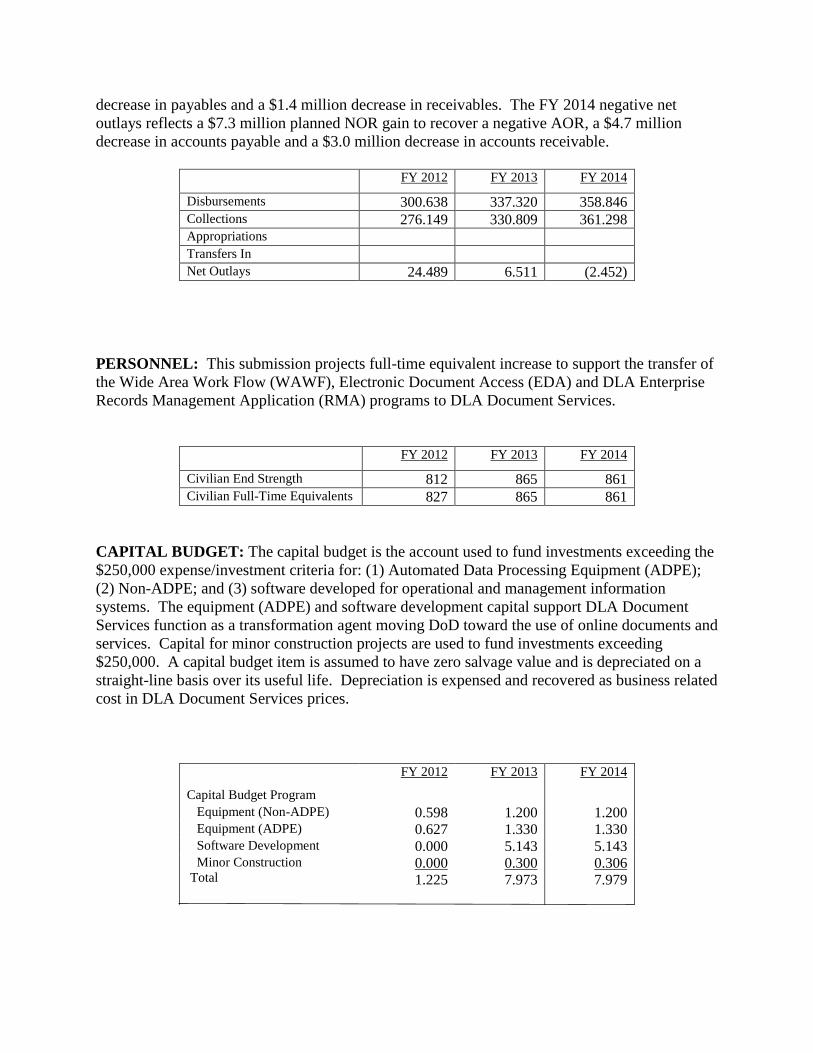
decrease in payables and a $1.4 million decrease in receivables. The FY 2014 negative net
outlays reflects a $7.3 million planned NOR gain to recover a negative AOR, a $4.7 million
decrease in accounts payable and a $3.0 million decrease in accounts receivable.
FY 2012 FY 2013 FY 2014
Disbursements 300.638 337.320 358.846 Collections 276.149 330.809 361.298 Appropriations Transfers In Net Outlays 24.489 6.511 (2.452)
PERSONNEL: This submission projects full-time equivalent increase to support the transfer of
the Wide Area Work Flow (WAWF), Electronic Document Access (EDA) and DLA Enterprise
Records Management Application (RMA) programs to DLA Document Services.
FY 2012 FY 2013 FY 2014
Civilian End Strength 812 865 861 Civilian Full-Time Equivalents 827 865 861
CAPITAL BUDGET: The capital budget is the account used to fund investments exceeding the
$250,000 expense/investment criteria for: (1) Automated Data Processing Equipment (ADPE);
(2) Non-ADPE; and (3) software developed for operational and management information
systems. The equipment (ADPE) and software development capital support DLA Document
Services function as a transformation agent moving DoD toward the use of online documents and
services. Capital for minor construction projects are used to fund investments exceeding
$250,000. A capital budget item is assumed to have zero salvage value and is depreciated on a
straight-line basis over its useful life. Depreciation is expensed and recovered as business related
cost in DLA Document Services prices.
FY 2012 FY 2013 FY 2014
Capital Budget Program Equipment (Non-ADPE) 0.598 1.200 1.200 Equipment (ADPE) 0.627 1.330 1.330 Software Development 0.000 5.143 5.143 Minor Construction
Total 0.000
1.225
0.300
7.973
0.306
7.979

SERVICE LEVEL BILLING TO SERVICES
DLA Document Services will perform service level billing for both the Electronic Document Access (EDA) and
Wide Area Workflow programs beginning in FY 2014. EDA is projected to bill at 25 percent for each Service plus
DLA, while WAWF billing allocation is based on actual transactions.
Electronic Document Access
Wide Area Workflow
($M) FY 2014 FY 2015 FY 2016 FY 2017 FY 2018
Army 1.9 1.9 2.0 2.0 2.0
Navy 1.4 1.4 1.5 1.5 1.5
Air Force 1.9 1.9 2.0 2.0 2.0
Marine Corps 0.5 0.5 0.5 0.5 0.5
DLA 1.9 1.9 2.0 2.0 2.0
Total 7.6 7.6 8.0 8.0 8.0
($M) FY 2014 FY 2015 FY 2016 FY 2017 FY 2018
Army 5.1 5.2 5.4 5.5 5.5
Navy 4.0 4.1 4.2 4.3 4.3
Air Force 3.0 3.1 3.1 3.2 3.2
Marine Corps 0.7 0.7 0.7 0.8 0.8
DCMA 4.2 4.3 4.4 4.5 4.5
Total 16.9 17.4 17.9 18.2 18.2
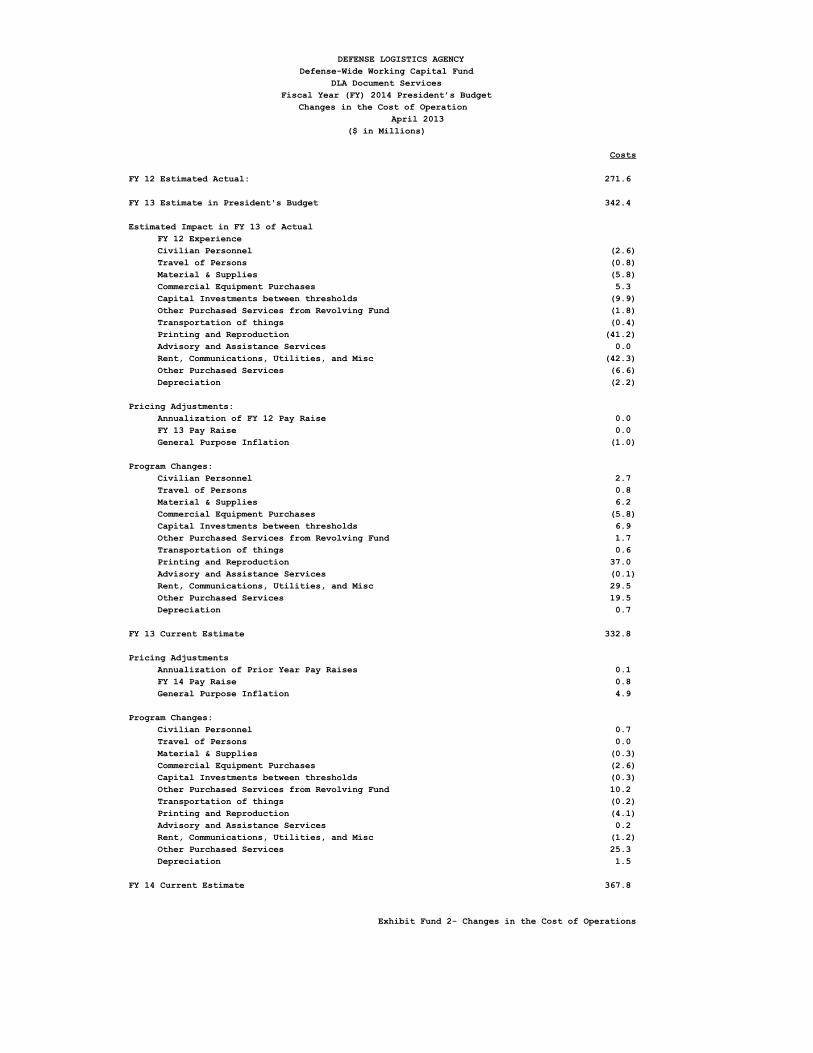
DEFENSE LOGISTICS AGENCY
Defense-Wide Working Capital Fund
DLA Document Services
April 2013
($ in Millions)
Costs
FY 12 Estimated Actual: 271.6
FY 13 Estimate in President's Budget 342.4
Estimated Impact in FY 13 of Actual
FY 12 Experience
Civilian Personnel (2.6)
Travel of Persons (0.8)
Material & Supplies (5.8)
Commercial Equipment Purchases 5.3
Capital Investments between thresholds (9.9)
Other Purchased Services from Revolving Fund (1.8)
Transportation of things (0.4)
Printing and Reproduction (41.2)
Advisory and Assistance Services 0.0
Rent, Communications, Utilities, and Misc (42.3)
Other Purchased Services (6.6)
Depreciation (2.2)
Pricing Adjustments:
Annualization of FY 12 Pay Raise 0.0
FY 13 Pay Raise 0.0
General Purpose Inflation (1.0)
Program Changes:
Civilian Personnel 2.7
Travel of Persons 0.8
Material & Supplies 6.2
Commercial Equipment Purchases (5.8)
Capital Investments between thresholds 6.9
Other Purchased Services from Revolving Fund 1.7
Transportation of things 0.6
Printing and Reproduction 37.0
Advisory and Assistance Services (0.1)
Rent, Communications, Utilities, and Misc 29.5
Other Purchased Services 19.5
Depreciation 0.7
FY 13 Current Estimate 332.8
Pricing Adjustments
Annualization of Prior Year Pay Raises 0.1
FY 14 Pay Raise 0.8
General Purpose Inflation 4.9
Program Changes:
Civilian Personnel 0.7
Travel of Persons 0.0
Material & Supplies (0.3)
Commercial Equipment Purchases (2.6)
Capital Investments between thresholds (0.3)
Other Purchased Services from Revolving Fund 10.2
Transportation of things (0.2)
Printing and Reproduction (4.1)
Advisory and Assistance Services 0.2
Rent, Communications, Utilities, and Misc (1.2)
Other Purchased Services 25.3
Depreciation 1.5
FY 14 Current Estimate 367.8
Exhibit Fund 2- Changes in the Cost of Operations
Fiscal Year (FY) 2014 President’s Budget
Changes in the Cost of Operation
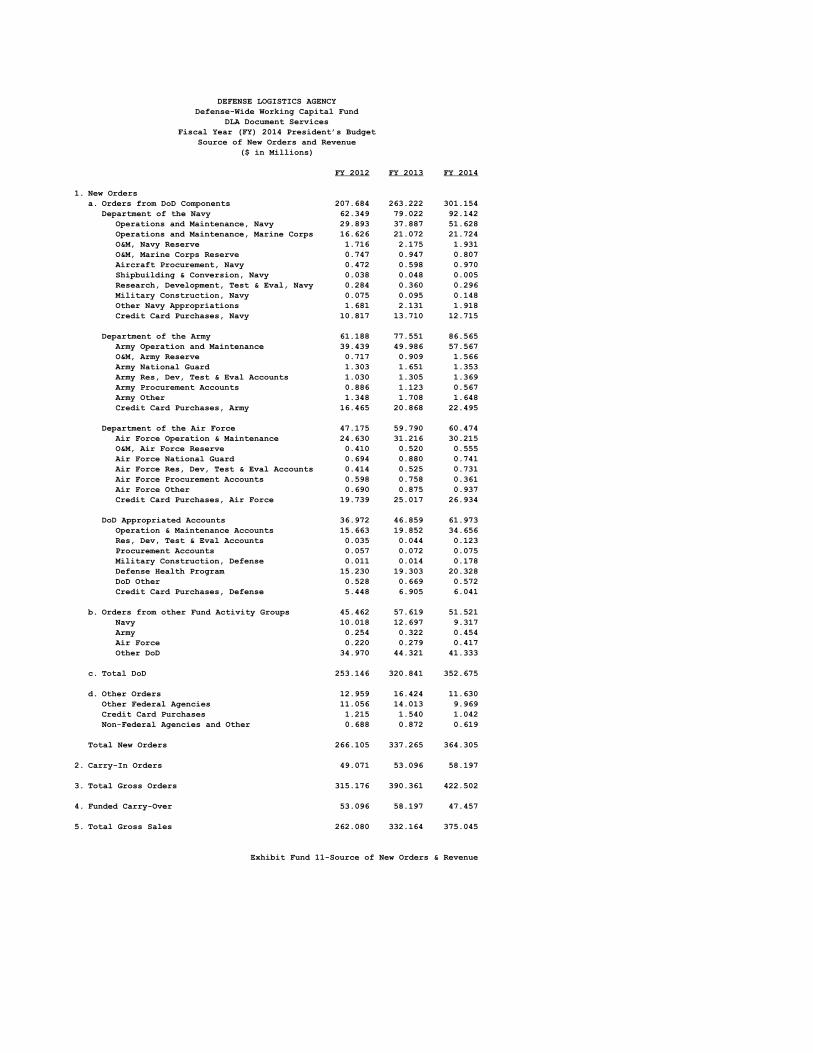
FY 2012 FY 2013 FY 2014
1. New Orders
a. Orders from DoD Components 207.684 263.222 301.154
Department of the Navy 62.349 79.022 92.142
Operations and Maintenance, Navy 29.893 37.887 51.628
Operations and Maintenance, Marine Corps 16.626 21.072 21.724
O&M, Navy Reserve 1.716 2.175 1.931
O&M, Marine Corps Reserve 0.747 0.947 0.807
Aircraft Procurement, Navy 0.472 0.598 0.970
Shipbuilding & Conversion, Navy 0.038 0.048 0.005
Research, Development, Test & Eval, Navy 0.284 0.360 0.296
Military Construction, Navy 0.075 0.095 0.148
Other Navy Appropriations 1.681 2.131 1.918
Credit Card Purchases, Navy 10.817 13.710 12.715
Department of the Army 61.188 77.551 86.565
Army Operation and Maintenance 39.439 49.986 57.567
O&M, Army Reserve 0.717 0.909 1.566
Army National Guard 1.303 1.651 1.353
Army Res, Dev, Test & Eval Accounts 1.030 1.305 1.369
Army Procurement Accounts 0.886 1.123 0.567
Army Other 1.348 1.708 1.648
Credit Card Purchases, Army 16.465 20.868 22.495
Department of the Air Force 47.175 59.790 60.474
Air Force Operation & Maintenance 24.630 31.216 30.215
O&M, Air Force Reserve 0.410 0.520 0.555
Air Force National Guard 0.694 0.880 0.741
Air Force Res, Dev, Test & Eval Accounts 0.414 0.525 0.731
Air Force Procurement Accounts 0.598 0.758 0.361
Air Force Other 0.690 0.875 0.937
Credit Card Purchases, Air Force 19.739 25.017 26.934
DoD Appropriated Accounts 36.972 46.859 61.973
Operation & Maintenance Accounts 15.663 19.852 34.656
Res, Dev, Test & Eval Accounts 0.035 0.044 0.123
Procurement Accounts 0.057 0.072 0.075
Military Construction, Defense 0.011 0.014 0.178
Defense Health Program 15.230 19.303 20.328
DoD Other 0.528 0.669 0.572
Credit Card Purchases, Defense 5.448 6.905 6.041
b. Orders from other Fund Activity Groups 45.462 57.619 51.521
Navy 10.018 12.697 9.317
Army 0.254 0.322 0.454
Air Force 0.220 0.279 0.417
Other DoD 34.970 44.321 41.333
c. Total DoD 253.146 320.841 352.675
d. Other Orders 12.959 16.424 11.630
Other Federal Agencies 11.056 14.013 9.969
Credit Card Purchases 1.215 1.540 1.042
Non-Federal Agencies and Other 0.688 0.872 0.619
Total New Orders 266.105 337.265 364.305
2. Carry-In Orders 49.071 53.096 58.197
3. Total Gross Orders 315.176 390.361 422.502
4. Funded Carry-Over 53.096 58.197 47.457
5. Total Gross Sales 262.080 332.164 375.045
Exhibit Fund 11-Source of New Orders & Revenue
Fiscal Year (FY) 2014 President’s Budget
Source of New Orders and Revenue
($ in Millions)
DEFENSE LOGISTICS AGENCY
Defense-Wide Working Capital Fund
DLA Document Services

Defense-Wide Working Capital Fund
DLA Document Services
Revenue and Costs
($ in Millions)
FY 2012 FY 2013 FY 2014
Revenue
Gross Sales 262.080 332.164 375.045
Operations 0.000 0.000 0.000
Capital Surcharge 0.000 0.000 0.000
Depreciation excluding Major Construction 0.000 0.000 0.000
Major Construction Depreciation 0.000 0.000 0.000
Other Income 0.000 0.000 0.000
Refunds/Discounts (-) 0.000 0.000 0.000
Total Income: 262.080 332.164 375.045
Costs
Cost of Material Sold from Inventory 0.000 0.000 0.000
Salaries and Wages:
Military Personnel Compensation & Benefits 0.000 0.000 0.000
Civilian Personnel Compensation & Benefits 65.549 68.048 69.303
Travel & Transportation of Personnel 0.932 1.785 1.810
Materials & Supplies (For Internal Operations) 16.996 21.546 21.690
Equipment Purchases 12.008 7.472 5.029
Capital Investments between Thresholds 0.000 1.810 1.500
Other Purchases from Revolving Funds 3.799 5.796 16.090
Transportation of Things 1.593 2.232 2.099
Depreciation - Capital 2.669 3.216 4.662
Printing and Reproduction 66.039 78.422 76.163
Advisory and Assistance Services 0.904 0.865 1.075
Rent, Communications, Utilities, & Misc. Charges 65.751 86.072 86.536
Other Purchased Services 38.054 55.501 81.817
Total Expenses: 274.294 332.765 367.774
Operating Result (12.215) (0.601) 7.271
Net Operating Result (12.215) (0.601) 7.271
Prior Year Adjustments
Prior Year AOR 3.857 (6.670) (7.271)
Accumulated Operating Result (8.357) (7.271) (0.000)
Non-Recoverable Adjustment Impacting AOR:
Deferred Operating Results and Depreciation 1.687
Accumulated Operating Results for Budget Purposes (6.670) (7.271) (0.000)
Exhibit Fund 14-Revenue and Expenses
DEFENSE LOGISTICS AGENCY
Fiscal Year (FY) 2014 President’s Budget