defining contagion and divergence based on the...
TRANSCRIPT
Gábor Dávid KISS
Defining Contagion and Divergence Based on the Extremity
of Daily Returns
- on the networks of the East-Central European stock, bond and
currency markets
Theses of doctoral dissertation
2012


University of Szeged
Faculty of Economics and Business Administration
Doctoral School in Economics
Gábor Dávid KISS
Defining Contagion and Divergence Based on the Extremity
of Daily Returns
- on the networks of the East-Central European stock, bond and
currency markets
Theses of doctoral dissertation
Supervisors:
Prof. Dr. Katalin BOTOS
Prof. Dr. Árpád KOVÁCS
University of Szeged, Faculty of Economics and Business Administration
Institute of Finance and International Economic Relations
Szeged, 2012

1
Contents 1. Introduction ......................................................................................................................... 2
2. Aims of the dissertation, definitions and hypotheses .......................................................... 2
3. Structure of the dissertation ................................................................................................ 6
4. Methodology ....................................................................................................................... 7
5. Summary of the results ..................................................................................................... 11
References ................................................................................................................................ 12
The candidate’s publication in the subject of the dissertation ................................................. 13

2
1. INTRODUCTION
Present days the actors on the capital markets as well as central bankers have to face with the
following question due to the international free flow of liquidity: what happens with the inter-
market correlations under extreme trading days? To ask this question the hypothesis of market
efficiency has to be rejected at first, but diversification strategies will be inefficient under
these circumstances – what is more than a simple theoretical problem.
This study has two main novelties: at first, there was no more comprehensive analysis in the
region to study contagion both on stock, bond and currency markets, as well as the applied
method to define the subset of extreme trading days is also new. This work applies the theory
of scale-free networks by Albert Barabási as well as the tool of dynamic conditional
correlation by Robert Engle, keeping in mind that this region has a unique model of
capitalism as Beata Farkas suggests.
In my opinion, the loss of financial stability is caused both by global imbalances and flow of
liquidity – but they are expressible trough the dynamic and statistic properties of extreme
events.
2. AIMS OF THE DISSERTATION, DEFINITIONS AND HYPOTHESES
The aim of this study is to analyze the following: assuming a network of capital markets in
East-Central Europe, Euro-zone and the US, how collective market behaviors are able to bias
market prices under extreme days? To answer this question, it is necessary to define at first
the set of data, then to define forms of collective behaviors.
This study focuses on the 3 month and the 10 year maturities of bond, currency, and stock
market developments between January 1 2002 and August 31 2011 using logarithmic
differentials as returns, calculated from daily closing values.
Bonanno et al. (2001) defined the three statistical consequences of complexity in financial
market: first of all time series have short range and long range memories and only asymptotic
stationary, second, their sectoral intraday cross-correlations are high, and for third they proved
collective market behavior during extreme market events. The terms of contagion, divergence
and interdependence are consistent with the latest two consequences – while interdependence
rules out any significant changes in the common movement between markets, contagion
counts with significant increase as well as divergence with decrease of the cross market
correlation.
Contagions could be broadly defined as the cross-country transmission of shocks or the
general cross-country spillover effects, which does not need to be related to crises. This paper

3
uses the World Bank’s very restrictive definition1 on the contagions, as a cross-country
correlations increase during "crisis times" relative to correlations during "tranquil times". We
can talk about interdependence, when the difference between correlations under extreme and
normal conditions is insignificant.
Definition: Contagion (1) occurs between mkmj markets, when the cross-market
correlation became significantly higher due to a shock derived from one market (rn/xm
) to
others or other external factors (Forbes and Rigobon, 2002; Campbell et al., 2002; Bekaert et
al., 2005):
𝑟𝑛/𝑥𝑚 𝑖 ≠ 0 → 𝜌𝑛
𝑚𝑘𝑚 𝑗 < 𝜌𝑥𝑚𝑘𝑚 𝑗
, (1)
Definition: Interdependence (2) occurs between mkmj markets, when the cross-
market correlation not became significantly different, but the level of correlation is constantly
high (Forbes and Rigobon, 2002):
𝑟𝑛/𝑥𝑚 𝑖 ≠ 0 → 𝜌𝑛
𝑚𝑘𝑚 𝑗 ≈ 𝜌𝑥𝑚𝑘𝑚 𝑗
, (2)
Definition: Divergence (3) occurs between mkmj markets, when the cross-market
correlation became significantly lower due to a shock derived from one market (rn/xm
) to
others or other external factors (Bearce 2002):
𝑟𝑛/𝑥𝑚 𝑖 ≠ 0 → 𝜌𝑛
𝑚𝑘𝑚 𝑗 > 𝜌𝑥𝑚𝑘𝑚 𝑗
, (3)
The necessity to define ―shocks‖ or extreme events and correlations is nested in the upper
definitions.
Definition: Extreme event is a 𝑤𝑥 ∈ 𝑊 event for a W stochastic variable with a wx>>wn or
wx<<wn) significant higher impact than the expected, in a limited time and space with a
p(wx)<<p(wn) significant lower probability than the expected, providing a uniqueness
(Jentsch et al. 2006). Extreme events have both statistical and dynamic properties. Their
statistical property comes from their occurrence on the tails of probability distribution –
defining both negative and positive extreme events as well as pointing on the importance of
fat tailed distributions. Extreme events are built in features of complex systems (like the scale-
free networks of Barabási-Albert (1999)), where the power-law degree distributed structure
defines the error tolerance and attack vulnerability as well as easy synchronicity (Clauset et al.
2009).
Capital market returns are also power law distributed in ideal cases as Gabaix et al. (2003)
suggest or at least fat-tailed. Therefore it is reasonable to define extreme returns on the basis
1 see: http://go.worldbank.org/JIBDRK3YC0, cited also by Forbes, Rigobon (2002)
4
of the extreme event definition – to state that ―shocks‖ came from the transition from normal
to extreme return subset.
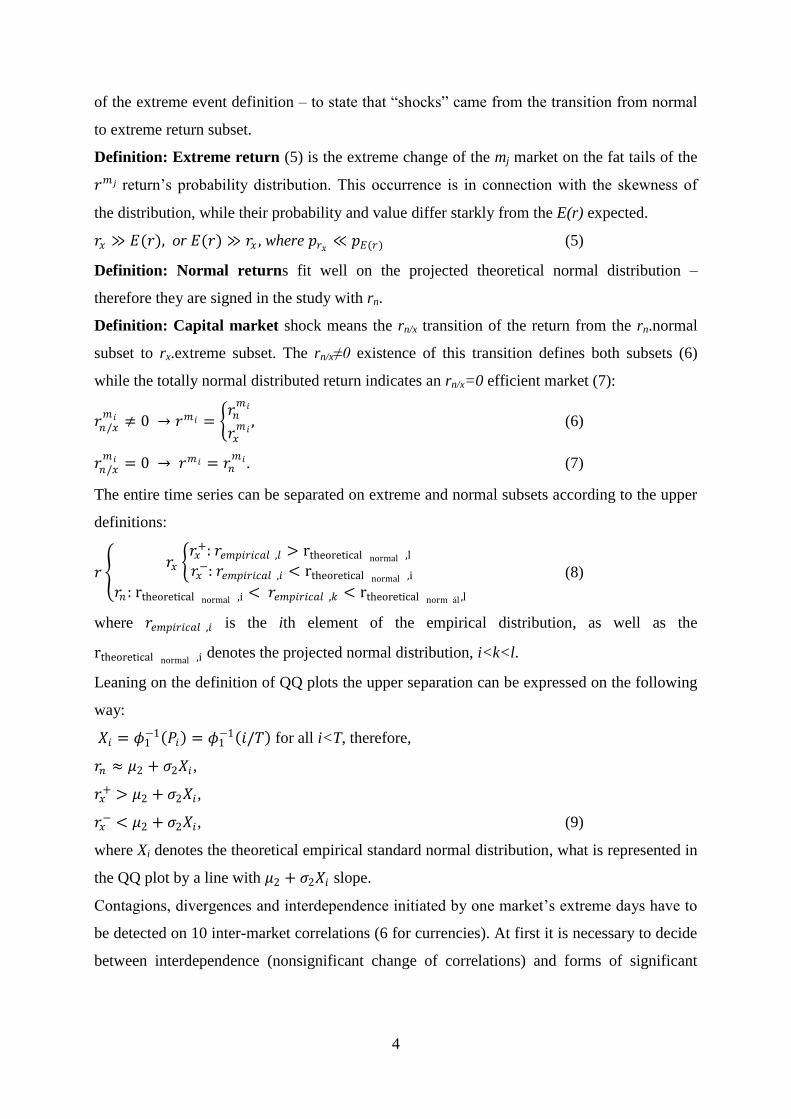
Definition: Extreme return (5) is the extreme change of the mj market on the fat tails of the
𝑟𝑚 𝑗 return’s probability distribution. This occurrence is in connection with the skewness of
the distribution, while their probability and value differ starkly from the E(r) expected.
𝑟𝑥 ≫ 𝐸(𝑟), or 𝐸(𝑟) ≫ 𝑟𝑥 , where 𝑝𝑟𝑥 ≪ 𝑝𝐸(𝑟) (5)
Definition: Normal returns fit well on the projected theoretical normal distribution –
therefore they are signed in the study with rn.
Definition: Capital market shock means the rn/x transition of the return from the rn.normal
subset to rx.extreme subset. The rn/x≠0 existence of this transition defines both subsets (6)
while the totally normal distributed return indicates an rn/x=0 efficient market (7):
𝑟𝑛/𝑥𝑚 𝑖 ≠ 0 → 𝑟𝑚 𝑖 =
𝑟𝑛𝑚 𝑖
𝑟𝑥𝑚 𝑖 , (6)
𝑟𝑛/𝑥𝑚 𝑖 = 0 → 𝑟𝑚 𝑖 = 𝑟𝑛
𝑚 𝑖 . (7)
The entire time series can be separated on extreme and normal subsets according to the upper
definitions:
𝑟 𝑟𝑥
𝑟𝑥+: 𝑟𝑒𝑚𝑝𝑖𝑟𝑖𝑐𝑎𝑙 ,𝑙 > rtheoretical normal ,l
𝑟𝑥−: 𝑟𝑒𝑚𝑝𝑖𝑟𝑖𝑐𝑎𝑙 ,𝑖 < rtheoretical normal ,i
𝑟𝑛 : rtheoretical normal ,i < 𝑟𝑒𝑚𝑝𝑖𝑟𝑖𝑐𝑎𝑙 ,𝑘 < rtheoretical norm ál ,l
(8)
where 𝑟𝑒𝑚𝑝𝑖𝑟𝑖𝑐𝑎𝑙 ,𝑖 is the ith element of the empirical distribution, as well as the
rtheoretical normal ,i denotes the projected normal distribution, i<k<l.
Leaning on the definition of QQ plots the upper separation can be expressed on the following
way:
𝑋𝑖 = 𝜙1−1 𝑃𝑖 = 𝜙1
−1 𝑖/𝑇 for all i<T, therefore,
𝑟𝑛 ≈ 𝜇2 + 𝜎2𝑋𝑖 ,
𝑟𝑥+ > 𝜇2 + 𝜎2𝑋𝑖,
𝑟𝑥− < 𝜇2 + 𝜎2𝑋𝑖, (9)
where Xi denotes the theoretical empirical standard normal distribution, what is represented in
the QQ plot by a line with 𝜇2 + 𝜎2𝑋𝑖 slope.
Contagions, divergences and interdependence initiated by one market’s extreme days have to
be detected on 10 inter-market correlations (6 for currencies). At first it is necessary to decide
between interdependence (nonsignificant change of correlations) and forms of significant

5
correlation changes (as divergence and contagion) – it could be expressed by the overall
weight of significant different correlations (10):
(𝑠𝑚1𝑚2 ,𝑠𝑚1𝑚3 ,…,𝑠𝑚𝑗𝑚𝑘,…,𝑠𝑚𝑛−1𝑚𝑛 )
𝑁 > 50%,𝑤𝑒𝑟𝑒 𝑖𝑠 𝑐𝑜𝑛𝑡𝑎𝑔𝑖𝑜𝑛 𝑜𝑟 𝑑𝑖𝑣𝑒𝑟𝑔𝑒𝑛𝑐𝑒
≤ 50%,𝑤𝑒𝑟𝑒 𝑖𝑠 𝑖𝑛𝑡𝑒𝑟𝑑𝑒𝑝𝑒𝑛𝑑𝑒𝑛𝑐𝑒 , (10)
where 𝑠 = 1,𝑤𝑒𝑛 𝑐𝑜𝑟𝑟𝑒𝑙𝑎𝑡𝑖𝑜𝑛𝑠 𝑎𝑟𝑒 𝑠𝑖𝑔𝑛𝑖𝑓𝑖𝑐𝑎𝑛𝑡 𝑑𝑖𝑓𝑓𝑒𝑟𝑒𝑛𝑡
0,𝑤𝑒𝑛 𝑐𝑜𝑟𝑟𝑒𝑙𝑎𝑡𝑖𝑜𝑛𝑠 𝑎𝑟𝑒 𝑛𝑜𝑛𝑠𝑖𝑔𝑛𝑖𝑓𝑖𝑐𝑎𝑛𝑡 𝑑𝑖𝑓𝑓𝑒𝑟𝑒𝑛𝑡 , N denotes the number
of involved market pairs. Contagions are characterized by significant higher, as well as
divergences by significant lower correlations according to the definitions (11). To choose
between these two form the following algorithm was used:
𝑔 = 1, 𝑖𝑓 (𝜌𝑛𝑎 =
0, 𝑖𝑓 𝑠 = 0𝜌𝑛 , 𝑖𝑓 𝑠 = 1
< 𝜌𝑥𝑎 = 0, 𝑖𝑓 𝑠 = 0𝜌𝑥 , 𝑖𝑓 𝑠 = 1
)
0, 𝑖𝑓 (𝜌𝑛𝑎 = 0, 𝑖𝑓 𝑠 = 0𝜌𝑛 , 𝑖𝑓 𝑠 = 1
≥ 𝜌𝑥𝑎 = 0, 𝑖𝑓 𝑠 = 0𝜌𝑥 , 𝑖𝑓𝑠 = 1
)
,
than (𝑔𝑚1𝑚2 ,𝑔𝑚1𝑚3 ,…,𝑔𝑚𝑗𝑚𝑘
,…,𝑔𝑚𝑛−1𝑚𝑛 )
𝑁
> 50%,𝑤𝑒𝑟𝑒 𝑖𝑠 𝑐𝑜𝑛𝑡𝑎𝑔𝑖𝑜𝑛≤ 50%,𝑤𝑒𝑟𝑒 𝑖𝑠 𝑑𝑖𝑣𝑒𝑟𝑔𝑒𝑛𝑐𝑒
. (11)
So the contagion was expressed by weighting against the entire set of correlations, what is a
strict rule.
The definition of basic formulas supports the expression of my dissertation’s hypotheses.
Hypothesis 1.: There is an mV capital market, what is capable to identify the contagions on
the East-Central European capital markets(12):
𝑟𝑛/𝑥𝑚𝑉 ≠ 0 → 𝜌𝑛
𝑚𝑘𝑚 𝑗 < 𝜌𝑥𝑚𝑘𝑚 𝑗
. (12)
Hypothesis 2.: Assuming an US (𝑚𝑉1) and a Euro-zone (𝑚𝑉2
) capital market, contagion will
be not detected upon the strength (13) of external trade (𝑋𝐶𝐸𝐸𝑉1
𝑋𝐶𝐸𝐸<
𝑋𝐶𝐸𝐸𝑉2
𝑋𝐶𝐸𝐸,𝐼𝑀𝐶𝐸𝐸
𝑉1
𝐼𝑀𝐶𝐸𝐸<
𝐼𝑀𝐶𝐸𝐸𝑉2
𝐼𝑀𝐶𝐸𝐸):
𝑟𝑛/𝑥
𝑚𝑉1 ≠ 0 → 𝜌𝑛𝑚𝑘𝑚 𝑗 < 𝜌𝑥
𝑚𝑘𝑚 𝑗 ,𝑤𝑖𝑙𝑒 𝑟𝑛/𝑥
𝑚𝑉2 ≠ 0 → 𝜌𝑛𝑚𝑘𝑚 𝑗 ≈ 𝜌𝑥
𝑚𝑘𝑚 𝑗. (13)
Hypothesis 3.: Monetary policy have to face with unwanted autonomy under extreme days on
the bond markets – caused by contagions (14):
𝑟𝑛/𝑥𝑚 𝑖 ≠ 0 → 𝜌𝑛
𝑚𝑘𝑚 𝑗 > 𝜌𝑥𝑚𝑘𝑚 𝑗
. (14)

6
3. STRUCTURE OF THE DISSERTATION
The extremity of an event is directly linked to the extremity of a dynamical state of the
underlying system as Jentsch et al. (2006) suggest. The second chapter of the dissertation
describes an alternative model which is capable to provide extreme jumps and collective
behaviors. A market model which allows collective behaviors is more heterogeneous and
hierarchic than it should be according to the efficient market hypothesis. Therefore the null
hypothesis of efficient markets will be tested against the alternative hypothesis of complex
markets.
To model the network structure of one market (n) (15) it is necessary to define the actors (a),
their interactions (c), and the shape of the network (sh):
𝑛(𝑎, 𝑐, 𝑠). (15)
The mainstream model of efficient markets (16) has the following structure:
𝑟𝑛(𝑎𝑟 , 𝑠𝑟 , 𝑠𝑏 ,𝑒−𝑘), (16)
where rn denotes the normal distributed returns, while ar signs the rational actors, shr is
random networks, sb random-walk in the case of time series, as well as he-k is the sign of
market efficiency. The Erdősi-Rényi random networks are capable to model competitive and
efficient markets with dynamic recombination and fast information propagation, but they are
unable to describe preferential connectivity. From statistic view, it involves the requirements
of normal distributed, homoscedastic and not autocorrelated returns.
If extreme returns represent a higher mass than from normal distribution it could be expected,
capital market should be modeled as the dynamic properties of extreme events suggest – as a
complex system (17):
𝑟𝑛/𝑥(𝑎𝑘𝑟 , 𝑠𝑠 , 𝑠𝑎− ,𝑔𝑦 ), (17)
where rn/x denotes shock on capital markets due to the fat-tailed distribution of returns, akr
signs bounded rational actors, shs means scale-free network, sa-h point on autocorrelated and
heteroskedastic time series, as well as hgy denotes the lack of efficiency. Scale-free complex
networks were described by Barabási-Albert (1999), what is able to explain internal
heterogeneity through preferential connections which could be responsible for spontaneous
synchronisations (―large cooperative phenomena‖) or phase transitions. These systems are far
from equilibrium as self-organized criticality (SOC) describes – therefore extreme events are
inherent properties of the system and indicated by power law distribution.
The third chapter of my dissertation describes the applied methodology: the rejection of
market efficiency is followed by the calculation of GARCH-based dynamic conditional
correlation based on the article of Cappiello, Engle and Sheppard (2006). These correlations

7
were analyzed in the light of extreme events to detect interdependence, divergence and
correlations. This chapter summarizes several rejected alternative ways to answer the
hypotheses.
The fourth chapter contains the results of the dissertation. Market efficiency was clearly
rejected, due to the autocorrelation and heteroscedasticity and the lack of normal distribution
in the case of analyzed returns. Returns seemed to be weak (covariant) stationary, what is the
pre requirement for the further analysis. Heteroscedasticity was ruled out by the application of
APARCH(p,o,q) model, as well as kurtosis was reduced too. 3M maturity on the bond
markets seemed to be uncorrelated, while common movement between 10Y maturities
declined from weak/medium correlation to no/weak correlation after 2006. The correlation of
stock markets increased after 2006 – but East-Central European and German markets tended
to move stronger together than with US market. Currencies showed a tight common
movement. Contagion was detected only in the case of Dow Jones Industrial Average from
the stock markets and partially in the case of EUR/USD exchange rate, while divergence
occurred on the 10Y market. These results were analyzed also according to the interest rate
policy of the ECB, as well as the impact of the time-lag on the US market (it showed no bias).
There was a test for alternative detection of contagions: to separate extreme returns trough
probabilities (from 1% to 10%), but the distributions were too different and asymmetric.
4. METHODOLOGY
To prove the existence of contagions it is necessary at first to reject the efficiency of the
selected markets. To meet the efficiency requirements, markets have to look like as the
random walk and Wiener-process describes them – the distribution of returns should be
normal, without autocorrelation, heteroscedasticity and unit root. The rejection of market
efficiency allows us to estimate contagions trough dynamic conditional correlation after ruling
out heteroscedasticity with GARCH-models (Figure 1).
8
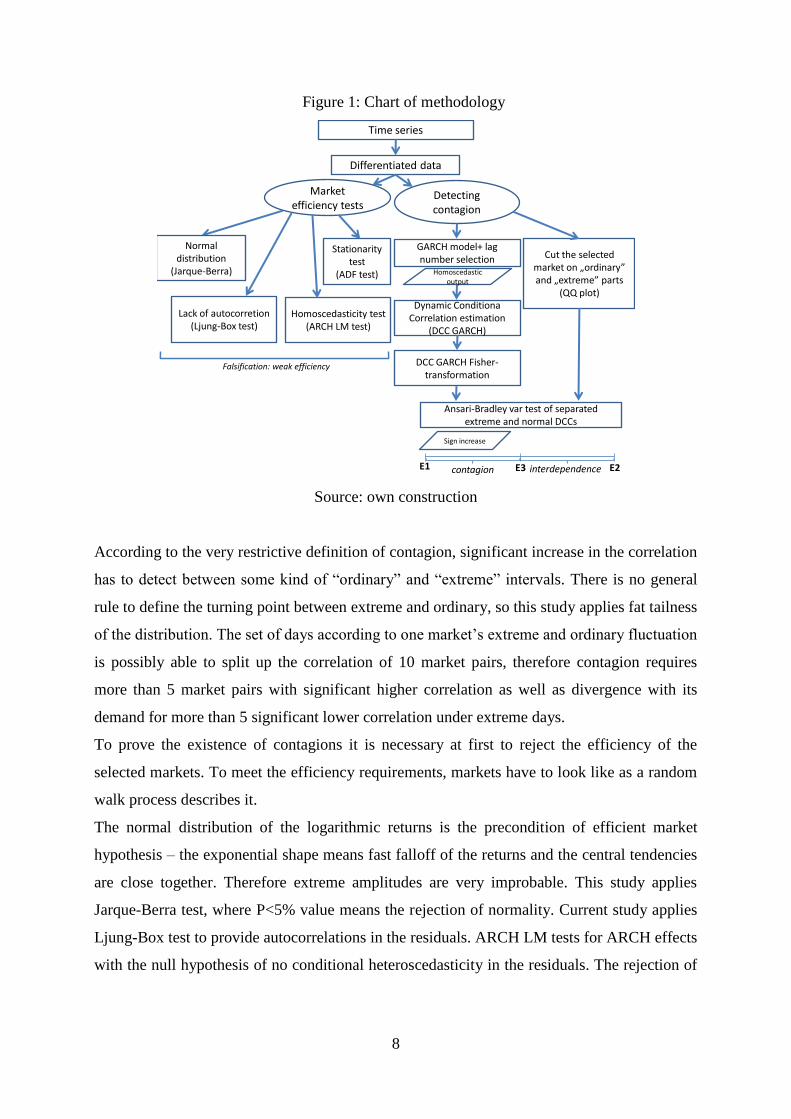
Figure 1: Chart of methodology
Detecting contagion
GARCH model+ lag number selection
Dynamic Conditiona Correlation estimation
(DCC GARCH)
DCC GARCH Fisher-transformation
Cut the selected market on „ordinary” and „extreme” parts
(QQ plot)
Ansari-Bradley var test of separated extreme and normal DCCs
Homoscedastic output
Sign increase
E1 E2E3contagion interdependence
Market efficiency tests
Stationarity test
(ADF test)
Normal distribution
(Jarque-Berra)
Lack of autocorretion (Ljung-Box test)
Homoscedasticity test (ARCH LM test)
Falsification: weak efficiency
Time series
Differentiated data
Source: own construction
According to the very restrictive definition of contagion, significant increase in the correlation
has to detect between some kind of ―ordinary‖ and ―extreme‖ intervals. There is no general
rule to define the turning point between extreme and ordinary, so this study applies fat tailness
of the distribution. The set of days according to one market’s extreme and ordinary fluctuation
is possibly able to split up the correlation of 10 market pairs, therefore contagion requires
more than 5 market pairs with significant higher correlation as well as divergence with its
demand for more than 5 significant lower correlation under extreme days.
To prove the existence of contagions it is necessary at first to reject the efficiency of the
selected markets. To meet the efficiency requirements, markets have to look like as a random
walk process describes it.
The normal distribution of the logarithmic returns is the precondition of efficient market
hypothesis – the exponential shape means fast falloff of the returns and the central tendencies
are close together. Therefore extreme amplitudes are very improbable. This study applies
Jarque-Berra test, where P<5% value means the rejection of normality. Current study applies
Ljung-Box test to provide autocorrelations in the residuals. ARCH LM tests for ARCH effects
with the null hypothesis of no conditional heteroscedasticity in the residuals. The rejection of

9
H0 supports the idea of volatility clustering, which bias could be ruled out by GARCH
models.
Under the assumption of weak market efficiency time series are mostly biased by
autocorrelation and heteroscedasticity due to the fat tails of the return distributions and
volatility clustering. The different versions of Generalized Autoregression and
Heteroscedasticity (GARCH) models are widely used methods to provide homoscedastic
standardized residuals, which is necessary to estimate Engle’s (2002) Dynamic Conditional
Correlation (DCC).
The Asymmetric Power GARCH (APARCH)2 model by Ding, Granger and Engle (1993) is
maybe the most powerful tool to handle the bias of heteroscedasticity due to the asymmetric,
fat-tailed assumptions of the distribution. There parameters of APARCH have to be defined,
―p‖ and ―q‖ determines the lag number of residuals and volatility, while ―o‖ is a non-negative
scalar integer representing the number of asymmetric innovations. Further advantage of the
APARCH model is the flexibility – it is easy to convert both on GJR GARCH and TARCH as
well as the basic GARCH form too. The lag length was optimized on a 1-to-4 scale and
selected according to the estimation’s Akaike Information Criteria (AIC).
Ordinary cross-correlation is not the suitable tool to specify the common movement of
markets due to the heteroscedasticity as Forbes and Rigobon (2002) suggest. Cointegration is
ruled out too, because it is better to analyze long-term processes, so BEKK-GARCH or DCC-
GARCH could be an adequate solution after the APARCH step.
This study applies DCC-GARCH3, to analyze the daily common movements of the selected
markets. Cross market correlation is compared both with Ansari-Bradley and two-sided t-test,
because the variance test is not based on the assumption of normal distribution – as happens
in the case of the widely used t-tests.
The Ansari-Bradley test of the hypothesis that two independent samples, in the vectors x and
y, come from the same distribution, against the alternative that they come from distributions
that have the same median and shape but different variances. The result is h = 0 if the null
hypothesis of identical distributions cannot be rejected at the 5% significance level, or h = 1 if
the null hypothesis can be rejected at the 5% level.
2The estimation based on the UCSD toolbox, developed by Kevin Sheppard:
http://www.kevinsheppard.com/wiki/UCSD_GARCH 3The estimation based on the Oxford MFE toolbox, developed by Kevin Sheppard:
http://www.kevinsheppard.com/wiki/MFE_Toolbox
10
Before the Ansari-Bradley test of significant variance difference of the ordinary and extreme
correlation intervals, it is necessary to run a Fischer-transformation (8) on the computed
correlations as Lukács (1999) suggests:
, (8)
After the identification of market common movements, it is necessary to separate them on the
ground of the hub return’s extremity or normality.
How can we separate the ―extreme‖ and ―ordinary‖? Jentsch et al. (2006) defined extreme
events by their impact and probability – so we have to find a suitable threshold or milestone to
form both groups. There are multiple solutions, see Campbell et al. (2002), but this study
focus on the fatness of tails, therefore it is obvious to cut the empirical distribution with a
fitted theoretical normal distribution on it.
This process was done in Matlab on the base logic of a QQ plot. QQ plots are common tools
of visualizing the normal distribution of the time series with a straight line which represents
the normal distribution and dots of the empirical distribution. Normal distribution of the
empirical data is observable, if dots are fitting on the line, but most financial data has an ―S‖
shape on the QQ plot – suggesting a power-law distribution and fat-tails (Clauset el al., 2007).
Therefore it is reasonable to define the tails trough QQ plot, where the turning point of
extremity is defined as the first empirical data in the lower quartile right from the normality
line on the positive side and left from the normality line on the negative side.
This solution uses the markets as their developments would be the source of the shock or
contagion. Therefore a rank of contagiousness could be defined between three CEE the US
and Euro-zone markets were they could be scored according to the number of correlations
divided into significantly different parts, as well as the extreme correlation should be higher.
The results can be easily visualized on the following way: on the ―x‖ axis lays the rate of
significantly different and non different correlations, while on the ―y‖ axis the number of
correlations are observable, which extreme value is higher than the normal.

11
5. SUMMARY OF THE RESULTS
The theses of current dissertation are summarized in this chapter to evaluate my upper
presented hypotheses. Their acceptance will support the idea of complexity of capital markets,
with bounded actors and nested turbulences and imbalances.
Thesis 1.: Dow Jones Industrial was a capable indicator the detect contagions on East-
Central European capital markets for the entire sample (18):
𝑟𝑛/𝑥
𝑚𝐷𝐽𝐼 ≠ 0 → 𝜌𝑛𝑚𝑘𝑚 𝑗 < 𝜌𝑥
𝑚𝑘𝑚 𝑗. (18)
After rejection of market efficiency and proving the existence of contagions on the
stock market, my opinion is to accept the concept of complex capital markets, based on
Barabási-Albert’s scale-free network, bounded rational agents. Market participants and
central bankers have to focus much more on partner risks and they have to avoid the
(opportunity of the) bankruptcy of the hub-actors, because it would cause the
disintegration of market structure – which means a system-level crisis.
Thesis 2.: Trade relations could be able to cause higher correlations between East-
Central-European and German/Euro-zone markets, and this common movement
increased until the crisis, but only the extreme days of DJI seemed to be capable to
detect contagions (19).
𝑟𝑛/𝑥
𝑚𝐷𝐽𝐼 ≠ 0 → 𝜌𝑛𝑚𝑘𝑚 𝑗 < 𝜌𝑥
𝑚𝑘𝑚 𝑗 ,𝑤𝑖𝑙𝑒 𝑟𝑛/𝑥𝑚𝐷𝐴𝑋 ≠ 0 → 𝜌𝑛
𝑚𝑘𝑚 𝑗 ≈ 𝜌𝑥𝑚𝑘𝑚 𝑗 . (19)
Networks of real economy and capital market are not parallel. Despite centrum-
periphery relations structured on the same way, but common movement increased
generally only under extreme jumps on the main US stock market (involving their time-
lag too).
Thesis 3.: Central bank autonomy increases on an unwanted way under extreme days
(20), therefore daily turbulences of Euro-zone weakens the region’s Euro-apotion’s
implicit guarantee:
𝑟𝑛/𝑥𝑚 𝑖 ≠ 0 → 𝜌𝑛
𝑚𝑘𝑚 𝑗 > 𝜌𝑥𝑚𝑘𝑚 𝑗
. (20)
The divergence of 10 year yields and the sight contagion on the currency market
supports this idea. The free floating currencies presented a strong correlation, which
became much more tight under extreme fall of Euro against USD – causing more
intensive fall in the case of East-Central European currencies. But the reduction of 10Y
yields on the US and Euro-zone market are not followed by the region (due to the
reduced correlation).
12
REFERENCES
Alexander C. 2008: Market Risk Analysis: Practical Financial Econometrics. Wiley
Barabási, A-L. – Albert, R. 1999: Emergence of Scaling in Random Networks. Science, 286,
509
Bearce D. 2002: Monetary Divergence: Domestic Policy Autonomy in the Post-Bretton
Woods Era. University of Michigan Press
Bekaert, G. – Harvey, C. R. – Ng, A. 2005: Market Integration and Contagion. Journal of
Bussiness, 78, 1, 39-69
Benedek, G. – Lublóy, Á. – Szenes, M. 2007: A hálózatelmélet banki alkalmazása.
Közgazdasági Szemle, 54, 682-702
Bonanno, G. – Lillo, F. – Mantegna, R. 2001: Levels of complexity in financial markets.
Physica A, 299, 16-27
Campbell, R. – Koedij, K. – Kofman, P. 2002: Increased Correlation in Bear Markets.
Financial Analysts Journal, 58, 1, 87-94
Cappeiello L. – Engle R. F. – Sheppard K. 2006: Asymmetric Dynamics in the Correlations of
Global Equity and Bond Returns. Journal of Financial Econometrics, 4, 4, 537-572
Chan, N. H. 2002: Time Series Applications to Finance. John Wiley & Sons, Inc.
Clauset, A. – Shalizi, C. R. – Newman, M. E. J. 2009: Power-law distributions in empirical
data. SIAM Review, 51, 4, 661-703
Ding, Z. – Granger, C. W. J. – Engle, R. F. 1993: A Long Memory Property of Stock Market
Returns and a New Model. Journal of Empirical Finance, 1, 83-106
Engle, R. F. 2002: Dynamic Conditional Correlation - A Simple Class of Multivariate
GARCH Models. Journal of Business and Economic Statistics, 20, 3, 377-389
Farkas, B. 2011: The Central and Eastern European model of capitalism. Post-Communist
Economies, 23, 1, 15-34
Forbes, J. K. – Rigobon, R. 2002: No contagion, only interdependence: measuring stock
market comovements. Journal of Finance, 57, 6, 2223-2261
Gabaix X. – Gopikrishnan P. – Plerou V. – Stanley H. E. 2003: A theory of power-law
distributions in financial market fluctuations. Nature 423, 267-270
Jentsch, V. – Kantz, H. – Albeverio, S. 2006: Extereme Events: Magic, Mysteries and
Challenges. In Albeverio, S. – Jentsch, V. – Kantz, H. (eds.): Extreme Events in
Nature and Society. Springer
Kanna, P. – Köhler-Geib, F. 2009: The Uncertainty Channel of Contagion. The World Bank,
Policy Research Working Paper WPS4995
Kantz, H. – Altman, E. G. – Hallerberg, S. – Holstein, D. – Riegert, A. 2006: Dynamical
Interpretation of Extreme Events: Predictability and Predictions. In Albeverio, S. –
Jentsch, V. – Kantz, H. (eds.): Extreme Events in Nature and Society. Springer
Lütkepohl, H. – Kratzig, M. 2004: Applied Time Series Econometrics. Cambridge University
Press
Sornette, D. 2006: Endogenous versus Exogenous Origins of Crises. In Albeverio, S. –
Jentsch, V. – Kantz, H. (eds.): Extreme Events in Nature and Society. Springer
Tsay, R. S. 2005: Analysis of Financial Time Series. John Wiley & Sons, Inc., Hoboken, New
Jersey

13
THE CANDIDATE’S PUBLICATION IN THE SUBJECT OF THE DISSERTATION
A. Books and book chapters
Kiss, G. D. (2011): Market dependency and financial buffers in Russia. In: FARKAS B.
(ed.) Studies in International Economics and Finance. Szeged: JATEPress, pp. 63-80.
ISBN 978-963-315-055-9.
Kiss, G. D. (2010): Impact of Financial Contagion on Pension Portfolio’s Performance in
Hungary and Russia. In: STAVÁREK, D. and VODOVÁ, P. (ed.) Proceedings of 12th
International Conference on Finance and Banking. Karviná: Silesian University,
2010, pp. 98-108. ISBN 978-80-7248-592-5. selected and reviewed proceeding,
Thomson Conference Proceedings Citation Index
Kiss, G. D., Dudás, L. (2010): Analyses of Extreme Events on Emerging Capital Markets. In:
Kovács, P., Szép, K., Katona, T. (eds.): Proceedings of the Challenges for Analysis of
the Economy, the Businesses, and Social Progress International Scientific Conference.
Unidocument, Szeged, ISBN: 978-963-069-558-9, pp. 517-531
Botos K., Kiss, G. D., Dudás L. (2009): Pension portfolio models in Hungary and Russia. In:
Wandy Sulkowskiej (ed.) – Tomasz Michalski (lekt.): Szanse i zagrozenia dla rynków
ubezpieczen w krajach Europy Srodkowej i Wschodniej. Studia i Prace Uniwersytetu
Ekonomicznego w Krakowie. No 7, ISSN: 1899-6205, ISBN: 978-83-7252-462-1, pp.
29-38.
Kiss Gábor Dávid (2009): Hosszú távú stabilitás és az orosz nyugdíjrendszer. In: Botos K.
(szerk): Idősödés és globalizáció - Nemzetközi Pénzügyi Egyensúlytalanság. Tarsoly
Kiadó, Budapest, ISBN: 978-963-9570-31-3, 150-162. oldal
Kiss Gábor Dávid (2009): Az idősödés arcai. In: Botos K. (szerk): Idősödés és globalizáció -
Nemzetközi Pénzügyi Egyensúlytalanság. Tarsoly Kiadó, Budapest, ISBN: 978-963-
9570-31-3, 115-122. oldal
Kiss Gábor Dávid – Felegyi Krisztina – Farkas Gergely (2009): A hazai bankok és a MiFID –
egy 41 bankfiókot vizsgáló kutatás eredményei. In: Hetesi E. – Majó Z. – Lukovics M.
(szerk.): A szolgáltatások világa. JATEPress, Szeged, 419-429. o.
B. Articles in referred journals
Gábor Dávid Kiss – Andreász Kosztopulosz 2012: The Impact of the Crisis on the Monetary
Autonomy of Central and Eastern European Countries. Public Finance Quarterly, vol.
LVII., issue 1., p. 27-51.
Gábor Dávid Kiss (2011): The Impact of Financial Interdependence on the Czech, Hungarian
and Polish Interbank, Stock and Currency Market. International Journal of
Management Cases. vol. 13, issue 3, pp. 555-565 Ebsco
Gábor Tamás – Kiss Gábor Dávid – Kovács Péter (2012): A monetáris sterilizáció
hatékonysága és költségei Kínában. Közgazdasági Szemle, LIX. évf., 2012. február,
164—188. oldal
Kiss Gábor Dávid – Kuba Péter (2009): Diverzifikáció a komplex tőkepiacokon – Az emberi
tényező hatása a tőkepiacok működésére. Hitelintézeti Szemle, VIII. évf., 1. szám,
ISSN: 1588-6883, 25-48. oldal
Kiss Gábor Dávid – Vajda Beáta (2008): A biztonság kockázata - a tőkegarantált befektetési
alapok komplex megközelítése. Hitelintézeti Szemle, VII. évf., 2. szám, ISSN: 1588-
6883, 121-151. oldal
Kiss Gábor Dávid (2009): A kockázati tőkeelemek szerepe a hazai magánnyugdíjalapok
portfoliójában. Jelenkori társadalmi és gazdasági folyamatok, IV. évf., 3-4.szám,
ISSN:1788-7593, 168-173. oldal
C. Conference proceedings

14
Kiss, G. D., Ács, A. 2011. Time value of the money and contagions on the bond markets. In:
POLOUČEK, S. and STAVÁREK, D. (ed.) Lessons Learned from the Financial
Crisis. Proceedings of 13th International Conference on Finance and
Banking. Karviná: Silesian University, School of Business Administration, 2011, pp.
291-304. ISBN 978-80-7248-708-0.peer reviewed
Kiss, G. D., 2010. Tools of Russian Financial Stability. In: Procházka, David (ed.): The 11th
Annual Doctoral Conference of the Faculty of Finance and Accounting, University of
Economics, Prague – Collection of Papers 2010, University of Economics,
Oeconomica Publishing House, Prague, Vol 1, ISBN 978-80-245-1651-9, pp. 17-
16.peer reviewed
Kiss, G. D. 2010. Long-Term Financial Stability in Russia. 6th Annual International Bata
Conference for Ph.D. Students and Young Researchers, 15 April 2010, Zlin, ISBN:
978-80-7318-922-8.
Kiss, G. D. 2010. Venture Capital and Pension System. In: Petr Červinek, Petr Musil
(ed.) New Economic Challenges. Proceedings of 2nd International PhD Students
Conference. Brno: Masaryk University, 2010, pp. 30-34. ISBN: 978-80-210-5111-9
Reviewed
Kiss, G. D., Dudás L. 2009. Analyses of Extreme Events on Emerging Capital
Markets. Challenges for Analysis of the Economy, the Business, and Social Progress.
SZTE GTK, KSH, November 19-21, 2009., Szeged
Kiss, G. D. 2009. Impact of Financial Contagion on Pension Portfolio’s Performance in
Hungary and Russia. In: POLOUČEK, S. and STAVÁREK, D. (ed.) Structural and
Regional Impacts of Financial Crises. Proceedings of 12th International Conference
on Finance and Banking. Karviná: Silesian University, 2009, pp. 278-292. ISBN 978-
80-7248-554-3. reviewed proceeding
Kiss, G. D., Megyeri E., Gábor T., Dudás L. 2009. Convergence and contagion in transitional
countries. In:Regions, Firms and Institutions int he World Economy, Warsaw School
of Economics – University of Tübingen – Heidelberg University – University of
Hohenheim, October 8-9, 2009, Warsaw
Kiss, G. D., Dudás L. 2009. Faces of Ageing and Fundamental Background of Pension
Investments – in East Central Europe, Russia and Scandinavia. In: Procházka, David -
Korda, Jan (ed.): The 10th Annual Doctoral Conference of the Faculty of Finance and
Accounting, University of Economics, Prague – Collection of Papers 2009. Vysoká
škola ekonomická v Praze, Nakladatelství Oeconomica, ISBN 978-80-245-1522-9, pp.
77-86
Kiss, G. D., Felegyi K., Farkas G. (2009): Hungarian Banking System and MiFID - Results of
Mystery Shopping Trips. 5th Annual International Bata Conference for Ph.D. Students
and Young Researchers, 2 April 2009, Zlin, ISBN: 978-80-7318-812-2
Kiss, G. D. (2009): Analysis of Diversification Problems in the Case of Hungarian and
Russian Pension Investements. In: Mgr. Petr Cervinek (ed.): New Economic
Challenges - 1st International PhD Students Conference, Masaryk University -
Faculty of Economics and Administraiton, Mazarykova univerzita, Brno, ISBN 978-
80-210-4815-7, pp. 26-30.
Kiss, G. D. (2009): Analysis of Market Risk in the Case of Potential Hungarian and Russian
Pension Portfolio.XXIII. microCAD International Conference 19-20 March 2009,
Miskolc, ISBN: 978-661-881-0, pp. 121-126.
Kiss, G. D., 2010. Kölcsönös függőség a Visegrádi országok kötvény, részvény és
devizapiacai között – van-e értelme a második pillérnek? In: Andrássy Adél (szerk.):
„Hitel, világ, stádium” Konferencia a Magyar Tudomány Ünnepe alkalmából, NYME
GTK, 2009. november 3., Sopron ISBN: 978-963-9883-73-4

15
Kiss, G. D., 2009. A tőkepiaci hozamok hatványszerű valószínűségi eloszlásának okai Kelet-
közép Európában. In: Andrássy Adél (szerk.): „Gazdaság és Társadalom”
Konferencia a Magyar Tudomány Ünnepe alkalmából, NYME GTK, 2009. november
3., Sopron ISBN: 978-963-9871-30-4
Kiss, G. D. 2009. A kockázati tőkeelemek szerepe a hazai magánnyugdíjalapok
portfoliójában. V. Európai kihívások nemzetközi tudományos konferencia, 2009.
október 7., Szeged
Kiss Gábor Dávid 2008. A tőkefedezeti nyugdíjrendszer és az idősödés folyamata
Magyarországon. In: Kovács Beatrix (szerk.): „Társadalom és Gazdaság – új trendek
és kihívások” Nemzetközi tudományos konferencia kiadványa. EJF MGF GTI, Baja,
2008. szeptember 19. ISBN: 978-963-7290-62-6, 273-278. o.
Kiss Gábor Dávid 2007. Tökéletlen tőkepiacok és idősödés. In Botos K., Katona K.
(szerk): Verseny és vesenyképesség. Szent István Társulat, Budapest, ISBN: 978-963-
361-981-0, 140-148. oldal
D. Working papers, research reports
Kiss Gábor Dávid 2012. A válság hatása a kelet-közép európai országok monetáris politikai
autonómiájára. TÁMOP 4.2.1/B-09/1/KONV-2010-0005 (Az állam gazdasági szerepe
a 2008-as válság tükrében program)
Kiss Gábor Dávid 2011. Válság definiálhatósága tőkepiaci indikátorokban megfigyelhető
extern gyökerű extrém elmozdulások alapján. TÁMOP 4.2.1/B-09/1/KONV-2010-
0005 (Az állam gazdasági szerepe a 2008-as válság tükrében program)
Kovács Péter - Kosztopulosz Andreász - Révész Balázs - Kiss Gábor Dávid - Székelyhidi
Katalin - Tulkán Tímea - Árva-Tóth Adrienn 2011. Középiskolások pénzügyi
kultúrájának felmérése - Összefoglaló tanulmány. TÁMOP-4.2.1/B-09/1/KONV-
2010-0005 program
Udvari Beáta - Kiss Gábor Dávid 2011. Az ázsiai és európai regionális repterek fejlesztési
jellemzői és ezek adaptálhatósága. GOP-1.1.2-07/1-2008-0007 (Multidiszciplináris
kutatás-fejlesztés a DEAK KKK folytatásában)
Kiss Gábor Dávid – Vajda Beáta 2007. A biztonság kockázata, a tőkegarantált befektetési
alapok komplex megközelítése. Országos Tudományos Diákköri Konferencia, 1.
helyezés
Kiss Gábor Dávid 2007. A jóléti állam, mint a társadalmi bizalom optimuma. Országos
Tudományos Diákköri Konferencia, 1. helyezés