defining dimensions in schizotypy: factor structure
TRANSCRIPT

University of Nebraska - LincolnDigitalCommons@University of Nebraska - LincolnTheses, Dissertations, and Student Research:Department of Psychology Psychology, Department of
Winter 12-12-2016
Defining Dimensions In Schizotypy: FactorStructure Replication And External Validation OfThe Schizotypal Personality Questionnaire – BriefRevised Updated (SPQ-BRU).Elaina MontagueUniversity of Nebraska-Lincoln, [email protected]
Follow this and additional works at: http://digitalcommons.unl.edu/psychdiss
Part of the Clinical Psychology Commons
This Article is brought to you for free and open access by the Psychology, Department of at DigitalCommons@University of Nebraska - Lincoln. It hasbeen accepted for inclusion in Theses, Dissertations, and Student Research: Department of Psychology by an authorized administrator ofDigitalCommons@University of Nebraska - Lincoln.
Montague, Elaina, "Defining Dimensions In Schizotypy: Factor Structure Replication And External Validation Of The SchizotypalPersonality Questionnaire – Brief Revised Updated (SPQ-BRU)." (2016). Theses, Dissertations, and Student Research: Department ofPsychology. 90.http://digitalcommons.unl.edu/psychdiss/90

Defining Dimensions in Schizotypy: Factor Structure Replication and
External Validation of the Schizotypal Personality Questionnaire – Brief
Revised Updated (SPQ-BRU).
by
Elaina Montague, M.A.
A Research Proposal
Presented to the Faculty of
The Clinical Psychology Training Program
In Fulfillment of the
Masters-Equivalent Research Project (MERP)
Proposal Requirement
Faculty approvals:
William D. Spaulding, Ph.D. (12/12/16) Rebecca Brock, Ph.D. (12/12/16)
First Reader Second Reader

Running head: DIMENSIONS, SCHIZOTYPY, AND FACTOR STRUCTURE
2
Abstract
Background: Schizotypy is a construct that captures quantitative dimensions of the psychosis
continuum from clinical to non-clinical expressions. The purpose of this study was to determine
the factor structure and criterion validity of a newly revised self-report measure, the Schizotypal
Personality Questionnaire–Brief Revised Updated (SPQ-BRU; Davidson, Hoffman, &
Spaulding, 2016) for predicting later cognitive-perceptual experiences in college undergraduates.
Method: The data analytic sample was comprised of 2,474 undergraduate students (female =
71.9%) attending a university in the Midwest. First, we aimed to identify a model of best fit by
comparing latent measurement models of schizotypy using confirmatory factor analysis (CFA).
Second, we estimated a latent cognitive-perceptual factor from multiple measures collected at a
second time point in a subsample of participants (n = 357). Using structural equation modeling
(SEM), we tested the impact of latent schizotypy on participants’ self-reported cognitive-
perceptual experiences at time 2.
Results: Overall, CFA findings supported a 4-factor model of schizotypy described by Callaway
and colleagues (2013), (χ2 (450) = 2814, p < 0.001, CFI = 0.931, TLI = 0.942, RMSEA = 0.046,
CIRMSEA = 0.044—0.048, SRMR = 0.052). The 4-factor model replicated in the subsample for
aim 2, (χ2 (48) = 111.073, p < 0.001, CFI = 0.961, TLI = 0.947, RMSEA = 0.061, CIRMSEA =
0.046— 0.075, SRMR = 0.041). Consistent with our hypothesis for aim 2, the latent cognitive-
perceptual model had excellent fit of the data (χ2 (1) = 0.002, p = 0.963, CFI = 1.000, TLI =
1.024, RMSEA = 0.000, CIRMSEA = 0.000—0.000, SRMR = 0.000). Lastly, the SEM model for
aim 3 obtained good fit of the data, (χ2 (13) = 33.636, p = 0.0014, CFI = 0.952, TLI = 0.920,
RMSEA = 0.067, CIRMSEA = 0.039—0.095, SRMR = 0.041). This final path model explained
41.4% of variance in time 2 cognitive-perceptual experiences (p < 0.001).
Conclusion: This investigation bolsters a growing body of evidence for the dimensional
approach to psychometrically-defined schizotypy. In addition, this study strengthens support for
the predictive power of schizotypy. Psychometric and methodology issues in the context of the
dimensional approach to schizotypy will be discussed.
Keywords: Schizotypy, Schizophrenia, Psychometrics, Confirmatory Factor Analysis, Structural
Equation Modeling

Running head: DIMENSIONS, SCHIZOTYPY, AND FACTOR STRUCTURE
3
Introduction
Converging Frameworks: Dimensional & Neurodevelopmental
Contemporary research on psychopathology is undergoing a paradigm shift in response to
the questionable validity of the categorical framework for mental illness (Cuthbert & Insel, 2013;
Stefanis et al., 2007). The National Institutes of Mental Health (NIMH) has released a new
strategic aim to move the field towards a dimensional paradigm of psychopathology, known as
the Research Domain Criteria or “RDoC.” A central purpose of this new initiative is to provide
an alternative framework spanning a broader range of behavior from normative to clinically-
significant variations (Cuthbert, 2014). Exploration of a broader array of phenotypes provides
opportunities for early intervention and prevention of mental illness—all of which are key areas
for broader public health impact (Insel, 2014; Insel et al., 2010).
Increasing interest in dimensional approaches reflects a major paradigmatic shift in
schizophrenia research (Cuthbert & Insel, 2010; Morris, Vaidyanathan, & Cuthbert, 2016). In
convergence with this shift is growing agreement within the schizophrenia-spectrum disorders
(SSD) research community regarding the continuous population distribution of psychosis
manifest phenotypes (Barch et al., 2013; Johns & van Os, 2001; van Os, Linscott, Myin-
Germeys, Delespaul, & Krabbendam, 2009). In addition, there is increased recognition that SSD
is a neurodevelopmental disorder with delayed onset (Fatemi & Folsom, 2009; Weinberger &
Levitt, 2011). Although research evidence suggests that gene-environment interactions across the
lifespan underlie the expression of psychosis (van Os, Kenis, & Rutten, 2010; van Os, Rutten, &
Poulton, 2008), little is understood about developmental pathways associated with varying
trajectories in SSD, and about which stages of development and pathogenesis are most
responsive to intervention. Together, dimensional and neurodevelopmental frameworks provide

Running head: DIMENSIONS, SCHIZOTYPY, AND FACTOR STRUCTURE
4
a valuable, unifying paradigm for researchers seeking to understand the developmental and
biopsychosocial complexity of psychosis.
Researchers interested in the neurodevelopmental-dimensional framework have begun to
reexamine the role of schizotypy as a construct that captures the full range of the psychosis
continuum (Barrantes-Vidal, Grant, & Kwapil, 2015). Schizotypy occurs in the general
population at a higher frequency than full-blown schizophrenia (Johns & van Os, 2001) and
interacts with other vulnerabilities to increase cumulative risk for psychosis (Debbané &
Barrantes-Vidal, 2015; Debbané et al., 2015; Debbané & Mohr, 2015). Although schizotypal
traits do not confer risk for psychosis in isolation from other etiological risk factors, evidence
from longitudinal research supports their utility for prediction of later clinical status in adulthood
(Kwapil, Gross, Silvia, & Barrantes-Vidal, 2013; Ruhrmann et al., 2010; van Os et al., 2008).
Furthermore, elevations in schizotypy are well documented in clinical populations with
psychosis and first degree relatives (Barrantes-Vidal et al., 2013; Tarbox & Pogue-Geile, 2011).
These lines of convergent research suggest schizotypal traits may be proximal to the genes
mediating conversion to psychosis.
Psychometrically-Defined Schizotypy
Sample characterization via valid and reliable assessment is critical for bridging the gap
between research and practice in mental health. Reliable and valid measures that apply
psychometric theory may assist in identifying the full range of phenotypes along the
schizophrenia spectrum (Mason, 2015). Unlike neural, behavioral, or biological measures,
psychometric measures are convenient and inexpensive to administer. Such measures may aid in
stratified recruitment research for studies using larger samples or costly research approaches.
Additionally, the dimensional assessment approach permits wider inclusion of behavioral

Running head: DIMENSIONS, SCHIZOTYPY, AND FACTOR STRUCTURE
5
problems and populations (e.g., clinical, first-degree relatives, age-matched controls, subclinical,
controls, etc.). Thus, dimensional assessments are crucial for moving research toward
paradigmatic changes in SSD and broader psychopathology.
Sampling from populations with psychometrically-defined dimensional schizotypy
possesses several methodological advantages over clinical samples that include: (1) reduced
confounds associated with SSD chronicity (e.g., antipsychotic side effects), (2) improved
measurement validity of the psychosis continuum (Stefanis et al., 2004), and (3) greater scientific
convergence with evolving neurodevelopmental-dimensional models of complex
psychopathology as articulated in the RDoC project (Casey, Oliveri, & Insel, 2014).
Psychometrically-defined schizotypy also possesses notable advantages over familial and clinical
approaches that include: (1) convenient, mass screening of individuals from the general
population, (2) relatively non-invasive assessment, (3) inexpensive administration, and (4)
opportunities for multivariate research (Kwapil & Chun, 2015).
To summarize, there is sound justification for the study of dimensional schizotypy and
further development of accompanying psychometric measures. Schizotypy provides a frontier to
study the etiology of SSD as a dimensional sampling frame, and thus its application in research
aligns with broader public health initiatives in schizophrenia research.
Inconsistencies in Past Research
Although several papers seek to study the dimensional nature of schizotypy, there are
several inconsistent practices that occur at different stages of the research process. For instance,
researchers aiming to study dimensional schizotypy select measures that have distributional
assumptions inconsistent with a dimensional approach (Kwapil, Barrantes-Vidal, & Silvia,
2008). Problematic data treatment practices may include invalidating scale assumptions when the

Running head: DIMENSIONS, SCHIZOTYPY, AND FACTOR STRUCTURE
6
measure is already continuous (Grimshaw, Bryson, Atchley, & Humphrey, 2010) or using
mathematical functions that force a continuous distribution on non-normally distributed scales.
An example of the former is the application of data transformations to change the distribution of
scores to meet normality assumptions (Barrantes-Vidal, Lewandowski, & Kwapil, 2010).
In the context of sampling, it is a common practice to dichotomize continuous measures
by grouping participants into “high’ and ‘low’ schizotypy groups. ‘High’ schizotypy can range
from the top 5% (Cohen, Callaway, Mitchell, Larsen, & Strauss, 2016) to the top 25% (Papousek
et al., 2014) of scorers, while ‘low’ schizotypy may vary from the bottom 10% (Chan et al.,
2011) to the bottom 50% (Cohen, Morrison, Brown, & Minor, 2012). The practice of
dichotomizing continuous variables is known to increase Type I error and decrease power
(Maxwell & Delaney, 1993). Differences on scores between categories are assumed to be equal
within category (MacCallum, Zhang, Preacher, & Rucker, 2002).
Lastly, inconsistent use of terminology in past schizotypy research is also apparent.
Specifically, there appears to be conflated use of terminology regarding psychometric factor
structure (e.g., “multidimensional”) and population distribution assumptions in schizotypy
("dimensional" e.g., Fonseca-Pedrero, Paino, Lemos-Giraldez, Sierra-Baigrie, & Muniz, 2011).
A ‘multidimensional’ factor structure refers to a construct that has two or more factors. Factor
structure is not an assumption about the continuity of scores, as latent factors can be categorical
with the appropriate estimator.
Taken together, these practices in research and discourse may explain inconsistent
findings as well as problems with generalization in research on schizotypy to broader SSD. We
propose that future research examining dimensional schizotypy practice unequivocally

Running head: DIMENSIONS, SCHIZOTYPY, AND FACTOR STRUCTURE
7
dimensional assessment, sampling, and data analytic techniques to demonstrate consistency
between theoretical assumptions and methodology.
Taxometric (Discrete) vs. Dimensional (Continuous) Schizotypy
Although the dimensional model of psychopathology is relatively new, dimensional
schizotypy has a rich history in schizophrenia research dating back to debates about its
theoretical structure. Discrepancies primarily stem from divergent theoretical models, each with
their own disciplinary traditions and assumptions (Kwapil & Chun, 2015). Taxometric models of
schizotypy primarily evolved from medicine, which emphasizes diagnostic categorization of
mental illness. In this perspective, schizotypy is regarded as a qualitatively-distinct group from
the general population, best described as Schizotypal Personality Disorder (SPD). Dimensional
models, by contrast, originate from personality psychology and theorize that clinical phenomena
fall along the extreme ends of a continuum in the general population.
The quasi-dimensional theory conceived by Meehl (1962) describes schizotypy as the
manifest phenotype of schizotaxia, a genetically determined sensory-neural integrative deficit,
which is necessary but not sufficient for the development of schizophrenia (Lenzenweger, 2006).
Meehl (1990) hypothesized that the population distribution of schizotypy is categorical in nature,
with approximately 10% of the population possessing schizotypal traits and 10% of schizotypal
individuals later developing schizophrenia (Lenzenweger, 2006). Meehl believed schizotypy
represented subclinical manifestations of schizophrenia, and his supporters argue that schizotypy
is worthy of study in its own right for this reason (Lenzenweger, 2015). Although prior research
has provided some support for Meehl’s taxon, its theoretical and empirical basis has been
challenged by simulation research (Rawlings, Williams, Haslam, & Claridge, 2008).

Running head: DIMENSIONS, SCHIZOTYPY, AND FACTOR STRUCTURE
8
Schizotypy is increasingly understood today as a fully dimensional continuum of
individual differences in personality and behavior (Nelson, Seal, Pantelis, & Phillips, 2013). The
dimensional model proposed by Claridge and Beech (1995) posits that schizotypal traits are
represented in the general population at varying degrees. The etiological theory corresponding
with this model articulates that a combination of genetic, environmental, and individual
characteristics contributes to the heterogeneous expression of schizotypal traits, which range
from adaptive to non-adaptive levels (Claridge et al., 1996).
Dimensional Measures of Schizotypy
Dimensional schizotypy, while heterogeneous, can be detected in the general population
using valid and reliable psychometric measures that assess its multiple dimensions (Davidson et
al., 2016). The Schizotypal Personality Questionnaire (SPQ; Raine, 1991) is the most popular
psychometric method to date (Kwapil & Chun, 2015). The present study will focus on this self-
report measure for three reasons: (1) it provides a continuous measure of schizotypy, (2) it is
relatively brief to administer, and (3) it has strong psychometric properties that make it ideal for
further development and application in treatment and research contexts.
Davidson, Hoffman, and Spaulding (2016) recently published an updated version of the
32-item short form called The Schizotypal Personality Questionnaire-Brief Revised Updated
(SPQ-BRU; Davidson et al., 2016). This update changed the wording of some of the items to
reduce potential method effects of the SPQ-Brief Revised (SPQ-BR; Cohen, Matthews, Najolia,
& Brown, 2010). Much like the original SPQ developed by Raine (1991), the SPQ-BRU assesses
9 features of schizotypy: ideas of reference, social anxiety, magical thinking, unusual
perceptions, eccentric behavior, no close friends, odd speech, constricted affect, and
Running head: DIMENSIONS, SCHIZOTYPY, AND FACTOR STRUCTURE
9
suspiciousness. Although Raine developed the SPQ based on diagnostic criteria, the measure has
been revised to capture the dimensional nature of psychosis (van Os & Reininghaus, 2016)
Factor Structure of Schizotypy
Measurement models of dimensional schizotypy vary due to theoretical and sample
differences, as well as divergent measurement and analytic approaches (Fonseca-Pedrero et al.,
2011; Nelson et al., 2013). Although earlier investigations proposed unidimensional and 2-factor
models, more contemporary research favors models with 3 or 4 factors (Barrantes-Vidal et al.,
2015; Cicero, 2016; Davidson et al., 2016; Raine et al., 1994).
2- and 3-Factor Models
Raine and colleagues (1994) were among the first to test a higher-order structure of the
SPQ. Out of five models tested, the three-factor solution consisting of cognitive-perceptual,
interpersonal, and disorganized had the best fit of the data across undergraduate and community
samples. This three-factor solution, which consists of cognitive-perceptual and interpersonal
schizotypy, had better fit than a positive-negative 2-factor model proposed earlier by Kendler et
al. (1991). The 3-factor solution allows the “paranoid” (suspiciousness) subscale to cross-load
onto the interpersonal and cognitive-perceptual factors. This model differs from Kendler et al.
(1991) in that anxiety loads distinctly onto the interpersonal factor.
4-Factor “Paranoid” Model
Stefanis et al. (2004) later compared 13 models using the SPQ. These researchers
hypothesized that a 4-factor “Paranoid” model modified from Bergman et al. (1996) would yield
the best fit of the data in a large, all-male military sample. The 4-factor Paranoid model of
schizotypy consists of cognitive perceptual, paranoid, negative, and disorganized factors. This
model allows social anxiety and paranoid ideation (suspiciousness) to cross-load onto paranoid

Running head: DIMENSIONS, SCHIZOTYPY, AND FACTOR STRUCTURE
10
and negative factors. Consistent with their hypotheses, the 4-factor Paranoid model yielded good
fit of the data and had superior fit over competing models including the 3-factor model in
random subsamples of data.
Wuthrich and Bates (2006) tested the factor structure of the SPQ in an Australian student
sample with a wide age range (17 to 60 years). This includes two different 2-factor models
(Kendler et al., 1991; Siever & Gunderson, 1983), three different 3-factor models (Battaglia,
Cavallini, Macciardi, & Bellodi, 1997; Bergman et al., 1996; Raine et al., 1994), and the 4-factor
Paranoid model. Although the 4-factor paranoid model initially provided good fit of the data, the
authors re-specified Raine’s 3-factor model. Compton, Goulding, Bakeman, and McClure-Tone
(2009a) later replicated the superiority the 4-factor Paranoid model in a smaller undergraduate
student sample. Model fit indices for this model were more robust when compared to the nine
other single- and higher-order models.
4-Factor Standard Model
Callaway, Cohen, Matthews, and Dinzeo (2014) later confirmed a 4-factor structure of
the SPQ-Brief Revised consisting of social anxiety, no close friends/constrained affect,
cognitive-perceptual, and disorganized. Although the 3- and 4-factor solutions examined had
nearly equivalent goodness-of-fit indices, the BIC fit statistics and deviance test statistics
indicated that the 4-factor solution ultimately improved model fit of the data. This 4-factor model
was recently replicated by Davidson et al. (2016), with the exception that the “no close
friends/constrained affect” factor was estimated as the latent factor called “interpersonal.”
Neither of these more recent studies tested the fit of the 4-factor Paranoid Model
identified by Stefanis and colleagues, which had robust goodness-of-fit indices later replicated

Running head: DIMENSIONS, SCHIZOTYPY, AND FACTOR STRUCTURE
11
by Compton et al. (2009a). Furthermore, although the 4-factor Paranoid model has robust global
fit indices, its substandard local (component) fit has not been addressed to date.
The Present Study
Three primary aims guided this investigation. The first aim was to estimate and
statistically compare competing lower- and higher-order models of latent schizotypy discussed in
the prior literature. Overall, we hypothesized that 4-factor models will fit the data better over the
unidimensional, 2-factor, and 3-factor models of schizotypy. Whether or not the 4-factor
(Callaway et al., 2014) or Paranoid (Stefanis et al., 2004) model best reflects the latent construct
of schizotypy is a question that remains to be empirically examined. Based on prior literature, we
expected that the 4-factor model identified by Callaway et al. (2014) would have superior
component fit in comparison to the 4-factor Paranoid model.
The second aim was to test the model fit of a hypothesized cognitive-perceptual model
comprised of multiple measures collected at a second time point. Our three candidate measures
for the latent cognitive-perceptual measurement model were selected a priori based off
converging lines of evidence in the psychoses-spectrum literature. We hypothesized that this 4-
factor model consisting of magical ideation, conspiracy beliefs, and maladaptive daydreaming
would fit the time 2 data well. In addition, we hypothesized that the model of best fit from aim 1
would replicate in this subsample.
The third aim was to examine the criterion validity of the hypothesized multidimensional
model from aim 1 in explaining time 2 cognitive-perceptual experiences using structural
equation modeling (SEM). We hypothesized that our CFA derived solution would explain a
significant proportion of variance in later cognitive-perceptual experiences. It was expected that
all the factors of the SPQ-BRU would be associated with time 2 cognitive-perceptual

Running head: DIMENSIONS, SCHIZOTYPY, AND FACTOR STRUCTURE
12
experiences, but the cognitive-perceptual factor would explain most of the variance in that model
compared to the other schizotypy factors.
Model Specification
Aim 1 (Latent Schizotypy CFA)
To meet the first aim of this study, we adopted a model specification approach similar to
Compton et al. (2009a). First, a single factor model was fit using all nine sub-factors of the SPQ-
BRU. This unidimensional model (Model 1) provided the baseline model and was compared
with higher-order models. Next, we evaluated the fit of a 2-factor model (Model 2) consisting of
positive and negative schizotypy (see Compton et al., 2009a). Following this, we estimated a 3-
factor model (Model 3) containing positive, negative, and disorganized schizotypy (Raine et al.,
1994). Then we assessed the fit of a 4-factor solution (Model 4) identified by Callaway et al.
(2014), which includes positive, negative, disorganized, and social anxiety factors. Finally, we fit
the “Paranoid” model (Model 5) identified by Stefanis et al. (2004). This model is a non-standard
CFA solution and its complex indicators (social anxiety and paranoid/suspiciousness) cross-load
onto multiple factors (paranoid and negative).
Aim 2 (Cognitive-Perceptual CFA)
To meet the second aim, we fit a latent cognitive-perceptual model with four observed
indicators using candidate measures selected a-priori. Of the measures selected, the Magical
Ideation Scale (MIS; Eckblad & Chapman, 1983) is the most familiar to schizotypy research.
The MIS assesses personal beliefs or experiences associated with clairvoyance, telepathy,
superstition, and other supernatural experiences. The MIS is commonly associated with
fantastical and paranormal beliefs (Hergovich, Schott, & Arendasy, 2008). Like the MIS, the
Generic Conspiracist Beliefs (GCB; Brotherton, French, & Pickering, 2013) scale measures

Running head: DIMENSIONS, SCHIZOTYPY, AND FACTOR STRUCTURE
13
endorsement of improbable or unsubstantiated beliefs. Specifically, the GCB measures the
degree to which one holds prominent conspiracy theories across various contexts. Both the MIS
and GCB conceptually overlap with the magical thinking, ideas of reference, and suspiciousness
subscales of the SPQ-BRU. Only two of subscales on the GCB were selected for the time 2
cognitive-perceptual model due to their convergence with prior research literature in SSD:
extraterrestrial cover-ups and government malfeasance (Swami, Pietschnig, Stieger, & Voracek,
2011). We added a covariance between the residuals of these two indicators because both were
subscales on the same measure and expected to be correlated. In addition to cognitive aspects of
functioning, we used a relatively new measure called the Maladaptive Daydreaming Scale
(MDS; Somer, Lehrfeld, Bigelsen, & Jopp, 2016), which assesses impairment and distress
associated with daydreaming. We selected this measure due to its ability to provide an indirect
measure of unusual perceptions.
Aim 3 (Full Path Model)
To meet the third aim, we fit a path model loading the CFA solution of latent schizotypy
onto time 2 cognitive-perceptual experiences. We first fit each measurement model individually
and assessed model fit of the data. Then we fit the full path model and assessed its fit of the data.
Implications
If the hypothesized 4-factor Callaway et al. (2014) model is supported over single and
lower-order models, this would first suggest that traditional “positive” domains of schizotypy
generally reflect correlated, but ultimately distinct factors. If the hypothesized latent schizotypy
model explains a significant proportion of variance in time 2 cognitive-perceptual experiences,
then this would support the potential criterion and predictive validity of the 4-factor model.
Method
Running head: DIMENSIONS, SCHIZOTYPY, AND FACTOR STRUCTURE
14
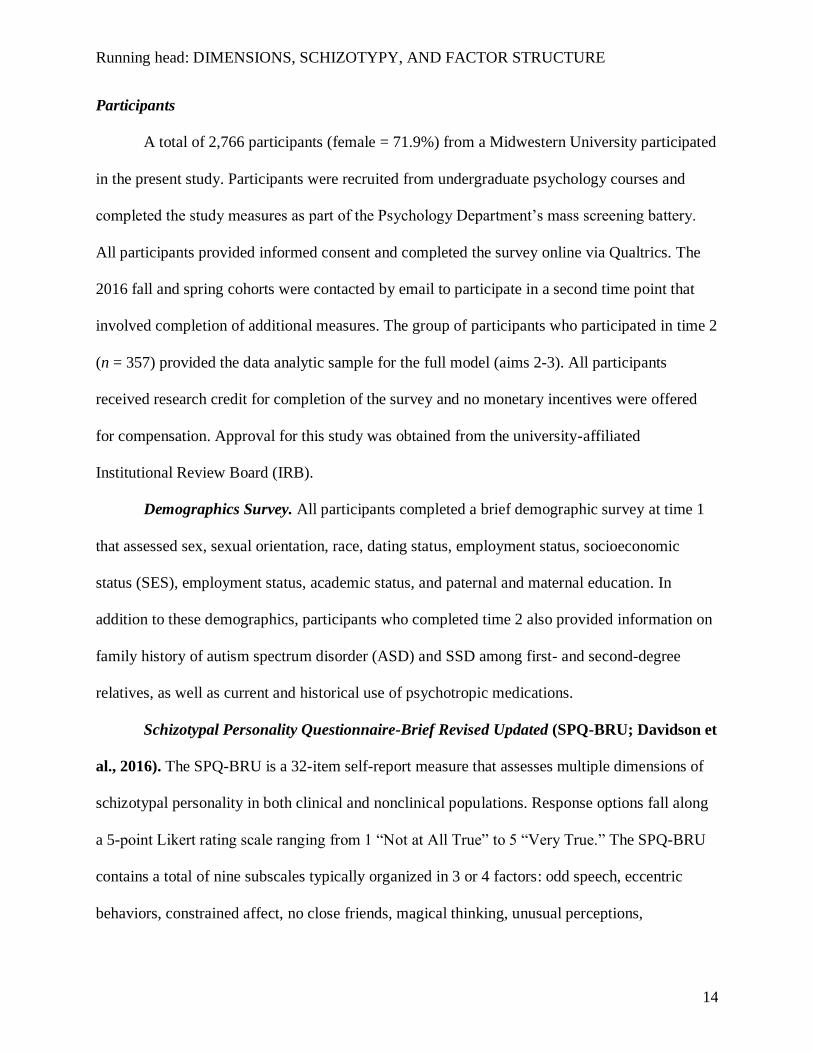
Participants
A total of 2,766 participants (female = 71.9%) from a Midwestern University participated
in the present study. Participants were recruited from undergraduate psychology courses and
completed the study measures as part of the Psychology Department’s mass screening battery.
All participants provided informed consent and completed the survey online via Qualtrics. The
2016 fall and spring cohorts were contacted by email to participate in a second time point that
involved completion of additional measures. The group of participants who participated in time 2
(n = 357) provided the data analytic sample for the full model (aims 2-3). All participants
received research credit for completion of the survey and no monetary incentives were offered
for compensation. Approval for this study was obtained from the university-affiliated
Institutional Review Board (IRB).
Demographics Survey. All participants completed a brief demographic survey at time 1
that assessed sex, sexual orientation, race, dating status, employment status, socioeconomic
status (SES), employment status, academic status, and paternal and maternal education. In
addition to these demographics, participants who completed time 2 also provided information on
family history of autism spectrum disorder (ASD) and SSD among first- and second-degree
relatives, as well as current and historical use of psychotropic medications.
Schizotypal Personality Questionnaire-Brief Revised Updated (SPQ-BRU; Davidson et
al., 2016). The SPQ-BRU is a 32-item self-report measure that assesses multiple dimensions of
schizotypal personality in both clinical and nonclinical populations. Response options fall along
a 5-point Likert rating scale ranging from 1 “Not at All True” to 5 “Very True.” The SPQ-BRU
contains a total of nine subscales typically organized in 3 or 4 factors: odd speech, eccentric
behaviors, constrained affect, no close friends, magical thinking, unusual perceptions,
Running head: DIMENSIONS, SCHIZOTYPY, AND FACTOR STRUCTURE
15
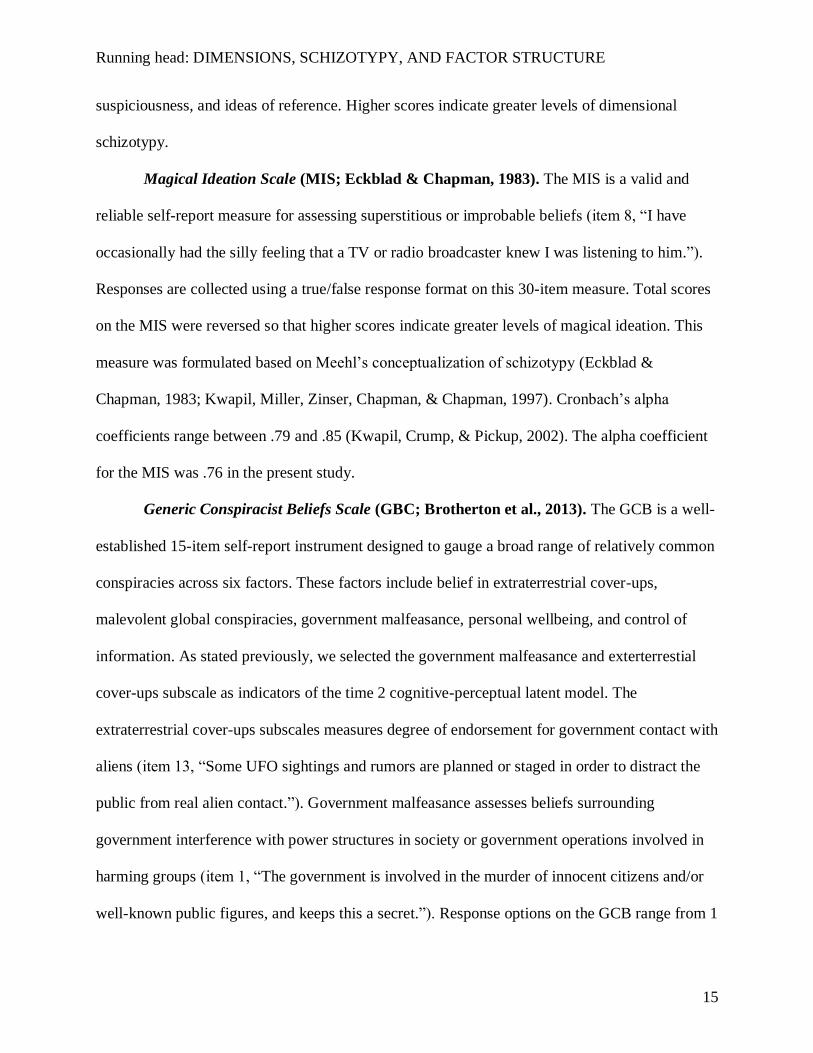
suspiciousness, and ideas of reference. Higher scores indicate greater levels of dimensional
schizotypy.
Magical Ideation Scale (MIS; Eckblad & Chapman, 1983). The MIS is a valid and
reliable self-report measure for assessing superstitious or improbable beliefs (item 8, “I have
occasionally had the silly feeling that a TV or radio broadcaster knew I was listening to him.”).
Responses are collected using a true/false response format on this 30-item measure. Total scores
on the MIS were reversed so that higher scores indicate greater levels of magical ideation. This
measure was formulated based on Meehl’s conceptualization of schizotypy (Eckblad &
Chapman, 1983; Kwapil, Miller, Zinser, Chapman, & Chapman, 1997). Cronbach’s alpha
coefficients range between .79 and .85 (Kwapil, Crump, & Pickup, 2002). The alpha coefficient
for the MIS was .76 in the present study.
Generic Conspiracist Beliefs Scale (GBC; Brotherton et al., 2013). The GCB is a well-
established 15-item self-report instrument designed to gauge a broad range of relatively common
conspiracies across six factors. These factors include belief in extraterrestrial cover-ups,
malevolent global conspiracies, government malfeasance, personal wellbeing, and control of
information. As stated previously, we selected the government malfeasance and exterterrestial
cover-ups subscale as indicators of the time 2 cognitive-perceptual latent model. The
extraterrestrial cover-ups subscales measures degree of endorsement for government contact with
aliens (item 13, “Some UFO sightings and rumors are planned or staged in order to distract the
public from real alien contact.”). Government malfeasance assesses beliefs surrounding
government interference with power structures in society or government operations involved in
harming groups (item 1, “The government is involved in the murder of innocent citizens and/or
well-known public figures, and keeps this a secret.”). Response options on the GCB range from 1
Running head: DIMENSIONS, SCHIZOTYPY, AND FACTOR STRUCTURE
16
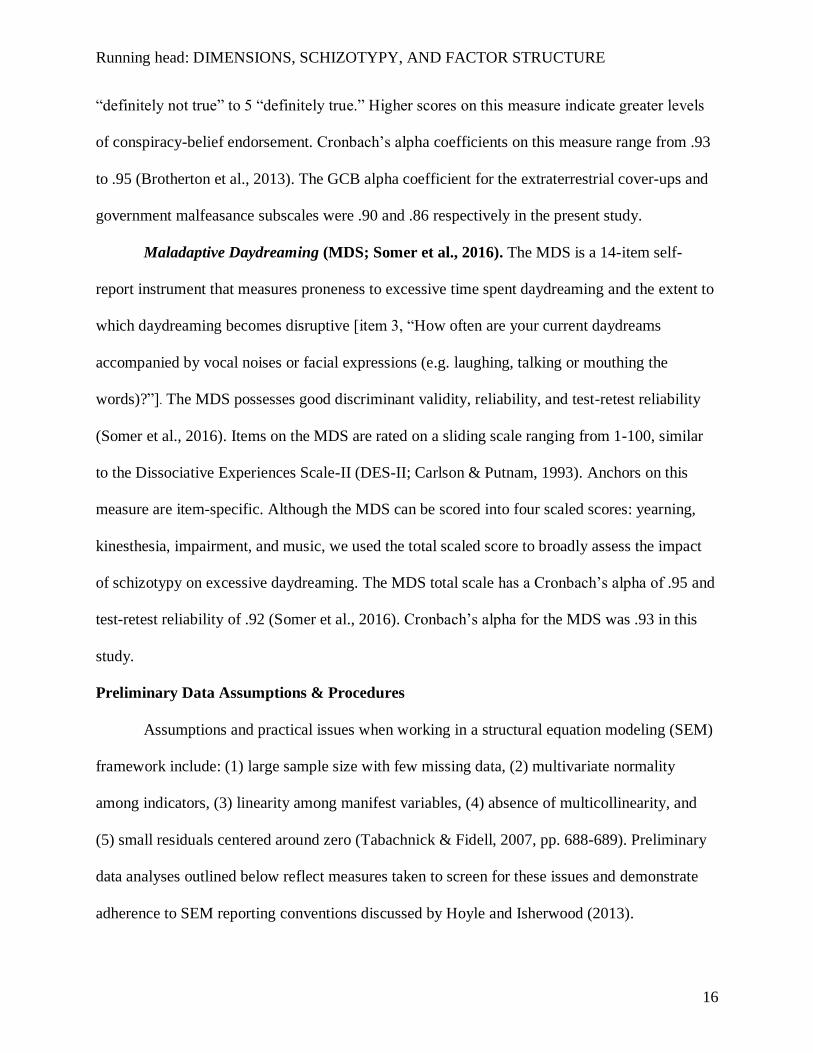
“definitely not true” to 5 “definitely true.” Higher scores on this measure indicate greater levels
of conspiracy-belief endorsement. Cronbach’s alpha coefficients on this measure range from .93
to .95 (Brotherton et al., 2013). The GCB alpha coefficient for the extraterrestrial cover-ups and
government malfeasance subscales were .90 and .86 respectively in the present study.
Maladaptive Daydreaming (MDS; Somer et al., 2016). The MDS is a 14-item self-
report instrument that measures proneness to excessive time spent daydreaming and the extent to
which daydreaming becomes disruptive [item 3, “How often are your current daydreams
accompanied by vocal noises or facial expressions (e.g. laughing, talking or mouthing the
words)?”]. The MDS possesses good discriminant validity, reliability, and test-retest reliability
(Somer et al., 2016). Items on the MDS are rated on a sliding scale ranging from 1-100, similar
to the Dissociative Experiences Scale-II (DES-II; Carlson & Putnam, 1993). Anchors on this
measure are item-specific. Although the MDS can be scored into four scaled scores: yearning,
kinesthesia, impairment, and music, we used the total scaled score to broadly assess the impact
of schizotypy on excessive daydreaming. The MDS total scale has a Cronbach’s alpha of .95 and
test-retest reliability of .92 (Somer et al., 2016). Cronbach’s alpha for the MDS was .93 in this
study.
Preliminary Data Assumptions & Procedures
Assumptions and practical issues when working in a structural equation modeling (SEM)
framework include: (1) large sample size with few missing data, (2) multivariate normality
among indicators, (3) linearity among manifest variables, (4) absence of multicollinearity, and
(5) small residuals centered around zero (Tabachnick & Fidell, 2007, pp. 688-689). Preliminary
data analyses outlined below reflect measures taken to screen for these issues and demonstrate
adherence to SEM reporting conventions discussed by Hoyle and Isherwood (2013).

Running head: DIMENSIONS, SCHIZOTYPY, AND FACTOR STRUCTURE
17
All manually entered data were checked for data entry errors and outliers (Tabachnick &
Fidell, 2007, p. 73). Descriptive analyses and summed scaled distributions were conducted to
examine sample characteristics, skewness, and kurtosis. Reference values were defined by an
absolute skew value larger than 3 or an absolute kurtosis value larger than 7 for determining non-
normality. Due to the large sample size, we plotted histograms for each subscale and factor scale
along with a normal distribution to visually screen the data. Differences in sample characteristics
and mean differences across samples were assessed using Pearson's chi-square test. Bivariate
correlations among the study variables were examined.
Model Estimation
CFA and path analyses were conducted with Mplus software (Version 7.4; Muthén &
Muthén, 2012) using Maximum Likelihood estimation with robust standard errors (MLR). The
standard errors in MLR, unlike those in regular ML, adjust for non-normality (Bentler &
Dijkstra, 1985). The latent variable for each model was standardized by setting the variance of
the latent variable to 1 in Mplus.
Assessment of Model Fit
The Model Chi-Square (𝜒2) test statistic and four other standard goodness-of-fit indices
were selected a priori based on recommendations from Kline (2015) and Brown (2015) for
model fit evaluation: (1) the Steiger-Lind Root Mean Square Error of Approximation (RMSEA;
Steiger, 1990) and its 90% confidence interval, (2) the Standardized Root Mean Square Residual
(SRMR), (3) the Tucker-Lewis Index (TLI; Tucker & Lewis, 1973), and (4) the Bentler
Comparative Fit Index (CFI; Bentler, 1990).
The Model 𝜒2 test is an absolute goodness-of-fit index that evaluates model fit. A non-
significant Model 𝜒2 result indicates good model fit (p > 0.05; indicates good fit). It is important
Running head: DIMENSIONS, SCHIZOTYPY, AND FACTOR STRUCTURE
18
to note that the Model 𝜒2 is sensitive to sample size and tends toward rejecting the null in studies
using large samples (Kline, 2015, pp. 271). We expect all Model 𝜒2 results to be significant
given the large sample size in the present study. Furthermore, the Model 𝜒2 can be affected by
non-normal data distributions, correlation magnitude, and unique variance (Kline, 2015).
The RMSEA can be thought of as a “badness-of-fit” indicator (Kline, 2015, p. 273) and it
provides a correction for model parsimony (RMSEA ≤ 0.10 indicates good fit; MacCallum,
Browne, & Sugawara, 1996). The RMSEA is reported along with its 90% confidence interval
(90% CI), which is sensitive to sample size and model complexity (Brown, 2015). The SRMR is
another “badness-of-fit” index that assesses the mean absolute correlation among the residuals
(SRMR ≤ 0.05 indicates good fit; Browne, Cudeck, Bollen, & Long, 1993). Perfect model fit for
RMSEA and SRMR is indicated by a value of 0, with lower scores indicating better model fit
(Kline, 2015). The TLI (also known as the Bentler-Bonett Nonnormed Fit Index, BBNFI; Bentler
& Bonett, 1980) is a relative fit index that tests discrepancy between the hypothesized and null
𝜒2 value (Brown, 2015). Lastly, the CFI analyzes goodness-of-fit and adjusts for sample size.
Larger TLI and CFI values close to 1 are indicative of good model fit (TLI ≥ 0.95; CFI ≥ 0.90
indicates good fit; Bentler, 1990) and values range between 0 and 1.0 (Hu & Bentler, 1999).
In addition to the above global fit indices, the Akaike information criterion (AIC) and
Bayesian information criterion (BIC) were selected a priori to assess which of the models tested
was the most parsimonious, with the preferred model having lower AIC/BIC values. Component
(local) fit was assessed by examining the standardized and unstandardized parameter estimates.
Standardized factor loadings greater than or equal to .30 were interpreted as salient indicators for
each measurement model (Brown, 2015, p. 27)
Results
Running head: DIMENSIONS, SCHIZOTYPY, AND FACTOR STRUCTURE
19
Missing Data & Exclusions
First, we computed an accuracy score for the validity items by calculating the proportion
of correct items obtained over total number of items for each individual. A total of 286 responses
were excluded (percent excluded = 10%) from the 2,766 original responses due to performance
on the validity items (accuracy < 80%). Then, missing data were screened using IBM SPSS
DESCRIPTIVES. One case was found to have significant missing data on all demographic
variables and was removed. Following exclusions, SPSS version 21.0 (IBM Corp., 2012) was
used to create a new file containing the data. For each aim, the MLR estimator was used to
address any missing data in Mplus (Enders, 2010). Five additional participants were missing
scores on all study variables and thus excluded from the analysis in Mplus.
The final data analytic sample was a total of 2,474 participants for aim 1 and 357
participants for aims 2 and 3. The sample size and ratio of variables to cases was adequate for
conducting SEM for each of the study aims (Brown, 2015).
Aim 1 Descriptive Statistics
Table 1 displays the univariate higher-order moment descriptive statistics for aim 1. As
indicated, missing data across the SPQ-BRU was generally low and percentage of missing
responses ranged from 0.3 to 3.7 percent.
______________________________________________________________
Insert Table 1.
______________________________________________________________
______________________________________________________________
Insert Figure 1.
______________________________________________________________

Running head: DIMENSIONS, SCHIZOTYPY, AND FACTOR STRUCTURE
20
Aim 1 Normality of Sample Distribution
Normality was assessed using IBM SPSS DESCRIPTIVES and by examining the
histograms. Consistent with assumptions regarding the continuity of schizotypy in the population
(Johns & van Os, 2001), the plot of the SPQ-BRU total scores followed a normal distribution
(Figure 1). All variables of interest fell within an acceptable range for skewness and kurtosis
(Table 1). Parameter estimates are the same in ML and MLR (Enders, 2010), so MLR was used
to account for undetected non-normality due to large sample size.
______________________________________________________________
Insert Table 2.
______________________________________________________________
Aim 1 Sample Characteristics
Table 2 provides the characteristics of the final data analytic sample, split by each
semester on self-reported sex, socioeconomic status (SES), employment status, academic status,
and paternal and maternal education. Overall, the sample was comprised of middle class female
college freshmen. Participants did not differ between the four semesters on key demographic
variables of interest, including race, [χ(15) = 23.165, p = 0.081], SES, [χ(9) = 11.105, p = .296],
dating status, [χ(2) = 0.760, p = .684], employment status, [χ(15) = 18.424, p = .241], political
affiliation, [χ(9) = 15.343, p = .082], paternal education, [χ(15) = 17.740, p = .277], and maternal
education, [χ(15) = 18.424, p = .241]. There were, however, significant differences across
semesters on sex, [χ(3) = 19.312, p <.001], and sexual orientation, [χ(9) = 20.042, p = .018].

Running head: DIMENSIONS, SCHIZOTYPY, AND FACTOR STRUCTURE
21
______________________________________________________________
Insert Table 3.
______________________________________________________________
Aim 1 Scale Reliability
Cronbach's alpha (α) coefficients for the SPQ-BRU factors and subscales are reported in
Table 3 based off the 4-factor scoring reported by Davidson et al. (2016). Among the 4-factors
and total scale score, reliability coefficients ranged from good to excellent. At the subscale level,
reliability coefficients ranged from questionable to good. The only subscale that fell within the
questionable range was Constrained Affect. Because this subscale is comprised of only three
items, the average inter-item correlation may be more appropriate for assessing its reliability
(Clark & Watson, 1995). Average inter-item correlations that fall below .15 are considered
weakly interrelated and suggest that the items are not suitable for measuring a single construct.
The average inter-item correlation for Constrained Affect was .392, suggesting the items are
sufficiently related.
______________________________________________________________
Insert Table 4.
______________________________________________________________
Aim 1 Bivariate Correlations
Table 4 displays bivariate correlations obtained from Mplus among the factor scales for
the SPQ-BRU using the same scoring procedures described above. Indicators of the

Running head: DIMENSIONS, SCHIZOTYPY, AND FACTOR STRUCTURE
22
hypothesized latent model of schizotypy were significantly correlated in the expected directions
(i.e., all positive associations).
______________________________________________________________
Insert Table 5.
______________________________________________________________
Aim 1 Goodness-of-Fit
The CFA goodness-of-fit indices of the five models proposed are shown in Table 5. As
expected, Model 𝜒2 test statistic was significant for all models due to large sample size. All
models met a priori criteria the CFI and RMSEA fit indices. None of the models met a priori
criteria for the TLI and only one model (Model 5) met criteria for the SRMR. When considering
both local and global fit, the hypothesized model (Model 4) provided an improvement over the
preceding model.
______________________________________________________________
Insert Figure 2a.
______________________________________________________________
______________________________________________________________
Insert Figure 2b.
______________________________________________________________

Running head: DIMENSIONS, SCHIZOTYPY, AND FACTOR STRUCTURE
23
______________________________________________________________
Table 6.
______________________________________________________________
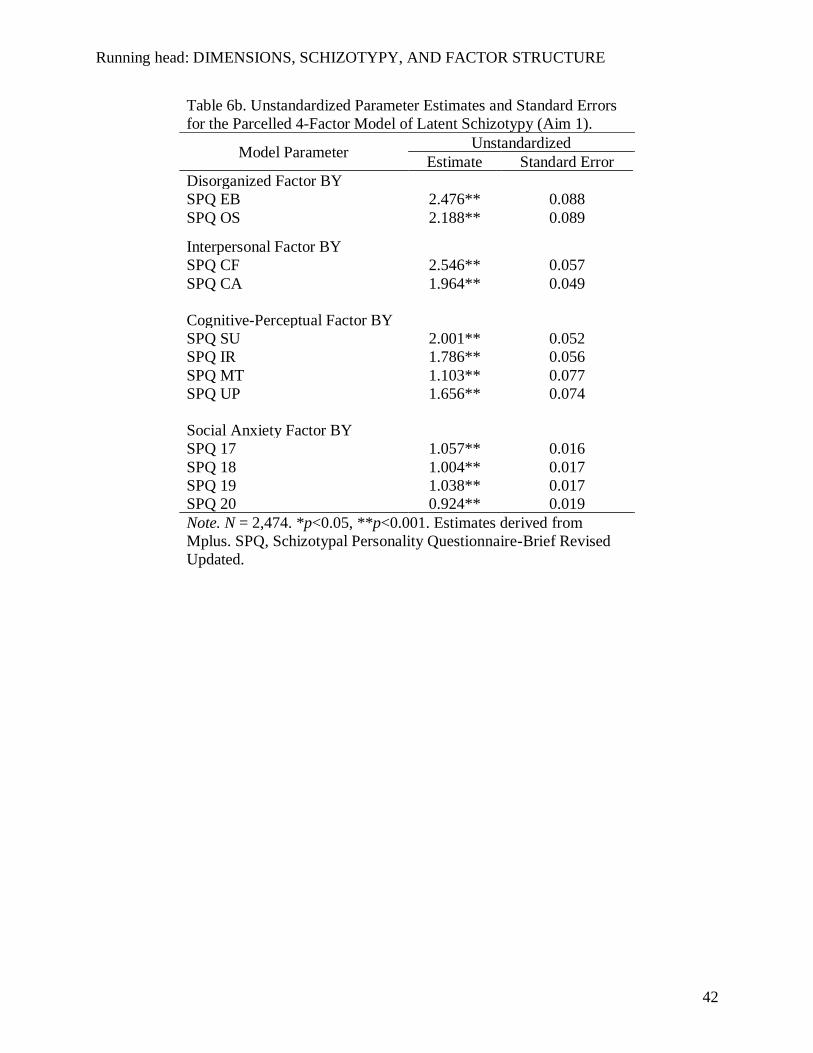
Figures 2a and 2b display standardized factor loadings for Model 4. As indicated, factor
loading estimates were all above .30 in both the full and parceled models (all p < 0.001). Table
6a contains the unstandardized parameter estimates and standard errors for the full model and
Table 6b contains the unstandardized parameter estimates for the parceled model.
______________________________________________________________
Table 7.
______________________________________________________________
Aim 2 Scale & Sample Characteristics
A total of 357 individuals (percent female = 68.0) participated in time 2. Demographic
characteristics of the aim 2 sample are presented in Table 7. Like the larger sample, the majority
of participants were college freshman from a middle-class background. Participants in this
subsample did not differ between semesters on key demographic variables of interest, including:
race, [χ(6) = 12.268, p = 0.056], sex, [χ(1) = 2.836, p = .092], dating status, [χ(1) = 0.001, p =
.997], paternal education, [χ(8) = 7.464, p = .488], and maternal education, [χ(8) = 4.442, p =
.815].
In addition, participants did not differ between semesters on clinical-historical variables,
including ASD history in first-degree relatives, [χ(2) = 2.654, p = .265], ASD history in second-
degree relatives, [χ(2) = 0.690, p = .966], SSD in first degree relatives, [χ(2) = 4.466, p = .107]

Running head: DIMENSIONS, SCHIZOTYPY, AND FACTOR STRUCTURE
24
and SSD in second degree relatives, [χ(2) = 0.524, p = .770], current use of psychotropic
medication, [χ(1) = 0.354, p = .552], and history of psychotropic medication use, [χ(2) = 0.901, p
= .637].
______________________________________________________________
Table 8.
______________________________________________________________
Table 8 displays the univariate higher-order moment descriptive statistics for aim 2.
Percent of missing responses for each measure ranged from 0 to 2.0. Normality characteristics
also fell within acceptable ranges for skewness and kurtosis for all scales.
______________________________________________________________
Table 9.
______________________________________________________________
Aim 2 Bivariate Correlations
Table 9 displays the bivariate correlations among the indicators for the time 2 cognitive-
perceptual latent model (magical ideation, maladaptive daydreaming, and magical ideation)
along with the SPQ-BRU. Indicators of the hypothesized latent cognitive-perceptual model were
significantly correlated in the expected directions (i.e., all positive associations). In addition, the
SPQ-BRU factor scales all correlated with time 2 cognitive-perceptual indicators in the expected
direction.
Aim 2 Goodness-of-Fit

Running head: DIMENSIONS, SCHIZOTYPY, AND FACTOR STRUCTURE
25
For aim 2, we first sought to replicate the 4-factor Callaway model of schizotypy in the
subsample of participants. The 4-factor model replicated in the subsample for aim 2, (χ2 (48) =
111.073, p < 0.001, CFI = 0.961, TLI = 0.947, RMSEA = 0.061, CIRMSEA = 0.046— 0.075,
SRMR = 0.041). In addition to replicating aim 1, we also tested the fit of a latent cognitive-
perceptual model in this subsample. The hypothesized latent cognitive-perceptual model yielded
excellent global and local fit of the data. Consistent with our hypothesis, this model met a priori
criteria each of the global fit indices (χ2 (1) = 0.002, p = 0.963, CFI = 1.000, TLI = 1.024,
RMSEA = 0.000, CIRMSEA = 0.000—0.000, SRMR = 0.000). Figure 4 displays the hypothesized
model along with the standardized factor loadings. All standardized factor loadings exceeded .30
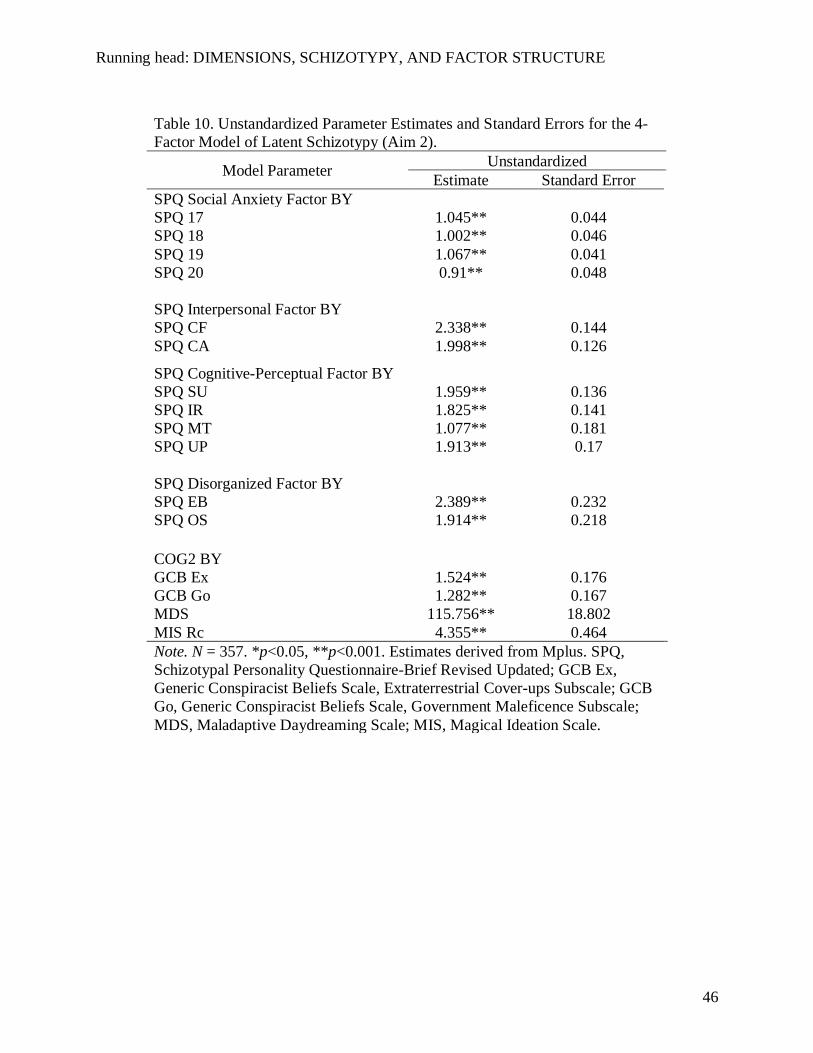
suggesting that they were salient measures of the latent construct. Lastly, table 10 contains the
unstandardized parameter estimates and standard errors for the time 2 latent cognitive-perceptual
model.
______________________________________________________________
Insert Figure 4.
______________________________________________________________
______________________________________________________________
Insert Table 10.
______________________________________________________________
______________________________________________________________
Figure 5.
______________________________________________________________

Running head: DIMENSIONS, SCHIZOTYPY, AND FACTOR STRUCTURE
26
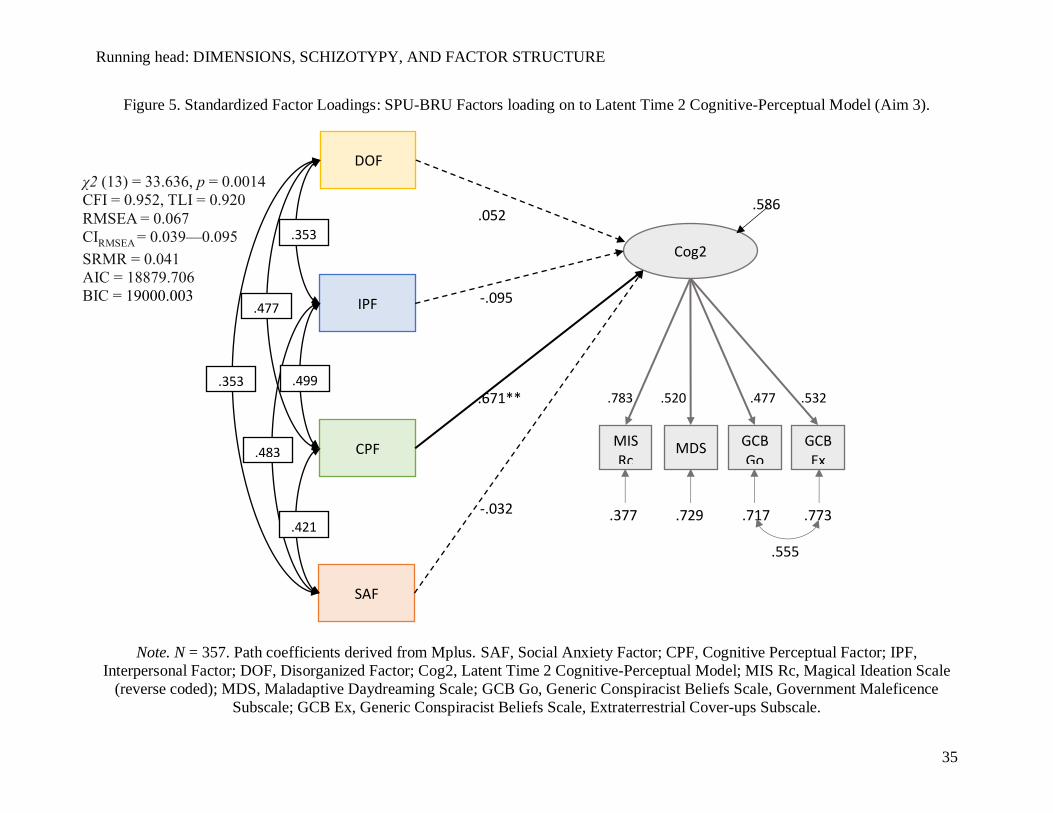
Aim 3 Goodness-of-Fit
After establishing fit for each measurement model, we tested the full model by regressing
scores on the higher-order latent schizotypy variable on to time 2 cognitive-perceptual
experiences in the aim 2 subsample (see Figure 5). Consistent with our predictions, this model
yielded adequate fit of the data χ2 (13) = 33.636, p = 0.0014, CFI = 0.952, TLI = 0.920, RMSEA
= 0.067, CIRMSEA = 0.039—0.095, SRMR = 0.041). The only path that was significant in the
model was the cognitive perceptual subscale of the SPQ-BRU. The R-square estimate indicates
the full model explained 41.4% of the variance in time 2 cognitive-perceptual latent endogenous
variable (p < .001).
Discussion
We tested three primary aims in the present study. Consistent with our hypothesis for the
first aim, CFA and model comparisons supported a 4-factor model identified by Callaway et al.
(2014). This model was previously supported by Davidson et al. (2016) in a similar sample. In
addition to determining the factor structure of the SPQ-BRU, we also tested aim 2, the model fit
of the time 2 latent cognitive-perceptual features. This aim provided an outcome of interest to
test our third aim, which examined the impact of latent schizotypy on time 2 cognitive-
perceptual features. Lastly, we found support for our full model tested in aim 3, which revealed
that the cognitive perceptual factor subscale SPQ-BRU was a robust predictor of cognitive-
perceptual features at time 2.
Strengths of the Present Study
The present study has several strengths. First, we empirically tested competing models
and established using both local and global fit indices a model of best fit. Two of the models
examined, the 4-factor Paranoid model and the 4-factor Callaway et al. (2014) model, have not

Running head: DIMENSIONS, SCHIZOTYPY, AND FACTOR STRUCTURE
27
been directly compared to date. Although prior studies have cited the superiority of the 4-factor
Paranoid solution of dimensional schizotypy due to its global fit, its local fit may be substandard.
Specifically, standardized factor loadings for the cross-loading indicators, which make this
model unique from other models, fall below recommendations cited by Brown (2015, p. 27). Our
present study appears to replicate a consistent pattern of excellent global, but poor component fit
among complex indicators using this model (Compton et al., 2009a; Compton, Goulding,
Bakeman, & McClure-Tone, 2009b; Gross, Mellin, Silvia, Barrantes-Vidal, & Kwapil, 2014;
Stefanis et al., 2004; Wuthrich & Bates, 2006).
It is unclear why component fit has not been discussed in prior psychometric
investigations using complex indicators in schizotypy. The practice of retaining solutions with
complex indicators when there is good global but questionable local fit is evident in other
investigations using different measures and theoretical approaches (Fonseca-Pedrero, Paino,
Lemos-Giráldez, Sierra-Baigrie, & Muñiz, 2010). Brown argues that interpretability of a CFA
solution involves evaluation of the items, the factors, and their respective conceptual and
empirical relevance. Complex indicators that load onto more than one factor may possess poor
discriminant validity. Furthermore, these types of indicators may yield weakly defined factors
that only have a small number of salient indicators. It is imperative to establish both global and
component fit prior to establishing a final measurement model because non-salient indicators are
typically dropped in model respecification stages (Brown, 2015).
A second strength of the present study is the consistency between theoretical,
measurement, and modeling approaches. Although dimensional models of psychosis have been
discussed as impactful for shifting schizophrenia research, the adoption of dimensional
assessment and sampling approaches are slow moving in practice. This investigation
Running head: DIMENSIONS, SCHIZOTYPY, AND FACTOR STRUCTURE
28
demonstrated that the SPQ-BRU adheres to the assumptions of a continuous model of
schizotypy. Specifically, schizotypal traits are normally distributed and predictive of cognitive-
perceptual phenomena in a non-clinical population, with extreme scores occurring less
frequently. Importantly, these findings demonstrate convergence with larger shifts in SSD
research and draw attention to the potential role of schizotypy in the future of psychosis research.
Lastly, this study demonstrated that the continuity of schizotypal traits can be reliably
measured using a relatively brief scale. The importance of this strength is noteworthy when
considering multi-trait investigations that will require brief screening measures. While other
measures of schizotypy have been recently revised to reduce their length and administration
time, the SPQ-BRU is the shortest and most comprehensive measure to date. Unlike other
measures, the SPQ-BRU is one of the few to assess disorganized features of schizotypy.
Disorganized speech and eccentricity are subtle but functionally-consequential aspects of
schizotypy that are pertinent to the etiology of psychosis spectrum disorders.
Limitations
The present study also had several limitations. First, a large proportion of the variance in
the full model (aim 3) appears to be explained by magical ideation. This suggests that the amount
of variance explained by the other indicators (conspiracy beliefs, maladaptive daydreaming) is
comparatively less than a more prototypical measure widely used in schizotypy research. We
initially selected the novel measures because they provide more indirect measures of cognitive-
perceptual abnormalities and proneness to fantasizing. We surmise that there may be a trade-off
between measurement specificity and sensitivity in this context.
In addition, the present study focused exclusively on a convenience sample of college-
age individuals from a Midwestern University. The use of this convenience sample may hinder
Running head: DIMENSIONS, SCHIZOTYPY, AND FACTOR STRUCTURE
29
generalization to populations with severe and persistent schizophrenia spectrum disorders (SSD).
Furthermore, this study would have been strengthened by integrating additional research
methods other than self-report. Finally, outcomes were assessed approximately 1-2 months after
initial assessment and a long-term follow-up would have greatly enhanced the long-term impact
of schizotypy on outcomes of interest.
Implications
Results from the present study dovetail with prior findings from longitudinal studies
assessing schizotypal traits in childhood. These studies confirm the predictive power and
accuracy of schizotypy for clinical status later in adulthood (Tyrka et al., 1995), which in turn
bolsters support for the dimensional-neurodevelopmental continuum of psychosis. For example,
results from the Dunedin Multidisciplinary Health and Development Study found that the
positive features of schizotypy in childhood later predicted schizophreniform disorder in both
adolescence and adulthood (Poulton et al., 2000). In a later investigation using the same sample,
(Fisher et al., 2013) found that 23.1% of all adult cases with a psychotic disorder had childhood
symptoms of schizotypy at age 11. These converging lines of evidence provide support for the
role of schizotypy in predicting later psychosis psychopathology in adulthood, supporting
theories positioning schizotypy as a “developmental mediator” of psychosis-risk (Debbané &
Barrantes-Vidal, 2015; Debbané et al., 2015; Debbané & Mohr, 2015).

Running head: DIMENSIONS, SCHIZOTYPY, AND FACTOR STRUCTURE
30
Appendices
Figure 1. Histogram and Normal Curve for Mean SPQ-BRU Total Scores.
Note. Frequencies are obtained from SPSS. N = 2,404. The red curve depicts a Gaussian
(normal) distribution. SPQ-BRU total scale scores are plotted along the x-axis. Listwise deletion
was used.

Running head: DIMENSIONS, SCHIZOTYPY, AND FACTOR STRUCTURE
31
Figure 2a. Final CFA Solution of Latent Schizotypy with Standardized Factor Loadings (Aim 1).
Note. N = 2,474. Standardized Factor Loadings derived from Mplus. SP, Schizotypal Personality Questionnaire-Brief Revised
Updated; IR, Ideas of Reference; SU, Suspiciousness; UP, Unusual Perceptions; MT, Magical Thinking; CA, Constrained Affect; EB,
Eccentric Behavior; OS, Odd Speech; SAF, Social Anxiety Factor; CPF, Cognitive Perceptual Factor; IPF, Interpersonal Factor; DOF,
Disorganized Factor.
χ2 (450) = 2814, p<0.001
CFI = 0.931, TLI = 0.942
RMSEA = 0.046
CIRMSEA
= 0.044—0.048
SRMR = 0.052
AIC = 190627.067
BIC = 119251.952

Running head: DIMENSIONS, SCHIZOTYPY, AND FACTOR STRUCTURE
32
Figure 2b. Replication of Final CFA Solution of Latent Schizotypy (Parceled) with Standardized Factor Loadings (Aim 1).
Note. N = 2,474. Standardized Factor Loadings derived from Mplus. SAF, Social Anxiety Factor; CPF, Cognitive Perceptual Factor;
IPF, Interpersonal Factor; DOF, Disorganized Factor; SPQ, Schizotypal Personality Questionnaire-Brief Revised Updated, UP,
Unusual Perceptions; MT, Magical Thinking; IR, Ideas of Reference; SU, Suspiciousness; CA, Constrained Affect; CF, No Close
Friends; OS, Odd Speech; EB, Eccentric Behavior.
SAF DOF IPF CPF
.482 .560
.482 .632
.733
.505
SPQ17
SPQ18
SPQ19
SPQ20
UP MT IR SU CA CF OS EB
.657 .621 .793 .827 .773 .688 .353 .532 .879 .850 .869 .755
.429 .245 .277 .227 .402 .527 .875 .717 .316 .372 .568 .614
χ2 (48) = 696.420, p<0.001
CFI = 0.941, TLI = 0.919
RMSEA = 0.074
CIRMSEA
= 0.069—0.079
SRMR = 0.042
AIC = 119007.781
BIC = 119251.952

Running head: DIMENSIONS, SCHIZOTYPY, AND FACTOR STRUCTURE
33
Figure 3. Replication of Final CFA Solution of Latent Schizotypy (Parceled) with Standardized Factor Loadings (Aim 2).
Note. N = 357. Standardized Factor Loadings derived from Mplus. SAF, Social Anxiety Factor; CPF, Cognitive Perceptual Factor;
IPF, Interpersonal Factor; DOF, Disorganized Factor; SPQ, Schizotypal Personality Questionnaire-Brief Revised Updated, UP,
Unusual Perceptions; MT, Magical Thinking; IR, Ideas of Reference; SU, Suspiciousness; CA, Constrained Affect; CF, No Close
Friends; OS, Odd Speech; EB, Eccentric Behavior.
SAF DOF IPF CPF
.503 .568
.516 .688
.751
.564
SPQ17
SPQ18
SPQ19
SPQ20
UP MT IR SU CA CF OS EB
.655 .554 .891 .769 .738 .709 .362 .603 .890 .862 .888 .734
.462 .212 .257 .208 .456 .498 .869 .637 .409 .329 .570 .693
χ2 (48) = 111.073, p<0.001
CFI = 0.961, TLI = 0.947
RMSEA = 0.061
CIRMSEA
= 0.046—0.075
SRMR = 0.041
AIC = 17213.054
BIC = 17376.036

Running head: DIMENSIONS, SCHIZOTYPY, AND FACTOR STRUCTURE
34
Figure 4. Final CFA Solution of Latent Time 2 Cognitive Perceptual Model with Standardized Factor Loadings (Aim 2).
Note. N = 357. Standardized Factor Loadings derived from Mplus. Cog2, Latent Time 2 Cognitive Perceptual Model; MIS Rc,
Magical Ideation Scale (reverse coded); MDS, Maladaptive Daydreaming Scale; GCB Go, Generic Conspiracist Beliefs Scale,
Government Maleficence Subscale; GCB Ex, Generic Conspiracist Beliefs Scale, Extraterrestrial Cover-ups Subscale.
Cog2
MISRc
MDS GCBGo
GCBEx
.502
.429
.484
.862
.816 .766 .257 .748
.578
χ2 (1) = 0.002, p = 0.963
CFI = 1.000, TLI = 1.024
RMSEA = 0.000
CIRMSEA = 0.000—0.000
SRMR = 0.000
AIC = 10284.810
BIC = 10335.220
Running head: DIMENSIONS, SCHIZOTYPY, AND FACTOR STRUCTURE
35
Figure 5. Standardized Factor Loadings: SPU-BRU Factors loading on to Latent Time 2 Cognitive-Perceptual Model (Aim 3).
Note. N = 357. Path coefficients derived from Mplus. SAF, Social Anxiety Factor; CPF, Cognitive Perceptual Factor; IPF,
Interpersonal Factor; DOF, Disorganized Factor; Cog2, Latent Time 2 Cognitive-Perceptual Model; MIS Rc, Magical Ideation Scale
(reverse coded); MDS, Maladaptive Daydreaming Scale; GCB Go, Generic Conspiracist Beliefs Scale, Government Maleficence
Subscale; GCB Ex, Generic Conspiracist Beliefs Scale, Extraterrestrial Cover-ups Subscale.
SAF
DOF
IPF
CPF
.353
.483
.421
.499
.477
.353 Cog2
MISRc
MDS GCBGo
GCBEx
.532 .477 .520 .783
.717 .729 .377 .773
.555
.586 .052
-.095
.671**
-.032
χ2 (13) = 33.636, p = 0.0014
CFI = 0.952, TLI = 0.920
RMSEA = 0.067
CIRMSEA = 0.039—0.095
SRMR = 0.041
AIC = 18879.706
BIC = 19000.003

Running head: DIMENSIONS, SCHIZOTYPY, AND FACTOR STRUCTURE
36
Table 1. Scale Characteristics & Normality Statistics for SPQ-BRU CFA (Aim 1).
Scale N (%) Mean (Variance) Skewness
(Kurtosis)
Minimum-
Maximum
Percentiles
40%-80% Median
SPQ Ideas of Reference 2468 (99.6) 9.26 (6.75) -0.42 (0.20) 3-15 9-12 10
SPQ Suspiciousness 2469 (99.6) 7.61 (6.70) -0.54 (0.54) 3-15 7-10 8
SPQ No Close Friends 2464 (99.4) 7.10 (9.49) 0.54 (-0.55) 3-15 6-10 6
SPQ Constrained Affect 2465 (99.4) 7.46 (6.15) 0.10 (-0.57) 3-15 7-10 7
SPQ Eccentric Behavior 2457 (99.1) 10.62 (14.21) -0.62 (0.87) 4-20 9-14 11
SPQ Magical Thinking 2461 (99.3) 7.10 (9.75) 0.87 (0.28) 4-20 5-10 7
SPQ Odd Speech 2462 (99.5) 12.80 (12.40) -0.21 (-0.34) 4-20 12-16 13
SPQ Unusual Perceptions 2464 (99.4) 7.57 (9.69) 0.56 (-0.48) 4-18 6-10 8
SPQ Social Anxiety 2463 (99.4) 12.20 (17.85) -0.09 (-0.73) 4-20 11-16 12
SPQ Cognitive Perceptual 2446 (98.7) 31.52 (66.01) 0.19 (-0.10) 14-65 29-38 31
SPQ Interpersonal 2459 (99.1) 23.41 (37.46) 0.32 (-0.53) 6-30 13-19 14
SPQ Disorganized 2446 (98.7) 23.41 (37.26) -0.13 (-0.22) 8-40 22-29 24
SPQ Total 2404 (96.7) 81.64 (316.60) -0.06 (0.05) 32-140 78-96 82
Note. N = 2,474. Univariate higher-order moment descriptive statistics derived from Mplus. Non-normality defined as skewness > 3,
kurtosis > 7. SPQ, Schizotypal Personality Questionnaire-Brief Revised Updated.

Running head: DIMENSIONS, SCHIZOTYPY, AND FACTOR STRUCTURE
37
Table 2. Sample Demographics by Semester (Percentages).
Fall 2014 Spring 2015 Spring 2016 Fall 2016 Total
N 576 592 610 695 2,404
Sex
Male 30.20 21.10 30.70 26.50 27.1
Female 67.40 78.80 68.50 72.90 71.9
Other 0.30 0.20 0.20 0.10 0.20
Sexual Orientation
Bisexual 3.8 3.5 3.8 5.7 4.3
Gay/Lesbian 0.5 0.7 1.6 2.4 1.4
Heterosexual 92.0 92.4 91.2 89.4 91.2
Other 2.8 3.0 2.1 1.6 2.3
Single
Yes N.A. N.A. 54.0 59.4 N.A.
No 45.2 40.0
Race
African American 3.3 5.1 2.8 3.4 3.6
Asian/Pacific Islander 3.8 5.1 3.6 6.0 5.2
Hispanic 7.3 6.2 7.2 7.7 6.7
Non-Hispanic White 79.7 79.8 82.2 79.2 80.2
Native American 0.3 0.0 0.2 0.3 0.2
Other 3.6 3.9 3.3 3.0 3.4
SES
Upper class 9.20 9.10 7.50 7.20 8.20
Middle class 73.30 70.70 73.20 75.00 73.10
Working class 12.20 16.00 15.30 14.30 14.50
Lower class 4.50 3.50 2.80 2.60 3.30
Employment
Full time 2.30 1.90 2.00 1.90 2.00
Part time 22.00 18.40 26.60 26.00 23.40
Academic Status
Freshman
56.80 43.20 61.30 41.50
Sophomore
22.60 24.50 16.40 16.10
Junior N.A. 11.80 18.80 10.20 10.30
Senior
5.60 11.60 9.30 6.80
Paternal Education
Some High School 3.80 5.10 5.10 6.00 4.70
High School Degree 17.00 17.40 17.40 18.20 17.70
Some College 17.70 16.00 16.00 15.50 16.90
College Degree 34.20 39.50 39.50 36.20 37.20
Some Graduate/Prof. 4.30 4.00 4.00 3.90 3.90
Graduate/Prof. Degree 22.40 17.50 17.50 19.40 18.90
Maternal Education
Some High School 4.30 3.70 3.30 6.00 4.30
High School Degree 15.10 13.30 13.10 18.20 14.20
Some College 13.90 18.00 14.70 15.50 15.90
College Degree 44.60 42.30 48.00 36.20 43.60
Some Graduate/Prof. 4.70 6.40 4.40 3.90 5.30
Graduate/Prof. Degree 17.00 15.90 15.80 19.40 16.30
Note. Percentages obtained from SPSS.

Running head: DIMENSIONS, SCHIZOTYPY, AND FACTOR STRUCTURE
38
Table 3. Cronbach’s Alpha Coefficients and Missing Data for the SPQ-BRU (Aim 1).
Scale Alphas No. of Items Missing N (%)
SPQ Ideas of Reference 0.77 3 11 (0.4)
SPQ Suspiciousness 0.74 3 10 (0.4)
SPQ No Close Friends 0.85 3 15 (0.6)
SPQ Constrained Affect 0.66 3 14 (0.6)
SPQ Eccentric Behavior 0.89 4 22 (0.9)
SPQ Magical Thinking 0.85 4 18 (0.7)
SPQ Odd Speech 0.84 4 17 (0.7)
SPQ Unusual Perceptions 0.81 4 15 (0.6)
SPQ Social Anxiety Factor 0.90 4 16 (0.6)
SPQ Cognitive Perceptual Factor 0.85 14 33 (1.3)
SPQ Interpersonal Factor 0.85 6 20 (0.8)
SPQ Disorganized Factor 0.86 8 33 (1.3)
SPQ-BRU Total 0.91 32 75 (3.0)
Note. N = 2,479. Cronbach’s alpha coefficients obtained from SPSS. Listwise deletion was used.

Running head: DIMENSIONS, SCHIZOTYPY, AND FACTOR STRUCTURE
39
Table 5. CFA Model Fit Using Robust Maximum Likelihood (MLR) Estimation for Aim 1.
Model
#
Estimated
Parameters
χ2
Value†
χ2
df CFI TLI SRMR
RMSEA
Estimate RMSEA
Lower CI RMSEA
Higher CI RMSEA
p-value AIC BIC
Unidimensional (Baseline) 105 3495.81 455 0.911 0.903 0.064 0.052 0.050 0.054 0.02 196787.59 197398.01
2-Factor (Compton et al., 2009a) 106 2986.35 454 0.926 0.919 0.058 0.047 0.046 0.049 1.00 196214.96 196831.20
3-Factor (Raine et al., 1994) 108 2878.25 452 0.929 0.922 0.056 0.047 0.045 0.048 1.00 196094.87 196722.74
4-Factor (Callaway et al., 2014) 108 2875.21 450 0.931 0.942 0.052 0.046 0.044 0.048 1.00 196027.07 196666.56
Paranoid (Stefanis et al., 2004) 111 2523.04 449 0.939 0.933 0.042 0.043 0.042 0.045 1.00 195698.33 196343.64
Note. N = 2,474. Model fit information derived from Mplus. †All models p<0.001.

Running head: DIMENSIONS, SCHIZOTYPY, AND FACTOR STRUCTURE
40
Table 6a. Unstandardized Parameter Estimates and
Standard Errors for the Full 4-Factor Model of Latent
Schizotypy (Aim 1).
Model Parameter Unstandardized
Estimate Standard Error
SPQ IR
SPQ 1 0.460** 0.018
SPQ 2 0.535** 0.022
SPQ 3 0.439** 0.018
SPQ SU
SPQ 4 0.275** 0.026
SPQ 5 0.315** 0.031
SPQ 6 0.321** 0.032
SPQ CF
SPQ 7 0.522** 0.027
SPQ 8 0.566** 0.029
SPQ 9 0.377** 0.020
SPQ CA
SPQ 10 0.282** 0.044
SPQ 11 0.134** 0.020
SPQ 12 0.291** 0.046
SPQ MT
SPQ 21 0.749** 0.019
SPQ 22 0.754** 0.020
SPQ 23 0.610** 0.021
SPQ 24 0.552** 0.019
SPQ OS
SPQ 25 0.689** 0.020
SPQ 26 0.729** 0.021
SPQ 27 0.586** 0.019
SPQ 28 0.479** 0.018
SPQ UP
SPQ 29 0.612** 0.020
SPQ 30 0.416** 0.016
SPQ 31 0.714** 0.022
SPQ 32 0.537** 0.016
SPQ EB
SPQ 13 0.656** 0.023
SPQ 14 0.663** 0.023

Running head: DIMENSIONS, SCHIZOTYPY, AND FACTOR STRUCTURE
41
SPQ 15 0.618** 0.022
SPQ 16 0.586** 0.021
Disorganized Factor
SPQ EB 0.989** 0.063
SPQ OS 0.838** 0.052
Interpersonal Factor
SPQ CF 1.680** 0.115
SPQ CA 2.758** 0.470
Cognitive-Perceptual Factor BY
SPQ SU 2.210** 0.248
SPQ IR 1.250** 0.072
SPQ MT 0.404** 0.032
SPQ UP 0.726** 0.045
Social Anxiety Factor
SPQ 17 1.057** 0.016
SPQ 18 1.004** 0.017
SPQ 19 1.038** 0.017
SPQ 20 0.924** 0.019
Note. N = 2,474. *p<0.05, **p<0.001. Estimates derived
from Mplus. SPQ, Schizotypal Personality Questionnaire-
Brief Revised Updated.
Running head: DIMENSIONS, SCHIZOTYPY, AND FACTOR STRUCTURE
42
Table 6b. Unstandardized Parameter Estimates and Standard Errors
for the Parcelled 4-Factor Model of Latent Schizotypy (Aim 1).
Model Parameter Unstandardized
Estimate Standard Error
Disorganized Factor BY
SPQ EB 2.476** 0.088
SPQ OS 2.188** 0.089
Interpersonal Factor BY
SPQ CF 2.546** 0.057
SPQ CA 1.964** 0.049
Cognitive-Perceptual Factor BY
SPQ SU 2.001** 0.052
SPQ IR 1.786** 0.056
SPQ MT 1.103** 0.077
SPQ UP 1.656** 0.074
Social Anxiety Factor BY
SPQ 17 1.057** 0.016
SPQ 18 1.004** 0.017
SPQ 19 1.038** 0.017
SPQ 20 0.924** 0.019
Note. N = 2,474. *p<0.05, **p<0.001. Estimates derived from
Mplus. SPQ, Schizotypal Personality Questionnaire-Brief Revised
Updated.

Running head: DIMENSIONS, SCHIZOTYPY, AND FACTOR STRUCTURE
43
Table 7. Sample Demographics for Aim 2 (Percentages).
Sex
Male 26.3
Female 73.7
Other 0.0
Sexual Orientation
Bisexual 4.7
Gay/Lesbian 23.7
Heterosexual 70.9
Other 0.6
Single
Yes 51.7
No 42.5
Race
African American 2.7
Non-Hispanic White 84.8
Native American 0.8
Asian/Pacific Islander 6.7
Other 5.1
SES
Upper class 7.0
Middle class 74.9
Working class 10.6
Lower class 2.2
Psychotropic Rx
No, never 85.5
A few months 7.5
Many years 7.0
Employment
Full time 1.7
Part time 23.5
Academic Status
Freshman 59.2
Sophomore 14.5
Junior 15.1
Senior 9.8
Paternal Education
Some High School 6.2
High School Degree 19.6
Some College/Associates 20.4
College Degree 31.1
Trade/Technical 2.7
Graduate/Prof. Degree 20.1
Maternal Education
Some High School 4.8
High School Degree 11.8
Some College 24.7
College Degree 36.2
Trade/Technical 2.7
Graduate/Prof. Degree 19.1
Note. N = 376. Percentages obtained from SPSS.

Running head: DIMENSIONS, SCHIZOTYPY, AND FACTOR STRUCTURE
44
Table 8. Scale Characteristics & Normality Statistics in Subsample (Aim 2).
Scale N (%) Mean (Variance) Skewness
(Kurtosis)
Minimum-
Maximum
Percentiles
40%-80% Median
SPQ17 358 (100) 3.52 (1.38) -0.55 (-0.64) 1-5 3-5 4
SPQ18 358 (100) 3.49 (1.35) -0.53 (-0.66) 1-5 3-4 4
SPQ19 358 (100) 3.27 (1.45) -0.17 (-1.00) 1-5 3-4 3
SPQ20 358 (100) 2.82 (1.54) 0.18 (-1.13) 1-5 2-4 3
SPQ Social Anxiety 358 (100) 13.09 (17.81) -0.239 (-0.74) 4-20 12-17 13.5
SPQ Cognitive Perceptual 358 (100) 32.15 (67.42) 0.134 (-0.36) 14-57 30-29 32
SPQ Interpersonal 358 (100) 24.53 (14.93) 0.307 (-0.40) 6 -30 13-19 14.5
SPQ Disorganized 357 (99.7) 23.96 (34.44) -0.189 (-0.31) 8-39 23-29 24
SPQ Total 357 (99.7) 84.08 (317.52) -0.085 (-0.03) 32-136 80-99 84
GCB Ex 351 (98.0) 6.41 (9.22) 0.523 (-0.73) 3-15 5-9 6
GCB Go 352 (98.3) 7.17 (8.95) 0.299 (-0.76) 3-15 6-10 7
MDS 352 (98.3) 265 (57200.281) 1.963 (1.291) 0-1330 150-540 210
MIS Rc 355 (98.3) 36.05 (25.53) 1.291 (1.37) 30-55 32-36 35
Note. N = 357. Univariate higher-order moment descriptive statistics derived from Mplus. Non-normality defined as skewness > 3,
kurtosis > 7. SPQ, Schizotypal Personality Questionnaire-Brief Revised Updated; GCB Ex, Generic Conspiracist Beliefs Scale,
Extraterrestrial Cover-ups Subscale; GCB Go, Generic Conspiracist Beliefs Scale, Government Maleficence Subscale; MDS,
Maladaptive Daydreaming Scale; MIS, Magical Ideation Scale.

Running head: DIMENSIONS, SCHIZOTYPY, AND FACTOR STRUCTURE
45
Table 9. Bivariate Correlations and Descriptive Statistics for Aim 3.
Scale 1 2 3 4 5 6 7 8
1 SPQ Social Anxiety 1.00
2 SPQ Cognitive Perceptual 0.42** 1.00
3 SPQ Interpersonal 0.48** 0.50** 1.00
4 SPQ Disorganized 0.35** 0.48** 0.35** 1.00
5 GCB Ex 0.12* 0.34** 0.18** 0.14** 1.00
6 GCB Go 0.12* 0.36** 0.27** 0.17* 0.68** 1.00
7 MDS 0.25** 0.36** 0.20** 0.27** 0.24** 0.21** 1.00
8 MIS Rc 0.13* 0.49** 0.13* 0.23* 0.43** 0.37** 0.42** 1.00
Note. N = 357. *p<0.05, **p<0.001. Bivariate correlations derived from Mplus. SPQ, Schizotypal Personality Questionnaire-Brief
Revised Updated; GCB Ex, Generic Conspiracist Beliefs Scale, Extraterrestrial Cover-ups Subscale; GCB Go, Generic Conspiracist
Beliefs Scale, Government Maleficence Subscale; MDS, Maladaptive Daydreaming Scale; MIS, Magical Ideation Scale.
Running head: DIMENSIONS, SCHIZOTYPY, AND FACTOR STRUCTURE
46
Table 10. Unstandardized Parameter Estimates and Standard Errors for the 4-
Factor Model of Latent Schizotypy (Aim 2).
Model Parameter Unstandardized
Estimate Standard Error
SPQ Social Anxiety Factor BY
SPQ 17 1.045** 0.044
SPQ 18 1.002** 0.046
SPQ 19 1.067** 0.041
SPQ 20 0.91** 0.048
SPQ Interpersonal Factor BY
SPQ CF 2.338** 0.144
SPQ CA 1.998** 0.126
SPQ Cognitive-Perceptual Factor BY
SPQ SU 1.959** 0.136
SPQ IR 1.825** 0.141
SPQ MT 1.077** 0.181
SPQ UP 1.913** 0.17
SPQ Disorganized Factor BY
SPQ EB 2.389** 0.232
SPQ OS 1.914** 0.218
COG2 BY
GCB Ex 1.524** 0.176
GCB Go 1.282** 0.167
MDS 115.756** 18.802
MIS Rc 4.355** 0.464
Note. N = 357. *p<0.05, **p<0.001. Estimates derived from Mplus. SPQ,
Schizotypal Personality Questionnaire-Brief Revised Updated; GCB Ex,
Generic Conspiracist Beliefs Scale, Extraterrestrial Cover-ups Subscale; GCB
Go, Generic Conspiracist Beliefs Scale, Government Maleficence Subscale;
MDS, Maladaptive Daydreaming Scale; MIS, Magical Ideation Scale.

Running head: DIMENSIONS, SCHIZOTYPY, AND FACTOR STRUCTURE
47
Table 11. Unstandardized Parameter Estimates and Standard Errors for Aim 3).
Model Parameter Unstandardized
Estimate Standard Error
COG2 BY
GCB EX 1.236** 0.119
GCB GO 1.092** 0.119
MDS 95.213** 13.226
MIS RC 3.051** 0.328
COG2 ON
SPQ Social Anxiety Factor -0.009 0.020
SPQ Cognitive-Perceptual Factor 0.107** 0.013
SPQ Interpersonal Factor -0.025 0.018
SPQ Disorganized Factor 0.011 0.013
Means
SPQ Social Anxiety Factor 13.092 0.223
SPQ Cognitive-Perceptual Factor 32.154 0.434
SPQ Interpersonal Factor 14.933 0.262
SPQ Disorganized Factor 23.971 0.310
Note. N = 357. *p<0.05, **p<0.001. Estimates derived from Mplus. SPQ,
Schizotypal Personality Questionnaire-Brief Revised Updated; GCB Ex,
Generic Conspiracist Beliefs Scale, Extraterrestrial Cover-ups Subscale; GCB
Go, Generic Conspiracist Beliefs Scale, Government Maleficence Subscale;
MDS, Maladaptive Daydreaming Scale; MIS, Magical Ideation Scale.

Running head: DIMENSIONS, SCHIZOTYPY, AND FACTOR STRUCTURE
48
References
Barch, D. M., Bustillo, J., Gaebel, W., Gur, R., Heckers, S., Malaspina, D., . . . Carpenter, W.
(2013). Logic and justification for dimensional assessment of symptoms and related
clinical phenomena in psychosis: Relevance to DSM-5. Schizophrenia Research, 150(1),
15-20. doi:10.1016/j.schres.2013.04.027
Barrantes-Vidal, N., Grant, P., & Kwapil, T. R. (2015). The role of schizotypy in the study of the
etiology of schizophrenia spectrum disorders. Schizophrenia Bulletin, 41 Suppl 2, S408-
416. doi:10.1093/schbul/sbu191
Barrantes-Vidal, N., Gross, G. M., Sheinbaum, T., Mitjavila, M., Ballespi, S., & Kwapil, T. R.
(2013). Positive and negative schizotypy are associated with prodromal and
schizophrenia-spectrum symptoms. Schizophrenia Research, 145(1-3), 50-55.
doi:10.1016/j.schres.2013.01.007
Barrantes-Vidal, N., Lewandowski, K. E., & Kwapil, T. R. (2010). Psychopathology, social
adjustment and personality correlates of schizotypy clusters in a large nonclinical sample.
Schizophrenia Research, 122(1), 219-225.
Battaglia, M., Cavallini, M. C., Macciardi, F., & Bellodi, L. (1997). The structure of DSM-III-R
schizotypal personality disorder diagnosed by direct interviews. Schizophrenia Bulletin,
23(1), 83.
Bentler, P. M. (1990). Comparative fit indexes in structural models. Psychological Bulletin,
107(2), 238.
Bentler, P. M., & Bonett, D. G. (1980). Significance tests and goodness of fit in the analysis of
covariance structures. Psychological Bulletin, 88(3), 588.
Bentler, P. M., & Dijkstra, T. (1985). Efficient estimation via linearization in structural models.
Multivariate analysis VI, 9-42.
Bergman, A. J., Harvey, P. D., Mitropoulou, V., Aronson, A., Marder, D., Silverman, J., . . .
Siever, L. J. (1996). The factor structure of schizotypal symptoms in a clinical
population. Schizophrenia Bulletin, 22(3), 501.
Brotherton, R., French, C. C., & Pickering, A. D. (2013). Measuring belief in conspiracy
theories: The generic conspiracist beliefs scale. Frontiers in Psychology, 4, 279.
Brown, T. A. (2015). Confirmatory factor analysis for applied research: Guilford Publications.
Browne, M. W., Cudeck, R., Bollen, K. A., & Long, J. S. (1993). Alternative ways of assessing
model fit. Sage Focus Editions, 154, 136-136.
Callaway, D. A., Cohen, A. S., Matthews, R. A., & Dinzeo, T. (2014). Schizotypal Personality
Questionnaire-Brief Revised: Psychometric replication and extension. Personality
Disorders: Theory, Research, and Treatment, 5(1), 32-38. doi:10.1037/per0000041
Carlson, E. B., & Putnam, F. W. (1993). An update on the dissociative experiences scale.
Dissociation: progress in the dissociative disorders.
Casey, B. J., Oliveri, M. E., & Insel, T. (2014). A neurodevelopmental perspective on the
research domain criteria (RDoC) framework. Biological Psychiatry, 76(5), 350-353.
doi:10.1016/j.biopsych.2014.01.006
Cicero, D. C. (2016). Measurement invariance of the Schizotypal Personality Questionnaire in
Asian, Pacific Islander, White, and multiethnic populations. Psychological Assessment,
28(4), 351-361. doi:10.1037/pas0000180
Claridge, G., & Beech, T. (1995). Fully and quasi-dimensional constructions of schizotypy.
Schizotypal personality, 192-216.

Running head: DIMENSIONS, SCHIZOTYPY, AND FACTOR STRUCTURE
49
Claridge, G., McCreery, C., Mason, O., Bentall, R., Boyle, G., Slade, P., & Popplewell, D.
(1996). The factor structure of "schizotypal' traits: A large replication study. British
Journal of Clinical Psychology, 35 ( Pt 1), 103-115.
Clark, L. A., & Watson, D. (1995). Constructing validity: Basic issues in objective scale
development. Psychological Assessment, 7(3), 309.
Cohen, A. S., Callaway, D. A., Mitchell, K. R., Larsen, J. T., & Strauss, G. P. (2016). A temporal
examination of co-activated emotion valence networks in schizophrenia and schizotypy.
Schizophrenia Research, 170(2), 322-329.
Cohen, A. S., Matthews, R. A., Najolia, G. M., & Brown, L. A. (2010). Toward a more
psychometrically sound brief measure of schizotypal traits: introducing the SPQ-Brief
Revised. Journal of Personality Disorders, 24(4), 516-537.
doi:10.1521/pedi.2010.24.4.516
Cohen, A. S., Morrison, S. C., Brown, L. A., & Minor, K. S. (2012). Towards a cognitive
resource limitations model of diminished expression in schizotypy. Journal of Abnormal
Psychology, 121(1), 109.
Compton, M. T., Goulding, S. M., Bakeman, R., & McClure-Tone, E. B. (2009a). Confirmation
of a four-factor structure of the Schizotypal Personality Questionnaire among
undergraduate students. Schizophrenia Research, 111(1), 46-52.
Compton, M. T., Goulding, S. M., Bakeman, R., & McClure-Tone, E. B. (2009b). An
examination of the factorial structure of the Schizotypal Personality Questionnaire-Brief
(SPQ-B) among undergraduate students. Schizophrenia Research, 115(2), 286-289.
Cuthbert, B. N. (2014). The RDoC framework: facilitating transition from ICD/DSM to
dimensional approaches that integrate neuroscience and psychopathology. World
Psychiatry, 13(1), 28-35. doi:10.1002/wps.20087
Cuthbert, B. N., & Insel, T. R. (2010). Toward new approaches to psychotic disorders: the
NIMH Research Domain Criteria project. Schizophrenia Bulletin, 36(6), 1061-1062.
doi:10.1093/schbul/sbq108
Cuthbert, B. N., & Insel, T. R. (2013). Toward the future of psychiatric diagnosis: The seven
pillars of RDoC. BMC Med, 11, 126. doi:10.1186/1741-7015-11-126
Davidson, C. A., Hoffman, L., & Spaulding, W. D. (2016). Schizotypal personality
questionnaire--brief revised (updated): An update of norms, factor structure, and item
content in a large non-clinical young adult sample. Psychiatry Research, 238, 345-355.
doi:10.1016/j.psychres.2016.01.053
Debbané, M., & Barrantes-Vidal, N. (2015). Schizotypy from a developmental perspective.
Schizophrenia Bulletin, 41 Suppl 2(suppl 2), S386-395. doi:10.1093/schbul/sbu175
Debbané, M., Eliez, S., Badoud, D., Conus, P., Flückiger, R., & Schultze-Lutter, F. (2015).
Developing psychosis and its risk states through the lens of schizotypy. Schizophrenia
Bulletin, 41(suppl 2), S396-S407.
Debbané, M., & Mohr, C. (2015). Integration and development in schizotypy research: An
introduction to the special supplement. Schizophrenia Bulletin, 41 Suppl 2(suppl 2),
S363-365. doi:10.1093/schbul/sbv003
Eckblad, M., & Chapman, L. J. (1983). Magical ideation as an indicator of schizotypy. Journal
of consulting and clinical psychology, 51(2), 215.
Enders, C. K. (2010). Applied missing data analysis: Guilford Press.
Fatemi, S. H., & Folsom, T. D. (2009). The neurodevelopmental hypothesis of schizophrenia,
revisited. Schizophrenia Bulletin, 35(3), 528-548. doi:10.1093/schbul/sbn187

Running head: DIMENSIONS, SCHIZOTYPY, AND FACTOR STRUCTURE
50
Fisher, H. L., Caspi, A., Poulton, R., Meier, M. H., Houts, R., Harrington, H., . . . Moffitt, T. E.
(2013). Specificity of childhood psychotic symptoms for predicting schizophrenia by 38
years of age: a birth cohort study. Psychological Medicine, 43(10), 2077-2086.
Fonseca-Pedrero, E., Paino, M., Lemos-Giraldez, S., Sierra-Baigrie, S., & Muniz, J. (2011).
Measurement invariance of the Schizotypal Personality Questionnaire-Brief across
gender and age. Psychiatry Research, 190(2-3), 309-315.
doi:10.1016/j.psychres.2011.05.021
Fonseca-Pedrero, E., Paino, M., Lemos-Giráldez, S., Sierra-Baigrie, S., & Muñiz, J. (2010).
Factor structure and measurement invariance of the Wisconsin Schizotypy Scales across
gender and age. The Spanish journal of psychology, 13(02), 941-950.
Grimshaw, G. M., Bryson, F. M., Atchley, R. A., & Humphrey, M. K. (2010). Semantic
ambiguity resolution in positive schizotypy: A right hemisphere interpretation.
Neuropsychology, 24(1), 130.
Gross, G. M., Mellin, J., Silvia, P. J., Barrantes-Vidal, N., & Kwapil, T. R. (2014). Comparing
the factor structure of the Wisconsin Schizotypy Scales and the Schizotypal Personality
Questionnaire. Personality Disorders: Theory, Research, and Treatment, 5(4), 397-405.
doi:10.1037/per0000090
Hergovich, A., Schott, R., & Arendasy, M. (2008). On the relationship between paranormal
belief and schizotypy among adolescents. Personality and Individual Differences, 45(2),
119-125. doi:10.1016/j.paid.2008.03.005
Hoyle, R. H., & Isherwood, J. C. (2013). Reporting results from structural equation modeling
analyses in Archives of Scientific Psychology. Archives of Scientific Psychology, 1(1),
14.
Hu, L., & Bentler, P. M. (1999). Cutoff criteria for fit indexes in covariance structure analysis:
Conventional criteria versus new alternatives. Structural equation modeling: A
multidisciplinary journal, 6(1), 1-55.
Insel, T. R. (2014). The NIMH Research Domain Criteria (RDoC) Project: Precision medicine
for psychiatry. American Journal of Psychiatry, 171(4), 395-397.
doi:10.1176/appi.ajp.2014.14020138
Insel, T. R., Cuthbert, B., Garvey, M., Heinssen, R., Pine, D. S., Quinn, K., . . . Wang, P. (2010).
Research domain criteria (RDoC): Toward a new classification framework for research
on mental disorders. American Journal of Psychiatry, 167(7), 748-751.
doi:10.1176/appi.ajp.2010.09091379
Johns, L. C., & van Os, J. (2001). The continuity of psychotic experiences in the general
population. Clinical psychology reviews, 21(8), 1125-1141.
Kendler, K. S., Ochs, A. L., Gorman, A. M., Hewitt, J. K., Ross, D. E., & Mirsky, A. F. (1991).
The structure of schizotypy: A pilot multitrait twin study. Psychiatry Research, 36(1), 19-
36.
Kline, R. B. (2015). Principles and practice of structural equation modeling: Guilford
publications.
Kwapil, T. R., Barrantes-Vidal, N., & Silvia, P. J. (2008). The dimensional structure of the
Wisconsin schizotypy scales: Factor identification and construct validity. Schizophrenia
Bulletin, 34(3), 444-457.
Kwapil, T. R., & Chun, C. A. (2015). 1 The psychometric assessment of schizotypy. Schizotypy:
New Dimensions, 7.

Running head: DIMENSIONS, SCHIZOTYPY, AND FACTOR STRUCTURE
51
Kwapil, T. R., Crump, R. A., & Pickup, D. R. (2002). Assessment of psychosis proneness in
African‐American college students. Journal of Clinical Psychology, 58(12), 1601-1614.
Kwapil, T. R., Gross, G. M., Silvia, P. J., & Barrantes-Vidal, N. (2013). Prediction of
psychopathology and functional impairment by positive and negative schizotypy in the
Chapmans' ten-year longitudinal study. Journal of Abnormal Psychology, 122(3), 807-
815. doi:10.1037/a0033759
Kwapil, T. R., Miller, M. B., Zinser, M. C., Chapman, J., & Chapman, L. J. (1997). Magical
ideation and social anhedonia as predictors of psychosis proneness: A partial replication.
Journal of Abnormal Psychology, 106(3), 491.
Lenzenweger, M. F. (2006). Schizotaxia, schizotypy, and schizophrenia: Paul E. Meehl's
blueprint for the experimental psychopathology and genetics of schizophrenia. Journal of
Abnormal Psychology, 115(2), 195-200. doi:10.1037/0021-843x.115.2.195
Lenzenweger, M. F. (2015). Thinking clearly about schizotypy: Hewing to the schizophrenia
liability core, considering interesting tangents, and avoiding conceptual quicksand.
Schizophrenia Bulletin, 41 Suppl 2, S483-491. doi:10.1093/schbul/sbu184
MacCallum, R. C., Browne, M. W., & Sugawara, H. M. (1996). Power analysis and
determination of sample size for covariance structure modeling. Psychological Methods,
1(2), 130.
Mason, O. J. (2015). The assessment of schizotypy and its clinical relevance. Schizophrenia
Bulletin, 41(suppl 2), S374-S385.
Maxwell, S. E., & Delaney, H. D. (1993). Bivariate median splits and spurious statistical
significance. Psychological Bulletin, 113(1), 181.
Meehl, P. E. (1962). Schizotaxia, schizotypy, schizophrenia. American psychologist, 17(12), 827.
Meehl, P. E. (1990). Toward an integrated theory of schizotaxia, schizotypy, and schizophrenia.
Journal of Personality Disorders, 4(1), 1.
Morris, S. E., Vaidyanathan, U., & Cuthbert, B. N. (2016). Changing the Diagnostic Concept of
Schizophrenia: The NIMH Research Domain Criteria Initiative The
Neuropsychopathology of Schizophrenia (pp. 225-252): Springer.
Muthén, L. K., & Muthén, B. O. (2012). Mplus (Version 7.4). Los Angeles, CA: Muthén &
Muthén.
Nelson, M. T., Seal, M. L., Pantelis, C., & Phillips, L. J. (2013). Evidence of a dimensional
relationship between schizotypy and schizophrenia: A systematic review. Neuroscience
& Biobehavioral Reviews, 37(3), 317-327. doi:10.1016/j.neubiorev.2013.01.004
Papousek, I., Weiss, E. M., Mosbacher, J. A., Reiser, E. M., Schulter, G., & Fink, A. (2014).
Affective processing in positive schizotypy: loose control of social-emotional
information. Brain and cognition, 92, 84-91.
Poulton, R., Caspi, A., Moffitt, T. E., Cannon, M., Murray, R., & Harrington, H. (2000).
Children's self-reported psychotic symptoms and adult schizophreniform disorder: A 15-
year longitudinal study. Archives of General Psychiatry, 57(11), 1053-1058.
Raine, A. (1991). The SPQ: A scale for the assessment of schizotypal personality based on
DSM-III-R criteria. Schizophrenia Bulletin, 17(4), 555-564.
Raine, A., Reynolds, C., Lencz, T., Scerbo, A., Triphon, N., & Kim, D. (1994). Cognitive-
perceptual, interpersonal, and disorganized features of schizotypal personality.
Schizophrenia Bulletin, 20(1), 191-201.

Running head: DIMENSIONS, SCHIZOTYPY, AND FACTOR STRUCTURE
52
Rawlings, D., Williams, B., Haslam, N., & Claridge, G. (2008). Taxometric analysis supports a
dimensional latent structure for schizotypy. Personality and Individual Differences,
44(8), 1640-1651.
Ruhrmann, S., Schultze-Lutter, F., Salokangas, R. K., Heinimaa, M., Linszen, D., Dingemans,
P., . . . Heinz, A. (2010). Prediction of psychosis in adolescents and young adults at high
risk: Results from the prospective European prediction of psychosis study. Archives of
General Psychiatry, 67(3), 241-251.
Siever, L. J., & Gunderson, J. G. (1983). The search for a schizotypal personality: Historical
origins and current status. Comprehensive Psychiatry, 24(3), 199-212.
Somer, E., Lehrfeld, J., Bigelsen, J., & Jopp, D. S. (2016). Development and validation of the
Maladaptive Daydreaming Scale (MDS). Consciousness and cognition, 39, 77-91.
Stefanis, N. C., Smyrnis, N., Avramopoulos, D., Evdokimidis, I., Ntzoufras, I., & Stefanis, C. N.
(2004). Factorial composition of self-rated schizotypal traits among young males
undergoing military training. Schizophrenia Bulletin, 30(2), 335-350.
Stefanis, N. C., Trikalinos, T. A., Avramopoulos, D., Smyrnis, N., Evdokimidis, I., Ntzani, E. E.,
. . . Stefanis, C. N. (2007). Impact of schizophrenia candidate genes on schizotypy and
cognitive endophenotypes at the population level. Biological Psychiatry, 62(7), 784-792.
doi:10.1016/j.biopsych.2006.11.015
Steiger, J. H. (1990). Structural model evaluation and modification: An interval estimation
approach. Multivariate Behavioral Research, 25(2), 173-180.
Swami, V., Pietschnig, J., Stieger, S., & Voracek, M. (2011). Alien psychology: Associations
between extraterrestrial beliefs and paranormal ideation, superstitious beliefs, schizotypy,
and the Big Five personality factors. Applied Cognitive Psychology, 25(4), 647-653.
Tabachnick, B. G., & Fidell, L. S. (2007). Using multivariate statistics, 5th. Needham Height,
MA: Allyn & Bacon.
Tarbox, S. I., & Pogue-Geile, M. F. (2011). A multivariate perspective on schizotypy and
familial association with schizophrenia: A review. Clinical psychology reviews, 31(7),
1169-1182. doi:10.1016/j.cpr.2011.07.002
Tyrka, A. R., Cannon, T. D., Haslam, N., Mednick, S. A., Schulsinger, F., Schulsinger, H., &
Parnas, J. (1995). The latent structure of schizotypy: I. Premorbid indicators of a taxon of
individuals at risk for schizophrenia-spectrum disorders. Journal of Abnormal
Psychology, 104(1), 173.
van Os, J., Kenis, G., & Rutten, B. P. (2010). The environment and schizophrenia. Nature,
468(7321), 203-212. doi:10.1038/nature09563
van Os, J., Linscott, R. J., Myin-Germeys, I., Delespaul, P., & Krabbendam, L. (2009). A
systematic review and meta-analysis of the psychosis continuum: Evidence for a
psychosis proneness-persistence-impairment model of psychotic disorder. Psychol
medicine, 39(2), 179-195. doi:10.1017/s0033291708003814
van Os, J., & Reininghaus, U. (2016). Psychosis as a transdiagnostic and extended phenotype in
the general population. World Psychiatry, 15(2), 118-124.
van Os, J., Rutten, B. P., & Poulton, R. (2008). Gene-environment interactions in schizophrenia:
Review of epidemiological findings and future directions. Schizophrenia Bulletin, 34(6),
1066-1082. doi:10.1093/schbul/sbn117
Weinberger, D. R., & Levitt, P. (2011). Neurodevelopmental origins of schizophrenia.
Schizophrenia, Third Edition, 393-412.

Running head: DIMENSIONS, SCHIZOTYPY, AND FACTOR STRUCTURE
53
Wuthrich, V. M., & Bates, T. C. (2006). Confirmatory factor analysis of the three-factor
structure of the schizotypal personality questionnaire and Chapman schizotypy scales.
Journal of Personality Assessment, 87(3), 292-304.