defining economic success as it pertains to native
TRANSCRIPT

DEFINING ECONOMIC SUCCESS AS IT PERTAINS TO NATIVE AMERICAN OWNED
BUSINESSES LOCATED ON/OR ADJACENT TO NORTH DAKOTA RESERVATIONS.
A Dissertation
Submitted to the Graduate Faculty
of the
North Dakota State University
of Agriculture and Applied Science
By
Barbara Elise Schmitt
In Partial Fulfillment of the Requirements
for the Degree of
DOCTOR OF PHILOSOPHY
Major Department:
Education
September 2013
Fargo, North Dakota
North Dakota State University
Graduate School
Title
DEFINING ECONOMIC SUCCESS AS IT PERTAINS TO NATIVE AMERICAN OWNED
BUSINESSES LOCATED ON/OR ADJACENT TO NORTH DAKOTA RESERVATIONS
By
Barbara Elise Schmitt
The Supervisory Committee certifies that this disquisition complies with North Dakota State
University’s regulations and meets the accepted standards for the degree of
DOCTOR OF PHILOSOPHY
SUPERVISORY COMMITTEE:
Dr. Myron Eighmy
Chair
Dr. Cheryl Kary
Dr. Denise Lajimodiere
Dr. Tim Peterson
Approved:
9-23-13 Dr. William Martin
Date Department Chair
ABSTRACT
Successful economic development is essential in building and sustaining a healthy
community. The purpose of this study was to identify indicators of successful economic
development as it pertained to Native American owned businesses located on/or adjacent to
North Dakota reservations. More specifically this study sought to explore specific relationships
between the perceived level of importance of knowledge, skills, and attitudes and sustainable
Native American owned business ventures. Using a quantitative correlation research design, 194
Native American owned businesses located on/or adjacent to the four reservations in North
Dakota: Spirit Lake, Standing Rock, Fort Berthold, and Turtle Mountain responded to a self-
administered 69 item survey instrument. The instrument was designed to gain an understanding
of how important each factor was to the business owner and to what extent the business owner
used each factor. The compiled research data was analyzed in addressing the following
questions: (a) How important are knowledge, skills, and attitudes to the sustainability of Native
American owned businesses? and (b) To what extent are Native American environmental
factors, knowledge, skills, and attitudes significant for emerging verses mature Native American
owned businesses?
Native American owned businesses play a significant role in their communities. This
research indicated Native American owned businesses need planning and organization skills to
be successful. Strategic planning, operational planning, communication, managing change,
innovation, and human resources are all essential planning and organization skills that both
emerging and mature businesses need.
Emerging Native American business owners also need to be technically proficient in their
field. Therefore, they should be encouraged to participate in training which focuses on technical
iii

skills. They also need to solicit critical suggestions from a business network to be successful.
Receiving constant feedback on the performance of the business will assist emerging business
owners in identifying and correcting issues which would otherwise hold a business back or cause
it to go out of business.
Tribal administrations and tribal economic development offices may benefit from this
study by providing foundational knowledge to advance their economic development efforts. The
results from this study may also benefit higher education business departments who offer
economic development courses.
iv

ACKNOWLEDGEMENTS
There are so many people that helped me to achieve this personal goal of mine. I will be
forever grateful for their encouragement and support to complete this journey. I would like to
first acknowledge my advisor, Dr. Myron Eighmy for the continued encouragement throughout
this whole process and for believing in me to the very end. Without the expertise and support of
my committee members, Dr. Denise Lajimodiere, Dr. Cheryl Kary, and Dr. Tim Peterson this
would have been a very difficult journey. Dr. Peterson your assistance and patience with me will
never be forgotten. I would also like to acknowledge my very good friend Dr. Jen Janecek-
Hartman for her support and friendship. Her “there is a light at the end of tunnel” attitude, made
it bearable. I would also like to recognize my friend and co-worker Arden Boxer for the
emotional support throughout the whole process. Of course, I could not leave out my “sisters”
Julie, Snookie, Alice Jo, Ardis, Sherry, and Amy who heard it all-from start to finish!! You guys
rock!!!
I would like to acknowledge the support of the administration and staff of United Tribes
Technical College. I am forever grateful and cannot express my deepest gratitude to them. The
administration, especially President David Gipp, provided the support, encouragement and
resources I needed to complete this project. Thank you to Dr. Stacie Iken for her invaluable
input throughout this journey. The North Dakota Indian Scholarship program must also be
recognized for providing financial assistance.
Last but definitely not least, I would like to acknowledge my family and friends who
made sacrifices during this process. Thank you to all my concert and camping family for being
patient with me throughout the whole process. Without their continued support and
encouragement, I would not have persevered. I love you all.
v

DEDICATION
This dissertation is dedicated to my family. My husband Jim, my beautiful daughters,
Chelsea and Haley, my sons, daughter-in-laws and grandkids; Jason, April, Brandee, Brooke,
Corey, Erika, McKenna, Landon, Brent and Ashley. Jim you were always there for me, you’ll
never know how much it meant to me. You were my rock. Chelsea and Haley, your ultimate
sacrifice of being without “mom” on many, many occasions will never be forgotten. Kids your
never-ending love and support has allowed me to reach this goal. It is also dedicated to my mom,
Audrey Manson, who in spirit was always looking over my shoulder. I did it Ma.....
vi
TABLE OF CONTENTS
ABSTRACT ................................................................................................................................... iii
ACKNOWLEDGEMENTS .............................................................................................................v
DEDICATION ............................................................................................................................... vi
LIST OF TABLES ...........................................................................................................................x
LIST OF FIGURES ..................................................................................................................... xiii
CHAPTER 1. INTRODUCTION ....................................................................................................1
Statement of the Problem .....................................................................................................2
Purpose of the Study ............................................................................................................3
Importance of the Study .......................................................................................................4
Definition of Terms..............................................................................................................6
Assumptions .........................................................................................................................7
Limitations ...........................................................................................................................8
Delimitations ........................................................................................................................8
Organization of the Remaining Chapters .............................................................................8
CHAPTER 2. LITERATURE REVIEW .......................................................................................10
History of Native Economic Development ........................................................................10
Economic Development on Reservations ..........................................................................17
Tribal Colleges and Economic Development ....................................................................23
Culturally-Relevant Programs ...........................................................................................23
Roles in Reservation Economic Development ..................................................................25
Determining Economic Success ........................................................................................27
Native Entrepreneurs .........................................................................................................31
vii

CHAPTER 3. METHODOLOGY .................................................................................................37
Research Design.................................................................................................................38
Population and Sample ......................................................................................................41
Survey Instrument ..............................................................................................................42
Questionnaire Development...............................................................................................44
Instrument Scales ...............................................................................................................45
Validity ..............................................................................................................................45
Pilot Test Procedures .........................................................................................................45
Pilot Test Results ...............................................................................................................46
Data Collection ..................................................................................................................46
Data Analysis and Interpretation .......................................................................................47
Study Instrument ................................................................................................................48
Factor Analysis-Knowledge, Skills, and Attitudes-Importance ........................................49
Factor Analysis-Knowledge, Skills, and Attitudes-Extent ................................................53
CHAPTER 4. RESULTS ...............................................................................................................57
Missing Data ......................................................................................................................57
Demographics ....................................................................................................................58
Pearson Correlation for Success Measures ........................................................................62
Factor Analysis-Success Measures ....................................................................................65
Research Question 1: How Important Are the Items to the Business? ..............................66
Pearson Correlation for Environmental Factors-Importance .............................................81
Factor Analysis-Environmental Factors-Importance .........................................................85
Regression Analysis ...........................................................................................................87
Research Question 2: How Often Do the Items Pertain to the Business? .........................90
viii
Pearson Correlation for Environmental Factors-Extent ...................................................106
Factor Analysis-Environmental Factors-Extent ...............................................................110
Independent T-Test ..........................................................................................................112
CHAPTER 5. SUMMARY, CONCLUSIONS, AND RECOMMENDATIONS .......................115
Conclusions ......................................................................................................................116
Conclusions for Research Question 1 ..............................................................................116
Conclusions for Research Question 2 ..............................................................................118
Discussion ........................................................................................................................120
Recommendations ............................................................................................................122
Recommendations for Practice ........................................................................................123
Recommendations for Further Study ...............................................................................126
A Closing Thought ...........................................................................................................128
REFERENCES ............................................................................................................................130
APPENDIX A. NATIVE AMERICAN ENTREPRENEUR SURVEY......................................139
APPENDIX B. PERMISSION TO USE SUN’S (2004) INSTRUMENT ..................................145
APPENDIX C. QUESTIONNAIRE DESIGN ............................................................................146
APPENDIX D. PILOT TEST PARTICIPANT REQUEST LETTER ........................................155
APPENDIX E. PILOT TEST COMMENT FORM .....................................................................157
APPENDIX F. PILOT TEST CRONBACH’S ALPHA ..............................................................159
APPENDIX G. REQUEST FOR PERMISSION LETTER ........................................................160
APPENDIX H. TRIBAL RESOLUTIONS/LETTERS ...............................................................168
APPENDIX I. PARTICIPANT REQUEST COVER LETTER ..................................................171
APPENDIX J. PARTICIPANT REMINDER LETTER .............................................................173
ix

LIST OF TABLES
Table Page
1. Characteristics of Reservations Positioned for Sustainable Economic
Development Success ........................................................................................................30
2. List of Environmental Factors ...........................................................................................43
3. Factor Loadings for Varimax Four-Factor Solution for the Item Entrepreneur
Knowledge, Skills, and Attitudes-Importance ...................................................................50
4. Factor Loadings for Varimax Four-Factor Solution for the Item Entrepreneur
Knowledge, Skills, and Attitudes-Extent ..........................................................................55
5. Demographics: Years of Operation ...................................................................................58
6. Demographics: Gender ......................................................................................................59
7. Demographics: Business Role ...........................................................................................59
8. Demographics: Business Acquisition ................................................................................59
9. Demographics: Number of Employees ..............................................................................60
10. Demographics: Revenue Range .........................................................................................60
11. Demographics: Level of Education and Background ........................................................61
12. Demographics: Hours Worked ..........................................................................................62
13. Pearson Product Moment Correlations for Success Measures ..........................................64
14. Factor Loadings from Principal Component Factor Analysis: Communalities,
Eigenvalues, and Percentages of Variance for Items for Success .....................................65
15. Frequency Statistics-Environmental Factors-Importance ..................................................68
16. Descriptive Statistics for Environmental Factors-Importance ...........................................71
17. Frequency Statistics-Planning and Organization-Importance ...........................................73
18. Descriptive Statistics for Planning and Organization-Importance.....................................74
19. Frequency Statistics-Self-Leadership-Importance .............................................................75
x

20. Descriptive Statistics for Self-Leadership-Importance ......................................................76
21. Frequency Statistics-Interpersonal Leadership-Importance ..............................................77
22. Descriptive Statistics for Interpersonal Leadership-Importance ........................................77
23. Frequency Statistics-Systems Management-Importance ...................................................79
24. Descriptive Statistics for Systems Management-Importance ............................................80
25. Pearson Product Moment Correlations for Environmental Factors-Importance ...............83
26. Factor Loadings from Principal Component Factor Analysis: Communalities,
Eigenvalues, and Percentages of Variance for Items for Native American
Environment-Importance ...................................................................................................85
27. Means, Standard Deviations, and Intercorrelations for Success and Knowledge, Skills,
and Attitudes Variables ......................................................................................................88
28. Hierarchical Regression Analysis Summary for Knowledge, Skills, and Attitudes
Predicting Success (N = 194) Model 1 ..............................................................................90
29. Hierarchical Regression Analysis Summary for Knowledge, Skills, and Attitudes
Predicting Success (N = 194) Model 2 ..............................................................................90
30. Frequency Statistics-Environmental Factors-Extent..........................................................93
31. Descriptive Statistics for Environmental Factors-Extent ...................................................95
32. Frequency Statistics-Planning and Organization-Extent ...................................................98
33. Descriptive Statistics for Planning and Organization-Extent ............................................99
34. Frequency Statistics-Self-Leadership-Extent...................................................................100
35. Descriptive Statistics for Self-Leadership-Extent ............................................................101
36. Frequency Statistics-Interpersonal Leadership-Extent ....................................................102
37. Descriptive Statistics for Interpersonal Leadership-Extent .............................................103
38. Frequency Statistics-Systems Management-Extent .........................................................104
39. Descriptive Statistics for Systems Management-Extent ..................................................105
xi
40. Pearson Product Moment Correlations for Environmental Factors-Extent .....................108
41. Factor Loadings from Principal Component Factor Analysis: Communalities,
Eigenvalues, and Percentages of Variance for Items for Native American
Environment-Extent .........................................................................................................110
42. Summary of Analyses of Importance and Usage of Factors............................................120
43. Native American Environmental Factor Items-Extent ....................................................121
44. Self-Leadership Factor Items-Extent ...............................................................................122
45. Essential Planning Skills ..................................................................................................125
46. Essential Organization Skills ...........................................................................................126
xii

LIST OF FIGURES
Figure Page
1. Map of reservations in North Dakota...................................................................................3
2. Trade and intercourse act ...................................................................................................11
3. Growth in Native owned businesses ..................................................................................33
4. Research design overview ..................................................................................................39
xiii
1
CHAPTER 1. INTRODUCTION
This study examines economic success as it pertains to Native American owned
businesses located on/or adjacent to North Dakota reservations. More specifically this study
seeks to explore relationships between the perceived level of importance of knowledge, skills,
and attitudes and sustainable business. Economic success and sustainability will be used
interchangeably for this paper. Adjacent to a reservation will constitute a radius of approximately
25 miles. The term Native American will be used throughout this paper in describing members of
tribes. For this study emerging business will be defined as a business that has been in business
less than five years and a mature business will be defined as a business that has been in business
more than five years.
In their pursuit of self-determination and self-governance, Native American tribes’
economic conditions and outlooks have considerably changed (Tirado, 2008). Economic
development for Native Americans is very different than other ethnic groups. According to
Trosper (1999), “Indian and mainstream values differ, but few have spelled out the implications
of these differences for economic development policy” (p. 139). Emery, Wall, Bregendahl, Flora
and Schmitt (2006) found that the approaches for economic development used in mainstream
America are not appropriate for Indian country because of political and cultural characteristics
unique to each reservation. They reviewed four documents that identified indicators of successful
businesses and opportunities for economic development in rural reservation communities. They
concluded that while local natural resources and governance structures help shape the context for
economic development, social capital in the business community is critical. This study seeks to
expand on the research of Emery et al. by investigating the importance of knowledge, skills, and
attitudes and sustainable businesses located on North Dakota reservations.
2
Statement of the Problem
From an Economic Development Director perspective, working primarily with tribal
organizations in North Dakota, the challenges that tribes have had to face are very apparent. In
general, Indian country lacks the technology, the infrastructure, the financial capital, and the
human resources necessary to successfully achieve economic opportunity. Successful economic
development is essential in building and sustaining an economically healthy community.
Goreham, Rathge and Hess (1994), indicated Native Americans represented the largest
minority group in the Great Plains and accounted for more than 76,000 residents in the states of
North Dakota and South Dakota. The Native American population comprised nearly 6% of the
population, however they owned less than 1% of the businesses in the two-state area. Goreham et
al. (1994) compared two business cultures, the Anglo model and the Native American Model.
Differences were found when comparing the two especially in the area of business and business
management. An unpublished report from the Office of the Assistant Secretary for Policy,
Management, and Budget of the US Department of Interior (as cited in Robinson & Hogan,
1994) indicated that “Indian businesses adopting the Anglo Model have succeeded at only one-
tenth the average rate for all new American business start-ups” (Blending Models, n.d. Adapting
Cultures section, para. 1).
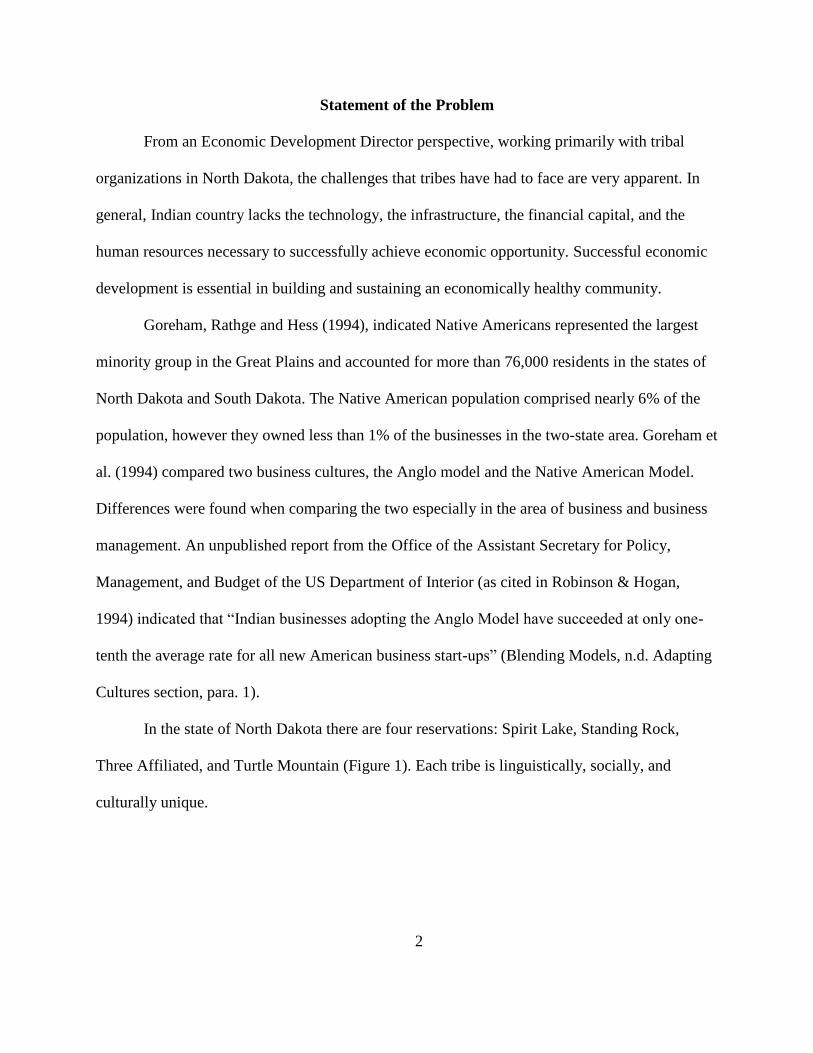
In the state of North Dakota there are four reservations: Spirit Lake, Standing Rock,
Three Affiliated, and Turtle Mountain (Figure 1). Each tribe is linguistically, socially, and
culturally unique.
3
Figure 1. Map of reservations in North Dakota (North Dakota Indian Affairs Commission,
2010).
Purpose of the Study
The purpose of this study is to define economic success as it pertains to Native American
owned businesses located on/or adjacent to North Dakota reservations. More specifically this
study seeks to explore relationships between the perceived level of importance of knowledge,
skills, and attitudes and sustainable business. For this study, a successful business is defined as
one that is in operation for at least five consecutive years. Adjacent to a reservation will
constitute a radius of approximately 25 miles.
The following study questions guided this study:
RQ1. How important are knowledge, skills, and attitudes to the sustainability of Native
American owned businesses?
RQ2. To what extent are Native American environmental factors, knowledge, skills, and
attitudes significant for emerging verses mature Native American owned
businesses?
A quantitative method of research was implemented and a survey instrument was used to
collect data. Results of the study will be shared with tribal administrations and tribal economic

4
development offices to assist them with their economic development efforts. This may include
developing curriculum specific to knowledge, skills, and attitudes of business owners.
Importance of the Study
According to Garsombke and Garsombke (2000), there is limited research on Native
American entrepreneurship and small businesses. In a study conducted by Baker and Lynch
(1994), research indicated education plays a critical role in economic development. Education
was regarded as a very serious and compelling force for tribal improvement. Tribal colleges all
play important roles in the future development of Native American reservation communities,
especially in establishing the foundation for future growth through skills development, technical
assistance, and other efforts. Research findings also indicated each organization is different and
for economic development to be successful it must combine the governance of the tribe and
education. This study is important for the field of education in that the results may be used in
developing curriculum specific to knowledge, skills, and attitudes of business owners. The
curriculum developed will benefit teachers of higher education business departments who teach
economic development courses. Tribal administrations and tribal economic development offices
will also benefit from this study by assisting them with their economic development efforts.
Cornell and Kalt (2003) commented on the economic challenges faced by Indian Nations
in the United States:
American Indian societies are phenomenally resilient. In the last several centuries, they
have faced winds of economic, political, and cultural change that have blown as fiercely
over them as over any people in history. These winds have brought military violence and
subjugation, epidemics of disease, seizures of land and property, vicious racism, and
economic deprivation. Yet, as the 21st century begins, hundreds of distinct Indian nations

5
built upon dozens of cultural lineages still persevere and grow, variously bound together
by ties of family, language, history, and culture. The lesson from Indian Country is a
lesson of strength.
This strength is still being tested. Among the most formidable challenges facing
Native peoples today are those rooted in economic conditions. American Indians living
on the nation's nearly 300 reservations are among the poorest people in the United States.
On most reservations, sustained economic development, while much discussed, has yet to
make a significant dent in a long history of poverty and powerlessness. (p. 3)
Rural reservations throughout the United States face similar economic development,
social, health and cultural challenges. Employment opportunities are severely limited on
reservations, attributing to high unemployment rates. Continuing high unemployment rates have
lead to high rates of domestic violence, alcoholism and poverty (Smith, 2000). In general, Indian
country lacks the technology, the infrastructure, the financial capital, and the human resources
necessary to successfully achieve economic opportunity.
Tribal communities generally are located far from urban centers, therefore do not benefit
from the services that larger communities offer. Services that are typically not found on North
Dakota reservations include household maintenance services, financial institutions, small
appliance repair, accounting services, printing and publication services, reliable
telecommunications support and other services required to successfully operate a business. They
are also located at a significant distance from other reservations. This geographical isolation
coupled with cultural and political uniqueness causes them to develop economic development
strategies in isolation of each other. As a result, North Dakota reservations remain at different
stages of economic development.

6
Definition of Terms
This section provides definitions of key terms that are used in this study.
American Indian reservation: An area of land that has been reserved for a tribe or tribes
through a treaty or other agreement with the United States, executive order, or federal statute or
administrative action as permanent tribal homelands, and where the federal government holds
title to the land in trust on behalf of the tribe (U. S. Department of Interior, 2011).
Attitude: The preference of an individual or organization towards or away from things,
events or people (Frank & Smith, 1999).
Bureau of Indian Affairs: An agency of the federal government of the United States,
which is within the Department of the Interior (U. S. Department of Interior, 2011).
Correlation: Describes how strong the relationship is between variables (Salkind, 2008).
Size of the correlation 0.2 to 0.4 is considered a weak relationship, 0.4 to 0.6 is considered a
moderate relationship, and 0.6 to 0.8 is considered a strong relationship (Salkind, 2008).
Deteriorate: To diminish or impair in quality, character, or value.
Economic success and sustainability: Process whereby the tribe meets the needs of the
present without compromising the ability of future generations to meet their own needs (World
Commission on Environment and Development, 1987).
Federally recognized tribe: An American Indian or Alaska Native tribal entity is
recognized as having a government-to-government relationship with the United States. It also
holds the responsibilities, powers; limitations, obligations attached to the designation, and are
eligible for funding and services from the Bureau of Indian Affairs (U. S. Department of Interior,
2011).

7
Indian Self-Determination and Education Assistance Act (PL 93-638): Allows tribes and
tribal organizations to acquire increased control over the management of federal programs that
impact their members, resources and governments (U. S. Department of Interior, 2011).
Native American: A member of any of the indigenous peoples of America. Other terms
often used when describing Native Americans are: Indian, American Indian, Indian Nation and
Indigenous.
Stagnant: Period of no or slow economic growth or of economic decline in real
(inflation-adjusted) terms (All Business, n.d.).
Tribal Employment Rights Ordinance (TERO): Requires the fair employment of Indians
within the boundaries of a reservation. TERO also prevents reservation employers from
discriminating against Indians throughout their employment practices on the reservation (Turtle
Mountain, 2011).
Tribal self-governance: The right to become self-sufficient, self-determining, and self-
governing societies.
Tribal sovereignty: The inherent authority of indigenous tribes to govern themselves.
Assumptions
A major assumption for this study was whether the entrepreneurs who had business skills
were actually making use of those skills. The listings of Native American businesses operating
on the reservations were assumed to be current. Another assumption was that the respondents
answered the questions on the survey honestly in regards to the importance and performance of
their business. It was also assumed that respondents would return their survey’s in a timely
manner.

8
Limitations
A limitation of this study was the limited scope in which the research was conducted. The
research was limited to the four reservations in North Dakota and encompassed only those
Native American owned businesses located on or adjacent to a reservation. It should be noted if
the tribal administration did not give its approval for the researcher to conduct research on their
reservation this would be a limitation. Another limitation was the limited research on Native
American entrepreneurship and small businesses in general (Garsombke & Garsombke, 2000).
Very few studies have been done on the successes of Native American owned businesses. Most
studies have been about the success of non-Native businesses. In identifying another limitation,
in mailing out the survey it was assumed the addresses were correct. The survey was also not
accessible by internet; therefore the only response was by U.S. postal service. A more significant
limitation regarding the instrument was that it was not created by Native Americans; therefore
cultural values were not taken into account.
Delimitations
Preferably the sample size would include all Native American owned businesses located
in the United States. Due to limitations of time, funds and access to entrepreneurs, this study was
limited to North Dakota Native American owned businesses located on/or adjacent to North
Dakota reservations. Another delimitation was the interpretation of the survey questions and the
response to the questions by the respondents.
Organization of the Remaining Chapters
The dissertation is organized into five chapters. Chapter 1 provides the introduction to the
study. Chapter 2 provides a review of the literature and related research that supports the study
design and concept. It includes background information about economic development on North

9
Dakota reservations and how this attributes to successes on the reservations. The chapter also
summarizes current literature on Native American owned businesses and how they operate on
reservations. The practices provide the foundation for the study.
Chapter 3 outlines the research design and methodology. It contains information about
the population and sample in the study, outlines the instrumentation used, and describes the data
collection process. Chapter 4 provides the methodology of the data collection and the results
obtained from the research. Chapter 5 provides the summary, conclusions, and recommendations
of the study.

10
CHAPTER 2. LITERATURE REVIEW
This study examines economic success as it pertains to Native American owned
businesses located on/or adjacent to North Dakota reservations. More specifically this study
seeks to explore relationships between the identified level of importance of knowledge, skills,
and attitudes and sustainable business.
The review of the literature begins with a description of the history of Native economic
development on reservations. It establishes the uniqueness of how economic development is
viewed on reservations. In addition, a review of the literature about Native entrepreneurs clearly
demonstrates the challenges that face Native owned businesses on reservations. Determining
economic success and how education and economic development are intertwined are discussed
in this literature review.
History of Native Economic Development
Economic development is not a new concept to reservations. Economic development has
a long history of policies and programs through collaboration with federal agencies. Some of
these were more successful than others (Cornell & Kalt, 1992). When federal agencies are
involved, they are the primary decision-makers for the endeavor. Grants and contracts with the
federal government are driven by federal need rather than the needs of the tribe. However, when
Native American tribes assume more responsibility for making development decisions they are
more likely to succeed (Cornell & Kalt, 1992).
Tribal nations have always engaged in various forms of commerce (Thompson, 2010).
Market centers were established from one end of the continent to the other. These trade routes
were the basis for the roads and highways of what they are today. Tribal commerce focused
around seasonal gatherings that are still in effect today. At certain times of the year, large trade

11
gatherings were held amongst the tribes in the Great Plains region (Thompson, 2010). In the
summer months many members of tribes gathered to exchange a variety of agricultural products
from other members (Eagle Woman, 2009). According to Eagle Woman (2009), summer is the
most logical time for members to participate in trade due to weather conditions. June, July and
August are typically powwow season.
Many historical events impacted tribal economies during 1790-1934. From 1790-1834
the Trade and Intercourse Acts were enacted. The Acts allowed for recognition of the tribal
nations as sovereign (Smith, 2000). It was common practice at that time for traders to exchange
land for goods that were provided by tribes. Under the Trade and Intercourse Acts, Indian lands
could only be purchased by the federal government. Prohibiting individuals and states from
purchasing lands directly from tribes protected tribes from land deals that were considered
deceptive (O’Brien, 1989).
Three additional major acts impacted tribes and their economies: the Indian Removal Act
of 1830, the General Allotment Act of 1887 and the Indian Reorganization Act of 1934 (Figure
2).
Figure 2. Trade and intercourse acts (Smith, 2000).
1790-1833 1834-1900 1900-1950
Removal
Act
(1830)
Indian
Reorganization
Act
(1934)
General
Allotment
Act
(1887)

12
In 1830, the Indian Removal Bill was passed. The Removal Act of 1830 (CHAP.
CXLVIII) allowed for tribes to have a choice to move west or stay where they were and follow
the respective state laws. Approximately 30 tribes moved west, including the Cherokee, where
almost 4,000 tribal members died during the move (O’Brien, 1989).
According to Welch (2006), tribes were forced to move to areas that were far different
from their original lands. Many were moved to areas which lacked fishing and hunting, which
were historically important to these tribes’ survival. They were resilient, though. Ranching
became a part of life for these tribes. With the onset of settlers moving to the west, many tribes
started businesses to meet the needs of these travelers. These businesses engaged in providing
supplies, horses, and oxen.
According to Black (1994), Native Americans were expected to change their way of life
and their cultures to those of mainstream America. This didn’t happen for many of these tribes.
Once the tribes moved west, the government realized their effort to assimilate the Native
Americans to the American culture was not working. Native Americans continued to practice
their religious ceremonies such as the Corn Festival and Sun Dance. Instead of the typical
mainstream practices of father, mother and children, extended family culture was practiced
(Welch, 2006). Native Americans were determined to retain their cultural values despite the
efforts of the government to destroy their traditional practices and way of life.
The General Allotment Act (24 Stat. 388), also known as the Dawes Act, was passed in
1887. This act was another attempt to acculturate and assimilate the Native Americans into white
society (Smith, 2000). Each household was given 160 acres of land. To protect the owner, this
land was to be held in trust for 25 years. That means that even though the household was allotted
160 acres, the owner didn’t take possession of the land for 25 years. In 1887, reservation lands

13
consisted of approximately 138 million acres. After each reservation was allotted the 160 acres,
the rest of the reservation land was declared surplus and opened up to non-Indian settlers for
homestead. By 1934, only 48 million acres of reservation land remained (Welch, 2006). The land
allocated to the Native Americans was not considered prime land, therefore farming and
ranching was very poor. Indian land owners were provided basic farming techniques to try and
compete with non-Indian settlers who received the more prosperous land (O’Brien, 1989).
The Indian Reorganization Act of 1934 (Wheeler-Howard Act - 48 Stat. 984 - 25 U.S.C.
§ 461) created federally sponsored tribal governments (Tootle, 1996). Although the Indian
Reorganization Act (IRA) recognized tribes as sovereign nations, it did not acknowledge the
tribal culture. Many tribes in this region accepted the IRA. There were also many tribes in the
nation who did not accept the IRA and were determined to follow their traditional ways (Welch,
2006). Tribes who accepted the IRA would develop new government structures for their
reservations. The new form of government would open up opportunities for the tribes to access
federal loans and federal assistance with tribal administration (Rosier, 2004). The IRA tribes
were to use constitutions established by the Bureau of Indian Affairs. Using a BIA-developed
constitution limited tribal control over tribal affairs (Smith, 2000), but it also provided for the
tribes to be recognized as sovereign nations. Other benefits of the IRA included encouragement
and promotion of economic activity as well as tribal self-governance (Arnold, 2004). The IRA
authorized the creation of tribal corporations. Most tribes adopted corporate charters. These were
developed by individuals who did not take into account the cultural form of government that
existed with tribes (Trosper, 1999). Most corporations were governed by a board of directors.
This meant that decisions did not require consensus of the community, which went against the
tribes’ values (Welch, 2006).

14
According to Cornell and Kalt (1992), in spite of the cultural disconnects, tribes, for the
most part, have operated fairly well under the IRA. An example would be the success of the
Apache tribes. Corporate leaders, who displayed strong leadership, were selected, following the
example of the IRA. Leaders demonstrated authority both at the administrative level as well as
the community level. Those who abused their authority were simply abandoned by the citizens.
Joining the cultural based structure and those of the government were keys to a successful
economic development environment for the Apache tribes.
During the 1940s and 1950s, the federal government attempted to dismantle the
reservation system. The government adopted policies design to terminate its responsibilities to
tribes (O’Brien, 1989). Reservations in New York, California, Florida, and Texas were among
the first to be identified for termination. Tribes included in the initial termination were the
Flathead, Klamath, Menominee, Potawatomis and the Turtle Mountain Band of Chippewa
(Welch, 2006). The economic impact of the proposed termination was profound as these
reservations were rich in resources. For example, the Menominee tribe in Wisconsin had rich
timber resources which provided a successful economy for the tribe. The land was acquired by
non-tribal members who wanted to capitalize on these resources (Trosper, 1999). Through
termination of the reservation, the Menominee tribe was vulnerable to the structure of a county
government. With the end to government funding, tribes were required to rely on state
appropriations, further limiting economic progression (O’Brien, 1989).
Taking of lands from the Mandan, Hidatsa, Arikara nation for the Garrison Dam in North
Dakota resulted in significant economic impact for that tribe. Over the years, lands of over 12
million acres were reduced to just over 1 million acres (MHA Nation, n.d.). Lost was the way of
life for the Mandan, Hidatsa and Arikara nation. Farm land and ranching were diminished. The
15
building of the Garrison Dam required flooding approximately 152,360 acres (MHA Nation,
n.d.). Communities, which were the center of the tribe’s economy, were lost to the flood.
Elbowoods was considered the main business community for the tribe. When it was flooded, lost
was the hospital and school. Other communities, such as Nishu, Red Butte, and Shell Creek, all
had churches, parks, and cemeteries that were loss to the flood. The loss of these communities
had a profound impact on the economies for the Mandan, Hidatsa, and Arikara nation as these
resources would never be replaced (MHA Nation, n.d.).
Efforts by tribal groups such as the National Congress of American Indians (NCAI), the
American Indian Movement (AIM), and the United Indians of All Tribes were groups that made
their voices heard in protest of termination. The NCAI, founded in 1944, worked closely with
tribes in protecting their treaty and sovereign rights. NCAI was diligent in informing the public
and congress on the rights of Native Americans (NCAI, n.d.). AIM, established in 1968, was an
organization that also fought for Native rights. Demonstrations, by AIM members, were held
throughout the United States protesting government rulings on the destroying of tribal culture
and Indian civil rights (O’Brien, 1989). The United Indians of All Tribes also became a voice in
the 1970s for the rights of Native people. Located in Seattle, Washington the United Indians of
All Tribes were able to bring attention to the needs of the Natives in the Seattle area and reclaim
a land base for them (United Indians of All Tribes, n.d.). In the 1970s, the federal government
acknowledged its acceptance of tribal self-government and its treaty responsibilities (Mathews,
2008).
According to the American Indian Higher Education Consortium (AIHEC) (1999), in the
last 40 years other events have impacted tribal economies. The creation of tribally controlled
community colleges (TCU) is one event that impacted tribal economies. Tribes looked at higher

16
education as a means of encouraging self-determination. In 1968, the Navajo Nation created the
first tribally controlled college. Today there are 36 tribal colleges. TCUs came about in order for
Native Americans to educate their own people in a culturally responsive and respectful way.
Tribal colleges were founded with a simple mission. According to Boyer (1992), they were
designed to prepare students for work, especially for work available in their own communities.
Tribal colleges work to strengthen the larger economic environment of their communities. By
2008, approximately 32 tribal colleges attained land grant status. Land grant status allows tribal
colleges to access research and extension programs offered by the United State Department of
Agriculture (AIHEC, 1999). As a land grant college, support is provided to colleges to offer
agricultural, science and engineering courses. Individuals who receive degrees in these particular
fields support tribal efforts toward becoming self sufficient.
Gaming was another major economic event that impacted tribes in the 1980s. The Indian
Gaming Regulatory Act (IGRA) was passed in 1988. The Act was passed for the regulation of
gaming operations on reservations. For some tribes, the success of gaming on their reservations
has resulted in being less dependent on the government (Rosier, 2003). Some tribes are more
successful than others with gaming. The success of the Seminole tribe is one example of a tribe
with strong economy resulting from its gaming ventures (Cattelino, 2004). Revenues from
gaming have allowed the Seminole tribe to subsidize ventures such as smoke shops and tourism
businesses. Gaming ventures have also attracted outside investors to the reservations. Outside
investors strengthen the economy of the reservations by investing resources in developing areas
such as infrastructure (Smith, 2000). Successful gaming ventures also attributed to lowering
unemployment rates, thus reducing the dependency on government programs.

17
High unemployment rates continue to be prevalent on most reservations and poverty
continues to be an issue. From the wealthiest tribes to the poorest reservations, the historical
events have all impacted the economies of every tribe. As tribes pursue their quest to become
truly sovereign nations, these events will continue to have an effect on them for years to come.
Economic Development on Reservations
Economic development on reservations is not just the development of businesses. It
includes development in every part of the environment, specifically family, health care, and
social services. Economic development is defined as increasing development of natural and
human resources and economic activity in a community (Cornell & Jorgensen, 2007; Smith,
2000). Smith (2000) indicated rural reservations throughout the United States face similar
economic development, social, health and cultural challenges. Lack of technology and
infrastructure are highly limited on reservations in addition to access to financial capital and
human resources. Many reservations in rural America are land rich but cash poor. However, the
land is underdeveloped. Undeveloped land leads to untapped resources for tribes (Wall &
Montonya, 2007). According to Smith (2000), reservations throughout the nation typically have
natural and human resources that are underutilized and underdeveloped. Indian Country has a
substantial labor force but tribes do not tap into these resources as a means to improve economic
development on reservations (Emery et al. 2006). The majority of jobs on the reservations are
with the tribal government, Bureau of Indian Affairs, schools, and a few private businesses. This,
coupled with startling high unemployment rates, causes the economic structures of Native
American reservations to differ considerably from non-reservation economies of similar
population or land area. Continuing high unemployment rates have lead to high rates of domestic
violence, alcoholism and poverty (Smith, 2000).

18
In the 1960s, the BIA dominated the decision-making process for tribes in the selection
of economic development strategies on reservations (Vinje, 1996). The decision-making process
was controlled through only funding projects the BIA thought was important. Strategies that
worked in small rural non-Indian communities were expected to work on reservations. When
specific types of funding became available to tribes, these would be the types of projects the tribe
would follow (Cornell & Jorgenson, 2007). This was the start of the manufacturing plant era on
reservations. Federal funding was provided to tribes to encourage firms, such as manufacturing,
to locate on reservations. An increase in business activity followed the development of
manufacturing plants. The development of manufacturing plants assisted in reducing
unemployment on reservations.
Turtle Mountain Manufacturing Corporation (TMMC) was incorporated in 1979 to
establish an economic enterprise on the reservation to reduce unemployment and to provide
economic stability for the Turtle Mountain Band of Chippewa. At its peak production TMMC
employed approximately 300 employees (TMMC, n.d.) Contracts with the US Department of
Defense allowed TMMC to manufacture trailers and metal fabricated assemblies (TMMC).
Sioux Manufacturing Corporation (SMC) was also created to reduce unemployment for the Spirit
Lake Nation. An estimated 250 employees worked at SMC during the 1970s and 1980s. A
manufacturer of camouflage systems, SMC also received a majority of their contracts through
the US Department of Defense (SMC, n.d.).
In the 1970s, tribes began to assert more authority and regulation of the types of
businesses and economic development that was conducted on their reservations (Vinje, 1996).
Self-determination efforts resulted in the development of tribal enterprises. This transition
towards taking more control over tribal administration and economic activities allowed tribes the

19
opportunity to begin taking over services historically provided by BIA, such as health care and
education. The Indian Financing Act of 1974 (25 U.S.C. §§ 1451-1544) was passed to promote
reservation businesses (Welch, 2006). Under the Act, tribal businesses were provided grants
under the Indian Business Development Grant program to be used as seed money for business
start ups. Assessment of the Aberdeen Area Office Indian Business Development Grant,
conducted from 1987 through 1992 by Robert McLaughlin, a financial and economic consultant,
indicated that 89% of Native business owners, who received an Indian Business Development
Grant, were outstandingly successful (McLaughlin, 1992).
The national economic downturn in the 1980s impacted reservations. Funding was cut
across all federal programs forcing the tribes to make some tough financial decisions. Funding
was also reduced for economic development programs. Tribes that had benefited from
government support in the 1970s struggled to maintain the programs it had created (Welch,
2006). The 1980s saw a change in funding by the government, more specifically in the area of
the manufacturing industry. While successful, manufacturing plants did not have the staying
power (Vinje, 1996). Manufacturing plants were no longer receiving support from the
government resulting in downsizing of the labor force. The government was no longer
advocating for manufacturing jobs on reservations (Tootle, 1996).
Support from the federal government continued to decline in the 1990s. During the
1990s, gaming became an important economic development tool for tribes (Vinje, 1996).
Gaming profits were used to supplement tribes programs. The Seminole tribe in Florida set the
precedence for tribal gaming when it won its court case against the state of Florida (Rosier,
2003). The case, Seminole Tribe of Florida v. Butterworth (1981) was important to Native
Americans as tribal sovereignty was finally being recognized. Exercising its right as a sovereign

20
nation, the Seminole tribe was able to expand its operations, which generated millions in revenue
(Rosier). Tribes such as the Cabazon Band of Mission Indians and the Mashantucket Pequot
have both become successful gaming tribes (Welch, 2006). Housing, education and infrastructure
on these reservations have all benefited from the revenues of gaming, decreasing federal support
for these programs.
A study conducted by the Harvard Project on American Indian Economic Development
identified three areas that contribute to economic development: sovereignty, culture, and
institutions (Jorgenson & Taylor, 2000). Sovereignty means that tribes are self-governing and
they have the same powers as federal and state governments to regulate their internal affairs.
Tribes who make their own decisions about what approaches to take and what resources to
develop were more likely to successful. An important aspect to maintaining tribes as sovereign
nations is to maintain culture and language. Sovereignty and culture are interdependent.
“Developing reservation economies is vital to sustaining and developing cultural identities”
(Smith, 2000, p. 19). In many instances economic activity outweighs cultural issues and cultural
development is not equal to economic development. Many tribes have exercised their
sovereignty by adopting commercial codes and independent judiciaries, and experience an
increase in economic activity (Keohane, 2006). Tribes are investing in themselves and their
economies are growing as a result.
Reservation communities are growing at a faster rate than other communities in North
Dakota. While the rest of the state is growing at an average of only 4.7%, the Native American
population is growing at 22.1% (US Census Bureau, 2010). Between 2000 and 2010, the
population for most of North Dakota reservations increased significantly. The Three Affiliated
Tribes population increased by 7%, whereas both the Spirit Lake Tribe and the Turtle Mountain

21
Band of Chippewa increased by 5% (US Census Bureau, 2010). In Rolette County, location of
the Turtle Mountain reservation, there were significant increases in older age groups. For
example, for ages 45 to 64 there was an increase of 32% (North Dakota State Data Center, 2010).
For most Native Americans, family ties are the reason they retire to their home reservations. It is
also common for Native Americans to have big families leading to increased population on
reservations. While the state of North Dakota has seen a significant outmigration of individuals
from 2000 to 2005, the reservations did not (US Census Bureau, 2010).
Individuals who are retiring to their home reservations are returning with basic needs.
The necessity for housing, health care and social services provides opportunities for
entrepreneurs to meet these needs. Employment opportunities are presented to those in the
construction and the health care field aiding in the expansion of economic development on the
reservation. Increasing populations for tribes can be viewed as positive. Several resources, such
as the US Department of Housing and Urban Development (HUD) Renewal Communities and
Entrepreneurial centers are available to meet the growing needs on the reservations.
In 2002, the Turtle Mountain Band of Chippewa was designated as a Renewal
Community by HUD. This permitted the tribe to encourage economic and community
development on the reservation (Turtle Mountain Renewal Community, n.d.). As a renewal
community, the tribe was eligible for tax incentives to stimulate growth and provide for
affordable housing.
The Standing Rock Sioux Tribe/Sitting Bull Community College Entrepreneurial Center
is another resource that is assisting the tribe in promoting economic development on the
reservation. Entrepreneurship plays a role in economic development in Indian Country (Emery,
2007). The Entrepreneurial Center was established to assist the reservation economy by creating

22
and expanding of small businesses. These small businesses provide employment opportunities
for members of the tribe. The center provides technical assistance, financial resources and
business incubator services to small businesses (Sitting Bull College, n.d.).
Emery (2007) identified many underutilized assets on reservations, such as: natural,
cultural, human and social capital, on reservations. Natural resources located on reservations in
North Dakota include forestry, water, land, minerals, and wind. Cultural resources include
language and religion (Smith, 2000). There continues to be a movement to integrate languages
that were nearly lost in the era of assimilation back into society through education. This in turn
increases the need for tribal members to become teachers, therefore impacting the economy of
tribes.
In traditional approaches to job and business development, these assets are typically
ignored. However, economic development is gaining a lot of attention in Indian Country not only
because of the casino wealth that is generated but also through the tribes owning tribal
enterprises (Emery, 2007).
Cornell and Kalt (1998) identified two different approaches to economic development.
The first approach was the “jobs and income” approach. Tribes develop businesses to reduce
unemployment and providing income to individuals. Many of these businesses are successful at
the beginning but typically fail because of no long range planning. The second approach was the
“nation-building” approach. This approach is to build a nation in which both businesses and
individuals succeed. By building an environment favorable to investors, businesses benefit from
the investments (Cornell & Kalt).
For many tribes, land is a valuable asset. Tribes sometimes have difficulty promoting
economic development because most land on reservations, held in trust by the BIA, cannot be

23
used as collateral. In addition, many tracts of land owned by Indians are ‘fractionated” as a result
of the Dawes Act (Clement, 2006). Over the years this land has been divided among heirs
numerous times making it unusable. Some of the tracts of land are as small as a CD case. In
order to grant permission for land use, whether for mineral extraction, wind energy development,
or other economically advantageous venture, all owners of the fractioned land must be contacted
for permission. This can be a very difficult task which impedes timely development.
Economic development for Native Americans in North Dakota is very different than
other ethnic minority groups. According to Tirado (2008), Native American tribe’s economic
conditions and outlooks have considerably changed. Emery et al. (2006) indicated a one-size fits
all approach to economic development will not work in Indian country. Approaches for
economic development used in mainstream America are not appropriate for Indian country
because of political and cultural characteristics unique to each reservation.
Tribal Colleges and Economic Development
Tribal colleges and universities (TCUs) have always played critical roles in reservation
economic development, starting with training students for jobs (Ambler, 1992). Tribal colleges
work to strengthen the larger economic environment of their communities. The reservations on
which most TCUs serve face high unemployment rates and low per capita income. The
unemployment rate on the Fort Berthold reservation (served by UTTC and Fort Berthold
Community College) has been as high as 69.99%. In 2005, 95% of students served at these two
TCUs were classified as low income (Paulson, 2005).
Culturally-Relevant Programs
TCUs exist to serve primarily Native American people, which are among the poorest
racial and culturally diverse groups in the nation. Tribally controlled community colleges came

24
about in order for Indian people to educate their own in a culturally responsive and respectful
way. They also provide postsecondary access to Native American students who might not
otherwise be able to attend college (Fann, 2002). TCUs differ from mainstream institutions in
their missions: (a) to rebuild, reinforce, and explore traditional tribal culture through specially
designed curricula, settings; while at the same time (b) addressing Western models of learning by
providing courses in traditional disciplines that are transferable to four-year mainstream
institutions (Tierney, 1992).
The history of TCUs is relatively short. The Navajo Nation founded the first TCU, Dine
College in 1968. It was followed by TCUs in California, North Dakota and South Dakota. Today
there are 37 tribally chartered colleges and three federally charted Native American colleges in
13 states (Kim, Crasco, & Weiner, 2005). These institutions serve over 30,000 students each year
(Boyer, 2002). They differ in several stages including development, structure, size and others.
Several studies (AIHEC, 1999, Boyer, 1997; Kim et al., 2005; O’Brien, 1992; Pavel,
Swisher, & Ward, 1995) indicated every one of the colleges is unique, reflecting the local,
economic, and cultural needs of the community and surrounding area it serves. However, TCUs
share some basic features. The majority are less than 30 years old, have small student bodies that
are mostly Native American, most are located on reservations, have open admission policies, and
began as two-year institutions. Additionally, 31 are accredited by regional accreditation agencies.
Each TCU offer associate’s degrees and most offer short-term certificate programs as well. They
are all similarly organized and 26 are funded similarly. Even though there is diversity among
them, it is possible to summarize their administration, community and student body, and
financial needs

25
In many ways TCUs are like their mainstream counterparts. However, TCUs are different
from mainstream institutions in respect to their dual missions: to rebuild and reinforce traditional
tribal cultures, using cultural responsive curricula and institutional settings. Concurrently they
work to address Western models of learning by providing courses that will be transferable to
mainstream four-year institutions (Tierney, 1992). Another factor that sets TCUs apart from
mainstream institutions is their ability to provide the personal and cultural attention to the
students served thus aiding the students in overcoming the economic and social barriers to
postsecondary success (Benham & Stein, 2003; Federico Cunningham & Parker, 1998). TCUs
are characterized by their family-like atmosphere and strong personal relationships between
students, instructors, and staff (Austin, 2005; Boyer, 1997; Tierney, 1992).
Tribal colleges are unique in that they combine personal attention to students with
cultural relevance in such a way that it encourages Native Americans, especially those living on
reservations or geographically isolated areas, to overcome the obstacles to obtaining a
postsecondary degree (AIHEC, 1999, Austin, 2005). Obstacles to obtaining a postsecondary
degree lie within the context of their socioeconomic circumstances. Their uniqueness reflects the
local communities’ cultural identity. Many of the institutions are involved in a far-reaching range
of community efforts-including basic education, economic development, and counseling
services. TCU curricula are designed from a Native American perspective, and the individual
courses reflect this effort.
Roles in Reservation Economic Development
Another role TCUs play in their communities is one of economic development. Many
colleges offer entrepreneurial business courses and sponsor small business economic

26
development centers to encourage private sector growth in the TCU service area (Casey, 1997).
These sites offer technical assistance and advice to tribal members.
The tribal colleges also have hosted strategy seminars and provided leadership, relevant
curricula and a data base of economic information. By expanding their current involvement in
these arenas, development strategists believe that tribal colleges can serve their communities
better (Ambler, 1992). Tribal colleges were founded with a simple mission: they were expected
to prepare students for work, especially for work available in their own communities (Boyer,
1992).
According to Boyer (1992), reservation economic development requires more than
skilled employees. It also requires the presence of a healthy business climate, outside investment,
wise use of natural resources and support to tribal entrepreneurs. Cunningham (2000), through a
collaborative effort between the American Indian Higher Education Consortium (AIHEC) and
the American Indian College Fund (AICF), prepared a report that described some of the
economic development efforts of the tribal colleges. The author indicated tribal colleges are at
different stages in the process of assisting and sustaining local community development. Tribal
colleges all play important roles in the future development of Native American reservation
communities, especially in establishing the foundation for future growth through skills
development, technical assistance, and other efforts.
Cunningham (2000) indicated by building on their strengths as community centers and
support institutions, tribal colleges actively promoted entrepreneurship in a number of ways.
Many tribal colleges match their business curricula to existing local economic needs. In doing so,
they link entrepreneurship with housing, the environment, health and culture.
27
Beyond education and training, tribal colleges promote entrepreneurship and small
business growth in their communities through workshops and leadership development. They
deliver technical assistance via small business centers and other outlets (Bly, 2005). Many of the
tribal colleges maintain community entrepreneurship initiatives that reach beyond their core
education programs. A variety of these initiatives reveals the extent of entrepreneurship
development approaches that tribal colleges pursue (Bly, 2005).
Tribal colleges are offering the reservations and tribal communities the chance to build
knowledge, skills, confidence, and pride in a way not possible for non-Indian institutions to offer
(Boyer, 1997). Colleges try to match curricula to existing local economic needs, but they also try
to develop programs that encourage the creation of new small businesses and other
entrepreneurial activities (Cunningham, 2000).
In a study conducted by Baker and Lynch (1994), research indicated education plays a
critical role in economic development. Education was regarded as a very serious and compelling
force for tribal improvement. Research findings also indicated each organization is different and
for economic development to be successful it must combine the governance of the tribe and
education.
Determining Economic Success
According to Cornell and Kalt (1998), successful economic development depends on
three important factors: sovereignty, institutional strength and strategies. Tribes that effectively
exercised their right of sovereignty were more likely to have successful economic development
on their reservations then those who did not (Capriccioso, 2007). According to Cross (2009),
efficient problem solving is important within a sovereign society. Besides being culturally
sensitive, the institution must also have the full trust and faith of the people they are governing.

28
Jorgenson and Taylor (2000) indicated poverty in Indian Country is a political problem not an
economic one. Strategies with policies must also be in place to have successful economic
development on reservations (Cornell & Kalt, 1998). According to Emery et al. (2006), most
institutions implement models that are most often used outside Indian Country. These models do
not consider the social and financial issues that are unique to reservations.
According to Grobsmith (1981), business development on reservations is difficult for
individual Indians because of the collateral needed to obtain loans and because of the lack of
management training and experience that prepares one for beginning business. Sandefur (1989)
indicated many tribes have attempted to develop their own businesses or attract private business
to the reservation. Tribal businesses have either deteriorated or remained stagnate because of a
lack of business experience or because of the difficulties in marketing goods produced on the
reservation. Most state laws do not protect private businesses intending to locate on reservations,
therefore inhibiting these efforts to spurn economic development.
Cornell (2006) focused his research on five factors that can have a significant effect on
business performance that are sometimes ignored in building successful Native owned
businesses. The author indicated these factors included: clarity about enterprise goals, effective
management of the politics-business-connection, the purpose, power, and composition of
enterprise boards, independent and reliable resolution of disputes, and the critical need to educate
the community about enterprise goals and activity. Cornell’s (2006) research found successful
businesses also depended on having adequate start-up funds, a supply of good workers, smart
management, adequate infrastructure, a dose of good fortune, and a host of other things if they
were to survive and yield the benefits they so often promised. By addressing these five issues,

29
Native businesses significantly increased their chances of building sustainable and productive
enterprises.
A statistical analysis was conducted by Jorgenson and Taylor (2007) from surveys of 70
respondents on a number of questions including: does using technical assistance help firms, does
employing tribal or other Indian workers increase firms’ success, and does advertising more
help. The authors indicated separating politics from business were among the key findings, as
well as, tribal ownership of enterprises were linked with reducing success in the enterprise. Other
findings concluded there was no correlation between advertising and success and management
turnover did not affect success.
Recent research from the North Central Regional Center for Rural Development,
Heartland Center for Leadership Development, and United Tribes Technical College (Emery et
al. 2006) indicated successful economic development indicators are those that are considered to
be most valued by those on reservations. These indicators are most often not necessarily always
viewed in a monetary way. For example, there are many untapped assets, including natural,
human, and social capital assets. In traditional approaches to job and business development,
these assets are typically ignored. The author’s research indicates Indian Country does have
successful entrepreneurs.
In a case study report conducted by Mantonya and Wall (2007) in conjunction with
United Tribes Technical College, the communities that were studied were found to have a
positive economic environment. The purpose of the study was to determine best practices in
Indian Country and to develop a tool for tribal administrations to use in their economic
development efforts. Teaching materials were derived from the study were used by tribal
planners in the Great Plains as a means to expand on their economic development efforts.

30
Approximately five reservations, located in the Great Plains were part of the study. These
reservations included: Flathead, Turtle Mountain, Wind River, Winnebago, and Rosebud
reservation. The methodology of the research was conducted using interviews and surveys.
According to Mantonya and Wall (2007), the research found 25 characteristics of reservations
positioned for sustainable economic development success (see Table 1).
Table 1
Characteristics of Reservations Positioned for Sustainable Economic Development Success
Capacity Characteristics Cultural Retention Balance between traditional wisdom and new approaches
Recognition of the importance of cultural relevance
Sovereignty Commitment to economic self sufficiency
Recognition of the importance of sovereignty
Evidence that the tribe is discarding “the BIA mentality.”
Leadership Proactive council that works in tandem with economic development
professionals.
Separation of politics and business.
Continuity in tribal government.
Tribal commitment to supporting entrepreneurial efforts and encouraging
entrepreneurial spirit.
In-place structure guaranteeing an autonomous judiciary.
Importance of having “champions” for community and economic
development.
Strategic Agenda Evidence of an investment culture.
Adoption and/or creation of a uniform commercial code.
Positioned to take advantage of incentive programs such as 8A, 638.
Use of failures and successes to build collective knowledge about managing
enterprises.
Evidence of a strategic focus in both economic and community development.
Willingness to collaborate within the tribe and with other entities.
Proactive stance with respect to both internal and external opportunities.
Strong Local Economy Multiple revenue streams created through diversified economic strategies.
Keen awareness of internal assets combined with smart use of external
resources.
Emphasis on the value of spending dollars locally.

31
Table 1. Characteristics of Reservations Positioned for Sustainable Economic Development
Success (continued)
Capacity Characteristics
Emphasis on Community
Capitals
Attention to multiple capitals that include social and cultural networks,
human capital, financial capital and infrastructure.
Strategy to develop tribal financial institutions and/or build successful
partnership with external financial institutions.
Support for child care, K-16 and lifelong education.
Importance of strong, locally-based institutions (health and wellness, socials
services, education, etc.).
According to Mantonya and Wall (2007), entrepreneurial activity was flourishing on the
reservations studied. Interviews were conducted with local individuals to learn what their tribal
organizations and administrations were doing, if any, to generate economic development on the
reservation. The research indicated businesses that showed signs of deterioration or stagnation,
by implementing the 25 characteristics derived from this study, would contribute to
strengthening the business.
Native Entrepreneurs
Goreham and Rathge (1991) conducted a study in which interviews were conducted with
21 Native American entrepreneurs who lived on North Dakota reservations. The purpose of the
study was to determine factors associated with entrepreneurial success on the reservations. The
research indicated Native entrepreneurs in North Dakota were found to be most successful if they
had knowledge, experience, and managerial skills along with aggressive business attitudes. Work
related skills and previous education were considered to be most important for the entrepreneur.
Malkin and Aseron (2007) attested to these findings through their own research. The authors
conducted extensive research on two reservations in South Dakota. The authors indicated in
order for a business to grow and be sustainable, it must have critical skills, like those mentioned

32
by Goreham and Rathge, necessary to be successful. These skills included expanding on
entrepreneurship education through various programs available in elementary and high schools.
In a study conducted by Goreham, Rathge and Hess (1994) the authors indicated
reservations in the Great Plains needed to find other economic development avenues to pursue
because of the low numbers of Native American businesses compared with non-Native owned
businesses. Native Americans represented the largest minority group in the Great Plains and
accounted for more than 76,000 residents in the states of North Dakota and South Dakota. The
Native American population comprises 7.1% of the population, however they owned less than
1.9% of the businesses in the two-state area. In 2010, the U. S. Census Bureau reported Native
Americans once again represented the largest minority group in the Great Plains. In North and
South Dakota there were approximately 108,000 residents comprising of nearly 8% of the
population (U.S. Census Bureau, 2010).
The U.S. Census Bureau, Survey of Business Owners (2007) showed that business
ownership rates are far lower for Native Americans than for Americans as a whole. In the states
of North and South Dakota, between 2002 and 2007, there was a significant increase in Native
owned businesses. For North and South Dakota there was an increase of 18% and 32%
respectively. An increase in receipts was also shown for these states of 75% and 56%
respectively. These statistics indicate a significant growth trend among Native owned businesses
(Figure 3).
Jorgenson and Taylor’s (2000) research indicated tribal enterprises that are free from
political pressure tend to be more successful. Tribal enterprises that are run by tribes that have
control over their own government are more likely to succeed. The authors indicated tribes that

33
have government structures that are tailored after mainstream systems are more likely to be
economically successful. In a 1992 study by Cornell and Kalt, the authors agreed with the
findings of Jorgenson and Taylor by indicting Native owned businesses, whether private or
tribally owned, who are isolated from tribal administration political interactions are more likely
to be successful.
Figure 3. Growth in Native owned businesses (U.S. Census Bureau, 2002-2007).
Jahrig (1996) pointed out that Native American businesses have succeeded at only one-
tenth the average for all new American business start-ups. According to Robinson and Hogan
(1994), different cultural values may be the cause for this wide range. Native Americans have
always been barters and traders. For an entrepreneur, these traits are vital in conducting business
(Jahrig, 1997). In Native American culture it is respectful if someone gives you something, you
give something back. Robinson and Hogan (1994) indicated mainstream America’s business
culture is driven by materialistic success. Native Americans on the other hand view family
values and community support as being more important. In Jahrig’s 1997 study, the author
34
indicated that Native Americans are givers rather than takers. Many Native American
entrepreneurs tend to frown upon materialistic success and want to have the support of the
community. According to Goreham and Rathge (1991), although having community and tribal
support is very important in having a successful business, this support is very limited due to
many issues facing Native owned businesses; jealousy being one of them. There is a reluctance
to support each other. Another reason for the lack of community support is that many times
individuals from another tribe live on a reservation that they are not enrolled in. This makes it
difficult for entrepreneurs to gain business deals.
According to Jahrig (1997), sometimes community and business development is not
always highly regarded on the reservation. While some tribal councils encourage business
development, there are still those who actively discourage it. Research conducted by Goreham
and Rathge (1991) indicated tribes are changing their attitudes toward business and economic
development and the effect it has on their reservations. Native owned-businesses are increasing.
The 2002 Census Bureau report (2002) indicated an 18% increase of Native American owned
businesses. Emorie Davis-Bird, the Economic Development planner for the Blackfeet Tribe and
enrolled member of the Blackfeet Tribe indicated that Native Americans are moving back to the
reservation and starting businesses (Jahrig, 2007).
In their study, Malkin, Dabson, Pate, and Mathews (2004) found “entrepreneurship
development has the potential to contribute positively to wealth creation, economic development,
and poverty easing and can be compatible with Native traditional cultures” (Conclusion section,
para. 1). The author’s found significant barriers in Native communities to include political,
financial, and legal issues. Understanding tribal sovereignty and the alleged notion of non-
Natives finding it difficult to conduct businesses on the reservations have limited

35
entrepreneurship. The legal relationship between state and tribal government is complicated and
jurisdiction issues continue to be argued about on reservations. State laws differ widely
throughout Indian Country. “State laws cannot be enforced in Indian country and state courts are
without jurisdiction to hear lawsuits brought by non-Indians against tribes, tribal entities, and
tribal members about matters that occur on reservations” (Malkin et al., 2004, p. 25). These
issues add to the already normal challenges facing many entrepreneurs on reservations.
Access to capital is another significant barrier found to limit entrepreneurship on
reservations. First Nations Development Institute (FNDI) (1998) conducted a region wide study
on accessing commercial financing by Native owned businesses. The survey results indicated the
lack of access to capital discourages entrepreneurs and limits business development on
reservations. The inability to access mainstream financial institutions is a huge problem for those
entrepreneurs seeking to start or expand a business on a reservation. In comparison with non-
Native businesses, Native communities do not have the opportunity to access capital, credit, and
other financial services resulting in the deterioration and stagnation of reservation businesses
(Malkin et al., 2004).
For many tribes, land is a valuable asset. Tribes sometimes have difficulty promoting
economic development because most land on reservations, held in trust by the BIA, cannot be
used as collateral. In addition, many tracts of land owned by Indians are ‘fractionated” as a result
of the Dawes Act (Clement, 2006). Over the years this land has been divided among heirs
numerous times making it unusable. Some of the tracts of land are as small as a CD case. In
order to grant permission for land use, whether for mineral extraction, wind energy development,
or other economically advantageous venture, all owners of the fractioned land must be contacted
for permission. This can be a very difficult task which impedes timely development.

36
According to Adamson and King (2002), limited business expertise, lack of marketing
knowledge, business plan development, credit and general business practices, are also significant
barriers for Native entrepreneurs. The authors found that many prospective Native entrepreneurs
often lack the necessary business knowledge and management skills to successfully start and
grow businesses. Educating entrepreneurs with basic business skills will help to promote
community and economic development on reservations.
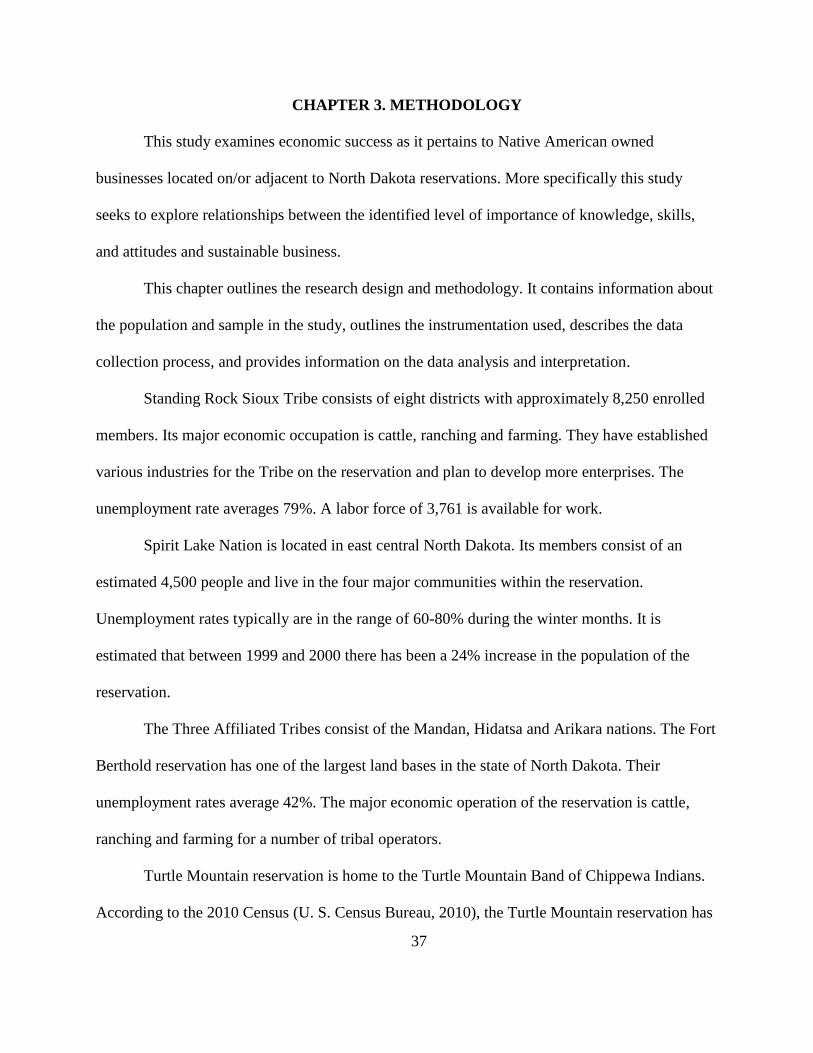
37
CHAPTER 3. METHODOLOGY
This study examines economic success as it pertains to Native American owned
businesses located on/or adjacent to North Dakota reservations. More specifically this study
seeks to explore relationships between the identified level of importance of knowledge, skills,
and attitudes and sustainable business.
This chapter outlines the research design and methodology. It contains information about
the population and sample in the study, outlines the instrumentation used, describes the data
collection process, and provides information on the data analysis and interpretation.
Standing Rock Sioux Tribe consists of eight districts with approximately 8,250 enrolled
members. Its major economic occupation is cattle, ranching and farming. They have established
various industries for the Tribe on the reservation and plan to develop more enterprises. The
unemployment rate averages 79%. A labor force of 3,761 is available for work.
Spirit Lake Nation is located in east central North Dakota. Its members consist of an
estimated 4,500 people and live in the four major communities within the reservation.
Unemployment rates typically are in the range of 60-80% during the winter months. It is
estimated that between 1999 and 2000 there has been a 24% increase in the population of the
reservation.
The Three Affiliated Tribes consist of the Mandan, Hidatsa and Arikara nations. The Fort
Berthold reservation has one of the largest land bases in the state of North Dakota. Their
unemployment rates average 42%. The major economic operation of the reservation is cattle,
ranching and farming for a number of tribal operators.
Turtle Mountain reservation is home to the Turtle Mountain Band of Chippewa Indians.
According to the 2010 Census (U. S. Census Bureau, 2010), the Turtle Mountain reservation has
38
approximately 8,669 members living on the reservation. The Bureau of Indian Affairs census
(2010) estimates a total membership of the Chippewa as 30,000. The tribe experiences
unemployment rates of about 50-60% at various times during the year (U.S. Census Bureau,
2010).
The credibility of a study depends extensively on the quality of the research design, data
collection, data management, and data analysis (Creswell, 2002).
Research Design
According to Creswell (2002), quantitative research is used to study research problems
requiring a description of trends or an explanation of the relationship among variables. Creswell
(2002) indicated in this type of study, the research problem can best be answered by a study in
which the researcher seeks to establish the overall tendency of responses from individuals and to
note how this tendency varies among people. The primary input for the design chosen for this
research was the literature review and another study in entrepreneurship (Sun, 2004). A
quantitative descriptive method design, using correlation research, was used when conducting
research on this project. This research method was chosen to obtain first hand data from the
respondents to formulation rational and sound conclusions and recommendations for the study
(Creswell, 2002). The research included a survey instrument, which was used to explore
relationships between the identified level of importance of knowledge, skills, and attitudes and
sustainable business.
The research design measured successful Native American business owner’s belief
concerning the importance of the knowledge areas relating to Native American environmental
factors, planning and organizing, self-leadership, interpersonal leadership, and systems
management. Details of the research design can be found in Figure 4.

39
Figure 4. Research design overview.
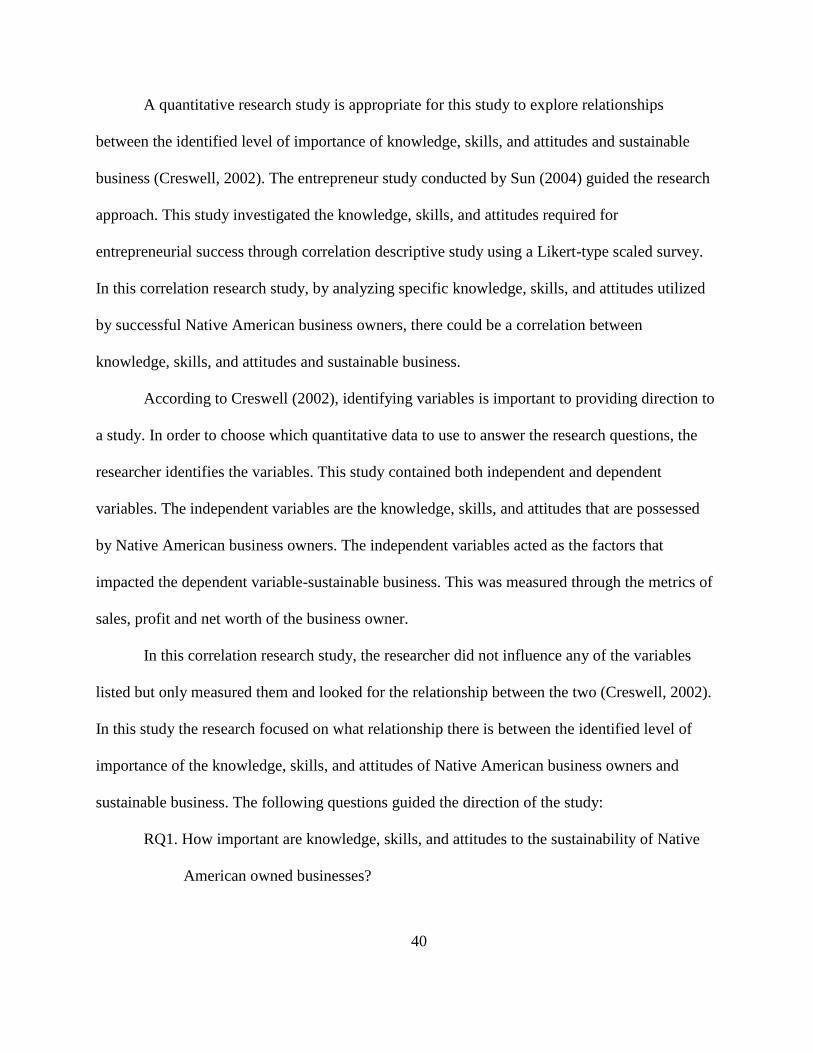
40
A quantitative research study is appropriate for this study to explore relationships
between the identified level of importance of knowledge, skills, and attitudes and sustainable
business (Creswell, 2002). The entrepreneur study conducted by Sun (2004) guided the research
approach. This study investigated the knowledge, skills, and attitudes required for
entrepreneurial success through correlation descriptive study using a Likert-type scaled survey.
In this correlation research study, by analyzing specific knowledge, skills, and attitudes utilized
by successful Native American business owners, there could be a correlation between
knowledge, skills, and attitudes and sustainable business.
According to Creswell (2002), identifying variables is important to providing direction to
a study. In order to choose which quantitative data to use to answer the research questions, the
researcher identifies the variables. This study contained both independent and dependent
variables. The independent variables are the knowledge, skills, and attitudes that are possessed
by Native American business owners. The independent variables acted as the factors that
impacted the dependent variable-sustainable business. This was measured through the metrics of
sales, profit and net worth of the business owner.
In this correlation research study, the researcher did not influence any of the variables
listed but only measured them and looked for the relationship between the two (Creswell, 2002).
In this study the research focused on what relationship there is between the identified level of
importance of the knowledge, skills, and attitudes of Native American business owners and
sustainable business. The following questions guided the direction of the study:
RQ1. How important are knowledge, skills, and attitudes to the sustainability of Native
American owned businesses?

41
RQ2. To what extent are Native American environmental factors, knowledge, skills, and
attitudes significant for emerging verses mature Native American owned
businesses?
Population and Sample
The population were all Native American business owners located on/or adjacent to the
four reservations in North Dakota. These are; Spirit Lake, Standing Rock, Fort Berthold and
Turtle Mountain. Each tribe is unique linguistically, socially, and culturally.
A challenge for most reservations is the rural location in the state. These reservations are
isolated from benefits that are offered by larger communities such as major shopping centers. For
example, the Turtle Mountain reservation is located over 100 miles to the closest major shopping
center and services. Spirit Lake is located 20 miles from the nearest hospital thus hindering
immediate health care. On the Fort Berthold reservation, many outlying communities have to
drive 150 miles one-way for any type of service. The Standing Rock reservation is 72 miles from
the nearest metropolitan area. In order for individuals to receive specialized technical support
they must pay for the support to come to the reservation.
A master database of all operating Native American owned businesses was compiled for
each North Dakota reservation. When compiling data, all methods to obtain lists of current
Native American owned businesses operating on/or adjacent to the reservations in North Dakota
were exhausted. Contact was made with individuals engaged in tribal economic development
(e.g., tribal planners), Tribal Employment Rights Office (TERO) and the Tribal business
licensing offices to request assistance in identifying Native American businesses located on the
reservation. Other resources included the State Data Center at North Dakota State University and
the Minneapolis Federal Reserve Bank located in Minneapolis, Minnesota.

42
This study intended to select as large a sample as possible from the population or from
the individuals available (Creswell, 2002). According to the U.S. Census Bureau (2010), there is
an estimated 800 Native American owned businesses located in the state of North Dakota. The
master database listed approximately 384 Native American owned businesses located on/or
adjacent to the four reservations in North Dakota, which all were sampled. The larger the sample,
the more similar it will be to the population. Creswell (2002) stated in a correlation study, such
as this one, the group needs to be of adequate size for use of the correlation statistic, such as N =
30; larger sizes contribute to less error variance and better claims of representativeness.
The Native American business owners selected to participate in the study completed a
survey to explore relationships between the identified level of importance of knowledge, skills,
and attitudes and sustainable business. The results of the survey were then translated into a form
appropriate for analysis by a computer (Fowler, 2009). The computed values were compared to
the Likert scale for data interpretation using SPSS. Relevant literature was also used to support
the gathered data (Fowler, 2009). Further explanation of the justification for use of a survey is
addressed in the data collection section of this chapter.
Survey Instrument
A survey was designed to obtain input from Native American business owners on North
Dakota reservations. Respondents answered questions that measured how important they
perceived a variety of knowledge, skills, and attitudes that are often required for operating a
successful business.
The research instrument is a questionnaire-type survey (Appendix A). Literature research
relating to Native American owned businesses was used as well as questions derived from the
research instrument used by Sun (2004). Permission was received from the author for the use of
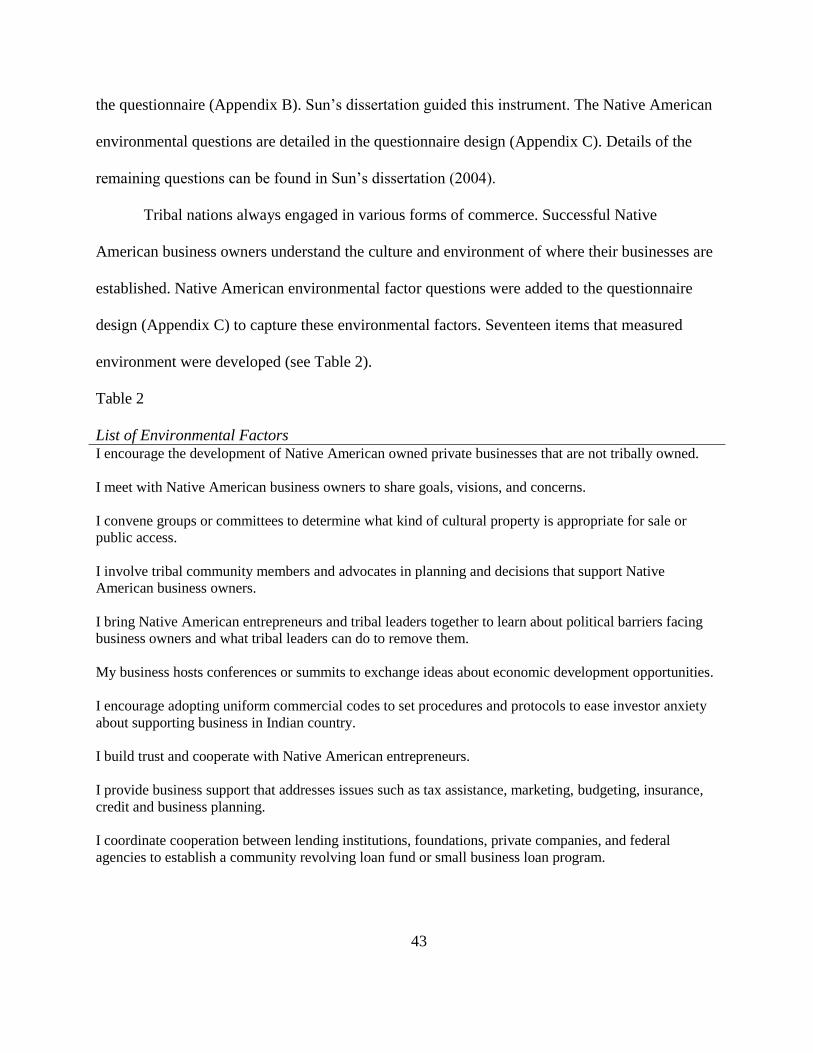
43
the questionnaire (Appendix B). Sun’s dissertation guided this instrument. The Native American
environmental questions are detailed in the questionnaire design (Appendix C). Details of the
remaining questions can be found in Sun’s dissertation (2004).
Tribal nations always engaged in various forms of commerce. Successful Native
American business owners understand the culture and environment of where their businesses are
established. Native American environmental factor questions were added to the questionnaire
design (Appendix C) to capture these environmental factors. Seventeen items that measured
environment were developed (see Table 2).
Table 2
List of Environmental Factors I encourage the development of Native American owned private businesses that are not tribally owned.
I meet with Native American business owners to share goals, visions, and concerns.
I convene groups or committees to determine what kind of cultural property is appropriate for sale or
public access.
I involve tribal community members and advocates in planning and decisions that support Native
American business owners.
I bring Native American entrepreneurs and tribal leaders together to learn about political barriers facing
business owners and what tribal leaders can do to remove them.
My business hosts conferences or summits to exchange ideas about economic development opportunities.
I encourage adopting uniform commercial codes to set procedures and protocols to ease investor anxiety
about supporting business in Indian country.
I build trust and cooperate with Native American entrepreneurs.
I provide business support that addresses issues such as tax assistance, marketing, budgeting, insurance,
credit and business planning.
I coordinate cooperation between lending institutions, foundations, private companies, and federal
agencies to establish a community revolving loan fund or small business loan program.

44
Table 2. List of Environmental Factors (continued)
I establish a way for local business owners to work together to lower insurance and marketing costs.
I facilitate cooperation between local tribal colleges, tribal education centers, or business development
centers to help business owners develop sound and creative business plans.
I situate technology within overall nation-building goals as one tool to improve economic development on
tribal lands.
I support partnerships between tribal governments, tribal colleges, business development centers, business
owners, and tribal members to help business owners in their business development efforts.
I establish collaborative relations between local K-12 schools, business owners, and community members
to optimize and enhance technology skills.
I form committees or groups to establish an enforceable copyright or trademark registration system to
protect Native American business owners from unlawful Internet reproducing of tribal intellectual
property.
I set up mentoring programs among various tribal business owners to provide computer support such as
Web site development, Internet sales, trademark or copyright protection.
Questionnaire Development
The survey was divided into six sections: environmental factors, planning and organizing,
self leadership, interpersonal leadership, systems management, and success measures. Each
section was designed to identify the indicators of successful economic development on
reservations, address why some businesses develop economically while others remain stagnant
or deteriorate, and what knowledge, skills, and attitudes do Native American business owners
need to be successful.
Respondents answered 60 questions that measured how important they perceived a
variety of knowledge, skills, and attitudes that are often required for operating a successful
business. There were 17 questions addressing the environmental factors, 10 questions for
planning and organization, six questions for self-leadership, eight questions for interpersonal
leadership, and 11 questions for systems management. Under the success measures, eight

45
questions were asked. Nine demographic questions pertaining to years of operation, gender,
number employees, revenue, position in the business, education level, and hours worked in the
business were also part of the survey.
Instrument Scales
Sun’s instrument used a 5-point Likert scale where the scales were labeled from A
through E. For this study the scales were labeled 1 through 5. The score was calculated from the
responses. The “degree of importance scale” was defined as: (a) very unimportant; (b)
unimportant; (c) neither unimportant nor important; (d) important; and (e) very important. The
“to what extent scale” was defined as: (a) never; (b) rarely; (c) sometimes; (d) often; and (e)
always. The “satisfaction of performance scale” was designed as follows: (a) very dissatisfied;
(b) somewhat dissatisfied; (c) neither satisfied nor dissatisfied; (d) somewhat satisfied; and (e)
very satisfied.
Validity
To test the validity of the instrument, it was pilot tested to 30 Native American business
owners not part of the main sample. The survey instrument validation was also increased by the
correlational coefficient test that was conducted by Sun (2004). A correlational coefficient of
0.857 was found and created the acceptability of construct validity.
Pilot Test Procedures
A letter was sent to those selected inviting them to be part of the pilot test (Appendix D).
The participants were provided a copy of the research cover letter and were requested to fill out
the survey and to provide comments on a comment form (Appendix E). Participants were asked
to provide comments to the following questions: (a) Did the cover letter and questionnaire
clearly indicate the purpose of the survey? (b) Were the instructions clear? (c) Is each of the

46
questions clearly written? (d) Were there any items unclear or ambiguous? (e) Did you find any
problems or difficulties in answering the questions? (f) Was the scale easy to use? (g) How long
did it take to complete? and (h) Was the length and structure of the questionnaire satisfactory?
Approximately 20 participants responded to the pilot test.
Pilot Test Results
For this study, data from the pilot test of the survey was inputted into the computer using
SPSS to compute Cronbach’s alpha. Cronbach's alpha splits all the questions on the instrument
every possible way and computes correlation values for them all (Salkind, 2008). The computer
output will generate one number for Cronbach's alpha. According to Radhakrishna (2007), a
reliability coefficient (alpha) of .70 or higher is considered acceptable reliability. Cronbach's
alpha for the survey instrument (Appendix F) was reported as 0.926.
Based on the feedback of those responding to the pilot test, one spelling error was
corrected on the cover letter. There were no changes to the instrument.
Data Collection
Approval was received from the committee and from the institutional review board prior
to conducting the research. The data collection process was to identify the four North Dakota
tribes who were willing to participate in the project. This was done by personally making a
telephone call to the tribal chairman on each reservation and explaining the research to be
conducted on their reservation. Official letters requesting permission to conduct research on the
reservations were sent to the tribal administration (Appendix G). If a tribe had a tribal IRB
office, a request was made to them as well. Tribal resolutions and/or letters of approval were
obtained from each tribe (Appendix H). It should be noted the Three Affiliated Tribes gave a
verbal approval through Chairman Tex Hall on July 6, 2012. Contact was then made with

47
individuals engaged in tribal economic development (e.g., tribal planners), Tribal Employment
Rights Office (TERO), and the Tribal business licensing offices to request assistance in
identifying Native American businesses located on the reservation. Business owners who operate
on a reservation must obtain an operating license. Licensed businesses are issued an identifier
code. The lists of businesses were entered into a database to create a master list of all 384 Native
American owned businesses located on/or adjacent to North Dakota reservations.
The 384 Native American owned businesses located on/or adjacent to the four
reservations in North Dakota were mailed the survey along with a cover letter which explained
the purpose and value of the study. The cover letter also stressed the importance of voluntary
participation and anonymity of the study (Appendix I). To reduce the rate of non-response, a
self-addressed stamped envelope was provided to the participants. Of the 384 businesses
surveyed, 52 (13.54%) surveys were returned undeliverable for various reasons. The remaining
332 viable business addresses were sent a reminder letter one month after the initial mailing
(Appendix J). Of the remaining 332 participants, 194 completed the survey for a response rate of
50.5%.
Data Analysis and Interpretation
The main components for analysis of the study included descriptive, factor analysis,
correlational analysis, t-tests, and multiple regression analysis. Descriptive and variance analysis
were used for questions pertaining to years of operation, gender, position in the business,
business ownership, number of employees, education, and hours worked in the business. This
information was used to determine the simple summaries about the sample population. A
descriptive analysis helped summarize the overall trends or tendencies of data relating to what
are indicators of successful economic development on reservations. The analysis provided an

48
understanding of how varied the scores might be, and provided insight into where one score
stands in comparison with others. The results of the descriptive and variance analysis are
discussed in Chapter 4.
Multiple regression and correlation analysis was conducted for the remaining questions.
Results from this survey were analyzed to establish potential correlations among how important
each knowledge, skill or attitude is perceived by the respondent and the level of success in
operating a business. The Pearson product-moment correlation statistical technique was chosen
for this study because it described and measured the degree of relationship between the two
variables. Multiple regression analysis was used to determine if there was a linear relationship
between the dependent variable (sustainable business) and the independent variables
(knowledge, skills, and attitudes). Independent samples t-tests were run to determine if there was
a statistically difference between emerging versus mature Native American owned businesses.
For this correlation research project, SPSS was used to analyze the relationship between
two variables, the identified level of importance of knowledge, skills, and attitudes and
sustainable business. When using the Pearson correlation statistic, the data for this study was
assumed to be normally distributed. The correlation value was computed using SPSS as indicated
previously. This indicated whether the coefficient statistics are statistically significantly
correlated at the p < .05 and p < .01 levels (Creswell, 2002).
Study Instrument
As indicated earlier the entrepreneur study conducted by Sun (2004) guided the research
approach. This study investigated the knowledge, skills, and attitudes required for
entrepreneurial success through correlation descriptive study using a Likert-type scaled survey.

49
The data analysis from this study found some inadequacies that indicated this study was
significantly different from the approach Sun took.
Sun’s (2004) study identified four factors as being important for entrepreneurs: Planning
and organization, systems management, self-leadership, and interpersonal leadership. Because
Sun did not test items for fit within the four factors, a factor analysis was run to determine if the
items could be reduced and to identify potential clusters. Factor analysis using Varimax rotation
was conducted to verify this (see Table 3).
Factor Analysis-Knowledge, Skills, and Attitudes-Importance
The analysis found the factors did not load the way Sun indicated they would. Some
loaded correctly, while some did not. Table 3 shows that 10 items cross-loaded and are listed at
the bottom of the table. These items did not pertain to this study therefore were removed. Table 3
provides the results of the analysis which indicated a new set of items to be used for the four
factors. As can be seen in Table 3, eight items were associated with planning and organization
factor, six items with the systems management factor, four items with interpersonal leadership
factor, and five items with self-leadership factor.
The final factor loadings for the 35 questions relating to the relationship between
knowledge, skills, and attitudes and successful Native American owned businesses are listed in
Table 3. The analysis yielded four factors explaining a total of 60.950% of the variance for the
entire set of variables. The variables account for 61% of all variance in all the answers
respondents provided which would indicate there could be four factors called planning and
organization, systems management, interpersonal leadership, and self-leadership. Factor 1
was labeled planning and organization due to the high loadings by the following factors: (a) I
understand how financial statements depict my business; (b) I exhibit a high degree of technical
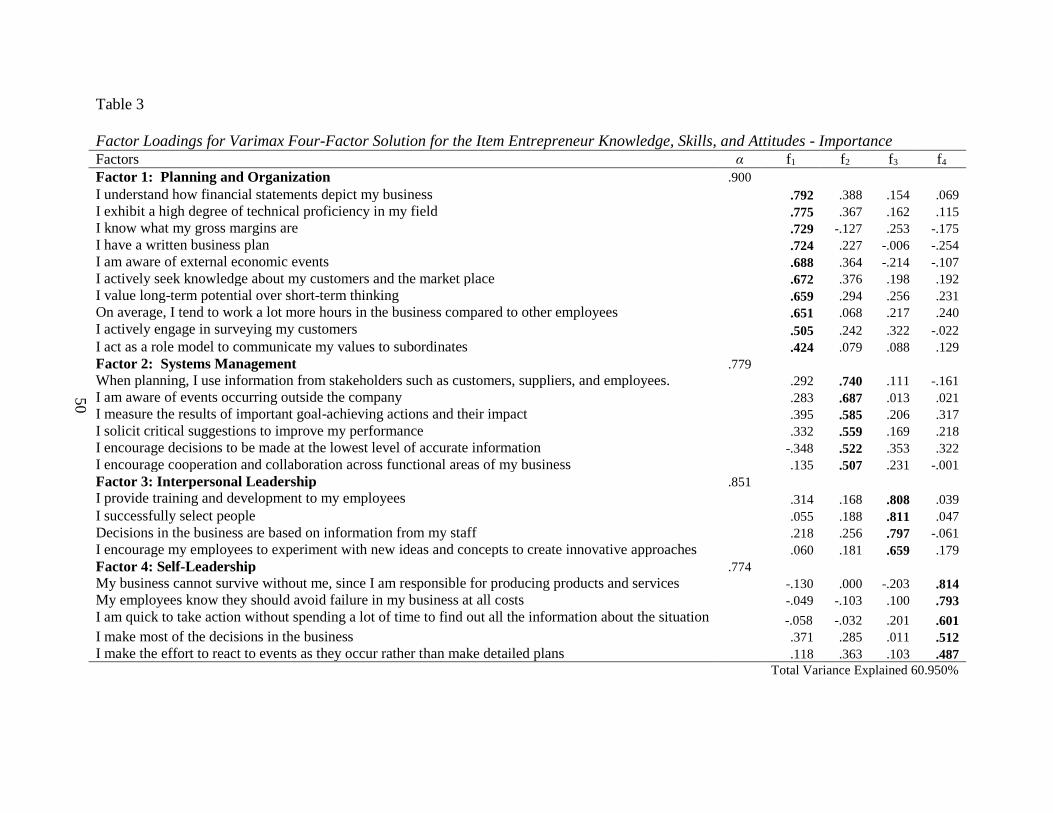
50
Table 3
Factor Loadings for Varimax Four-Factor Solution for the Item Entrepreneur Knowledge, Skills, and Attitudes - Importance Factors α f1 f2 f3 f4
Factor 1: Planning and Organization .900
I understand how financial statements depict my business .792 .388 .154 .069
I exhibit a high degree of technical proficiency in my field .775 .367 .162 .115
I know what my gross margins are .729 -.127 .253 -.175
I have a written business plan .724 .227 -.006 -.254
I am aware of external economic events .688 .364 -.214 -.107
I actively seek knowledge about my customers and the market place .672 .376 .198 .192
I value long-term potential over short-term thinking .659 .294 .256 .231
On average, I tend to work a lot more hours in the business compared to other employees .651 .068 .217 .240
I actively engage in surveying my customers .505 .242 .322 -.022
I act as a role model to communicate my values to subordinates .424 .079 .088 .129
Factor 2: Systems Management .779
When planning, I use information from stakeholders such as customers, suppliers, and employees. .292 .740 .111 -.161
I am aware of events occurring outside the company .283 .687 .013 .021
I measure the results of important goal-achieving actions and their impact .395 .585 .206 .317
I solicit critical suggestions to improve my performance .332 .559 .169 .218
I encourage decisions to be made at the lowest level of accurate information -.348 .522 .353 .322
I encourage cooperation and collaboration across functional areas of my business .135 .507 .231 -.001
Factor 3: Interpersonal Leadership .851
I provide training and development to my employees .314 .168 .808 .039
I successfully select people .055 .188 .811 .047
Decisions in the business are based on information from my staff .218 .256 .797 -.061
I encourage my employees to experiment with new ideas and concepts to create innovative approaches .060 .181 .659 .179
Factor 4: Self-Leadership .774
My business cannot survive without me, since I am responsible for producing products and services -.130 .000 -.203 .814
My employees know they should avoid failure in my business at all costs -.049 -.103 .100 .793
I am quick to take action without spending a lot of time to find out all the information about the situation -.058 -.032 .201 .601
I make most of the decisions in the business .371 .285 .011 .512
I make the effort to react to events as they occur rather than make detailed plans .118 .363 .103 .487
Total Variance Explained 60.950%

51
Table 3. Factor Loadings for Varimax Four-Factor Solution for the Item Entrepreneur Knowledge, Skills, and Attitudes – Importance
(continued)
Factors f1 f2 f3 f4
Items Removed: Expected
Loading:
I take the time to plan the path of my business f1 .641 .447 .148 .090
My employees can clearly articulate the goals and values of my company f1 .541 .000 .590 .042
I make constant changes to my business plan according to the economy and business
factors
f1
.420 .627 .312 .155
I am aware of the product/services and pricing structure of my competitors f2 .678 .441 .131 .104
I know the return on investment of my advertising campaigns f2 .402 .001 .359 .507
To keep updated with technology and information, I participate in learning activities
through seminars, workshops, tradeshows, and/or talking with suppliers
f2
.755 .451 .191 .005
I critically analyze past performance and future opportunities and take actions to enhance
performance
f2
.512 .502 .316 .214
I am actively involved in market analysis f2 .492 .560 .388 .009
I have the courage to make commitments that would be considered risky by others f4 .545 .362 .026 .491
I project a high degree of self-confidence f4 .408 .249 -.122 .581
Note. Factor loadings > .40 are in boldface.

52
proficiency in my field; (c) I know what my gross margins are; (d) I have a written business plan;
(e) I am aware of external economic events; (f) I actively seek knowledge about my customers
and the market place; (g) I value long-term potential over short-term thinking, on average; (h) I
tend to work a lot more hours in the business compared to other employees; (i) I actively engage
in surveying my customers, and (j) I act as a role model to communicate my values to
subordinates. The first factor explained 38.704% of the variance. The second factor was labeled
systems management. This factor was labeled as such due to the high loadings by the following
factors: (a) when planning, I use information from stakeholders such as customers, suppliers, and
employees; (b) I am aware of events occurring outside the company; (c) I measure the results of
important goal-achieving actions and their impact; (d) I solicit critical suggestions to improve my
performance; (e) I encourage decisions to be made at the lowest level of accurate information,
and (f) I encourage cooperation and collaboration across functional areas of my business. The
variance explained by the factor was 9.499%. The third factor was labeled interpersonal
leadership due to the high loadings by the following factors: (a) I provide training and
development to my employees; (b) I successfully select people; decisions in the business are
based on information from my staff, and (c) I encourage my employees to experiment with new
ideas and concepts to create innovative approaches. The third factor explained 7.643% of the
variance. The fourth factor was labeled self-leadership due to the high loadings by the following
factors: (a) my business cannot survive without me, since I am responsible for producing
products and services; (b) my employees know they should avoid failure in my business at all
costs; (c) I am quick to take action without spending a lot of time to find out all the information
about the situation; (d) I make most of the decisions in the business, and (e) I make the effort to
react to events as they occur rather than make detailed plans.

53
Except for one item, the communalities values were all above .3. This meant each item
shared some common variance with other items.
Factor Analysis-Knowledge, Skills, and Attitudes-Extent
The next step was to run a factor analysis on the four independent variables-extent to
identify potential clusters and to determine whether the data should be reduced. Factor analysis
using Varimax rotation was conducted to verify this (see Table 4). Table 4 shows nine cross
loaded items and two items which loaded less than 0.4 and are listed at the bottom of this study.
These items did not pertain to this study therefore were removed. As seen in Table 4, eight items
were associated with the planning and organization factor, five items with the systems
management factor, six items with the interpersonal leadership factor, and four items with the
self-leadership factor.
The final factor loadings for the 35 questions relating “to what extent” relationship
between knowledge, skills, and attitudes and successful Native American owned businesses are
listed in Table 4. The analysis yielded four factors explaining a total of 53.725% of the variance
for the entire set of variables. The variables account for 54% of all variance in all the answers
respondents provided which would indicate there could be four factors called planning and
organization, systems management, interpersonal leadership, and self-leadership. Factor 1 was
labeled planning and organization due to the high loadings by the following: (a) I understand
how financial statements depict my business, (b) to keep updated with technology and
information, I participate in learning activities through seminars, workshops, tradeshows, and/or
talking with suppliers, (c) I am aware of external economic events, (d) I am actively involved in
market analysis, (e) I am aware of the product/services and pricing structure of my competitors,
(f) I actively engage in surveying my customers, (g) I critically analyze past performance and

54
future opportunities and take actions to enhance performance, and (h) I have the courage to make
commitments that would be considered risky by others. The first factor explained 32.133% of the
variance. The second factor was labeled systems management. This factor was labeled as such
due to the high loadings by the following factors: (a) I successfully select people, (b) my
employees can clearly articulate the goals and values of my company, (c) I provide training and
development to my employees, (d) on average, I tend to work a lot more hours in the business
compared to other employees, (e) I value long-term potential over short-term thinking, and (f) I
encourage my employees to experiment with new ideas and concepts to create innovative
approaches. The second factor explained 9.188% of the variance. The third factor was labeled
interpersonal leadership due to the high loadings by the following factors: (a) my business
cannot survive without me, (b) I make most of the decisions in the business, (c) I project a high
degree of self-confidence, (d) I make the effort to react to events as they occur rather than make
detailed plans, (e) I am quick to take action without spending a lot of time to find out all the
information about the situation, and (f) I am aware of events occurring outside the company. The
third factor explained 6.917% of the variance. The fourth factor was labeled self-leadership due
to the high loadings by the following factors: (a) I solicit critical suggestions to improve my
performance, (b) decisions in the business are based on information from my staff, (c) I
encourage decisions to be made at the lowest level of accurate information, and when planning,
(d) I use information from stakeholders such as customers, suppliers, and employees. Except for
one item, the communalities values were all above .3. This meant each item shared some
common variance with other items.

55
Table 4
Factor Loadings for Varimax Four-Factor Solution for the Item Entrepreneur Knowledge, Skills, and Attitudes -Extent Factors α f1 f2 f3 f4
Factor 1: Planning and Organization .869
I understand how financial statements depict my business .822 .226 .084 .045
To keep updated with technology and information, I participate in learning activities through seminars,
workshops, tradeshows, and/or talking with suppliers .768 .082 .116 .204
I am aware of external economic events .760 .056 -.264 -.081
I am actively involved in market analysis .696 .041 .119 .329
I am aware of the product/services and pricing structure of my competitors .679 .292 .121 .256
I actively engage in surveying my customers .576 .074 .228 .242
I critically analyze past performance and future opportunities and take actions to enhance performance .527 .349 .191 .202
I have the courage to make commitments that would be considered risky by others .400 .168 .253 .358
Factor 2: Systems Management .807
I successfully select people .144 .707 .047 .269
My employees can clearly articulate the goals and values of my company .205 .688 .204 -.107
I provide training and development to my employees .119 .669 .123 .292
On average, I tend to work a lot more hours in the business compared to other employees .073 .608 .299 .164
I value long-term potential over short-term thinking .383 .520 .221 .144
I encourage my employees to experiment with new ideas and concepts to create innovative approaches .097 .513 .140 .299
Factor 3: Interpersonal Leadership .728
My business cannot survive without me, since I am responsible for producing products and services -.044 -.107 .771 -.283
I make most of the decisions in the business -.018 .296 .672 .055
I project a high degree of self-confidence .305 .303 .600 .080
I make the effort to react to events as they occur rather than make detailed plans .161 .034 .539 .146
I am quick to take action without spending a lot of time to find out all the information about the
situation
-.036 .166 .532 .224
I am aware of events occurring outside the company .291 .190 .517 .394
Factor 4: Self-Leadership .660
I solicit critical suggestions to improve my performance .302 .180 .112 .671
Decisions in the business are based on information from my staff -.045 .331 -.199 .656
I encourage decisions to be made at the lowest level of accurate information .077 -.004 .075 .613
When planning, I use information from stakeholders such as customers, suppliers, and employees. .077 -.004 .075 .613
Total Variance Explained 53.725%
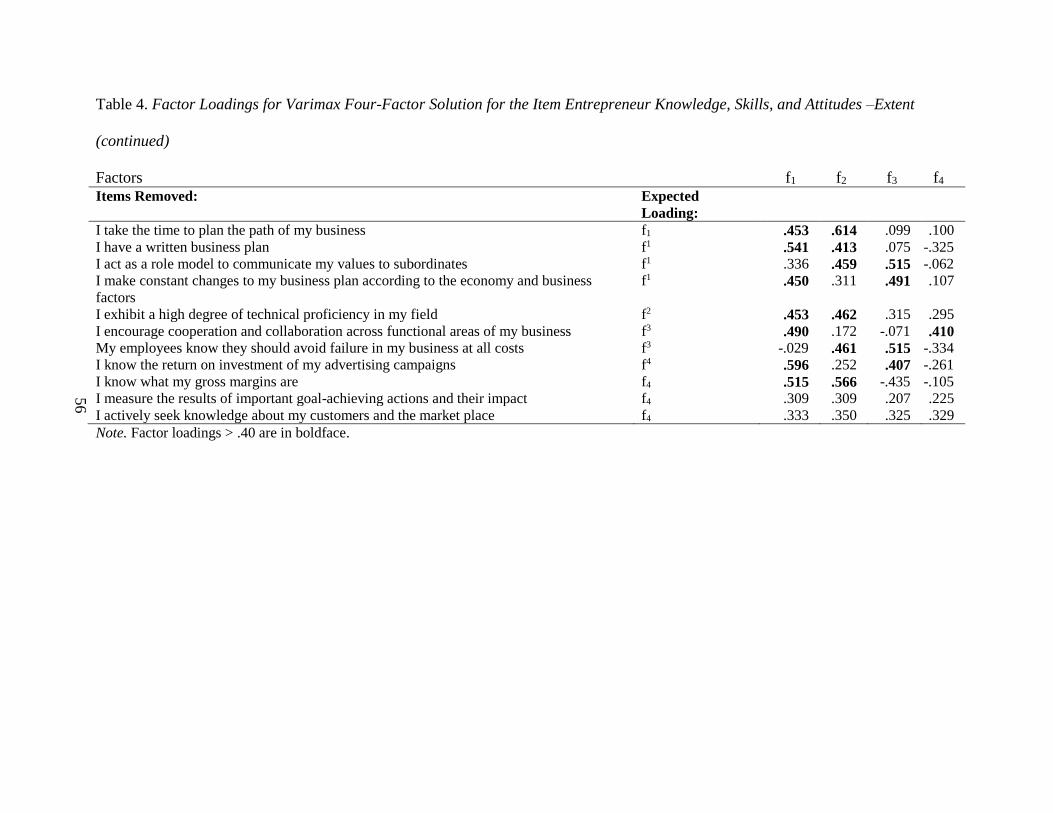
56
Table 4. Factor Loadings for Varimax Four-Factor Solution for the Item Entrepreneur Knowledge, Skills, and Attitudes –Extent
(continued)
Factors f1 f2 f3 f4
Items Removed: Expected
Loading:
I take the time to plan the path of my business f1 .453 .614 .099 .100
I have a written business plan f1 .541 .413 .075 -.325
I act as a role model to communicate my values to subordinates f1 .336 .459 .515 -.062
I make constant changes to my business plan according to the economy and business
factors
f1 .450 .311 .491 .107
I exhibit a high degree of technical proficiency in my field f2 .453 .462 .315 .295
I encourage cooperation and collaboration across functional areas of my business f3 .490 .172 -.071 .410
My employees know they should avoid failure in my business at all costs f3 -.029 .461 .515 -.334
I know the return on investment of my advertising campaigns f4 .596 .252 .407 -.261
I know what my gross margins are f4 .515 .566 -.435 -.105
I measure the results of important goal-achieving actions and their impact f4 .309 .309 .207 .225
I actively seek knowledge about my customers and the market place f4 .333 .350 .325 .329
Note. Factor loadings > .40 are in boldface.
57
CHAPTER 4. RESULTS
This study examined economic success as it pertained to Native American owned
businesses located on/or adjacent to North Dakota reservations. More specifically this study
sought to explore relationships between the perceived level of importance of knowledge, skills,
and attitudes and sustainable business. The previous chapters presented the research questions
and developed the foundation and methodology of the research. Chapter four will present the
results from two measures: “degree of importance” and “to what extent” of the data collected
from the self-administered survey. The “degree of importance scale” measured how important
the business owner felt the statement was to the success of the business, and the “to what extent
scale” measured how often this statement pertained to the owners business.
The following research questions guided the direction of this study:
RQ1. How important are knowledge, skills, and attitudes to the sustainability of
Native American owned businesses?
RQ2. To what extent are Native American environmental factors, knowledge,
skills, and attitudes significant for emerging verses mature Native American
owned businesses?
This correlation research study, by analyzing specific knowledge, skills, and attitudes
utilized by successful Native American business owners, determined there was a correlation
between knowledge, skills, and attitudes and sustainable business. The research data compiled
was analyzed using descriptive, factor analysis, correlations, t-tests, and regression analysis.
Missing Data
Prior to testing, the data was inputted into SPSS to examine missing data. The results
indicated participants did not fill out 294 items on the survey. This meant of the 23,280 items to

58
be filled out by the 194 participants, less than one percent of all items were left blank for
unknown reasons. Due to the large sample size, the series mean method was chosen as the best
method to address the missing data. Using SPSS, the series mean method was used to replace the
missing values with the mean for the entire series.
Demographics
The participants who responded to the self-administered survey are described in the
following tables. The categories for the demographics included: years of operation, gender,
business role, business acquisition, number of employees, revenue size of the firm, educational
level and background, and hours worked.
Over one-half of the entrepreneurs (55%) indicated they had been in business for over 7
years (see Table 5). This is significant in the data collected on the level of importance of
knowledge skills, and attitudes by entrepreneurs who have been in operation for at least five
consecutive years.
Table 5
Demographics: Years of Operation
Years
N
%
1-3 40 21
3-5 22 11
5-7 26 13
7+ 106 55
The majority of the participants were male at 75% (see Table 6).

59
Table 6
Demographics: Gender
Gender
N
%
Female 49 25
Male 145 75
Approximately 52% of the participants held the position of President/CEO of the
company, while 36% were sole proprietors (see Table 7). The remaining 12% had partners who
were involved with the company.
Table 7
Demographics:Business Role
Role
N
%
President/CEO 102 52
Partner 23 12
Sole Proprietor/Principal 69 36
Approximately 71% of the participants personally started their own business, while 16%
inherited the business or it was transferred in some other way (see Table 8).
Table 8
Demographics:Business Acquisition
Acquisition
N
%
Personally started the business 138 71
Purchased the business from
someone else
26
13
Inherited the business or it was
transferred in some other way
30 16

60
The majority of the entrepreneurs (67%) had fewer than 20 employees, whereas only 13
indicated they had over 100 employees (see Table 9).
Table 9
Demographics:Number of Employees
Employees
N
%
1-3 58 30
4-20 72 37
21-50 38 20
51-100 11 6
100+ 13 7
A higher percentage of the participants had under $10 million in revenue (93%). The
remaining 7% had above the $10 million dollar revenue (see Table 10).
Table 10
Demographics: Revenue Range
Revenue
N
%
<$500K 82 42
$500K - $1M 31 16
$ 1M- $10M 67 35
$ 10M- $100M 8 5
$100M+ 3 2
Table 11 indicates the educational attainment of the respondents. Of all the participants
sampled, only 3% indicated they did not finish high school.

61
Table 11
Demographics: Level of Education and Background
Education
N
%
Did not finish school 6 3
High school graduate 32 17
Some college 72 37
Some graduate school 16 8
Graduate/professional degree 67 35
Background N %
Science, engineering or technical 35 18
Social Science or Humanities 13 7
Business 85 44
Professional (law, health field,
social services)
19 10
Other educational background 41 21
Most of the entrepreneurs worked over 50 hours per week (51%). Research by Cornell
(2006) attested to this (see Table 12).

62
Table 12
Demographics: Hours Worked
Hours per week
N
%
10-20 23 12
21-30 9 5
31-40 16 8
41-50 46 24
51-60 52 27
61-70 12 6
70+ 35 18
Pearson Correlation for Success Measures
In Sun’s dissertation (2004), he identified sales, profits, and net worth as items which he
considered measures of success. To determine whether these items were related to each other or
if they were independent from each other, Pearson correlation statistical technique was used to
determine the relationship between the items. The correlation matrix was computed using SPSS
and the data was assumed to be normally distributed. The test was run to determine whether the
items were significantly related, and if so, could they be combined into one dependent variable-
success. The correlation analysis indicated that the items were all positively correlated. The
correlation analysis of success measures in Table 13 indicated sales growth, net profit and yearly
increase of your personal net worth were found to be strongly correlated. Items that were found
to be moderately correlated included: (a) I feel satisfied with owning my own business, (b) I
consider myself to be successful in my life and the pursuit of my goals, (c) I receive personal
gratification working in my field, and (d) I have achieved my own personal happiness and

63
fulfillment. The item, I enjoy complete independence and control over my life was found to have
the weakest correlation.
The relationship between sales growth and I enjoy complete independence and control
over my life is much weaker than the relationship between I feel satisfied with owning my own
business and I consider myself to be successful in my life and the pursuit of my goals. Meaning
if people feel satisfied with owning their own business, chances are there is a higher relationship
with them in considering themselves to be successful in their life and in the pursuit of their goals.
Whereas, the weaker relationship between sales growth and net profit, and I enjoy
complete independence and control over my life would mean sales growth and net profit do not
necessarily mean that I enjoy complete independence and control over my life. They are not as
closely related as the previous experience.

64
Table 13
Pearson Product Moment Correlations for Success Measures 1 2 3 4 5 6 7 8
Sales growth
____ .626** .676** .428** .363** .579** .488** .502**
Net profit
.626** ____ .718** .371** .324** .558** .527** .487**
Yearly increase of your personal net worth.
.676** .718** ____ .548** .445** .694** .577** .568**
I have achieved my own personal
happiness and fulfillment.
.428** .371** .548** ____ .628** .631** .666** .644**
I enjoy complete independence and control
over my life.
.363** .324** .445** .628** ____ .608** .561** .680**
I feel satisfied with owning my own
business.
.579** .558** .694** .631** .608** ____ .773** .802**
I receive personal gratification working in
my field.
.488** .527** .577** .666** .561** .773** ____ .756**
I consider myself to be successful in my
life and the pursuit of my goals.
.502** .487** .568** .644** .680** .802** .756** ____
Note. N = 194.
**p < .01, two-tailed.

65
Factor Analysis-Success Measures
Since the test indicated the items were significantly correlated, the next step was to run a
factor analysis to find out if all of these items loaded on a single factor (see Table 14). A factor
analysis was run to determine whether the eight items would load on a single factor or if there
were additional factors they would load to. It was also run to determine whether a single factor
could be created for these items. Principal component analysis with Varimax rotation was
performed using SPSS to determine the relationship of the items to each other. Communality
values were well-defined by this factor analysis, with all variables exceeding .40. The total
analysis explained a total of 63.615% of the variance for the entire set of variables. The variables
account for 64% of all the variance in all the answers respondents provided which would indicate
there could be a single factor called success.
Table 14
Factor Loadings from Principal Component Factor Analysis: Communalities, Eigenvalues, and
Percentages of Variance for Items for Success
Item
Factor
loading
Communality I feel satisfied with owning my own business. .895 .802
I consider myself to be successful in my life and the pursuit of my
goals.
.862 .743
I receive personal gratification working in my field. .848 .719
Yearly increase of your personal net worth. .819 .671
I have achieved my own personal happiness and fulfillment. .773 .598
Sales growth .724 .524
I enjoy complete independence and control over my life. .722 .521
Net profit .716 .513
Eigenvalue 5.089
% of variance 63.615
66
In calculating the reliability analysis, the Cronbach’s alpha was .915 indicating the items
were very reliable. Based on the results of the correlation analysis, factor analysis, and the
Cronbach alpha, the items considered measures of success can be combined together into one
dependent variable called success. The scores ranged from 8-40 in the dataset.
Research Question 1: How Important Are the Items to the Business?
To get a general picture and pattern of responses and to determine how responses
compared to each other, descriptive analysis was conducted for each factor: environmental
factors, planning and organization, self-leadership, interpersonal leadership, and systems
management. Respondents were given a set of items to determine how important the business
owner felt the statement was to the success of their business. Using SPSS software, data from
these responses were used to compute measures of central tendency and variability of responses
to each factor. Mean and standard deviation values were then extracted and tabulated.
Data from the responses to the environmental factor items are shown in Table 15 and
Table 16. Of the total respondents, 84% indicated it was important or very important (M = 4.363;
SD = 1.049) to encourage the development of Native American owned private businesses that
are not tribally owned (EFQ1); 76% indicated it was important or very important (M = 3.995; SD
= 1.227) to support partnerships between tribal governments, tribal colleges, business
development centers, business owners, and tribal members to help business owners in their
business development efforts (EFQ14); 70% indicated it was important or very important (M =
3.979; SD = 1.142) to build trust and cooperate with Native American entrepreneurs (EFQ8);
66% indicated it was important or very important (M = 3.649; SD = 1.118) to establish
collaborative relations between K-12 schools, business owners, and community members to
optimize and enhance technology skills (EFQ15); and 66% indicated it was important or very
67
important (M = 3.583; SD = 1.347) to encourage adopting uniform commercial codes to set
procedures and protocols to ease investor anxiety about supporting business in Indian country
(EFQ7).
On the other hand, only 32% indicated it was important or very important (M = 2.702; SD
= 1.335) for the business to hosts conferences or summits to exchange ideas about economic
development opportunities (EFQ6); 32% of all respondents indicated it was important or very
important (M = 2.865; SD = 1.308) to convene groups or committees to determine what kind of
cultural property is appropriate for sale or public access (EFQ3); 43% indicated it was important
or very important (M = 3.011; SD = 1.225) to set up mentoring programs among various tribal
business owners to provide computer support such as Web site development, Internet sales,
trademark or copyright protection (EFQ17); and 49% indicated it was important or very
important (M = 3.220; SD = 1.297) to establish a way for local business owners to work together
to lower insurance and marketing costs (EFQ11).
Therefore, based on percentages, means and standard deviation values, respondents
indicated the environmental factor items they felt were important or very important to the
success of the business were: encourage the development of Native American owned private
businesses that are not tribally owned (EFQ1); support partnerships between tribal governments,
tribal colleges, business development centers, business owners, and tribal members to help
business owners in their business development efforts (EFQ14); build trust and cooperate with
Native American entrepreneurs (EFQ8); to establish collaborative relations between K-12
schools, business owners, and community members to optimize and enhance technology skills
(EFQ15); and to encourage adopting uniform commercial codes to set procedures and protocols
to ease investor anxiety about supporting business in Indian country (EFQ7).

68
The environmental factor items the respondents felt were least important to the
success of the business were: for a business to hosts conferences or summits to exchange ideas
about economic development opportunities (EFQ6); convene groups or committees to determine
what kind of cultural property is appropriate for sale or public access (EFQ3); to set up
mentoring programs among various tribal business owners to provide computer support such as
Web site development, Internet sales, trademark or copyright protection (EFQ17); and to
establish a way for local business owners to work together to lower insurance and marketing
costs (EFQ11).
Table 15
Frequency Statistics-Environmental Factors-Importance
VU = Very unimportant; U = Unimportant; NUI = Neither unimportant nor important;
I = Important; VI = Very important; N = Sample Size
Environmental Factors VU U NUI I VI N
I encourage the development of
Native American owned private
businesses that are not tribally
owned (EFQ1).
7 (3.6%) 9 (4.6%) 15 (7.7%) 39 (20.2%) 124 (63.9%) 194
I support partnerships between
tribal governments, tribal
colleges, business development
centers, business owners, and
tribal members to help business
owners in their business
development efforts (EFQ14).
18 (9.3%) 5 (2.6%) 23 (11.9%) 62 (31.9%) 86 (44.3%) 194
I build trust and cooperate with
Native American entrepreneurs
(EFQ8).
14 (7.2%) 0 44 (22.7%) 54 (27.8%) 82 (42.3%) 194
I meet with Native American
business owners to share goals,
visions, and concerns (EFQ2).
11 (5.7%) 16 (8.2%) 56 (28.9%) 51 (26.3%) 60 (30.9%) 194

69
Table 15. Frequency Statistics-Environmental Factors-Importance (continued)
VU = Very unimportant; U = Unimportant; NUI = Neither unimportant nor important;
I = Important; VI = Very important; N = Sample Size
Environmental Factors VU UN UI I VI N I involve tribal community
members and advocates in
planning and decisions that
support Native American
business owners (EFQ4).
24 (12.4%) 9 (4.6%) 38 (19.6%) 62 (32%) 61 (31.4%) 194
I establish collaborative
relations between local K-12
schools, business owners, and
community members to
optimize and enhance
technology skills (EFQ15).
15 (7.7%) 12 (6.2%) 40 (20.6%) 85 (43.9%) 42 (21.6%) 194
I encourage adopting uniform
commercial codes to set
procedures and protocols to ease
investor anxiety about
supporting business in Indian
country (EFQ7).
27 (13.9%) 15 (7.7%) 25 (12.9%) 71 (36.6%) 56 (28.9%) 194
I provide business support that
addresses issues such as tax
assistance, marketing,
budgeting, insurance, credit and
business planning (EFQ9).
20 (10.3%) 19 (9.8%) 42 (21.6%) 59 (30.5%) 54 (27.8%) 194
I bring Native American
entrepreneurs and tribal leaders
together to learn about political
barriers facing business owners
and what tribal leaders can do to
remove them (EFQ5).
23 (11.9%) 17 (8.8%) 44 (22.7%) 57 (29.3%) 53 (27.3%) 194
I facilitate cooperation between
local tribal colleges, tribal
education centers, or business
development centers to help
business owners develop sound
and creative business plans
(EFQ12).
27 (13.9%) 6 (3.1%) 44 (22.7%) 82 (42.3%) 35 (18.0%) 194

70
Table 15. Frequency Statistics-Environmental Factors-Importance (continued)
VU = Very unimportant; U = Unimportant; NUI = Neither unimportant nor important;
I = Important; VI = Very important; N = Sample Size
Environmental Factors VU UN UI I VI N I situate technology within overall
nation-building goals as one tool to
improve economic development on
tribal lands (EFQ13).
21 (10.8%) 13 (6.7%) 56 (28.9%) 71 (36.6%) 33 (17.0%) 194
I coordinate cooperation between
lending institutions, foundations,
private companies, and federal
agencies to establish a community
revolving loan fund or small
business loan program (EFQ10)
25 (12.9%) 21 (10.8%) 48 (24.7%) 50 (25.8%) 50 (25.8%) 194
I form committees or groups to
establish an enforceable copyright
or trademark registration system to
protect Native American business
owners from unlawful Internet
reproducing of tribal intellectual
property (EFQ16).
26 (13.4%) 16 (8.2%) 76 (39.3%) 42 (21.6%) 34 (17.5%) 194
I establish a way for local business
owners to work together to lower
insurance and marketing costs.
(EFQ11).
29 (14.9%) 27 (13.9%) 43 (22.2%) 63 (32.5%) 32 (16.5%) 194
I set up mentoring programs among
various tribal business owners to
provide computer support such as
Web site development, Internet
sales, trademark or copyright
protection (EFQ17).
39 (20.1%) 15 (7.7%) 57 (29.4%) 71 (36.6%) 12 (6.2%) 194
I convene groups or committees to
determine what kind of cultural
property is appropriate for sale or
public access (EFQ3).
43 (22.2%) 26 (13.4%) 64 (32.9%) 36 (18.6%) 25 (12.9%) 194
My business hosts conferences or
summits to exchange ideas about
economic development
opportunities (EFQ6).
52 (26.8%) 34 (17.5%) 46 (23.7%) 43 (22.2%) 19 (9.8%) 194

71
Table 16
Descriptive Statistics for Environmental Factors-Importance
Item
N
M
SD
I encourage the development of Native American owned private
businesses that are not tribally owned (EFQ1).
194 4.363 1.0496
I support partnerships between tribal governments, tribal colleges,
business development centers, business owners, and tribal members to
help business owners in their business development efforts (EFQ14).
194 3.995 1.2279
I build trust and cooperate with Native American entrepreneurs (EFQ8).
194 3.979 1.1425
1. I meet with Native American business owners to share goals, visions, and
concerns (EFQ2).
2.
194 3.686 1.1603
I involve tribal community members and advocates in planning and
decisions that support Native American business owners (EFQ4).
194 3.651 1.3029
I establish collaborative relations between local K-12 schools, business
owners, and community members to optimize and enhance technology
skills (EFQ15).
194 3.649 1.1186
I encourage adopting uniform commercial codes to set procedures and
protocols to ease investor anxiety about supporting business in Indian
country (EFQ7).
194 3.583 1.3479
I provide business support that addresses issues such as tax assistance,
marketing, budgeting, insurance, credit and business planning (EFQ9).
194 3.547 1.2736
I bring Native American entrepreneurs and tribal leaders together to learn
about political barriers facing business owners and what tribal leaders can
do to remove them (EFQ5).
194 3.513 1.3001
I facilitate cooperation between local tribal colleges, tribal education
centers, or business development centers to help business owners develop
sound and creative business plans (EFQ12).
194 3.457 1.2272
I situate technology within overall nation-building goals as one tool to
improve economic development on tribal lands (EFQ13).
194 3.434 1.1705
I coordinate cooperation between lending institutions, foundations,
private companies, and federal agencies to establish a community
revolving loan fund or small business loan program (EFQ10).
194 3.414 1.3240

72
Table 16. Descriptive Statistics for Environmental Factors-Importance (continued)
Item N M SD I establish a way for local business owners to work together to lower
insurance and marketing costs (EFQ11).
194 3.220 1.2972
I set up mentoring programs among various tribal business owners to
provide computer support such as Web site development, Internet sales,
trademark or copyright protection (EFQ17).
194 3.011 1.2258
I convene groups or committees to determine what kind of cultural
property is appropriate for sale or public access (EFQ3).
194 2.865 1.3086
My business hosts conferences or summits to exchange ideas about
economic development opportunities (EFQ6).
194 2.702 1.3350
Data from the responses to the planning and organization items are shown in Table 17
and Table 18. Of the total respondents, 91% indicated it was important or very important (M =
4.510; SD = .7769) to take time to plan the path of the business (POQ18); 88% indicated it was
important or very important (M = 4.473; SD = .7229) to act as a role model to communicate my
values to subordinates (POQ23); 89% indicated it was important or very important (M = 4.445;
SD = .8492) to work a lot more hours in the business compared to other employees (POQ21);
91% indicated it was important or very important (M = 4.389; SD = .7681) to be aware of events
occurring outside the company (POQ25); and 88% indicated it was important or very important
(M = 4.326; SD = .8770) to value long-term potential over short-term thinking (POQ20).
On the other hand, 60% of all respondents indicated it was important or very important
(M = 3.518; SD = 1.164) to make the effort to react to events as they occur rather than make
detailed plans (POQ24).
Therefore, based on percentages, means and standard deviation values, respondents
indicated the planning and organization items they felt were important or very important to
the success of the business were: take time to plan the path of the business (POQ18); act as a role
model to communicate my values to subordinates (POQ23); work a lot more hours in the

73
business compared to other employees (POQ21); be aware of events occurring outside the
company (POQ25); and value long-term potential over short-term thinking (POQ20).
The planning and organization item the respondents felt was least important to the
success of the business was: to make the effort to react to events as they occur rather than make
detailed plans (POQ24).
Table 17
Frequency Statistics-Planning and Organization-Importance
VU = Very unimportant; U = Unimportant; NUI = Neither unimportant nor important;
I = Important; VI = Very important; N = Sample Size
Planning and Organization
VU
U
NUI
I
VI
N I take time to plan the path of my
business (POQ18).
3 (1.5%) 1 (.5%) 13 (6.7%) 54 (27.9%) 123 (63.4%) 194
I act as a role model to
communicate my values to
subordinates (POQ23).
0 2 (1.0%) 21 (10.8%) 51 (26.3%) 120 (61.9%) 194
On average, I tend to work a lot
more hours in the business
compared to other employees
(POQ21).
3 (1.5%) 5 (2.6%) 13 (6.7%) 56 (28.9%) 117 (60.3%) 194
I am aware of events occurring
outside the company (POQ25).
0 8 (4.1%) 10 (5.2%) 75 (38.6%) 101 (52.1%) 194
I value long-term potential over
short-term thinking (POQ20).
3 (1.5%) 7 (3.6%) 14 (7.2%) 70 (36.2%) 100 (51.5%) 194
When planning, I use information
from stakeholders such as
customers, suppliers, and
employees (POQ26).
0 15 (7.7%) 19 (9.8%) 65 (33.5%) 95 (49.0%) 194
I make constant changes to my
business plan according to the
economy and business factors
(POQ27).
5 (2.6%) 11 (5.7%) 19 (9.8%) 59 (30.4%) 100 (51.5%) 194
My employees can clearly
articulate the goals and values of
my company (POQ19).
5 (2.6%) 9 (4.6%) 23 (11.9%) 60 (30.9%) 97 (50.0%) 194

74
Table 17. Frequency Statistics-Planning and Organization-Importance (continued)
VU = Very unimportant; U = Unimportant; NUI = Neither unimportant nor important;
I = Important; VI = Very important; N = Sample Size
Planning and Organization VU U NUI I VI N I have a written business plan
(POQ22).
11 (5.7%) 5 (2.6%) 32 (16.5%) 54 (27.8%) 92 (47.4%) 194
I make the effort to react to events
as they occur rather than make
detailed plans (POQ24).
21 (10.8%) 8 (4.1%) 49 (25.3%) 80 (41.2%) 36 (18.6%) 194
Table 18
Descriptive Statistics for Planning and Organization-Importance
Item
N
M
SD
I take time to plan the path of my business (POQ18). 194 4.510 .7769
I act as a role model to communicate my values to subordinates (POQ23).
194 4.473 .7229
On average, I tend to work a lot more hours in the business compared to
other employees (POQ21).
194 4.445 .8492
I am aware of events occurring outside the company (POQ25).
194 4.389 .7681
I value long-term potential over short-term thinking (POQ20).
194 4.326 .8770
When planning, I use information from stakeholders such as customers,
suppliers, and employees (POQ26).
194 4.240 .9189
I make constant changes to my business plan according to the economy
and business factors (POQ27).
194 4.229 1.0127
My employees can clearly articulate the goals and values of my company
(POQ19).
194 4.217 .9977
I have a written business plan (POQ22).
194 4.089 1.1186
I make the effort to react to events as they occur rather than make detailed
plans (POQ24). 194 3.518 1.1644
Self-leadership item responses are shown in Table 18 and Table 19. Of the total
respondents, 88% indicated it was important or very important (M = 4.289; SD = .8202) to
project a high degree of self-confidence (SLQ32); 85% indicated it was important or very
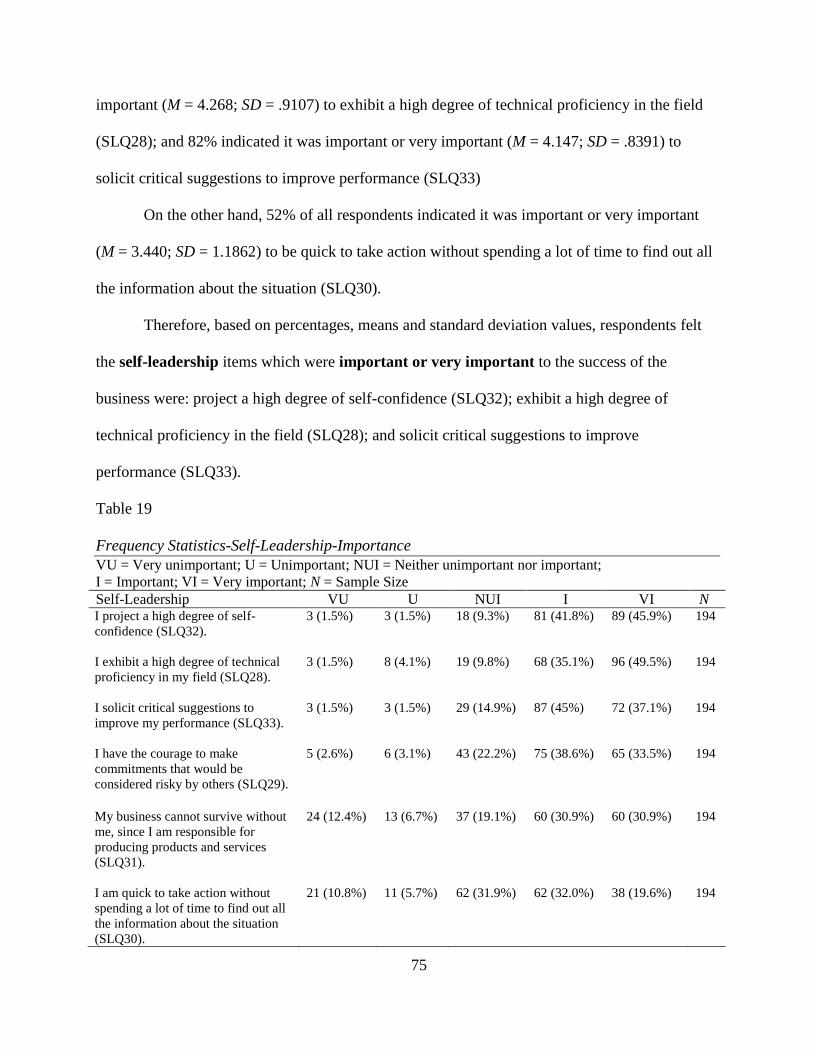
75
important (M = 4.268; SD = .9107) to exhibit a high degree of technical proficiency in the field
(SLQ28); and 82% indicated it was important or very important (M = 4.147; SD = .8391) to
solicit critical suggestions to improve performance (SLQ33)
On the other hand, 52% of all respondents indicated it was important or very important
(M = 3.440; SD = 1.1862) to be quick to take action without spending a lot of time to find out all
the information about the situation (SLQ30).
Therefore, based on percentages, means and standard deviation values, respondents felt
the self-leadership items which were important or very important to the success of the
business were: project a high degree of self-confidence (SLQ32); exhibit a high degree of
technical proficiency in the field (SLQ28); and solicit critical suggestions to improve
performance (SLQ33).
Table 19
Frequency Statistics-Self-Leadership-Importance
VU = Very unimportant; U = Unimportant; NUI = Neither unimportant nor important;
I = Important; VI = Very important; N = Sample Size
Self-Leadership VU U NUI I VI N I project a high degree of self-
confidence (SLQ32).
3 (1.5%) 3 (1.5%) 18 (9.3%) 81 (41.8%) 89 (45.9%) 194
I exhibit a high degree of technical
proficiency in my field (SLQ28).
3 (1.5%) 8 (4.1%) 19 (9.8%) 68 (35.1%) 96 (49.5%) 194
I solicit critical suggestions to
improve my performance (SLQ33).
3 (1.5%) 3 (1.5%) 29 (14.9%) 87 (45%) 72 (37.1%) 194
I have the courage to make
commitments that would be
considered risky by others (SLQ29).
5 (2.6%) 6 (3.1%) 43 (22.2%) 75 (38.6%) 65 (33.5%) 194
My business cannot survive without
me, since I am responsible for
producing products and services
(SLQ31).
24 (12.4%) 13 (6.7%) 37 (19.1%) 60 (30.9%) 60 (30.9%) 194
I am quick to take action without
spending a lot of time to find out all
the information about the situation
(SLQ30).
21 (10.8%) 11 (5.7%) 62 (31.9%) 62 (32.0%) 38 (19.6%) 194

76
Table 20
Descriptive Statistics for Self-Leadership-Importance
Item
N
M
SD
I project a high degree of self-confidence (SLQ32).
194 4.289 .8202
I exhibit a high degree of technical proficiency in my field (SLQ28).
194 4.268 .9107
I solicit critical suggestions to improve my performance (SLQ33).
194 4.147 .8391
I have the courage to make commitments that would be considered risky
by others (SLQ29).
194 3.974 .9573
My business cannot survive without me, since I am responsible for
producing products and services (SLQ31).
194 3.611 1.3192
I am quick to take action without spending a lot of time to find out all the
information about the situation (SLQ30). 194 3.440 1.1862
Interpersonal leadership item responses are shown in Table 20 and Table 21. Of the
total respondents, 88% indicated it was important or very important (M = 4.432; SD = .7502) to
encourage cooperation and collaboration across functional areas of the business (ILQ36); 86%
indicated it was important or very important (M = 4.340; SD = .9224) to provide training and
development to the employees (ILQ39); and 85% indicated it was important or very important
(M = 4.222; SD = 1.0268) to make most of the decisions in the business (ILQ34).
On the other hand, 53% of all respondents indicated it was important or very important
(M = 3.565; SD = 1.0101) to encourage decisions to be made at the lowest level of accurate
information (ILQ35).
Based on percentages, means and standard deviation values, respondents felt the
interpersonal leadership items which were important or very important to the success of the
business were: encourage cooperation and collaboration across functional areas of the business
ILQ36); provide training and development to the employees (ILQ39); and make most of the
decisions in the business (ILQ34).
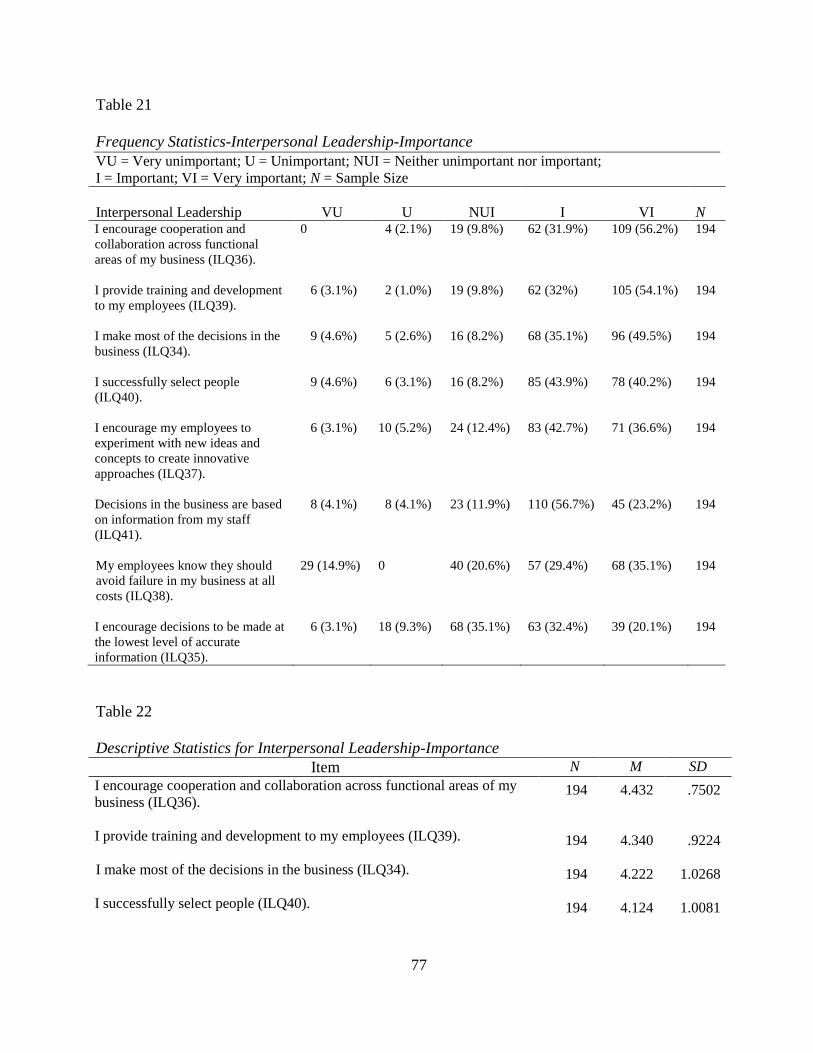
77
Table 21
Frequency Statistics-Interpersonal Leadership-Importance
VU = Very unimportant; U = Unimportant; NUI = Neither unimportant nor important;
I = Important; VI = Very important; N = Sample Size
Interpersonal Leadership
VU
U
NUI
I
VI
N I encourage cooperation and
collaboration across functional
areas of my business (ILQ36).
0 4 (2.1%) 19 (9.8%) 62 (31.9%) 109 (56.2%) 194
I provide training and development
to my employees (ILQ39).
6 (3.1%) 2 (1.0%) 19 (9.8%) 62 (32%) 105 (54.1%) 194
I make most of the decisions in the
business (ILQ34).
9 (4.6%) 5 (2.6%) 16 (8.2%) 68 (35.1%) 96 (49.5%) 194
I successfully select people
(ILQ40).
9 (4.6%) 6 (3.1%) 16 (8.2%) 85 (43.9%) 78 (40.2%) 194
I encourage my employees to
experiment with new ideas and
concepts to create innovative
approaches (ILQ37).
6 (3.1%) 10 (5.2%) 24 (12.4%) 83 (42.7%) 71 (36.6%) 194
Decisions in the business are based
on information from my staff
(ILQ41).
8 (4.1%) 8 (4.1%) 23 (11.9%) 110 (56.7%) 45 (23.2%) 194
My employees know they should
avoid failure in my business at all
costs (ILQ38).
29 (14.9%) 0 40 (20.6%) 57 (29.4%) 68 (35.1%) 194
I encourage decisions to be made at
the lowest level of accurate
information (ILQ35).
6 (3.1%) 18 (9.3%) 68 (35.1%) 63 (32.4%) 39 (20.1%) 194
Table 22
Descriptive Statistics for Interpersonal Leadership-Importance
Item N M SD
I encourage cooperation and collaboration across functional areas of my
business (ILQ36).
194 4.432 .7502
I provide training and development to my employees (ILQ39).
194 4.340 .9224
I make most of the decisions in the business (ILQ34).
194 4.222 1.0268
I successfully select people (ILQ40).
194 4.124 1.0081
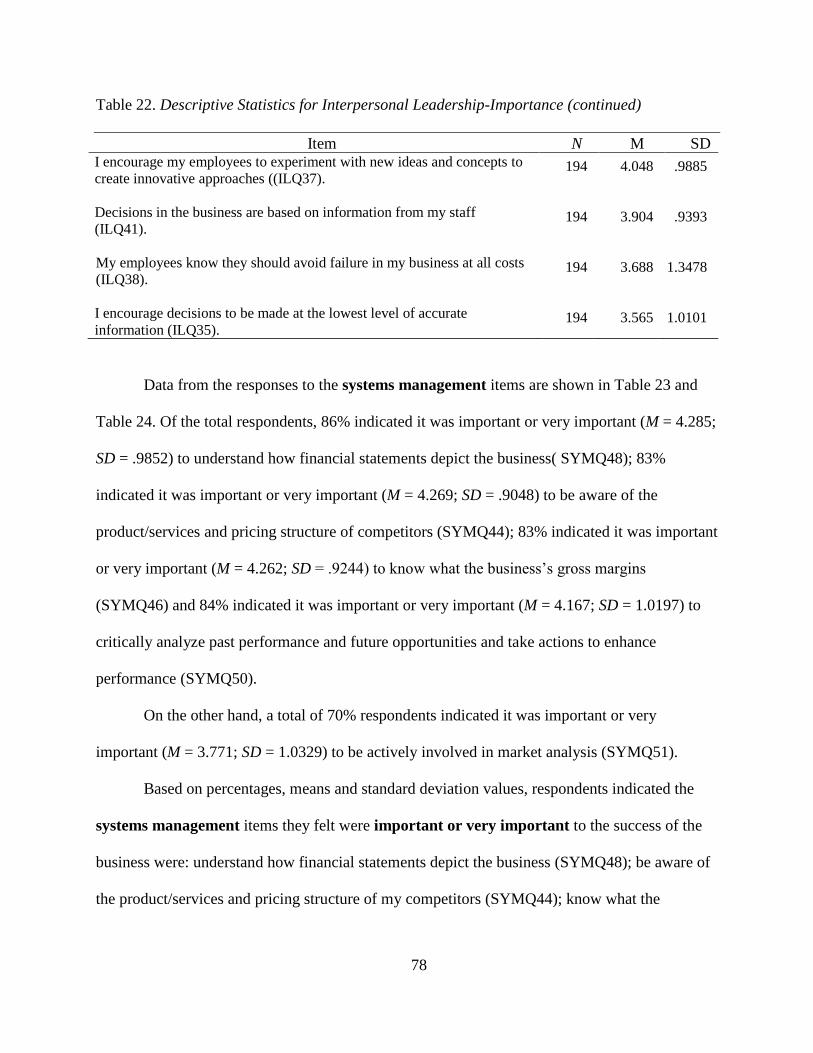
78
Table 22. Descriptive Statistics for Interpersonal Leadership-Importance (continued)
Item N M SD I encourage my employees to experiment with new ideas and concepts to
create innovative approaches ((ILQ37).
194 4.048 .9885
Decisions in the business are based on information from my staff
(ILQ41).
194 3.904 .9393
My employees know they should avoid failure in my business at all costs
(ILQ38).
194 3.688 1.3478
I encourage decisions to be made at the lowest level of accurate
information (ILQ35). 194 3.565 1.0101
Data from the responses to the systems management items are shown in Table 23 and
Table 24. Of the total respondents, 86% indicated it was important or very important (M = 4.285;
SD = .9852) to understand how financial statements depict the business( SYMQ48); 83%
indicated it was important or very important (M = 4.269; SD = .9048) to be aware of the
product/services and pricing structure of competitors (SYMQ44); 83% indicated it was important
or very important (M = 4.262; SD = .9244) to know what the business’s gross margins
(SYMQ46) and 84% indicated it was important or very important (M = 4.167; SD = 1.0197) to
critically analyze past performance and future opportunities and take actions to enhance
performance (SYMQ50).
On the other hand, a total of 70% respondents indicated it was important or very
important (M = 3.771; SD = 1.0329) to be actively involved in market analysis (SYMQ51).
Based on percentages, means and standard deviation values, respondents indicated the
systems management items they felt were important or very important to the success of the
business were: understand how financial statements depict the business (SYMQ48); be aware of
the product/services and pricing structure of my competitors (SYMQ44); know what the
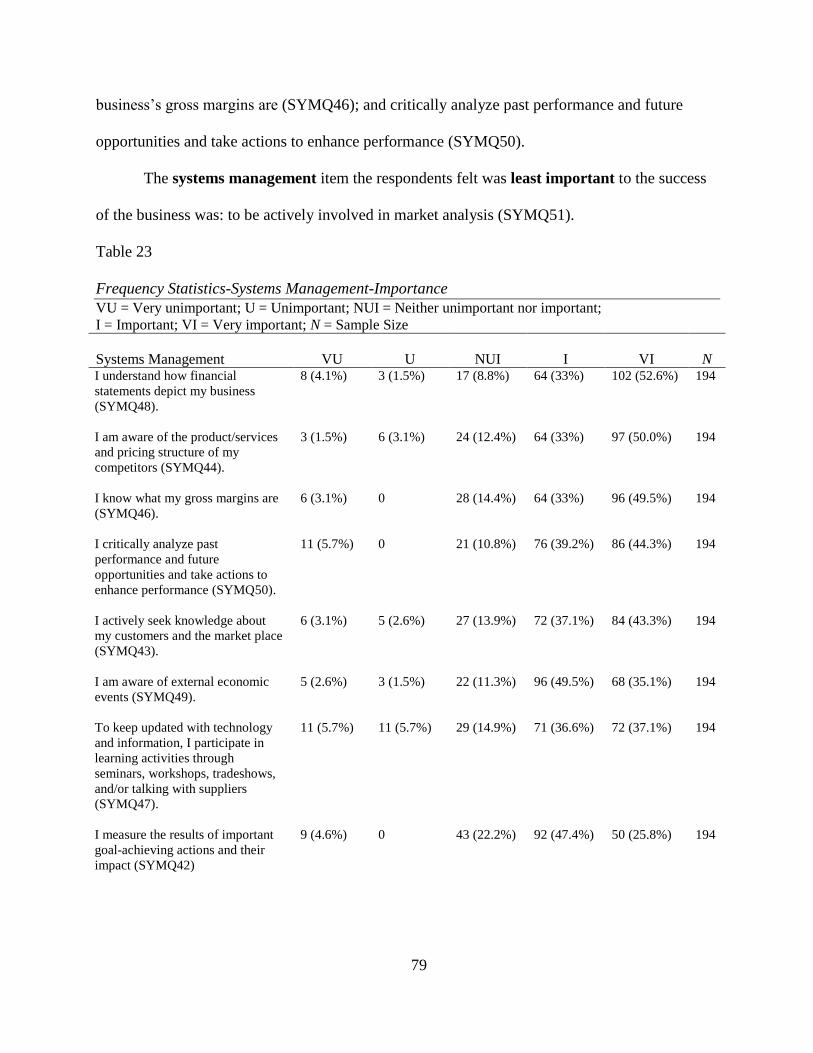
79
business’s gross margins are (SYMQ46); and critically analyze past performance and future
opportunities and take actions to enhance performance (SYMQ50).
The systems management item the respondents felt was least important to the success
of the business was: to be actively involved in market analysis (SYMQ51).
Table 23
Frequency Statistics-Systems Management-Importance
VU = Very unimportant; U = Unimportant; NUI = Neither unimportant nor important;
I = Important; VI = Very important; N = Sample Size
Systems Management
VU
U
NUI
I
VI
N I understand how financial
statements depict my business
(SYMQ48).
8 (4.1%) 3 (1.5%) 17 (8.8%) 64 (33%) 102 (52.6%) 194
I am aware of the product/services
and pricing structure of my
competitors (SYMQ44).
3 (1.5%) 6 (3.1%) 24 (12.4%) 64 (33%) 97 (50.0%) 194
I know what my gross margins are
(SYMQ46).
6 (3.1%) 0 28 (14.4%) 64 (33%) 96 (49.5%) 194
I critically analyze past
performance and future
opportunities and take actions to
enhance performance (SYMQ50).
11 (5.7%) 0 21 (10.8%) 76 (39.2%) 86 (44.3%) 194
I actively seek knowledge about
my customers and the market place
(SYMQ43).
6 (3.1%) 5 (2.6%) 27 (13.9%) 72 (37.1%) 84 (43.3%) 194
I am aware of external economic
events (SYMQ49).
5 (2.6%) 3 (1.5%) 22 (11.3%) 96 (49.5%) 68 (35.1%) 194
To keep updated with technology
and information, I participate in
learning activities through
seminars, workshops, tradeshows,
and/or talking with suppliers
(SYMQ47).
11 (5.7%) 11 (5.7%) 29 (14.9%) 71 (36.6%) 72 (37.1%) 194
I measure the results of important
goal-achieving actions and their
impact (SYMQ42)
9 (4.6%) 0 43 (22.2%) 92 (47.4%) 50 (25.8%) 194

80
Table 23. Frequency Statistics-Systems Management-Importance (continued)
VU = Very unimportant; U = Unimportant; NUI = Neither unimportant nor important;
I = Important; VI = Very important; N = Sample Size
Systems Management VU U NUI I VI N I actively engage in surveying
my customers (SYMQ52).
8 (4.1%) 11 (5.7%) 52 (26.8%) 53 (27.3%) 70 (36.1%) 194
I know the return on
investment of my advertising
campaigns (SYMQ45).
7 (3.6%) 8 (4.1%) 56 (28.9%) 62 (32%) 61 (31.4%) 194
I am actively involved in
market analysis (SYMQ51).
11 (5.7%) 8 (4.1%) 40 (20.6%) 90 (46.4%) 45 (23.2%) 194
Table 24
Descriptive Statistics for Systems Management-Importance Item N M SD
I understand how financial statements depict my business (SYMQ48).
194 4.285 .9852
I am aware of the product/services and pricing structure of my
competitors (SYMQ44)
194 4.269 .9048
I know what my gross margins are (SYMQ46)
194 4.262 .9244
I critically analyze past performance and future opportunities and take
actions to enhance performance (SYMQ50).
194 4.167 1.0197
I actively seek knowledge about my customers and the market place
(SYMQ43).
194 4.150 .9675
I am aware of external economic events (SYMQ49).
194 4.131 .8630
To keep updated with technology and information, I participate in
learning activities through seminars, workshops, tradeshows, and/or
talking with suppliers (SYMQ47).
194 3.937 1.1226
I measure the results of important goal-achieving actions and their impact
(SYMQ42).
194 3.895 .9438
I actively engage in surveying my customers (SYMQ52).
194 3.854 1.1009
I know the return on investment of my advertising campaigns (SYMQ45).
194 3.832 1.0347
I am actively involved in market analysis (SYMQ51). 194 3.771 1.0329

81
Pearson Correlation for Environmental Factors-Importance
Using the first measure of “degree of importance”, to determine whether the 17
environmental factors were related to each other or if they were independent from each other,
Pearson correlation analysis was computed using SPSS. The test was run to determine whether
the items were significantly related, and if so, could they be combined into one independent
variable-environmental factors-importance.
The correlation analysis of environmental factors in Table 25 indicated the items were all
positively correlated. The correlation analysis of environmental factors-importance indicated the
relationships ranged from weak to strong correlations. The items found to have the strongest
correlation included: (a) I meet with Native American business owners to share goals, visions,
and concerns, (b) I build trust and cooperate with Native American entrepreneurs, and (c) I
facilitate cooperation between local tribal colleges, tribal education centers, or business
development centers to help business owners develop sound and create business plans. Two
items were found to have the weakest correlation: (a) I convene groups or committees to
determine what kind of cultural property is appropriate for sale or public access and (b) my
business hosts conferences or summits to exchange ideas about economic development
opportunities. The remaining items were found to be moderately correlated.
The relationship between I encourage the development of Native American owned
private businesses that are not tribally owned and I convene groups or committees to determine
what kind of cultural property is appropriate for sale or public access, along with my business
hosts conferences or summits to exchange ideas about economic development opportunities is
much weaker than the relationship between I coordinate cooperation between lending
institutions, foundations, private companies, and federal agencies to establish a community

82
revolving loan fund or small business loan program and I establish a way for local business
owners to work together to lower insurance and marketing costs. Meaning if business owners
coordinate working together with lending institutions to establish a community revolving loan
fund or small business loan program, chances are there is a greater relationship with them in
establishing a way for local business owners to lower insurance and marketing costs.
Whereas, the weaker relationship between I encourage the development of Native
American owned private businesses that are not tribally owned and my business hosts
conferences or summits to exchange ideas about economic development opportunities would
mean although I encourage the development of Native American owned private businesses that
are not tribally owned it does not necessarily mean that my business hosts conferences or
summits to exchange ideas about economic development opportunities. They are not as closely
related as the previous experience. Although I may encourage the development of Native
American owned private businesses, it does not mean that the business would host conferences
to promote this.
Overall, there was a strong positive correlation between I facilitate cooperation between
local tribal colleges, tribal education centers, or business development centers to help business
owners develop sound and create business plans and I situate technology within overall nation-
building goals as one tool to improve economic development on tribal lands. If owners work
with local tribal colleges, tribal education centers, or business development centers to help
business owners develop sound and creative business plans chances are there is a greater
relationship with them in situating technology within overall nation-building goals as one tool to
improve economic development on tribal lands.
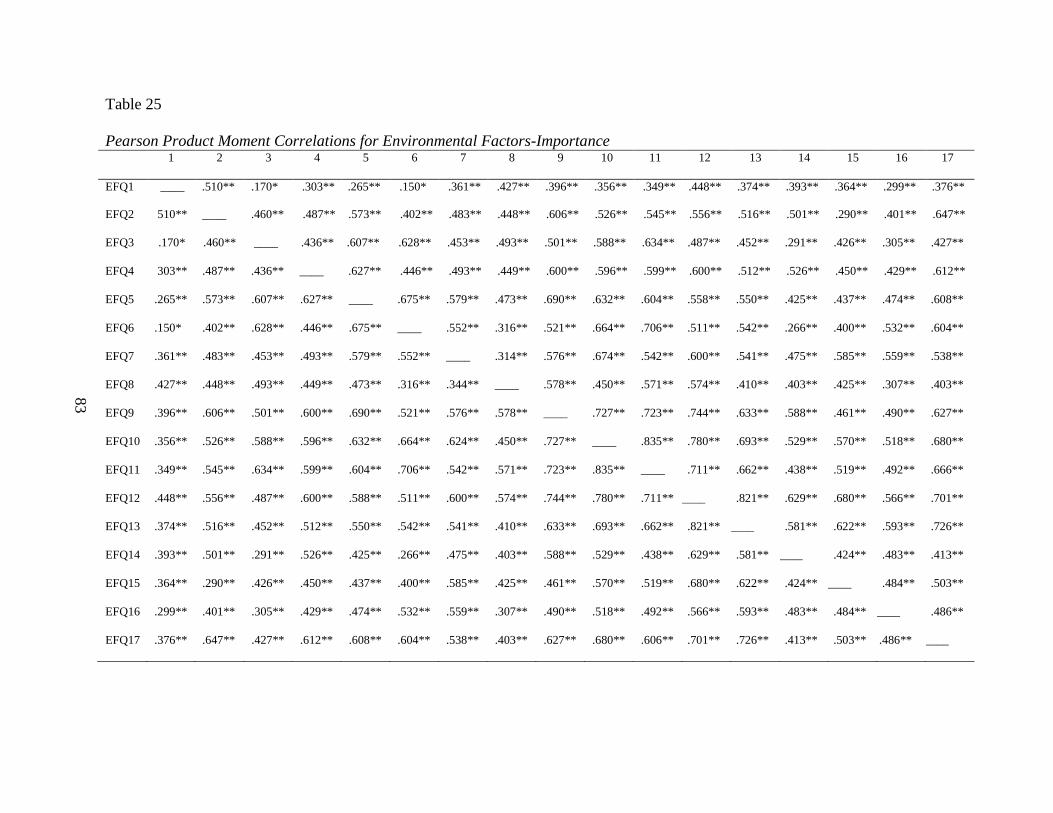
83
Table 25
Pearson Product Moment Correlations for Environmental Factors-Importance
1
2
3
4
5
6
7
8
9
10
11
12
13
14
15
16
17
EFQ1
____ .510** .170* .303** .265** .150* .361** .427** .396** .356** .349** .448** .374** .393** .364** .299** .376**
EFQ2
510** ____ .460** .487** .573** .402** .483** .448** .606** .526** .545** .556** .516** .501** .290** .401** .647**
EFQ3
.170* .460** ____ .436** .607** .628** .453** .493** .501** .588** .634** .487** .452** .291** .426** .305** .427**
EFQ4
303** .487** .436** ____ .627** .446** .493** .449** .600** .596** .599** .600** .512** .526** .450** .429** .612**
EFQ5
.265** .573** .607** .627** ____ .675** .579** .473** .690** .632** .604** .558** .550** .425** .437** .474** .608**
EFQ6
.150* .402** .628** .446** .675** ____ .552** .316** .521** .664** .706** .511** .542** .266** .400** .532** .604**
EFQ7
.361** .483** .453** .493** .579** .552** ____ .314** .576** .674** .542** .600** .541** .475** .585** .559** .538**
EFQ8
.427** .448** .493** .449** .473** .316** .344** ____ .578** .450** .571** .574** .410** .403** .425** .307** .403**
EFQ9
.396** .606** .501** .600** .690** .521** .576** .578** ____ .727** .723** .744** .633** .588** .461** .490** .627**
EFQ10
.356** .526** .588** .596** .632** .664** .624** .450** .727** ____ .835** .780** .693** .529** .570** .518** .680**
EFQ11
.349** .545** .634** .599** .604** .706** .542** .571** .723** .835** ____ .711** .662** .438** .519** .492** .666**
EFQ12
.448** .556** .487** .600** .588** .511** .600** .574** .744** .780** .711** ____ .821** .629** .680** .566** .701**
EFQ13
.374** .516** .452** .512** .550** .542** .541** .410** .633** .693** .662** .821** ____ .581** .622** .593** .726**
EFQ14
.393** .501** .291** .526** .425** .266** .475** .403** .588** .529** .438** .629** .581** ____ .424** .483** .413**
EFQ15
.364** .290** .426** .450** .437** .400** .585** .425** .461** .570** .519** .680** .622** .424** ____ .484** .503**
EFQ16
.299** .401** .305** .429** .474** .532** .559** .307** .490** .518** .492** .566** .593** .483** .484** ____ .486**
EFQ17
.376** .647** .427** .612** .608** .604** .538** .403** .627** .680** .606** .701** .726** .413** .503** .486** ____

84
Table 25. Pearson Product Moment Correlations for Environmental Factors-Importance (continued)
Note. N = 194
EFQ1 = I encourage the development of Native American owned private businesses that are not tribally owned
EFQ2 = I meet with Native American business owners to share goals, visions, and concerns
EFQ3 = I convene groups or committees to determine what kind of cultural property is appropriate for sale or public access
EFQ4 = I involve tribal community members and advocates in planning and decisions that support Native American business owners
EFQ5 = I bring Native American entrepreneurs and tribal leaders together to learn about political barriers facing business owners and what
tribal leaders can do to remove them
EFQ6 = My business hosts conferences or summits to exchange ideas about economic development opportunities
EFQ7 = I encourage adopting uniform commercial codes to set procedures and protocols to ease investor anxiety about supporting business in
Indian country
EFQ8 = I build trust and cooperate with Native American entrepreneurs
EFQ9 = I provide business support that addresses issues such as tax assistance, marketing, budgeting, insurance, credit and business planning
EFQ10 = I coordinate cooperation between lending institutions, foundations, private companies, and federal agencies to establish a
community revolving loan fund or small business loan program
EFQ11 = I establish a way for local business owners to work together to lower insurance and marketing costs
EFQ12 = I facilitate cooperation between local tribal colleges, tribal education centers, or business development centers to help business
owners develop sound and creative business plans
EFQ13 = I situate technology within overall nation-building goals as one tool to improve economic development on tribal lands
EFQ14 = I support partnerships between tribal governments, tribal colleges, business development centers, business owners, and tribal
members to help business owners in their business development efforts
EFQ15 = I establish collaborative relations between local K-12 schools, business owners, and community members to optimize and enhance
technology skills
EFQ16 = I form committees or groups to establish an enforceable copyright or trademark registration system to protect Native American
business owners from unlawful Internet reproducing of tribal intellectual property
EFQ17 = I set up mentoring programs among various tribal business owners to provide computer support such as Web site development,
Internet sales, trademark or copyright protection
* p < .05, two-tailed. **p < .01, two-tailed.
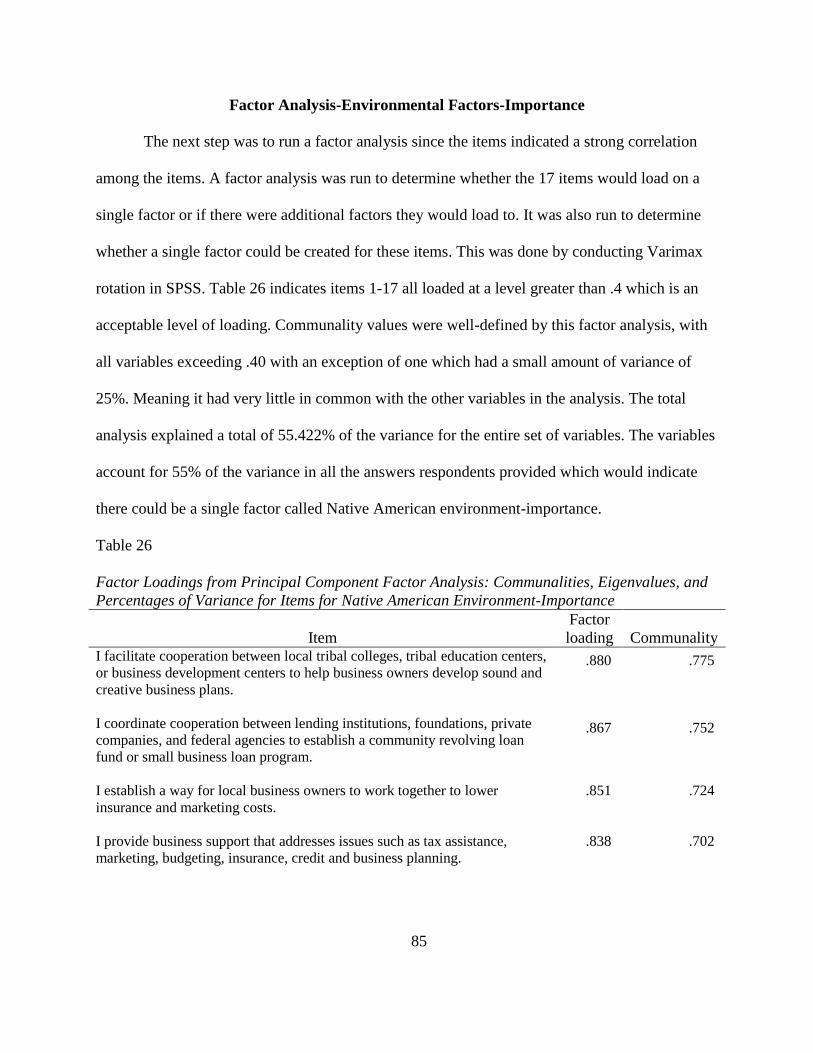
85
Factor Analysis-Environmental Factors-Importance
The next step was to run a factor analysis since the items indicated a strong correlation
among the items. A factor analysis was run to determine whether the 17 items would load on a
single factor or if there were additional factors they would load to. It was also run to determine
whether a single factor could be created for these items. This was done by conducting Varimax
rotation in SPSS. Table 26 indicates items 1-17 all loaded at a level greater than .4 which is an
acceptable level of loading. Communality values were well-defined by this factor analysis, with
all variables exceeding .40 with an exception of one which had a small amount of variance of
25%. Meaning it had very little in common with the other variables in the analysis. The total
analysis explained a total of 55.422% of the variance for the entire set of variables. The variables
account for 55% of the variance in all the answers respondents provided which would indicate
there could be a single factor called Native American environment-importance.
Table 26
Factor Loadings from Principal Component Factor Analysis: Communalities, Eigenvalues, and
Percentages of Variance for Items for Native American Environment-Importance
Item Factor
loading
Communality I facilitate cooperation between local tribal colleges, tribal education centers,
or business development centers to help business owners develop sound and
creative business plans.
.880 .775
I coordinate cooperation between lending institutions, foundations, private
companies, and federal agencies to establish a community revolving loan
fund or small business loan program.
.867 .752
I establish a way for local business owners to work together to lower
insurance and marketing costs.
.851 .724
I provide business support that addresses issues such as tax assistance,
marketing, budgeting, insurance, credit and business planning.
.838 .702

86
Table 26. Factor Loadings from Principal Component Factor Analysis: Communalities,
Eigenvalues, and Percentages of Variance for Items for Native American Environment-
Importance (continued)
Factor
Item loading Communality I situate technology within overall nation-building goals as one tool to improve
economic development on tribal lands.
.821 .674
I set up mentoring programs among various tribal business owners to provide
computer support such as Web site development, Internet sales, trademark or
copyright protection.
.804 .647
I bring Native American entrepreneurs and tribal leaders together to learn about
political barriers facing business owners and what tribal leaders can do to remove
them.
.784 .615
I encourage adopting uniform commercial codes to set procedures and protocols to
ease investor anxiety about supporting business in Indian country.
.739 .546
I involve tribal community members and advocates in planning and decisions that
support Native American business owners.
.731 .534
My business hosts conferences or summits to exchange ideas about economic
development opportunities.
.717 .514
I meet with Native American business owners to share goals, visions, and concerns.
.707 .499
I establish collaborative relations between local K-12 schools, business owners, and
community members to optimize and enhance technology skills.
.685 .469
I form committees or groups to establish an enforceable copyright or trademark
registration system to protect Native American business owners from unlawful
Internet reproducing of tribal intellectual property.
.667 .444
I convene groups or committees to determine what kind of cultural property is
appropriate for sale or public access.
.665 .442
I support partnerships between tribal governments, tribal colleges, business
development centers, business owners, and tribal members to help business owners
in their business development efforts.
.660 .435
I build trust and cooperate with Native American entrepreneurs.
.632 .400
I encourage the development of Native American owned private businesses that are
not tribally owned.
.498 .248
Eigenvalue 9.422 % of variance 55.422

87
In calculating reliability analysis, Cronbach’s alpha was .948 indicating the items were
very reliable. Based on the results of the correlation analysis, factor analysis, and the Cronbach
alpha, the items considered environmental factors can be combined together into one
independent variable called Native American environment-importance. Each respondent’s
scores within the construct were added together to create a new variable called Native American
environment-importance. The variable scores ranged from 17-85 in the dataset.
The next step was to run a regression analysis on the dependent variable-success and the
five variables. In chapter 3 four variables were identified from the analysis that was done from
Sun’s instrument. These four variables: planning and organization, self-leadership, interpersonal
leadership, systems management and the new variable Native American environment-importance
were used to run the regression analysis.
Regression Analysis
As indicated previously, literature review indicated environmental factors make a
difference to Native American entrepreneurs. Linear regression, using the forward selection
method in SPSS, was conducted to determine the relationship between the dependent variable-
success and the five variables: Native American environment, planning and organization,
systems management, self-leadership, and interpersonal leadership. This method was chosen to
determine the best predictor of the dependent variable-success. SPSS entered the variables into
the model one at a time in an order determined by the strength of their correlation with the
dependent variable. The variables that did not significantly add to the success of the model were
excluded.
As indicated in Table 27, success is correlated with Native American environment but
not to the degree as it is with planning and organization. The results indicate Native American

88
environment factors do contribute to the success of Native American owned businesses, but not
to the degree of planning and organization. Interpersonal leadership is also highly correlated
with planning and organization at .456, meaning if the Native American owned business had
good interpersonal leadership skills, it would probably improve their ability to plan and
organize.
The relationship between success and the variable self-leadership goes down as success
goes up. For the entrepreneur, as the company grows and people are hired to assist in the
management of the company, the company’s success increases. The results in Table 27 indicate a
company need not be solely dependent on its owner for its success.
The results also indicate in order for Native Americans to start up new companies,
planning and organization would need to be emphasized. Planning and organization for Native
American owned businesses are more dominant than any other variable in relationship to
success.
Table 27
Means, Standard Deviations, and Intercorrelations for Success and Knowledge, Skills, and
Attitudes Variables Variable M SD 1 2 3 4 5
Success 34.09 4.85 .199** .269** .182* -.031 .150*
Predictor Variable
1. Native American
Environment
59.29 15.60 .512** .368** .093 .383**
2. Planning and Organization 42.28 6.82 .456** .144* .571**
3. Interpersonal Leadership 24.67 3.63 .223** .440**
4. Self-Leadership 14.98 3.16 .282**
5. Systems Management 18.48 4.27
Note. N = 194.
* p < .05, two-tailed. **p < .01, two-tailed.
In conducting a hierarchical regression analysis, the variable Native American
environment was entered first because earlier literature stated this variable made a significant

89
difference for Native American owned businesses. The results of this can be found in Table 28.
Step one indicates when entered as the only variable, Native American environment is
significant and explains a part of what success is for Native American owned businesses. The
regression equation is: Success = 30.431 + .062 x NAEnvir. The highest possible success score is
40 and the highest possible Native American environment score is 85. Applying the Native
American environment score to the regression equation you would get a success score of 35.701,
which is very close to the highest possible score of 40. The results indicate without any other
variables, Native American environment is significant and does explain part of what success is
for Native American owned businesses.
Analysis was then run to find out if there were other variables that explained success for
Native American owned businesses, such as knowledge, skills, and attitudes. These were entered
second using a forward method to ensure that SPSS determined which of these variables was
most significant. When this happened, Native American environment was made insignificant
(Table 28). Results showed when the variable planning and organization was included in the
model, the constant decreased for Native American environment, indicating this became
insignificant and planning and organization became significant (Table 28). The results indicated
when other variables were looked at for the dependent variable-success, planning and
organization tended to overpower Native American environment.
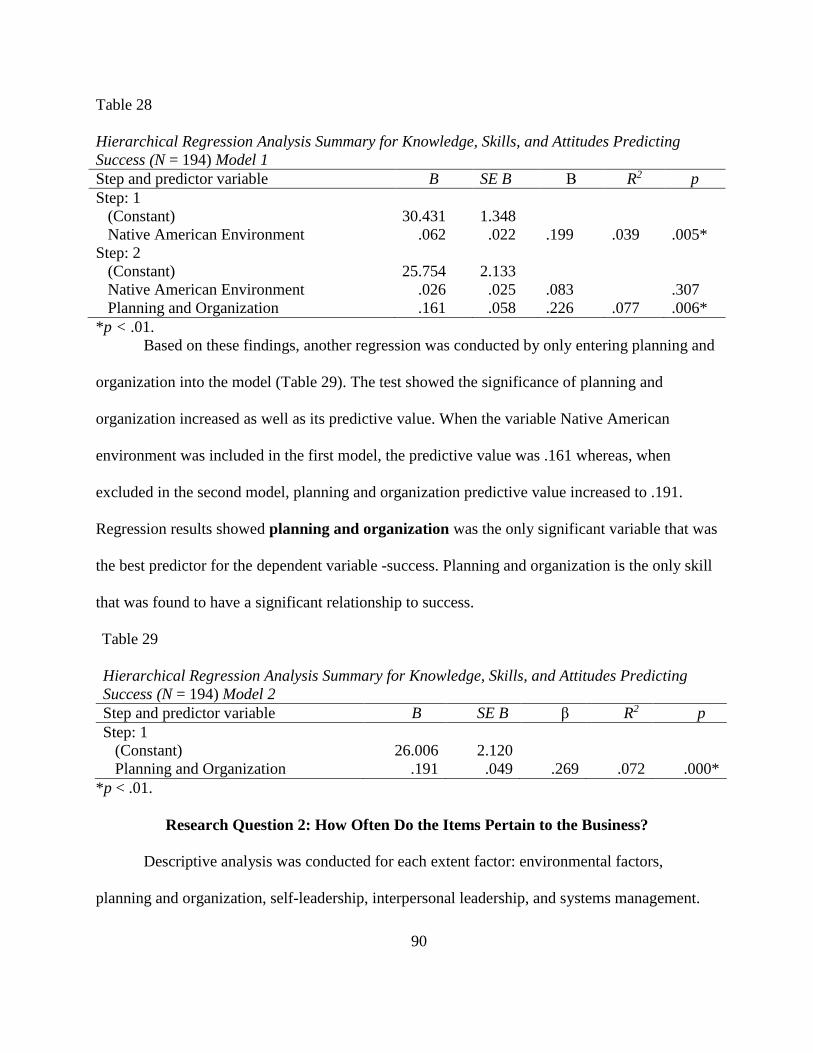
90
Table 28
Hierarchical Regression Analysis Summary for Knowledge, Skills, and Attitudes Predicting
Success (N = 194) Model 1
Step and predictor variable B SE B Β R2 p
Step: 1
(Constant) 30.431 1.348
Native American Environment .062 .022 .199 .039 .005*
Step: 2
(Constant) 25.754 2.133
Native American Environment .026 .025 .083 .307
Planning and Organization .161 .058 .226 .077 .006*
*p < .01.
Based on these findings, another regression was conducted by only entering planning and
organization into the model (Table 29). The test showed the significance of planning and
organization increased as well as its predictive value. When the variable Native American
environment was included in the first model, the predictive value was .161 whereas, when
excluded in the second model, planning and organization predictive value increased to .191.
Regression results showed planning and organization was the only significant variable that was
the best predictor for the dependent variable -success. Planning and organization is the only skill
that was found to have a significant relationship to success.
Table 29
Hierarchical Regression Analysis Summary for Knowledge, Skills, and Attitudes Predicting
Success (N = 194) Model 2
Step and predictor variable B SE B β R2 p
Step: 1
(Constant) 26.006 2.120
Planning and Organization .191 .049 .269 .072 .000*
*p < .01.
Research Question 2: How Often Do the Items Pertain to the Business?
Descriptive analysis was conducted for each extent factor: environmental factors,
planning and organization, self-leadership, interpersonal leadership, and systems management.

91
Respondents were given a set of items to determine how often the items pertained to the success
of their business. Using SPSS software, data from these responses were used to compute
measures of central tendency and variability of responses to each factor. Mean and standard
deviation values were then extracted and tabulated.
Data from the responses to the environmental factor-extent items are shown in Table 30
and Table 31. Of the total respondents, 82% indicated the business owner always (M = 4.264; SD
= 1.0810) encouraged the development of Native American owned private businesses that are not
tribally owned (EFQ1); 53% indicated the business owner often or always (M = 3.500; SD =
1.235) build trust and cooperate with Native American entrepreneurs (EFQ8); 39% indicated the
business owner often or always (M = 3.186; SD = 1.2983) met with Native American business
owners to share goals, visions, and concerns (EFQ2) and 43% to indicated the business owner
often or always (M = 3.120; SD = 1.3738) supported partnerships between tribal governments,
tribal colleges, business development centers, business owners, and tribal members to help
business owners in their business development efforts (EFQ14).
On the other hand, only 11% indicated the business owner often or always (M = 1.875;
SD = 1.1893) hosted conferences or summits to exchange ideas about economic development
opportunities (EFQ6); 14% of all respondents indicated the business owner often or always (M =
1.937; SD = 1.1087) set up mentoring programs among various tribal business owners to provide
computer support such as Web site development, Internet sales, trademark or copyright
protection (EFQ17); 15% indicated the business owner often or always (M = 2.021; SD =
1.3114) formed committees or groups to establish an enforceable copyright or trademark
registration system to protect Native American business owners from unlawful Internet
reproducing of tribal intellectual property (EFQ16); and 23% indicated the business owner often

92
or always (M = 2.177; SD = 1.2836) established a way for local business owners to work
together to lower insurance and marketing costs (EFQ11).
Therefore, based on percentages, means and standard deviation values, respondents
indicated the environmental factor-extent items they felt often or always pertained to the
success of their business were: encouraging the development of Native American owned private
businesses that are not tribally owned (EFQ1); building trust and cooperation with Native
American entrepreneurs (EFQ8); meeting with Native American business owners to share goals,
visions, and concerns (EFQ2); and supporting partnerships between tribal governments, tribal
colleges, business development centers, business owners, and tribal members to help business
owners in their business development efforts (EFQ14).
The environmental factor-extent items the respondents felt least pertained to the
success of the business were: for a business to hosts conferences or summits to exchange ideas
about economic development opportunities (EFQ6); to set up mentoring programs among
various tribal business owners to provide computer support such as Web site development,
Internet sales, trademark or copyright protection (EFQ17); to form committees or groups to
establish an enforceable copyright or trademark registration system to protect Native American
business owners from unlawful Internet reproducing of tribal intellectual property (EFQ16); and
to establish a way for local business owners to work together to lower insurance and marketing
costs (EFQ11).

93
Table 30
Frequency Statistics-Environmental Factors-Extent
N = Never; R = Rarely; S = Sometimes; O = Often; A = Always; N = Sample Size
Environmental Factors N R S O A N I encourage the development
of Native American owned
private businesses that are
not tribally owned (EFQ1).
7 (3.6%) 12 (6.2%) 16 (8.2%) 47 (24.3%) 112 (57.7) 194
I build trust and cooperate
with Native American
entrepreneurs (EFQ8).
14 (17.2%) 29 (14.9%) 49 (25.3%) 50 (25.8%) 52 (26.8%) 194
I meet with Native American
business owners to share
goals, visions, and concerns
(EFQ2).
22 (11.3%) 39 (20.1%) 57 (29.4%) 33 (17.0%) 43 (22.2%) 194
I support partnerships
between tribal governments,
tribal colleges, business
development centers,
business owners, and tribal
members to help business
owners in their business
development efforts
(EFQ14).
29 (14.9%) 44 (22.8%) 37 (19.0%) 43 (22.2%) 41 (21.1%) 194
I involve tribal community
members and advocates in
planning and decisions that
support Native American
business owners (EFQ4).
23 (11.9%) 30 (15.5%) 75 (38.5%) 36 (18.6%) 30 (15.5%) 194
I encourage adopting
uniform commercial codes to
set procedures and protocols
to ease investor anxiety
about supporting business in
Indian country (EFQ7).
30 (15.5%) 34 (17.5%) 57 (29.4%) 39 (20.1%) 34 (17.5%) 194
I provide business support
that addresses issues such as
tax assistance, marketing,
budgeting, insurance, credit
and business planning
(EFQ9).
40 (20.6%) 48 (24.7%) 41 (21.2%) 32 (16.5%) 33 (17.0%) 194

94
Table 30. Frequency Statistics-Environmental Factors-Extent (continued)
N = Never; R = Rarely; S = Sometimes; O = Often; A = Always; N = Sample Size
Environmental Factors N R S O A N I bring Native American
entrepreneurs and tribal
leaders together to learn
about political barriers
facing business owners and
what tribal leaders can do to
remove them (EFQ5).
38 (19.6%) 47 (24.2%) 57 (29.4%) 16 (8.2%) 6 (18.6%) 194
I establish collaborative
relations between local K-12
schools, business owners,
and community members to
optimize and enhance
technology skills (EFQ15).
58 (29.9%) 38 (19.6%) 43 (22.1%) 31 (16.0%) 24 (12.4%) 194
I coordinate cooperation
between lending institutions,
foundations, private
companies, and federal
agencies to establish a
community revolving loan
fund or small business loan
program (EFQ10).
58 (29.9%) 41 (21.1%) 43 (22.2%) 24 (12.4%) 28 (14.4%) 194
I facilitate cooperation
between local tribal colleges,
tribal education centers, or
business development
centers to help business
owners develop sound and
creative business plans
(EFQ12).
68 (35.1%) 37 (19 %) 38 (19.6%) 38 (19.6%) 13 (6.7%) 194
I situate technology within
overall nation-building goals
as one tool to improve
economic development on
tribal lands (EFQ13).
56 (28.9%) 61 (31.3%) 36 (18.6%) 36 (18.6%) 5 (2.6%) 194
I convene groups or
committees to determine
what kind of cultural
property is appropriate for
sale or public access (EFQ3).
77 (39.7%) 48 (24.7%) 37 (19.1%) 13 (6.7%) 19 (9.8%) 194

95
Table 30. Frequency Statistics-Environmental Factors-Extent (continued)
N = Never; R = Rarely; S = Sometimes; O = Often; A = Always; N = Sample Size
Environmental Factors N R S O A N I establish a way for local
business owners to work
together to lower insurance and
marketing costs (EFQ11).
91 (46.9%) 27 (13.9%) 32 (16.5%) 39 (20.1%) 5 (2.6%) 194
I form committees or groups to
establish an enforceable
copyright or trademark
registration system to protect
Native American business
owners from unlawful Internet
reproducing of tribal
intellectual property (EFQ16).
101 (52.1%) 34 (17.4%) 30 (15.5%) 12 (6.2%) 17 (8.8%) 194
I set up mentoring programs
among various tribal business
owners to provide computer
support such as Web site
development, Internet sales,
trademark or copyright
protection (EFQ17).
97 (50.0%) 40 (20.7%) 29 (14.9%) 28 (14.4%) 0 194
My business hosts conferences
or summits to exchange ideas
about economic development
opportunities (EFQ6).
107 (55.2%) 36 (18.4%) 30 (15.5%) 10 (5.2%) 11 (5.7%) 194
Table 31
Descriptive Statistics for Environmental Factors-Extent Item N M SD
I encourage the development of Native American owned private businesses
that are not tribally owned (EFQ1).
194 4.264 1.0810
I build trust and cooperate with Native American entrepreneurs (EFQ8).
194 3.500 1.2353
I meet with Native American business owners to share goals, visions, and
concerns (EFQ2).
194 3.186 1.2983
I support partnerships between tribal governments, tribal colleges, business
development centers, business owners, and tribal members to help business
owners in their business development efforts (EFQ14).
194 3.120 1.3738
I involve tribal community members and advocates in planning and
decisions that support Native American business owners (EFQ4).
194 3.105 1.1956

96
Table 31. Descriptive Statistics for Environmental Factors-Extent (continued)
Item N M SD I encourage adopting uniform commercial codes to set procedures and
protocols to ease investor anxiety about supporting business in Indian
country (EFQ7).
194 3.068 1.3039
I provide business support that addresses issues such as tax assistance,
marketing, budgeting, insurance, credit and business planning (EFQ9).
194 2.843 1.3795
I bring Native American entrepreneurs and tribal leaders together to learn
about political barriers facing business owners and what tribal leaders can
do to remove them (EFQ5).
194 2.818 1.3517
I establish collaborative relations between local K-12 schools, business
owners, and community members to optimize and enhance technology
skills (EFQ15).
194 2.607 1.3800
I coordinate cooperation between lending institutions, foundations,
private companies, and federal agencies to establish a community
revolving loan fund or small business loan program (EFQ10).
194 2.599 1.3997
I facilitate cooperation between local tribal colleges, tribal education
centers, or business development centers to help business owners develop
sound and creative business plans (EFQ12)
194 2.445 1.3217
I situate technology within overall nation-building goals as one tool to
improve economic development on tribal lands (EFQ13).
194 2.351 1.1551
I convene groups or committees to determine what kind of cultural
property is appropriate for sale or public access (EFQ3).
194 2.222 1.3026
I establish a way for local business owners to work together to lower
insurance and marketing costs (EFQ11).
194 2.177 1.2836
I form committees or groups to establish an enforceable copyright or
trademark registration system to protect Native American business
owners from unlawful Internet reproducing of tribal intellectual property
(EFQ16).
194 2.021 1.3114
I set up mentoring programs among various tribal business owners to
provide computer support such as Web site development, Internet sales,
trademark or copyright protection (EFQ17).
194 1.937 1.1087
My business hosts conferences or summits to exchange ideas about
economic development opportunities (EFQ6).
194 1.875 1.1893

97
Data from the responses to the planning and organization-extent items are shown in
Table 32 and Table 33. Overall, the majority of the respondents indicated the business owner
often or always used the planning and organization items as it pertained to the business. Of all
the respondents, 86% indicated the business owner often or always (M = 4.402; SD = 8.536) took
take time to plan the path of the business (POQ18); 87% indicated the business owner often or
always (M = 4.396; SD = .9159) worked a lot more hours in the business compared to other
employees (POQ21); and 86% indicated the business owner often or always (M = 4.280; SD =
.9130) valued long-term potential over short-term thinking (POQ20).
On the other hand, 48% indicated the business owner often or always (M = 3.340; SD =
1.0552) made the effort to react to events as they occur rather than make detailed plans (POQ24);
55% indicated the business owner often or always (M = 3.712; SD = 1.2657) had a written
business plan (POQ22); and 60% of all respondents indicated the business owner often or always
(M = 3.799; SD = 1.0782) set up mentoring programs among various tribal business owners to
provide computer support such as Web site development, Internet sales, trademark or copyright
protection (POQ19).
Therefore, based on percentages, means and standard deviation values, respondents
indicated the planning and organization-extent items which often or always pertained to the
success of their business were: take time to plan the path of the business (POQ18); work a lot
more hours in the business compared to other employees (POQ21); and value long-term potential
over short-term thinking (POQ20).
The planning and organization-extent item the respondents felt least pertained to the
success of the business was: to make the effort to react to events as they occur rather than make
detailed plans (POQ24).

98
Table 32
Frequency Statistics-Planning and Organization-Extent
N = Never; R = Rarely; S = Sometimes; O = Often; A = Always; N = Sample Size
Planning and Organization N R S O A N
I take time to plan the path of
my business (POQ18).
2 (1.0%) 5 (2.6%) 20 (10.3%) 53 (27.3%) 114 (58.8%) 194
On average, I tend to work a lot
more hours in the business
compared to other employees
(POQ21).
3 (1.5 %) 9 (4.6%) 13 (6.7%) 53 (27.4%) 116 (59.8%) 194
I value long-term potential over
short-term thinking (POQ20).
5 (2.6%) 4 (2.1%) 19 (9.8%) 70 (36.0%) 96 (49.5%) 194
I act as a role model to
communicate my values to
subordinates (POQ23).
2 (1.0%) 5 (2.6%) 35 (18.0%) 61 (31.5%) 91 (46.9%) 194
When planning, I use
information from stakeholders
such as customers, suppliers,
and employees (POQ26).
3 (1.5%) 10 (5.2%) 32 (16.5%) 58 (29.9%) 91 (46.9%) 194
I am aware of events occurring
outside the company (POQ25).
3 (1.5%) 6 (3.1%) 41 (21.1%) 71 (36.7%) 73 (37.6%) 194
I make constant changes to my
business plan according to the
economy and business factors
(POQ27).
8 (4.1%) 7 (3.6%) 50 (25.8%) 60 (30.9%) 69 (35.6%) 194
My employees can clearly
articulate the goals and values
of my company (POQ19).
11 (5.7%) 4 (2.1%) 62 (31.9%) 57 (29.4%) 60 (30.9%) 194
I have a written business plan
(POQ22).
16 (8.2%) 11 (5.7%) 61 (31.4%) 30 (15.5%) 76 (39.2%) 194
I make the effort to react to
events as they occur rather than
make detailed plans (POQ24).
18 (9.3%) 12 (6.2%) 71 (36.6%) 73 (37.6%) 20 (10.3%) 194

99
Table 33
Descriptive Statistics for Planning and Organization-Extent
Item N M SD
I take time to plan the path of my business (POQ18). 194 4.402 .8536
On average, I tend to work a lot more hours in the business compared to
other employees (POQ21).
194 4.396 .9159
I value long-term potential over short-term thinking (POQ20).
194 4.280 .9130
I act as a role model to communicate my values to subordinates (POQ23).
194 4.213 .8976
When planning, I use information from stakeholders such as customers,
suppliers, and employees (POQ26).
194 4.155 .9799
I am aware of events occurring outside the company (POQ25).
194 4.057 .9229
I make constant changes to my business plan according to the economy
and business factors (POQ27).
194 3.901 1.0606
My employees can clearly articulate the goals and values of my company
(POQ19).
194 3.799 1.0782
I have a written business plan (POQ22).
194 3.712 1.2657
I make the effort to react to events as they occur rather than make detailed
plans (POQ24).
194 3.340 1.0552
Self-leadership-extent item responses are shown in Table 34 and Table 35. Of the total
respondents, 78% indicated the business owner often or always (M = 4.232; SD = .8832) project
a high degree of self-confidence (SLQ32); 79% indicated the business owner often or always (M
= 4.144; SD = .9548) exhibited a high degree of technical proficiency in the field (SLQ28); and
73% indicated the business owner often or always (M = 4.057; SD = .9984) had the courage to
make commitments that would be considered risky by others as it pertained to the success of the
business (SLQ29).
On the other hand, only 42 % of all respondents indicated the business owner often or
always (M = 3.171; SD = 1.2371) be quick to take action without spending a lot of time to find
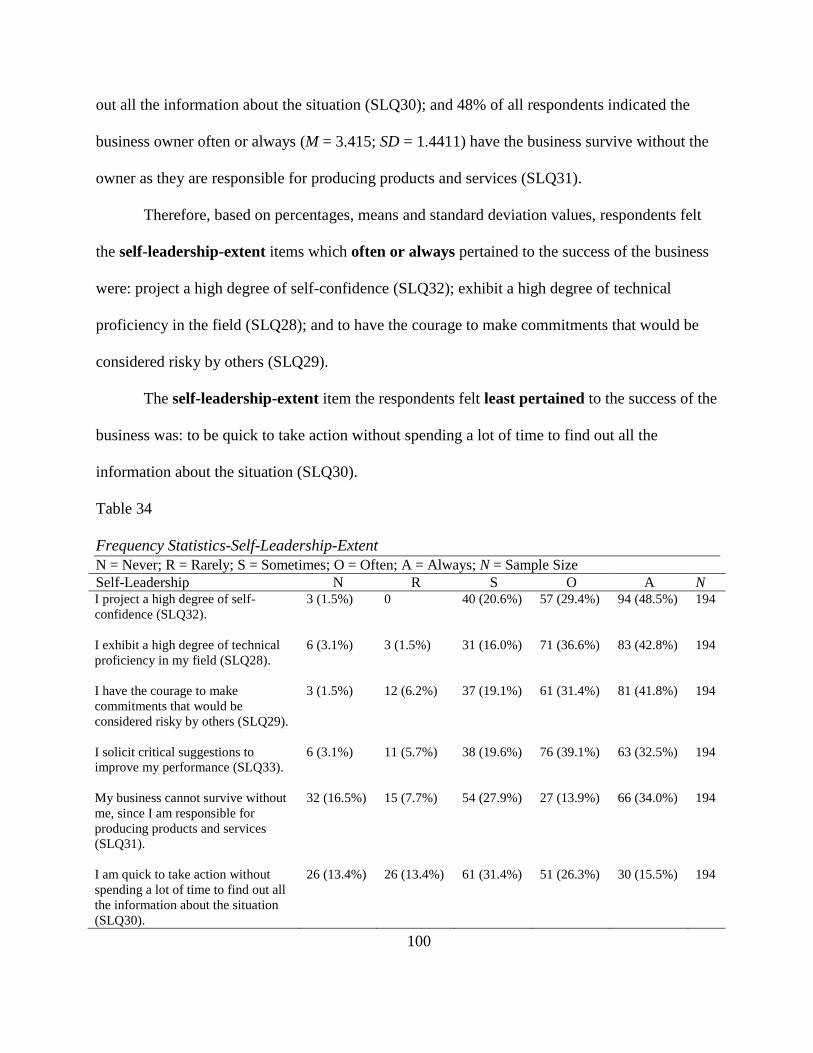
100
out all the information about the situation (SLQ30); and 48% of all respondents indicated the
business owner often or always (M = 3.415; SD = 1.4411) have the business survive without the
owner as they are responsible for producing products and services (SLQ31).
Therefore, based on percentages, means and standard deviation values, respondents felt
the self-leadership-extent items which often or always pertained to the success of the business
were: project a high degree of self-confidence (SLQ32); exhibit a high degree of technical
proficiency in the field (SLQ28); and to have the courage to make commitments that would be
considered risky by others (SLQ29).
The self-leadership-extent item the respondents felt least pertained to the success of the
business was: to be quick to take action without spending a lot of time to find out all the
information about the situation (SLQ30).
Table 34
Frequency Statistics-Self-Leadership-Extent
N = Never; R = Rarely; S = Sometimes; O = Often; A = Always; N = Sample Size Self-Leadership N R S O A N I project a high degree of self-
confidence (SLQ32).
3 (1.5%) 0 40 (20.6%) 57 (29.4%) 94 (48.5%) 194
I exhibit a high degree of technical
proficiency in my field (SLQ28).
6 (3.1%) 3 (1.5%) 31 (16.0%) 71 (36.6%) 83 (42.8%) 194
I have the courage to make
commitments that would be
considered risky by others (SLQ29).
3 (1.5%) 12 (6.2%) 37 (19.1%) 61 (31.4%) 81 (41.8%) 194
I solicit critical suggestions to
improve my performance (SLQ33).
6 (3.1%) 11 (5.7%) 38 (19.6%) 76 (39.1%) 63 (32.5%) 194
My business cannot survive without
me, since I am responsible for
producing products and services
(SLQ31).
32 (16.5%) 15 (7.7%) 54 (27.9%) 27 (13.9%) 66 (34.0%) 194
I am quick to take action without
spending a lot of time to find out all
the information about the situation
(SLQ30).
26 (13.4%) 26 (13.4%) 61 (31.4%) 51 (26.3%) 30 (15.5%) 194
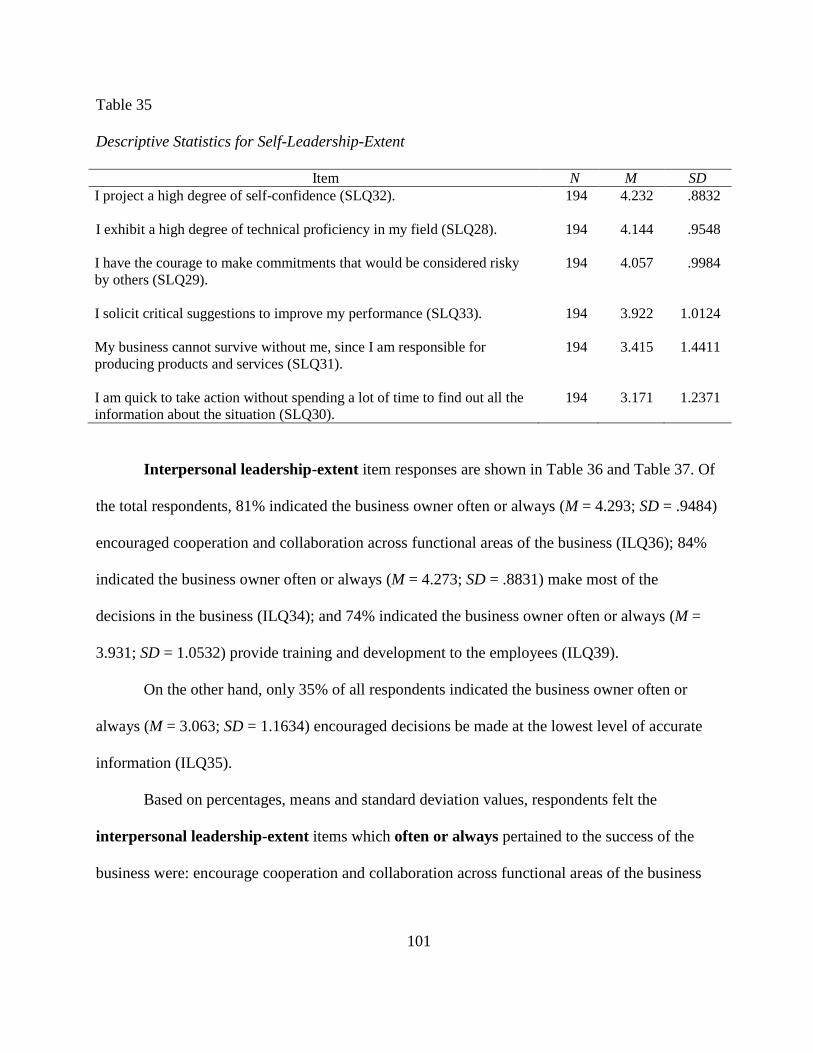
101
Table 35
Descriptive Statistics for Self-Leadership-Extent
Item N M SD
I project a high degree of self-confidence (SLQ32).
194 4.232 .8832
I exhibit a high degree of technical proficiency in my field (SLQ28).
194 4.144 .9548
I have the courage to make commitments that would be considered risky
by others (SLQ29).
194 4.057 .9984
I solicit critical suggestions to improve my performance (SLQ33).
194 3.922 1.0124
My business cannot survive without me, since I am responsible for
producing products and services (SLQ31).
194 3.415 1.4411
I am quick to take action without spending a lot of time to find out all the
information about the situation (SLQ30).
194 3.171 1.2371
Interpersonal leadership-extent item responses are shown in Table 36 and Table 37. Of
the total respondents, 81% indicated the business owner often or always (M = 4.293; SD = .9484)
encouraged cooperation and collaboration across functional areas of the business (ILQ36); 84%
indicated the business owner often or always (M = 4.273; SD = .8831) make most of the
decisions in the business (ILQ34); and 74% indicated the business owner often or always (M =
3.931; SD = 1.0532) provide training and development to the employees (ILQ39).
On the other hand, only 35% of all respondents indicated the business owner often or
always (M = 3.063; SD = 1.1634) encouraged decisions be made at the lowest level of accurate
information (ILQ35).
Based on percentages, means and standard deviation values, respondents felt the
interpersonal leadership-extent items which often or always pertained to the success of the
business were: encourage cooperation and collaboration across functional areas of the business

102
(ILQ36); make most of the decisions in the business (ILQ34); and provide training and
development to the employees (ILQ39).
The interpersonal leadership-extent item the respondents felt least pertained to the
success of the business was: to encourage decisions be made at the lowest level of accurate
information (ILQ35).
Table 36
Frequency Statistics-Interpersonal Leadership-Extent
N = Never; R = Rarely; S = Sometimes; O = Often; A = Always; N = Sample Size
Interpersonal Leadership N R S O A N
I encourage cooperation and
collaboration across functional
areas of my business (ILQ36).
6 (3.1%) 0 31 (16.0%) 52 (26.8%) 105 (54.1%) 194
I make most of the decisions in
the business (ILQ34).
3 (1.5%) 5 (2.6%) 23 (11.9%) 68 (35.1%) 95 (49.0%) 194
I provide training and
development to my employees.
(ILQ39.
9 (4.6%) 9 (4.6%) 33 (17.0%) 78 (40.3%) 65 (33.5%) 194
I encourage my employees to
experiment with new ideas and
concepts to create innovative
approaches (ILQ37).
11 (5.7%) 7 (3.6%) 38 (19.6%) 84 (43.3%) 54 (27.8%) 194
I successfully select people
(ILQ40).
9 (4.6%) 10 (5.2%) 34 (17.5%) 110 (56.7%) 31 (16.0%) 194
My employees know they
should avoid failure in my
business at all costs (ILQ38).
25 (12.9%) 7 (3.6%0 60 (30.9%) 44 (22.7%) 58 (29.9%) 194
Decisions in the business are
based on information from my
staff (ILQ41).
18 (9.3%) 14 (7.2%) 39 (20.1%) 99 (51.0%) 24 (12.4%) 194
I encourage decisions to be
made at the lowest level of
accurate information (ILQ35).
28 (14.4%) 20 (10.3%) 79 (40.8%) 46 (23.7%) 21 (10.8%) 194

103
Table 37
Descriptive Statistics for Interpersonal Leadership-Extent
Item N M SD
I encourage cooperation and collaboration across functional areas of my
business (ILQ36).
194 4.293 .9484
I make most of the decisions in the business (ILQ34).
194 4.273 .8831
I provide training and development to my employees (ILQ39).
194 3.931 1.0532
I encourage my employees to experiment with new ideas and concepts to
create innovative approaches (ILQ37).
194 3.837 1.0529
I successfully select people (ILQ40).
194 3.731 .9456
My employees know they should avoid failure in my business at all costs
(ILQ38).
194 3.521 1.3025
Decisions in the business are based on information from my staff
(ILQ41).
194 3.481 1.0933
I encourage decisions to be made at the lowest level of accurate
information (ILQ35).
194 3.063 1.1634
Data from the responses to the systems management-extent items are shown in Table 38
and Table 39. Of the total respondents, 82% indicated the business owner often or always (M =
4.232; SD = 1.1007) know what the businesses gross margins are (SYMQ46); 79% indicated the
business owner often or always (M = 4.166; SD = .9068) be aware of the product/services and
pricing structure of competitors (SYMQ44); 78% indicated the business owner often or always
(M = 4.073; SD = 1.0845) understand how financial statements depict the business (SYMQ48);
and 70% indicated the business owner often or always (M = 4.042; SD = 1.0323) critically
analyze past performance and future opportunities and take actions to enhance performance
(SYMQ50).

104
On the other hand, only 41% of the total respondents indicated the business owner often
or always (M = 3.219; SD = 1.3289) actively engage in surveying the businesses customers
(SYMQ52); and 45% indicated the business owner often or always (M = 3.325; SD = 1.3655)
know the return on investment of the advertising campaigns (SYMQ45).
Based on percentages, means and standard deviation values, respondents felt the systems
management-extent items which often or always pertained to the success of the business were:
know what the businesses gross margins are (SYMQ46); be aware of the product/services and
pricing structure of competitors (SYMQ44); understand how financial statements depict the
business (SYMQ48) and critically analyze past performance and future opportunities and take
actions to enhance performance (SYMQ50).
The systems management-extent item the respondents felt least pertained to the
success of the business was to actively engage in surveying the businesses customers
(SYMQ52).
Table 38
Frequency Statistics-Systems Management-Extent
N = Never; R = Rarely; S = Sometimes; O = Often; A = Always; N = Sample Size
Systems Management N R S O A N
I know what my gross
margins are (SYMQ46).
13 (6.7%) 0 22 (11.3%) 54 (27.9%) 105 (54.1%) 194
I am aware of the
product/services and pricing
structure of my competitors
(SYMQ44).
2 (1.0%) 8 (4.1%) 30 (15.5%) 70 (36.1%) 84 (43.3%) 194
I understand how financial
statements depict my business
(SYMQ48).
11 (5.7%) 5 (2.6%) 26 (13.4%) 69 (35.5%) 83 (42.8%) 194
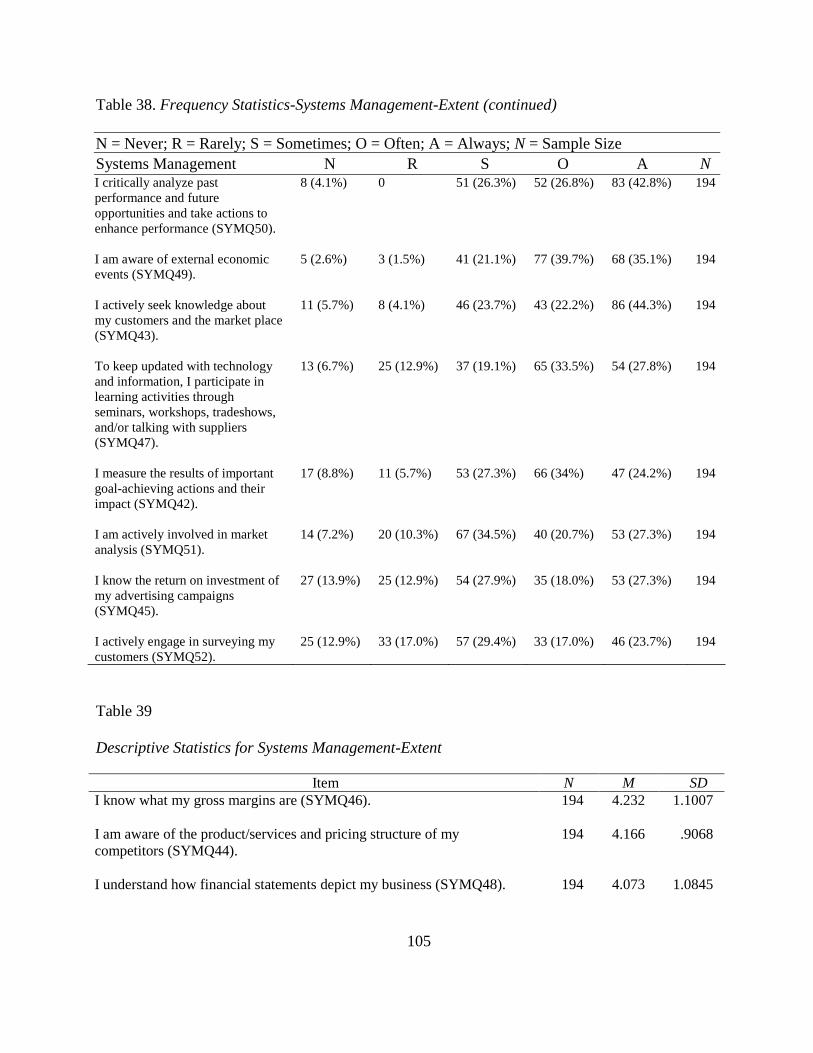
105
Table 38. Frequency Statistics-Systems Management-Extent (continued)
N = Never; R = Rarely; S = Sometimes; O = Often; A = Always; N = Sample Size
Systems Management N R S O A N I critically analyze past
performance and future
opportunities and take actions to
enhance performance (SYMQ50).
8 (4.1%) 0 51 (26.3%) 52 (26.8%) 83 (42.8%) 194
I am aware of external economic
events (SYMQ49).
5 (2.6%) 3 (1.5%) 41 (21.1%) 77 (39.7%) 68 (35.1%) 194
I actively seek knowledge about
my customers and the market place
(SYMQ43).
11 (5.7%) 8 (4.1%) 46 (23.7%) 43 (22.2%) 86 (44.3%) 194
To keep updated with technology
and information, I participate in
learning activities through
seminars, workshops, tradeshows,
and/or talking with suppliers
(SYMQ47).
13 (6.7%) 25 (12.9%) 37 (19.1%) 65 (33.5%) 54 (27.8%) 194
I measure the results of important
goal-achieving actions and their
impact (SYMQ42).
17 (8.8%) 11 (5.7%) 53 (27.3%) 66 (34%) 47 (24.2%) 194
I am actively involved in market
analysis (SYMQ51).
14 (7.2%) 20 (10.3%) 67 (34.5%) 40 (20.7%) 53 (27.3%) 194
I know the return on investment of
my advertising campaigns
(SYMQ45).
27 (13.9%) 25 (12.9%) 54 (27.9%) 35 (18.0%) 53 (27.3%) 194
I actively engage in surveying my
customers (SYMQ52).
25 (12.9%) 33 (17.0%) 57 (29.4%) 33 (17.0%) 46 (23.7%) 194
Table 39
Descriptive Statistics for Systems Management-Extent
Item N M SD
I know what my gross margins are (SYMQ46).
194 4.232 1.1007
I am aware of the product/services and pricing structure of my
competitors (SYMQ44).
194 4.166 .9068
I understand how financial statements depict my business (SYMQ48).
194 4.073 1.0845

106
Table 39. Descriptive Statistics for Systems Management-Extent (continued)
Item N M SD I critically analyze past performance and future opportunities and take
actions to enhance performance (SYMQ50).
194 4.042 1.0323
I am aware of external economic events (SYMQ49).
194 4.031 .9269
I actively seek knowledge about my customers and the market place
(SYMQ43).
194 3.953 1.1664
To keep updated with technology and information, I participate in
learning activities through seminars, workshops, tradeshows, and/or
talking with suppliers (SYMQ47).
194 3.623 1.2063
I measure the results of important goal-achieving actions and their impact
(SYMQ42).
194 3.586 1.1703
I am actively involved in market analysis (SYMQ51).
194 3.503 1.2007
I know the return on investment of my advertising campaigns (SYMQ45).
194 3.325 1.3655
I actively engage in surveying my customers (SYMQ52). 194 3.219 1.3289
Pearson Correlation for Environmental Factors-Extent
In addressing the second research question, Pearson correlation analysis, factor analysis,
and independent samples t-test was conducted. The second measure of “to what extent” was used
to determine whether the environmental factors, were related to each other or if they were
independent from each other, Pearson correlation analysis was computed using SPSS. The test
was run to determine whether the items were significantly related, and if so, could they be
combined into one independent variable-environmental factors-extent.
The correlation analysis of environmental factors-extent in Table 40 indicated the items
were all positively correlated. The correlation analysis of environmental factors-extent indicated
the relationships ranged from weak to moderate correlations. The items found to have the
strongest correlation included: (a) I involve tribal community members and advocates in
107
planning and decisions that support Native American business owners, (b) I encourage adopting
uniform commercial codes to set procedures and protocols to ease investor anxiety about
supporting business in Indian country, and (c) I provide business support that addresses issues
such as tax assistance, marketing, budgeting, insurance, credit and business planning. The
remaining items were found to have a weak correlation.
The relationship between I encourage the development of Native American owned
private businesses that are not tribally owned and I establish a way for local business owners to
work together to lower insurance and marketing costs is much weaker than the relationship
between I facilitate cooperation between local tribal colleges, tribal education centers, or
business development centers to help business owners develop sound and creative business plans
and I establish collaborative relations between K-12 schools, business owners, and community
members to optimize and enhance technology skills. Meaning if owners work with local tribal
colleges, tribal education centers, or business development centers to help business owners
develop sound and creative business plans chances are there is a greater relationship with them in
optimizing and enhancing technology skills through established relationships with K-12 schools,
business owners and community members.
Whereas, the weaker relationship between I encourage the development of Native
American owned private businesses that are not tribally owned and I establish a way for local
business owners to work together to lower insurance and marketing costs would mean although I
encourage the development of Native American owned private businesses that are not tribally
owned it does not necessarily mean I would establish a way to lower their insurance and
marketing costs. They are not as closely related as the previous experience.

108
Table 40
Pearson Product Moment Correlations for Environmental Factors-Extent 1
2
3
4
5
6
7
8
9
10
11
12
13
14
15
16
17
EFQ1
____ .285** .263** .302** .299** .201** .304** .104 .347** .096 .083 .213** .103 .201** .165** .109 .078
EFQ2
.285** ____ .552** .556** .636** .515** .412** .462** .607** .585** .581** .617** .523** .473** .506** .534** .566**
EFQ3
.263** .552** ____ .430** .517** .610** .397** .349** .486** .561** .451** .577** .533** .491** .527** .531** .429**
EFQ4
.302** .556** .430** ____ .554** .378** .255** .375** .501** .447** .352** .453** .331** .301** .284** .408** .429**
EFQ5
.299** .636** .517** .554** ____ .705** .501** .299** .724** .644** .603** .545** .503** .461** .438** .541** .560**
EFQ6
.201** .515** .628** .446** .675** ____ .552** .316** .521** .664** .706** .511** .542** .266** .400** .532** .604**
EFQ7
.304** .412** .397** .255** .501** .346** ____ .147* .439** .554** .578** .681** .501** .603** .578** .526** .526**
EFQ8
.104 .462** .349** .375** .299** .151* .147* ____ .394** .387** .250** .393** .241** .318** .377** .205** .276**
EFQ9
.347** .607** .486** .501** .742** .609** .439** .394** ____ .682** .610** .636** .538** .585** .427** .458** .587**
EFQ10
.096 .585** .561** .447** .644** .594** .554** .387** .682** ____ .688** .736** .649** .607** .613** .573** .712**
EFQ11
.083 .581** .451** .352*8 .603** .599** .578** .250** .610** .688** ____ .748** .782** .519** .651** .724** .758**
EFQ12
.213** .617** .577** .453** .545** .495** .681** .393** .636** .736** .748** ____ .703** .664** .819** .620** .641**
EFQ13
.103 .523** .533** .331** .503** .542** .501** .241** .538** .649** .728** .703** ____ .430** .625** .717** .713**
EFQ14
.201** .473** .491** .301** .461** .423** .603** .318** .585** .607** .519** .664** .430** ____ .545** .445** .457**
EFQ15
.165** .506** .527** .284** .438** .393** .578** .377** .427** .613** .651** .819** .625** .545** ____ .629** .523**
EFQ16
.109** .534** .531** .309** .541** .537** .526** .205** .458** .573** .724** .620** .717** .445** .629** ____ .689**
EFQ17
.078 .566** .429** .333** .560** .560** .526** .276** .587** .712** .758** .641** .713** .457** .523** .689** ____

109
Table 40. Pearson Product Moment Correlations for Environmental Factors-Extent (continued)
Note. N = 194.
EFQ1 = I encourage the development of Native American owned private businesses that are not tribally owned
EFQ2 = I meet with Native American business owners to share goals, visions, and concerns
EFQ3 = I convene groups or committees to determine what kind of cultural property is appropriate for sale or public access
EFQ4 = I involve tribal community members and advocates in planning and decisions that support Native American business owners
EFQ5 = I bring Native American entrepreneurs and tribal leaders together to learn about political barriers facing business owners and what
tribal leaders can do to remove them
EFQ6 = My business hosts conferences or summits to exchange ideas about economic development opportunities;
EFQ7 = I encourage adopting uniform commercial codes to set procedures and protocols to ease investor anxiety about supporting business in
Indian country
EFQ8 = I build trust and cooperate with Native American entrepreneurs
EFQ9 = I provide business support that addresses issues such as tax assistance, marketing, budgeting, insurance, credit and business planning;
EFQ10 =I coordinate cooperation between lending institutions, foundations, private companies, and federal agencies to establish a
community revolving loan fund or small business loan program
EFQ11 =I establish a way for local business owners to work together to lower insurance and marketing costs
EFQ12 =I facilitate cooperation between local tribal colleges, tribal education centers, or business development centers to help business
owners develop sound and creative business plan
EFQ13 =I situate technology within overall nation-building goals as one tool to improve economic development on tribal lands;
EFQ14 =I support partnerships between tribal governments, tribal colleges, business development centers, business owners, and tribal
members to help business owners in their business development efforts
EFQ15 =I establish collaborative relations between local K-12 schools, business owners, and community members to optimize and enhance
technology skills
EFQ16 =I form committees or groups to establish an enforceable copyright or trademark registration system to protect Native American
business owners from unlawful Internet reproducing of tribal intellectual property
EFQ17 =I set up mentoring programs among various tribal business owners to provide computer support such as Web site development,
Internet sales, trademark or copyright protection
* p < .05, two-tailed. **p < .01, two-tailed.

110
Factor Analysis-Environmental Factors-Extent
The next step was to run a factor analysis since the items indicated a strong correlation
among the items. A factor analysis was run to determine whether the 17 items would load on a
single factor or if there were additional factors they would load on. It was also run to determine
whether a single factor could be created for these items. This was done by conducting Varimax
rotation in SPSS. Table 41 indicates items 1-17 all loaded at a level greater than .4 except item
one which loaded at less than the acceptable level of loading, therefore this item was eliminated.
Communality values were well-defined by this factor analysis, with all variables exceeding .40
with an exception of items four and eight which had small amounts of variance of 32% and 20%.
Meaning these two items had very little in common with the other variables in the analysis;
therefore these items were also eliminated from the factor. The total analysis explained a total of
60.535% of the variance for the entire set of variables. The variables account for 61% of all the
variance in all the answers respondents provided which would indicate there could be a single
factor called Native American environment-extent.
Table 41
Factor Loadings from Principal Component Factor Analysis: Communalities, Eigenvalues, and
Percentages of Variance for Items for Native American Environment-Extent
Item Factor
loading
Communality I facilitate cooperation between local tribal colleges, tribal education centers,
or business development centers to help business owners develop sound and
creative business plans.
.875 .765
I establish a way for local business owners to work together to lower
insurance and marketing costs.
.861 .710
I coordinate cooperation between lending institutions, foundations, private
companies, and federal agencies to establish a community revolving loan
fund or small business loan program.
.849 .716

111
Table 41. Factor Loadings from Principal Component Factor Analysis: Communalities,
Eigenvalues, and Percentages of Variance for Items for Native American Environment-Extent
(continued)
Factor
Item loading Communality
I situate technology within overall nation-building goals as one tool to improve
economic development on tribal lands.
.811 .632
I set up mentoring programs among various tribal business owners to provide
computer support such as Web site development, Internet sales, trademark or
copyright protection.
.808 .628
I form committees or groups to establish an enforceable copyright or trademark
registration system to protect Native American business owners from unlawful
Internet reproducing of tribal intellectual property.
.786 .590
I provide business support that addresses issues such as tax assistance,
marketing, budgeting, insurance, credit and business planning.
.771 .618
I bring Native American entrepreneurs and tribal leaders together to learn about
political barriers facing business owners and what tribal leaders can do to
remove them.
.768 .609
I establish collaborative relations between local K-12 schools, business owners,
and community members to optimize and enhance technology skills.
.763 .571
I meet with Native American business owners to share goals, visions, and
concerns.
.744 .586
My business hosts conferences or summits to exchange ideas about economic
development opportunities.
.726 .516
I support partnerships between tribal governments, tribal colleges, business
development centers, business owners, and tribal members to help business
owners in their business development efforts.
.703 .490
I encourage adopting uniform commercial codes to set procedures and protocols
to ease investor anxiety about supporting business in Indian country.
.700 .473
I convene groups or committees to determine what kind of cultural property is
appropriate for sale or public access.
.698 .501
Eigenvalue 8.475
% of variance 60.535

112
In calculating reliability analysis, after eliminating items one, four and eight, Cronbach’s
alpha was .949 indicating the remaining items were very reliable. Based on the results of the
correlation analysis, factor analysis, and the Cronbach’s alpha, the fourteen environmental
factors can be combined together into one independent variable called Native American
environment-extent. Each respondent’s scores within the construct were added together to
create a new variable called Native American environment-extent. The scores ranged from 14-70
in the dataset.
Independent T-Test
The final step was to run an independent samples t-test to determine if there was a
statistically significant difference between emerging versus mature Native American owned
businesses. In a recent report by the Small Business Administration (SBA) almost half of all new
businesses survive five years or more and about one-third survive 10 years or more (SBA, 2012).
Many of these businesses are successful at the beginning but typically fail because of no long
range planning (Cornell & Kalt, 1998). In determining which businesses would be considered
emerging, the respondents who indicated their years of operation were 1-3 and 3-5 were defined
as emerging (N = 62). The businesses who indicated their years of operation as greater than five
were considered mature (N = 132).
A composite score of the environmental factors-extent was used for the test. For Native
American environmental factors-extent, the preliminary Levene’s test for equality of variances
indicated that the variances of the two groups, emerging versus mature businesses, were not
significantly different (p =.518), therefore an independent sample t-test was performed that
assumes equal variances. The results indicated when comparing Native American environmental
factors in emerging versus mature Native American owned businesses, the mature businesses
113
were significantly different (M = 48.01, SD = 15.95) versus emerging businesses (M = 42.15,
SD = 14.14), t(192) = -2.48, p = 0.01. Mature Native American owned businesses had
significantly higher means than emerging businesses when comparing Native American
environmental factors. Based on these results, this would suggest that mature Native American
owned businesses understand that even though Native American environmental factors showed
little significance under the measure “degree of importance”, these items still made a difference
in making them a mature business.
The preliminary Levene’s test was run for the factor planning and organization-extent.
The Levene’s test for equality of variances indicated that the variances of the two groups,
emerging versus mature businesses, were significantly different (p =0.001), therefore an
independent sample t-test was performed where equal variances were not assumed. The t-test
results indicated there is no significance difference when comparing the factor planning and
organization-extent and emerging versus mature Native American owned businesses. Planning
and organization-extent factors for emerging businesses (M = 31.37, SD = 3.93) were not
significantly different from mature businesses (M = 30.40, SD = 7.17), t(187.421) = 1.209, p =
0.228.
For systems management factors-extent, the preliminary Levene’s test for equality of
variances indicated that the variances of the two groups, emerging versus mature businesses,
were significantly different (p = 0.000), therefore an independent sample t-test was performed
where equal variances were not assumed. The t-test results indicated there is no significance
difference when comparing the factor systems management-extent and emerging versus mature
Native American owned businesses. Systems management-extent factors for emerging

114
businesses (M = 23.96, SD = 2.82) were not significantly different from mature businesses (M =
23.98, SD = 4.80), t(182.69) = -0.033, p = 0.974.
For interpersonal leadership factors-extent, the preliminary Levene’s test for equality of
variances indicated that the variances of the two groups, emerging versus mature businesses,
were significantly different (p = 0.003), therefore an independent sample t-test was performed,
where equal variances were not assumed. The t-test results indicated there is no significance
difference when comparing the factor interpersonal leadership-extent and emerging versus
mature Native American owned businesses. Interpersonal leadership-extent factors for emerging
businesses (M = 22.48, SD = 3.10) were not significantly different from mature businesses (M =
22.49, SD = 4.72), t(171.50) = -0.022, p = 0.983.
For self-leadership factors-extent, the preliminary Levene’s test for equality of variances
indicated that the variances of the two groups, emerging versus mature businesses, were not
significantly different (p =.079), therefore an independent sample t-test was performed that
assumes equal variances. The results indicated when comparing self-leadership factors in
emerging versus mature Native American owned businesses, the mature businesses were
significantly different (M = 14.31, SD = 3.13) versus emerging businesses (M = 15.28, SD =
2.58), t(192) = 2.125, p = 0.04. These results suggest the use of self-leadership skills do make a
difference for mature Native American owned businesses versus emerging businesses.
Specifically the results suggest that when emerging business owners’ exhibit skills such as
displaying high degree of technical proficiency and project a high degree of self-confidence they
are more apt to be successful.

115
CHAPTER 5. SUMMARY, CONCLUSIONS, AND RECOMMENDATIONS
In summary, the purpose of this study was to identify indicators of successful economic
development as it pertained to Native American owned businesses located on/or adjacent to
North Dakota reservations. More specifically this study sought to explore specific relationships
between the perceived level of importance of knowledge, skills, and attitudes and sustainable
Native American owned business ventures. The following research questions guided this study:
RQ1. How important are knowledge, skills, and attitudes to the sustainability of Native
American owned businesses?
RQ2. To what extent are Native American environmental factors, knowledge, skills, and
attitudes significant for emerging verses mature Native American owned
businesses?
It is believed that Native American owned businesses located on/or adjacent to North
Dakota reservations differ from mainstream America because of political and cultural
characteristics unique to the reservation. Mainstream America’s business culture is driven by
materialistic success, whereas Native American businesses on the other hand view family values
and community support as being more important. Previous research has found that Native
Americans who are successful in owning a business understand the culture and environment
where their business is located (Emery, et. al., 2006).
Using a quantitative correlation research design, 194 Native American owned businesses
located on/or adjacent to the four reservations in North Dakota: Spirit Lake, Standing Rock, Fort
Berthold, and Turtle Mountain responded to a self-administered 69 item survey instrument. The
instrument utilized for this study was an instrument that was used in a study conducted by Sun
(2004) and was designed to gain an understanding of how important each factor was to the
116
business owner and to what extent the business owner used each factor. The compiled research
data was analyzed using descriptive, factor analysis, correlations, t-tests, and regression analysis.
Conclusions
In this section of Chapter 5, the results from Chapter 4 will be discussed focusing on the
two major issues of how important are knowledge, skills, and attitudes to Native American
owned businesses and the extent of their usage by the business owners.
Conclusions for Research Question 1
Upon examining the means and standard deviation data from the environmental factors-
importance descriptive table (Table 16), results indicate Native American business owners are
more apt to encourage the development of Native American private businesses that are not
tribally owned rather than having their business host conferences or summits to exchange ideas
about economic development opportunities. The results indicate of the 17 environmental factor
items, only three items were considered to be important with the remaining items being
considered unimportant in attributing to the success of their business. Building trust and
cooperating with Native American entrepreneurs as well as partnering with tribal governments
and tribal colleges are also considered to be important.
In analyzing the descriptive results of the planning and organization-importance factor,
all but one item was found to be important (Table 18). Taking time to plan the path of the
business was considered to be the most important, whereas the businesses effort to react to
events as they occur was the least important.
In examining the descriptive table for the self-leadership factor-importance, Native
American owned business owners felt there were the same amount of items which would be
considered important as unimportant (Table 20). The number of unimportant items counteracted

117
the important items therefore making this factor even. The same can be concluded for the
Interpersonal Leadership-importance factor (Table 22). Results indicate five of the eight items
were deemed important, while the remaining three items were considered unimportant. The
results for the Systems Management-importance factor also had almost the same equal amount of
responses for the important and unimportant items (Table 24). In reviewing the means and
standard deviations for all the independent variables, it can be concluded that it’s possible to
already see why some of the independent variables might not be factors in the success of a
Native American owned business.
To determine which of these independent variables made an impact on business owners
success, a hierarchical regression was conducted between the dependent variable-success and the
five independent variables-environmental factors, planning and organization, self-leadership,
interpersonal leadership, and systems management.
The variable Native American environmental factor was entered first into the regression,
because earlier literature stated this variable made a significant difference for Native American
owned businesses. The results of the regression indicate this factor does make a significant
impact on Native American owned businesses (Table 28). However, when the other variables
were included in the regression, Native American environmental factor no longer was
significant. The only variable that was significant was planning and organization which is
consistent with the results indicated above in which all of the items in that factor, except for one,
were found to be important by Native American business owners. Additional information on the
importance of planning and organization will be further addressed in the recommendation
section.
118
Conclusions for Research Question 2
While it is useful to know how important these factors are, it is critical to know whether
the business owners use these factors or not and are the factors being used differently by
emerging versus mature businesses.
Upon examining the means and standard deviation data from the environmental factors-
extent descriptive table (Table 31), results indicate Native American business owners always
encouraged the development of Native American private businesses that are not tribally owned
more often than any other item in this factor. This finding is the same as what was found under
the importance finding. Business owners were also more likely to never host conferences or
summits to exchange ideas about economic development opportunities.
In analyzing the descriptive results of the planning and organization-extent factor, Native
American business owners felt the majority of the items always pertained to their business (Table
33). Results indicate Native American business owners always took time to plan the path of the
business but only sometimes made the effort to react to events as they occurred. This finding is
also the same as what was found under the importance finding.
In examining the descriptive table for the self-leadership factor-extent, Native American
owned business owners felt there were the same amount of items which pertained to their
business as those items that did not (Table 35). Results indicate Native American business
owners most always projected a high degree of self-confidence; whereas, they seldom took quick
action without spending a lot of time to find out all the information about the situation. The items
which most pertained to the business counteracted the items which did not pertain, therefore
making this factor even.

119
Upon examining the means and standard deviation data from the interpersonal
leadership-extent factor descriptive table (Table 37), results indicate only 2 of the 8 items
pertained to the Native American owned business. Native American business owners always
encouraged cooperation and collaboration across functional areas of the business and were most
likely to make most of the decisions in the business. The results for the systems management-
extent factor also had almost the same equal amount of responses for how the items pertained to
the business (Table 39).
We can conclude at this point, that Native American environmental factors are not very
important and are used very little and that it is the planning and organization factors that the
Native business owners are using. The means and standard deviation data is showing us that the
Native American environmental factors do not matter but planning and organization factors do.
However, this is not the end of the story. It is also critical to determine the usage of the
factors by emerging versus mature businesses; therefore independent t-tests were conducted to
compare emerging versus mature business owners.
When the two groups are subdivided, the results indicate mature businesses use Native
American environmental factors more than emerging businesses. Planning and organization
factors, systems management and interpersonal leadership factors were all used equally by both
emerging and mature businesses. For the self-leadership factor, results indicate emerging
businesses used this factor more than mature businesses.
Table 42 illustrates the results of the analyses on whether the factors are important and
whether the factors are being used by emerging and mature businesses.

120
Table 42
Summary of Analyses of Importance and Usage of Factors
Factor Importance Used
Native American Environmental Not Mature
Planning and Organization Is Both
Systems Management Not Neither
Interpersonal Leadership Not Neither
Self-Leadership Not Emerging
The data for the Native American environmental factor indicates this factor is not
important however the mature business owners are using this factor. Planning and organization is
important and both emerging and mature businesses are using this factor. Systems management
and interpersonal leadership are both considered not important and neither of these factors is
being used. Self-leadership data indicates it is not important although emerging business owners
are using this factor.
These mixed conclusions require further analysis which will be done in the discussion
section.
Discussion
When the independent t-tests were conducted on the Native American environmental
factor, the results indicated collaboration and cooperation are the key elements for mature
businesses (Table 43). Mature businesses have the time and the resources available to them to
focus on these elements. The businesses have matured to a point where business owners do not
have to spend a significant amount of time worrying about the business. The business owner can
now start collaborating and cooperating with lending institutions and local tribal colleges. The
emerging businesses do not have the time and resources available to them therefore they do not
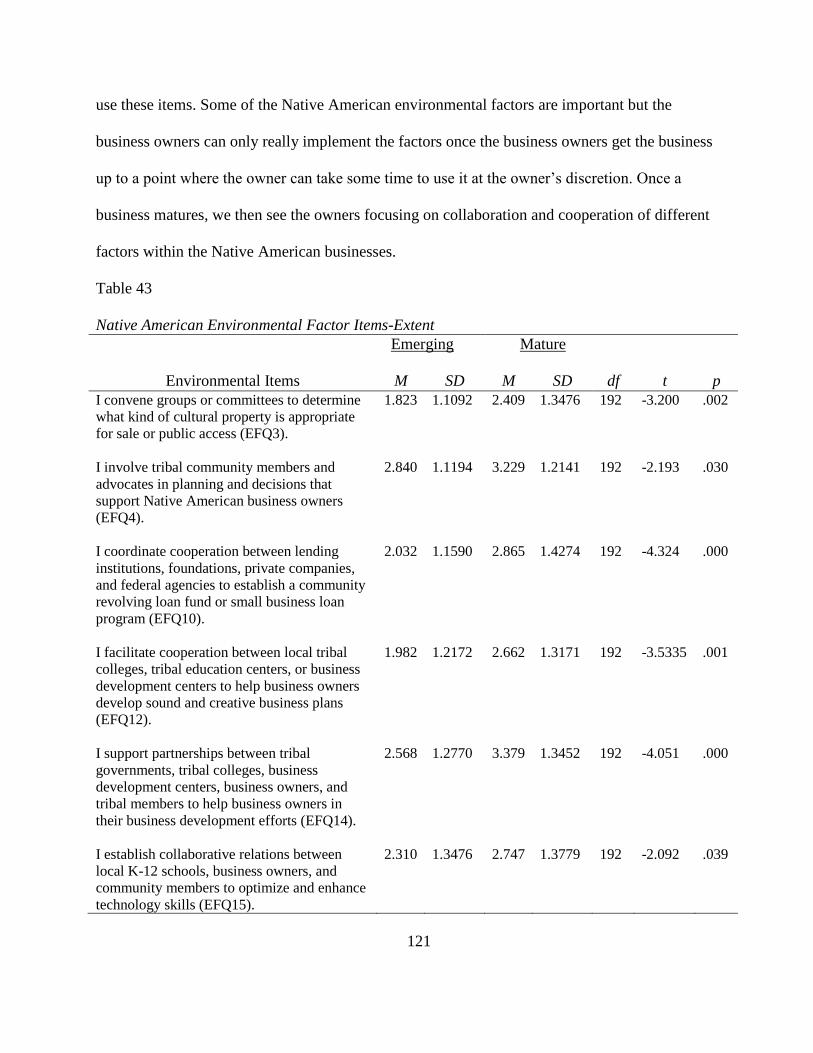
121
use these items. Some of the Native American environmental factors are important but the
business owners can only really implement the factors once the business owners get the business
up to a point where the owner can take some time to use it at the owner’s discretion. Once a
business matures, we then see the owners focusing on collaboration and cooperation of different
factors within the Native American businesses.
Table 43
Native American Environmental Factor Items-Extent
Emerging Mature
Environmental Items M SD M SD df t p
I convene groups or committees to determine
what kind of cultural property is appropriate
for sale or public access (EFQ3).
1.823 1.1092 2.409 1.3476 192 -3.200 .002
I involve tribal community members and
advocates in planning and decisions that
support Native American business owners
(EFQ4).
2.840 1.1194 3.229 1.2141 192 -2.193 .030
I coordinate cooperation between lending
institutions, foundations, private companies,
and federal agencies to establish a community
revolving loan fund or small business loan
program (EFQ10).
2.032 1.1590 2.865 1.4274 192 -4.324 .000
I facilitate cooperation between local tribal
colleges, tribal education centers, or business
development centers to help business owners
develop sound and creative business plans
(EFQ12).
1.982 1.2172 2.662 1.3171 192 -3.5335 .001
I support partnerships between tribal
governments, tribal colleges, business
development centers, business owners, and
tribal members to help business owners in
their business development efforts (EFQ14).
2.568 1.2770 3.379 1.3452 192 -4.051 .000
I establish collaborative relations between
local K-12 schools, business owners, and
community members to optimize and enhance
technology skills (EFQ15).
2.310 1.3476 2.747 1.3779 192 -2.092 .039

122
When the independent t-tests were conducted for the self-leadership factor items, the
results indicated technical proficiency in the owner’s field and soliciting critical suggestions for
the business are key elements for emerging businesses (Table 44). The results indicate emerging
businesses are proficient in their field, but are constantly looking for feedback about how the
owner is performing. Those business owners that are emerging most likely will use their
technical proficiency to start their company and solicit feedback from others.
Table 44
Self-Leadership Factor Items-Extent
Emerging Mature
Self-Leadership Items M SD M SD df t p I exhibit a high degree of technical
proficiency in my field (SLQ28). 4.355 .6798 4.045 1.0475 192 2.464 .015
I solicit critical suggestions to improve
my performance (SLQ33). 4.258 .7668 3.764 1.0760 192 3.657 .000
What we should expect then, would be for new business startups to have some type of
technical proficiencies in their field. Emerging businesses would not be expected to spend a
significant amount of time in collaborating and cooperating with other Native owned businesses
until they get past the emerging stage of the first five years. Upon reaching the mature level, the
business would then have discretionary time to focus on these items.
Recommendations
This section of Chapter 5 will cover recommendations that emerged from the research. It
will cover the recommendations for practice, which are based on the study’s findings and
conclusions, and recommendations for future study.

123
Recommendations for Practice
Within the Native American community there is a tradition of respect for the importance
of family and the honoring of elders. An elder is a man or woman, who is usually older than the
others in the family and community, and who is widely recognized and highly respected for their
wisdom and spiritual leadership (Welch, 2006). A mature Native American owned business
could be comparable to an elder in a Native American community. Elders are often known for
their vast knowledge and wisdom that is gained from life experiences. Mature businesses that
have been in business over 5 years also have gained vast knowledge about their business and
about business in general. Elders are considered to be the decision makers in a tribe, as are
mature business owners. Mature businesses have established creditably among their peers as do
elders within a tribe. According to Kouzes and Posner (2003), creditability is something that is
earned over time and that is does make a difference. The recommendation is to consider mature
business owners as mentors to emerging business owners in various areas, such as building
collaborative relationships with lending institutions and tribal colleges. This may include
establishing a local Native American business council consisting of Native owned businesses on
the reservation. The business council may act as a forum for sharing information and mutual
support. Another example of collaboration which mature and emerging businesses should
consider is the exploration and development of collaborations among tribal colleges, state
universities, and other partners related to entrepreneurial activities. Mature and emerging
businesses could benefit from the resources educational institutions have to offer, such as
training and technical assistance in the entrepreneurial field.
Another recommendation is to encourage Native American business owners to participate
in training which focuses on technical skills. This could be at a two or a four-year college or a
124
trade school. The data clearly indicates business owners need to be technically proficient in their
field to be considered successful. A new business start-up has a tendency to start out lacking
these technical competencies. Attending an educational institution, which offers the type of skills
training required by their business, would benefit an emerging business. Many tribal colleges
match their business curricula to existing local economic needs. Tribal colleges also promote
entrepreneurship and small business growth in their communities through workshops and
leadership development. Emerging businesses could benefit from attending these programs.
Another aspect is for an emerging business to have some form of professional
development or continuing education in requesting feedback on the performance of the business
so improvements can be made. This can entail developing a network of businesses who meet
monthly to discuss certain business issues as it pertains to their company. The business would
agree to participate in this network which would be facilitated by a tribal college or an
educational institution. Assistance to the businesses in this network could be provided by the
facilitator in overcoming the identified challenges. This could be conducted in a group setting or
in an individual setting. Requiring participation by the network businesses at meetings in three or
six month increments could be implemented. By establishing a network of businesses, feedback
on the performance of the business will assist business owners in identifying and correcting
issues which would otherwise hold a business back or cause it to go out of business. While
emerging business owners need both technical proficiency and the willingness to engage in
feedback sessions about the development of their business, both mature and emerging business
owners need planning and organizing.
The next recommendation is to develop professional development or training in planning
and organization. Four leading authors (Griffen, 2005; Kreitner, 2007; Robbins, 1984; &

125
Williams, 2007) have identified a portion of the essential planning and organization skills needed
by emerging and mature businesses. Table 45 illustrates the essential planning skills as identified
by Griffen, 2005; Kreitner, 2007; Robbins, 1984; and Williams, 2007. Communication,
coordination, and organizing are all common themes among these four authors. Emerging
businesses that do not possess these essential skills could prevent their business from moving
forward.
Table 45
Essential Planning Skills
Skill
Formulating a business model-the overall set of structural elements
and the relationships among those elements used to manage the total
organization.
Strategy planning (5 years or greater)-outlining decisions of resource
allocation, priorities, and action steps necessary to reach strategic
goals.
Strategic initiatives-the method by which strategies are executed
within the organization.
Tactical planning (1 to 5 years)-achieving tactical goals and
implementing specific parts of a strategic plan.
Tactical goals-a goal set by and for middle managers of the
organization.
Operational planning (day to day to 1 year)-process of linking
strategic goals and objectives to tactical goals and objectives.
Operational objectives-short-term goal who attainment moves an
organization towards achieving its strategic or long-term goals.
Contingency planning-the determination of alternative courses of
action to be taken if an intended pan in unexpectedly disrupted or
rendered inappropriate.
Communication- Making sure employees understand the plan and
how their role fits to the overall plan.

126
Table 46 illustrates the essential organizing skills as identified by Griffen, 2005;
Kreitner, 2007; Robbins, 1984; and Williams, 2007. Task structure, coordination, managing
change, innovation and human resources are all essential organization skills that emerging
businesses need to be successful.
Table 46
Essential Organization Skills
Skill
Organizing-effectively designing work responsibilities.
Task structure-identifying who, what and how the tasks are going to
be completed.
Coordination-the process of linking the activities of various functions
to the overall plan.
Managing change-transitioning individuals within an organization to
a desired future state.
Managing innovation-the ability to manage the effort of an
organization to develop new products or services for existing
products or services.
Managing human resources-the ability to attract, develop, and
maintain an effective workforce.
It is recommended emerging business owners receive extensive professional development
and training in these skills in order for them to be successful and that mature business owners
receive refresher courses to keep them current with new trends in planning and organization.
Recommendations for Further Study
All studies, including this one, have limitations. This section will identify the limitations
of the study and simultaneously address recommendations for future research.

127
One of the limitations of this study was the sample size. This sample was limited to the
four reservations in North Dakota and encompassed only those Native American owned
businesses located on/or adjacent to a North Dakota reservation. Future research may include a
broader sample of Native American owned businesses that are not located on reservations to get
their perspective, such as all of the Native American owned business located in the United
States. Since this study was limited to the four reservations in North Dakota, future research may
also include expanding the study to the 26 tribes within the region. Future studies may also
include replicating this study in other geographical regions of the country and compare the
findings with the findings of this study. Since only Native American owned businesses were the
focus of this study, future studies may include conducting research on other behaviors located on
reservations such social services and housing programs.
An additional limitation was the use of Sun’s self-administered instrument. When using
the principal component analysis, this limitation became evident when attempting to identify the
factor structure of the instrument. The data analysis from the study (N = 194), found some
inadequacies that indicated the current study was significantly different from the approach Sun
took. A future study would be to collect additional data from a very large sample to determine if
the factor structure of the instrument will remain sound.
Another limitation was that the instrument was not accessible by internet; therefore the
only response was by U.S. postal service. Every effort was made to ensure the return of the
sample by enclosing a self-addressed envelope which resulted in a response rate of 51%. The
survey was distributed to the respondents through the U.S. postal service only. Future research
may include putting the survey online for better access.

128
A more significant limitation regarding the instrument was that it was not created by
Native Americans; therefore cultural values were not taken into account. Since the survey was
replicated from this other study not all questions were developed by Native Americans. Future
studies may include re-writing the survey with culturally adaptive statements and compare the
findings with the findings of this study.
This study was a quantitative study which gathered data through a survey. Further studies
may include conducting a qualitative study to get the reactions of mature Native American
owned businesses and their thoughts on running a successful business.
This study only asked for the level of education attained by the business owner. Future
research may include comparing those business owners who had advanced education with those
who did not. Future studies may include conducting research on those individuals who indicated
they had a college education to find out if they had attended a tribal college and compare it to
those who had not.
A Closing Thought
Native American owned businesses play a significant role in their communities. To foster
the entrepreneurial spirit, according to Clifton (2013) entrepreneurship should begin in
elementary schools. This research indicated that emerging Native American business owners
need to be technically proficient in their field in order to find the spark to start their own
business. Therefore, they should be encouraged to participate in training which focuses on
technical skills. An individual wishing to start their own business would benefit by acquiring
technical proficiency skills at a higher education institution. For example, a welder or electrician
could attend a two-year college or trade school to attain these skills, whereas an individual who

129
pursues a degree as a certified public accountant would attend a four-year college to develop
these technical skills.
Establishing a network of emerging business owners is also critical to the success of a
Native American business. Receiving constant feedback on the performance of the business will
assist emerging business owners in identifying and correcting issues which would otherwise hold
a business back or cause it to go out of business. Because of this, Native American businesses
will have a greater chance of lasting longer than five years.
Native American owned businesses also need to plan and organize. Decision-making,
establishing relationships, and task structures are all essential organization skills that emerging
businesses need to be successful. Although mature businesses have the time and resources
available to them to focus on these elements, they still need refresher courses in this area to keep
them current with new trends in planning and organizing. Mature businesses use Native
American environmental factors more than emerging businesses, therefore we would want these
businesses to help all businesses, whether they are emerging or mature businesses. Tribal
administration and tribal economic development offices should benefit from this study by
providing foundational knowledge to advance their economic development efforts.

130
REFERENCES
Adamson, R., & King, J. (2002). The Native American entrepreneurship report. Fredericksburg,
VA: First Nations Development Institute.
All Business. (n.d.). Retrieved from http://www.allbusiness.com/glossaries/stagnation/4955176-
1.html.
Ambler, M. (1992). The wealth of (Indian) nations: Tribes are creating a new model of economic
development by building on old strengths. Tribal College Journal of American Indian
Higher Education, 4(2), 8-12.
American Indian Higher Education Consortium. (1999). Tribal colleges: An introduction.
Oronoco, VA: Author.
American Indian reservation. (n.d.). Retrieved from
http://en.wikipedia.org/wiki/Indian_reservation
Arnold, D. (2004). Native Pathways: American Indian Culture and Economic Development in
the Twentieth Century. Boulder: University Press of Colorado.
Austin, R. D. (2005). Perspectives of American Indian Nation parents and leaders. New
Directions for Student Services, 109, 41-48.
Baker, P., & Lynch P. D. (1994). Tribal governance and economic development of American
Indian nations. Tribal College Journal of American Indian Higher Education, 6(2), 26-
32.
Benham, M. K. P., & Stein, W. J. (2003). The renaissance of American Indian higher education.
Mahwah, NJ: Lawrence Erlbaum.
Black, S. S. (1994). Redefining success in community development: A new approach for
determining and measuring the impact of development. Paper presented at the LFC’s
131
annual Management and Community Development Institute, Medford, MA. Retrieved
from http://www.firstnations.org/publications/tuftreport.pdf.
Bly, B. (2005). Tribal colleges can be a key to Native entrepreneurship. Retrieved from
http://www.minneapolisfed.org/publications_papers/pub_display.cfm?id=2378
Boyer, P. (1989). Tribal colleges: Shaping the future of Native America. Princeton, NJ: Carnegie
Foundation for the Advancement of Teaching.
Boyer, P. (1992). Education for economic development. Tribal College Journal of American
Indian Higher Education, 4(2), 4-5.
Boyer, P. (1997). Native American colleges: Progress and prospects. Princeton, NJ: Carnegie
Foundation for the Advancement of Teaching.
Boyer, P. (2002). Education for economic development. Tribal College Journal of American
Indian Higher Education, 14(2), 12-19.
Bregendahl, C., & Flora, C. (2002). Native American Business Participation in E-Commerce: An
Assessment of Technical Assistance and Training Needs. Ames: North Central Regional
Center for Rural Development. Iowa State University.
Capriccioso, R. (2007, September). Economic success in Indian country: A complex tale that
needs to be told. American Indian Report.
Casey, C. (1997). Entrepreneurs stimulate Tribal economies. Tribal College Journal of American
Indian Higher Education, 9(3), 12-14.
Cattelino, J. (2004). Native Pathways: American Indian Culture and Economic Development in
the Twentieth Century. Boulder: University Press of Colorado.

132
Clement, D. (2006, March). Indianpreneurs: Small business development holds great promise for
American Indian economic progress, but big obstacles remain. Fedgazette. Retrieved
from http://www.minneapolisfed.org/publications_papers/pub_display.cfm?id=1377
Cornell, S. (1988). The Return of the Native: American Indian Political Resurgence. New York:
Oxford University Press.
Cornell, S. (2006). What makes first nations enterprises successful? Lessons from the Harvard
project. Native Nations Institute for Leadership, Management and Policy, The University
of Arizona, Tucson, AZ and the Harvard Project on American Indian Economic
Development. John F. Kennedy School of Government. Cambridge, MA: Harvard
University.
Cornell, S., & Jorgensen, M. (2007). The nature and components of economic development in
Indian country. Paper presented at the National American Economic Summit, Phoenix,
AZ. Retrieved from http://nni.arizona.edu/resources/inpp/2007CornellJorgensen.pdf
Cornell, S., & Kalt, J. (1992). Reloading the dice: Improving the chances for economic
development on Indian reservations. What can Tribes do? Strategies and Institutions in
American Indian Economic Development. Los Angeles, CA: University of California.
Cornell, S., & Kalt, J.P. (1998). Sovereignty and nation-building: The development challenge in
Indian country today. American Indian Culture and Research Journal 22(3), 187-214.
Creswell, J. (2002). Research design: Qualitative, quantitative, and mixed methods. Thousand
Oaks, CA: Sage.
Cross, T. (2009). Culturally informed strategies for poverty reduction in Indian country. Policy
Matters 1(2), 1-20.

133
Cuba, R. C., & Milbourn, G. (1982, October/December). Delegating for small business
success. American Journal of Small Business, 7(2), 33-41.
Cunningham, A. F. (2000). Tribal college contributions to local economic development. A
product of the Tribal College Research and Database Initiative, a collaborative effort
between the American Indian Higher Education Consortium and the American Indian
College Fund.
EagleWoman, A. (2009). Tribal nation economics: Rebuilding commercial prosperity in spite of
U.S. trade restraints-recommendations for economic revitalization in Indian country.
Tulsa Law Review, 44(1), 383-426.
Emery, M. (2007). A driver for economic development in Indian country. Report to North Dakota
State University Extension Service, Fargo, ND. Retrieved from
http://www.extension.org/pages/A_Driver_for_Economic_Development_in_Indian_Coun
try
Emery, M., Wall, M., Bregendahl, C., Flora C., & Schmitt, B. (2006). Economic Development in
Indian Country: Redefining Success. The Online Journal of Rural Research and Policy,
4:1-21.
Fann, A. (2002). Tribal colleges: An overview. Eric Digest, 2. Retrieved January 13, 2011, from
Eric Digest Web Site.
Federico Cunningham, A., & Parker, C. (1998). Tribal colleges as community institutions and
resources: Minority-serving institution: Distinct purposes, common goals. San Francisco:
Jossey-Bass.
First Nations Development Institute. (1998). CRA Query: Norwest and Wells Fargo Findings
within a Seven-State Target Group: Banking and Financial Service Needs and Lending

134
Issues in Native Communities Survey Findings. Fredericksburg, VA: First Nations
Development Institute.
Frank, F., & Smith, A. (1999). The community development handbook: A tool to build
community capacity. Human Resources Development, Hull, Quebec, Canada. Retrieved
from:
http://action.web.ca/home/narcc/attach/Community%20Development%20Handbook%20-
%20HRSD%20-%20Introduction%5B1%5D1.pdf
Garsombke, D., & Garsombke, T. (2000). Non-traditional vs. traditional entrepreneurs:
Emergence of a Native American comparative profile of characteristics and barriers.
Academy of Entrepreneurship Journal, 6(1), 93-100.
Goreham, G., & Rathge, R. (1991). Native American entrepreneurs in North Dakota
(Agricultural Economics Miscellaneous Report No. 158). Retrieved from AgEcon search
website: http://ageconsearch.umn.edu/bitstream/51201/2/No.158.pdf
Goreham, G., Rathge, R., & Hess, D. (1994, Winter). Successful American Indian
entrepreneurship on reservations in North Dakota and South Dakota. North Dakota Farm
Research. 50(2), 6-10.
Griffin, R.W. (2005). Management. Boston: Houghlin Mifflin Company.
Grobsmith, E. S. (1981). Lakota of the Rosebud A Contemporary Ethnography. New York:
Harcourt Brace College Publishers.
Jahrig, S. M. (1996, Summer). Crossing the cultural divide. Montana Business Quarterly. 34(2),
2-3.
Jahrig, S. M. (1997, Autumn). Business on the reservation. Montana Business Quarterly. 35(3),
5-18.

135
Jorgensen, M., & Taylor, J. (2000). What determines Indian economic success? Evidence from
tribal and individual Indian Enterprises. Malcolm Wiener Center for Social Policy.
Harvard Project on American Indian Economic Development. John F. Kennedy School of
Government. Harvard University.
Keohane, J. R. (2006, Spring). The rise of tribal self-determination and economic development.
Human Rights. 33(2), 9-12.
Kim, J., Crasco, L., & Weiner, J. (2005, March). Institutional research capacity building at
Tribal Colleges and Universities. Boston: Systemic Research, Inc.
Kirkpatrick, S. A. & Locke, E. A. (1991, May). Leadership: do traits matter? Academy of
Management Executive, 5, 48-60.
Kreitner, R. (2007). Management. Boston: Houghlin Mifflin Company.
Kouzes, J., & Posner, B. (2003). Credibility. San Francisco: Jossey-Bass.
MHA Nation. (n.d.). Retrieved from
http://www.mhanation.com/main/history/history_garrison_dam.html
Malkin, J., Dabson, B., Pate, K., & Mathews, A. (2004). Native entrepreneurship: Challenges
and opportunities for rural communities. Corporation for Enterprise Development,
Washington, D.C. and Northwest Area Foundation, Minneapolis, Minnesota.
Malkin, J., & Aseron, J. (2007). Native entrepreneurship: Nationwide & in South Dakota.
Corporation for Enterprise Development, Washington, D.C. and Northwest Area
Foundation, Minneapolis, Minnesota.
Mantonya, K., & Wall, M. (2007). Economic Development in Indian Country: Traits that Lead to
Sustainability. The Online Journal of Rural Research and Policy, 3, 1-36.
Mathews, S. (2008). American Indians in the Early West. ABC-CLIO, Inc. Santa Barbara.

136
McLaughlin, R. (1992). Assessment of the Aberdeen Area Office Indian Business Development
Grant Program, IBDGP, Fiscal years: 1987 through 1992. Unpublished paper.
National Congress of American Indians. (n.d.). Retrieved from
http://www.ncai.org/About.8.0.html
Native American self-determination. (n.d.). Retrieved from
http://en.wikipedia.org/wiki/Native_American_self-determination
Native American Tribe. (n.d.). Retrieved from
http://en.wikipedia.org/wiki/Native_American_tribe
O’Brien, E.M. (1992). American Indians in higher education. American Council on Education
Research Brief, 3(3).
O’Brien, S. (1989). American Indian tribal governments. University of Oklahoma Press.
Norman.
Pavel, M., Swisher, K., & Ward, M. (1995). Special focus: American Indian and Alaska Native
demographic and educational trends: Minorities in higher education 1994: Thirteen
Annual Status Report. Washington, DC: American Council on Education.
Robbins, S. P. (1984). Management. Englewood Cliffs: Prentice Hall.
Robinson, S., & Hogan, S. (1994, Winter). Family business: Ideal vehicle for Indian business
success? Montana Business Quarterly, 31(4), 2-6.
Rosier, P. (2003). Native American issues. Westport: Greenwood Press.
Rosier, P. (2004). Native pathways: American Indian culture and economic development in the
twentieth century. Boulder: University Press of Colorado.
Salkind, N. J. (2008). Statistics for people who (think they) hate statistics. Thousand Oaks: Sage
Publications, Inc.
137
Sandefur, G. (1989). American Indian reservations: The first underclass areas? Focus, 12, 37-41.
Seminole Tribe of Florida v. Butterworth, 658 F. 2d 310 (Fl. Ct. App. 1981).
Sioux Manufacturing Corporation. (n.d.). Retrieved from:
http://www.siouxmanufacturing.com/history.htm
Smith, H. D. (2000). Modern tribal development: Paths to self-sufficiency and cultural integrity
in Indian country. Walnut Creek: Altamira Press.
Small Business Administration (2012, September). Retrieved from http: www.sba.gov/advocacy
Stanley, S., & Thomas, R. K. (1978, March). Current demographic and social trends among
North American Indians. Annals of the American Academy of Political and Social
Science, American Indians Today. 436, 111-120.
Sun, T. (2004). Knowledge required to achieve entrepreneurial success. Retrieved from ProQuest
Dissertations and Theses. (3136142)
Thompson, S. (2010). Exercising and protecting Tribal sovereignty in day-to-day business
operations: What the key players need to know. Washburn Law Journal, 49, 661-716.
Tierney, W. (1992). Official encouragement, institutional discouragement: Minorities in
academe-The Native American experience. Norwood, NJ: Ablex.
Tirado, M. (2008). Planning for economic development. American Indian Report, Sept/Oct., 14-
15.
Tootle, D. M. (1996). American Indians: Economic opportunities and development (AER-731).
Economic Research Service (USDA), Washington, DC. Retrieved from
http://www.ers.usda.gov/publications/aer731/aer731i.pdf
Trosper, R. (1999). Traditional American Indian economic development policy in contemporary
Native American political issues. Walnut Creek: Altamira Press.

138
Turtle Mountain TERO. (2011). Retrieved from: http://www.turtle-
mountain.cc.nd.us/community/propeace/resources/TERO.pdf
Turtle Mountain Manufacturing Corporation. (2011.). Retrieved from:
http://tmmc.utma.com/Home.htm
United Indians of All Tribes. (n.d.). Retrieved from
http://www.unitedindians.org/about_history.html
U. S. Census Bureau. (2010). Retrieved from http://factfinder.census.gov
U.S. Census Bureau. (2002 & 2007). Survey of business, preliminary estimates of business
ownership by gender, ethnicity, race, and veteran status, released July 13, 2010.
Retrieved from http://www.census.gov/econ/sbo/
U. S. Department of Interior. (2011). Retrieved from http://www.doi.gov.
Vinje, D. (1996, October). Native American economic development on selected reservations: A
comparative analysis. American Journal of Economics and Sociology. 55(4), 427-442.
Retrieved from http://findarticles.com/p/articles/mi_m0254/is_n4_v55/ai_18910969/
Wall, M., & Mantoya, K. (2007). Sustaining success in tribal economic development: A report of
research, analysis and economic development training for tribal planners. North Central
Regional Center for Rural Development. Ames: Iowa State University.
Welch, D. (2006). Economic issues and development. New York: Chelsea house.
Wheeler-Howard Act- 48 Stat. 984 - 25 U.S.C. § 461 et seq. (n.d.). Retrieved from
http://www.maquah.net/Kafkaesque/IndianCourt/IRA.htm
Williams, C. (2007). Management. Mason: Thomson South-Western.
World Commission on Environment and Development. (1987). From one Earth to one world:
An overview. Oxford: Oxford University Press.

139
APPENDIX A. NATIVE AMERICAN ENTREPRENEUR SURVEY
Date:__________
NATIVE AMERICAN ENTREPRENEUR SURVEY
This is a questionnaire to help discover the knowledge required by a Native American Entrepreneur to
be successful in creating and running a business. This study will attempt to identify those factors that
attribute to economic success as it pertains to Native American owned businesses located on/or
adjacent to North Dakota reservations.
You must be a Native American business owner to participate. Please disregard if you are not a Native
American business owner.
Your input is appreciated and all information provided will be kept strictly confidential.
INSTRUCTIONS: The following questions are designed to gain an understanding on
your thoughts on specific knowledge, skills, and levels of attitudes
(abilities) you possess. If an item does not apply, or if you are
uncertain or do not know how to answer, simply leave the answer
blank.
The “degree of importance scale” is meant to determine how important you feel the
statement is to your success.
The following key applies to the “Degree of Importance Scale”:
1 –Very Unimportant
2– Unimportant
3– Neither unimportant nor important
4– Important
5– Very important
The “To What Extent Scale” is meant to determine how often this statement pertains to
your business.
The following key applies to the “To What Extent Scale”:
1– Never
2– Rarely
3– Sometimes
4– Often
5– Always

140
Environmental Factors Degree of
Importance
Scale
To What Extent
Scale
1. I encourage the development of Native American owned
private businesses that are not tribally owned. 1 2 3 4 5 1 2 3 4 5
2. I meet with Native American business owners to share
goals, visions, and concerns. 1 2 3 4 5 1 2 3 4 5
3. I convene groups or committees to determine what kind of
cultural property is appropriate for sale or public access. 1 2 3 4 5 1 2 3 4 5
4. I involve tribal community members and advocates in
planning and decisions that support Native American
business owners.
1 2 3 4 5 1 2 3 4 5
5. I bring Native American entrepreneurs and tribal leaders
together to learn about political barriers facing business
owners and what tribal leaders can do to remove them.
1 2 3 4 5 1 2 3 4 5
6. My business hosts conferences or summits to exchange
ideas about economic development opportunities. 1 2 3 4 5 1 2 3 4 5
7. I encourage adopting uniform commercial codes to set
procedures and protocols to ease investor anxiety about
supporting business in Indian country.
1 2 3 4 5 1 2 3 4 5
8. I build trust and cooperate with Native American
entrepreneurs. 1 2 3 4 5 1 2 3 4 5
9. I provide business support that addresses issues such as tax
assistance, marketing, budgeting, insurance, credit and
business planning.
1 2 3 4 5 1 2 3 4 5
10. I coordinate cooperation between lending institutions,
foundations, private companies, and federal agencies to
establish a community revolving loan fund or small
business loan program.
1 2 3 4 5 1 2 3 4 5
11. I establish a way for local business owners to work
together to lower insurance and marketing costs. 1 2 3 4 5 1 2 3 4 5
12. I facilitate cooperation between local tribal colleges, tribal
education centers, or business development centers to help
business owners develop sound and creative business
plans.
1 2 3 4 5 1 2 3 4 5
13. I situate technology within overall nation-building goals as
one tool to improve economic development on tribal lands. 1 2 3 4 5 1 2 3 4 5
14. I support partnerships between tribal governments, tribal
colleges, business development centers, business owners,
and tribal members to help business owners in their
business development efforts.
1 2 3 4 5 1 2 3 4 5
15. I establish collaborative relations between local K-12
schools, business owners, and community members to
optimize and enhance technology skills.
1 2 3 4 5 1 2 3 4 5
16. I form committees or groups to establish an enforceable
copyright or trademark registration system to protect
Native American business owners from unlawful Internet
reproducing of tribal intellectual property.
1 2 3 4 5 1 2 3 4 5

141
17. I set up mentoring programs among various tribal business
owners to provide computer support such as Web site
development, Internet sales, trademark or copyright
protection.
1 2 3 4 5 1 2 3 4 5
Planning and Organizing Degree of
Importance
Scale
To What Extent
Scale
18. I take time to plan the path of my business. 1 2 3 4 5 1 2 3 4 5
19. My employees can clearly articulate the goals and values
of my company. 1 2 3 4 5 1 2 3 4 5
20. I value long-term potential over short-term thinking. 1 2 3 4 5 1 2 3 4 5 21. On average, I tend to work a lot more hours in the business
compared to other employees. 1 2 3 4 5 1 2 3 4 5
22. I have a written business plan. 1 2 3 4 5 1 2 3 4 5 23. I act as a role model to communicate my values to
subordinates. 1 2 3 4 5 1 2 3 4 5
24. I make the effort to react to events as they occur rather
than make detailed plans. 1 2 3 4 5 1 2 3 4 5
25. I am aware of events occurring outside the company. 1 2 3 4 5 1 2 3 4 5 26. When planning, I use information from stakeholders such
as customers, suppliers, and employees. 1 2 3 4 5 1 2 3 4 5
27. I make constant changes to my business plan according to
the economy and business factors. 1 2 3 4 5 1 2 3 4 5
Self Leadership Degree of
Importance
Scale
To What Extent
Scale
28. I exhibit a high degree of technical proficiency in my field. 1 2 3 4 5 1 2 3 4 5 29. I have the courage to make commitments that would be
considered risky by others. 1 2 3 4 5 1 2 3 4 5
30. I am quick to take action without spending a lot of time to
find out all the information about the situation. 1 2 3 4 5 1 2 3 4 5
31. My business cannot survive without me, since I am
responsible for producing products and services. 1 2 3 4 5 1 2 3 4 5
32. I project a high degree of self-confidence. 1 2 3 4 5 1 2 3 4 5 33. I solicit critical suggestions to improve my performance. 1 2 3 4 5 1 2 3 4 5
Interpersonal Leadership Degree of
Importance
Scale
To What Extent
Scale
34. I make most of the decisions in the business. 1 2 3 4 5 1 2 3 4 5 35. I encourage decisions to be made at the lowest level of
accurate information. 1 2 3 4 5 1 2 3 4 5
36. I encourage cooperation and collaboration across
functional areas of my business. 1 2 3 4 5 1 2 3 4 5
37. I encourage my employees to experiment with new ideas
and concepts to create innovative approaches. 1 2 3 4 5 1 2 3 4 5
38. My employees know they should avoid failure in my
business at all costs. 1 2 3 4 5 1 2 3 4 5

142
39. I provide training and development to my employees. 1 2 3 4 5 1 2 3 4 5 40. I successfully select people. 1 2 3 4 5 1 2 3 4 5 41. Decisions in the business are based on information from
my staff. 1 2 3 4 5 1 2 3 4 5
Systems Management Degree of
Importance
Scale
To What Extent
Scale
42. I measure the results of important goal-achieving actions
and their impact. 1 2 3 4 5 1 2 3 4 5
43. I actively seek knowledge about my customers and the
market place. 1 2 3 4 5 1 2 3 4 5
44. I am aware of the product/services and pricing structure of
my competitors. 1 2 3 4 5 1 2 3 4 5
45. I know the return on investment of my advertising
campaigns. 1 2 3 4 5 1 2 3 4 5
46. I know what my gross margins are. 1 2 3 4 5 1 2 3 4 5 47. To keep updated with technology and information, I
participate in learning activities through seminars,
workshops, tradeshows, and/or talking with suppliers.
1 2 3 4 5 1 2 3 4 5
48. I understand how financial statements depict my business. 1 2 3 4 5 1 2 3 4 5 49. I am aware of external economic events. 1 2 3 4 5 1 2 3 4 5 50. I critically analyze past performance and future
opportunities and take actions to enhance performance. 1 2 3 4 5 1 2 3 4 5
51. I am actively involved in market analysis 1 2 3 4 5 1 2 3 4 5 52. I actively engage in surveying my customers. 1 2 3 4 5 1 2 3 4 5
The following key applies to the rest of the questions:
The “degree of importance scale” is meant to determine how important you feel the
statement is to your success.
The following key applies to the “Degree of Importance Scale”:
1 –Very Unimportant
2– Unimportant
3– Neither unimportant nor important
4– Important
5– Very important
The “satisfaction of performance scale” is designed to seek your level of knowledge on the
statement. The following key applies to the “Satisfaction of Performance Scale”:
The following key applies to the “Satisfaction of Performance Scale”:
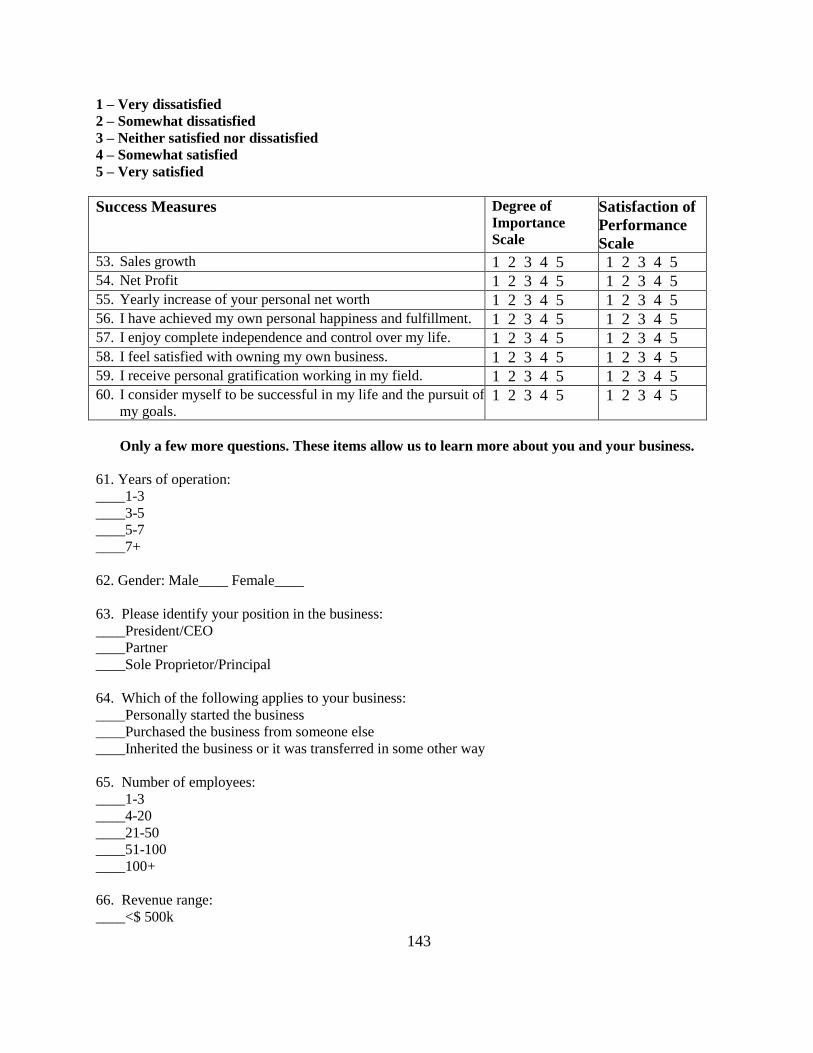
143
1 – Very dissatisfied
2 – Somewhat dissatisfied
3 – Neither satisfied nor dissatisfied
4 – Somewhat satisfied
5 – Very satisfied
Success Measures Degree of
Importance
Scale
Satisfaction of
Performance
Scale 53. Sales growth 1 2 3 4 5 1 2 3 4 5 54. Net Profit 1 2 3 4 5 1 2 3 4 5 55. Yearly increase of your personal net worth 1 2 3 4 5 1 2 3 4 5 56. I have achieved my own personal happiness and fulfillment. 1 2 3 4 5 1 2 3 4 5 57. I enjoy complete independence and control over my life. 1 2 3 4 5 1 2 3 4 5 58. I feel satisfied with owning my own business. 1 2 3 4 5 1 2 3 4 5 59. I receive personal gratification working in my field. 1 2 3 4 5 1 2 3 4 5 60. I consider myself to be successful in my life and the pursuit of
my goals. 1 2 3 4 5 1 2 3 4 5
Only a few more questions. These items allow us to learn more about you and your business.
61. Years of operation:
____1-3
____3-5
____5-7
____7+
62. Gender: Male____ Female____
63. Please identify your position in the business:
____President/CEO
____Partner
____Sole Proprietor/Principal
64. Which of the following applies to your business:
____Personally started the business
____Purchased the business from someone else
____Inherited the business or it was transferred in some other way
65. Number of employees:
____1-3
____4-20
____21-50
____51-100
____100+
66. Revenue range:
____<$ 500k
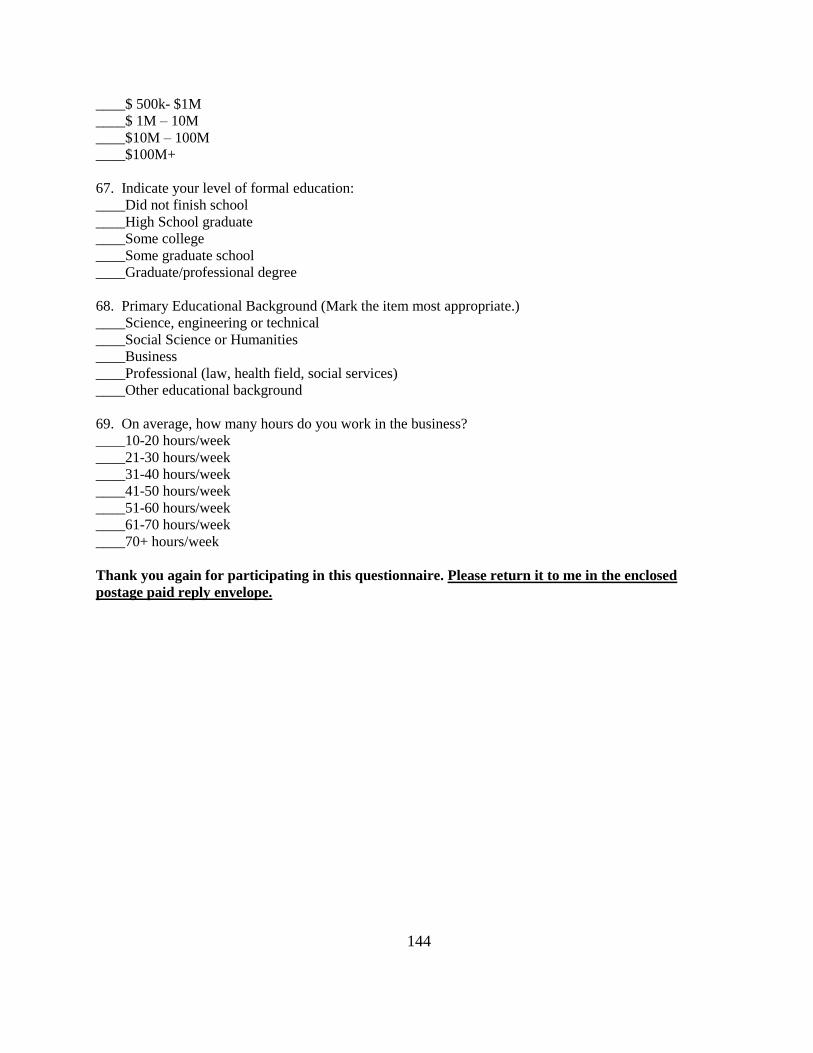
144
____$ 500k- $1M
____$ 1M – 10M
____$10M – 100M
____$100M+
67. Indicate your level of formal education:
____Did not finish school
____High School graduate
____Some college
____Some graduate school
____Graduate/professional degree
68. Primary Educational Background (Mark the item most appropriate.)
____Science, engineering or technical
____Social Science or Humanities
____Business
____Professional (law, health field, social services)
____Other educational background
69. On average, how many hours do you work in the business?
____10-20 hours/week
____21-30 hours/week
____31-40 hours/week
____41-50 hours/week
____51-60 hours/week
____61-70 hours/week
____70+ hours/week
Thank you again for participating in this questionnaire. Please return it to me in the enclosed
postage paid reply envelope.

145
APPENDIX B. PERMISSION TO USE SUN’S (2004) INSTRUMENT
From: [email protected] To: [email protected] Subject: RE: Request to use research instrument Date: Sun, 1 Jul 2012 12:13:32 -0400
Hi Barbara,
Sure, you're welcome to use it, as long as you don't mind sharing your research. I'd like to see how it's being used and the findings as well.
Dr2.Ted Sun Chief Dream Maker & International Professor Executive Balance Ph: (614) 538-1664 Fax: (614) 245-0605
Vice Chancellor of Academics School of Business SMC University
Adult Lead Faculty Leadership Worthington
From: Barbara Schmitt [mailto:[email protected]] Sent: Sunday, July 01, 2012 11:50 AM
To: [email protected] Subject: Request to use research instrument
Dear Dr. Sun,
My name is Barbara Schmitt. I am a graduate student at North Dakota State University working on my dissertation. I would like to request permission to use your instrument from your 2004 study on
Knowledge Required to Achieve Entrepreneurial Success.
Thank you,
Please reply back to this email.
Barbara
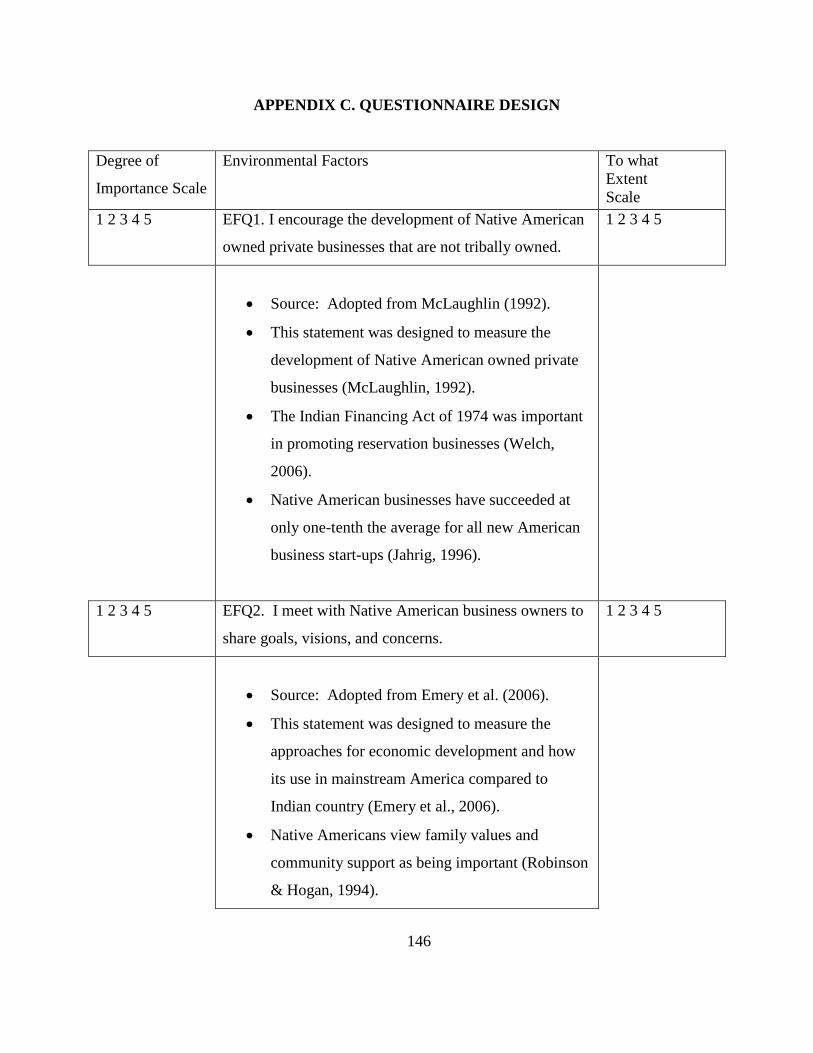
146
APPENDIX C. QUESTIONNAIRE DESIGN
Degree of
Importance Scale
Environmental Factors To what
Extent
Scale
1 2 3 4 5 EFQ1. I encourage the development of Native American
owned private businesses that are not tribally owned.
1 2 3 4 5
Source: Adopted from McLaughlin (1992).
This statement was designed to measure the
development of Native American owned private
businesses (McLaughlin, 1992).
The Indian Financing Act of 1974 was important
in promoting reservation businesses (Welch,
2006).
Native American businesses have succeeded at
only one-tenth the average for all new American
business start-ups (Jahrig, 1996).
1 2 3 4 5 EFQ2. I meet with Native American business owners to
share goals, visions, and concerns.
1 2 3 4 5
Source: Adopted from Emery et al. (2006).
This statement was designed to measure the
approaches for economic development and how
its use in mainstream America compared to
Indian country (Emery et al., 2006).
Native Americans view family values and
community support as being important (Robinson
& Hogan, 1994).

147
1 2 3 4 5 EFQ3. I convene groups or committees to determine
what kind of cultural property is appropriate for sale or
public access.
1 2 3 4 5
Source: Adopted from Mantonya & Wall (2007).
This statement was designed to measure the
recognition of the importance of cultural
relevance (Mantonya &Wall, 2007).
Tribal nations have always engaged in various
forms of commerce (Thompson, 2010).
1 2 3 4 5 EFQ4. I involve tribal community members and
advocates in planning and decisions that support Native
American business owners.
1 2 3 4 5
Source: Adopted from Goreham & Rathge
(1991).
This statement was designed to measure the
community and tribal support (Goreham &
Rathge, 1991).
Community and business development is not
always highly regarded on the reservation (Jahrig,
1997).

148
1 2 3 4 5 EFQ5. I bring Native American entrepreneurs and tribal
leaders together to learn about political barriers facing
business owners and what tribal leaders can do to remove
them.
1 2 3 4 5
Source: Adopted from Mantonya & Wall (2007)
and Jorgenson & Taylor (2007).
This statement was designed to measure tribal
commitment in supporting entrepreneurial efforts
(Mantonya &Wall, 2007; Jorgenson & Taylor,
2007).
Self-determination efforts resulted in the
development of tribal enterprises (Vinje, 1996).
1 2 3 4 5 EFQ6. My business hosts conferences or summits to
exchange ideas about economic development
opportunities.
1 2 3 4 5
Source: Adopted from Thompson (2010).
This statement was designed to measure the effect
of large trade gatherings.
Many members of tribes gathered to exchange a
variety of products from other members (Eagle
Woman, 2009).

149
1 2 3 4 5 EFQ7. I encourage adopting uniform commercial codes
to set procedures and protocols to ease investor anxiety
about supporting business in Indian country.
1 2 3 4 5
Source: Adopted from Keohane (2006).
Many tribes have increased their economic
activity by exercising their sovereignty (Keohane,
2006).
This statement was designed to measure the
characteristic positioned for sustainable economic
development success (Mantonya & Wall, 2007).
State laws differ widely throughout Indian
Country (Malkin et al., 2004).
1 2 3 4 5 EFQ8. I build trust and cooperate with Native American
entrepreneurs.
1 2 3 4 5
Source: Adopted from Goreham & Rathge
(1991).
This statement was designed to measure the
individual community support or therefore lack of
(Goreham & Rathge, 1991).
Support is very limited due to many issues
facing Native owned businesses; jealousy being
one of them (Goreham & Rathge, 1991).

150
1 2 3 4 5 EFQ9. I provide business support that addresses issues
such as tax assistance, marketing, budgeting, insurance,
credit and business planning.
1 2 3 4 5
Source: Adopted from Malkin et al. (2004) and
Adamson & King (2002).
This statement was designed to measure the
business knowledge of the entrepreneur
(Adamson & King, 2002).
Educating entrepreneurs with basic business skills
will promote economic development on
reservations (Adamson & King, 2002).
1 2 3 4 5 EFQ10. I coordinate cooperation between lending
institutions, foundations, private companies, and federal
agencies to establish a community revolving loan fund or
small business loan program.
1 2 3 4 5
Source: Adopted from Malkin et al. (2004) and
Adamson & King (2002).
This statement was designed to measure the
business knowledge of the entrepreneur
(Adamson & King, 2002).
Educating entrepreneurs with basic business skills
will promote economic development on
reservations (Adamson & King, 2002).
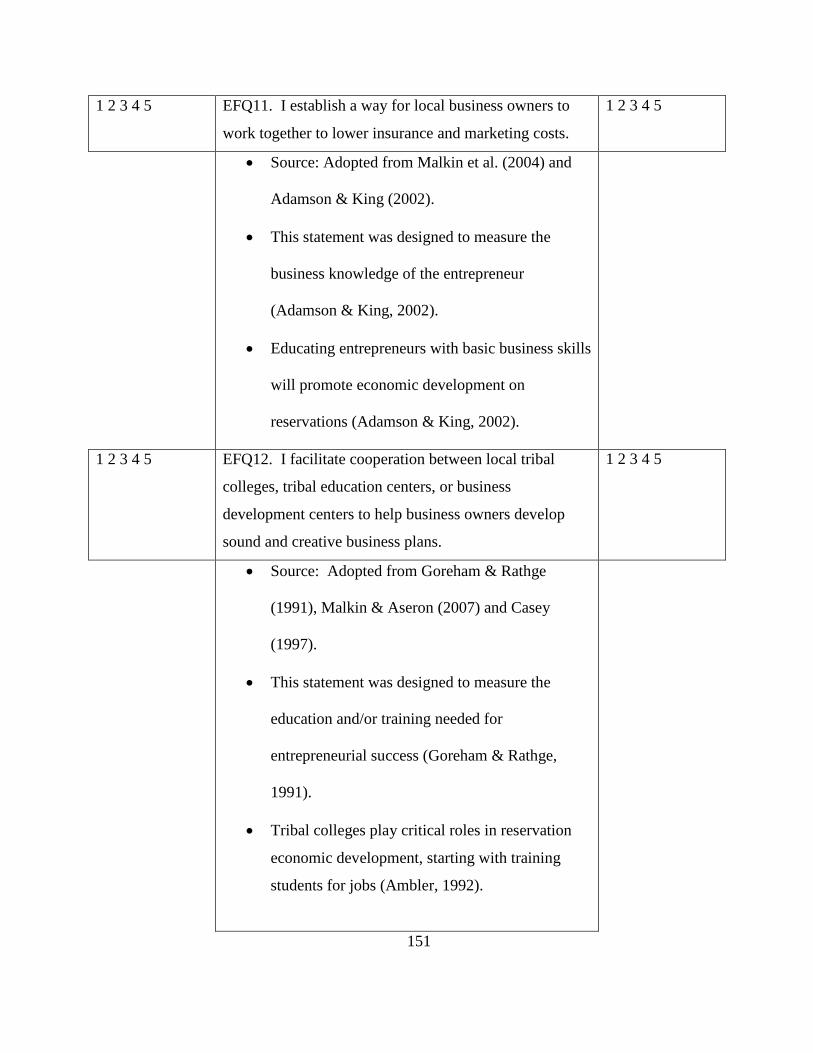
151
1 2 3 4 5 EFQ11. I establish a way for local business owners to
work together to lower insurance and marketing costs.
1 2 3 4 5
Source: Adopted from Malkin et al. (2004) and
Adamson & King (2002).
This statement was designed to measure the
business knowledge of the entrepreneur
(Adamson & King, 2002).
Educating entrepreneurs with basic business skills
will promote economic development on
reservations (Adamson & King, 2002).
1 2 3 4 5 EFQ12. I facilitate cooperation between local tribal
colleges, tribal education centers, or business
development centers to help business owners develop
sound and creative business plans.
1 2 3 4 5
Source: Adopted from Goreham & Rathge
(1991), Malkin & Aseron (2007) and Casey
(1997).
This statement was designed to measure the
education and/or training needed for
entrepreneurial success (Goreham & Rathge,
1991).
Tribal colleges play critical roles in reservation
economic development, starting with training
students for jobs (Ambler, 1992).

152
1 2 3 4 5 EFQ13. I situate technology within overall nation-
building goals as one tool to improve economic
development on tribal lands.
1 2 3 4 5
Source: Adopted from Smith (2000) and Cornell
& Kalt (2003).
This statement was designed to measure how
technology is important to economic development
on reservations (Smith, 2000).
1 2 3 4 5 EFQ14. I support partnerships between tribal
governments, tribal colleges, business development
centers, business owners, and tribal members to help
business owners in their business development efforts.
1 2 3 4 5
Source: Adopted from Goreham & Rathge
(1991), Malkin & Aseron (2007) and Casey
(1997).
This statement was designed to measure the
education and/or training needed for
entrepreneurial success (Goreham & Rathge,
1991).
Tribal colleges play critical roles in reservation
economic development, starting with training
students for jobs (Ambler, 1992).
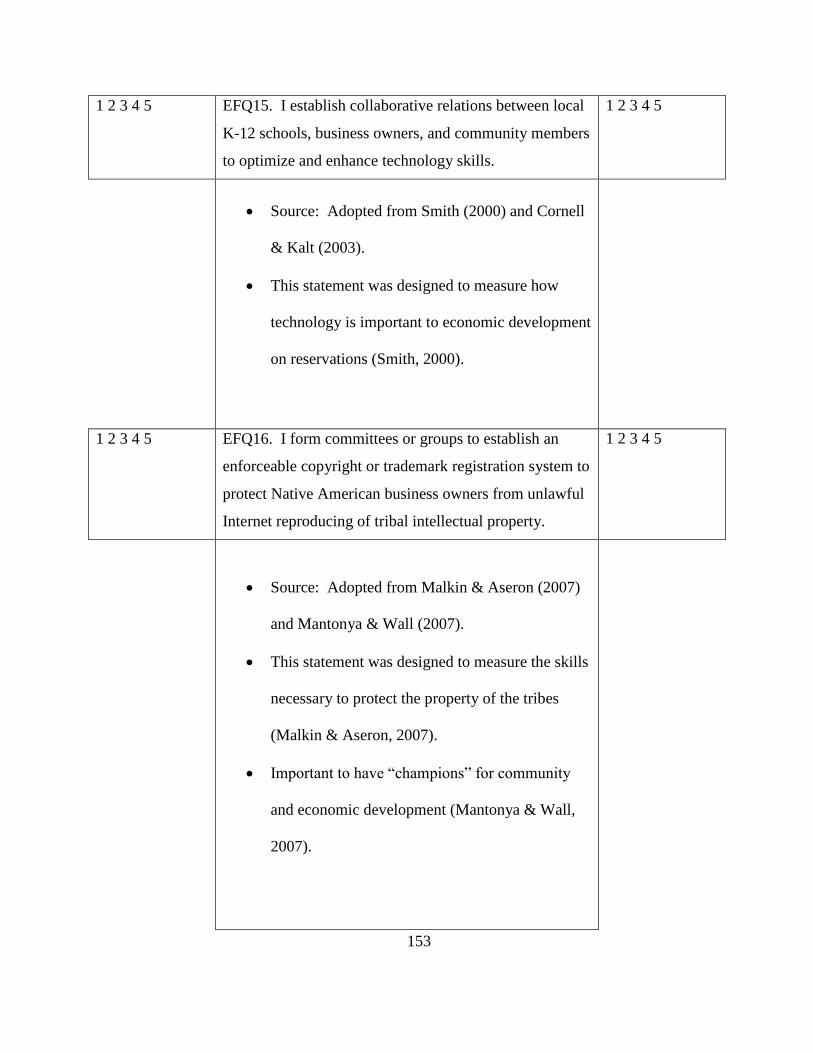
153
1 2 3 4 5 EFQ15. I establish collaborative relations between local
K-12 schools, business owners, and community members
to optimize and enhance technology skills.
1 2 3 4 5
Source: Adopted from Smith (2000) and Cornell
& Kalt (2003).
This statement was designed to measure how
technology is important to economic development
on reservations (Smith, 2000).
1 2 3 4 5 EFQ16. I form committees or groups to establish an
enforceable copyright or trademark registration system to
protect Native American business owners from unlawful
Internet reproducing of tribal intellectual property.
1 2 3 4 5
Source: Adopted from Malkin & Aseron (2007)
and Mantonya & Wall (2007).
This statement was designed to measure the skills
necessary to protect the property of the tribes
(Malkin & Aseron, 2007).
Important to have “champions” for community
and economic development (Mantonya & Wall,
2007).
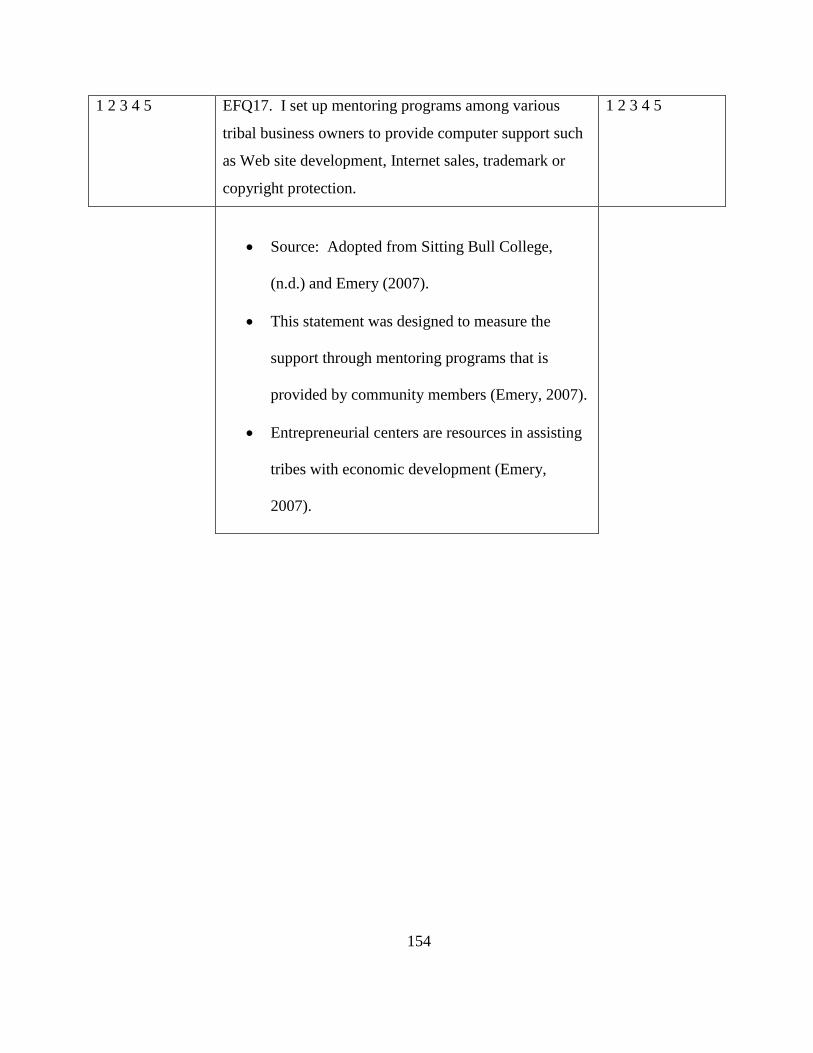
154
1 2 3 4 5 EFQ17. I set up mentoring programs among various
tribal business owners to provide computer support such
as Web site development, Internet sales, trademark or
copyright protection.
1 2 3 4 5
Source: Adopted from Sitting Bull College,
(n.d.) and Emery (2007).
This statement was designed to measure the
support through mentoring programs that is
provided by community members (Emery, 2007).
Entrepreneurial centers are resources in assisting
tribes with economic development (Emery,
2007).

155
APPENDIX D. PILOT TEST PARTICIPANT REQUEST LETTER
NDSU NORTH DAKOTA STATE UNIVERSITY
Education Doctoral Program School of Education
Barbara Schmitt
9220 Plainview Drive
Bismarck, ND 58503
701/527-0931
Title of Research Study: Defining economic success as it pertains to Native
American owned businesses located on/or adjacent to North Dakota reservations.
Dear :
My name is Barbara (Manson) Schmitt. I am a graduate student in Education at North
Dakota State University, and I am conducting a research project on defining economic success as
it pertains to Native American owned businesses located on/or adjacent to North Dakota
reservations. It is our hope, that with this research, we will learn more about exploring
relationships between the perceived level of importance of knowledge, skills, and attitudes and
sustainable business.
I would like to invite you to assist me with the pilot study of my research. This is a
crucial step in validating the research instrument. Attached is the cover letter and survey
701.231.7202
Fax 701.231.7416
156
instrument that will be distributed to Native American owned businesses located on/or adjacent
to the North Dakota reservations.
As part of the validation required, I would like for you to review and comment on the
cover letter and survey using the attached comment form. It should be noted, the survey that is
being used is a modification of a survey that was used in a 1994 study by Dr. Ted Sun.
Your views are very important. This study is anonymous therefore no one, not even
members of the research team, will know that the information you give comes from you. Please
fill out the survey then answer the questions on the comment form. Return the survey and
comment form in the enclosed self-addressed stamped envelope no later than July 13, 2012.
Again, I thank you for your time and assistance in helping me accomplish my dream
and sharing your expertise.
If you have any questions about this project, please contact me at 701/527-0931 or at
my email address, [email protected], or contact my advisor at Dr. Myron Eighmy, 701-
231-5775 Email: [email protected].
Sincerely,
Barbara Schmitt
This project has been reviewed by the NDSU Institutional Review Board. You have rights as a research
participant. If you have questions about your rights or complaints about this research, you may talk to the
researcher or contact the NDSU Human Research Protection Program at 701.231.8908, [email protected],
or by mail at: NDSU HRPP Office, NDSU Dept 4000, PO Box 6050, Fargo, ND 58108-6050.

157
APPENDIX E. PILOT TEST COMMENT FORM
NATIVE AMERICAN ENTREPRENEUR SURVEY
COVER LETTER/SURVEY FEEDBACK QUESTIONS
1. Did the cover letter and questionnaire clearly indicate the purpose of the survey? If not,
suggest improvement_______________________________________________
______________________________________________________________________
______________________________________________________________________
2. Were the instructions clear? If not, suggest improvement____________________
______________________________________________________________________
______________________________________________________________________
3. Is each of the questions clearly written? If not, suggest improvement__________
______________________________________________________________________
______________________________________________________________________
4. Were there any items unclear or ambiguous? If so, which ones?______________
______________________________________________________________________
5. Did you find any problems or difficulties in answering the questions? If yes, suggest
improvement____________________________________________________
______________________________________________________________________
______________________________________________________________________
6. Was the scale easy to use? If not, suggest improvement______________________
______________________________________________________________________
______________________________________________________________________

158
7. How long did it take to complete?________________________________________
_______________________________________________________________________
_______________________________________________________________________
8. Was the length and structure of the questionnaire satisfactory?_______________
_______________________________________________________________________
_______________________________________________________________________
Please provide additional comments below:
_______________________________________________________________________
_______________________________________________________________________
_______________________________________________________________________

159
APPENDIX F. PILOT TEST CRONBACH’S ALPHA
Reliability Statistics
Cronbach's Alpha N of Items
.926 60

160
APPENDIX G. REQUEST FOR PERMISSION LETTER
NDSU NORTH DAKOTA STATE UNIVERSITY
Education Doctoral Program School of Education
Barbara Schmitt
9220 Plainview Drive
Bismarck, ND 58503
701/527-0931
Title of Research Study: Defining economic success as it pertains to Native American
owned businesses located on/or adjacent to North Dakota reservations.
Dear Chairman Yankton:
My name is Barbara (Manson) Schmitt. I am a graduate student in Education at North Dakota
State University, and I am conducting a research project on defining economic success as it
pertains to Native American owned businesses located on/or adjacent to North Dakota
reservations. It is our hope, that with this research, we will learn more about exploring
relationships between the perceived level of importance of knowledge, skills, and attitudes and
sustainable business.
701.231.7202
Fax 701.231.7416

161
I am writing to request permission to conduct research on the Spirit Lake reservation. Can you
please provide me the process necessary to obtain the consent of Spirit Lake Nation?
A survey will be provided to Native American business owners located on/or adjacent to the
Spirit Lake reservation. Participants will be asked questions about the knowledge, skills, and
attitudes of Native American business owners. The findings may benefit the Spirit Lake Nation
in your economic development efforts as well as benefit the tribal economic development office.
It is not possible to identify all potential risks in research procedures, but we have taken
reasonable safeguards to minimize any known risks. These known risks include loss of
confidentiality. We may publish the results of the study; however, this study is anonymous
therefore no one, not even members of the research team, will know the information provided
came from your reservation.
If you have any questions about this project, please contact me at 701/527-0931 or at my email
address, [email protected], or contact my advisor at Dr. Myron Eighmy, 701-231-5775
Email: [email protected].
The Spirit Lake Nation’s consent to conduct research on the Spirit Lake reservation would be
appreciated. Please send the approval/disapproval to the address listed above. If you wish to
receive a copy of the results, please send a written request also to this address.
Sincerely,
Barbara Schmitt
This project has been reviewed by the NDSU Institutional Review Board. You have rights as a research
participant. If you have questions about your rights or complaints about this research, you may talk to the
researcher or contact the NDSU Human Research Protection Program at 701.231.8908, [email protected],
or by mail at: NDSU HRPP Office, NDSU Dept 4000, PO Box 6050, Fargo, ND 58108-6050.
162
NDSU NORTH DAKOTA STATE UNIVERSITY
Education Doctoral Program School of Education
Barbara Schmitt
9220 Plainview Drive
Bismarck, ND 58503
701/527-0931
Title of Research Study: Defining economic success as it pertains to Native American
owned businesses located on/or adjacent to North Dakota reservations.
Dear Chairman Murphy:
My name is Barbara (Manson) Schmitt. I am a graduate student in Education at North Dakota
State University, and I am conducting a research project on defining economic success as it
pertains to Native American owned businesses located on/or adjacent to North Dakota
reservations. It is our hope, that with this research, we will learn more about exploring
relationships between the perceived level of importance of knowledge, skills, and attitudes and
sustainable business.
I am writing to request permission to conduct research on the Standing Rock reservation. Can
you please provide me the process necessary to obtain the consent of the Standing Rock Sioux
Tribe?
A survey will be provided to Native American business owners located on/or adjacent to the
Standing Rock reservation. Participants will be asked questions about the knowledge, skills, and
attitudes of Native American business owners. The findings may benefit the Standing Rock
701.231.7202
Fax 701.231.7416

163
Sioux Tribe in your economic development efforts as well as benefit the tribal economic
development office.
It is not possible to identify all potential risks in research procedures, but we have taken
reasonable safeguards to minimize any known risks. These known risks include loss of
confidentiality. We may publish the results of the study; however, this study is anonymous
therefore no one, not even members of the research team, will know the information provided
came from your reservation.
If you have any questions about this project, please contact me at 701/527-0931 or at my email
address, [email protected], or contact my advisor at Dr. Myron Eighmy, 701-231-5775
Email: [email protected].
The Standing Rock Sioux Tribe’s consent to conduct research on the Standing Rock reservation
would be appreciated. Please send the approval/disapproval to the address listed above. If you
wish to receive a copy of the results, please send a written request also to this address.
Sincerely,
Barbara Schmitt
This project has been reviewed by the NDSU Institutional Review Board. You have rights as a research
participant. If you have questions about your rights or complaints about this research, you may talk to the
researcher or contact the NDSU Human Research Protection Program at 701.231.8908, [email protected],
or by mail at: NDSU HRPP Office, NDSU Dept 4000, PO Box 6050, Fargo, ND 58108-6050.

164
NDSU NORTH DAKOTA STATE UNIVERSITY
Education Doctoral Program School of Education
Barbara Schmitt
9220 Plainview Drive
Bismarck, ND 58503
701/527-0931
Title of Research Study: Defining economic success as it pertains to Native American
owned businesses located on/or adjacent to North Dakota reservations.
Dear Chairman Hall:
My name is Barbara (Manson) Schmitt. I am a graduate student in Education at North Dakota
State University, and I am conducting a research project on defining economic success as it
pertains to Native American owned businesses located on/or adjacent to North Dakota
reservations. It is our hope, that with this research, we will learn more about exploring
relationships between the perceived level of importance of knowledge, skills, and attitudes and
sustainable business.
I am writing to request permission to conduct research on the Fort Berthold reservation. Can you
please provide me the process necessary to obtain the consent of the Three Affiliated Tribes?
A survey will be provided to Native American business owners located on/or adjacent to the Fort
Berthold reservation. Participants will be asked questions about the knowledge, skills, and
attitudes of Native American business owners. The findings may benefit the Three Affiliated
Tribes in your economic development efforts as well as benefit the tribal economic development
office.
701.231.7202
Fax 701.231.7416

165
It is not possible to identify all potential risks in research procedures, but we have taken
reasonable safeguards to minimize any known risks. These known risks include loss of
confidentiality. We may publish the results of the study; however, this study is anonymous
therefore no one, not even members of the research team, will know the information provided
came from your reservation.
If you have any questions about this project, please contact me at 701/527-0931 or at my email
address, [email protected], or contact my advisor at Dr. Myron Eighmy, 701-231-5775
Email: [email protected].
The Three Affiliated Tribe’s consent to conduct research on the Fort Berthold reservation would
be appreciated. Please send the approval/disapproval to the address listed above. If you wish to
receive a copy of the results, please send a written request also to this address.
Sincerely,
Barbara Schmitt
This project has been reviewed by the NDSU Institutional Review Board. You have rights as a research
participant. If you have questions about your rights or complaints about this research, you may talk to the
researcher or contact the NDSU Human Research Protection Program at 701.231.8908, [email protected],
or by mail at: NDSU HRPP Office, NDSU Dept 4000, PO Box 6050, Fargo, ND 58108-6050.
166
NDSU NORTH DAKOTA STATE UNIVERSITY
Education Doctoral Program School of Education
Barbara Schmitt
9220 Plainview Drive
Bismarck, ND 58503
701/527-0931
Title of Research Study: Defining economic success as it pertains to Native American
owned businesses located on/or adjacent to North Dakota reservations.
Dear Chairman St. Claire:
My name is Barbara (Manson) Schmitt. I am a graduate student in Education at North Dakota
State University, and I am conducting a research project on defining economic success as it
pertains to Native American owned businesses located on/or adjacent to North Dakota
reservations. It is our hope, that with this research, we will learn more about exploring
relationships between the perceived level of importance of knowledge, skills, and attitudes and
sustainable business.
I am writing to request permission to conduct research on the Turtle Mountain reservation. Can
you please provide me the process necessary to obtain the consent of the Turtle Mountain Tribe?
A survey will be provided to Native American business owners located on/or adjacent to the
Turtle Mountain reservation. Participants will be asked questions about the knowledge, skills,
and attitudes of Native American business owners. The findings may benefit the Turtle Mountain
Tribe in your economic development efforts as well as benefit the tribal economic development
office.
701.231.7202
Fax 701.231.7416
167
It is not possible to identify all potential risks in research procedures, but we have taken
reasonable safeguards to minimize any known risks. These known risks include loss of
confidentiality. We may publish the results of the study; however, this study is anonymous
therefore no one, not even members of the research team, will know the information provided
came from your reservation.
If you have any questions about this project, please contact me at 701/527-0931 or at my email
address, [email protected], or contact my advisor at Dr. Myron Eighmy, 701-231-5775
Email: [email protected].
The Turtle Mountain Tribe’s consent to conduct research on the Turtle Mountain reservation
would be appreciated. Please send the approval/disapproval to the address listed above. If you
wish to receive a copy of the results, please send a written request also to this address.
Sincerely,
Barbara Schmitt
This project has been reviewed by the NDSU Institutional Review Board. You have rights as a research
participant. If you have questions about your rights or complaints about this research, you may talk to the
researcher or contact the NDSU Human Research Protection Program at 701.231.8908, [email protected],
or by mail at: NDSU HRPP Office, NDSU Dept 4000, PO Box 6050, Fargo, ND 58108-6050.

168
APPENDIX H. TRIBAL RESOLUTIONS/LETTERS

169

170
171
APPENDIX I. PARTICIPANT REQUEST COVER LETTER
NDSU NORTH DAKOTA STATE UNIVERSITY
Education Doctoral Program School of Education
Barbara Schmitt
9220 Plainview Drive
Bismarck, ND 58503
701/527-0931
Title of Research Study: Defining economic success as it pertains to Native American
owned businesses located on/or adjacent to North Dakota reservations.
Dear Entrepreneur:
My name is Barbara (Manson) Schmitt. I am a graduate student in Education at North
Dakota State University, and I am conducting a research project on defining economic success as
it pertains to Native American owned businesses located on/or adjacent to North Dakota
reservations. This is a questionnaire to help discover the knowledge required by a Native
American Entrepreneur to be successful in creating and running a business. This study will
attempt to identify those factors that attribute to economic success as it pertains to Native
American owned businesses located on/or adjacent to North Dakota reservations.
Because you are a Native American business owner, you are invited to take part in this
research project. Your participation is entirely your choice, and you may change your mind or
quit participating at any time, with no penalty to you. It is not possible to identify all potential
risks in research procedures, but we have taken reasonable safeguards to minimize any known
risks. These known risks include loss of confidentiality.
By taking part in this research, the findings may benefit you in your economic
development efforts. Benefits to others may include the tribal administration and the tribal
economic development office.
701.231.7202
Fax 701.231.7416

172
It should take about 15 minutes to complete the survey, which asks questions about the
knowledge, skills, and attitudes of Native American business owners. Every attempt is being
made to maintain confidentiality. Your information will be combined with information from
other people taking part in the study, we will write about the combined information that we have
gathered. You will not be identified in these written materials. We may publish the results of the
study; however, this study is anonymous therefore no one, not even members of the research
team, will know that the information you give comes from you.
Please fill out the survey and return it in the self-addressed stamped envelope
provided as soon as possible.
If you have any questions about this project, please contact me at 701/527-0931 or at
my email address, [email protected], or contact my advisor at Dr. Myron Eighmy, 701-
231-5775 Email: [email protected].
Thank you for your taking part in this research. If you wish to receive a copy of the
results, please send a written request to my address listed above.
Sincerely,
Barbara Schmitt
This project has been reviewed by the NDSU Institutional Review Board. You have rights as a research
participant. If you have questions about your rights or complaints about this research, you may talk to the
researcher or contact the NDSU Human Research Protection Program at 701.231.8908, [email protected],
or by mail at: NDSU HRPP Office, NDSU Dept 4000, P.O. Box 6050, Fargo, ND 58108-6050.

173
APPENDIX J. PARTICIPANT REMINDER LETTER
NDSU NORTH DAKOTA STATE UNIVERSITY
Education Doctoral Program School of Education
Barbara Schmitt
9220 Plainview Drive
Bismarck, ND 58503
701/527-0931
Title of Research Study: Defining economic success as it pertains to Native American owned
businesses located on/or adjacent to North Dakota reservations.
Dear Entrepreneur:
The questionnaire I sent to you recently is vital to the research I am conducting of Native
American entrepreneurs. I am an enrolled member of the Turtle Mountain Band of Chippewa who has
worked in the field of tribal economic development for almost 25 years. I am very passionate about
discovering ways to assist Native American entrepreneurs in their endeavors.
As indicated in the earlier letter I sent to you, the questionnaire is to help discover the
knowledge required by a Native American Entrepreneur to be successful in creating and running a
business. This study will attempt to identify those factors that attribute to economic success as it pertains
to Native American owned businesses located on/or adjacent to North Dakota reservations. Your answers
to the questionnaire are very important to this research.
Will you please fill out the questionnaire and return it in the enclosed envelope as soon as
possible. Your participation is entirely your choice, and you may change your mind or quit participating
at any time, with no penalty to you. Every attempt is being made to maintain confidentiality. You will not
be identified in the written materials. I would hope that you would support this research and return the
questionnaire at your earliest convenience. I would appreciate it very much.
If you have any questions about this project, please contact me at 701/527-0931 or at my email
address, [email protected], or contact my advisor at Dr. Myron Eighmy, 701-231-5775 Email:
701.231.7202
Fax 701.231.7416
174
Thank you again for your taking part in this research. If you wish to receive a copy of the
results, please send a written request to my address listed above.
Sincerely,
Barbara Schmitt
This project has been reviewed by the NDSU Institutional Review Board. You have rights as a research participant. If
you have questions about your rights or complaints about this research, you may talk to the researcher or contact the
NDSU Human Research Protection Program at 701.231.8908, [email protected], or by mail at: NDSU HRPP Office,
NDSU Dept 4000, P.O. Box 6050, Fargo, ND 58108-6050.