defining methodologies and data sources for project-level
TRANSCRIPT
Preliminary Investigation (PI-0292)
Caltrans Division of Research, Innovation and System Information
Defining Methodologies and Data Sources for Project-Level Performance Measurement
Requested by Angel Pyle, SB 1 Program
April 15, 2021
The Caltrans Division of Research, Innovation and System Information (DRISI) receives and evaluates numerous research problem statements for funding every year. DRISI conducts Preliminary Investigations on these problem statements to better scope and prioritize the proposed research in light of existing credible work on the topics nationally and internationally. Online and print sources for Preliminary Investigations include the National Cooperative Highway Research Program (NCHRP) and other Transportation Research Board (TRB) programs, the American Association of State Highway and Transportation Officials (AASHTO), the research and practices of other transportation agencies, and related academic and industry research. The views and conclusions in cited works, while generally peer reviewed or published by authoritative sources, may not be accepted without qualification by all experts in the field. The contents of this document reflect the views of the authors, who are responsible for the facts and accuracy of the data presented herein. The contents do not necessarily reflect the official views or policies of the California Department of Transportation, the State of California, or the Federal Highway Administration. This document does not constitute a standard, specification, or regulation. No part of this publication should be construed as an endorsement for a commercial product, manufacturer, contractor, or consultant. Any trade names or photos of commercial products appearing in this publication are for clarity only.
Table of Contents
Executive Summary................................................................................................................. 5 Background............................................................................................................................. 5 Summary of Findings .............................................................................................................. 5 Gaps in Findings ....................................................................................................................13 Next Steps .............................................................................................................................13
Detailed Findings ....................................................................................................................14 Background............................................................................................................................14 Survey of Practice..................................................................................................................14
Contacts ..................................................................................................................................86 Appendix A: Survey Questions..............................................................................................89
© 2021 California Department of Transportation. All rights reserved.

List of Tables
Table ES1. State/Agency Performance Measures ....................................................................11 Table 1. Accessibility Performance Measures...........................................................................18 Table 2. Climate Performance Measures ..................................................................................23 Table 3. Congestion Performance Measures ............................................................................29 Table 4. Economy and Cost-Effectiveness Performance Measures ..........................................34 Table 5. Efficient Land Use Performance Measures .................................................................38 Table 6. Environment: Short-Term Assessment Performance Measures ..................................42 Table 7. Environment: Long-Term Goals and Objectives Performance Measures.....................44 Table 8. Equity Performance Measures ....................................................................................46 Table 9. Partnership Performance Measures ............................................................................51 Table 10. Quality of Life and Public Health Performance Measures ..........................................53 Table 11. Freight Reliability Performance Measures .................................................................56 Table 12. Nonfreight Reliability Performance Measures............................................................58 Table 13. Safety Performance Measures ..................................................................................61 Table 14. Throughput (Freight) Performance Measures............................................................67 Table 15. Velocity (Freight) Performance Measures .................................................................68 Table 16. Additional Performance Measures.............................................................................69 Table 17. Geospatial Tools Used for Data Collection and Mapping...........................................73 Table 18. Tools and Models Used for Data Collection and Management ..................................74
List of Abbreviations and Acronyms
AADT Annual Average Daily Traffic AASHTO American Association of State Highway and Transportation Officials AB assembly bill ABAG Association of Bay Area Governments ABM Activity-Based Model ACS American Community Survey ADA Americans With Disabilities Act ADT average daily traffic AVMT annual vehicle miles of travel BRT Bus Rapid Transit Caltrans California Department of Transportation CARB California Air Resources Board CARE Community Air Risk Evaluation CMAQ Congestion Mitigation and Air Quality CTC California Transportation Commission
Produced by CTC & Associates LLC 2
CTP Consolidated Transportation Program DAC disadvantaged communities DOT department of transportation EA environmental assessment EIR environmental impact report EIS environmental impact statement EJ environmental justice FEMA Federal Emergency Management Agency FHWA Federal Highway Administration GHG greenhouse gas GIS geographic information system HPMS Highway Performance Monitoring System HQTA High Quality Transit Area Kern COG Kern Council of Governments LA County Metro Los Angeles County Metropolitan Transportation Authority LEHD Longitudinal Employer-Household Dynamics MAP-21 Moving Ahead for Progress in the 21st Century Act MAPC Metropolitan Area Planning Council (Boston) Maryland SHA Maryland State Highway Administration MPO metropolitan planning organization MSTM Maryland Statewide Transportation Model MTC Metropolitan Transportation Commission NHFN National Highway Freight Network NOAA National Oceanic and Atmospheric Administration NPMRDS National Performance Measurement Research Data Set PDA Priority Development Area PeMS Performance Measurement System RCTC Riverside County Transportation Commission RITIS Regional Integrated Transportation Information System RSTP Regional Surface Transportation Program RTP Regional Transportation Plan RTPA regional transportation planning agency SACOG Sacramento Area Council of Governments SACSIM Sacramento Activity-Based Travel Simulation Model SANDAG San Diego Association of Governments SB senate bill SBCAG Santa Barbara County Association of Governments SBCTA San Bernardino County Transportation Authority SBTAM San Bernardino Transportation Analysis Model
Produced by CTC & Associates LLC 3
SCAG Southern California Association of Governments SCCP Solutions for Congested Corridors Program SCCRTC Santa Cruz County Regional Transportation Commission SCS Sustainable Communities Strategy SHOPP State Highway Operation and Protection Program StanCOG Stanislaus Council of Governments STIP Statewide Transportation Improvement Program STP Surface Transportation Program SWITRS Statewide Integrated Traffic Records System TASAS Traffic Accident Surveillance and Analysis System TAZ Traffic Analysis Zone TCEP Trade Corridor Enhancement Program TERM Transit Economic Requirements Model TIMS Traffic Injury Mapping System TIP transportation improvement program TIRCP Transit and Intercity Rail Capital Program TMC Traffic Message Channel TRAC Transportation Review Advisory Council VHD vehicle hours of delay VHT vehicle hours traveled VMT vehicle miles traveled
Produced by CTC & Associates LLC 4

Executive Summary
Background California Department of Transportation (Caltrans) and the California Transportation Commission (CTC) have defined performance measures for use with four competitive transportation project funding programs established in response to Senate Bill 1, Road Repair and Accountability Act of 2017 (SB 1):
Active Transportation Program. Local Partnership Program. Solutions for Congested Corridors Program. Trade Corridor Enhancement Program.
Many of these measures are included in program guidelines and are required to be reported in transportation project applications. Caltrans is seeking information about the practices that other state departments of transportation (DOTs) and California agencies have instituted and implemented (or plan to implement) to measure the impacts of proposed transportation policies, programs and projects, and to ensure transportation equity for disadvantaged communities. This information will be used to develop a guidebook for applicant agencies that will standardize applicants’ use of the performance measures in project applications.
Summary of Findings
Survey of Practice An online survey was distributed to members of the American Association of State Highway and Transportation Officials (AASHTO) Committee on Performance-Based Management. This committee’s membership is national in scope and includes representatives from state DOTs in all 50 states and the District of Columbia. The survey was also distributed to a select group of California metropolitan planning organizations (MPOs), regional transportation planning agencies (RTPAs) and other regional MPOs outside of California.
Thirty agencies responded to the survey. Of these, 17 respondents from 16 agencies described project-level performance measures used to evaluate proposals submitted by applicant agencies:
State DOTs Illinois DOT Maryland DOT Minnesota DOT Ohio DOT
California MPOs Kern Council of Governments (Kern COG) Metropolitan Transportation Commission (MTC) Sacramento Area Council of Governments (SACOG) San Diego Association of Governments (SANDAG) Southern California Association of Governments (SCAG) Stanislaus Council of Governments (StanCOG)
Produced by CTC & Associates LLC 5
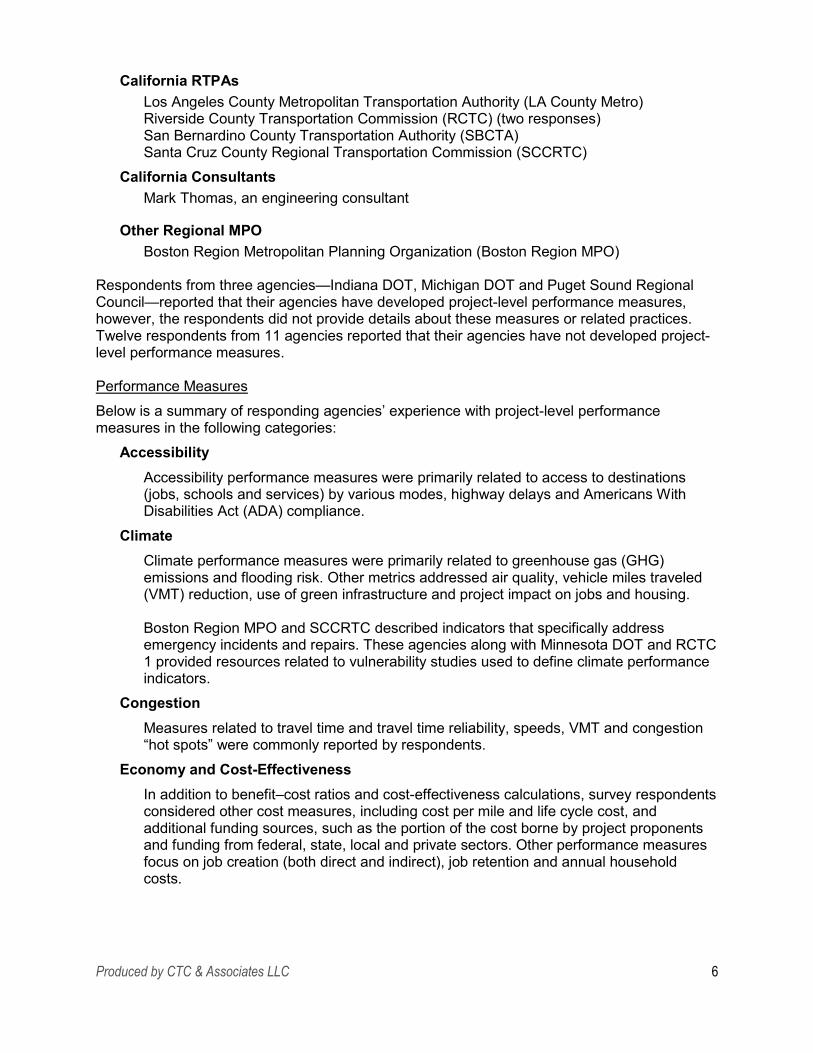
California RTPAs Los Angeles County Metropolitan Transportation Authority (LA County Metro) Riverside County Transportation Commission (RCTC) (two responses) San Bernardino County Transportation Authority (SBCTA) Santa Cruz County Regional Transportation Commission (SCCRTC)
California Consultants Mark Thomas, an engineering consultant
Other Regional MPO Boston Region Metropolitan Planning Organization (Boston Region MPO)
Respondents from three agencies—Indiana DOT, Michigan DOT and Puget Sound Regional Council—reported that their agencies have developed project-level performance measures, however, the respondents did not provide details about these measures or related practices. Twelve respondents from 11 agencies reported that their agencies have not developed project-level performance measures.
Performance Measures Below is a summary of responding agencies’ experience with project-level performance measures in the following categories:
Accessibility Accessibility performance measures were primarily related to access to destinations (jobs, schools and services) by various modes, highway delays and Americans With Disabilities Act (ADA) compliance.
Climate Climate performance measures were primarily related to greenhouse gas (GHG) emissions and flooding risk. Other metrics addressed air quality, vehicle miles traveled (VMT) reduction, use of green infrastructure and project impact on jobs and housing.
Boston Region MPO and SCCRTC described indicators that specifically address emergency incidents and repairs. These agencies along with Minnesota DOT and RCTC 1 provided resources related to vulnerability studies used to define climate performance indicators.
Congestion Measures related to travel time and travel time reliability, speeds, VMT and congestion “hot spots” were commonly reported by respondents.
Economy and Cost-Effectiveness In addition to benefit–cost ratios and cost-effectiveness calculations, survey respondents considered other cost measures, including cost per mile and life cycle cost, and additional funding sources, such as the portion of the cost borne by project proponents and funding from federal, state, local and private sectors. Other performance measures focus on job creation (both direct and indirect), job retention and annual household costs.
Produced by CTC & Associates LLC 6

Efficient Land Use Performance measures were primarily related to land consumption and prioritization plans, but also included metrics for proximity to transit, jobs and affordable housing; active transportation; and congestion.
Environment—Short-Term Assessment Short-term environmental performance metrics included criteria air pollutant and GHG air quality impacts, projects that avoided impacts to sensitive natural areas and state resources, anticipated improvements to water quality and the project’s potential to reduce an urban heat island effect or increase tree canopy coverage. Noise impacts are also considered.
Environment—Long-Term Goals and Objectives Emissions reduction measures were most frequently cited by agencies responding to the survey. Advancing state environmental goals and natural resource preservation were also reported.
Equity Benefits to equity populations is the primary focus of equity performance measures. Boston Region MPO, Mark Thomas (consultant), Minnesota DOT, MTC and SBCTA assess the extent to which projects deliver benefits to people of color, tribal communities, low-income people, people with disabilities, people with limited English proficiency, youth, older adults and other disadvantaged communities. Other focus areas include environmental justice and access to affordable housing, jobs, schools and services.
Innovation Three agencies provided recommendations instead of metrics currently used: RCTC 2 suggested a metric focused specifically on climate change innovation that could be used in conjunction with climate metrics; SBCTA recommended an overall commitment to innovative approaches; and SCCRTC suggested a qualitative discussion explaining why the project is innovative.
Partnership Partnership performance measures include metrics that encourage participation and collaboration from the public and private sectors. In the Boston Region MPO, projects with more co-sponsors are expected to have a higher likelihood of long-term success. Other agencies encourage local agencies to prioritize projects to obtain local agency buy-in.
Quality of Life and Public Health Several agencies use air quality impacts as a measure of quality of life. Metrics in Boston Region MPO include NOx reductions in parts of the region with existing high concentrations. SANDAG evaluates air quality based on PM 2.5, PM 10, CO2, VOC, SOX, CO and NOX. SCCRTC assesses six standard criteria plus GHG. Additional measures assess acres of parks per 1,000 residents; the percent of residents living within a 0.5-mile walk to parks or open space; and enhancements to community assets, such as schools and community centers.
Produced by CTC & Associates LLC 7
Reliability Freight: Truck travel time reliability and freight travel time reliability performance
measures are commonly used among responding agencies to assess freight reliability. Illinois DOT prioritizes projects on routes on the National Highway Freight Network (NHFN). SCCRTC uses 80% reliability, however, the respondent added that it is “very hard to forecast based on project improvements.” Additional measures include vehicle hours traveled time reduction and vehicle hours of buffer time.
Nonfreight: Travel time reliability was also frequently cited as a measure of nonfreight reliability. Boston Region MPO uses a level of travel time reliability based on data from the Regional Integrated Transportation Information System (RITIS), which is obtained from the Center for Advanced Transportation Technology Lab at the University of Maryland. SACOG’s travel time reliability ratio is based on the MAP-21 (Moving Ahead for Progress in the 21st Century Act) level of travel time reliability definition of reliability measurement as 80th percentile travel time divided by 50th percentile travel time.
Safety Most safety performance measures were related to crash rates, the number of fatalities and the number of serious injuries. Additional metrics were reported for reduction in crashes, fatalities and severe injuries; bicycle and pedestrian incidents; presence of bicycle/pedestrian facilities; pavement condition; property damage; and impact on the implementation of Complete Streets policies.
Throughput Truck volume performance measures included daily and peak period volume, percent of traffic volume that is trucks and change in annual truck volume as a result of the project. Additional measures assess the project’s alignment with a state freight plan and share of jobs near projects in industrial sectors, which indicates the volume of freight traffic that will travel on the project segment.
Velocity—Freight Respondents from RCTC 2, SANDAG and SBCTA provided performance measures in the velocity (freight) category. SANDAG uses travel time or total cargo transport time, including dwell time in a logistics facility such as a port or railyard if applicable to the project. SBCTA uses peak and off-peak period speeds for all traffic, with the understanding that trucks travel with all traffic under congested conditions and at the speed limit for uncongested conditions. The agency anticipates that the improvement will not increase speeds for trucks as much as it will for automobiles. The RCTC 2 respondent noted that the CTC metrics of travel time per trip and change in average peak speed are sufficient to measure this outcome.
Several respondents provided information about performance measures in other categories, including economic development, social benefit–cost ratios, resiliency and system preservation/asset management. Table ES1 summarizes agency use of performance measures.
Tools and Models Ten responding agencies reported using ArcGIS, ArcMap and other Esri tools to gather and map data needed to support the project-level performance measures. Additional tools used by agencies included in-house and vendor products, Google Maps and CalEnviroScreen.
Produced by CTC & Associates LLC 8
Agencies also reported using a range of vendor, in-house and other tools and models to manage the data needed to support the project-level performance measures. SACOG uses the select link analysis in its travel model in performance assessment. SANDAG's Activity-Based Model is useful for horizon year data; however, because operating the model takes significant resources, the agency typically uses Cal-B/C for grant applications.
Assessment and Recommendations Successes and Challenges
Successes using project-level performance measures in transportation project applications were reported in the following areas:
Ensuring equitable access to funding. Modeling project elements and cost-effectiveness. Using performance and equity assessment results to identify project deficiencies. Obtaining required design and other documentation. Maintaining flexibility with performance measures. Building interagency relationships.
Challenges that agencies reported included: Incomplete information from applicants. Applicants’ ability to access data. Accommodating projects of all sizes. Issues with tools and access to tools. Understanding how projects will perform in an uncertain future. Maintaining flexibility with performance measures.
Implementation Recommendations
Respondents offered recommendations for other agencies beginning to implement project-level performance measures to evaluate the effectiveness and/or competitiveness of transportation project applications. Below is a sampling of respondents’ suggestions:
Allow performance measures to vary by project type (Boston Region MPO). Ensure a transparent development and education process for new programs (Maryland
DOT, Minnesota DOT). Try some new criteria and then reflect and update measures (Minnesota DOT). Base equity assessments on modeled utilization of a project instead of simply on a
project location (MTC). Use templates within the application to request essential project information and data
(RCTC). Start with observed data to demonstrate an existing need (SACOG). Develop a process for tracking the performance measures since the awarded agency
will need to revisit these performance measures often for annual reporting and audits (SANDAG).
Produced by CTC & Associates LLC 9
Provide the best information for evaluation instead of following the exact wording of the performance measure requirement since measures are not always applicable for all situations (SCCRTC).
Once performance measures are developed, work with the agencies to help generate projects with the ability to meet the performance goals (StanCOG).
Related Research and Resources Included throughout the Preliminary Investigation is documentation provided by survey respondents about using project-level performance measures with competitive transportation project funding programs. Also included is contact information for survey respondents and others who are available to provide additional information about an agency’s project-level performance measurement practices.
Produced by CTC & Associates LLC 10

-
Table ES1. State/Agency Performance Measures
State/Agency Accessibility Climate Congestion Economy Land Use
Environment Short Term
Environment Long Term Equity Innovation
Boston Region MPO X X X X X X X X Illinois DOT X X X X X LA County Metro X X X Mark Thomas X Maryland DOT X X X X X X X X Minnesota DOT X X X X X MTC X X X Ohio DOT RCTC 1 X X X X X X X X RCTC 2 X X X X X X SACOG X X X X X X X X SANDAG X SBCTA X X X X X X X X X SCAG X X X X X SCCRTC X X X X X X StanCOG X
Table ES1. State/Agency Performance Measures, Continued
State/Agency Partnership Quality of Life
Reliability: Freight
Reliability: Nonfreight Safety Throughput
(Freight) Velocity: Freight Other
Boston Region MPO X X X X X Illinois DOT X X X LA County Metro X Mark Thomas Maryland DOT X X X X X X Minnesota DOT X X X
Produced by CTC & Associates LLC 11

State/Agency Partnership Quality of Life
Reliability: Freight
Reliability: Nonfreight Safety Throughput
(Freight) Velocity: Freight Other
MTC X Ohio DOT X RCTC 1 X X X RCTC 2 X X X X X X SACOG X X X SANDAG X X X X SBCTA X X X X X X X SCAG X X X X SCCRTC X X X X X X StanCOG
Produced by CTC & Associates LLC 12
Agencies Not Using Project-Level Performance Measures Twelve respondents from 11 agencies reported that their agencies have not developed project-level performance measures:
State DOTs Florida DOT New Mexico DOT Wyoming DOT
California MPOs SANDAG (two responses: Planning, and Grants and Contracts) San Luis Obispo Council of Governments Santa Barbara County Association of Governments (SBCAG)
California RTPAs Madera County Transportation Commission Modoc County Transportation Commission Shasta Regional Transportation Planning Agency Tehama County Transportation Commission Trinity County DOT
Five agencies—Modoc County Transportation Commission, SANDAG/Planning, SBCAG, Shasta Regional Transportation Planning Agency and Wyoming DOT—provided information about their agencies’ current circumstances related to competitive transportation project funding, which is primarily related to the limited number of funded projects (see page 84).
Gaps in Findings While the survey received a good response and respondents provided a significant level of detail, other state transportation agencies and planning agencies from within California and outside of the state may have information and experience to share related to their use of performance measures. Contacting agencies that did not respond to the survey may produce additional information of value to Caltrans. In addition, follow-up inquiries with survey respondents could generate other information of value to Caltrans, particularly related to methodologies.
Next Steps Moving forward, Caltrans could consider:
Examining the tables in this report to review in detail the performance measures used by respondents.
Engaging with survey respondents to learn more about their use of performance measures, including data sources and methodologies.
Reviewing the publications and other resources provided by respondents related to their agencies’ practices and to studies conducted by these agencies.
Contacting the respondents from Indiana DOT, Michigan DOT and Puget Sound Regional Council for details about the project-level performance measures or related practices used by these agencies.
Reaching out to nonresponding transportation and planning agencies to potentially uncover additional information of value to Caltrans.
Produced by CTC & Associates LLC 13

Detailed Findings
Background California Department of Transportation (Caltrans) and the California Transportation Commission (CTC) have defined performance measures for use with four competitive transportation project funding programs established in response to Senate Bill 1, Road Repair and Accountability Act of 2017 (SB 1):
Active Transportation Program. Local Partnership Program. Solutions for Congested Corridors Program (SCCP). Trade Corridor Enhancement Program (TCEP).
Many of these measures are included in program guidelines and are required to be reported in transportation project applications. They also appear in the California Transportation Plan 2050 and are organized into eight goal areas with related objectives. In addition to the measures that were included in cycles 1 and 2 of the SB 1 programs listed above, Caltrans and CTC are interested in other measures that will help quantify the benefits of potential projects in the following categories:
Accessibility. Equity. Climate. Innovation. Congestion. Partnership. Economy and cost-effectiveness. Quality of life and public health. Efficient land use. Reliability (freight and nonfreight). Environment (short-term
assessment and long-term goals and objectives).
Safety. Throughput (freight). Velocity (freight).
Caltrans is seeking information from state departments of transportation (DOTs) and local and regional agencies about their experience with project-level performance measures and methodologies. This information will be used to inform the development of a guidebook for applicant agencies that provides the methodologies—including data sources, assumptions, standards and calculations—that will standardize applicants’ use of the performance measures in project applications.
Survey of Practice An online survey was distributed to members of the American Association of State Highway and Transportation Officials (AASHTO) Committee on Performance-Based Management. This committee’s membership is national in scope and includes representatives from state DOTs in all 50 states and the District of Columbia. The survey distribution list also included a select group of California metropolitan planning organizations (MPOs), regional transportation planning agencies (RTPAs) and other regional MPOs outside of California.
Survey questions are provided in Appendix A. The full text of survey responses is presented in a supplement to this report.
Produced by CTC & Associates LLC 14

Summary of Survey Results Thirty agencies responded to the survey. Of these, 17 respondents from 16 agencies described project-level performance measures used to evaluate proposals submitted by applicant agencies:
State DOTs Illinois DOT. Maryland DOT. Minnesota DOT. Ohio DOT.
California MPOs Kern Council of Governments (Kern COG). Metropolitan Transportation Commission (MTC). Sacramento Area Council of Governments (SACOG). San Diego Association of Governments (SANDAG). Southern California Association of Governments (SCAG). Stanislaus Council of Governments (StanCOG).
California RTPAs Los Angeles County Metropolitan Transportation Authority (LA County Metro). Riverside County Transportation Commission (RCTC) (two responses). San Bernardino County Transportation Authority (SBCTA). Santa Cruz County Regional Transportation Commission (SCCRTC).
California Consultants Mark Thomas, a consultant that provides “civil and structural engineering, land surveying, planning and urban design, and landscape architectural services for California roadways, structures, bicycle/pedestrian facilities, parks, communities, and infrastructure and utility systems.”
Other Regional MPO Boston Region Metropolitan Planning Organization (Boston Region MPO).
Respondents from three agencies—Indiana DOT, Michigan DOT and Puget Sound Regional Council—reported that their agencies have developed project-level performance measures, however, the respondents did not provide details about these measures or related practices.
Twelve respondents from 11 agencies reported that their agencies have not developed project-level performance measures:
State DOTs Florida DOT. New Mexico DOT. Wyoming DOT.
Produced by CTC & Associates LLC 15

California MPOs SANDAG (two responses). San Luis Obispo Council of Governments. Santa Barbara County Association of Governments (SBCAG).
California RTPAs Madera County Transportation Commission. Modoc County Transportation Commission. Shasta Regional Transportation Planning Agency. Tehama County Transportation Commission. Trinity County DOT.
Information provided by these agencies begins on page 84.
Below are survey results from the 16 agencies reporting on project-level performance measures used to evaluate applicant agency proposals. Two agencies, Kern COG and Ohio DOT, provided the following responses instead of completing the survey:
The Kern COG respondent recommended consolidating the required technical data in reference to all of the state-managed programs, including State Highway Operation and Protection Program (SHOPP), Statewide Transportation Improvement Program (STIP), all SB 1 programs, Congestion Mitigation and Air Quality (CMAQ) and Regional Surface Transportation Program (RSTP). The respondent noted that equity is the only measure that stands out as a challenge for regions and the state, including weighting the various output elements. Most of the transportation programs now are discretionary, he said, and are not all equal in how they should be valued. He also suggested examining all of the applications for existing project programs to determine what agencies are using. He added that regions are “trying to please the state and federal guidelines [but the] challenge is the weighting of all these considerations because it’s political.” He recommended a focus on consistency, using the same formulas and calculations whenever possible since review “gets extremely technical very quickly.” Once the data is gathered, agencies should work with the benefits–cost analysis staff to integrate that data into the other performance measures. Kern COG recently completed an SB 1 TCEP application that included a working spreadsheet to support its output calculations.
According to the Ohio DOT respondent, the agency has “many, many project-level performance measures across dozens of programs.” The respondent referred to two publications: Ohio DOT Program Resource Guide: Fiscal Year 2020, which lists many of its programs and high-level metrics used in some of them, and the Transportation Review Advisory Council (TRAC) Policy and Procedures, one of the agency’s most detailed explanations of project scoring practices for its TRAC program (see page 60 for more information about these resources). He added that many of the agency’s programs have a similar level of project scoring.
Results from the remaining agencies are summarized in the following topic areas: Performance measures. Tools and documentation. Assessment and recommendations.
Produced by CTC & Associates LLC 16

Publications and resources provided by survey respondents are included as supporting documents throughout this report. Additional documentation related to the use of project-level performance measures in connection with competitive transportation project funding programs can be found in Related Research and Resources beginning on page 81.
Below is supplemental information related to other survey responses: Illinois DOT’s project-level performance measures are still in development and have not
yet been implemented. MTC’s responses are related to two distinct processes: its current Surface
Transportation Program (STP)/CMAQ funding program and its Regional Transportation Program (RTP) project performance assessment. The respondent noted that although the RTP is not technically a competitive funding process (there are no actual funds awarded to projects during RTP development), the project performance assessment work that was completed for the RTP could be useful in developing innovative methodologies that could be applied to project prioritization processes for funding programs.
Many of the measures reported by the RCTC 2 respondent are suggested practices and are not currently used by RCTC.
The SANDAG comments are specific to the SB 1 TCEP for its land port of entry project. Much of the SCCRTC data is provided in more detail in its SCCP grant application.
Performance Measures Below is a summary of responding agencies’ experience with project-level performance measures in the following categories:
Accessibility. Equity. Climate. Innovation. Congestion. Partnership. Economy and cost-effectiveness. Quality of life and public health. Efficient land use. Reliability—freight. Environment—short-term
assessment. Reliability—nonfreight. Safety.
Environment—long-term goals and objectives.
Throughput. Velocity—freight.
Additional performance measures reported by respondents are also presented. When available, data sources and methodologies used with each measure are provided.
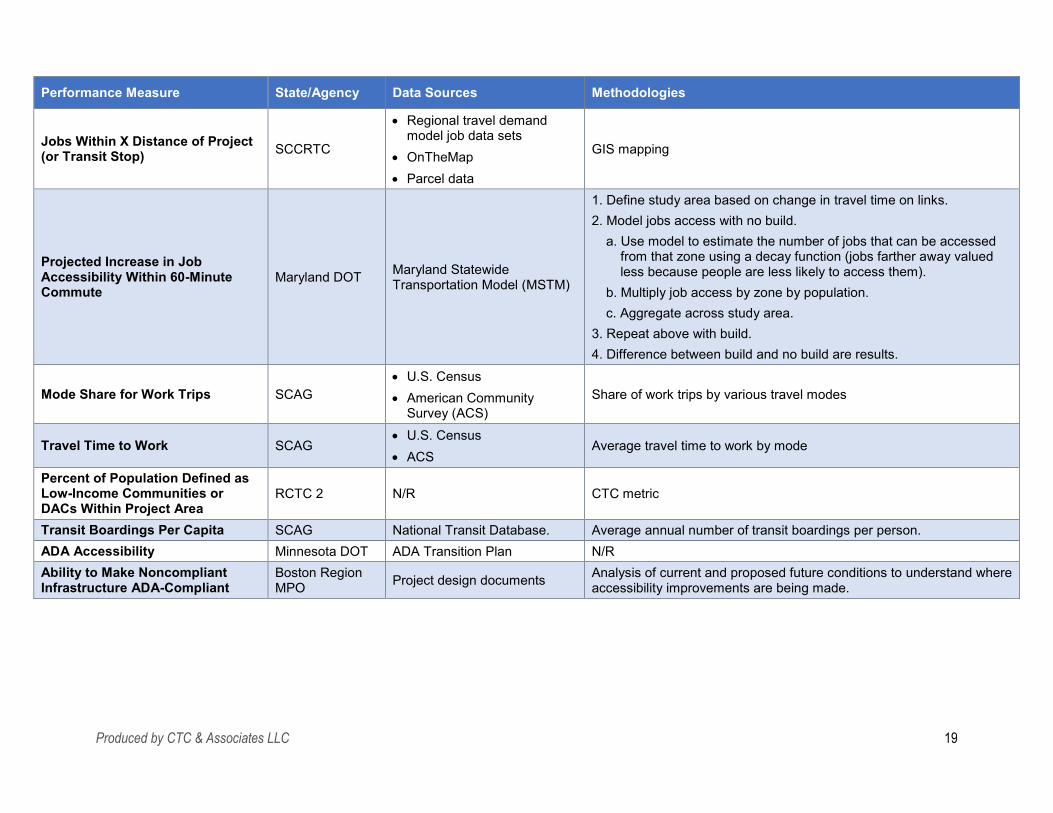
Accessibility Accessibility performance measures were primarily related to access to destinations (jobs, schools and services) by various modes, highway delays and Americans With Disabilities Act (ADA) compliance. The RCTC 2 respondent noted that accessibility measures currently used by CTC are sufficient to measure project impact. These measures include the number of jobs accessible by mode and access to key destinations by mode, and percent of the population defined as low-income or disadvantaged communities (DAC) within the project area.
Table 1 summarizes survey responses.
Produced by CTC & Associates LLC 17

Table 1. Accessibility Performance Measures
Performance Measure State/Agency Data Sources Methodologies
Highway Nonrecurrent Delay SCAG Caltrans Performance Measurement System (PeMS)
Delay caused by atypical traffic patterns, including accidents, weather, planned lane closure or special events
Improved Transportation Choices MTC N/R
Projects that improve transportation choices for all income levels (specifically, those that reduce vehicle miles traveled (VMT)), improve access to transit, and/or emphasize connectivity are given additional weight in STP/CMAQ project prioritization.
Intermodal Accessibility Illinois DOT Illinois DOT GIS data Projects are scored on whether intermodal facilities (ports, airports or rail/truck facilities) are within 1 mile or 3 miles.
Proximity to Key Destinations SCCRTC
Regional travel demand model job data sets
OnTheMap Parcel data
GIS mapping
Average Number of Destinations (Jobs, Schools) Accessible Near Project by Mode (Walk, Bike, Drive, Transit)
RCTC 2, SACOG
SACOG: CUBE Access by Bentley
Systems General Transit Feed data Commercially available
congestion data Routable all-streets GIS
network U.S. Census population data Longitudinal Employer-
Household Dynamics (LEHD) data.
RCTC 2: CTC metrics (number of jobs accessible by mode and access to key destinations by mode). SACOG:
CUBE Access software calculates accessibility at a user-specified geography (e.g., accessibility to jobs from each block group, census tract or Traffic Analysis Zone (TAZ)).
Project Performance Assessment goes one step further and gets “project average” accessibility (the average accessibility for an entire project based on the accessibility of the census blocks in the project).
Jobs Within a Median Work Trip Length of the Corridor (Freight/ Express Lane Project)
SBCTA TAZ data GIS analysis of number of jobs within corridor (for highway)
Jobs Within 0.5 Mile of Transit Station (Bus Rapid Transit (BRT) Project)
SBCTA TAZ data Geographic information system (GIS) analysis of number of jobs within 0.5-mile radius of transit stations (for transit, BRT or rail)
Produced by CTC & Associates LLC 18
Performance Measure State/Agency Data Sources Methodologies
Jobs Within X Distance of Project (or Transit Stop) SCCRTC
Regional travel demand model job data sets
OnTheMap Parcel data
GIS mapping
Projected Increase in Job Accessibility Within 60-Minute Commute
Maryland DOT Maryland Statewide Transportation Model (MSTM)
1. Define study area based on change in travel time on links. 2. Model jobs access with no build.
a. Use model to estimate the number of jobs that can be accessed from that zone using a decay function (jobs farther away valued less because people are less likely to access them).
b. Multiply job access by zone by population. c. Aggregate across study area.
3. Repeat above with build. 4. Difference between build and no build are results.
Mode Share for Work Trips SCAG U.S. Census American Community
Survey (ACS) Share of work trips by various travel modes
Travel Time to Work SCAG U.S. Census ACS
Average travel time to work by mode
Percent of Population Defined as Low-Income Communities or DACs Within Project Area
RCTC 2 N/R CTC metric
Transit Boardings Per Capita SCAG National Transit Database. Average annual number of transit boardings per person. ADA Accessibility Minnesota DOT ADA Transition Plan N/R Ability to Make Noncompliant Infrastructure ADA-Compliant
Boston Region MPO Project design documents Analysis of current and proposed future conditions to understand where
accessibility improvements are being made.
Produced by CTC & Associates LLC 19

Performance Measure State/Agency Data Sources Methodologies
Accessibility Coordinator to Manage ADA Conformance RCTC 1
Project-level accessibility requirements determined as a function of specific project objectives. In construction-related projects, this is conformance to ADA requirements.
Qualitative measure. RCTC has published an ADA nondiscrimination notice, ADA grievance procedure and ADA discrimination complaint form on its web site.
All Build Vs. No Build (Unless Otherwise Specified) SBCTA TAZ employment data GIS analysis of number of jobs within corridor (for highway)
Freight Facility Access Minnesota DOT Applicant information N/R
Percentage Elevation Gain Over Route LA County Metro
mapmyride.com Google Maps
N/R
N/R No response.
Produced by CTC & Associates LLC 20

Climate Climate performance measures were primarily related to greenhouse gas (GHG) emissions and flooding risk. Other metrics addressed air quality, reduction in vehicle miles traveled (VMT), use of green infrastructure, and project impact on jobs and housing. The RCTC 2 respondent suggested that in addition to the air quality and GHG emissions performance metrics used by the CTC, agencies could consider the reduction in GHG emissions that would result if a project includes a scope to build an alternative energy source such as wind, solar or other installations. Project documentation could provide the needed data, and Cal-B./C could be used to evaluate the measure.
Table 2 summarizes survey responses.
Indicators Specifically Addressing Emergency Incidents and Repairs
Two agency respondents—Boston Region MPO and SCCRTC—described indicators that specifically address emergency incidents and repairs:
Boston Region MPO: Projects are awarded points for making multimodal improvements to hurricane evacuation routes (for those projects located in areas that the Massachusetts Emergency Management Agency has identified as hurricane evacuation zones).
SCCRTC: The respondent noted that one quantitative performance measure may not address all types of emergency scenarios. She added that emergency response metrics should be “open-ended discussions” that explain how a project will improve any type of emergency response, such as alternative options for travel through transit or improved highway shoulders for breakdowns or collision removal.
Vulnerability Studies Used to Define Climate Performance Indicators
Four agency respondents—Boston Region MPO, Minnesota DOT, RCTC 1 and SCCRTC— provided resources related to vulnerability studies used to define climate performance indicators:
Boston Region MPO: The agency uses municipal vulnerability, climate adaptation and hazard mitigation plans.
Minnesota DOT: The agency’s climate resilience web page (see Supporting Documents below) provides access to ongoing research and completed vulnerability analyses.
RCTC 1: Many project-level air quality analyses conducted by RCTC consider any disproportionate impact on DACs.
SCCRTC: The agency uses The Nature Conservancy’s Coastal Resilience mapping portal and NOAA’s Sea Level Rise Viewer to evaluate potential coastal flooding impact areas and relative depth (see Supporting Documents below).
Supporting Documents
Minnesota Cost-Effectiveness and Benefit–Cost Analysis for Transportation Projects: Standard Value Tables, Appendix A, Office of Transportation System Management, Minnesota Department of Transportation, July 2020. https://www.dot.state.mn.us/planning/program/appendix_a.html Standard values for use in benefit–cost analysis are available on this web page.
Produced by CTC & Associates LLC 21

Climate Resilience, Minnesota Department of Transportation, undated. https://www.dot.state.mn.us/sustainability/climate-resilience.html Access to ongoing climate research and completed vulnerability analyses is provided at this web site.
Santa Cruz County Regional Transportation Commission Coastal Resilience Mapping Portal, The Nature Conservancy, undated. https://maps.coastalresilience.org/ From the web page: Coastal Resilience is a program led by The Nature Conservancy to examine nature’s role in reducing coastal flood risk. The program consists of an approach, a web mapping tool, and a network of practitioners around the world supporting hazard mitigation and climate adaptation planning.
Sea Level Rise Viewer, National Oceanic and Atmospheric Administration (NOAA), undated. https://coast.noaa.gov/slr/ This tool allows users to view sea level rise and potential coastal flooding impact areas and relative depth.
Produced by CTC & Associates LLC 22

Table 2. Climate Performance Measures
Performance Measure State/Agency Data Sources Methodologies
Anticipated Flooding or Sea Level Rise Issues Based on Future Climate Projections
Boston Region MPO
Project design documents State data on flooding and
sea level rise
Analyze project documents and climate projections to understand the relationship of the project to anticipated issues with flooding or rises in sea level.
Coastal Resiliency (Length of Project With Potential Impact From Climate Change)
SCCRTC
NOAA and other tools for assessing coastal erosion, coastal storm surge and flooding impacts from sea level rise (see Supporting Documents).
Use NOAA and other tools to assess coastal erosion, coastal storm surge and flooding impacts from sea level rise (see Supporting Documents).
Proportion of Project Area Vulnerable to Flooding
Maryland DOT, Minnesota DOT
Maryland DOT: MSTM Federal Emergency
Management Agency (FEMA) 100-year floodplain
Minnesota DOT: Flood risk based on vulnerability assessment
Maryland DOT: 1. Determine the area (in acres) within the 100-year floodplain impacted by the project.
Using geospatial data, layer project acres over 100-year floodplain areas to determine the acres impacted within the 100-year floodplain.
2. Divide the number of impacted acres within the 100-year floodplain by the total project acres.
3. Subtract this number from 1 (i.e., score = 1 - impacted acres/total project acres). Scale the benefit by dividing by the maximum unscaled value across all projects in the comparison database.
Use of Green Infrastructure or Other Climate-Resilient Materials
Boston Region MPO
Project design documents State data on flooding and
sea level rise
Analyze project documents and climate projections to understand the relationship of the project to planned use of green infrastructure or other climate-resilient materials.
Support for Regional Resiliency Plan/Study Goals
Boston Region MPO
Project design documents State data on flooding and
sea level rise
Analyze project documents and climate projections to understand the relationship of the project to regional resiliency goals.
Potential to Reduce GHG Emissions
Maryland DOT, Minnesota DOT, SBCTA, SCCRTC
Maryland DOT: MSTM
Minnesota DOT: Emissions based on change in VMT and truck VMT
Maryland DOT: Highway Projects
1. Identify zones in the project study area. 2. Use the MSTM multi-resolution framework to assign traffic at the higher-resolution
(Level 2) zone structure.
Produced by CTC & Associates LLC 23

Performance Measure State/Agency Data Sources Methodologies
SBCTA: GHG emission factors in Cal-B/C
SCCRTC: EMFAC or Cal-B/C
3. Calculate the daily fuel consumption from each period based on congested travel times for the baseline or no-build condition within the study area.
4. Calculate the daily fuel consumption from each period based on congested travel times for the build condition within the study area.
5. Subtract the daily fuel consumed under the no-build condition from the build condition to estimate daily fuel savings due to operating speed improvements.
6. Annualize fuel savings. 7. Divide by 1000 to convert value into thousands of gallons.
Transit Projects 1. Obtain the number of daily new transit passengers. 2. Compute reduced fuel consumption as a result of new transit riders:
a. Convert new daily transit passengers to annual passengers. b. Multiply by average transit trip length in miles (constant value). This value
represents annual miles of new transit trips. c. Divide by fuel economy average in miles per gallon (constant value). This value
represents the gallons of fuel saved by shifting passengers from highway to transit travel.
d. Divide by 1000 to convert value into thousands of gallons. 3. Add the values for fuel savings for highway and transit. 4. Scale the benefit by dividing by the maximum unscaled value across all projects in
the comparison database. For projecting fuel savings, the agency estimates that each new trip reduced fuel consumption by 0.2 gallon based on an average auto trip in DMV of 5 miles divided by the average fuel efficiency of vehicles at 27 miles per gallon. This equates to a 0.2 gallon fuel savings per new transit passengers off the roadway.
Minnesota DOT: Part of the agency’s benefit–cost analysis (see Supporting Documents). SBCTA: Use Cal-B/C Sketch version 7.2. Post-implementation estimates not feasible. SCCRTC: Use EMFAC or Cal-B/C.
Produced by CTC & Associates LLC 24

Performance Measure State/Agency Data Sources Methodologies
Life Cycle GHG Emissions RCTC 1
Traffic engineering studies
Environmental impact studies and EIRs
Project-level analyses
California Air Resources Board (CARB) GHG quantification methodologies Cal-B/C suite of tools ICF Infrastructure Carbon Estimator
Project-Level GHG Emissions RCTC 1
Traffic engineering studies
Environmental impact studies and EIRs
Project-level analyses
CARB GHG quantification methodologies Cal-B/C suite of tools ICF Infrastructure Carbon Estimator
Construction-Related GHG Emissions
RCTC 1
Traffic engineering studies
Environmental impact studies and EIRs
Project-level analyses
CARB GHG quantification methodologies Cal-B/C suite of tools ICF Infrastructure Carbon Estimator
GHG Reduction From Alternative Energy (e.g., Wind, Solar)*
RCTC 2* Project documentation* Calculate in Cal-B/C*.
Ambient Air Quality Conditions SCAG CARB Existing air quality condition by air basin
VMT SCAG Highway Performance Monitoring System (HPMS) Average annual VMT per person (autos and light trucks)
VMT Reduction SCCRTC Travel demand model Off model analysis for
countywide VMT
Travel demand model Off model analysis for countywide VMT
Build, No-Build Conditions SBCTA GHG emission factors in
Cal-B/C Use Cal-B/C Sketch version 7.2. Post-implementation estimates not feasible.
Produced by CTC & Associates LLC 25

Performance Measure State/Agency Data Sources Methodologies
Land Use Mix Index** SACOG
SACSIM (Sacramento Activity-Based Travel Simulation Model) outputs for parcel-level: o VMT estimates o Mode-split
estimates
Land use mix index compares ratios of various job types that are proxies for typical daily needs like schools and retail to the number of households that are within a given area. For Project Performance Assessment, this area is within 0.5 mile of a proposed transportation project.
Accessibility to Services by Walking/Short Drive
SACOG CUBE Access software N/R
Share of Total Centerline Miles That are Bike Paths/Bike Lanes
SACOG GIS line file of regional bike facilities N/R
Total Jobs and Housing Within 0.5 Mile of Project
SACOG
SACOG Employment Inventory
ACS Local agency general
and specific plans and parcel data
N/R
Transit Vehicle Stops Per Acre Per Day
SACOG GTFS transit service data for levels of service down to the transit stop
N/R
Transit Person-Trips on Segment SACOG
SACSIM travel demand model estimates of transit person-trips on road segments
N/R
Share of Household Growth in High Quality Transit Areas (HQTAs)
SCAG ACS SCAG data Share of total regional household growth occurring in HQTAs
Share of Employment Growth in HQTAs
SCAG ACS SCAG data Share of total regional employment growth
Produced by CTC & Associates LLC 26

Performance Measure State/Agency Data Sources Methodologies
GHG Reduction From Alternative Energy Source (e.g., Wind, Solar)*
RCTC 2* Project documentation* Calculate in Cal-B/C.*
N/R No response. * Potential performance measure. RCTC does not use this practice. ** Land use mix index: Mix of houses and businesses accessible to residents through nondriving modes or by short (less than 1 mile) driving trips.
Produced by CTC & Associates LLC 27

Congestion Measures related to travel time and travel time reliability, speeds, VMT and congestion “hot spots” were commonly reported by respondents. Minnesota DOT uses a benefit–cost ratio, and Maryland DOT assesses the positive impact on travel time. Data sources ranged from national and state modeling to traffic engineering analyses and environmental impact reports (EIRs).
Table 3 summarizes survey responses.
Supporting Document
Minnesota Cost-Effectiveness and Benefit–Cost Analysis for Transportation Projects: Standard Value Tables, Appendix A, Office of Transportation System Management, Minnesota Department of Transportation, July 2020. https://www.dot.state.mn.us/planning/program/appendix_a.html Standard values for use in benefit–cost analysis are available on this web page.
Produced by CTC & Associates LLC 28

Table 3. Congestion Performance Measures
Performance Measure State/Agency Data Sources Methodologies
Positive Impact on Travel Time Maryland DOT MSTM
Highway Projects 1. Identify zones that comprise the study area for each project. 2. Use the MSTM multi-resolution framework to assign traffic at the higher-resolution
(Level 2) zone structure. 3. Combine vehicle hours traveled (VHT) for each time of day to develop daily VHT
under free-flow conditions. 4. Combine VHT for each time of day to develop daily VHT under congested
conditions. 5. Subtract congested VHT from free-flow VHT to calculate vehicle hours of delay
(VHD). 6. Annualize daily VHT and divide by 1000 to report in thousands.
Transit Projects 1. Obtain the number of daily new transit passengers. 2. Calculate the travel time savings for transit users through the Renaissance
Planning Multimodal Accessibility Tool: a. Compute a comparison of the matrix of zone-to-zone transit travel time savings
against the highway trip table from the MSTM to compute a weighted average of travel time savings multiplied by transit ridership, and annualized.
3. Compute travel time savings for highway users as a result of the transit project. a. Multiply daily new transit passengers by travel time savings for new transit
passenger (constant value expressed in minutes/trip). b. Convert from daily to annual travel time savings. This value represents the
annual minutes of travel time saved by new transit passengers produced by the project.
c. Divide by 60 to convert minutes of travel time savings to hours of travel time savings. Then divide by 1000 to convert value to align with the thousands of hours scale.
4. Add the values for annual travel time savings for highway and transit users. 5. Scale the benefit by dividing by the maximum unscaled value across all projects in
the comparison database.
Produced by CTC & Associates LLC 29

Performance Measure State/Agency Data Sources Methodologies
Benefit–Cost Ratio Minnesota DOT N/R See Supporting Documents.
Bottleneck/ Congestion Hot Spots
RCTC 1
Traffic engineering analyses
EIRs Signal coordination
timing analyses
Methodologies included in analytic tools (including but not limited to Synchro Trafficware and SimTraffic)
Change in Level of Service
RCTC 1, RCTC 2
Traffic engineering analyses
EIRs Signal coordination
timing analyses
Methodologies included in analytic tools (including but not limited to Synchro Trafficware and SimTraffic)
Highway Capacity Manual
Average Peak Hour and Peak Period Speeds
SBCTA Probe-based data analyzed with ClearGuide (Iteris)
Generally use speed/distance speed contour diagrams to illustrate extent and time of congestion. Note: Selection of analysis area/study area and facilities included is critically important for VHT, PHT and VMT. Study area should capture all the effects of the project, and scope of impact can vary significantly from project to project.
Peak and Off-Peak Speed and Volumes SACOG:
National Performance Measurement Research Data Set (NPMRDS)
SACSIM travel demand model
Calculate congestion and reliability. These values are initially calculated for each Traffic Message Channel (TMC) segment, provided in the NPMRDS data set; project-level analyses are then aggregated to get average speed and reliability values for a given project’s extent.
Select link analysis in travel model.
Comparison of Free-Flow Speed to Congested Speed*
SACOG: NPMRDS SACSIM travel demand
model
Calculate congestion and reliability. These values are initially calculated for each TMC segment, provided in the NPMRDS data set; project-level analyses are then aggregated to get average speed and reliability values for a given project’s extent.
Select link analysis in travel model.
Annual Average Daily Traffic (AADT) Travel Time Index
Illinois DOT Illinois DOT data Project AADT = SUM(segment AADT x (segment length/project length) ) TTI calculated using Regional Integrated Transportation Information System (RITIS)
platform Travel Time Reliability for Automobiles
SCAG Caltrans PeMS Day-to-day variation in travel times of automobile travelers along a specified roadway.
Produced by CTC & Associates LLC 30

Performance Measure State/Agency Data Sources Methodologies
Travel Time Reliability for Trucks
SCAG Caltrans PeMS Day-to-day variation in travel times of trucks along a specified roadway
Vehicle Hours of Delay SCCRTC
Caltrans HPMS Travel demand model U.S. Census data California Household
Travel Survey Traffic count data Origin/destination data
from cellphone
Mode shift projections from vehicles to other modes based on bike or transit ridership projections with new facility. Transit ridership projections can include many types of data for assessment.
Vehicle Hours of Travel Time Saved SBCTA Subregional travel demand
model
Generally use speed/distance speed contour diagrams to illustrate extent and time of congestion. Note: Selection of analysis area/study area and facilities included is critically important for VHT, PHT and VMT. Study area should capture all the effects of the project, and scope of impact can vary significantly from project to project.
Person Hours of Travel Time Saved SBCTA Subregional travel demand
model
Generally use speed/distance speed contour diagrams to illustrate extent and time of congestion. Note: Selection of analysis area/study area and facilities included is critically important for VHT, PHT and VMT. Study area should capture all the effects of the project, and scope of impact can vary significantly from project to project.
Transit: Daily Hours of Passenger Delay
Boston Region MPO RTA ridership/route data
Change in traffic signal delay resulting from the project is calculated. Result is translated into transit passenger hours of delay (for bus and light rail)
based on ridership.
VMT SBCTA Probe-based data analyzed with ClearGuide (Iteris)
Generally use speed/distance speed contour diagrams to illustrate extent and time of congestion. Note: Selection of analysis area/study area and facilities included is critically important for VHT, PHT and VMT. Study area should capture all the effects of the project, and scope of impact can vary significantly from project to project.
Produced by CTC & Associates LLC 31

Performance Measure State/Agency Data Sources Methodologies
Countywide VMT SCCRTC
Caltrans HPMS Travel demand model U.S. Census data California Household
Travel Survey Traffic count data Origin/destination data
from cellphone
Mode shift projections from vehicles to other modes based on bike or transit ridership projections with new facility. Transit ridership projections can include many types of data for assessment.
Countywide VMT Per Capita SCCRTC
Caltrans HPMS Travel demand model U.S. Census data California Household
Travel Survey Traffic count data Origin/destination data
from cellphone
Mode shift projections from vehicles to other modes based on bike or transit ridership projections with new facility. Transit ridership projections can include many types of data for assessment.
Change in VMT RCTC 1
Traffic engineering analyses
EIRs Signal coordination
timing analyses
Methodologies included in analytic tools (including but not limited to Synchro Trafficware and SimTraffic)
Projected Change in Annual Vehicle Miles of Travel (AVMT)
Illinois DOT Illinois DOT statistics
Change in AVMT = 1 - e^rt where:
e = mathematical constant r = county growth rate t = # of years (plan to use 20 years)
N/R No response. * Congested speed is the average speed during the four slowest weekday hours.
Produced by CTC & Associates LLC 32
Economy and Cost-Effectiveness In addition to benefit–cost ratios and cost-effectiveness calculations, survey respondents considered other cost measures, including cost per mile and life cycle cost, and additional funding sources, such as the portion of the cost borne by project proponents and funding from federal, state, local and private sectors. Other performance measures focus on job creation (both direct and indirect), job retention and annual household costs.
StanCOG uses dollars per pound as a metric. The respondent noted that beginning in fiscal year 2011, all San Joaquin Valley MPOs adopted policies for distributing at least 20% of CMAQ funds to projects that meet a cost-effectiveness threshold for emission reductions. The policies indicate that before allocating CMAQ funds with each new Federal Transportation Improvement Program, the San Joaquin Valley MPOs in consultation with the interagency consultation partners will develop the cost-effectiveness threshold. The current threshold is $45 per pound ($90,000 per ton).
Table 4 summarizes survey responses.
Supporting Documents
Minnesota Cost-Effectiveness and Benefit–Cost Analysis for Transportation Projects: Standard Value Tables, Appendix A, Office of Transportation System Management, Minnesota Department of Transportation, July 2020. https://www.dot.state.mn.us/planning/program/appendix_a.html Standard values for use in benefit–cost analysis are available on this web page.
Stanislaus Council of Governments Congestion Mitigation and Air Quality Improvement (CMAQ) Program, California Air Resources Board, undated. http://www.arb.ca.gov/planning/tsaq/eval/eval.htm This web page offers access to the automated tool for determining the cost-effectiveness of funding air quality projects.
Methods to Find the Cost-Effectiveness of Funding Air Quality Projects: Emission Factor Tables, California Air Resources Board, March 2018. https://myairdistrict.com/wp-content/uploads/2018/09/Emission-Factor-Tables-March-2018.pdf This methodology is used by StanCOG for calculating cost-effectiveness.
Produced by CTC & Associates LLC 33

Table 4. Economy and Cost-Effectiveness Performance Measures
Performance Measure State/Agency Data Sources Methodologies
Air Quality Cost Effectiveness RCTC 1
Project design documentation
Cost estimates. CARB cost-effectiveness methodologies.
Benefit–Cost Ratio
Minnesota DOT, RCTC 1, SBCTA
Minnesota DOT: Usually project applicants RCTC 1: Project design
documentation Cost estimates SBCTA: All inputs required for Cal-B/C
Minnesota DOT : Benefits/cost ratio (see Supporting Documents) RCTC 1: Cal-B/C SBCTA: Cal-B/C 7.2 Sketch
Cost-Effectiveness
Minnesota DOT, SACOG, SCCRTC
Minnesota DOT Applicants SACOG: Average daily traffic
(ADT) Cost Useful life estimate Length SCCRTC: Cal-B/C
Minnesota DOT: Usually a points/cost calculation. SACOG: Simple cost–effect calculation based on sponsor-provided inputs. Not meant to imply precision. SCCRTC: Cal-B/C for various modes.
Percent of Project Cost Borne by Proponent
Boston Region MPO Project documentation
Projects are awarded more points for supplementing transportation improvement program (TIP) funding with other public or private funding sources in support of capital costs
Leverage Additional Funding (Federal, State, Local and Private Sectors)
Maryland DOT MSTM
1. Determine total value of funds from other sources, defined as: a. Anticipated commitments from local governments/private entities; or b. Committed discretionary funds awarded through federal grant applications.
2. Divide by the total project cost. 3. Scale the benefit by dividing by the maximum unscaled value across all
projects in the comparison database.
Produced by CTC & Associates LLC 34

Performance Measure State/Agency Data Sources Methodologies
Cost Per Mile LA County Metro
Applicant data on total project cost and project limits
N/R
Life Cycle Cost RCTC 1 Project design
documentation Cost estimates
Cal-B/C
Estimated Travel Time Savings Divided by Project Cost
Maryland DOT MSTM
1. Obtain the scaled annual hours of travel time savings for the project. This value is the output from the calculation for Goal 3 Measure 2, Travel Time Reliability.
2. Divide by project cost from the Maryland Consolidated Transportation Program (CTP). If the project is not in the CTP, use the combined value of state money plus federal formula money.
3. Scale the benefit by dividing by the maximum unscaled value across all projects in the comparison database.
Dollars Per Pound StanCOG CARB (see Supporting Documents)
Methodology taken from the March 2018 CARB Methods to Find the Cost-Effectiveness of Funding Air Quality Projects (see Supporting Documents).
Cost-effectiveness for CMAQ projects should be expressed as dollars spent per pound of pollutant reduced (ROG + NOx + PM2.5 + PM10).
CO emissions are not included in the formula. CO is several orders of magnitude larger than ozone precursors and overwhelms cost-effectiveness ratios unless CO emission reductions are scaled back significantly, typically by a factor of seven.
As indicated in the policy, cost-effectiveness is based on CMAQ dollars only (versus total project costs, which include capital investments and operating costs). The funding dollars are amortized over the expected project life using a discount rate. The amortization formula yields a capital recovery factor, which, when multiplied by the funding, gives the annual funding for the project over its expected lifetime.
Cost-effectiveness is determined by dividing annualized funds by annual emission reductions (VOC + NOx + PM10).
Major Development Illinois DOT Illinois DOT district
information A project is evaluated on whether any major industrial, commercial or residential development has recently occurred or is being planned along the project corridor.
Produced by CTC & Associates LLC 35

Performance Measure State/Agency Data Sources Methodologies
Job Creation/ Retention
Minnesota DOT, SANDAG, SBCTA, SCCRTC
Minnesota DOT: Usually project applicants SANDAG: Applicable capital cost
and annual operation and maintenance cost estimates
Regional economic multipliers from IMPLAN
SBCTA: All inputs required for Cal-B/C SCCRTC: Cal-B/C
Minnesota DOT: Number of jobs created per million of construction costs and income created (number of jobs x average wages)
SANDAG: Direct and indirect jobs. Input-output analysis with IMPLAN tool SBCTA: Cal-B/C 7.2 Sketch SCCRTC: Caltrans provides an estimate of 11 direct and indirect jobs for every $1 million spent.
Annual Household Transportation Cost
SCAG Center for Neighborhood Technology
Annual household spending on transportation, including vehicle ownership, operation and maintenance, and transit costs
Share of Annual Household Income Spent on Housing
SCAG U.S. Bureau of Labor
Statistics ACS
Share of annual household income spent on housing-related expenses.
N/R No response.
Produced by CTC & Associates LLC 36
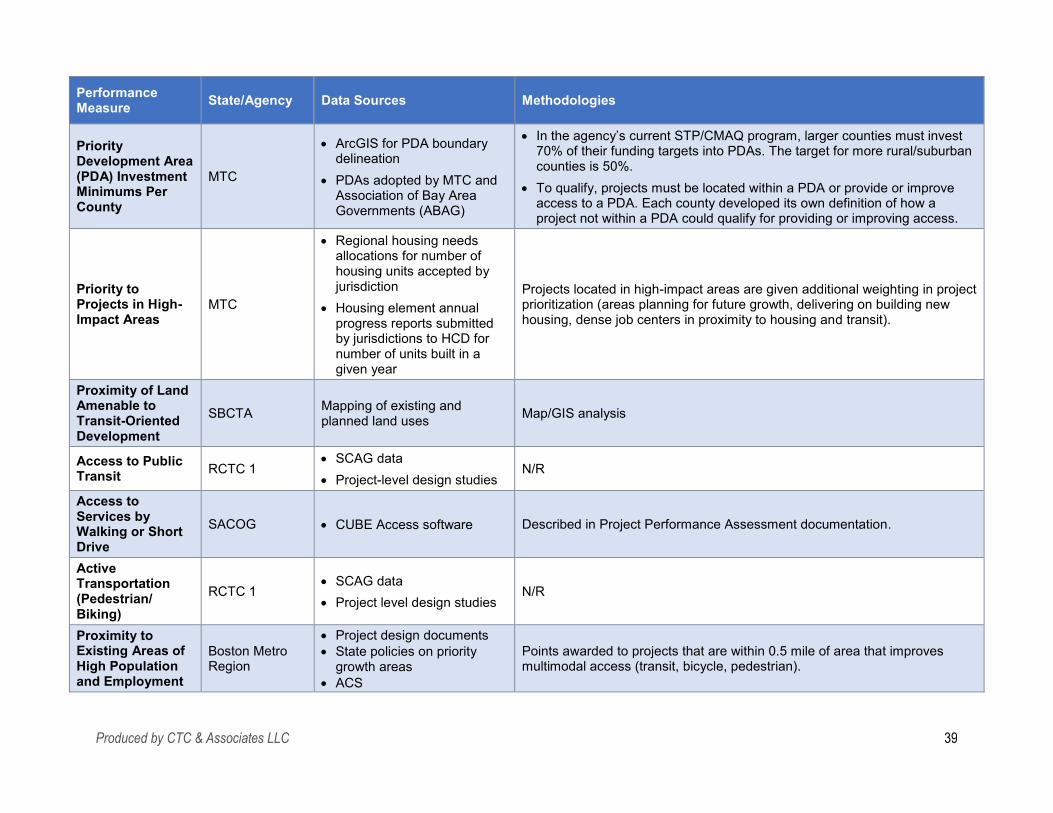
Efficient Land Use Performance measures were primarily related to land consumption and prioritization plans, but also included metrics for proximity to transit, jobs and affordable housing; active transportation; and congestion. The SCCRTC respondent noted that this measure is difficult to assess quantitatively, adding that discussions similar to the SCCP analysis worked, but agencies “need space to provide this level of detail.”
The RCTC 2 respondent suggested a potential metric could focus on supplying needed transportation and housing for future population demand; for example, the measure could evaluate the amount of housing within a specified proximity of the project area that will be available to an estimated additional population in the area by a specific year.
Table 5 summarizes survey responses.
Produced by CTC & Associates LLC 37
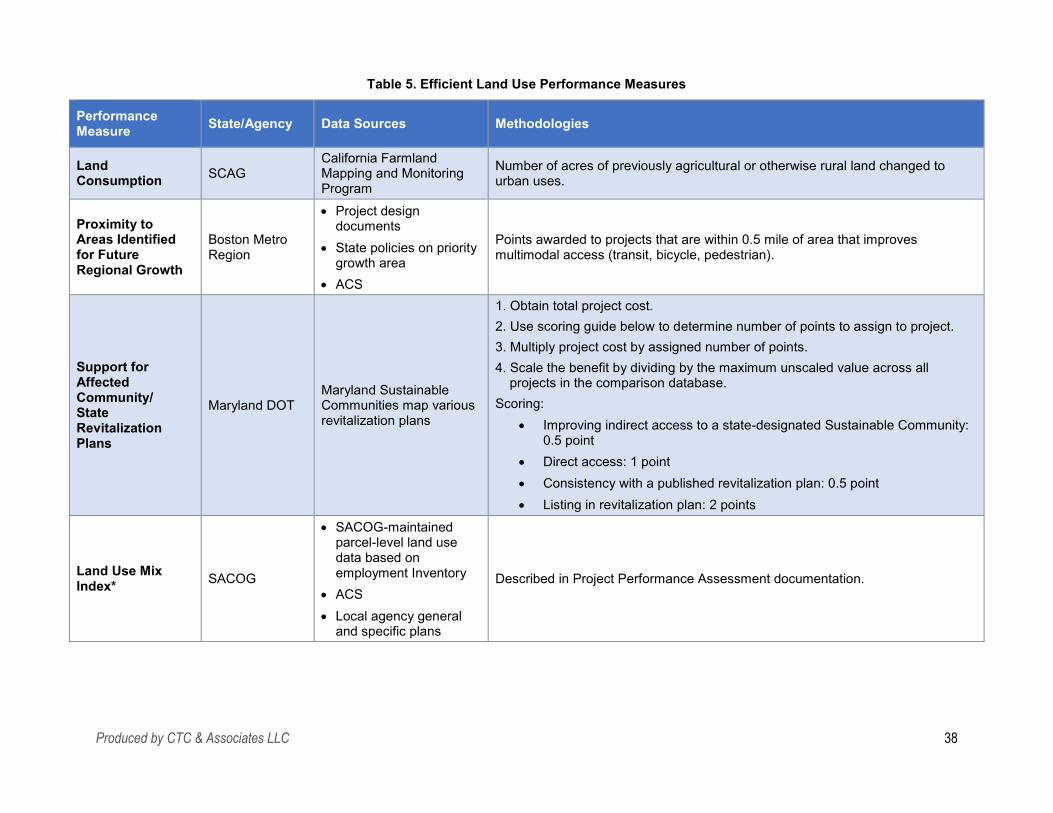
Table 5. Efficient Land Use Performance Measures
Performance Measure State/Agency Data Sources Methodologies
Land Consumption SCAG
California Farmland Mapping and Monitoring Program
Number of acres of previously agricultural or otherwise rural land changed to urban uses.
Proximity to Areas Identified for Future Regional Growth
Boston Metro Region
Project design documents
State policies on priority growth area
ACS
Points awarded to projects that are within 0.5 mile of area that improves multimodal access (transit, bicycle, pedestrian).
Support for Affected Community/ State Revitalization Plans
Maryland DOT Maryland Sustainable Communities map various revitalization plans
1. Obtain total project cost. 2. Use scoring guide below to determine number of points to assign to project. 3. Multiply project cost by assigned number of points. 4. Scale the benefit by dividing by the maximum unscaled value across all
projects in the comparison database. Scoring:
Improving indirect access to a state-designated Sustainable Community: 0.5 point
Direct access: 1 point Consistency with a published revitalization plan: 0.5 point Listing in revitalization plan: 2 points
Land Use Mix Index* SACOG
SACOG-maintained parcel-level land use data based on employment Inventory
ACS Local agency general
and specific plans
Described in Project Performance Assessment documentation.
Produced by CTC & Associates LLC 38
Performance Measure State/Agency Data Sources Methodologies
Priority Development Area (PDA) Investment Minimums Per County
MTC
ArcGIS for PDA boundary delineation
PDAs adopted by MTC and Association of Bay Area Governments (ABAG)
In the agency’s current STP/CMAQ program, larger counties must invest 70% of their funding targets into PDAs. The target for more rural/suburban counties is 50%.
To qualify, projects must be located within a PDA or provide or improve access to a PDA. Each county developed its own definition of how a project not within a PDA could qualify for providing or improving access.
Priority to Projects in High-Impact Areas
MTC
Regional housing needs allocations for number of housing units accepted by jurisdiction
Housing element annual progress reports submitted by jurisdictions to HCD for number of units built in a given year
Projects located in high-impact areas are given additional weighting in project prioritization (areas planning for future growth, delivering on building new housing, dense job centers in proximity to housing and transit).
Proximity of Land Amenable to Transit-Oriented Development
SBCTA Mapping of existing and planned land uses Map/GIS analysis
Access to Public Transit RCTC 1
SCAG data Project-level design studies
N/R
Access to Services by Walking or Short Drive
SACOG CUBE Access software Described in Project Performance Assessment documentation.
Active Transportation (Pedestrian/ Biking)
RCTC 1 SCAG data Project level design studies
N/R
Proximity to Existing Areas of High Population and Employment
Boston Metro Region
Project design documents State policies on priority
growth areas ACS
Points awarded to projects that are within 0.5 mile of area that improves multimodal access (transit, bicycle, pedestrian).
Produced by CTC & Associates LLC 39

Performance Measure State/Agency Data Sources Methodologies
Total Jobs and Housing Within 0.5 Mile of Project
SACOG
SACOG Employment Inventory
ACS Local agency general and
specific plans Parcel data
Described in Project Performance Assessment documentation.
Share of Regional Household Growth in HQTAs
SCAG ACS SCAG data
N/R
Share of Regional Employment Growth in HQTAs
SCAG ACS SCAG data
N/R
Amount of Housing Within X of Project Area Available to X More Expected Population in the Area by Year XXXX**
RCTC 2** N/R** N/R**
Dwelling Density RCTC 1 SCAG data Project-level design studies
N/R
Congestion RCTC 1 SCAG data Project-level design studies
N/R
Traffic Circulation RCTC 1 SCAG data Project-level design studies
N/R
HCD California Department of Housing and Community Development. N/R No response. * Land use mix index: Mix of houses and businesses accessible to residents through nondriving modes or by short (less than 1 mile) driving trips. ** Potential performance measure. RCTC does not currently use this practice.
Produced by CTC & Associates LLC 40

Environment Short-Term Assessment
Short-term environmental performance metrics included criteria air pollutant and GHG air quality impacts, projects that avoided impacts to sensitive natural areas and state resources, anticipated improvements to water quality and the project’s potential to reduce an urban heat island effect or increase tree canopy coverage. Noise impacts are also considered; for example, SBCTA measures the increase in noise based on Federal Highway Administration (FHWA) guidelines.
The SCCRTC respondent suggested asking for the results of the environmental review instead of developing new measures to assess performance. The RCTC 2 respondent suggested developing a metric that would measure a project’s potential benefit to an ecosystem such as a wetland or prairie. Data could be gathered from environmental documentation related to the project, and performance could be assessed qualitatively.
Table 6 summarizes survey responses.
Long-Term Goals and Objectives
Emissions reduction measures were most frequently cited by agencies responding to the survey. Advancing state environmental goals and natural resource preservation were also reported. As with short-term environmental assessment, the SCCRTC respondent suggested asking for the results of the environmental review instead of developing new measures to assess long-term environmental goals and objectives.
Table 7 summarizes survey responses.
Produced by CTC & Associates LLC 41
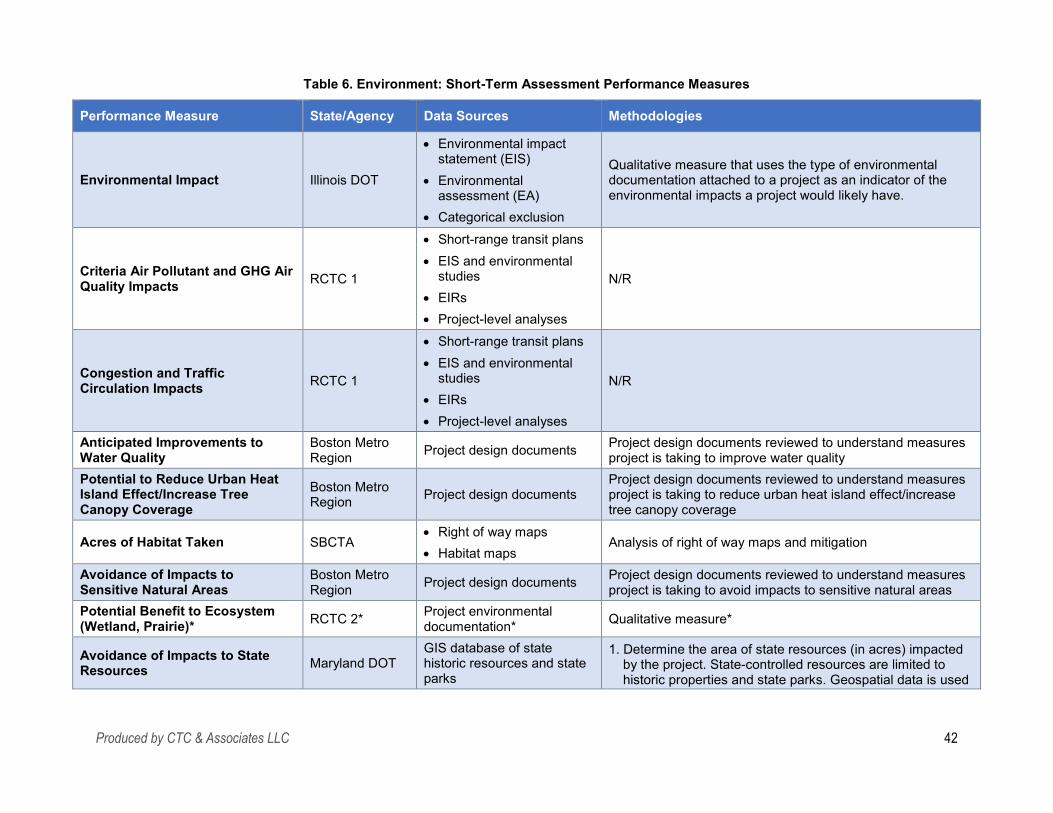
Table 6. Environment: Short-Term Assessment Performance Measures
Performance Measure State/Agency Data Sources Methodologies
Environmental Impact Illinois DOT
Environmental impact statement (EIS)
Environmental assessment (EA)
Categorical exclusion
Qualitative measure that uses the type of environmental documentation attached to a project as an indicator of the environmental impacts a project would likely have.
Criteria Air Pollutant and GHG Air Quality Impacts RCTC 1
Short-range transit plans EIS and environmental
studies EIRs Project-level analyses
N/R
Congestion and Traffic Circulation Impacts RCTC 1
Short-range transit plans EIS and environmental
studies EIRs Project-level analyses
N/R
Anticipated Improvements to Water Quality
Boston Metro Region Project design documents Project design documents reviewed to understand measures
project is taking to improve water quality Potential to Reduce Urban Heat Island Effect/Increase Tree Canopy Coverage
Boston Metro Region Project design documents
Project design documents reviewed to understand measures project is taking to reduce urban heat island effect/increase tree canopy coverage
Acres of Habitat Taken SBCTA Right of way maps Habitat maps
Analysis of right of way maps and mitigation
Avoidance of Impacts to Sensitive Natural Areas
Boston Metro Region Project design documents Project design documents reviewed to understand measures
project is taking to avoid impacts to sensitive natural areas Potential Benefit to Ecosystem (Wetland, Prairie)* RCTC 2* Project environmental
documentation* Qualitative measure*
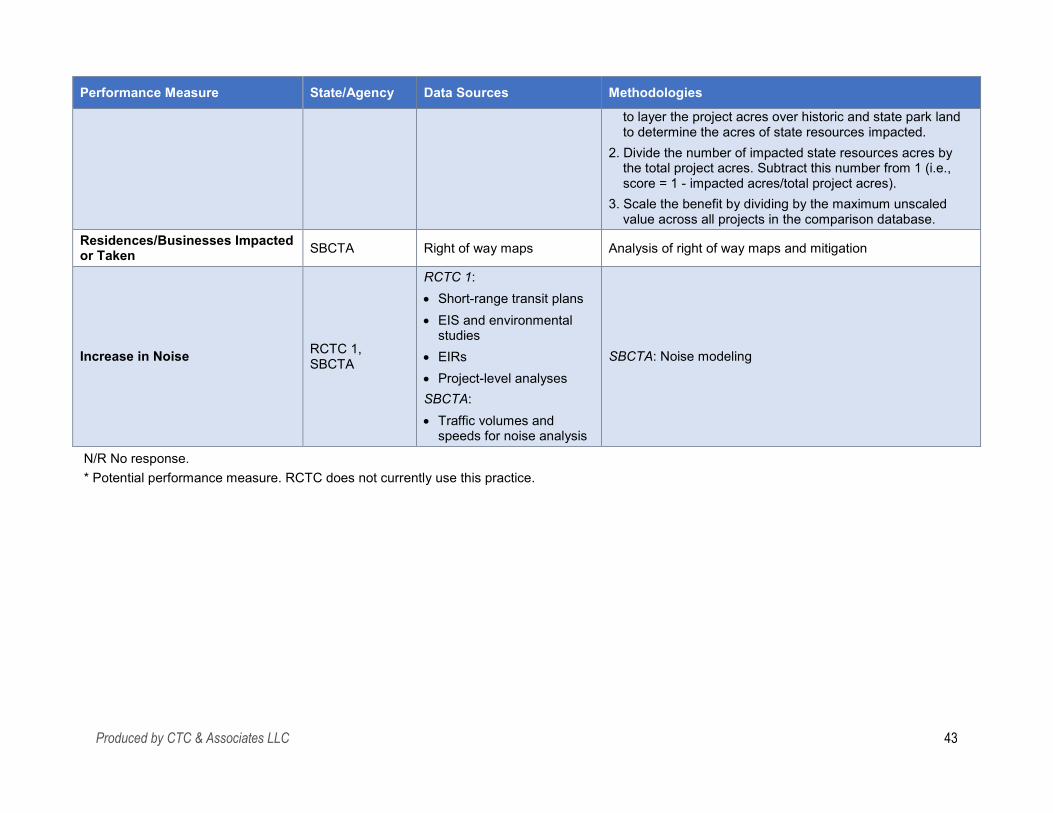
Avoidance of Impacts to State Resources Maryland DOT
GIS database of state historic resources and state parks
1. Determine the area of state resources (in acres) impacted by the project. State-controlled resources are limited to historic properties and state parks. Geospatial data is used
Produced by CTC & Associates LLC 42
Performance Measure State/Agency Data Sources Methodologies
to layer the project acres over historic and state park land to determine the acres of state resources impacted.
2. Divide the number of impacted state resources acres by the total project acres. Subtract this number from 1 (i.e., score = 1 - impacted acres/total project acres).
3. Scale the benefit by dividing by the maximum unscaled value across all projects in the comparison database.
Residences/Businesses Impacted or Taken SBCTA Right of way maps Analysis of right of way maps and mitigation
Increase in Noise RCTC 1, SBCTA
RCTC 1: Short-range transit plans EIS and environmental
studies EIRs Project-level analyses SBCTA: Traffic volumes and
speeds for noise analysis
SBCTA: Noise modeling
N/R No response. * Potential performance measure. RCTC does not currently use this practice.
Produced by CTC & Associates LLC 43
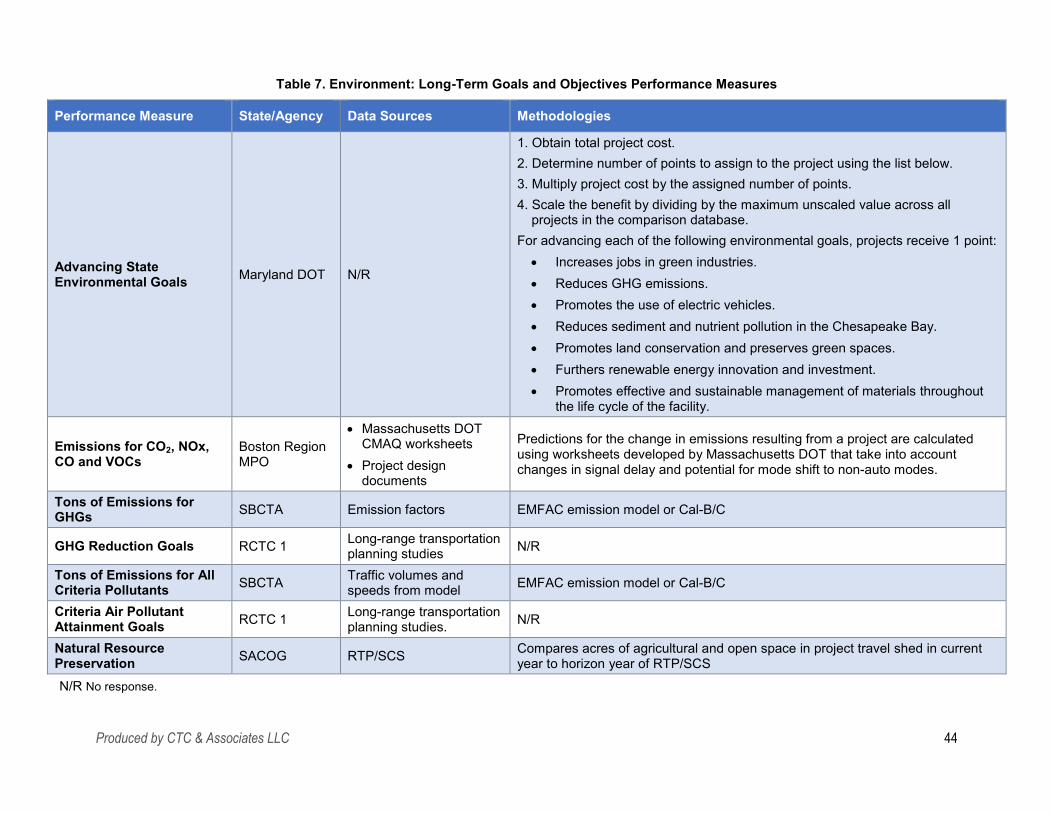
Table 7. Environment: Long-Term Goals and Objectives Performance Measures
Performance Measure State/Agency Data Sources Methodologies
Advancing State Environmental Goals Maryland DOT N/R
1. Obtain total project cost. 2. Determine number of points to assign to the project using the list below. 3. Multiply project cost by the assigned number of points. 4. Scale the benefit by dividing by the maximum unscaled value across all
projects in the comparison database. For advancing each of the following environmental goals, projects receive 1 point:
Increases jobs in green industries. Reduces GHG emissions. Promotes the use of electric vehicles. Reduces sediment and nutrient pollution in the Chesapeake Bay. Promotes land conservation and preserves green spaces. Furthers renewable energy innovation and investment. Promotes effective and sustainable management of materials throughout
the life cycle of the facility.
Emissions for CO2, NOx, CO and VOCs
Boston Region MPO
Massachusetts DOT CMAQ worksheets
Project design documents
Predictions for the change in emissions resulting from a project are calculated using worksheets developed by Massachusetts DOT that take into account changes in signal delay and potential for mode shift to non-auto modes.
Tons of Emissions for GHGs SBCTA Emission factors EMFAC emission model or Cal-B/C
GHG Reduction Goals RCTC 1 Long-range transportation planning studies N/R
Tons of Emissions for All Criteria Pollutants SBCTA Traffic volumes and
speeds from model EMFAC emission model or Cal-B/C
Criteria Air Pollutant Attainment Goals RCTC 1 Long-range transportation
planning studies. N/R
Natural Resource Preservation SACOG RTP/SCS Compares acres of agricultural and open space in project travel shed in current
year to horizon year of RTP/SCS N/R No response.
Produced by CTC & Associates LLC 44

Equity The primary focus of equity performance measures is on benefits to equity populations. Boston Region MPO, Mark Thomas (consultant), Minnesota DOT, MTC and SBCTA assess the extent to which projects deliver benefits to people of color, tribal communities, low-income people, people with disabilities, people with limited English proficiency, youth, older adults and other DACs. Other focus areas include environmental justice and access to affordable housing, jobs, schools and services.
Although LA County Metro did not provide a performance metric, the agency uses percentile scores from CalEnviroScreen, Healthy Places Index and SCAG communities of concern data. The RCTC 2 respondent suggested measuring whether the project provided access to higher-wage jobs to low-income, disadvantaged, rural or tribal communities in the project area or region. Data sources could include travel time savings from the project and household income from U.S. Census data.
Table 8 summarizes survey responses.
Produced by CTC & Associates LLC 45

Table 8. Equity Performance Measures
Performance Measure State/Agency Data Sources Methodologies
Benefits to Equity Populations
Boston Region MPO, Mark Thomas (consultant), Minnesota DOT, MTC, SBCTA
Boston Region MPO: U.S. Census ACS Minnesota DOT: Qualitative information from
applicants U.S. Census data Mark Thomas: CalEnviroScreen Median Household Income MTC: ArcGIS for community of concern boundaries SBCTA: DAC maps
Boston Region MPO: Layered approach to equity scoring: 1. Calculate the concentration of the six equity populations above within 0.5 mile of
the project, relative to regional averages. 2. Assign each project a point multiplier based on these relative concentrations. 3. Apply this multiplier to other base criteria scores (e.g., scores for improvements to
safety, transit access, air quality) that have been specifically identified as important to equity populations in the region through public outreach
Mark Thomas: SB 535 and Assembly Bill (AB) 1550 Minnesota DOT: Generally a qualitative assessment for bonus points MTC: STP/CMAQ projects located within or benefiting communities of concern are given additional weight in prioritizing projects. SBCTA: Map/GIS analysis
Environmental Justice (EJ)/Equity
Illinois DOT, SACOG
Illinois DOT: Shapefile of U.S. Census block group-level Community Survey Estimates for Minority and Low Income (obtained from Illinois EPA) SACOG: SACOG-maintained GIS file
of designated EJ areas within region
SACOG-maintained parcel-level land use data: o SACOG Employment
Inventory o ACS o Local agency general
and specific plans and parcel data
Illinois DOT: Qualitative measure that prioritizes projects in or adjacent to a predominately low income (≤64.8%) or minority (>74.8%). The minority and low-income thresholds were determined by doubling the statewide averages. The measure assumes that improvements to a roadway benefit the local community. SACOG: Same accessibility approach:
CUBE Access software calculates accessibility at a user-specified geography (e.g., accessibility to jobs from each block group, census tract or TAZ).
Project Performance Assessment obtains the project average accessibility (the average accessibility for an entire project based on the accessibility of the census blocks in the project).
Produced by CTC & Associates LLC 46

Performance Measure State/Agency Data Sources Methodologies
Total Population Within 0.5 Mile of Project Living Within Designated EJ Area*
SACOG
SACOG-maintained GIS file of designated EJ areas within region
SACOG-maintained parcel-level land use data based on: o SACOG Employment
Inventory o ACS o Local agency general
and specific plans and parcel
Described in Project Performance Assessment documentation.
Share of Population Within 0.5 Mile of Project Living Within EJ Area
SACOG
SACOG-maintained GIS file of designated EJ areas within region
SACOG-maintained parcel-level land use data based on: o SACOG Employment
Inventory o ACS o Local agency general
and specific plans and parcel
Described in Project Performance Assessment documentation.
Affordable Housing Preservation/ Creation Strategies
MTC
Survey of local jurisdictions’ housing staff to identify adopted strategies that support affordable housing
STP/CMAQ projects located within jurisdictions that have adopted policies to support affordable housing are given additional weight in prioritizing projects
Accessibility/ Increase in Accessibility to Jobs, Schools and Services
Maryland DOT, SACOG
Maryland DOT: MSTM Census employment data SACOG: Accessibility data from CUBE Access software
Maryland DOT: 1. Define study area based on change in travel time on links. 2. Model jobs access with no build.
a. Evaluate the number of jobs in each zone that can be accessed from that zone, using a decay function (jobs farther away valued less because people are less
Produced by CTC & Associates LLC 47

Performance Measure State/Agency Data Sources Methodologies
likely to access them). b. Multiply job access by zone by population. c. Aggregate across study area.
3. Repeat above with build data. 4. Difference between build and no build are results. Disadvantaged populations are defined as Census Block Groups with 50% or more of households having low incomes, defined as less or equal than twice the federal poverty level. SACOG: Same accessibility approach:
CUBE Access software calculates accessibility at a user-specified geography (e.g., accessibility to jobs from each block group, census tract or TAZ).
Project Performance Assessment obtains the project average accessibility (the average accessibility for an entire project based on the accessibility of the census blocks in the project).
Access to Higher-Wage Jobs for Low-Income, Disadvantaged, Rural or Tribal Communities**
RCTC 2** Travel time savings from project and household income (census)**
N/R**
% of Population Transportation Disadvantaged Within X Distance of Project
SCCRTC
County-defined transportation-disadvantaged U.S. Census tracts due to low income and minority
N/R
Transit Service Equity RCTC 1 N/R N/R
Fare Equity RCTC 1 N/R N/R ADA RCTC 1 N/R N/R Community Air Risk Evaluation (CARE) MTC ArcGIS for CARE boundaries STP/CMAQ projects located within or benefiting CARE communities are given
additional weight in prioritizing projects.
Produced by CTC & Associates LLC 48
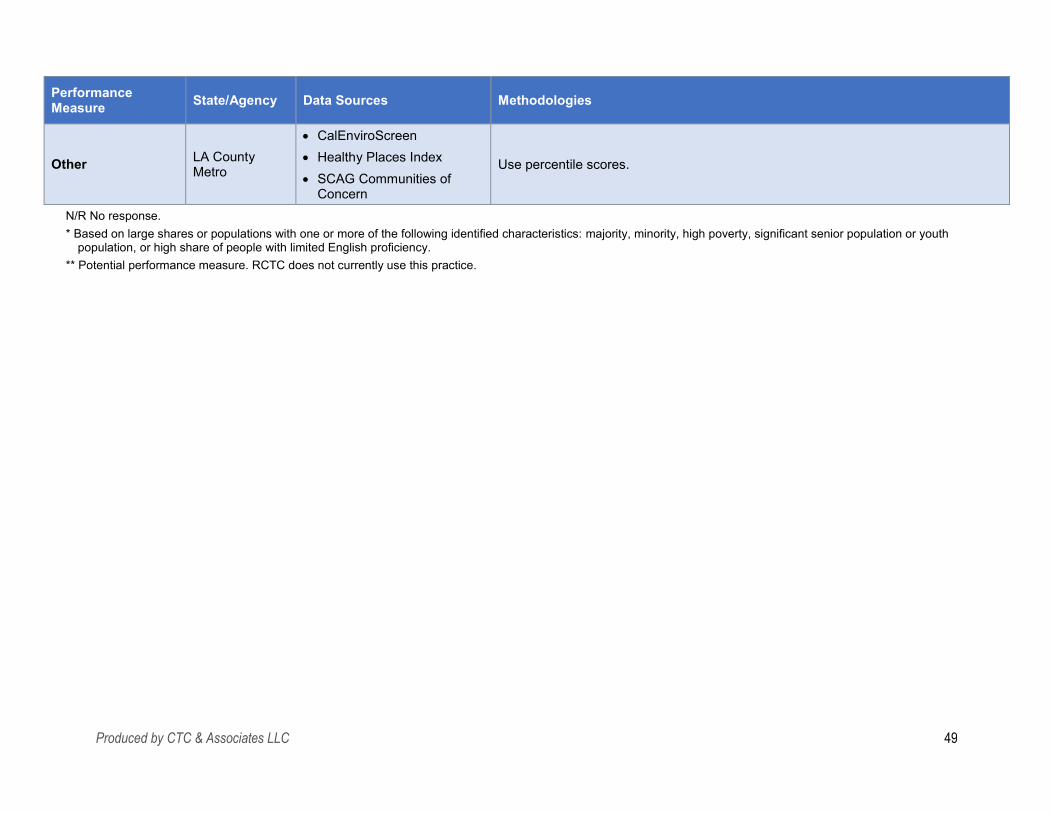
Performance Measure State/Agency Data Sources Methodologies
CalEnviroScreen Healthy Places Index SCAG Communities of
Concern
Other LA County Metro Use percentile scores.
N/R No response. * Based on large shares or populations with one or more of the following identified characteristics: majority, minority, high poverty, significant senior population or youth
population, or high share of people with limited English proficiency. ** Potential performance measure. RCTC does not currently use this practice.
Produced by CTC & Associates LLC 49
Innovation Three agencies provided information in the innovation category, primarily in the form of recommendations instead of metrics currently used. Details about data sources or methodologies were not provided. Below are suggestions from these agencies:
RCTC 2 suggested a metric focused specifically on climate change innovation that could be used in conjunction with climate metrics.
SBCTA recommended an overall commitment to innovative approaches. SCCRTC suggested a qualitative discussion explaining why the project is innovative.
Performance measures identified in other categories could be used.
Partnership Partnership performance measures include metrics that encourage participation and collaboration from the public and private sectors. In the Boston Region MPO, projects with more co-sponsors are expected to have a higher likelihood of long-term success. Other agencies encourage local agencies to prioritize projects to obtain local agency buy-in. The RCTC 2 respondent noted that a metric could be developed based on the amount of funding from both public and private partners.
Table 9 summarizes survey responses.
Produced by CTC & Associates LLC 50

Table 9. Partnership Performance Measures
Performance Measure State/Agency Data Sources Methodologies
Number of Project Collaborators
Boston Region MPO Project documents
This criterion is used specifically for projects funded through the agency’s first- and last-mile funding program, including new shuttle services, transit signal priority, bus lanes and transportation network company partnerships.
Projects receive points for having more collaborators in the public, private and nonprofit sectors.
Priority Ranking by County/Region/District Illinois DOT Illinois DOT district
information Districts rank projects based on their importance to the district.
Support of Local Governments' Transportation Priorities
Maryland DOT N/R
Within the Chapter 30 methodology, local priorities are determined at the county jurisdiction level.
Each county has 100 points to distribute across project applications. Counties can assign all points to one project application or distribute points across multiple projects.
Municipalities and counties should coordinate on applicable project priorities, and any municipality-requested projects should be submitted by the county as one of its project applications. To encourage coordination, any project with joint support from the county and municipality (based on letters of support accompanying the project application) receives an additional 30 local priority points in addition to the points allocated by the county.
Leveraging of Public Funding, Other Co-Funding, In-Kind Contributions, Other Project Co-Benefits
RCTC 1, RCTC 2*
RCTC 2: Funding allocations* N/R
Statement of Working Relationships for Project Implementation
SBCTA Cross-agency agreements N/R
Qualitative Discussion on Project Partnerships
SCCRTC N/R N/R
N/R No response. * Potential performance measure. RCTC does not currently use this practice
Produced by CTC & Associates LLC 51
Quality of Life and Public Health Several agencies use air quality impacts as a measure of quality of life. Metrics in Boston Region MPO include NOx reductions in parts of the region with existing high concentrations. Regional NOx concentration data is obtained from the Metropolitan Area Planning Council (MAPC), the regional planning agency serving the Boston area. SANDAG evaluates air quality based on PM 2.5, PM 10, CO2, VOC, SOX, CO and NOX. SCCRTC assesses six standard criteria plus GHG.
Additional measures assess acres of parks per 1,000 residents; the percentage of residents living within a 0.5-mile walk to parks or open space; and enhancements to community assets, such as schools and community centers.
Table 10 summarizes survey responses.
Produced by CTC & Associates LLC 52

Table 10. Quality of Life and Public Health Performance Measures
Performance Measure State/Agency Data Sources Methodologies
Air Quality Impacts RCTC 1, SANDAG*, SCCRTC**
RCTC 1: Congestion management and traffic engineering studies SANDAG: For TCEP cycle 2: o Otay Mesa East Level II
traffic and revenue Model (vehicle wait time simulation)
o Cal-B/C emission rates o Grams to short ton
conversion For TCEP cycle 1: Previous
traffic studies SCCRTC: EMFAC or Cal-B/C
SANDAG: For TCEP cycle 2: Using Cal-B/C, calculate based on: o Reduced delay at border o Emission rates from idling vehicles (2025-2044)
For TCEP cycle 1: Use Cal-B/C. SCCRTC: Use EMFAC or Cal-B/C.
NOx Reductions in High-Concentration Areas
Boston Region MPO
Regional NOx concentrations from MAPC
Projects are awarded points for reducing NOx emissions in high-concentration areas (relative to regional concentrations).
Traffic Congestion and Circulation Impacts RCTC 1 Congestion management and
traffic engineering studies N/R
Concentration of Affordable Housing
Boston Region MPO
Massachusetts Executive Office of Housing and Economic Development
Projects are awarded points for making multimodal improvements within 0.5 mile of higher concentrations of affordable housing options (relative to regional concentrations).
Percent of Residents Within 0.5-Mile Walk to Parks and Open Space
SCAG SCAG data Share of regional population living within walking distance to open space.
Acres of Parks Per 1,000 Residents SCAG SCAG data Acres of parks (including local, regional and beach parks) for every 1,000
residents. Projects That Improve Walking/Bicycling/ Transit
Minnesota DOT Applicant information (qualitative) N/R
Produced by CTC & Associates LLC 53

Performance Measure State/Agency Data Sources Methodologies
Enhancements to Community Assets Maryland DOT N/R
1. Obtain the total project cost. 2. Determine the points to assign to the project using the list below. 3. Multiply the project cost by the assigned points. 4. Scale the benefit by dividing by the maximum unscaled value across all
projects in the comparison database. Points awarded based on the number of community assets accessed through the proposed project. Multiples of the same community asset can apply (i.e., two schools):
Public and private grade schools: 1 Accredited higher education facilities: 1 Military base/government facility: 1 Community center: 1 Parks and community recreation facilities: 1 Hospitals: 1 State-designated sustainable communities: 1
Health Effects Impacts RCTC 1 Health effects studies N/R General Statements of Benefit SBCTA N/R N/R
N/R No response. * Air quality: PM 2.5, PM 10, CO2, VOC, SOX, CO, NOX. ** Air quality: Six standard criteria plus GHG.
Produced by CTC & Associates LLC 54
Reliability (Freight and Nonfreight) Freight
Truck travel time reliability and freight travel time reliability performance measures are commonly used among responding agencies to assess freight reliability. Illinois DOT prioritizes projects on routes on the National Highway Freight Network (NHFN). SCCRTC uses 80% reliability, however, the respondent added that it is “very hard to forecast based on project improvements.” Additional measures include VHT time reduction and vehicle hours of buffer time. The RCTC 2 respondent noted that the CTC-required metrics of truck travel time reliability index and VHT time reduction are sufficient to measure this outcome.
Table 11 summarizes survey responses.
Nonfreight
Travel time reliability was also frequently cited as a measure of nonfreight reliability. Boston Region MPO uses a level of travel time reliability based on RITIS data, which is obtained from the Center for Advanced Transportation Technology Lab at the University of Maryland. SACOG’s travel time reliability ratio is based on the MAP-21 (Moving Ahead for Progress in the 21st Century Act ) level of travel time reliability definition of reliability measurement as 80th percentile travel time divided by 50th percentile travel time. The RCTC 2 respondent noted that the CTC-required metrics of peak period travel time reliability index and VHT time reduction are sufficient to measure this outcome.
Table 12 summarizes survey responses.
Produced by CTC & Associates LLC 55

Table 11. Freight Reliability Performance Measures
Performance Measure State/Agency Data Sources Methodologies
Truck Travel Time Reliability RCTC 2, SCAG SCAG: Caltrans PeMS
RCTC 2: CTC metrics. SCAG: Day-to-day variation in travel times experienced by trucks along a specified roadway
Freight Travel Time Reliability Minnesota DOT Same as federal performance
measure Same as federal performance measure.
Peak Period Travel Time Reliability SBCTA
Existing data: Probe-based data (ClearGuide)
Forecasting data: Increment in speed calculated by Cal-B/C
Speeds estimated for peak and off-peak periods. Off-peak speed is divided by peak speed for freight.
80% Travel Time Reliability SCCRTC
Existing data: PeMS Forecasting data: Unknown
N/R
Priority to Projects on NHFN Routes Illinois DOT Illinois DOT GIS data Qualitative measure
Daily Vehicle Hours of Travel Time Reduction SANDAG
TCEP cycle 2: o Otay Mesa East Level II Traffic
and Revenue model (vehicle wait time simulation)
o Average vehicle occupancy o Hourly wait times o Hourly volumes o Reliability ratio o Average vehicle occupancy.
TCEP cycle 1: Previous traffic studies.
TCEP cycle 2: Using Cal-B/C. Average daily vehicle hours of delay at the border (2025-2044).
TCEP cycle 1: Using Cal-B/C.
Vehicle Hours of Travel Time Reduction RCTC 2 N/R CTC metrics
Produced by CTC & Associates LLC 56
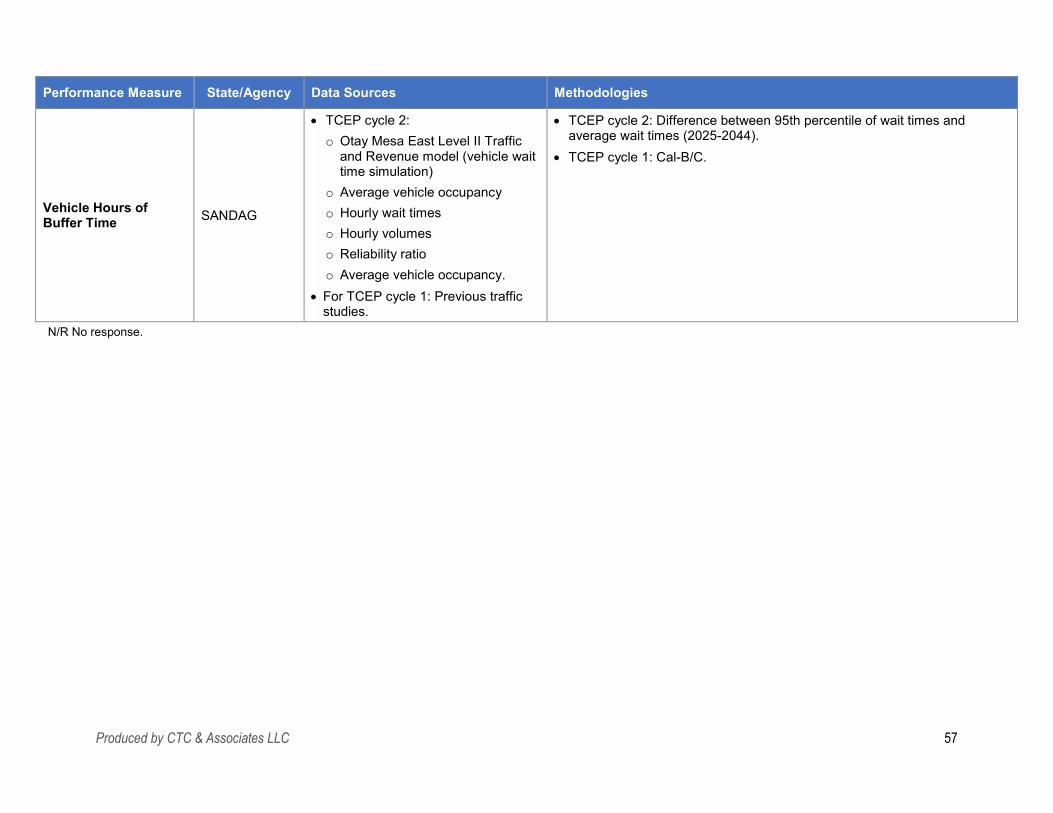
Performance Measure State/Agency Data Sources Methodologies
Vehicle Hours of Buffer Time SANDAG
TCEP cycle 2: o Otay Mesa East Level II Traffic
and Revenue model (vehicle wait time simulation)
o Average vehicle occupancy o Hourly wait times o Hourly volumes o Reliability ratio o Average vehicle occupancy.
For TCEP cycle 1: Previous traffic studies.
TCEP cycle 2: Difference between 95th percentile of wait times and average wait times (2025-2044).
TCEP cycle 1: Cal-B/C.
N/R No response.
Produced by CTC & Associates LLC 57

Table 12. Nonfreight Reliability Performance Measures
Performance Measure State/Agency Data Sources Methodologies
Travel Time Reliability
Boston Region MPO, RCTC 2 Boston Region MPO: RITIS
Boston Region MPO: 80th percentile travel times are compared to 50th percentile travel times for a corridor. Projects with ratios of greater than 1.25 are awarded points for addressing an unreliable corridor by making multimodal improvements. RCTC 2: CTC metrics.
Travel Time Reliability Ratio Based on MAP-21 Level of Travel Time Reliability
SACOG NPMRDS Follows MAP-21 level of travel time reliability metric.
80% Travel Time Reliability SCCRTC
Existing data: PeMS Forecasting data: Unknown
N/R
Automobile Travel Time Reliability SCAG Caltrans PeMS Day-to-day variation in travel times experienced by automobile travelers
along a specified roadway.
Peak Period Travel Time Reliability SBCTA
Existing data: Probe-based data (ClearGuide)
Forecasting data: Increment in speed calculated by Cal-B/C
Speeds estimated for peak and off-peak periods. Off-peak speed is divided by peak speed for freight.
Percent On-Time Performance for Transit
SBCTA Schedule adherence data N/R
Positive Impact on Travel Time Maryland DOT MSTM
Highway Projects 1. Identify zones that comprise the study area for each project. 2. Use the MSTM multi-resolution framework to assign traffic at the
higher-resolution (Level 2) zone structure. 3. Combine VHT for each time of day to develop daily VHT under free-
flow conditions. 4. Combine VHT for each time of day to develop daily VHT under
congested conditions. 5. Subtract congested VHT from free-flow VHT to calculate VHD.
Produced by CTC & Associates LLC 58

Performance Measure State/Agency Data Sources Methodologies
6. Annualize daily VHT and divide by 1000 to report in thousands. Transit Projects
1. Obtain the number of daily new transit passengers. 2. Calculate the travel time savings for transit users through the Multi-
Modal Accessibility tool: a. Compute a comparison of the matrix of zone-to-zone transit travel
time savings against the highway trip table from the MSTM to compute a weighted average of travel time savings multiplied by transit ridership and annualized.
3. Compute travel time savings for highway users as a result of the transit project. a. Multiply daily new transit passengers by travel time savings for
new transit passenger (constant value expressed in minutes/trip). b. Convert from daily to annual travel time savings. This value
represents the annual minutes of travel time saved by new transit passengers produced by the project.
c. Divide by 60 to convert minutes of travel time savings to hours of travel time savings. Then divide by 1000 to convert value to align with the thousands of hours scale.
4. Add the values for annual travel time savings for highway and transit users.
5. Scale the benefit by dividing by the maximum unscaled value across all projects in the comparison database.
N/R No response.
Produced by CTC & Associates LLC 59

Safety A range of performance measures were reported in the safety category, most related to crash rates, the number of fatalities and the number of serious injuries. Additional metrics were reported for reduction in crashes, fatalities and severe injuries; bicycle and pedestrian incidents; presence of bicycle/pedestrian facilities; pavement condition; property damage; and impact on the implementation of Complete Street policies. The RCTC 2 respondent noted that the CTC-required metrics related to safety are sufficient to measure this outcome.
Table 13 summarizes survey responses.
Supporting Documents
Ohio Program Resource Guide: Fiscal Year 2020, Ohio Department of Transportation, 2019. https://www.transportation.ohio.gov/wps/portal/gov/odot/working/publications/program-resource-guide Many of the agency’s programs and high-level metrics are listed in this guide, including the agency’s County Highway Safety Program (page 9 of the report; page 11 of the PDF).
TRAC Policy and Procedures, Transportation Review Advisory Council (TRAC), May 2015. https://www.transportation.ohio.gov/static/Programs/TRAC/TRAC-policy.pdf This resource provides detailed explanations of project scoring in Ohio DOT’s TRAC program. A discussion of scoring criteria and methodology begins on page 8 of the guide, including transportation and economic performance factors such as public transit (page 12), intermodal freight (beginning on page 14) and air quality (page 17).
Produced by CTC & Associates LLC 60

Table 13. Safety Performance Measures
Performance Measure State/Agency Data Sources Methodologies
Crash Rates
Boston Region MPO, Minnesota DOT, Ohio DOT
Boston Region MPO: Massachusetts Registry
of Motor Vehicles Project design
documents
Boston Region MPO: Intersection projects: Calculated per million entering vehicles. Corridor projects: Calculated per million VMT. Ohio DOT: See Supporting Documents.
Collision Rates by Severity and Mode SCAG
Traffic Accident Surveillance and Analysis System (TASAS)
Collision and fatality rates per 100 million vehicle miles by mode (all, bicycle/pedestrian)
Number of fatalities and serious injuries by mode
Share of Fatal Collisions on Project Segment SACOG
Traffic Injury Mapping System (TIMS)
Project Performance Assessment tool user’s estimate of traffic volume on project
Geospatial tool
Number of Fatal and Serious Injury Crashes Minnesota DOT N/R N/R
Total Injury/Fatality Collisions on Project Segment
SACOG
TIMS Project Performance
Assessment tool user’s estimate of traffic volume on project
Geospatial tool
Injury/Fatality Collision Rate Per 100 Million VMT on Project Segment
SACOG
TIMS Project Performance
Assessment tool user’s estimate of traffic volume on project
Geospatial tool
Number and Rate of Fatal Collisions SCCRTC
Statewide Integrated Traffic Records System (SWITRS)
TIMS
N/R
Produced by CTC & Associates LLC 61
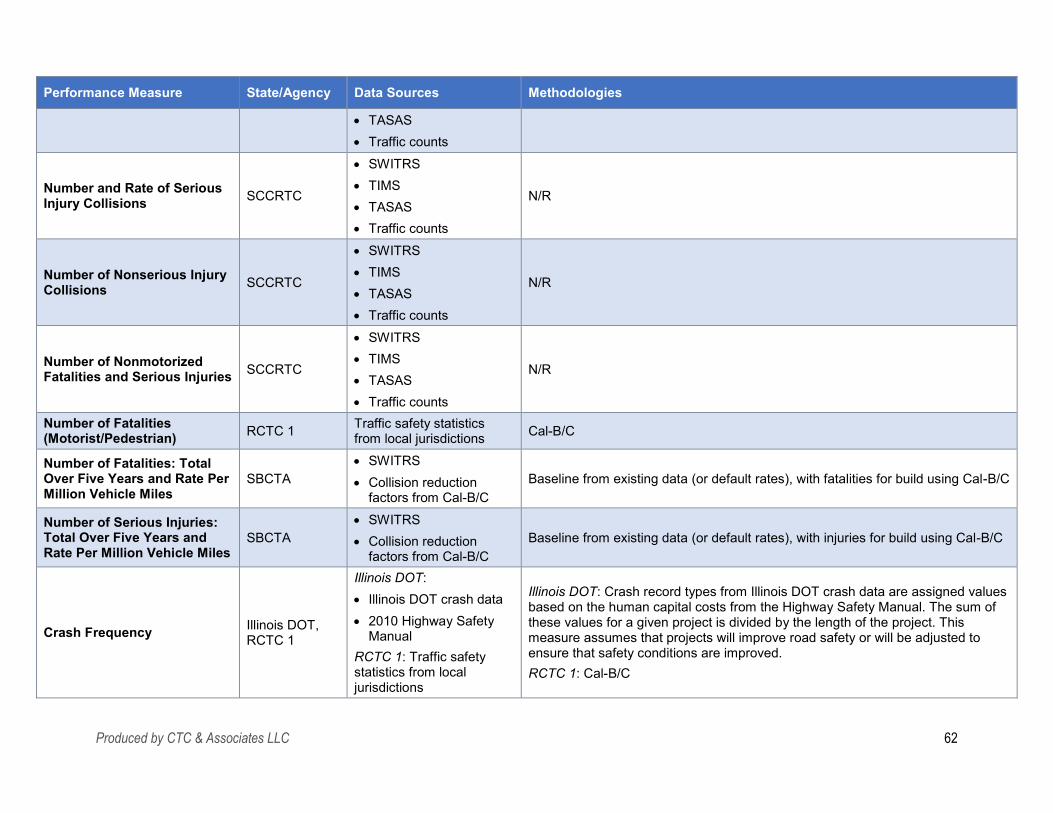
Performance Measure State/Agency Data Sources Methodologies
TASAS Traffic counts
Number and Rate of Serious Injury Collisions SCCRTC
SWITRS TIMS TASAS Traffic counts
N/R
Number of Nonserious Injury Collisions SCCRTC
SWITRS TIMS TASAS Traffic counts
N/R
Number of Nonmotorized Fatalities and Serious Injuries SCCRTC
SWITRS TIMS TASAS Traffic counts
N/R
Number of Fatalities (Motorist/Pedestrian) RCTC 1 Traffic safety statistics
from local jurisdictions Cal-B/C
Number of Fatalities: Total Over Five Years and Rate Per Million Vehicle Miles
SBCTA SWITRS Collision reduction
factors from Cal-B/C Baseline from existing data (or default rates), with fatalities for build using Cal-B/C
Number of Serious Injuries: Total Over Five Years and Rate Per Million Vehicle Miles
SBCTA SWITRS Collision reduction
factors from Cal-B/C Baseline from existing data (or default rates), with injuries for build using Cal-B/C
Crash Frequency Illinois DOT, RCTC 1
Illinois DOT: Illinois DOT crash data 2010 Highway Safety
Manual RCTC 1: Traffic safety statistics from local jurisdictions
Illinois DOT: Crash record types from Illinois DOT crash data are assigned values based on the human capital costs from the Highway Safety Manual. The sum of these values for a given project is divided by the length of the project. This measure assumes that projects will improve road safety or will be adjusted to ensure that safety conditions are improved. RCTC 1: Cal-B/C
Produced by CTC & Associates LLC 62

Performance Measure State/Agency Data Sources Methodologies
Crash Reduction Minnesota DOT N/R N/R
Expected Reduction in Total Fatalities/Severe Injuries in All Modes Affected by Project
Maryland DOT
Maryland DOT: Maryland State Highway Administration (SHA) Road Severity Index
1. Obtain SHA Road Severity Index value for the project. 2. Determine the number of safety improvements included in the proposed project
using the list below. Only consider improvements designed to reduce fatalities and/or severe injuries.
3. Multiply the Road Severity Index value by the number of safety improvements. 4. If the project is expected to produce new transit passengers, calculate the
additional safety benefit related to new transit ridership. Multiply the number of daily new transit passengers by the transit safety improvement factor (0.625).
5. Add the benefit calculated in Step 3 to the benefit calculated in Step 4 to obtain the unscaled benefit.
6. Scale the benefit by dividing by the maximum unscaled value across all projects in the comparison database.
Safety Improvements Scoring: Widen shoulders: 1 Add turn lanes: 1 Install rumble strips: 1 Improve road alignment: 1 Install guardrail, median and/or buffers: 1 Install lighting: 1 Construct pedestrian facilities: 1 Construct cyclist facilities: 1
Bicyclist and Pedestrian Crashes
LA County Metro TIMS Weighted by population and taken by percentile.
Share of Injury or Fatality Collisions That Involve a Cyclist or Pedestrian
SACOG
TIMS Project Performance
Assessment tool user’s estimate of traffic volume on project
Geospatial tool
Number of Pedestrian Incidents RCTC 1 Traffic safety statistics
from local jurisdictions Cal-B/C
Separate Statistic for Bicyclists/Pedestrians SBCTA
SWITRS Collision reduction
factors from Cal-B/C
Baseline from existing data (or default rates), with fatalities/injuries for build using Cal-B/C
Produced by CTC & Associates LLC 63

Performance Measure State/Agency Data Sources Methodologies
Presence of Bicycle/ Pedestrian Facilities
Boston Region MPO N/R N/R
Coverage/Locations of Crash Clusters
Boston Region MPO, Minnesota DOT
Boston Region MPO: Massachusetts Registry
of Motor Vehicles Project design
documents
N/R
State Highway System Pavement Condition SCAG Caltrans Pavement
Management System N/R
Local Roads Pavement Condition SCAG Local Arterial Survey
Database N/R
Equivalent Property Damage Only
Boston Region MPO, Ohio DOT
Boston Region MPO: Massachusetts Registry
of Motor Vehicles Project design
documents
Boston Region MPO: Calculated using: Property damage crashes: 1 point Injury/fatality crashes: 21 points
Ohio DOT: See Supporting Documents.
Number of Property Damage Only Collisions SCCRTC
SWITRS TIMS TASAS Traffic counts
N/R
Implementation of Complete Streets Policies Maryland DOT Maryland DOT: Maryland
SHA Road Severity Index
1. Obtain the total land area of the project in acres. 2. Determine if the project is in a short-trip opportunity area or has had any
bicycle/pedestrian safety incidents reported in the last five years. 3. Determine the number of points to attribute to the project using the list below. 4. Multiply the total project acres by the project points. 5. Scale the benefit by dividing by the maximum unscaled value across all
projects in the comparison database. Scoring: The project:
Manages speed and volume of traffic by narrowing/removing through traffic
Produced by CTC & Associates LLC 64

Performance Measure State/Agency Data Sources Methodologies
lanes or by adding bump-outs, pedestrian refuge islands and medians: 1 Improves accessibility and safety for transit riders, cyclists and pedestrians
by using appropriate design elements such as surface treatments, curbs, striping, lighting and landscaping: 1
Connects two separate bicycle/pedestrian facilities: 1 Constructs or replaces bicycle/pedestrian facilities: 1 Is in a local bicycle and pedestrian plan: 1
Other RCTC 2 N/R CTC metrics N/R No response.
Produced by CTC & Associates LLC 65
Throughput (Freight) Truck volume performance measures included daily and peak period volume, percent of traffic volume that is trucks and change in annual truck volume as a result of the project. Additional measures assess the project’s alignment with a state freight plan and share of jobs near projects in industrial sectors, which indicates the volume of freight traffic that will travel on the project segment.
Table 14 summarizes survey results.
Supporting Document
Maryland 2017 Maryland Strategic Goods Movement Plan, Maryland Department of Transportation, 2017. https://www.mdot.maryland.gov/OPCP/Strategic_Goods_Movement_Plan_2017.pdf From the plan purpose:
This Strategic Goods Movement Plan examines existing conditions and long-range projections, and establishes policy positions, strategies, and identifies freight projects over the next five years to improve freight movement efficiency and safety. Maryland’s multimodal transportation system for goods movement provides a critical support structure for the economic vitality of the [s]tate and surrounding region.
Section 5 addresses tracking performance (page 56 of the report, page 67 of the PDF).
Produced by CTC & Associates LLC 66
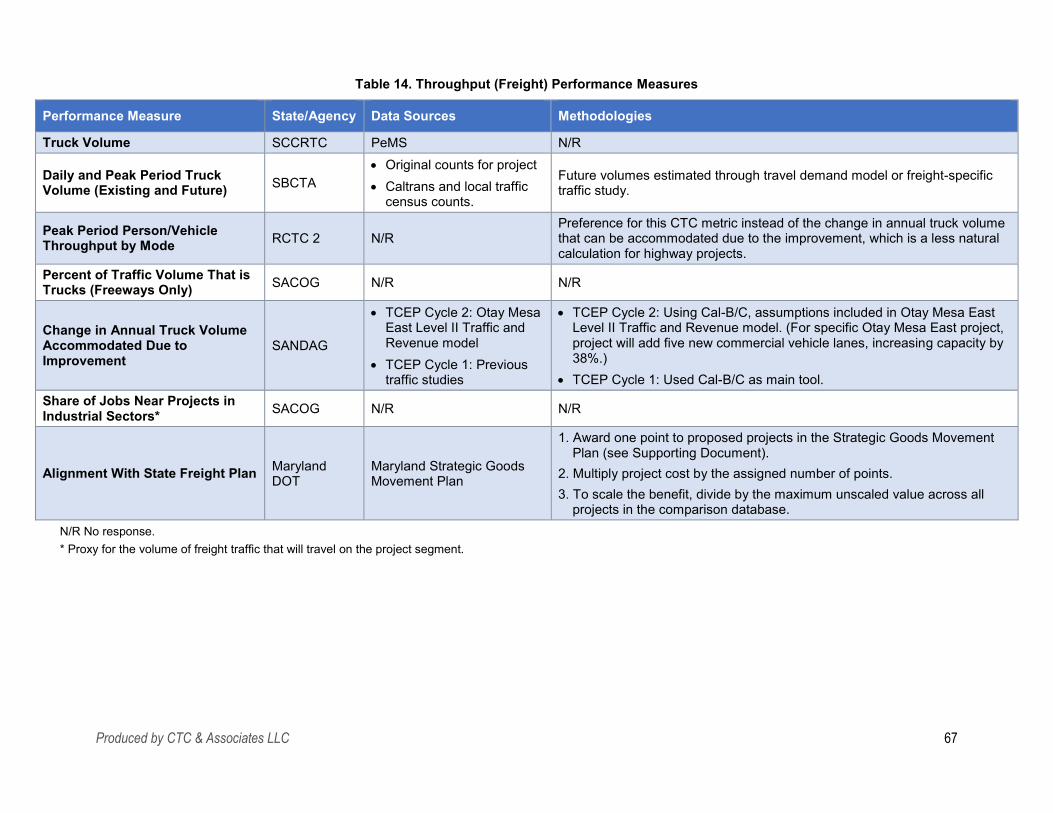
Table 14. Throughput (Freight) Performance Measures
Performance Measure State/Agency Data Sources Methodologies
Truck Volume SCCRTC PeMS N/R
Daily and Peak Period Truck Volume (Existing and Future) SBCTA
Original counts for project Caltrans and local traffic
census counts.
Future volumes estimated through travel demand model or freight-specific traffic study.
Peak Period Person/Vehicle Throughput by Mode RCTC 2 N/R
Preference for this CTC metric instead of the change in annual truck volume that can be accommodated due to the improvement, which is a less natural calculation for highway projects.
Percent of Traffic Volume That is Trucks (Freeways Only) SACOG N/R N/R
Change in Annual Truck Volume Accommodated Due to Improvement
SANDAG
TCEP Cycle 2: Otay Mesa East Level II Traffic and Revenue model
TCEP Cycle 1: Previous traffic studies
TCEP Cycle 2: Using Cal-B/C, assumptions included in Otay Mesa East Level II Traffic and Revenue model. (For specific Otay Mesa East project, project will add five new commercial vehicle lanes, increasing capacity by 38%.)
TCEP Cycle 1: Used Cal-B/C as main tool. Share of Jobs Near Projects in Industrial Sectors* SACOG N/R N/R
Alignment With State Freight Plan Maryland DOT
Maryland Strategic Goods Movement Plan
1. Award one point to proposed projects in the Strategic Goods Movement Plan (see Supporting Document).
2. Multiply project cost by the assigned number of points. 3. To scale the benefit, divide by the maximum unscaled value across all
projects in the comparison database. N/R No response. * Proxy for the volume of freight traffic that will travel on the project segment.
Produced by CTC & Associates LLC 67

Velocity (Freight) Respondents from three agencies—RCTC 2, SANDAG and SBCTA—provided performance measures in the velocity (freight) category. SANDAG uses travel time or total cargo transport time, including dwell time in a logistics facility such as a port or railyard if applicable to the project. SBCTA uses peak and off-peak period speeds for all traffic, with the understanding that trucks travel with all traffic under congested conditions and at the speed limit for uncongested conditions. The agency anticipates that the improvement will not increase speeds for trucks as much as it will for automobiles. The RCTC 2 respondent noted that the CTC metrics of travel time per trip and change in average peak speed are sufficient to measure this outcome.
Table 15 summarizes survey responses.
Table 15. Velocity (Freight) Performance Measures
Performance Measure State/Agency Data Sources Methodologies
Peak and Off-Peak Period Speed
RCTC 2, SBCTA
RCTC 2: CTC metrics of travel time per trip and change in average peak speed are sufficient to measure this outcome. SBCTA: Speeds are for all traffic. Trucks assumed to travel with all traffic under congested conditions. Trucks assumed generally at speed limit for uncongested conditions. (An improvement will not increase speeds for trucks as much as it will for automobiles.)
SBCTA: 1. Existing speeds based on
probe-based data analyzed with ClearGuide (Iteris)
2. Future speeds based on increment of model-based speeds or Cal-B/C-generated speeds
Travel Time or Total Cargo Transport Time*
RCTC 2, SANDAG
SANDAG: TCEP cycle 2: o Otay Mesa East Level II
Traffic and Revenue model (vehicle wait time simulation)
o Average vehicle occupancy
TCEP cycle 1: Previous traffic studies
SANDAG: TCEP cycle 2: o Cal-B/C o Total annual vehicle hours of delay at the
border (2025-2044) TCEP cycle 1: Cal-B/C
* Including dwell time in logistics facility (such as a port or railyard).
Additional Performance Measures Several respondents provided information about performance measures in other categories, including economic development, social benefit–cost ratios, resiliency and system preservation/asset management. The SBCTA respondent noted that metrics and methodologies vary across state agencies. CARB has a separate GHG reduction calculator for Transit and Intercity Rail Capital Program (TIRCP) projects, especially for transit projects. Cal-B/C is a very important analytical tool, but may not yield the same result.
Table 16 presents the additional categories and performance measures.
Produced by CTC & Associates LLC 68
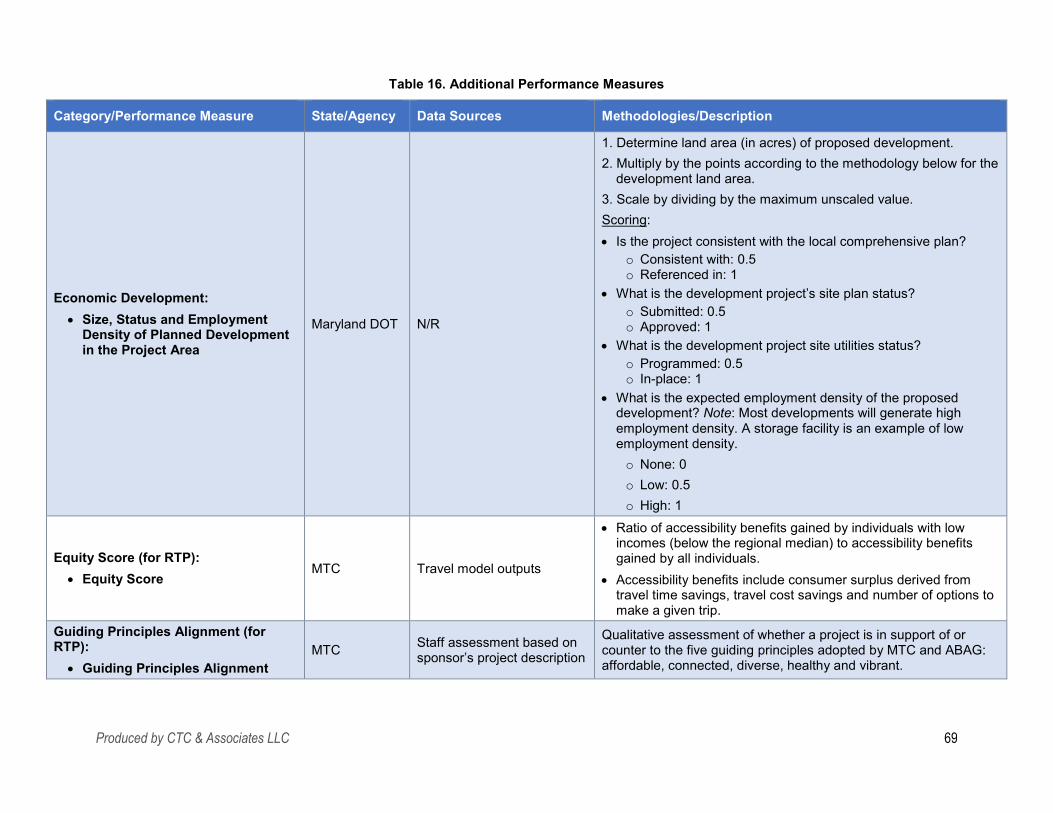
Table 16. Additional Performance Measures
Category/Performance Measure State/Agency Data Sources Methodologies/Description
Economic Development: Size, Status and Employment
Density of Planned Development in the Project Area
Maryland DOT N/R
1. Determine land area (in acres) of proposed development. 2. Multiply by the points according to the methodology below for the
development land area. 3. Scale by dividing by the maximum unscaled value. Scoring: Is the project consistent with the local comprehensive plan?
o Consistent with: 0.5 o Referenced in: 1
What is the development project’s site plan status? o Submitted: 0.5 o Approved: 1
What is the development project site utilities status? o Programmed: 0.5 o In-place: 1
What is the expected employment density of the proposed development? Note: Most developments will generate high employment density. A storage facility is an example of low employment density. o None: 0 o Low: 0.5 o High: 1
Equity Score (for RTP): Equity Score
MTC Travel model outputs
Ratio of accessibility benefits gained by individuals with low incomes (below the regional median) to accessibility benefits gained by all individuals.
Accessibility benefits include consumer surplus derived from travel time savings, travel cost savings and number of options to make a given trip.
Guiding Principles Alignment (for RTP):
Guiding Principles Alignment MTC Staff assessment based on
sponsor’s project description
Qualitative assessment of whether a project is in support of or counter to the five guiding principles adopted by MTC and ABAG: affordable, connected, diverse, healthy and vibrant.
Produced by CTC & Associates LLC 69

Category/Performance Measure State/Agency Data Sources Methodologies/Description
Resiliency: Project’s Ability to Improve
Connections to Critical Community Facilities in Emergencies
Boston Region MPO Project design documents
Award points to projects that improve multimodal access to schools, police/fire stations, hospitals, permanent and emergency shelters, community centers, food banks and churches.
Societal Benefit–Cost Ratios (for RTP):
Societal Benefit–Cost Ratios MTC
Travel model outputs and costs from project sponsors audited by independent cost consultant
Calculated as benefits divided by costs (each calculated over 80-year period, discounted): 1. Benefits include:
Accessibility benefits (such as consumer surplus derived from travel time savings, travel cost savings and number of options to make a given trip)
Freeway reliability Transit crowding reduction Environmental (including emissions and natural land
gained/lost) Health (including physical activity, air pollution and noise) Safety (including fatalities and serious injuries)
2. Costs include: Capital costs (including initial investment, rehabilitation/
replacement costs and a credit for residual value that remains after the plan period)
Annual operation and maintenance costs
System Preservation: Increased Life Span of the
Affected Facility Increased Functionality of the
Facility
Maryland DOT
Maryland pavement measure (to determine pavement area in fair and poor condition)
Maryland bridge measure (to determine pavement area in fair and poor condition)
Maryland rail and facility Transit Economic
Facility Life Span: 1. Select the first asset type. Assets can be selected if the project
includes system preservation activities for that particular asset. 2. Determine the amount of the asset in fair and poor condition.
a. For highways, use Maryland DOT SHA’s pavement and bridge measure to quantify pavement and bridge area in fair and poor condition.
b. For transit assets, use condition data collected based on Federal Transit Administration’s TERM 5-point scale.
Produced by CTC & Associates LLC 70

Category/Performance Measure State/Agency Data Sources Methodologies/Description
Requirements Model (TERM) condition score
3. Multiply the asset quantity in fair condition by the adjustment factor for fair condition.
4. Multiply the asset quantity in poor condition by the adjustment factor for poor condition.
Facility Functionality: 1. Obtain the total cost of the project. 2. Determine the number of points to attribute to the project using
the list below. 3. Multiply the total project cost by the project points. 4. Scale the benefit by dividing by the maximum unscaled value
across all projects in the comparison database. Scoring: Does the project:
Change the classification of a bridge from structurally deficient to not deficient? 1
Widen existing lanes or shoulders? 1 Include improvements that support ADA compliance? 1 Include improvements to transit or other fixed facilities to
replace equipment classified as obsolete based on current design standards? 1
System Preservation/Asset Management:
Improvements to Bridges and Pavement Condition
Improvements to Transit Assets
Boston Region MPO
Bridges and pavement condition: Massachusetts DOT bridge and pavement databases Transit assets: Project design documents
Bridges and pavement condition: Pavement condition is measured using IRI. Bridge condition is measured using federal good/fair/poor
system, along with notations on weight restrictions and whether bridges are structurally deficient.
Transit assets: Award points to projects that improve the condition of transit assets, including bus stops, rail stations, transit vehicles and other assets.
Produced by CTC & Associates LLC 71
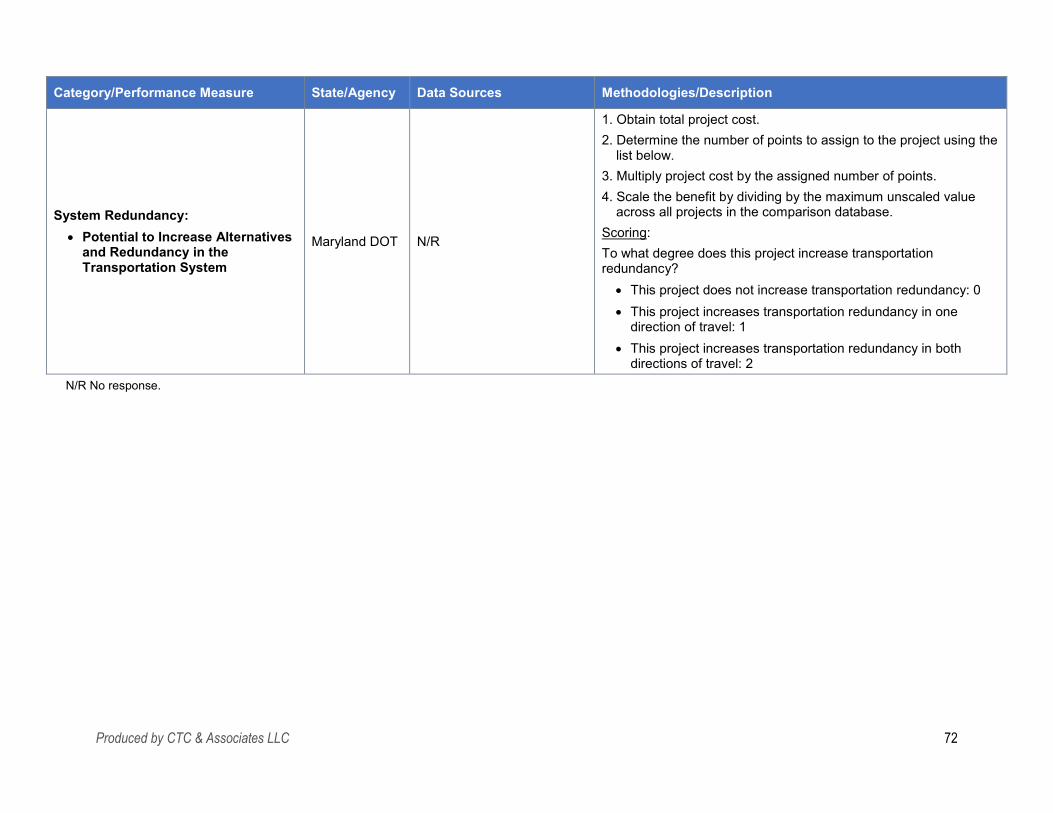
Category/Performance Measure State/Agency Data Sources Methodologies/Description
System Redundancy: Potential to Increase Alternatives
and Redundancy in the Transportation System
Maryland DOT N/R
1. Obtain total project cost. 2. Determine the number of points to assign to the project using the
list below. 3. Multiply project cost by the assigned number of points. 4. Scale the benefit by dividing by the maximum unscaled value
across all projects in the comparison database. Scoring: To what degree does this project increase transportation redundancy?
This project does not increase transportation redundancy: 0 This project increases transportation redundancy in one
direction of travel: 1 This project increases transportation redundancy in both
directions of travel: 2 N/R No response.
Produced by CTC & Associates LLC 72

Tools and Documentation Data Collection and Mapping Tools Ten responding agencies reported using Esri tools such as ArcGIS and ArcMap to gather and map data needed to support the project-level performance measures. Eight agencies reported using additional tools such as Google Maps and CalEnviroScreen. For RTPs, MTC uses Travel Model 1.5, an activity-based travel simulation model developed in house, and UrbanSim Two, an urban modeling tool that simulates household location choice, employer location choice and developer action. (MTC modifies UrbanSim to meet Bay Area specifications.) SACOG uses a custom Project Performance Assessment geospatial tool that aggregates data layers that the agency maintains and completes calculations by project; many of the measures use a buffer approach drawing on characteristics within the project travel shed. At StanCOG, local agency applicants use the CARB Automated Cost-Effectiveness Calculation Tool for CMAQ project submittals.
Table 17 summarizes survey responses.
Table 17. Geospatial Tools Used for Data Collection and Mapping
State/Agency Esri ArcGIS
Esri ArcMap Other Description
Boston Region MPO X X Google Maps Illinois DOT X LA County Metro X
Maryland DOT X X Renaissance Planning
Multimodal Accessibility Tool MSTM
Minnesota DOT X
MTC X Travel Model 1.5 UrbanSim Two
RCTC 1 X X Other tools related to ArcGIS RCTC 2 X Consultant preference
SACOG X Custom Project Performance Assessment tool
SANDAG X X CalEnviroScreen SBCTA X SCAG X SCCRTC X
StanCOG X
CARB Automated Cost-Effectiveness Calculation Tool (used by local agencies for CMAQ project submittals only)
Total 8 2 8
Produced by CTC & Associates LLC 73

-
Data Management Tools and Models Respondents reported a range of vendor, in-house and other tools and models to gather and manage the data needed to support the project-level performance measures. For RTPs, MTC employs REMI, which is used for regional economic forecasting, including future demographics and economic conditions. SACOG uses the select link analysis in its travel model in performance assessment. More recently, the agency has completed a pilot project using Replica data and will most likely be incorporating this as a tool in project-level assessment moving forward.
SANDAG's Activity-Based Model (ABM) is useful for horizon year data; however, since running the model takes significant resources, grant applications typically rely on Cal-B/C since it is quicker. The ABM is also not intended to be used for yearly reporting since it is a forecast tool and is not intended to be a monitoring tool for specific projects.
Among the tools used by SBCTA are the San Bernardino Transportation Analysis Model (SBTAM), a subregional TransCAD model that is based on the four-step SCAG Regional Model; FTA STOPS, a model generally used to analyze transit alternatives, which generates person-hours and some VMT reductions; and SYNCHRO for intersection/signal analysis (to analyze bottleneck relief and delay reduction for freight). RCTC 2 noted the agency’s reliance on consultants to gather and manage data that supports performance measures, adding that it provides project documents, including environmental documents and any studies that have been completed in support of a project, to consultants that prepare grant applications.
Table 18 summarizes survey responses.
Table 18. Tools and Models Used for Data Collection and Management
State/Agency RITIS CARB Tools
In House Tools
Vendor Tools Other Description
Boston Region MPO X Illinois DOT X X 2010 HSM Maryland DOT X Microsoft Excel (for project scoring) MTC X REMI (for RTP)
RCTC 1 X X
EMFAC CARB’s Carl Moyer Program
Guidelines Caltrans methods for calculating cost-
effectiveness of CMAQ projects RCTC 2 X Consultant preference
SACOG X X Select link analysis in performance
assessment travel model Replica data
SANDAG X SANDAG ABM Cal-B/C
SBCTA X X
SBTAM ClearGuide (Iteris) FTA STOPS SYNCHRO
Produced by CTC & Associates LLC 74

-State/Agency RITIS CARB Tools
In House Tools
Vendor Tools Other Description
SCAG X SCAG Regional Travel Demand
Model SCAG Scenario Planning Model.
SCCRTC X X X TransCAD AMBAG travel demand model Esri ArcGIS
StanCOG X CARB Automated Cost-Effectiveness Calculation Tool (CMAQ project submittals only)
Total 2 3 5 3 5
Assessment and Recommendations Successes Using Performance Measures in Applications Common successes using project-level performance measures in transportation project applications include:
Ensuring equitable access to funding To administer the 2% set-aside of local transportation funds for bicycle and
pedestrian projects, RCTC 2 reported that the agency creates a subcommittee of the agency’s Technical Advisory Committee that is made up of agencies that apply to receive competitive funds. RCTC establishes the scoring for applications, considering all input and the potential adverse impact some factors may have on particular applicants. To ensure equitable treatment among applicants, RCTC makes applications easy to compile and is fully transparent about scoring for each required category.
At MTC, project costs are used to calculate the benefit–cost ratio. These costs come from project sponsors that use varying methods for estimating project costs. The agency uses an independent consultant to verify cost estimates from sponsors to ensure a more uniform comparison across projects from different sponsors.
The SACOG respondent reported that online evaluation tools are available to anyone.
Modeling project elements and cost-effectiveness MTC quantifies benefits to individuals with low incomes to objectively assess
projects’ impacts on equity. Previously MTC had limited abilities to assess performance and had to rely on the geographic location.
SBCTA uses big data tools such as ClearGuide to quantify existing conditions and make the case for projects, particularly freight projects.
SBCTA also uses a cost-effectiveness index to prioritize interchange improvements for investment in its Measure I interchange program, which helped to structure and organize the interchange program in 2009.
Produced by CTC & Associates LLC 75

The StanCOG respondent noted that CMAQ projects with the best cost-effectiveness are funded and implemented, and provide air quality benefits to the region.
The SACOG respondent noted that performance measures have been the “cornerstone element of review” in recent funding rounds; the board “look[ed] for [the] quantitative component of [the] evaluation.”
Using performance and equity assessment results to identify project deficiencies MTC uses this information to help project sponsors re-scope projects or identify
complementary policies that should be pursued to mitigate deficiencies if the project is implemented.
Obtaining required design and other documentation Boston MPO Region is “generally pretty successful” at getting the information
needed to score projects, such as functional design reports, road safety audits and conceptual designs and plans. Applicants are required to complete a questionnaire to ensure project information is complete (see Supporting Document).
RCTC 1 reported that template-based application sections help ensure all essential information is provided to facilitate project evaluation.
Maintaining flexibility with performance measures The SANDAG respondent reported that funding agencies have been supportive of
requests for flexibility in performance measures.
Building interagency relationships SANDAG has built strong relationships with some of its statewide freight agencies to
build consensus on most TCEP performance measures.
Challenges Using Performance Measures in Applications Challenges that agencies have when working with applicants are summarized below:
Incomplete information Boston Region MPO noted that the level of detail across applications varies, which
can create challenges given the short timeline to score projects (usually about four weeks). Additional information is usually obtained through follow-up discussions with project proponents.
The RCTC respondents noted that “missing or inconsistent information” is challenging. In addition, many local agencies don't have sufficient staff to complete applications or acquire information, such as safety data.
Maryland DOT sometimes receives applications for projects that are either exempt from scoring or do not have sufficient planning to score.
Accessing data The Minnesota DOT respondent noted that obtaining data can create a barrier for
potential applicants. SACOG noted a lack of comprehensive, detailed traffic count data precludes the
calculation of weighted congestion measures (e.g., vehicle hours of delay or person hours of delay).
Produced by CTC & Associates LLC 76
Accommodating all projects MTC finds that some projects do not lend themselves to regional assessments,
including small projects that have highly localized benefits (such as bicycle or pedestrian investments) or that improve reliability (that an agency’s model cannot assess reliability benefits).
MTC also noted that analyzing projects in isolation is useful, but does not recognize that projects are part of a transportation network and can have improved or degraded performance in the presence of other projects.
SACOG reported challenges evaluating across project types, such as freeway high occupancy vehicle lane versus transit bus replacement versus road rehabilitation.
Tool issues SACOG noted a number of potential challenges with tools
o Ensuring tools are available to all users, including nonmodelers. o Managing expectations (e.g., a project/no project analysis versus reality,
state of the tool, level of effort). o Understanding the tool: SACOG’s tool produces many indicators. Using the
tool can be a “steep learning curve” for some applicants. o Ensuring online tool stability.
Understanding how projects will perform in an uncertain future For RTP measures, MTC finds that analyzing projects in multiple futures was
invaluable in understanding projects’ anticipated performance, though this approach substantially increased the workload.
Maintaining flexibility with performance measures For TCEP, SANDAG has pushed for funding opportunities to allow flexibility in
performance measures, especially for qualitative answers when quantitative answers are not feasible. For example, traditional performance measures don’t always apply to the agency’s land ports of entry, so the agency submits qualitative answers. In some cases, the agency applying for the freight grant is not the freight operator, and due to market conditions, the project may not realize the intended performance measures due to these market conditions.
SCCRTC finds that data and methodology for performance measures are often unique for the metric and project mode. Flexibility may be needed for applicants to determine the best information for assessing the benefit.
StanCOG noted that not all projects meet the $45 per pound threshold.
Implementation Recommendations Respondents offered recommendations for other agencies beginning to implement project-level performance measures to evaluate the effectiveness and/or competitiveness of transportation project applications:
Boston Region MPO: Allow performance measures to vary by project type. Recent revisions to the
agency’s project selection criteria prioritized this approach and created a better overall
Produced by CTC & Associates LLC 77

system by ensuring each performance measure appropriately applies to each project (for example, bicycle and pedestrian projects versus Complete Streets projects).
Balance breadth with clarity. The agency has about 25 scoring criteria, which makes scoring cumbersome (though the MPO board prefers this level of detail). Fewer criteria or performance measures can make a scoring system more legible, especially to the public, but that requires sacrificing some level of detail and thoroughness.
Conduct public outreach. The agency conducted two rounds of public outreach (through surveys and focus groups) in support of its new criteria and found these conversations to be rewarding. Several updates were made to the scoring criteria in direct response to public feedback.
Maryland DOT: Provide some areas where the reviewing agency has some evaluation input. Using
objective data and analysis are most desired in project performance criteria but some measures cannot always be evaluated based on data alone.
Ensure a transparent development and education process for new programs. Bring in various stakeholders when measures are developed to solicit data that will be applied and weight criteria. Get input from subject matter experts for each criteria field. Also, work to make the applicants part of the criteria development process. Invite some to sit on a development committee for review along the way. After the criteria are finalized, provide continual awareness about the evaluation process.
Minnesota DOT: Carefully consider the level of effort required versus the benefit of getting or using
the data. Be transparent with methodology and selection decisions. Take an iterative approach. Try some new criteria, and then reflect and update
measures.
MTC: For RTP measures, base equity assessments on modeled utilization of a project
instead of simply on a project location. This is especially important given the history of transportation infrastructure projects in disrupting communities of color without providing benefits to community members themselves.
RCTC 1: Use templates within the application to request essential project information and
data. Applicants fill in the appropriate data fields. For correctness and consistency, make the calculations instead of relying upon
applicants to do them. Request and evaluate supporting documents to corroborate and substantiate
performance measure representations.
RCTC 2: Keep it simple by sticking with the basics. Provide a straightforward explanation of
the impetus for creating the application process. Ensure all agencies have an equal shot at applying and receiving funds.
Produced by CTC & Associates LLC 78

SACOG: Define outputs and wherever possible, give a relative comparison. Understanding
the meaning of outputs can be a steep learning curve for some applicants. Start with observed data to demonstrate an existing need. Recognize upfront limitations and trade-offs. Avoid false precision.
SANDAG Attend workshops on the process of developing guidelines for funding
opportunities. This is the time that agencies can comment on potential performance measures and push for some flexibility.
Ensure the performance measures in the grant applications can be vetted with data sources/methodologies. The funding agencies will question numbers that are not explained in the application.
Develop a process for tracking the performance measures. The awarded agency will need to revisit these performance measures often for annual reporting and audits.
SBCTA: Keep performance measures simple and consistent across project types. The CTC
had a much more extensive set of performance measures for SB 1 cycle 2 TCEP and SCCP applications.
Reconsider post-implementation performance measures. The CTC requires post-implementation assessments, using actual data, for projects it has funded. This step is much more difficult and expensive, and many times not even feasible for before/after analysis. Recognize that these sets of performance measures are different, based on the feasibility and cost of data collection.
Continue to use cost-effectiveness as a criterion. It is a key component of how the public and businesses perceive the worthiness of a project. Savings in travel time is the principal determinant of a project’s cost-effectiveness and benefit to the economy, particularly for freight projects. The state needs to continue to include it as an evaluation factor for freight/economic competitiveness even though delay is being downplayed for automobile travel.
SCCRTC: Provide the best information for evaluation instead of following the exact wording
of the performance measure requirement. Measures are not always applicable for all situations.
StanCOG: When selecting performance measures, tailor each to a specific region. Not all
performance measures are applicable to each region. During performance measure development, consult with local agencies to assure
each measure’s feasibility before finalizing it. Once performance measures are developed, work with the agencies to help
generate projects with the ability to meet the performance goals. Collaboration among multiple agencies to create a bigger project may score higher depending on the performance measure.
Produced by CTC & Associates LLC 79
Additional Information Two respondents provided additional suggestions:
RCTC 2: The respondent noted that adding a sheet to the Cal-B/C model that automatically summarizes the safety, travel time and emissions-related metrics in the manner desired by CTC for performance monitoring would be very helpful. RCTC recently submitted four Cycle 2 SB 1 applications (Local Partnership Program C, Solutions for Congested Corridors Program, Trade Corridor Enhancement Program and Local Partnership Program F). Many of the metrics required additional analysis that was not easily derived from the required Cal-B/C model, which made for a more difficult analysis. The respondent suggested that it would benefit these applications and the grantees to either use a model that directly modeled the metrics requested (rather than requiring additional methodology or analysis) or update the metrics to more closely mirror the outputs of Cal-B/C, where applicable. Specifically, the summarized outputs of Cal-B/C show only the total change in top-level metrics over the 20-year operations period and an annual average. They do not show the build and no-build totals, and they do not show the daily information often requested in the CTC metrics. This information is available within the model but it requires significant effort to make the necessary calculations to summarize the information in the required manner.
SANDAG: The modeling staff shared the following suggestions: o Data related to cost of heavy duty truck operations and ownership: The SANDAG
ABM has an auto operating cost, which is a combination of fuel and maintenance. It would be helpful if there were similar annual reports that have that information. Usually the fuel costs have multiple sources but the modeling staff relies on the AAA maintenance cost calculator for the non-fuel costs (expressed in cents per mile driven). Trade groups or other freight organizations may survey operators about their annual operating costs, and could provide this information.
o Regular counts at major freight facilities by time of day: Knowing whether certain sites have a high proclivity of truck activity during nonstandard peak hours would help the staff in estimating its baseline model. For example, if a commercial ship at 10th Avenue generates most of its trips between 10 p.m. and 4 a.m., SANDAG could adjust its commercial vehicle model to assign those trips during the evening period in the model.
o Overall major freight facility throughput: Having a regular snapshot of what kind of activities are happening on a year-to-year basis would be useful. This information could be provided by loads, trips or tonnage, as long as it’s done by mode (such as truck, rail or ship).
Supporting Document Boston Region Metropolitan Planning Organization
Project Proponent Guidance and Questionnaire, Memorandum, Boston Region Metropolitan Planning Organization, October 2019. https://www.ctps.org/data/pdf/plans/TIP/FFYs-2021-2025-TIP-Project-Proponent-Guidance.pdf Local agencies interested in receiving federal funding for transportation construction projects use this guidance to provide information that is used to initiate the project, advance it through design review and evaluate for possible inclusion in the TIP.
Produced by CTC & Associates LLC 80

Related Research and Resources Below is documentation provided by survey respondents that is related to the use of project-level performance measures with competitive transportation project funding programs. Following these resources is contact information for survey respondents and others who are available to provide additional information about project-level performance measurement practices.
Related Research Boston Region Metropolitan Planning Organization
Creating New TIP Criteria, Boston Region Metropolitan Planning Organization, undated. https://www.ctps.org/tip-criteria-dev The agency recently completed a 15-month process of revising its project selection criteria and is building a larger suite of materials to communicate this information. Details about the revision process and proposed changes to project selection criteria are available at this web site.
Los Angeles County Metropolitan Transportation Authority
Metro Active Transport (MAT) Program: Cycle One Screening and Prioritization Methodology, Los Angeles County Metropolitan Transportation Authority, January 2020. http://media.metro.net/about_us/committees/images/mat-cycle1-screening-methodology.pdf The screening and prioritization methodologies are presented for the Metro Active Transport Program. The processes address equity, safety and mobility/connectivity.
Maryland
Chapter 30: Transportation Project-Based Scoring Model, 2019 Technical Guide, Maryland Department of Transportation, 2019. https://www.mdot.maryland.gov/OPCP/FY2019_Chapter30_Technical_Guide.pdf From the introduction: Pursuant to Chapter 30, Acts of 2017 (Senate Bill 307), the Maryland Department of Transportation (MDOT) “shall, in accordance with federal transportation requirements, develop a project-based scoring system for major transportation projects using the goals and measures established under [Transportation Article 2-103.7(c)] for projects” being considered for inclusion in the Consolidated Transportation Program (CTP). … This document presents details on the Chapter 30 scoring model including information on roles and responsibilities, project eligibility requirements, the project application process, and the goals and measures used for scoring projects.
Metropolitan Transportation Commission
Horizon/Plan Bay Area 2050: Project Performance Findings, Anup Tapase, Metropolitan Transportation Commission, Association of Bay Area Governments, January 2020. https://mtc.ca.gov/sites/default/files/ProjectPerformance_FinalFindings_Jan2020.pdf The key objectives of project performance and documentation about project methodologies used in the RTP are provided in this presentation.
Minnesota
Project Selection: How We Select Highway Construction Projects, Minnesota Department of Transportation, undated. www.mndot.gov/projectselection Information about the agency’s project selection processes is available on this web page.
Produced by CTC & Associates LLC 81

Sacramento Area Council of Governments
Project Performance Assessment, Sacramento Area Council of Governments, undated. https://www.sacog.org/project-performance-assessment Documentation about the updated Project Performance Assessment tool and other materials is available at this web site.
Santa Cruz County Regional Transportation Commission
The following reports both evaluate performance measures quantitatively:
Unified Corridor Investment Study, Santa Cruz County Regional Transportation Commission, January 2019. https://www.sccrtc.org/wp-content/uploads/2019/01/UCS-Final-January2019.pdf From the web site: The objective of the Unified Corridor Investment Study (UCS) is to identify multimodal transportation investments that provide the most effective use of Highway 1, Soquel Avenue/Soquel Drive/Freedom Boulevard, and the Santa Cruz Branch Rail Line while best serving the community’s transportation needs. The study’s goals focus on developing a sustainable and well-integrated transportation system while maximizing benefits in terms of efficient mobility, health and equity, the natural environment, and economic vitality.
Transit Corridor Alternatives Analysis and Rail Network Integration Study, Draft Report, Santa Cruz County Regional Transportation Commission, 2020. https://sccrtc.org/draft-results-of-the-transit-corridor-alternatives-analysis-study-released/ From the web site: The report details the results of the TCAA/RNIS [Transit Corridor Alternatives Analysis and Rail Network Integration Study] which evaluates high-capacity transit investment options and identifies a locally preferred transit system that utilizes all or part of the length of the Santa Cruz Branch Rail Line Rail Right-of-Way (SCBRL ROW). The yearlong study analyzed various transit alternatives to identify a locally preferred alternative that provides the greatest benefit to Santa Cruz County residents, businesses and visitors in terms [of] the triple bottom line goals of improving economy, equity, and the environment.
Follow-Up Contacts Below is contact information for agency representatives who are available to provide additional information about project-level performance measurement practices:
Boston Region Metropolitan Planning Organization: Matt Genova (survey respondent), [email protected].
Illinois DOT: Kyle Johnson (survey respondent), [email protected]. Steve Prefountain, [email protected].
Kern COG: Joseph Stramaglia (survey respondent), 661-472-2887.
Los Angeles County Metropolitan Transportation Authority Shelly Quan (survey respondent), [email protected].
Produced by CTC & Associates LLC 82

Maryland DOT: Phil LaCombe (survey respondent), [email protected]. Dan Favarulo, [email protected].
Minnesota DOT: Philip Schaffner (survey respondent), [email protected].
MTC: RTP: Raleigh McCoy, [email protected]. STP/CMAQ: Mallory Atkinson (survey respondent), [email protected].
RCTC: Ray Gorski (survey respondent 1), [email protected]. Jillian Guizado (survey respondent 2), [email protected].
SACOG: Garett Ballard-Rosa (survey respondent), [email protected]. Darren Conly, [email protected].
SANDAG: Keri Robinson (survey respondent), [email protected].
SBCTA: Steve Smith (survey respondent), [email protected]. Tim Byrne, [email protected].
SCCRTC: Ginger Dykaar (survey respondent), 831-460-3213, 831-334-9705 (cell),
Absence of Project-Level Performance Measures Twelve respondents from 11 agencies reported that their agencies have not developed project-level performance measures:
State DOTs Florida DOT New Mexico DOT Wyoming DOT
California MPOs SANDAG (two responses: Planning, and Grants and Contracts) San Luis Obispo Council of Governments SBCAG
California RTPAs Madera County Transportation Commission Modoc County Transportation Commission Shasta Regional Transportation Planning Agency
Produced by CTC & Associates LLC 83
Tehama County Transportation Commission Trinity County DOT
Five of these agencies provided more detail about current circumstances related to competitive transportation project funding, which is largely related to the limited number of projects that are funded:
Modoc County Transportation Commission: This agency operates in a very rural county with deferred maintenance needs.
SANDAG/Planning: Performance measure efforts are typically applied to plans and programs rather than specific projects.
SBCAG: SBCAG does not administer funding programs to the extent that performance measures are necessary. The respondent expects this condition to continue for the foreseeable future. The agency does administer a local sales tax initiative (Measure A). Most of the funding associated with this initiative is formula-based; funding that is not is largely associated with Safe Routes to School and Active Transportation programs. STIP funding has been used for a single large project. As STIP funding becomes available for other projects, circumstances may change and SBCAG will revisit the issue.
Shasta Regional Transportation Agency: The respondent noted that only a limited number of projects can be funded in smaller regions. The agency is usually focused on top-tier, long-established priorities. Local agency projects with a regional funding component must support implementation of the region’s adopted Regional Transportation Plan/Sustainable Communities Strategy (RTP/SCS), which includes goals and performance targets.
Wyoming DOT: The only competitive transportation project applications in Wyoming are the Technical Advisory Panel and CMAQ funds for local governments, which is a small portion of Wyoming DOT’s budget (about $4.5 million).
The SANDAG/Planning respondent also provided information about agency tools and implementation recommendations related to plan- and program-level performance measures (not project-level):
Geospatial tools to Esri ARC products, including online hosting services. gather and map data:
Other tools to gather and manage data:
ABM Database management tools, such as SQL Management,
Access and Excel
Implementation recommendations:
Support applicants with common data sources and processes. Not all agencies will have the same resources for data analysis. Supplying as much of the material as possible will help level the playing field. Existing conditions assessments help identify areas of need that may not fit in modeling of anticipated future conditions.
Provide flexibility for applicants to showcase project strengths outside the performance measure structure.
Produced by CTC & Associates LLC 84

The respondent is available to provide additional information about the agency’s practices.
Related Resource:
Federal 2020 Regional Transportation Plan (Archived), Activity-Based Model (ABM)— Reporting, San Diego Association of Governments, updated August 25, 2020. https://github.com/SANDAG/ABM-Reporting/wiki/Federal-2020-Regional-Transportation-Plan-(Archived) From the web page: The Federal 2020 Regional Transportation project contains SQL objects, a Python project, and a formatted Excel template. The main output product is a formatted and populated Excel workbook containing all [p]erformance [m]easures used in the Federal 2020 Regional Transportation Plan.
Future Plans Three of these agencies—SANDAG/Planning, SANDAG/Grants and Contracts, and Tehama County Transportation Commission—are considering developing project-level performance measures for competitive transportation project funding. According to the SANDAG/Grants and Contracts respondent, SANDAG has six competitive grant programs and will be implementing performance measures for each in the next scheduled call for projects, which is expected to occur in summer 2021. Tehama County Transportation Commission is considering developing performance measures but has not finalized plans.
Produced by CTC & Associates LLC 85
Contacts
CTC contacted the individuals below to gather information for this investigation.
State Agencies
Florida Regina Colson Transportation Performance Measures
Coordinator Florida Department of Transportation 850-414-5271,
Illinois Kyle Johnson GIS Database Specialist, Planning and
Programming Illinois Department of Transportation 217-622-5519, [email protected]
Indiana Louis Feagan Asset Management Indiana Department of Transportation 317-412-1670, [email protected]
Maryland Philip LaCombe Transportation Planner Maryland Department of Transportation 413-648-7445, [email protected]
Michigan Kelly Travelbee Performance Michigan Department of Transportation 517-898-4875, [email protected]
Minnesota Philip Schaffner Director, Statewide Planning, Planning Minnesota Department of Transportation 651-366-3743,
New Mexico Tamara Haas Capital Program and Investments Division New Mexico Department of Transportation 505-795-2126, [email protected]
Ohio Tim McDonald Planning Ohio Department of Transportation 614-466-8981, [email protected]
Wyoming Martin Kidner State Planning Engineer Wyoming Department of Transportation 307-777-4411, [email protected]
California Metropolitan Planning Organizations
Kern Council of Governments Joseph Stramaglia Regional Planner, Project Delivery 661-635-2914, [email protected]
Metropolitan Transportation Commission Mallory Atkinson Funding Policy Analyst, Funding Programs
and Policy 415-778-6793,
Produced by CTC & Associates LLC 86
Sacramento Area Council of Governments Garett Ballard-Rosa Transportation Group 916-319-5183, [email protected]
San Diego Association of Governments Keri Robinson Goods Movement Planner, Planning 619-699-6954, [email protected]
Jenny Russo Grants and Contracts 619-699-7314, [email protected]
Sam Sanford Planning 619-595-5607,
San Luis Obispo Council of Governments Daniel Audelo Transportation Planner 805-781-4219, [email protected]
Santa Barbara County Association of Governments Dylan Tonningsen Transportation Planner II, Programming 510-898-8178, [email protected]
Southern California Association of Governments Mike Gainor Senior Regional Planner 213-236-1822, [email protected]
Stanislaus Council of Governments Isael Ojeda Senior Planner 209-272-6381, [email protected]
California Regional Transportation Planning Agencies
Los Angeles County Metropolitan Transportation Authority Shelly Quan State Policy and Programming 213-922-3075, [email protected]
Madera County Transportation Commission Dylan Stone Regional Planning Supervisor 559-675-0721, [email protected]
Modoc County Transportation Commission Debbie Pedersen Executive Director 530-233-6410,
Riverside County Transportation Commission Ray Gorski (respondent 1) Consultant, Planning and Programming 760-715-5391, [email protected]
Jillian Guizado (respondent 2) Planning and Programming 951-787-7923, [email protected]
San Bernardino County Transportation Authority Steve Smith Director, Planning 760-567-0382, [email protected]
Santa Cruz County Regional Transportation Commission Ginger Dykaar Senior Transportation Planner 831-460-3213, [email protected]
Produced by CTC & Associates LLC 87

Shasta Regional Transportation Agency Daniel Wayne Senior Transportation Planner 530-262-6186, [email protected]
Tehama County Transportation Commission Jessica Riske-Gomez Transportation Manager 530-385-1462, [email protected]
Trinity County Department of Transportation Kimi Taguchi Transportation Planner 530-623-1365, [email protected]
Other Metropolitan Planning Organizations
Boston Region Metropolitan Planning Organization Matt Genova Transportation Improvement Program Manager 857-702-3702, [email protected]
Puget Sound Regional Council Kelly McGourty Director, Transportation Planning 206-971-3601, [email protected]
Consultant
Mark Thomas Ryan Bissegger New Business Director 916-539-4680, [email protected]
Produced by CTC & Associates LLC 88

Appendix A: Survey Questions The following survey was distributed to members of the American Association of State Highway and Transportation Officials (AASHTO) Committee on Performance-Based Management, a select group of California metropolitan planning organizations (MPOs) and regional transportation agencies, and a select group of MPOs from other states.
Survey on Methodologies Supporting Project-Level Performance Measurement
Note: The response to the question below determined how a respondent was directed through the survey.
(Required) Has your agency developed project-level performance measures that are used to evaluate proposals submitted by applicant agencies to competitive transportation project funding programs?
No. (Directed the respondent to the Agencies Without Project-Level Performance Measures section of the survey.)
Yes. (Directed the respondent to the Describing the Performance Measures section of the survey.)
Agencies Without Project-Level Performance Measures Is your agency considering developing project-level performance measures for use by applicant agencies submitting proposals to competitive transportation project funding programs?
No Yes (Please briefly describe your agency’s plans.)
Note: After responding to the question above, the respondent was directed to the Wrap-Up section of the survey.
Agencies With Project-Level Performance Measures
Describing the Performance Measures Please describe each of your agency’s project-level performance measures under the most appropriate corresponding general category below:
Accessibility Performance measure(s) Data sources Methodologies (including assumptions, standards and calculations)
Climate Performance measure(s) Data sources Methodologies (including assumptions, standards and calculations) Please also describe indicators specifically addressing emergency incidents and repairs. Please report on any vulnerability studies used to define these performance indicators.
Congestion Performance measure(s) Data sources Methodologies (including assumptions, standards and calculations)
Produced by CTC & Associates LLC 89

Economy and Cost-Effectiveness Performance measure(s) Data sources Methodologies (including assumptions, standards and calculations)
Efficient Land Use Performance measure(s) Data sources Methodologies (including assumptions, standards and calculations)
Environment: Short-Term Assessment Performance measure(s) Data sources Methodologies (including assumptions, standards and calculations)
Environment: Long-Term Goals and Objectives Performance measure(s) Data sources Methodologies (including assumptions, standards and calculations)
Equity Performance measure(s) Data sources Methodologies (including assumptions, standards and calculations)
Innovation Performance measure(s) Data sources Methodologies (including assumptions, standards and calculations)
Partnership Performance measure(s) Data sources Methodologies (including assumptions, standards and calculations)
Quality of Life and Public Health Performance measure(s) Data sources Methodologies (including assumptions, standards and calculations)
Reliability (Freight) Performance measure(s) Data sources Methodologies (including assumptions, standards and calculations)
Reliability (Non-Freight) Performance measure(s) Data sources Methodologies (including assumptions, standards and calculations)
Safety Performance measure(s) Data sources Methodologies (including assumptions, standards and calculations)
Produced by CTC & Associates LLC 90

Throughput (Freight) Performance measure(s) Data sources Methodologies (including assumptions, standards and calculations)
Velocity (Freight) Performance measure(s) Data sources Methodologies (including assumptions, standards and calculations)
Other (Please describe.) Performance measure(s) Data sources Methodologies (including assumptions, standards and calculations)
Tools and Documentation 1. What geospatial tools does your agency use to gather and map the data needed to support
the project-level performance measures? Please provide the name and vendor of commercial products.
2. What other tools and models does your agency use to gather and manage the data needed to support the project-level performance measures? Please provide the name and vendor of commercial products.
3. Has your agency developed documentation related to the use of project-level performance measures in connection with competitive transportation project funding programs?
No Yes (Please provide a link or electronic copy of this documentation or send any files
not available online to [email protected].) Assessment and Recommendations 1. What successes has your agency experienced when working with applicant agencies
required to include project-level performance measures in transportation project applications?
2. What challenges has your agency encountered when working with applicant agencies required to include project-level performance measures in transportation project applications?
3. What are your top three recommendations for other agencies beginning to implement project-level performance measures to evaluate the effectiveness and/or competitiveness of transportation project applications?
4. Can Caltrans contact you or a colleague to request additional information about your agency’s project-level performance measurement practices?
No Yes (Please provide contact information for your colleague, if applicable.)
Wrap-Up Please use this space to provide any comments or additional information about your previous responses.
Produced by CTC & Associates LLC 91