defining of printing plate quality level through
TRANSCRIPT

DEFINING OF PRINTING PLATE QUALITY LEVEL THROUGH INTRODUCTION OF
DIFFERENT IMAGE ANALYSIS APPLICATIONS
JELENA POLJAK
MÁSTER EN INVESTIGACIÓN EN INFORMÁTICA, FACULTAD DE INFORMÁTICA,
UNIVERSIDAD COMPLUTENSE DE MADRID
Trabajo Fin Máster en Ingeniería de Computadores
Junio de 2013
Director: GUILLERMO BOTELLA JUAN Director Colaborador externo: CARLOS GARCÍA SÁNCHEZ

I would like to thank my supervisors Sanja Mahović Poljaček,
Guillermo Botella Juan and Carlos García Sánchez for their guidance
and support throughout this work.

Abstract
Printing plate is carrier of an image which will be print out and multiply in the
reproduction process. It consists of surfaces which will, by using a printing ink,
transfer the digitally made image onto the printing substrate. Quality of the
image and final imprint depend on a number of parameters which have to be
monitored and adjusted during the printing plate making and reproduction
processes.
Quality control of printing plate can be conducted by observing the printing
areas, made of photosensitive layer; or by observing the non-printing areas,
made of aluminium-oxide. Quality of the image on the printing plate surface is
usually controlled by using different devices for measuring the quality level of
plates. These devices work on the principle of determining several parameters
for monitoring the quality of printing plates, where, the most significant is, the
surface coverage of the printing elements.
Beside those devices, market today offers a range of alternative methods which
allow the determination and characterization of tones by using a software
support for image analysis. Those methods are using the microscopic images of
the surface and can define the surface coverage of printing elements and other
necessary information about the quality of the printing plate.
The aim of this work is the defining of printing plate quality level through
introduction of different image analysis applications. The results of this research
may indicate that it is also possible to use alternative applications for monitoring
the quality of the printing plates. Furthermore, this paper would provide a
general overview of quality control possibilities for printing plates and could be
useful to the systems where such controls are regularly conducted.
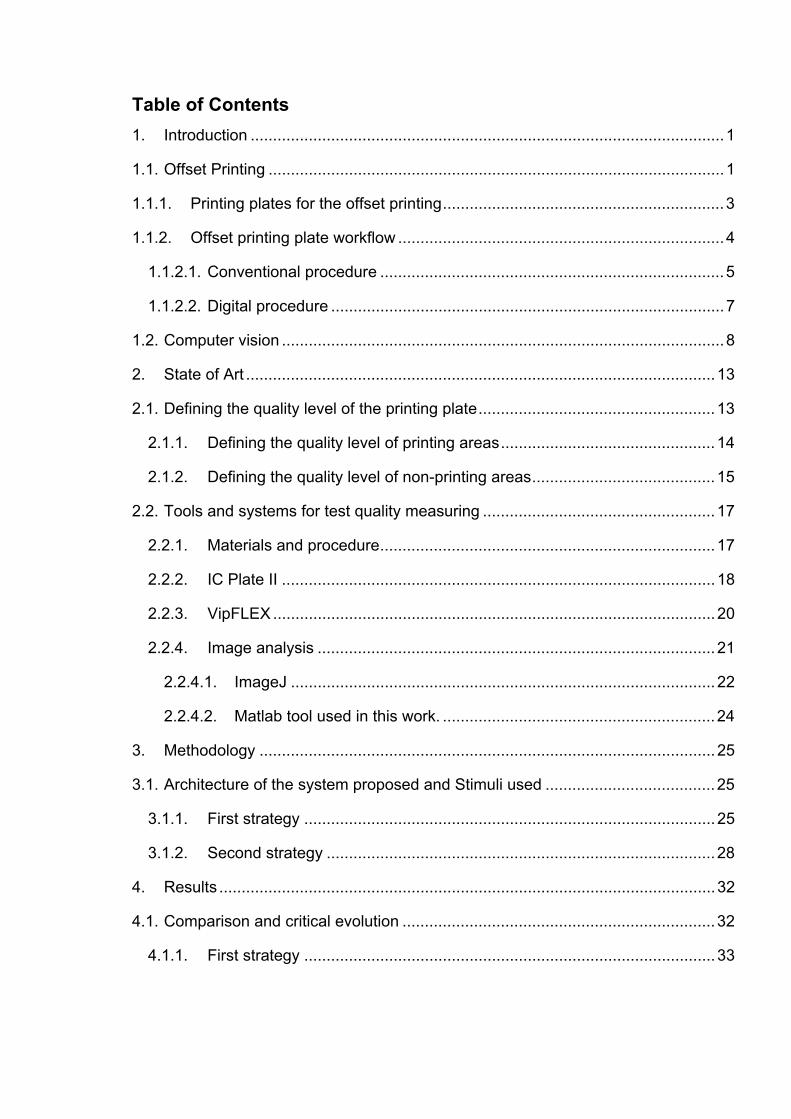
Table of Contents
1. Introduction .......................................................................................................... 1
1.1. Offset Printing ...................................................................................................... 1
1.1.1. Printing plates for the offset printing ............................................................... 3
1.1.2. Offset printing plate workflow ......................................................................... 4
1.1.2.1. Conventional procedure ............................................................................. 5
1.1.2.2. Digital procedure ........................................................................................ 7
1.2. Computer vision ................................................................................................... 8
2. State of Art ......................................................................................................... 13
2.1. Defining the quality level of the printing plate ..................................................... 13
2.1.1. Defining the quality level of printing areas ................................................ 14
2.1.2. Defining the quality level of non-printing areas ......................................... 15
2.2. Tools and systems for test quality measuring .................................................... 17
2.2.1. Materials and procedure ........................................................................... 17
2.2.2. IC Plate II ................................................................................................. 18
2.2.3. VipFLEX ................................................................................................... 20
2.2.4. Image analysis ......................................................................................... 21
2.2.4.1. ImageJ ............................................................................................... 22
2.2.4.2. Matlab tool used in this work. ............................................................. 24
3. Methodology ...................................................................................................... 25
3.1. Architecture of the system proposed and Stimuli used ...................................... 25
3.1.1. First strategy ............................................................................................ 25
3.1.2. Second strategy ....................................................................................... 28
4. Results ............................................................................................................... 32
4.1. Comparison and critical evolution ...................................................................... 32
4.1.1. First strategy ............................................................................................ 33

4.1.2. Second strategy ....................................................................................... 40
4.2. Implementation in a low-cost device .................................................................. 48
4.3. Conclusions and Future work ............................................................................. 52
5. Appendix ............................................................................................................ 54
5.1. Example of real outputs from Source Code of the system ................................. 54
6. Bibliography ....................................................................................................... 58

1
1. Introduction
1.1. Offset Printing
Offset printing is today the most common used printing technique. The principle
of offset printing is based on the physico-chemical differences between printing
and non-printing areas (Figure 1). Printing plate is made of aluminium foil and
ensures the transfer of the printing ink onto the printing substrate. On the
printing plate for the offset printing, printing and non-printing areas are in the
same plane. Between printing and non-printing areas there is a difference in
height of 2-3 micrometers but it is negligible compared to the other printing
techniques [1-2]. Printing areas are made of non-polar organic material
(photosensitive layer) and have hydrophobic properties [3]. On the other side,
non-printing areas are hydrophilic and made of polar material (aluminium oxide)
[4]. Apart from hydrophobic properties, printing areas have oleophilic
characteristics, which mean that oil-based printing ink will be adhered on them
during the reproduction process. Furthermore, non-printing areas which are
hydrophilic, when accepting the fountain solution, become completely
oleophobic.
Figure 1. Offset printing plate after applying fountain solution and ink
The printing process starts with the application of the fountain solution of a
strictly defined quantity. The fountain solution adheres only on the hydrophilic
non-printing areas. After the fountain solution, follows the application of the

2
printing ink which covers places on the printing plate covered with
photosensitive layer called printing areas. After the printing ink is applied,
begins the ink transfer to the printing substrate. The printing unit for the offset
printing consists of three main cylinders: plate cylinder, offset (blanket, rubber)
cylinder and impression cylinder (Figure 2) [5]. Dampening and inking system
are in contact with the printing plate which is placed on the plate cylinder. The
fountain solution and printing ink are transferred directly to the printing plate.
Since this is an indirect printing technique, the ink transfers from the printing
plate to the offset cylinder, covered with the rubber, and after that to the printing
substrate. To make this transfer possible, the pressure which is achieved
between offset and impression cylinder is required. Printing substrate, mostly
sheets or rolls of paper, pass between this two cylinders. Offset printing was
first used in the United States, where the first offset press was built in 1905.
Figure 2. Key elements in an offset process

3
1.1.1. Printing plates for the offset printing
Printing plates for the offset printing can be made of one material, i.e.
monometal or few materials, i.e. polymetal plates. Monometal printing plates are
made of aluminium foil and a thin photosensitive layer is applied on to
aluminium surface (Figure 3). They are processed by selective light exposure
and chemical developing of the soluble parts of photosensitive layer. As said
before, commonly used metal in monometal printing plates is aluminium, while
zinc and steel are rarely used. To get the aluminium foil firstly all the mass of
aluminum must pass through the system of rolls to produce a thin metal sheet.
On the surface of the thin metal sheet, a coating of aluminium oxide (Al2O3)
which has good hydrophilic characteristics is created spontaneously.
Roughening the surface can be performed by a sand-blasting, while today the
most commonly used process is electrochemical roughening. After the
roughening process, the aluminium surface has a defined micro-roughness,
thus additionally affecting the adhesion of the photosensitive layer and the
adsorption of the fountain solution in the printing process [6-7]. With
anodization, which is the next step in production of the printing plates, a thin
porous layer (2-4 micrometers) of aluminium-oxide is created. The role of the
layer is to increase hydrophilic properties of the non-printing areas. Beside this,
the coating also protects aluminium from corrosion and gives a greater
durability to the printing plate, because the aluminium-oxide has better
mechanical properties than aluminium.
a)

4
b)
Figure 3. Offset printing plate surfaces
a) SEM image of the aluminium oxide surface, magnification 2000×,
b) Images of printing (photosensitive) and non-printing (aluminium oxide) surfaces
Polymetal printing plates consist of at least two metals (bimetal) where one
metal has a function of printing areas, and the other of non-printing areas. For
forming the printing areas usually copper, zinc and brass are used, which show
good hydrophobic characteristics. Nickel, steel, aluminium and chromium are
metals with good hydrophilic characteristics and therefore are used for forming
the non-printing areas [8]. Polymetal printing plates are rarely used, because
their production is more complex than that of the monometal plates, although
they have better abrasion resistance and higher quality of reproduction.
1.1.2. Offset printing plate workflow
On the prepared aluminium foil, a thin photosensitive layer which is later
removed from defined surfaces during, the production process, is applied.
There are two types of printing plate production workflow: conventional and
digital procedure.

5
1.1.2.1. Conventional procedure
Conventional procedure of printing plate production is based on process of
exposing and making of films which are being copied on the printing plate.
Figure 4. Workflow of the conventional offset plate making process
Input data (image, text, illustration) are sent to the computer where they are
processed. Processed data are sent to RIP (Raster Image Processor) which
transforms the original to the screen image of input data (Figure 4). After
processing in Raster Image Processor, films are made by printing them on foil.
By exposing the films, which are mounted on the plate, photosensitive layer
changes its solubility. The developing process follows, where soluble part is
removed, thus creating the non-printing areas.
Conventional procedure of printing plate production could be positive or
negative process, depending on the type of photosensitive layer.
If the process is negative, on the thin aluminium sheet a negative photosensitive
layer is applied, with a negative copy film on top (Figure 5). Negative
photosensitive layer is soluble in the defined developing solution, and after
exposure it becomes insoluble. In the developing process, soluble or
unexposed layer is removed and in the end a printing plate with clearly defined
non-printing and printing areas is obtained.

6
Figure 5. Negative printing plate making process
The other type of printing plate making procedure is the positive process (Figure
6). Positive photosensitive layer is insoluble before, and becomes soluble in the
defined developing solution after exposure. Exposure is also performed through
the positive film, and followed by the developing process. The printing plate with
visible printing and non-printing (Al2O3) areas is obtained after developing [1-2].
Regardless which method is used, the result on the printing plate should be the
same.
Figure 6. Positive printing plate making process

7
1.1.2.2. Digital procedure
With technology development, the process of printing plates making procedure
has improved in the way that the environmentally least acceptable part, film
production and development, is not needed anymore (Figure 7) [10]. Digital
procedure or CtP (Computer to Plate) presents a process where the digital
information is directly formed on the printing plate. They can be, depending on
which type of photosensitive layer is used, divided in three groups: thermal
procedures, silver salt diffusion procedures and procedures with
photopolymerization [11].
Figure 7. Workflow of the digital offset plate making process
Today market offers different types of CTP technologies for production of the
offset printing plates. There are several platesetter units which differs in the type
of laser used in the plate exposure process [9]. By laser exposing of the printing
plate the solubility of photosensitive layer is changed. The laser with visible light
makes chemical changes on the photosensitive layer which is then removed
from non-printing areas. On the other hand, physical changes are made with
thermal laser where the printing areas are hardened and photosensitive layer
from non-printing areas is removed [9]. Besides differences in the used lasers,
platesetters may differ in their construction: internal drum, external drum and
flat-bed platesetters [10].
8
1.2. Computer vision
Nowadays, the big effort is investing in the development of the computer
systems which will be closer to human understanding and thinking. In that way
the artificial intelligence is developed and systems acquire the necessary skills
such as: ability to communicate in natural language, the ability to learn and
apply knowledge, reasoning, understanding of the surroundings, etc.
Particularly interesting and very complex component of computer science is the
computer vision. Its role is of modeling and replicating human vision using
computer software and hardware in way to extract useful information from
images and subsequently analyse them (Figure 8) [12]. In other words
computer vision is meant to complement the biological vision and for this reason
definition of the computer vision would be a study of analysis of images and
videos in order to achieve results similar to those obtained by people. It is the
great challenge to develop a computer system that is able to understand what a
human being “see” because it is estimated that human eyes collect about 80%
of information from the environment. The technical definition of computer vision
would be that it is the science of having computers acquire process and analyse
digital images [13].
Figure 8. Acquiring and further analysing an image regarding computer vision (Image taken
from Gonzalez & Woods, Digital Image Processing (2002))

9
Growing image and videos distribution coupled with widespread usage of
cameras, either through desktop computers or mobile devices, contribute to the
fact that today computer vision as an engineering discipline is becoming an
increasingly used tool [13]. The last 40 years, from its first attempt in 1960s,
computer vision is in constant development, doing small steps, but some
already created systems show that for this part of computer science is a bright
future. For example, the development of mechanisms for monitoring visual
objects has enabled the emergence of augmented reality and mechanisms for
monitoring human body have prompted the emergence of a concept called
natural user interface [14].
As a field that includes methods for acquiring, processing, analysing and
understanding images and high-dimensional data, in order to get numerical or
symbolic information, is built upon the learning from diverse scientific areas,
such as that of mathematics, physics, biology, engineering and computer
science. For achieving computer vision goals, descriptions, interpretations or
measurements, many techniques are used, such as image processing and
pattern recognition.
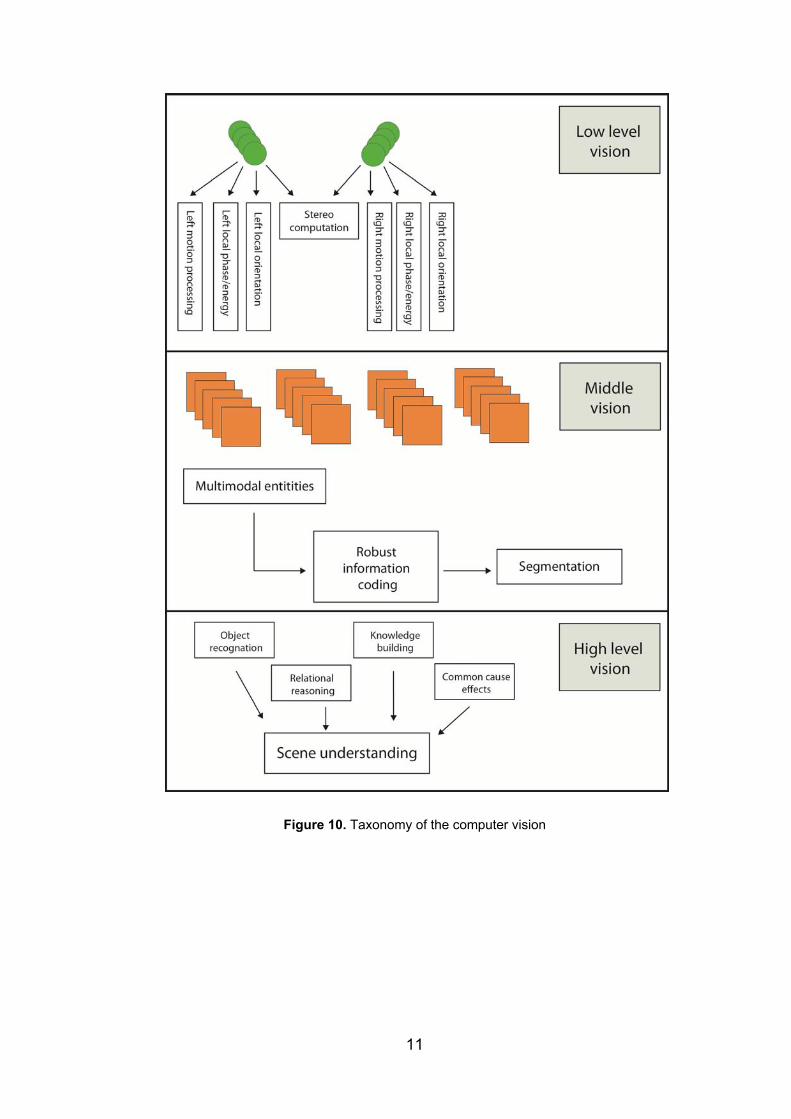
The computer vision is used in robotics, medicine, security, transportation,
industrial automation; image/video databases and human computer interface
(Figure 9) [16].
Figure 9. Connection with other fields

10
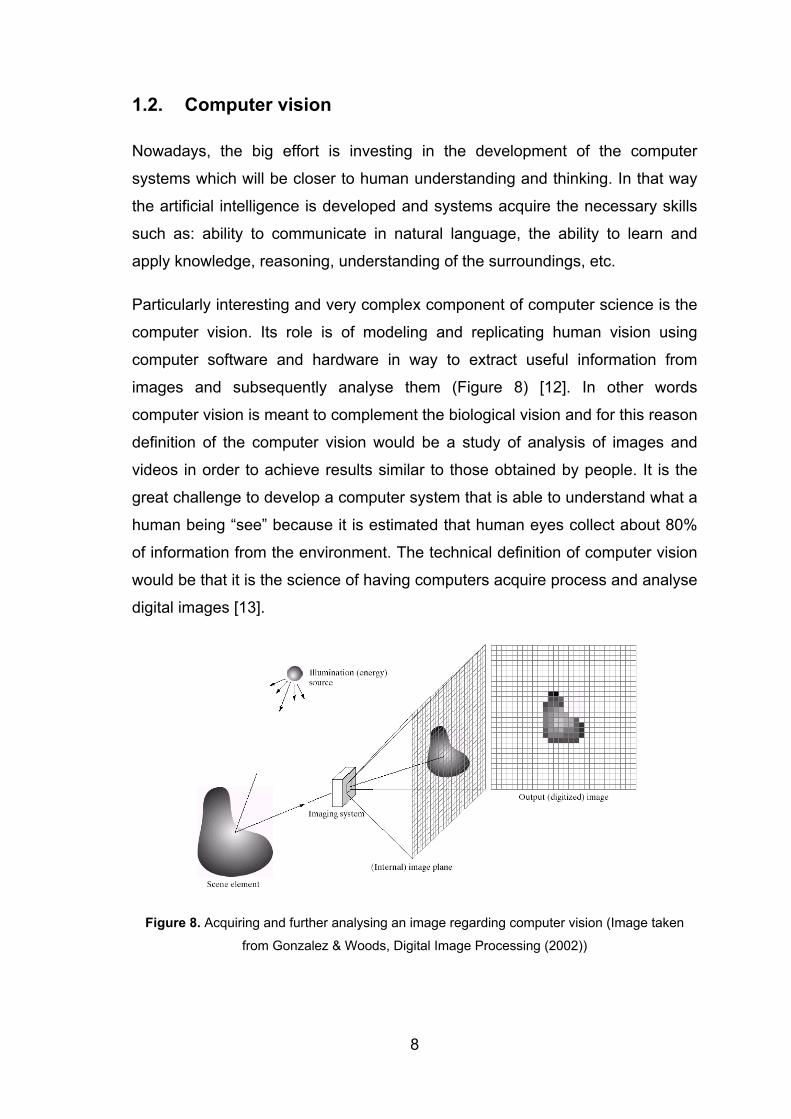
There are known three levels of computer vision: low, mid and high level. Low-
level vision is based on low-level image processing. Its aim is image matching,
optical flow computation and motion analysis. Image matching is used for
finding similarities between two or more images. The motion analysis and
optical flow are related with observing of motion, where optical flow only
measures the optical changes in images. Low-level vision involves tasks in
which the quality of the image is improved for the benefit of human observers,
including useful measurements such as colour, spatial frequency, binocular
disparity, motion processing. Two highly related aspects, inferring the geometry
and inferring the motion, represent mid-level of computer vision. The main
question on which mid-level gives an answer is: “How the object moves?” Also,
mid-level vision involves the processes of feature extraction and pattern
detection tasks. Furthermore, high-level vision deals with object recognition and
there are two possible ways: model-based recognition and learning-based
recognition [15]. High-level vision involves interpretation of scene through
specific tasks such as relational reasoning, knowledge building and object
recognition and as well other tasks to get information required for human
understanding of objects. For design these computer systems in many
applications, a hierarchized approach, is used as shown in Figure 10.
11
Figure 10. Taxonomy of the computer vision
12
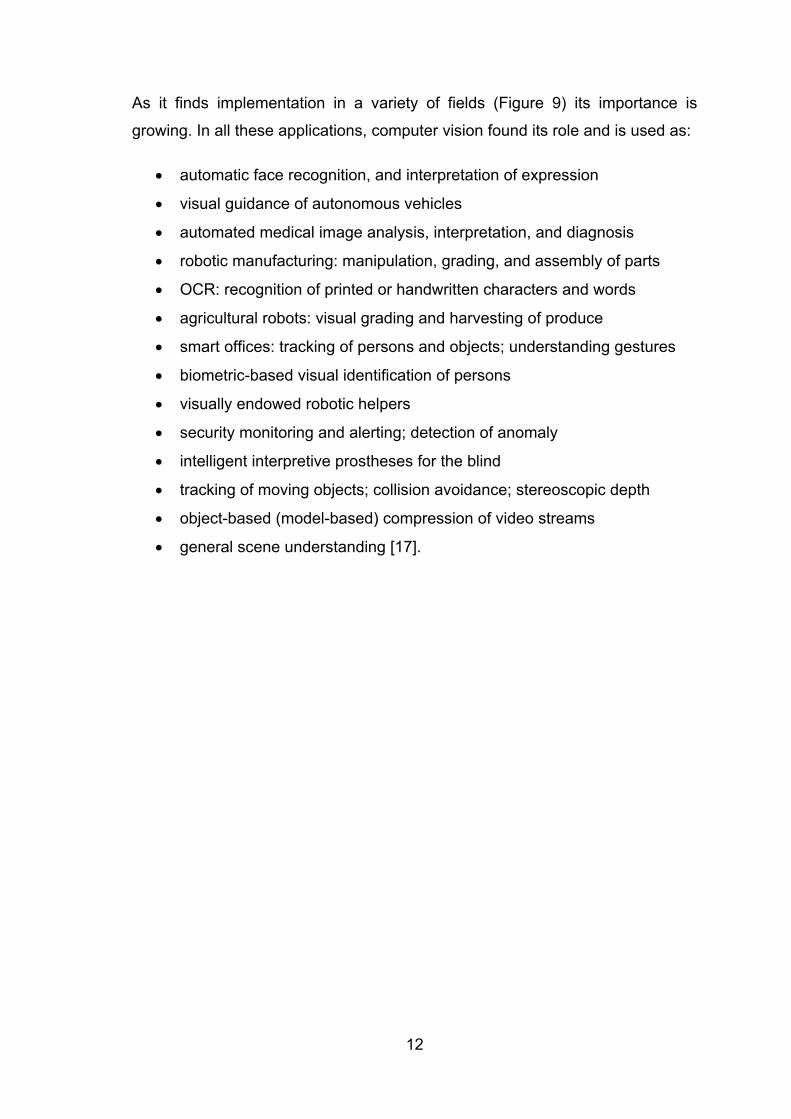
As it finds implementation in a variety of fields (Figure 9) its importance is
growing. In all these applications, computer vision found its role and is used as:
automatic face recognition, and interpretation of expression
visual guidance of autonomous vehicles
automated medical image analysis, interpretation, and diagnosis
robotic manufacturing: manipulation, grading, and assembly of parts
OCR: recognition of printed or handwritten characters and words
agricultural robots: visual grading and harvesting of produce
smart offices: tracking of persons and objects; understanding gestures
biometric-based visual identification of persons
visually endowed robotic helpers
security monitoring and alerting; detection of anomaly
intelligent interpretive prostheses for the blind
tracking of moving objects; collision avoidance; stereoscopic depth
object-based (model-based) compression of video streams
general scene understanding [17].

13
2. State of Art
2.1. Defining the quality level of the printing plate
Quality control is a procedure or set of procedures intended to ensure that
manufactured products meet the quality criteria and requirements of the client.
Mostly, it involves thorough examination and testing the product quality in every
step in the reproduction chain, such as control of the printing plates.
To avoid unwanted consequences in the printing process, it is necessary to
control the quality of the printing plates. Today the quality control is of major
importance in the printing industry. The printing plate is often the last and
sometimes only chance for a visible inspection before starting the printing
process.
Quality control of a printing plate can be conducted by observing the printing
areas, made of photosensitive layer; or by observing the non-printing areas,
made of aluminium-oxide [18]. Many factors affect the quality level such as:
type of photosensitive layer, sensitivity and thickness of the photosensitive
layer, imagesetter, laser power in platesetter, developing process, etc. [19].
Image quality on the printing plate surface is usually controlled by using
different devices for measuring the quality level of the plates. These devices
work on the principle of determining several parameters for monitoring the
quality of printing plates, where the most significant is the surface coverage of
the printing elements.
14
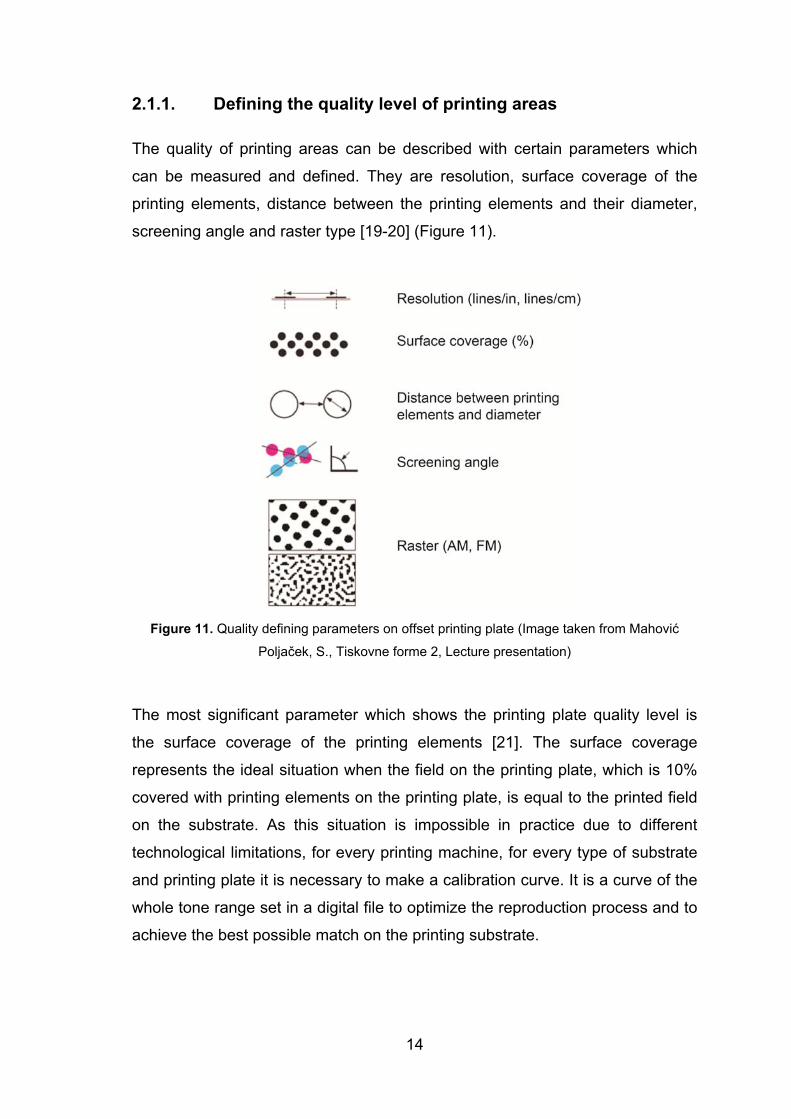
2.1.1. Defining the quality level of printing areas
The quality of printing areas can be described with certain parameters which
can be measured and defined. They are resolution, surface coverage of the
printing elements, distance between the printing elements and their diameter,
screening angle and raster type [19-20] (Figure 11).
Figure 11. Quality defining parameters on offset printing plate (Image taken from Mahović
Poljaček, S., Tiskovne forme 2, Lecture presentation)
The most significant parameter which shows the printing plate quality level is
the surface coverage of the printing elements [21]. The surface coverage
represents the ideal situation when the field on the printing plate, which is 10%
covered with printing elements on the printing plate, is equal to the printed field
on the substrate. As this situation is impossible in practice due to different
technological limitations, for every printing machine, for every type of substrate
and printing plate it is necessary to make a calibration curve. It is a curve of the
whole tone range set in a digital file to optimize the reproduction process and to
achieve the best possible match on the printing substrate.

15
In an ideal situation the curve will be line at an angle of 45° and it is called the
optimal tone reproduction (Figure 12). In optimal tone reproduction the
requirement that the optical density range of the originals (Do) is equal to the
density range on the imprints (Dr) is fulfilled [20].
Figure 12. Optimal A and relative B, C, D tone reproduction (Image taken from Kumar, M.,
Standardizacija izrade I eksploatacija tiskovne forme za plošni tisak (1978))
Considering the fact that ideal situation cannot be achieved, calibration curves
define the possible quality of final printing product and are defined to the image
prior to platemaking. Nevertheless, measuring of the produced plate ensure the
control of tones transformed from a digital file onto the printing plate before the
printing process starts.
2.1.2. Defining the quality level of non-printing areas
In defining the quality level of non-printing areas it is very important to define the
ability of these areas for accepting fountain solution. For this part two
parameters are very important: contact angle and adsorption.

16
Contact angle () defines the level of surfaces wetting and is the angle which
encloses the tangent drawn to the edge of the liquid drop, and the surface of the
solid which is wetted by liquid (Figure 13).
Figure 13. Contact angle
Wetting is a physic-chemical phenomenon which is a result of decrease of the
surface tension forces and depends on the type of solid surface and the liquid.
The surface tension of the liquid is generally less than the surface tension of
solids, so liquids are mainly wetting solids. The measure of wetting solid surface
is the cosine of the contact angle (cos). In the case of complete wetting, the
contact angle is 0 ° or cos = 1. If the contact angle is 180 ° or cos = -1, it
represents non-wetting [4].
During the offset printing process, ink and fountain solution are applied to the
printing plate (Figure 14). The fountain solution is applied first and is very
important for it to show good wettability characteristics. Its role is to cover all
non-printing areas, so that the ink adheres only on the printing areas. For better
wettability characteristics, the additives are added to the fountain solution in
order to decrease its surface tension and the contact angle. Accordingly, the
smaller the contact angle is, the better the wetting.
Figure 14. Relation between photosensitive layer and aluminium oxide with fountain solution
drop
17
Besides wetting, the quality level of non-printing areas can be determined by
observing adsorption of the fountain solution on the non-printing areas.
Adsorption is an accumulation of particles from a liquid or gas on the surface of
a solid or liquid phase.
Adsorption is a reversible process, where the adsorbed particles are detached
from the surface back to the surroundings. This phenomenon is called
desorption.
Type of adsorption which is very important in production of printing plates is
called chemisorption. Chemisorption is an irreversible process which involves a
chemical reaction between the adsorb and the adsorbent which causes
formation of monomolecular or multimolecular layer of a new chemical
compound [22].
2.2. Tools and systems for test quality measuring
2.2.1. Materials and procedure
For this research, 23 printing plates samples have been made in the same
processing conditions by copying control wedge with group of fields of 5%,
10%, 15%, … to 99% coverage value. Printing plate samples were exposed
with metalhalide lamp for 60 impulses. After the exposure, samples were
developed in commercial offset plate developer in a period of 15 seconds.
Those processing conditions were defined by plate manufacturer for used
workflow.
In order to define the printing plate’s quality level, the surface coverage of the
printing elements was observed. The surface coverage can be measured with
devices, designed for controlling of the printing plates, which automatically show
the coverage value or by image analysis software. In this research, both
methods of determining the surface coverage of printing elements were used.

18
Measurements of coverage values were performed by Gretag Macbeth’s IC
Plate II plate reader and repeated five times for each sample. The coverage
values were shown on the display of the portable device and also in the
supported software. Besides this device, measurements were conducted by
meant of VipFLEX, repeated five times for each sample. The results were
shown in supported software.
Moreover, to get images for defining the surface coverage values with image
analysis software, the samples were captured with VipFLEX device. After
capturing images by means of VipFLEX, the obtained images were analyzed in
softwares for image analysis, ImageJ and Matlab.
2.2.2. IC Plate II
Gretag Machbeth IC Plate II is a portable plate reader which provides quick and
accurate quality control (Figure 15). Device has automatic calibration and the
battery life is extended by LED illumination. The power-saving electronics and
LED technology allow up to 30000 measurements per battery set. The
measuring time is 3-4 seconds. Measuring unit is calibrated automatically. It is
equipped with high-resolution camera and is able to capture images of the
printing plate surface.
Figure 15. Gretag Macbeth’s IC Plate II (Image taken from
http://www.idd.tudarmstadt.de/re_search/equipm/characterization_lab/index.en.jsp)

19
IC Plate II can measure a wide variety of plate types, metal and polyester plate,
positive and negative, paper and foil. Also, it can measure and calculate surface
coverage, diameter of printing element, screen resolution and screen angle.
The algorithm built in device eliminates dust and scratches as it reads the
printing plate. Also, screening algorithm allows measuring regular or stochastic
type of raster. There are two measurement modes IC Plate II and Fogra
Measuring Bar (FMB), which can be set in device settings. IC Plate II uses the
specially developed plate measurement algorithm where the dots can be
accurately detected. In Fogra Measuring Bar mode IC Plate II measures
according to the FOGRA standard. In IC Plate II the image analysis algorithms
are used. Type of sensor which is used is CMOS 648 x 488 with sensor
resolution of 12,700 ppi [23].
Figure 16. PlateQuality interface
Belonging software to the IC Plate II is the PlateQuality Software, but the device
can also work independently, showing information on the display (Figure 16).
The software stores, visualizes and document both individual measurements
and plate characteristics curve measurements. PlateQuality Software has
capture tool which allows getting the images and later that plate images can be
compared for a detailed quality analysis [23].

20
2.2.3. VipFLEX
VipFLEX is mainly intended for flexography plates but it can be also used to
measure paper, foils, film and aluminium plates (Figure 17). Measuring system
includes the vipFLEX desktop plate reader and PlateQualityFlexo software. It is
characterized by camera with high resolution and sophisticated image
recognition. One battery set allows up to 50000 measurements. VipFLEX can
measure dot area, dot size, edge factor and mottling. It has possibility that it can
measure AM, FM and hybrid screening. Device is equipped with sensor RGB
camera 640 x 480 with resolution sensor of 10000 ppi. Measuring time is very
fast and it is less than 1 second. VipFLEX has two different measurement
algorithms, chain dot and normal dot. Normal dot algorithm will produce the
surface coverage value and contour factor while chain dot algorithm will only
produce the surface coverage [24].
Figure 17. VipFLEX (Image taken from http://www.mgvcolor.com/vipflex/)
PlateQualityFlexo analyses and gives information about quality of the printing
plate (Figure 18). Also, it gives all required information which can be printed in a
variety of formats or stored in a database. It stores, visualizes, and documents
both individual measurements and plate characteristic curve measurements.

21
Figure 18. PlateQualityFlexo interface (Image taken from http://www.corona-
grafica.com/PDFs/vipFLEX.pdf)
2.2.4. Image analysis
In various scientific fields the image analysis technique is being used, such as
in medicine, astronomy, security, robotics, graphic technology [10]. In image
analysis the input parameter is usually the image and the output parameter is
information, respectively the result of the measurement. Two main steps are
receiving and digitalizing the image followed by processing and analysing of the
image. Microscope, CCD camera and scanner are used for receiving and
digitalizing the image. On the other hand, computer and appropriate software
are used for processing and analysing to obtain results [25].
In graphic technology image analysis is used for examinations of imprints,
substrates and printing plates. Analysing final imprint with an image analysis
method is acceptable as a tool for control and examination of the reproduction
processes [26]. Also, it is used to identify impurities in substrates. Analysing the
microscopic images of the surface one can define the surface coverage of
printing elements on the printing plate.
In this research, the image analysis is used for determining the surface
coverage of printing elements on the printing plates. Firstly, the samples of the
printing plate were captured with VIPFlex device. As software for image

22
analysis and processing, Wayne Rasband’s ImageJ is used. Beside ImageJ
Matlab software was also used in image analysis.
2.2.4.1. ImageJ
ImageJ is software used for image processing and image analysis, created at
the National Institutes of Health by Wayne Rasband. It is free public software
based on Java [27]. In 1986 American programmer defined essential users’
freedoms: user has the freedom to run the program for any purpose. Also, the
user has the freedom to study how the program works and, change it or
improve it, and release his improvements to the public. The user is able to
redistribute copies, so anyone can use it.
ImageJ is possible to install on every computer which use Java 1.4 application.
With ImageJ, it is possible to display, edit, analyze, process, save and print 8-
bit, 16-bit and 32-bit images. This program accepts different formats of images
including TIFF, PNG, JPEG, GIF, BMP and many more. Also, ImageJ has a
range of 256 possible shown pixel values [28].
Because of its features and opportunities it offers, ImageJ has application in
many scientific fields. Functions of the ImageJ can be modified by extras written
in Java and applied in program. ImageJ is able to calculate the surface
coverage and pixel value. It can measure distances, angles and create
density histograms. Also it can perform standard image processing operations
such as contrast manipulation, sharpening, smoothing, edge detection, median
filtering, scaling, rotation and flips.
One of the options provided by the ImageJ is determination of the surface
coverage. For getting the percentage of surface coverage with ImageJ, it is
necessary to convert a multitone image into a duotone image in order to
maximize the contrast between the printing and non-printing elements. For
staining duotone images, a command Process – Binary – Make binary is used
(Figure 19). After converting the images, the appearance of the noise is
23
possible; this may interfere with accurate determination of the surface coverage.
To remove the noise, Process – Noise – Despeckle command is used.
Figure 19. Capture of the sample used in image analysis
After converting image to binary mode the results were provided in two ways.
First way was by using circular window and changing its size for 10%, and
another was rectangular window. In both ways the coverage was measured for
10 times and then the main values were calculated. The results of analysis are
given in results window and can be saved and printed (Figure 20). Selection of
data shown in the result box can be adjusted with Analyse – Set Measurements
command. Related to the percentage of surface coverage are Area and Area
fraction commands, which must be activated.
Figure 20. Interface of the ImageJ software

24
2.2.4.2. Matlab tool used in this work.
The name of very well-known Matlab tool (widely used in academic and
research institutions as well as industrial enterprises) comes from Matrix
Laboratory, it is a numerical computing based environment and fourth-
generation programming language, developed by MathWorks. This environment
provides matrix manipulations, implementation of algorithms, plotting of
functions and data, creation of user interfaces, and interfacing with programs
written in other languages, including C, C++, Java, and Fortran among other
features.
Matlab is provided by some toolboxes regarding different disciplines and topics,
focusing in Computer Vision Toolbox, it allows design and simulation of
computer vision and video processing systems with a set of different algorithms
and tools such as feature extraction, motion detection, object detection, object
tracking, stereo vision, video processing, video analysis, etc.
In this presented work, we have not used the Image Processing toolbox, since
we have constructed our Matlab scripts as close as possible to just raw C, for
sake of portability to the hardware stage (ARM v7 processor) as it will be shown
further.

25
3. Methodology
3.1. Architecture of the system proposed and Stimuli used
In this section are described the methods and strategies performed for
measuring the quality of printing plates.
3.1.1. First strategy
Quality of the printing plates can be obtained in different ways and one of them
is using computer vision algorithms. In computer vision algorithms the captured
images of the printing plate surface were used. Computer vision algorithm
which is used in first strategy is less complex and in only three steps gives the
results of surface coverage counting black and white pixels.
Figure 21. Flow chart from first method implemented
The first strategy (Figure 21) is based on image segmentation which plays an
important role in image analysis and computer vision system. The image
segmentation is separating objects, in this case printing elements, from the
background. Among all segmentation techniques, the automatic thresholding
methods are widely used because of their advantages of simple implement and

26
time saving. The basic idea of automatic thresholding is to automatically select
an optimal or several optimal gray-level threshold values for separating objects
of interest in an image from the background based on their gray-level
distribution. For image segmentation the simple and effective Otsu method was
used. Otsu method is one of thresholding methods which calculate the optimum
threshold separating objects and background so that their combined spread is
minimal.
Otsu method computes a global threshold (level) that can be used to convert a
real time image to a binary image. Level is a normalized intensity value that lies
in the range [0,1]. Otsu method chooses the threshold to minimize the intraclass
variance of the threshold black and white pixels. It applies an automatic
threshold in order to segment efficiently the image; it is based by a discriminant
criterion to optimize the function of separation of obtained classes in gray levels.
We describe very briefly the method used:
If supposing every pixels form an image represented by gray levels [1,2,..,L],
number of the pixels at level L is denoted by ni and the total number of pixels by
N. The gray-level histogram is normalized regarding a probability distribution
expression:
/ , 1
L
i i ii
p n N p (1)
Assuming a classification of pixels in two classes C0 and C1 (objects and
background) by a threshold level k, where pixels with levels [1,…k] belongs to
C0 and pixels with levels [k+1,..,L] belongs to C1. The probabilities of the class
occurrence and class means levels are written by:
0 0
0
Pr( )k
ii
w C p
; 1 11
Pr( )L
ii k
w C p
(2)

27
0 01 1
Pr( ) /k k
i oi i
i i C ip w
;
1 1 11 1
Pr( ) /L L
ii k i k
i i C ip w
(3)
In this step, we are ready to define the following relation for the choice of k, and
the variance based on first order statistics (class means):
0 1 1 1; 1T o ow w w w (4)
22 ( ) ( )( )
( )[1 ( )]T
B
w k kk
w k w k
(5)
The optimal threshold k* that maximizes σB2 is being selected by this sequential
search using the cumulative quantities expressed in (1) and (2).
2 * 2 *0 1
1( ) max ( ); S ; ( )[1 ( )] 0B B
k Lk k k w w w k w k
; (6)
The result of image segmentation is an image in binary mode, converted to
black and white pixels which indicate what is printing element and what is
background. The second step includes cropping binarize images applying
circular and rectangular window. The circular and rectangular windows were
applied for 10 times and each time the size of the window was changed keeping
the proportions with the size of the image. In the last step, the algorithm was

28
counting black and white pixels on the 10 circular and rectangular shape
images and making the main value of the 10 results.
3.1.2. Second strategy
The second strategy that was used is more complex than the first one. It
consists of six different steps to obtain the printing plate quality results. The
image was captured by means of VipFLEX device and because of the
deficiency of this way of capturing; on the edges of the images the noise was
appeared. To avoid unwanted noise the real time image was cropped in
rectangular shape keeping proportion of width and height with the real image.
The next step is binarizing the image which means to make image
segmentation with Otsu method which is explained previously. Otsu method
computes a global threshold (level) that can be used to convert a real time
image to a binary image, after that, this Level is a normalized intensity value
that lies in the range [0,1]. Otsu method chooses the threshold to minimize the
intraclass variance of the threshold black and white pixels.
The third step is edge detection using Sobel operator which is used in image
processing, particularly in edge detection algorithms. The Sobel operator is an
algorithm which in a clear way discovers the boundaries between regions in an
image. It works on the basis of the image gradient which is a change in intensity
(or color) of an image. An edge in an image occurs when the gradient is greater
and the Sobel operator makes use of this fact to find the edge in an image. The
Sobel operator calculates the approximate image gradient of each pixel by
convolving the image with a pair of 3x3 filters. The filters estimate the gradients
in the horizontal and vertical directions.
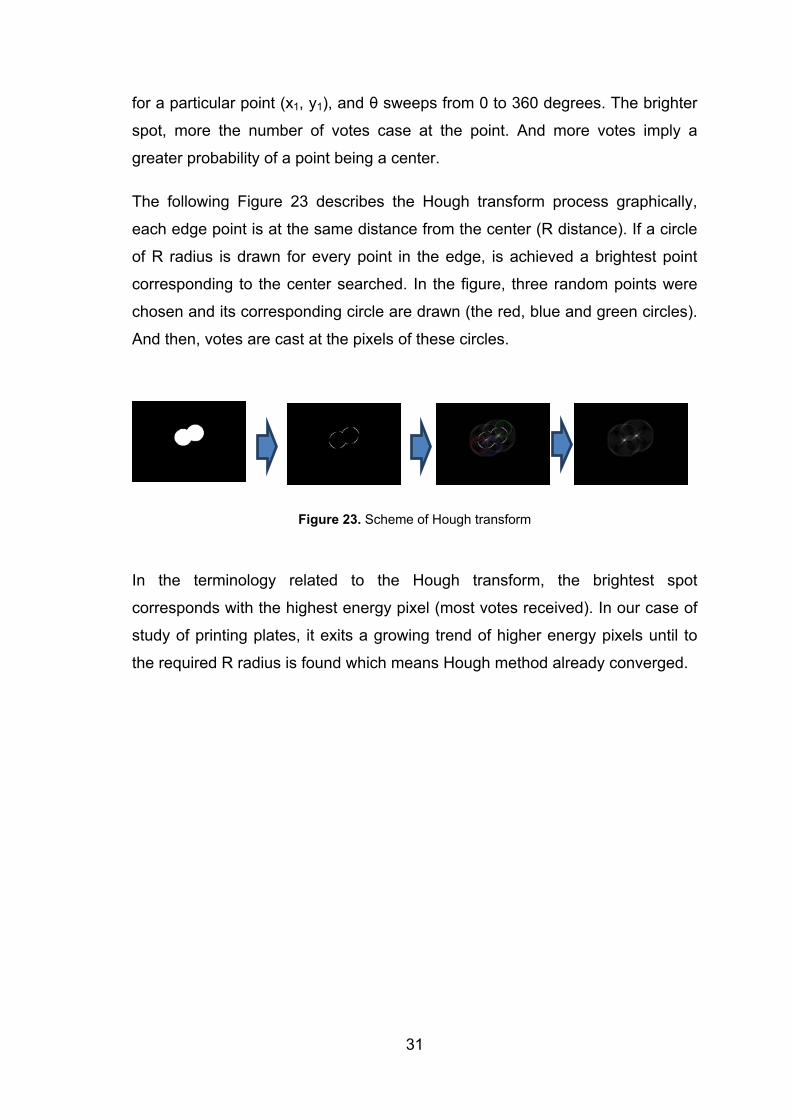
In the next step the Hough transform is used which is a method for detecting
curves by exploiting the duality between points on a curve and parameters of
that curve. The process of identifying possible circular object is relatively simple.
Hough transform technique first creates accumulator space which is made of a

29
cell for each pixel. For each edge point in image, for each pixel is calculating the
right radius. The calculating stops when the algorithm finds a center of the
looking circle which is the intersection of all circles which have center in the
edge of the object.
In the fifth step the algorithm is defining the threshold, the boundary which
separates correct circles from the not correct. The threshold is defined by
equation which is related with actual circle (candidate) and the circle which is
following the actual:
1
(7)
If the threshold is lower than the coverage ratio, then the circle is not
acceptable, the system removes that circle. This step is necessary to remove
eventually noise on the binary images to obtain good quality results.
Since the last step, all circles which represent printing elements should be
recognized by the algorithm. If any circle is not recognized, algorithm calculates
the distance between the centers of two neighboring circles. Also, beside
distance, algorithm also calculates the angle so that the system can replace if
any circle is missing. We have a summary of the flow chart in the Figure 22.

30
Figure 22. Flow chart from second method implemented
Within the whole process, the Hough transform is the most important stage
since it is responsible for obtaining the circle centers and their radius.
Hough transform is based on the assumption that circles have a particular R
radius. If the equations of each circle are:
(8)
(9)
Every point in the (x,y) space will be equivalent to a circle in the (a,b) space (R
isn’t a parameter, we already know it). This is because on rearranging the
equations, we get:
(10)
(11)
31
for a particular point (x1, y1), and θ sweeps from 0 to 360 degrees. The brighter
spot, more the number of votes case at the point. And more votes imply a
greater probability of a point being a center.
The following Figure 23 describes the Hough transform process graphically,
each edge point is at the same distance from the center (R distance). If a circle
of R radius is drawn for every point in the edge, is achieved a brightest point
corresponding to the center searched. In the figure, three random points were
chosen and its corresponding circle are drawn (the red, blue and green circles).
And then, votes are cast at the pixels of these circles.
Figure 23. Scheme of Hough transform
In the terminology related to the Hough transform, the brightest spot
corresponds with the highest energy pixel (most votes received). In our case of
study of printing plates, it exits a growing trend of higher energy pixels until to
the required R radius is found which means Hough method already converged.

32
4. Results
4.1. Comparison and critical evolution
Figure 24 represents the images of characteristic fields of the printing plate
samples captured with different devices. The differences between images are
visible. Wedge presents the digital data which was generated for this paper. IC
Plate II and VipFLEX present images processed by IC Plate II and VipFlex
devices. ImageJ and Matlab present bitmap-images obtained by tone and
contrast adjustments. Therefore, one can conclude that each system uses
different types of algorithms for image analysis. According to that, the deviations
in the measurement results were expected.
Figure 24. Images of selected printing plate’s testing fields obtained by different systems

33
4.1.1. First strategy
Results of the coverage value measurements were obtained by using six
different measuring methods. For each sample the mean value was calculated
and the results can be seen in Table 1.
Table 1. Nominal and calculated coverage values
Nominal
values VipFLEX
IC Plate
II
ImageJ
(rectangle)
ImageJ
(circle)
Matlab
(rectangle)
Matlab
(circle)
0 0 0 6,052 4,637 5,183756083 5,23845873
5 1,32 1,1 5,893 5,184 5,303175069 5,81268804
10 3,48 3,54 5,986 6,108 5,968611725 6,66428341
15 7,32 6,68 8,053 8,141 8,149617467 8,54573225
20 10,96 9,84 14,404 13,543 15,809588 14,9088104
25 13,42 12,74 20,295 20,156 20,1902172 21,4752333
30 18,18 16,4 25,582 25,783 25,43315558 26,1085041
35 21,74 19,64 31,295 32,002 31,38582242 31,6429309
40 26,36 25,66 37,633 38,105 38,85946267 38,3818144
45 33,44 32,72 43,47 44,276 47,052289 44,8195896
50 38,24 38,88 48,775 49,513 48,06449592 48,3070892
55 44,38 45 55,251 56,107 55,63096608 55,4372752
60 52,28 51,62 59,297 59,187 63,275684 61,5942289
65 57,8 56,84 68,915 66,754 63,280043 66,3678112
70 64 63,08 70,912 73,146 69,96095433 70,9582246
75 69 69,32 78,515 78,434 80,57859975 78,8366476
80 75,8 75,16 81,939 82,579 82,68225142 82,1476209
85 81,06 80,48 83,699 86,047 83,42537442 83,8971929
90 87,26 86,52 87,014 88,292 89,440541 88,6698728
95 93,72 93,1 88,967 91,422 90,5437065 89,5879719
97 95,74 95,26 89,801 93,868 93,46326708 91,8110795
98 96,72 96,26 98,025 98,901 98,97629158 98,4084772
99 97,64 97,22 89,428 96,704 95,36123475 92,8174954

34
The mean values of surface coverage values were showed in graphic diagram
which represent the reproduction of a whole tone scale (Figure 25). One can
see that results calculated with Matlab and ImageJ differ from other methods for
coverage calculation. The deviations can be explained through three areas.
The first one deviation is visible up to 15% of coverage (highlights) where
Matlab and ImageJ results are higher than others. Second deviation is visible
from 20 to 90% of coverage where Matlab and ImageJ results are higher than
others too. And finally, third deviation can be seen in shadows (over 90%).
There are two points of values equality calculated from all methods: at about
15% and 90% of coverage.
Figure 25. Comparison of nominal and measured coverage values obtained with different
methods from 0% to 99% coverage values
For detailed preview, results were showed in two graphic diagrams, divided
from 0% to 50% and 50% to 99% coverage values. Figure 26 shows the results
of surface coverage values of first half of tone scale obtained with six methods.
One can see that there are deviations between methods, especially between
results measured with devices and results calculated with the image analysis
0
20
40
60
80
100
120
0 10 20 30 40 50 60 70 80 90 97 99
Cal
cula
ted
co
vera
ge
valu
es (
%)
Nominal coverage values (%)
VipFLEX
IC Plate
ImageJ - rectangle
ImageJ - circle
MATLAB - rectangle
MATLAB - circle

35
software. Results obtained with devices VipFLEX and IC Plate II have the same
results from 0% to 15% of coverage. There are deviations in results between
15% and 40% of coverage which means that these areas cannot be measured
correctly. After 40% of coverage the results measured with devices are the
same. In the first half of tone scale are deviation between the image analysis
software and devices with one exception when the results are the same at 15%
of coverage. The possible reason for those deviations is in the usage of real
images of printing plate samples. The images captured with VipFLEX had round
noises on the edges because of the way they were captured.
Figure 26. Comparison of nominal and measured coverage values obtained with different
methods from 0% to 50% coverage values
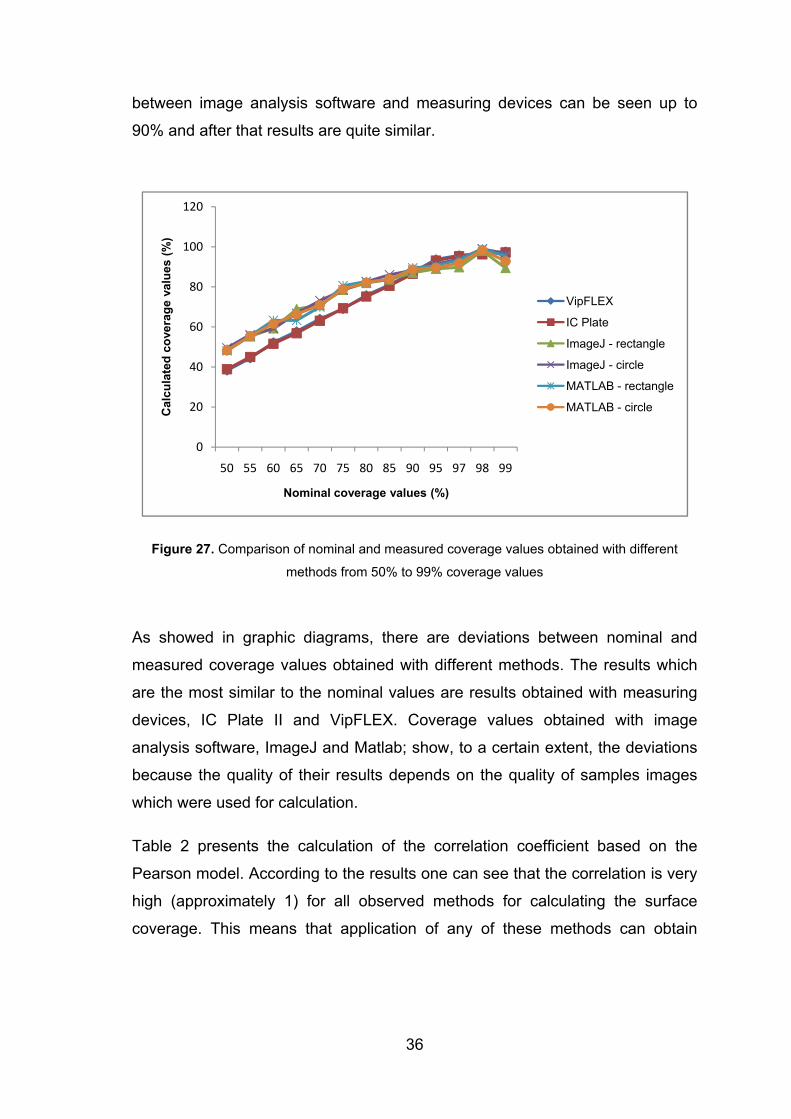
In Figure 27 one can see the relation between measured and nominal coverage
values for higher tone scale values (coverage values from 50% to 100%).
Measuring performed by using devices showed the same results, as the one
measured in highlights, but there are some deviations in the area from 95% to
98% which means that that area cannot be measured correctly. The deviations
0
10
20
30
40
50
60
0 5 10 15 20 25 30 35 40 45 50
Cal
cula
ted
co
vera
ge
valu
es (
%)
Nominal coverage values (%)
VipFLEX
IC Plate
ImageJ - rectangle
ImageJ - circle
MATLAB - rectangle
MATLAB - circle
36
between image analysis software and measuring devices can be seen up to
90% and after that results are quite similar.
Figure 27. Comparison of nominal and measured coverage values obtained with different
methods from 50% to 99% coverage values
As showed in graphic diagrams, there are deviations between nominal and
measured coverage values obtained with different methods. The results which
are the most similar to the nominal values are results obtained with measuring
devices, IC Plate II and VipFLEX. Coverage values obtained with image
analysis software, ImageJ and Matlab; show, to a certain extent, the deviations
because the quality of their results depends on the quality of samples images
which were used for calculation.
Table 2 presents the calculation of the correlation coefficient based on the
Pearson model. According to the results one can see that the correlation is very
high (approximately 1) for all observed methods for calculating the surface
coverage. This means that application of any of these methods can obtain
0
20
40
60
80
100
120
50 55 60 65 70 75 80 85 90 95 97 98 99
Cal
cula
ted
co
vera
ge
valu
es (
%)
Nominal coverage values (%)
VipFLEX
IC Plate
ImageJ - rectangle
ImageJ - circle
MATLAB - rectangle
MATLAB - circle

37
reliable results. However, in graphic diagrams one can see deviation in
measured coverage values, especially between 15% and 90% (Figure 25).
Table 2. Pearson correlation coefficient
Correlation Correlation coefficient
VipFlex: IC Plate 0,9998
IC Plate: ImageJ(rectangle) 0,9885
IC Plate: ImageJ(circle) 0,9919
IC Plate: Matlab (rectangle) 0,9909
IC Plate: Matlab (circle) 0,9906
VipFlex: ImageJ(rectangle) 0,9885
VipFlex: ImageJ(circle) 0,9920
VipFlex: MatLAB(rectangle) 0,9908
VipFlex: MatLAB(circle) 0,9907
ImageJ(circle): ImageJ(rectangle) 0,9989
Matlab (circle): Matlab (rectangle) 0,9994
ImageJ(circle): Matlab (circle) 0,9994
ImageJ(rectangle): Matlab (rectangle) 0,9979
For further analysis of results the standard deviations was calculated. Since
VipFLEX and IC Plate II are devices designed for measuring of printing plates
quality the standard deviation between their results were calculated firstly. The
results are shown in Figure 28 where ∆d presents difference between coverage
values measured by IC Plate II and VipFLEX:
∆d = coverage value (IC Plate II) - coverage value (VipFLEX). (12)
One can see that correlation is good, so for the further calculating it is not
important which method will be chosen. Since the IC Plate II device is

38
specialized for offset printing measurements, it will be used in further
calculations.
Figure 28. Comparison of coverage values calculated by VipFLEX and IC Plate II
As we can see in Figure 28, and was seen in diagrams in Figures from 25 to 27
the correlation coefficient is high (0,9998). According to those results one can
conclude that there are no differences in calculation of surface coverage
obtained by those devices. They can be used separately in analysis of offset
printing plate quality and will give the optimal and same result of coverage.
Since the IC Plate II device is specialized for offset printing measurements, that
results were used in further calculations.
Figure 29 shows difference between coverage values measured by IC Plate II
and calculated with ImageJ (circle and rectangle) and Matlab (circle and
rectangle). One can see that certain differences are present. It was expected as
the results of the coverage presented in Figure 25 showed similar differences.
Since the ImageJ and Matlab are used for calculation of surface coverage
based on image analysis their results were compared and shown in Figure 30.
0
0,5
1
1,5
2
2,5
3
3,5
4
4,5
5
0 20 40 60 80 100
∆d
(%
)
Nominal coverage values (%)
VipFLEX - IC Plate II
Poly. (VipFLEX - IC Plate II)

39
Figure 29. Comparison of coverage values calculated by IC Plate II, ImageJ (circle and
rectangle) and Matlab (circle and rectangle)
Figure 30. Comparison of coverage values calculated by ImageJ (circle and rectangle) and
Matlab (circle and rectangle)
‐13
‐8
‐3
2
7
0 20 40 60 80 100
∆d
(%
)
Nominal coverage values (%)
Poly. (IC Plate II - ImageJ - rectangle)
Poly. (Ic Plate II - ImageJ - circle)
Poly. (IC Plate II -MATLAB - rectangle)
Poly. (IC Plate II - MATLAB - circle)
‐8
‐6
‐4
‐2
0
2
4
6
8
0 20 40 60 80 100∆d
(%
)
Nominal coverage values (%)
Poly. (ImageJ - circle - ImageJ - rectangle)
Poly. (MATLAB - circle - ImageJ - circle)
Poly. (MATLAB - circle - MATLAB - rectangle)
Poly. (MATLAB -rectangle - ImageJ -rectangle)

40
4.1.2. Second strategy
The main objective of this strategy is to create an expert system which could
determine the original circles plate and thus can come to assess the strain that
has been in use. The following items summarize the steps involved in this
strategy, which were described in detail in section 3.1.2.:
1. Initially, the image is cropped in order to eliminate possible aberrations
due to lens in capture processing,
2. The input image cropped is now segmented by means of Otsu method,
3. Circle edges are extracted using Sobel operator,
4. Hough transform is performed that allows catching circles centers and
their radius,
5. A refinement step is applied in order to disposal invalid circles,
6. An extrapolation mythology of resulting centers is done and final quality
analysis of the resulting image is performed.
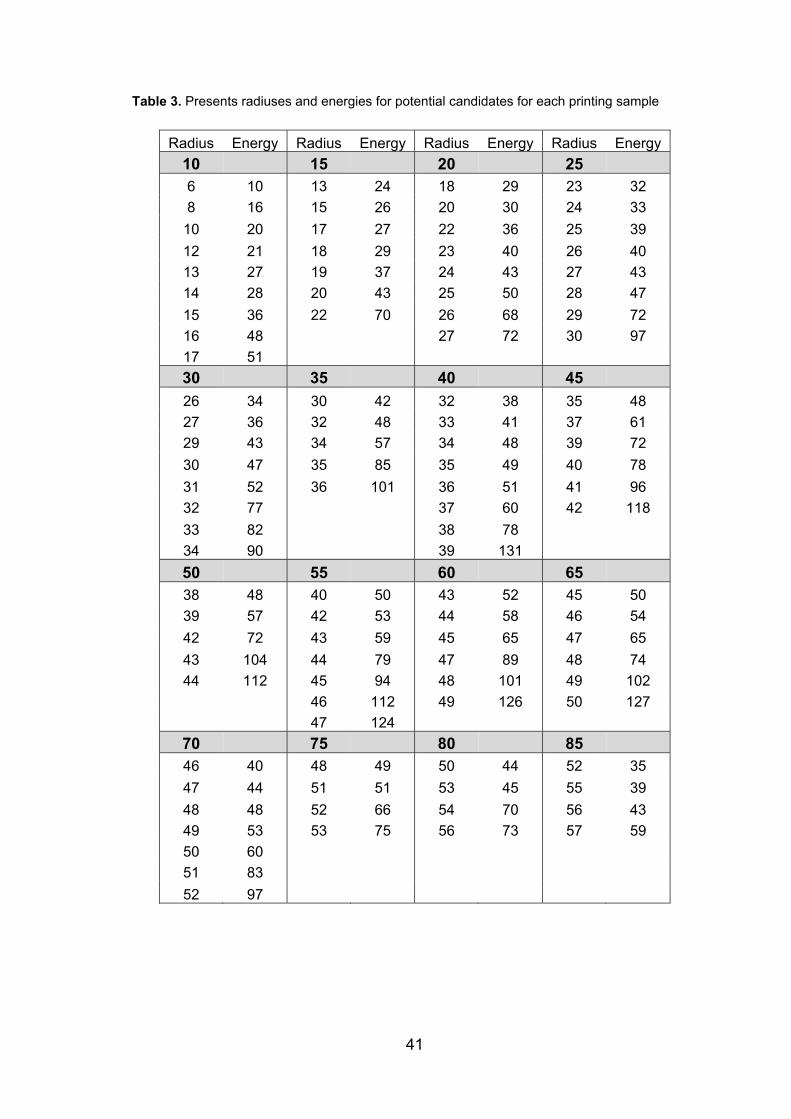
Table 3 presents the measures in terms of energy for different printing plates,
where it is specified radius and its corresponding energy. The more energy
index determined by one hand the more accurate radius and on the other hand
the high probability of a center found.
41
Table 3. Presents radiuses and energies for potential candidates for each printing sample
Radius Energy Radius Energy Radius Energy Radius Energy
10 15 20 25 6 10 13 24 18 29 23 32 8 16 15 26 20 30 24 33
10 20 17 27 22 36 25 39 12 21 18 29 23 40 26 40 13 27 19 37 24 43 27 43 14 28 20 43 25 50 28 47 15 36 22 70 26 68 29 72 16 48 27 72 30 97 17 51 30 35 40 45
26 34 30 42 32 38 35 48 27 36 32 48 33 41 37 61 29 43 34 57 34 48 39 72 30 47 35 85 35 49 40 78 31 52 36 101 36 51 41 96 32 77 37 60 42 118 33 82 38 78
34 90 39 131
50 55 60 65 38 48 40 50 43 52 45 50 39 57 42 53 44 58 46 54 42 72 43 59 45 65 47 65 43 104 44 79 47 89 48 74 44 112 45 94 48 101 49 102
46 112 49 126 50 127 47 124
70 75 80 85 46 40 48 49 50 44 52 35 47 44 51 51 53 45 55 39 48 48 52 66 54 70 56 43 49 53 53 75 56 73 57 59 50 60 51 83 52 97

42
90 95
53 32 58 30
54 33 59 32
56 38 60 33
57 40 63 41
58 43
60 47
61 49
The Figure 31 shows correlation between radius and energy. It is evident that
radius will grow when coverage values increase. Energy is higher for middle
coverage values, when in the highlights and the shadows it is low. The reason
of polygonal trendline comes from energy results, and the fact is that system
detects the background as printing element instead of circles after 50% of
coverage.
Figure 31. Radius and energy obtained for the different printing plates
0
20
40
60
80
100
120
140
0 20 40 60 80 100
∆d
(%
)
Nominal coverage values (%)
Radius
Energy
Linear (Radius)
Poly. (Energy)

43
After obtaining the candidate centers, it is proceeded to eliminate those we
consider invalid respect to a quality metric. This metric corresponds to a
threshold value equation described (7). Figure 32 shows on one hand the
number of centers obtained with Hough transform (in blue bars) and those that
remain after applying the aforementioned quality metric (in brown bars). Finally,
we estimate the centers missing to complete the picture by generating a regular
pattern extrapolating the distance between centers and their orientations. The
total number of centers, either estimated or those remained from the previous
phase are shown with the green bar.
Figure 32. Number of center obtained with Hough (blue bar), after false center removal (red
bar) and final estimation of new centers (green bar)
0
5
10
15
20
25
30
35
40
45
50
0 5 10 15 20 25 30 35 40 45 50 55 60 65 70 75 80 85
# ce
nte
rs
Nominal coverage values (%)
Centers with Hough
Remove false centers
Add estimated centers

44
Figure 33. Results of total coverage obtained with first and second strategy
Finally, Figure 33 highlights the results of the total coverage for first and second
strategy used.
The application of the second strategy could be seen in Figure 34 where system
calculated the distance and angle between the centers of two neighboring circle
on the images of 15% and 75% of surface coverage. Because of the dust on
printing plate sample during the capturing process, the noise is present on the
images and the printing elements could not be seen on this part. According to
this, system measured the distance and the angle between printing elements so
it can interpolate new element on this place.
0%
10%
20%
30%
40%
50%
60%
70%
80%
90%
100%
0 5 10 15 20 25 30 35 40 45 50 55 60 65 70 75 80 85
Cal
cula
ted
co
vera
ge
valu
es
(%)
Nominal coverage values (%)
First strategy
Second strategy
Poly. (First strategy)
Poly. (Second strategy)

45
Figure 34. Noise part before and after system's calculating
Table 4. Pearson correlation model for second strategy
Correlation Correlation coefficient
VipFLEX: Matlab (second strategy) 0,9844
IC Plate II: Matlab (second strategy) 0,983377
ImageJ (retangle): Matlab (second strategy) 0,994839
ImageJ (rcircle): Matlab (second strategy) 0,995164
Table 4 presents the calculation of the correlation coefficient based on the
Pearson model. According to the results, the correlation is very high
(approximately 1) for all observed methods for calculating the surface coverage.
This fact means that application of any of these methods can obtain reliable
results.

46
Figure 35. Comparison of nominal and measured coverage values obtained with different
methods
Figure 36. Comparison of nominal and measured coverage values obtained with ImageJ (circle
and rectangle) and Matlab – second strategy
Figures 35 and 36 present comparison between different methods including
‘Matlab-second strategy’ which gets the surface coverage values. Due to the
comparison graphic diagrams one can see the deviation between Matlab –
0
10
20
30
40
50
60
70
80
90
100
0 20 40 60 80 100
Cal
cula
ted
co
vera
ge
valu
es (
%)
Nominal coverage values (%)
VipFlex
IC Plate II
ImageJ - rectangle
ImageJ - circle
MATLAB - second strategy
0
10
20
30
40
50
60
70
80
90
100
0 20 40 60 80 100
Cal
cula
ted
co
vera
ge
valu
es
(%)
Nominal coverage values (%)
ImageJ - rectangle
ImageJ - circle
MATLAB - second strategy

47
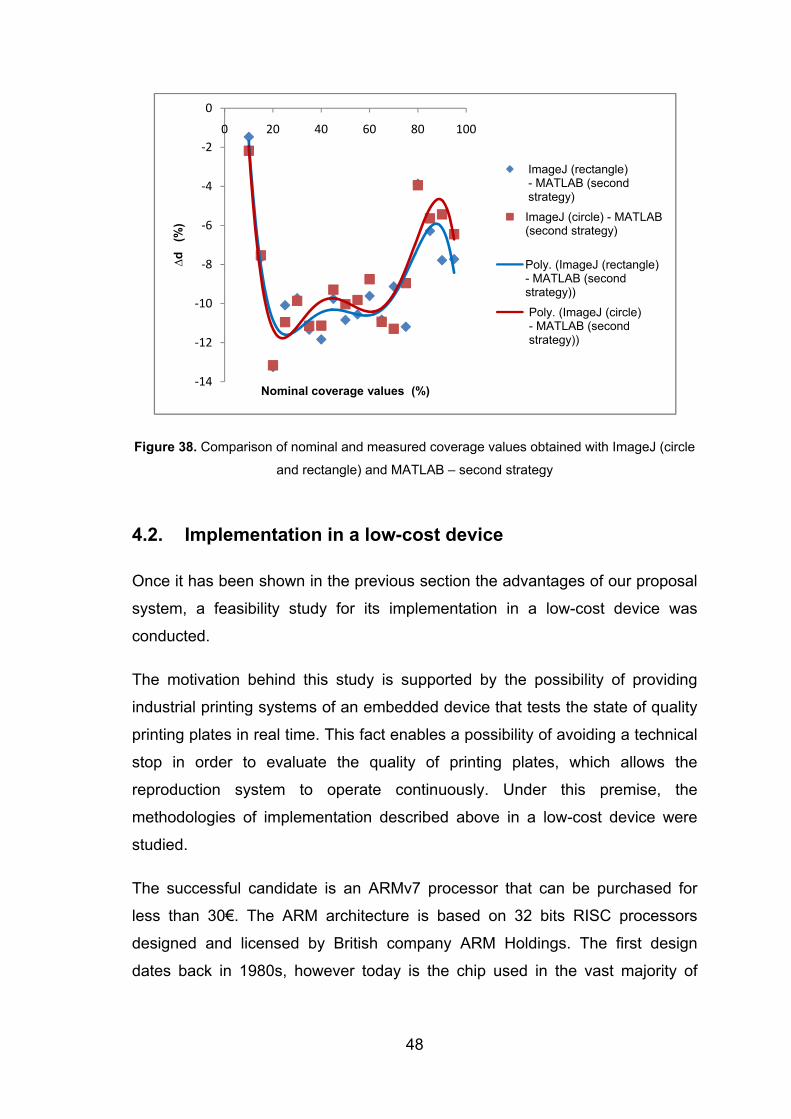
second strategy and other used methods. Focusing just on image analysis
software, as shown in Figures 37 and 38, the deviation is noticeable and Matlab
– second strategy coverage values are approximately 15% higher than with
ImageJ software. In Figures 37 and 38 ∆d presents difference between coverage
values measured by IC Plate II, VipFLEX, ImageJ (circle and rectangle) and Matlab
(second strategy):
∆d = coverage value (VipFLEX) - coverage value (Matlab - second strategy), (13)
∆d = coverage value (IC Plate II) - coverage value (Matlab - second strategy), (14)
∆d = coverage value (ImageJ - circle) - coverage value (Matlab - second strategy), (15)
∆d = coverage value (ImageJ - rectangle) - coverage value (Matlab - second
strategy),
(16)
∆d = coverage value (VipFLEX) - coverage value (Matlab - second strategy). (17)
Figure 37. Comparison of nominal and measured coverage values
‐25
‐20
‐15
‐10
‐5
0
0 20 40 60 80 100
∆d
(%
)
Nominal coverage values (%)
VipFLEX - MATLAB (second strategy)
IC Plate II - MATLAB (second strategy)
ImageJ (rectangle) - MATLAB (second strategy)
ImageJ (circle) - MATLAB (second strategy)
Poly. (VipFLEX - MATLAB (second strategy))
Poly. (IC Plate II - MATLAB (second strategy))
Poly. (ImageJ (rectangle) - MATLAB (second strategy))
48
Figure 38. Comparison of nominal and measured coverage values obtained with ImageJ (circle
and rectangle) and MATLAB – second strategy
4.2. Implementation in a low-cost device
Once it has been shown in the previous section the advantages of our proposal
system, a feasibility study for its implementation in a low-cost device was
conducted.
The motivation behind this study is supported by the possibility of providing
industrial printing systems of an embedded device that tests the state of quality
printing plates in real time. This fact enables a possibility of avoiding a technical
stop in order to evaluate the quality of printing plates, which allows the
reproduction system to operate continuously. Under this premise, the
methodologies of implementation described above in a low-cost device were
studied.
The successful candidate is an ARMv7 processor that can be purchased for
less than 30€. The ARM architecture is based on 32 bits RISC processors
designed and licensed by British company ARM Holdings. The first design
dates back in 1980s, however today is the chip used in the vast majority of
‐14
‐12
‐10
‐8
‐6
‐4
‐2
0
0 20 40 60 80 100
∆d
(%
)
Nominal coverage values (%)
ImageJ (rectangle) - MATLAB (second strategy)
ImageJ (circle) - MATLAB (second strategy)
Poly. (ImageJ (rectangle) - MATLAB (second strategy))
Poly. (ImageJ (circle) - MATLAB (second strategy))

49
mobile devices representing 95% of smartphones, 35% of digital televisions and
set-top boxes and 10% of mobile computers. The relevance of this processor is
well demonstrated by net sales in 2010 with more than 6.1 billion shipments of
ARM-based processors.
Figure 39. Scheme of the low-cost system
For this work we have used a system based on Carma platform [29] from SECO
company [30] which integrates as CPU an NvidiaTegra with 3 Quad-Cores ARM
A9. As GPUs it contains an NvidiaQuadro 1000M with 96 CUDA cores. In
Figure 39 is represented a scheme of the low-cost prototyping board that
contains the ARM’s processor to be programmed.
The first study carried out corresponds to the processing times of the second
strategy which is more time consuming. Figure 40 shows the times observed in
the CARMA’s system mentioned above. As shown, in all cases a quality test
can be performed in less than one minute, which supposes a reasonable time if
the system requires to be stopped in case of printing plates needs to be
exchanged. As expected, the most demanding phase by far is the computation
of radius and centers of the circles by means of Hough transform.

50
Figure 40. Execution time in an ARMv7 processor
Once demonstrated the feasibility of new proposal system, its scalability was
studied. The system used consists on 4xARM processors, so parallelism task
can be exploited with an important execution times reduction. A multithreaded
application can be coded by means of OpenMP [31] standard programming.
OpenMP uses a portable, scalable model that gives programmers a simple and
flexible interface for developing parallel applications for platforms ranging from
the standard desktop computer to supercomputer. OpenMP is an
implementation of multithreading, a method of parallelizing where by a master
thread (a series of instructions executed consecutively) forks a specified
number of slave threads and a task is divided among them. The threads then
run concurrently, with the runtime environment allocating threads to different
processors.
The programming is based on directives or tags which eases the hard parallel
coding task. The most common directive is #pragma omp parallel for which
0
10
20
30
40
50
60
0 5 10 15 20 25 30 35 40 45 50 55 60 65 70 75 80 85 90 95 97 98
Tim
e (s
)
Nominal coverage values (%)
Estimate new centers
Remove Invalid Centers
Otsu+Hough

51
distributes the loop iterations between different threads. It should be noted that
to achieve successful scalability rates it is recommended to balance work-load
among threads in a uniform way.
In our particular case, since the Hough transform is the most costly phase, we
focus on parallelizing the main loop that projects different circles for each edge
point. Although the way to exploit application parallelism is quite obvious,
scalability results (Figure 40) show a successfully efficiency rates of 96% for
two processors and 90% with 4 respectively. Figure 41 reinforces this effect,
emphasizing the independence of the printing plate chosen.
Figure 41. Speedup attained for 2 and 4 ARM’s processors
0
0,5
1
1,5
2
2,5
3
3,5
4
0 5 10 15 20 25 30 35 40 45 50 55 60 65 70 75 80 85 90 95 97
Sp
eed
up
Nominal coverage values (%)
2CPU
4CPU

52
4.3. Conclusions and Future work
There are few quality control methods on the printing plates, but the method
with image analysis proved to be the best. This method uses microscopic
images of the printing plate surface and software to analyze these images. The
image analysis software shows percentage of the surface coverage with the
printing elements.
This work describes the implementation of a low-cost system specially for
measuring quality of printing plates. The real problem was evaluated under two
strategies -just based on dynamic histogram segmentation- and -based on the
previous steps plus Hough transform and refinement- in order to construct a
robust machine vision system able to deal with noise and other drawbacks real
environment. These algorithms have been implemented using the same
processors than mobile devices as tablets, smartphones and so on.
Our results have shown that the algorithm is able to detect and visualize motion
artefacts with a high rate. We are currently improving the system with the
hierarchical multi-scale optical flow algorithm and we will evaluate the achieved
motion correction based on Receiver Operating Characteristic (ROC) over
different embedded GPUs in order to export that to mobile devices as well.
In this paper the surface coverage was measured with different methods, but
the most valuable method by using the software code in Matlab and later
translating it into C to be executed in a low-cost device. Captured images of the
printing plate surface with circle printing elements were inserted in the software.
For future experiment is possible to consider how to measure surface coverage
when the elements are not circle shaped, for example oval, or when printing
elements have special design shape.
In offset printing every color has a printing plate for itself with printing elements
placed under different angle avoiding an appearance of moaré. Accordingly, for
future work the software made in Matlab could check if the printing elements for
different colors are under the corresponding angles.

53
Furthermore, developing this software and making it suitable for other printing
techniques is also one of the possibilities for future work. Additionally, linking
software with appropriate hardware could result in prototypes which could
define quality of printing plates in the same way such as with expansive already
existing devices.

54
5. Appendix
5.1. Example of real outputs from Source Code of the system
Figure 42 presents exit images after every step in second strategy. In the first
column one can see images where the edge of the circle was detected. Also, it
is possible to see centers of the circles colored in red after Hough transform.
The yellow circle presents the first refinement, threshold which is used to
determine which circle is good, and which one is not. Second column are
images which are the product after interpolation where system detected the real
size of the circle.
Circle overlapping are showed on the real image in third column and the last
column presents final images of the printing plate samples where the circles
were constructed using interpolation methods.
It is shown also a set of many examples with larger resolution in Figure 43 (a-d)
for sake of clarity.

55
Figure 42. Images obtained after Matlab's calculation of second strategy
(From 10% surface coverage to 95%)

56
Figure 43 (a). Examples of circles detected for the first stages of second strategy
(theoretical radius value 35)
Figure 43 (b). Examples of circles detected for the next stages of second strategy
(theoretical radius value 35)

57
Figure 43 (c). Examples of circles overlapped with real image
(theoretical radius value 35)
Figure 43 (d). Examples of circles recovered again the real image
(theoretical radius value 35)

58
6. Bibliography
1. http://forme.grf.unizg.hr/pages/kolegiji/tiskovne-forme-1/nastavni-
materijali.php,(last request: 10.03.2013.)
2. Kumar, M., (1978), Standardizacija izrade i eksploatacija tiskovne forme
za plošni tisak, Zagreb.
3. MahovićPoljaček S., Risović D., Cigula T., Gojo M., “Application of
electrochemical impedance spectroscopy in characterization of structural
changes of printing plates“ Journal of Solid State electrochemistry 16
(2012), 3; 1077-1089
4. Korelić, O., (1986), Kemigrafija, Zagreb.
5. Bolanča, S., (1997), Glavne tehnike tiska, Zagreb: Acta Graphica.
6. Nishino, A., Masuda, Y., Sawada, H., Uesugi, A., (2004), Process for
Producing Aluminum Support for Lithographic Printing Plate, Patent No.:
US6682645 B2.
7. Lin, C. S., Chang, C. C., Fu, H. M., (2001), AC electrograining of
aluminum plate in hydrochloric acid, Materials Chemistry and Physics,
68, pp. 217–224.
8. Mahović Poljaček, S., (2007), Karakterizacija površinskih struktura
ofsetnih tiskovnih formi, Dissertation, Faculty of Graphic Arts, Zagreb.
9. The Northeast Waste Management Officials’ Association, (2006),
Computer-to-Plate Lithographic Printing, Techology Profile.
10. Kipphan, H., (2001), Handbook of Print Media, Berlin: Springer.
11. Baračić, M., (2008), Fizikalno-kemijska svojstva otopine za vlaženje,
Bachelor Work, Faculty of Graphic Arts, Zagreb.
12. Prince, S., (2012), Computer vision: models, learning and inference,
Cambridge University Press.
13. www.simplecv.org/learn/chapter_one.html, (last request: 28.04.2013.).

59
14. Shah, M., (1997), Fundamentals of Computer Vision, University of
Central Florida, Orlando.
15. Wu, Y., An Introduction to Computer Vision, Northwestern University,
Evanston.
16. Pun, T., Milanese, R., (1995), Computer Vision and Multimedia
Information Systems, International Workshop on Multimedia Information
Systems and Hypermedia, Tokyo.
17. Szelinski, R., (2010), Computer Vision: Algorithms and Applications,
Springer.
18. Tomašegović, T., Cigula, T., Mahović Poljaček S., Gojo, M., (2011),
Comparison of different measuring systems for printing plate´s coverage
values evaluation, Printing future day’s proceedings 2011, 39-44,
Chemnitz.
19. Mahović Poljaček, S., (2011/2012), Tiskovne forme 2, Lecture
presentation, Zagreb.
20. Imbriovčan, T., (2011), Slikovna analiza kao metoda mjerenja kvalitete
tiskovnih formi, Bachelor Work, Faculty of Graphic Arts, Zagreb.
21. Hudika, T., Tomašegović, T., MahovićPoljaček, S., (2012), Offset Printing
Plates: Alternative Metdod for Quality Conrol, Proceedings GRID 2012,
129-133, Novi Sad.
22. Žitinski Elías P. Y., Tomašegović T., (2009), Influence of the developing
solution onto wetting of offset printing plate, Rector's Award, Univeristy of
Zagreb, Zagreb.
23. http://www.sdg-net.co.jp/products/x-
rite/products_detail/pdf/300_icplate_user_guide_en.pdf, (last request:
28.04.2013.).
24. http://www.xrite.com/documents/literature/en/L7-442_vipFLEX2_en.pdf,
(last request: 28.04.2013.).
25. http://materijali.grf.unizg.hr/media/PGM_slikovna%20analiza.pdf,(last
request: 28.04.2013.).
26. Hranuelli, R., (2011), Slikovna analiza listova papira načinjenih od
recikliranih vlakanaca, Master Thesis, Faculty of Graphic Arts, Zagreb.

60
27. http://www.uhnresearch.ca/facilities/wcif/PDF/ImageJ_Manual.pdf,(last
request: 28.04.2013.).
28. http://rsbweb.nih.gov/ij/docs/user-guide.pdf, (last request: 28.04.2013.).
29. http://www.seco.com, (last request: 15.06.2013.).
30. http://www.seco.com/en/newselem/carma-devkit-now-shipping/, (last
request: 15.06.2013.).
31. www.openmp.org, (last request: 15.06.2013.)