deflection and frequency monitoring of the forth road...
TRANSCRIPT
Deflection and frequencymonitoring of the Forth Road Bridge,Scotland, by GPS
&1 Gethin W. Roberts BEng, PhDDean of Science and Engineering, Faculty of Science and Engineering,University of Nottingham Ningbo China, Ningbo, China
&2 Christopher J. Brown BScReader, Applied Mechanics, School of Engineering and Design, BrunelUniversity, Uxbridge, UK
&3 Xiaolin Meng PhDAssociate Professor and RCUK Fellow, Institute of EngineeringSurveying and Space Geodesy, University of Nottingham InnovationPark, Nottingham, UK
&4 Oluropo Ogundipe BSc, PhDResearch Fellow, Institute of Engineering Surveying and SpaceGeodesy, University of Nottingham Innovation Park, Nottingham, UK
&5 Christopher Atkins BA, MScMSc graduate, Institute of Engineering Surveying and Space Geodesy,
University of Nottingham Innovation Park, Nottingham, UK
&6 Barry Colford BScChief Engineer and Bridge Master, Forth Estuary Transport Authority,
South Queensferry, West Lothian, UK
1 2 3 4 5 6
The use of carrier phase kinematic GPS (global positioning system) has evolved into a reliable technique to measure
both the three-dimensional magnitudes and frequencies of movements of structures. Techniques have been
developed that tackle errors caused by multipath, tropospheric delay and issues relating to satellite geometry. GPS-
derived movements compare well with data from both design predictions and structural models. Results from field
trials carried out on the Forth Road Bridge are presented. This paper brings together key results that outline the
procedure as well as a series of new data that indicate other potential applications. GPS data were collected
continuously over a period of 46 h at a minimum rate of 10 Hz. During the trials wind speed, wind direction, relative
humidity and temperature were also recorded. Frequently there was very heavy traffic flow, and at one point a special
load (a 100-t lorry) passed over simultaneously to the heavy daytime flow of traffic. Data from a planned load trial
during a brief bridge closure are reported and compared with the limited results available from a finite element
model. Measured vibration frequencies are also computed from GPS data and compared with those given in the
literature. In addition, results indicating the change in structural characteristics are also presented – in particular
changes of mass associated with changes in traffic loading are observed. The results show the performance of GPS as
it has developed in recent years, and that it can now reliably be used as a significant part of structural health
monitoring schemes, giving both the magnitude of quasi-static deflections in known time periods and hence the
frequency of dynamic movements of structures.
1. Introduction
GPS (global positioning system) monitoring of major infra-
structure projects, notably suspension bridges, continues to
develop (Ashkenazi et al., 1996; Ashkenazi and Roberts, 1997;
Barnes et al., 2003; Brown et al., 1999, 2006, 2008; Dan et al.,
2008, Fujino et al., 2000; Guo et al., 2000; Meng, 2002; Meng
et al., 2005, 2007a; Roberts et al., 2004, 2008; Wong, 2007).
1.1 GPS measurements
GPS was originally designed to work by measuring the time it
takes binary codes, modulated onto carrier frequencies, to
reach a GPS antenna from satellites with known coordinates
orbiting the earth some 20 000 km above its surface. There are
two carrier frequencies, known as L1 and L2, with wavelengths
of approximately 19 cm and 24 cm, onto which are modulated
Bridge EngineeringVolume 165 Issue BE2
Deflection and frequency monitoring ofthe Forth Road Bridge, Scotland, by GPSRoberts, Brown, Meng, et al.
Proceedings of the Institution of Civil Engineers
Bridge Engineering 165 June 2012 Issue BE2
Pages 105–123 http://dx.doi.org/10.1680/bren.9.00022
Paper 900022
Received 28/05/2009 Accepted 13/01/2011
Keywords: bridges/field testing & monitoring/land
surveying
ice | proceedings ICE Publishing: All rights reserved
105
the coarse acquisition code (C/A code) onto L1, and the precise
code (P code, also known as the Y code) on both L1 and L2.
Satellites are currently being launched to replace the existing
satellites when they are no longer working. These current
replacement satellites known as block IIRM have a civilian
code (C code) on L2 in addition to the C/A and P codes. Future
block IIF satellites have an L5 carrier frequency as well as a
whole range of codes on all three frequencies. Currently the C/A
code is only widely available for non-US military use, but the C
code and L5 carrier will make a wider range of signals available
for all. The main advantage is that the errors induced onto these
radio frequencies by the ionosphere can be eliminated when
using multiple frequencies (Hancock et al., 2009; Hofmann-
Welenhoff et al., 2001; Leick, 2004).
The carrier phase itself is also used for precise range
measurements. The phase of the carrier signal can be measured
to submillimetre resolution. This observable is mainly used for
survey purposes, whereby a carrier phase-enabled GPS receiver
is positioned relative to another similar receiver located over a
survey marker with a known three-dimensional (3D) coordi-
nate. Millimetric relative positioning is possible through using
these observations (Hancock et al., 2009). However, even
though the carrier phase can be measured to submillimetre
resolution, in order to be able to use this precise measurement,
a whole number of carrier wavelengths, also known as the
integer ambiguity, needs to be added onto this measurement to
result in the true range. Various techniques have been
developed that are used to calculate the integer ambiguity
values for the various satellites used (Leick, 2004).
The use of carrier phase GPS enables 3D movements of bridges
to be measured at precise times with at least subcentimetre
precision and relative accuracies to the reference GPS receiver.
Due to the fact that each 3D coordinate is associated with a
precise time, the frequency of the movement can also be
derived. The work has evolved in data analysis to include
multipath mitigation (Roberts et al., 2002), using the internet
to transfer GPS data (Dodson et al., 2004) and in GPS
processing, both using single and dual frequency code/carrier
data (Cosser et al., 2003). Finite element model (FEM)
predictions of structural behaviour have been successfully
validated using GPS results (Brown et al., 1999).
Measuring deflections of large-scale relatively flexible structures
is technically challenging, but GPS is particularly well suited.
Nevertheless, care must be taken with the position of both
receivers and reference stations. It has been shown (Brownjohn
et al., 2004; Brownjohn, 2005) that measuring movements of tall
buildings is always prone to error because it is rarely possible to
have reference stations located at similar altitudes to the
monitoring GPS receivers and thus with the same tropospheric
interference patterns as the receivers. Nevertheless, the minimal
importance of vertical movement in multistorey buildings makes
it a viable technique for lateral dynamics.
The Humber Bridge was the first bridge in the UK to be used
as a test-bed for GPS trials. In 1996, Brunel University was
commissioned by the Humber Bridge Board to create a FEM
of the bridge (Karuna et al., 1997). Following this, the group at
the University of Nottingham carried out initial bridge
monitoring trials on the bridge and the displacement data
were then used to validate the FEM (Karuna et al., 1997,
1998). The potential of the technique for measuring frequency
was identified and reported at this stage. Work on the London
Millennium Footbridge before its structural modification has
also been reported (Roberts et al., 2006), and to date four
major UK bridges have been monitored by the authors, with a
further three to be monitored soon.
The major GPS assessment of the Forth Road Bridge is the
subject of this paper. The paper mainly details the results of a
trial carried out on the bridge in Scotland in February 2005.
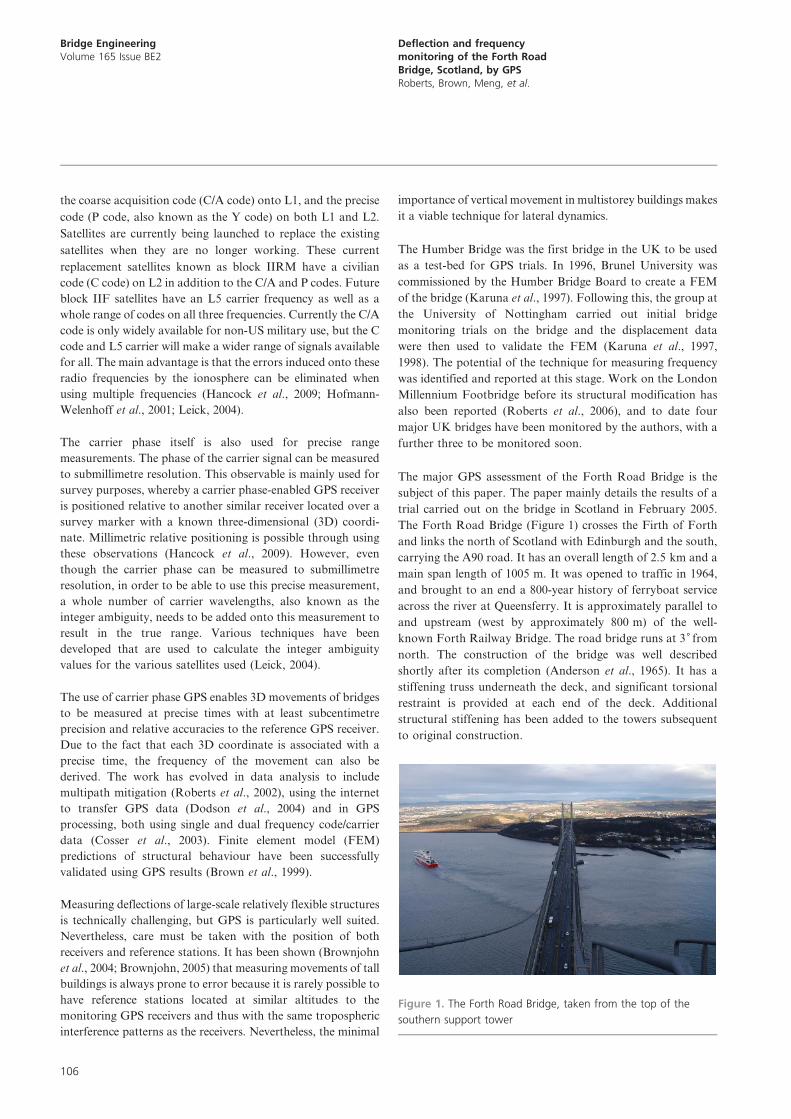
The Forth Road Bridge (Figure 1) crosses the Firth of Forth
and links the north of Scotland with Edinburgh and the south,
carrying the A90 road. It has an overall length of 2.5 km and a
main span length of 1005 m. It was opened to traffic in 1964,
and brought to an end a 800-year history of ferryboat service
across the river at Queensferry. It is approximately parallel to
and upstream (west by approximately 800 m) of the well-
known Forth Railway Bridge. The road bridge runs at 3˚ from
north. The construction of the bridge was well described
shortly after its completion (Anderson et al., 1965). It has a
stiffening truss underneath the deck, and significant torsional
restraint is provided at each end of the deck. Additional
structural stiffening has been added to the towers subsequent
to original construction.
Figure 1. The Forth Road Bridge, taken from the top of the
southern support tower
Bridge EngineeringVolume 165 Issue BE2
Deflection and frequencymonitoring of the Forth RoadBridge, Scotland, by GPSRoberts, Brown, Meng, et al.
106
Traffic has steadily increased over this bridge, from 4 million
vehicles in 1964 to over 23 million in 2002. In 1964 the heaviest
unrestricted commercial vehicles weighed 24 t; the current limit
is 44 t. There is a significant tidal traffic flow from north to
south in the morning peak and in the reverse direction in the
evening. Until recently the toll booths at the southern
approach meant that significant volumes of traffic were
stationary on the southbound carriageways in the morning
peak period, but a recent decision by the local Scottish
parliament has removed tolls and thus reduced some of the
peak load due to traffic.
Unconnected to this, there has been an inspection of the main
suspension cables following anxiety about the corroded state of
cables in suspension bridges of a similar age and design. While
those surveys are ongoing it should be emphasised that the
work described below is not part of that study.
2. Methods and measurements on the ForthRoad Bridge
2.1 Instrumentation
During a 46-h period from 8 to 10 February 2005, the authors
and staff from the Institute of Engineering Surveying and
Space Geodesy (IESSG) at the University of Nottingham
gathered data continuously from GPS receivers located on the
bridge. To ensure continuity of data two reference GPS
stations were used, located on the southern end viewing
platform of the north–south orientated bridge. A further five
GPS receivers were fixed to the bridge deck and two GPS
receivers were located on top of the southern support tower.
This limited number was governed by resources available for
the trial. In addition, a high accuracy INS, POS-RS inertial
measurement unit manufactured by Applanix (Richmond Hill,
Canada) was also located upon the bridge. The use of INS
(inertial navigation systems) for bridge deformation monitor-
ing is discussed elsewhere (Hide et al., 2005).
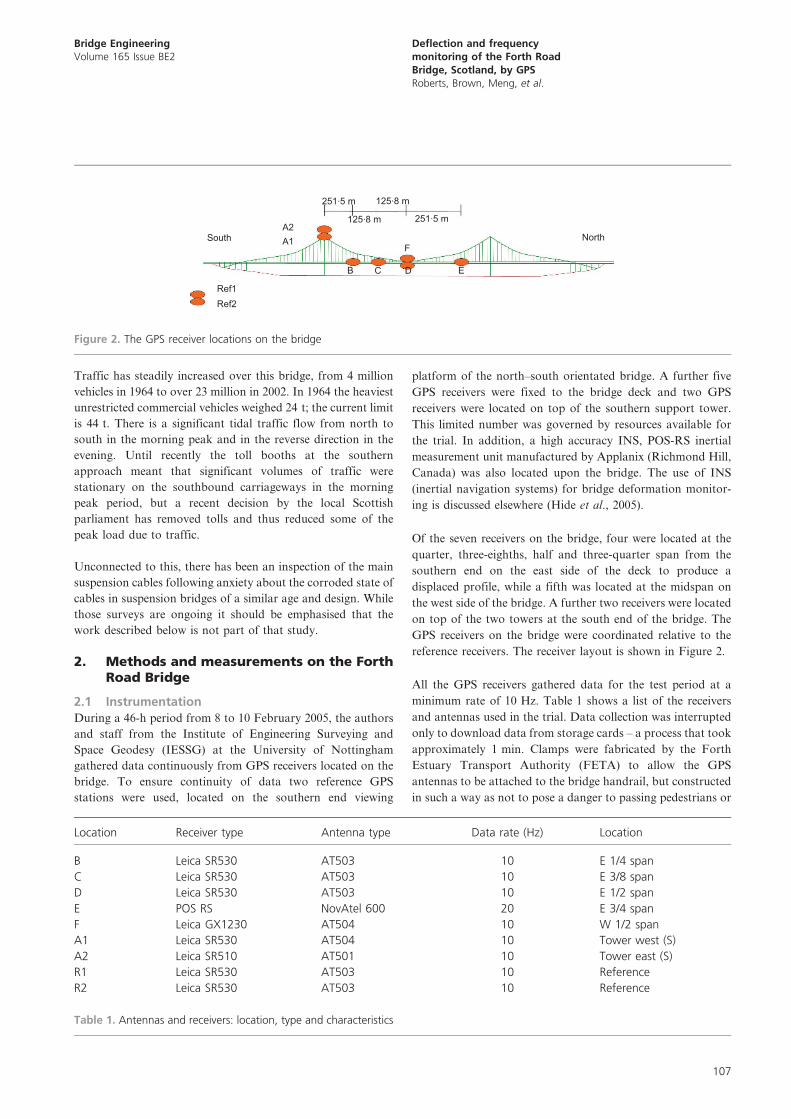
Of the seven receivers on the bridge, four were located at the
quarter, three-eighths, half and three-quarter span from the
southern end on the east side of the deck to produce a
displaced profile, while a fifth was located at the midspan on
the west side of the bridge. A further two receivers were located
on top of the two towers at the south end of the bridge. The
GPS receivers on the bridge were coordinated relative to the
reference receivers. The receiver layout is shown in Figure 2.
All the GPS receivers gathered data for the test period at a
minimum rate of 10 Hz. Table 1 shows a list of the receivers
and antennas used in the trial. Data collection was interrupted
only to download data from storage cards – a process that took
approximately 1 min. Clamps were fabricated by the Forth
Estuary Transport Authority (FETA) to allow the GPS
antennas to be attached to the bridge handrail, but constructed
in such a way as not to pose a danger to passing pedestrians or
251.5 m
251.5 m
North
125.8 mA2A1South
Ref1Ref2
B C D
F
E
125.8 m
Figure 2. The GPS receiver locations on the bridge
Location Receiver type Antenna type Data rate (Hz) Location
B Leica SR530 AT503 10 E 1/4 span
C Leica SR530 AT503 10 E 3/8 span
D Leica SR530 AT503 10 E 1/2 span
E POS RS NovAtel 600 20 E 3/4 span
F Leica GX1230 AT504 10 W 1/2 span
A1 Leica SR530 AT504 10 Tower west (S)
A2 Leica SR510 AT501 10 Tower east (S)
R1 Leica SR530 AT503 10 Reference
R2 Leica SR530 AT503 10 Reference
Table 1. Antennas and receivers: location, type and characteristics
Bridge EngineeringVolume 165 Issue BE2
Deflection and frequencymonitoring of the Forth RoadBridge, Scotland, by GPSRoberts, Brown, Meng, et al.
107
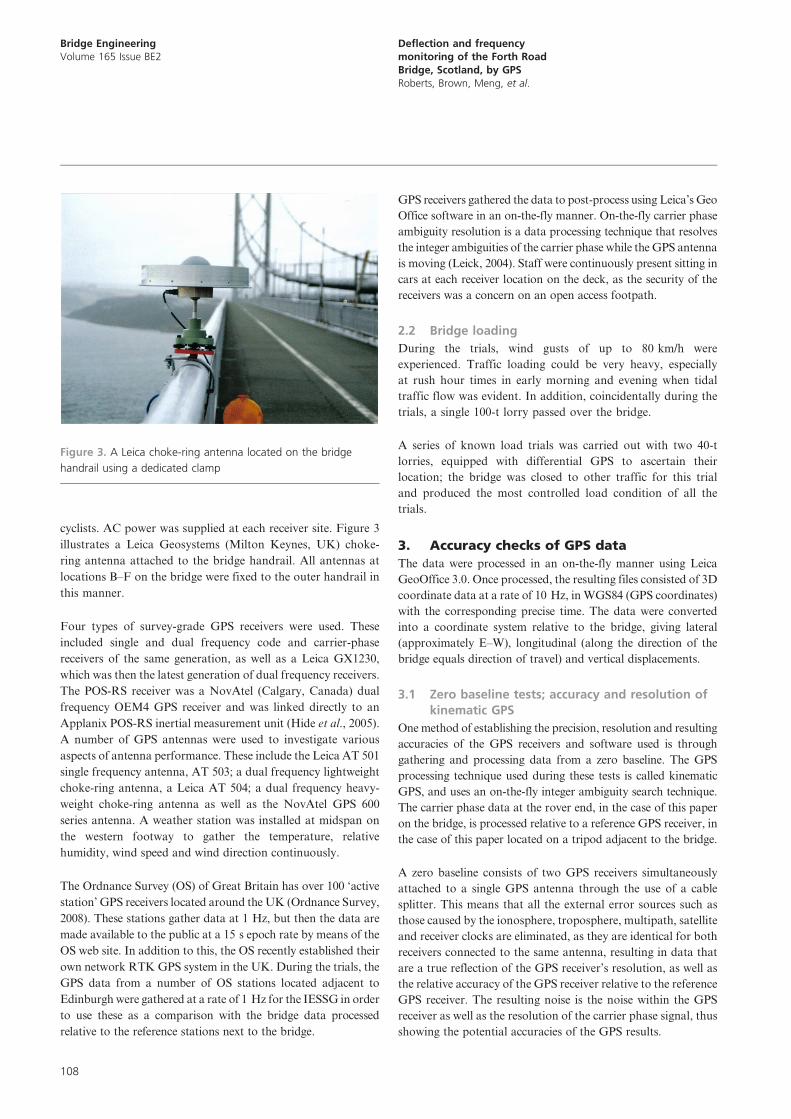
cyclists. AC power was supplied at each receiver site. Figure 3
illustrates a Leica Geosystems (Milton Keynes, UK) choke-
ring antenna attached to the bridge handrail. All antennas at
locations B–F on the bridge were fixed to the outer handrail in
this manner.
Four types of survey-grade GPS receivers were used. These
included single and dual frequency code and carrier-phase
receivers of the same generation, as well as a Leica GX1230,
which was then the latest generation of dual frequency receivers.
The POS-RS receiver was a NovAtel (Calgary, Canada) dual
frequency OEM4 GPS receiver and was linked directly to an
Applanix POS-RS inertial measurement unit (Hide et al., 2005).
A number of GPS antennas were used to investigate various
aspects of antenna performance. These include the Leica AT 501
single frequency antenna, AT 503; a dual frequency lightweight
choke-ring antenna, a Leica AT 504; a dual frequency heavy-
weight choke-ring antenna as well as the NovAtel GPS 600
series antenna. A weather station was installed at midspan on
the western footway to gather the temperature, relative
humidity, wind speed and wind direction continuously.
The Ordnance Survey (OS) of Great Britain has over 100 ‘active
station’ GPS receivers located around the UK (Ordnance Survey,
2008). These stations gather data at 1 Hz, but then the data are
made available to the public at a 15 s epoch rate by means of the
OS web site. In addition to this, the OS recently established their
own network RTK GPS system in the UK. During the trials, the
GPS data from a number of OS stations located adjacent to
Edinburgh were gathered at a rate of 1 Hz for the IESSG in order
to use these as a comparison with the bridge data processed
relative to the reference stations next to the bridge.
GPS receivers gathered the data to post-process using Leica’s Geo
Office software in an on-the-fly manner. On-the-fly carrier phase
ambiguity resolution is a data processing technique that resolves
the integer ambiguities of the carrier phase while the GPS antenna
is moving (Leick, 2004). Staff were continuously present sitting in
cars at each receiver location on the deck, as the security of the
receivers was a concern on an open access footpath.
2.2 Bridge loading
During the trials, wind gusts of up to 80 km/h were
experienced. Traffic loading could be very heavy, especially
at rush hour times in early morning and evening when tidal
traffic flow was evident. In addition, coincidentally during the
trials, a single 100-t lorry passed over the bridge.
A series of known load trials was carried out with two 40-t
lorries, equipped with differential GPS to ascertain their
location; the bridge was closed to other traffic for this trial
and produced the most controlled load condition of all the
trials.
3. Accuracy checks of GPS data
The data were processed in an on-the-fly manner using Leica
GeoOffice 3.0. Once processed, the resulting files consisted of 3D
coordinate data at a rate of 10 Hz, in WGS84 (GPS coordinates)
with the corresponding precise time. The data were converted
into a coordinate system relative to the bridge, giving lateral
(approximately E–W), longitudinal (along the direction of the
bridge equals direction of travel) and vertical displacements.
3.1 Zero baseline tests; accuracy and resolution ofkinematic GPS
One method of establishing the precision, resolution and resulting
accuracies of the GPS receivers and software used is through
gathering and processing data from a zero baseline. The GPS
processing technique used during these tests is called kinematic
GPS, and uses an on-the-fly integer ambiguity search technique.
The carrier phase data at the rover end, in the case of this paper
on the bridge, is processed relative to a reference GPS receiver, in
the case of this paper located on a tripod adjacent to the bridge.
A zero baseline consists of two GPS receivers simultaneously
attached to a single GPS antenna through the use of a cable
splitter. This means that all the external error sources such as
those caused by the ionosphere, troposphere, multipath, satellite
and receiver clocks are eliminated, as they are identical for both
receivers connected to the same antenna, resulting in data that
are a true reflection of the GPS receiver’s resolution, as well as
the relative accuracy of the GPS receiver relative to the reference
GPS receiver. The resulting noise is the noise within the GPS
receiver as well as the resolution of the carrier phase signal, thus
showing the potential accuracies of the GPS results.
Figure 3. A Leica choke-ring antenna located on the bridge
handrail using a dedicated clamp
Bridge EngineeringVolume 165 Issue BE2
Deflection and frequencymonitoring of the Forth RoadBridge, Scotland, by GPSRoberts, Brown, Meng, et al.
108
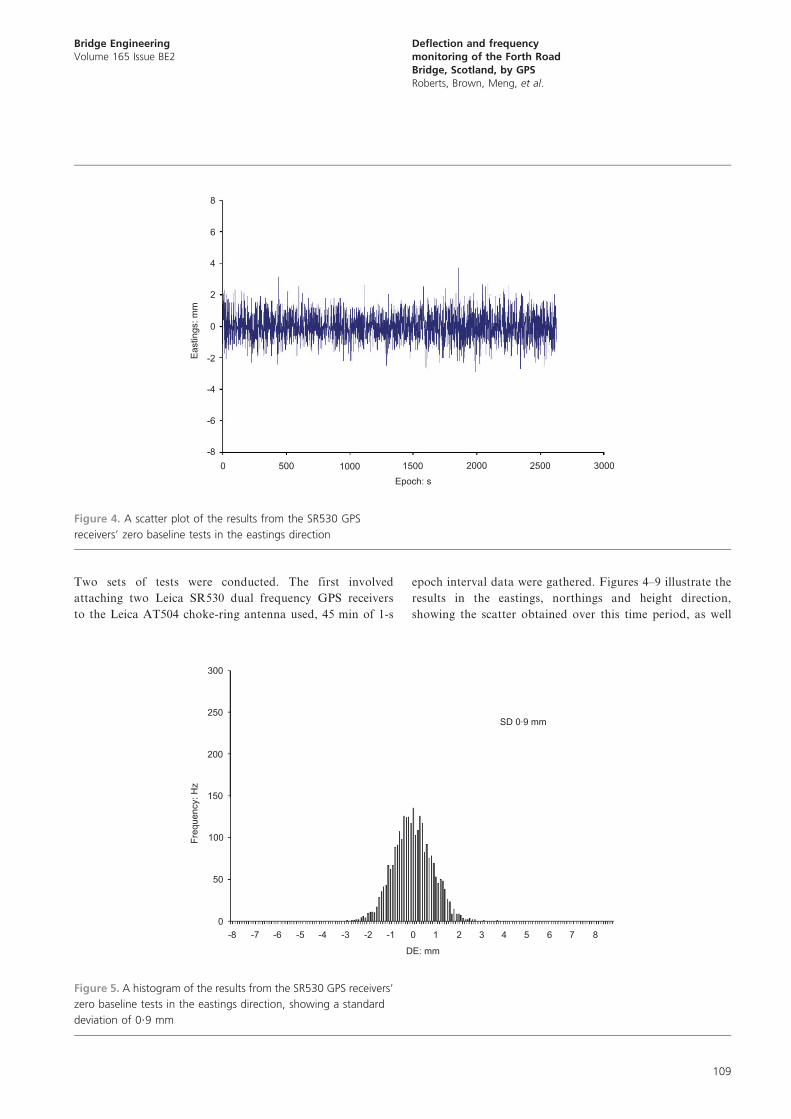
Two sets of tests were conducted. The first involved
attaching two Leica SR530 dual frequency GPS receivers
to the Leica AT504 choke-ring antenna used, 45 min of 1-s
epoch interval data were gathered. Figures 4–9 illustrate the
results in the eastings, northings and height direction,
showing the scatter obtained over this time period, as well
8
6
4
2
0
Eas
tings
: mm
0 500 1000 2000 30001500Epoch: s
2500
-2
-4
-6
-8
Figure 4. A scatter plot of the results from the SR530 GPS
receivers’ zero baseline tests in the eastings direction
300
SD 0.9 mm250
200
150
Freq
uenc
y: H
z
100
50
0-8 -7 -6 -5 -4 -3 -2 -1 0
DE: mm
1 2 3 4 5 6 7 8
Figure 5. A histogram of the results from the SR530 GPS receivers’
zero baseline tests in the eastings direction, showing a standard
deviation of 0?9 mm
Bridge EngineeringVolume 165 Issue BE2
Deflection and frequencymonitoring of the Forth RoadBridge, Scotland, by GPSRoberts, Brown, Meng, et al.
109
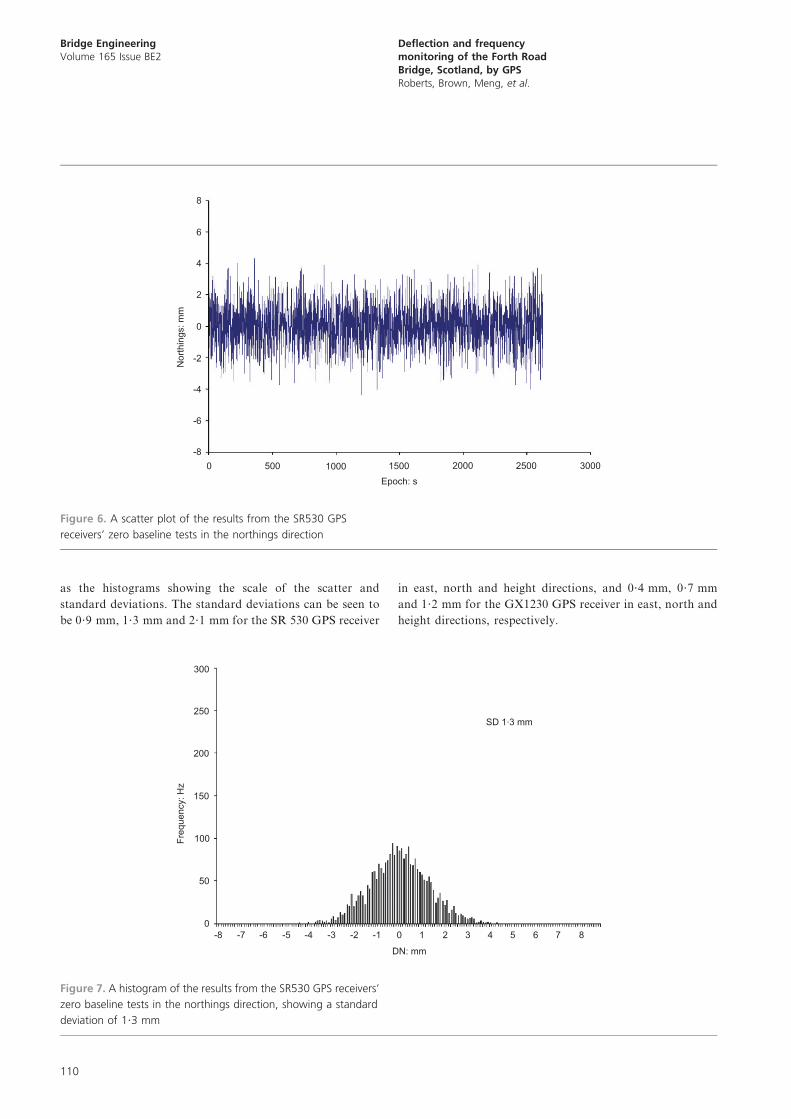
as the histograms showing the scale of the scatter and
standard deviations. The standard deviations can be seen to
be 0?9 mm, 1?3 mm and 2?1 mm for the SR 530 GPS receiver
in east, north and height directions, and 0?4 mm, 0?7 mm
and 1?2 mm for the GX1230 GPS receiver in east, north and
height directions, respectively.
8
6
4
2
0
Nor
thin
gs: m
m
0 500 1000 2000 30001500Epoch: s
2500
-2
-4
-6
-8
Figure 6. A scatter plot of the results from the SR530 GPS
receivers’ zero baseline tests in the northings direction
300
SD 1.3 mm250
200
150
Freq
uenc
y: H
z
100
50
0-8 -7 -6 -5 -4 -3 -2 -1 0
DN: mm
1 2 3 4 5 6 7 8
Figure 7. A histogram of the results from the SR530 GPS receivers’
zero baseline tests in the northings direction, showing a standard
deviation of 1?3 mm
Bridge EngineeringVolume 165 Issue BE2
Deflection and frequencymonitoring of the Forth RoadBridge, Scotland, by GPSRoberts, Brown, Meng, et al.
110
The second set of tests involved attaching two GX1230 dual
frequency GPS receivers to the same choke-ring antenna.
Again, 45 min of 1-s interval data were gathered, and again
the results were processed with one of the receiver’s data
being used as a reference GPS receiver and the other as the
rover. Figures 10–15 illustrate the scatter and histograms
for these results in the eastings, northings and height
directions.
8
6
4
2
0
Hei
ght:
mm
0 500 1000 2000 30001500Epoch: s
2500
-2
-4
-6
-8
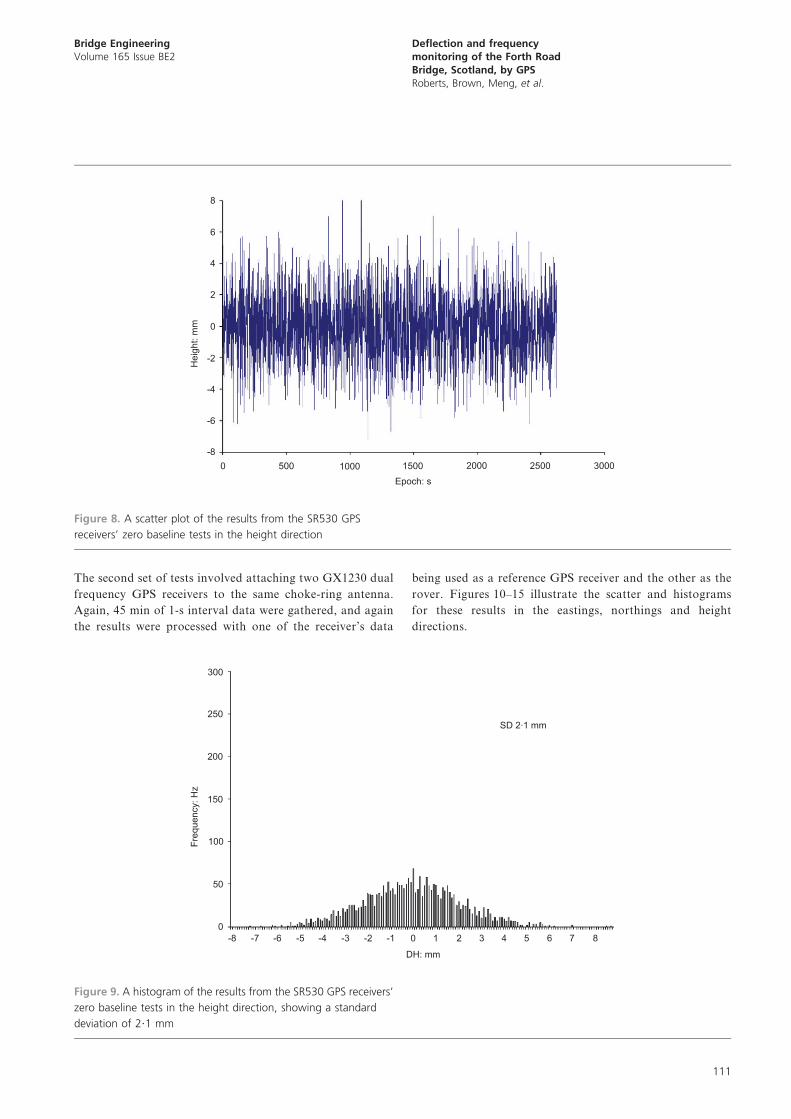
Figure 8. A scatter plot of the results from the SR530 GPS
receivers’ zero baseline tests in the height direction
300
SD 2.1 mm250
200
150
Freq
uenc
y: H
z
100
50
0-8 -7 -6 -5 -4 -3 -2 -1 0
DH: mm
1 2 3 4 5 6 7 8
Figure 9. A histogram of the results from the SR530 GPS receivers’
zero baseline tests in the height direction, showing a standard
deviation of 2?1 mm
Bridge EngineeringVolume 165 Issue BE2
Deflection and frequencymonitoring of the Forth RoadBridge, Scotland, by GPSRoberts, Brown, Meng, et al.
111
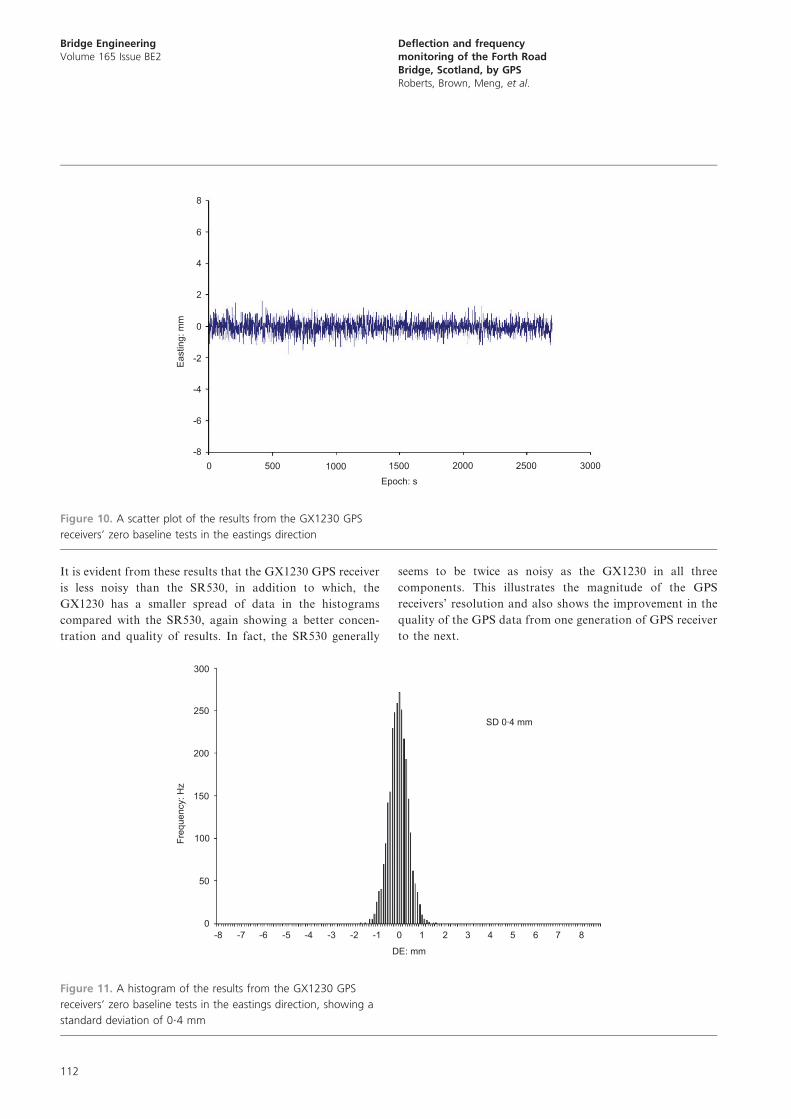
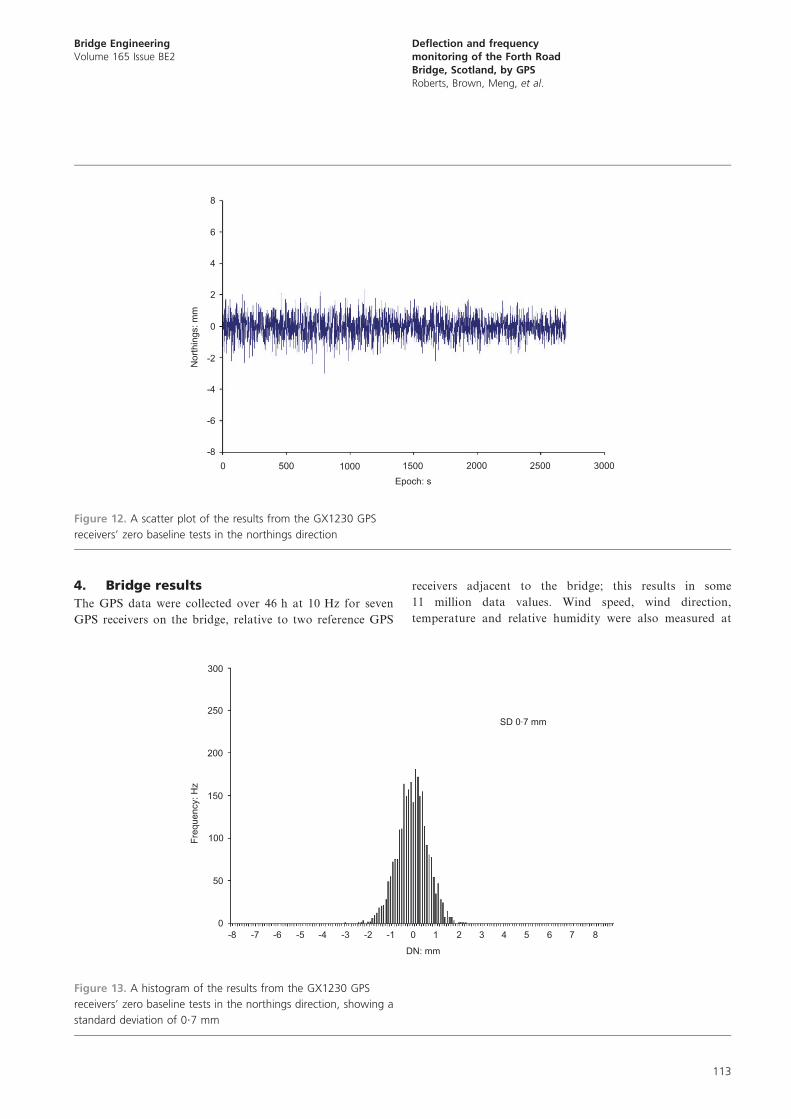
It is evident from these results that the GX1230 GPS receiver
is less noisy than the SR530, in addition to which, the
GX1230 has a smaller spread of data in the histograms
compared with the SR530, again showing a better concen-
tration and quality of results. In fact, the SR530 generally
seems to be twice as noisy as the GX1230 in all three
components. This illustrates the magnitude of the GPS
receivers’ resolution and also shows the improvement in the
quality of the GPS data from one generation of GPS receiver
to the next.
8
6
4
2
0
Eas
ting:
mm
0 500 1000 2000 30001500Epoch: s
2500
-2
-4
-6
-8
Figure 10. A scatter plot of the results from the GX1230 GPS
receivers’ zero baseline tests in the eastings direction
300
SD 0.4 mm250
200
150
Freq
uenc
y: H
z
100
50
0-8 -7 -6 -5 -4 -3 -2 -1 0
DE: mm
1 2 3 4 5 6 7 8
Figure 11. A histogram of the results from the GX1230 GPS
receivers’ zero baseline tests in the eastings direction, showing a
standard deviation of 0?4 mm
Bridge EngineeringVolume 165 Issue BE2
Deflection and frequencymonitoring of the Forth RoadBridge, Scotland, by GPSRoberts, Brown, Meng, et al.
112
4. Bridge results
The GPS data were collected over 46 h at 10 Hz for seven
GPS receivers on the bridge, relative to two reference GPS
receivers adjacent to the bridge; this results in some
11 million data values. Wind speed, wind direction,
temperature and relative humidity were also measured at
8
6
4
2
0
Nor
thin
gs: m
m
0 500 1000 2000 30001500Epoch: s
2500
-2
-4
-6
-8
Figure 12. A scatter plot of the results from the GX1230 GPS
receivers’ zero baseline tests in the northings direction
300
SD 0.7 mm250
200
150
Freq
uenc
y: H
z
100
50
0-8 -7 -6 -5 -4 -3 -2 -1 0
DN: mm
1 2 3 4 5 6 7 8
Figure 13. A histogram of the results from the GX1230 GPS
receivers’ zero baseline tests in the northings direction, showing a
standard deviation of 0?7 mm
Bridge EngineeringVolume 165 Issue BE2
Deflection and frequencymonitoring of the Forth RoadBridge, Scotland, by GPSRoberts, Brown, Meng, et al.
113

1 Hz. To demonstrate the range of information available for
health monitoring using GPS this paper provides a synopsis
that presents:
& a sample of the raw data
& a typical pattern of quasi-static ‘engineering’ deflections, and
& extracted frequencies for a period when the structure was
8
6
4
2
0
Hei
ght:
mm
0 500 1000 2000 30001500Epoch: s
2500
-2
-4
-6
-8
Figure 14. A scatter plot of the results from the GX1230 GPS
receivers’ zero baseline tests in the height direction
300
SD 1.2 mm250
200
150
Freq
uenc
y: H
z
100
50
0-8 -7 -6 -5 -4 -3 -2 -1 0
DH: mm
1 2 3 4 5 6 7 8
Figure 15. A histogram of the results from the GX1230 GPS
receivers’ zero baseline tests in the height direction, showing a
standard deviation of 1?2 mm
Bridge EngineeringVolume 165 Issue BE2
Deflection and frequencymonitoring of the Forth RoadBridge, Scotland, by GPSRoberts, Brown, Meng, et al.
114
subject to wind action. (Note: the effect of wind on the
structure has been reported fully elsewhere in Meng et al.,
2007b).
Vertical movements of the deck are also presented under
thermal action, while correlations between tower movements
and bridge deck movements are confirmed.
For vertical displacements, the datum is taken as the average of
the data above sea level and does not vary with time. For
lateral and longitudinal displacements, a datum is required,
and this can be an arbitrary position at an arbitrary point in
time. The average of all readings taken at this datum has been
used unless otherwise specified.
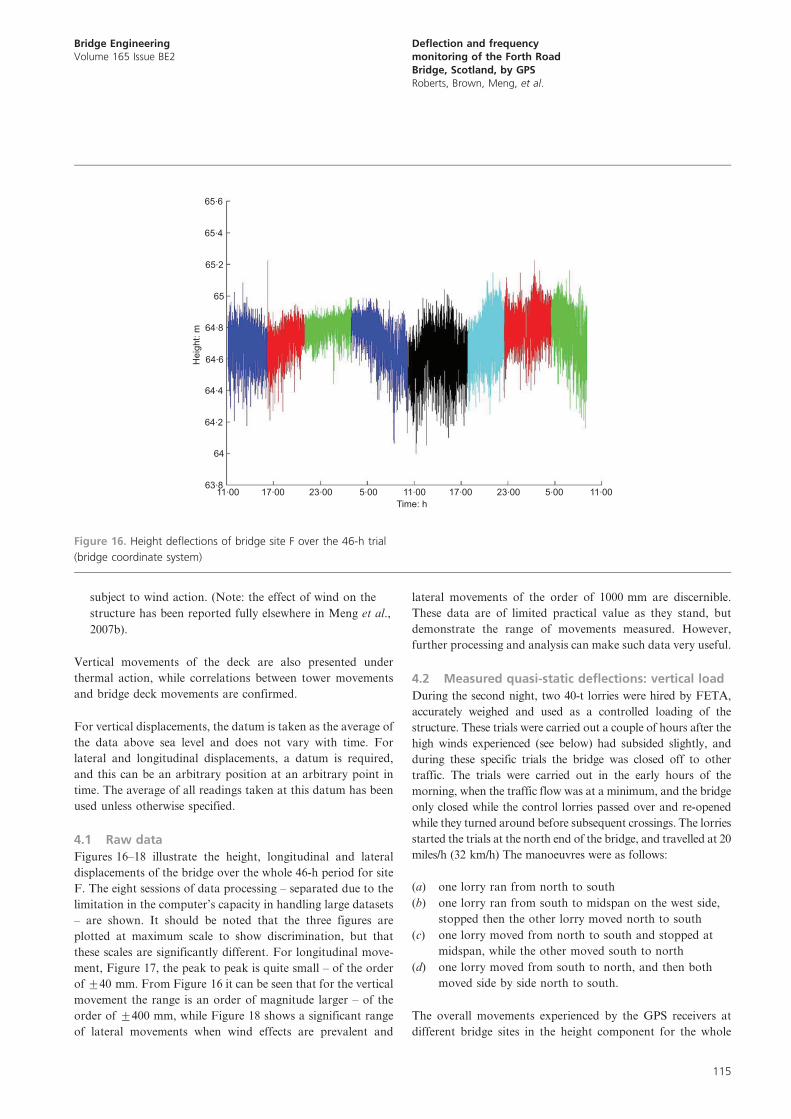
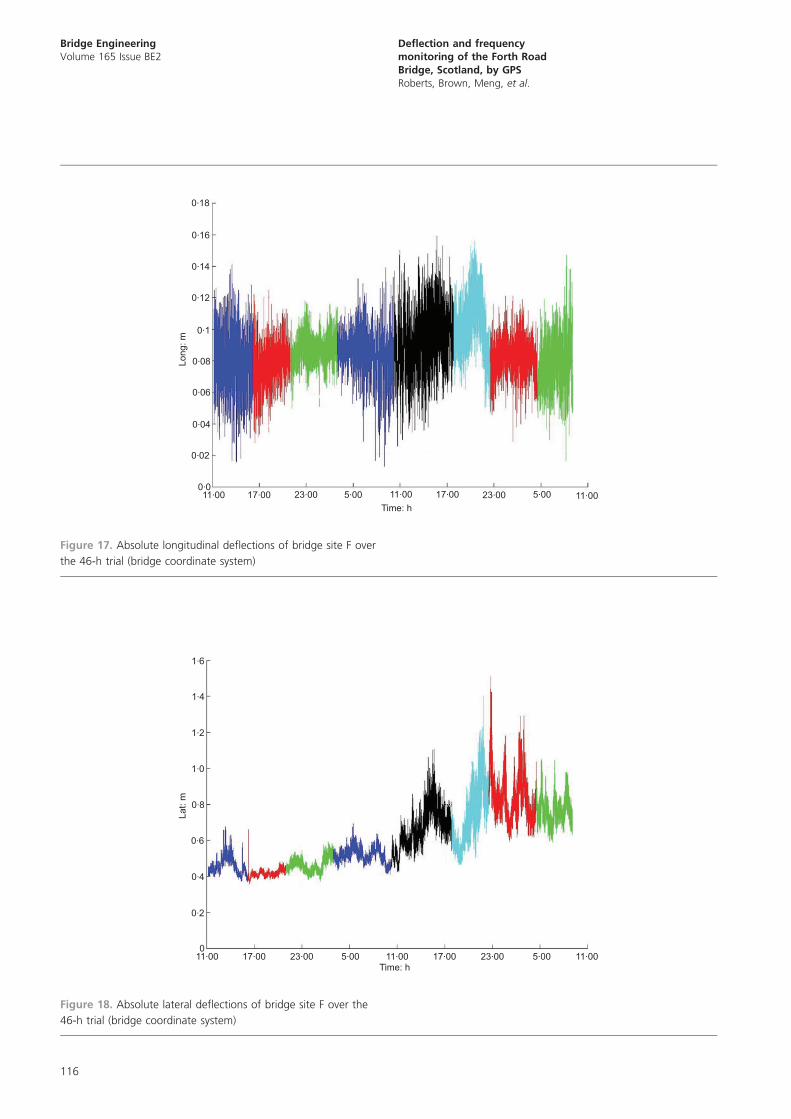
4.1 Raw data
Figures 16–18 illustrate the height, longitudinal and lateral
displacements of the bridge over the whole 46-h period for site
F. The eight sessions of data processing – separated due to the
limitation in the computer’s capacity in handling large datasets
– are shown. It should be noted that the three figures are
plotted at maximum scale to show discrimination, but that
these scales are significantly different. For longitudinal move-
ment, Figure 17, the peak to peak is quite small – of the order
of ¡40 mm. From Figure 16 it can be seen that for the vertical
movement the range is an order of magnitude larger – of the
order of ¡400 mm, while Figure 18 shows a significant range
of lateral movements when wind effects are prevalent and
lateral movements of the order of 1000 mm are discernible.
These data are of limited practical value as they stand, but
demonstrate the range of movements measured. However,
further processing and analysis can make such data very useful.
4.2 Measured quasi-static deflections: vertical load
During the second night, two 40-t lorries were hired by FETA,
accurately weighed and used as a controlled loading of the
structure. These trials were carried out a couple of hours after the
high winds experienced (see below) had subsided slightly, and
during these specific trials the bridge was closed off to other
traffic. The trials were carried out in the early hours of the
morning, when the traffic flow was at a minimum, and the bridge
only closed while the control lorries passed over and re-opened
while they turned around before subsequent crossings. The lorries
started the trials at the north end of the bridge, and travelled at 20
miles/h (32 km/h) The manoeuvres were as follows:
(a) one lorry ran from north to south
(b) one lorry ran from south to midspan on the west side,
stopped then the other lorry moved north to south
(c) one lorry moved from north to south and stopped at
midspan, while the other moved south to north
(d) one lorry moved from south to north, and then both
moved side by side north to south.
The overall movements experienced by the GPS receivers at
different bridge sites in the height component for the whole
65.6
65.4
65.2
64.8
63.811.00 17.00 23.00 5.00 11.00 17.00 23.00 5.00 11.00
64.6
64.4
64.2
64
Time: h
65
Hei
ght:
m
Figure 16. Height deflections of bridge site F over the 46-h trial
(bridge coordinate system)
Bridge EngineeringVolume 165 Issue BE2
Deflection and frequencymonitoring of the Forth RoadBridge, Scotland, by GPSRoberts, Brown, Meng, et al.
115
1.6
1.4
1.2
1.0
0.8
Lat:
m
0.6
0.4
0.2
11.00 11.00Time: h
11.0017.00 17.0023.00 23.005.00 5.000
Figure 18. Absolute lateral deflections of bridge site F over the
46-h trial (bridge coordinate system)
0.18
0.16
0.14
0.12
0.1
0.08Long
: m
0.06
0.04
0.02
11.00 11.00Time: h
11.0017.00 17.0023.00 23.005.00 5.000.0
Figure 17. Absolute longitudinal deflections of bridge site F over
the 46-h trial (bridge coordinate system)
Bridge EngineeringVolume 165 Issue BE2
Deflection and frequencymonitoring of the Forth RoadBridge, Scotland, by GPSRoberts, Brown, Meng, et al.
116
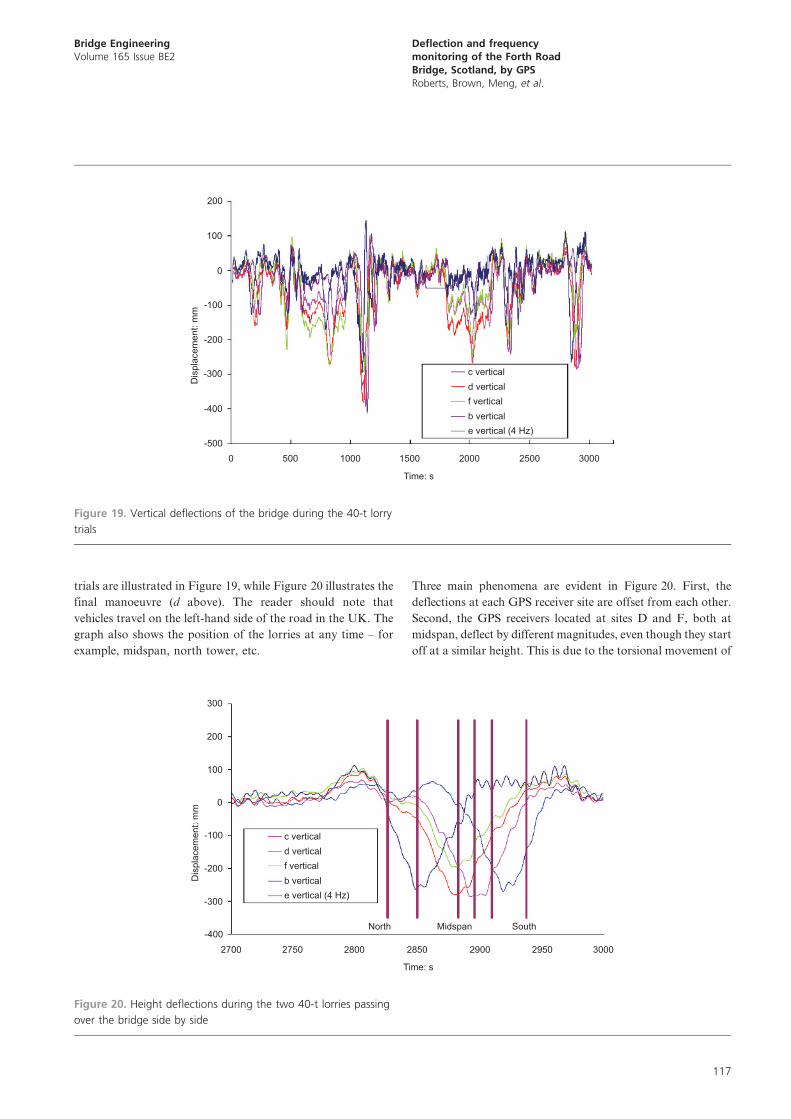
trials are illustrated in Figure 19, while Figure 20 illustrates the
final manoeuvre (d above). The reader should note that
vehicles travel on the left-hand side of the road in the UK. The
graph also shows the position of the lorries at any time – for
example, midspan, north tower, etc.
Three main phenomena are evident in Figure 20. First, the
deflections at each GPS receiver site are offset from each other.
Second, the GPS receivers located at sites D and F, both at
midspan, deflect by different magnitudes, even though they start
off at a similar height. This is due to the torsional movement of
0 500-500
-400
-300
-200
-100
Dis
plac
emen
t: m
m
0
100
200
1000 1500
Time: s
2000
c verticald verticalf verticalb verticale vertical (4 Hz)
2500 3000
Figure 19. Vertical deflections of the bridge during the 40-t lorry
trials
c vertical
300
200
100
-100
-200
-300
-4002700 2750 2800 2850
North Midspan South
Time: s
2900 2950 3000
0
Dis
plac
emen
t: m
m
d verticalf verticalb verticale vertical (4 Hz)
Figure 20. Height deflections during the two 40-t lorries passing
over the bridge side by side
Bridge EngineeringVolume 165 Issue BE2
Deflection and frequencymonitoring of the Forth RoadBridge, Scotland, by GPSRoberts, Brown, Meng, et al.
117
the bridge. The lorries, travelling on the left-hand side of the
carriageway from north to south, were in fact travelling on the
east side of the bridge. Hence, the eastern side (site D) deflects
more than the western side (site F). Third, the reader should note
that the bridge consists of three separate spans, each connected
through a cable that passes over the top of the towers. As the
lorries pass over the northern side span, the loaded hanger
cables pull down on the suspension cable, which results in the
suspension cable pulling up the main span. This is evident in
Figure 20 at approximately 2800 s. The lorries pass into the
main span, and their passage over the measured positions is
shown in Figure 20 with downward deflection of the main span
point D. As the lorries pass into the southerly side span, upward
movement of the main span – described above – is observed.
GPS measured displacement
Filtered GPS measured displacement
FE predicted displacement200
300
100
Verti
cal d
ispl
acem
ent:
mm
-100
-200
-300
-4002750 2800 2850
Time: s2900 2950 3000
0
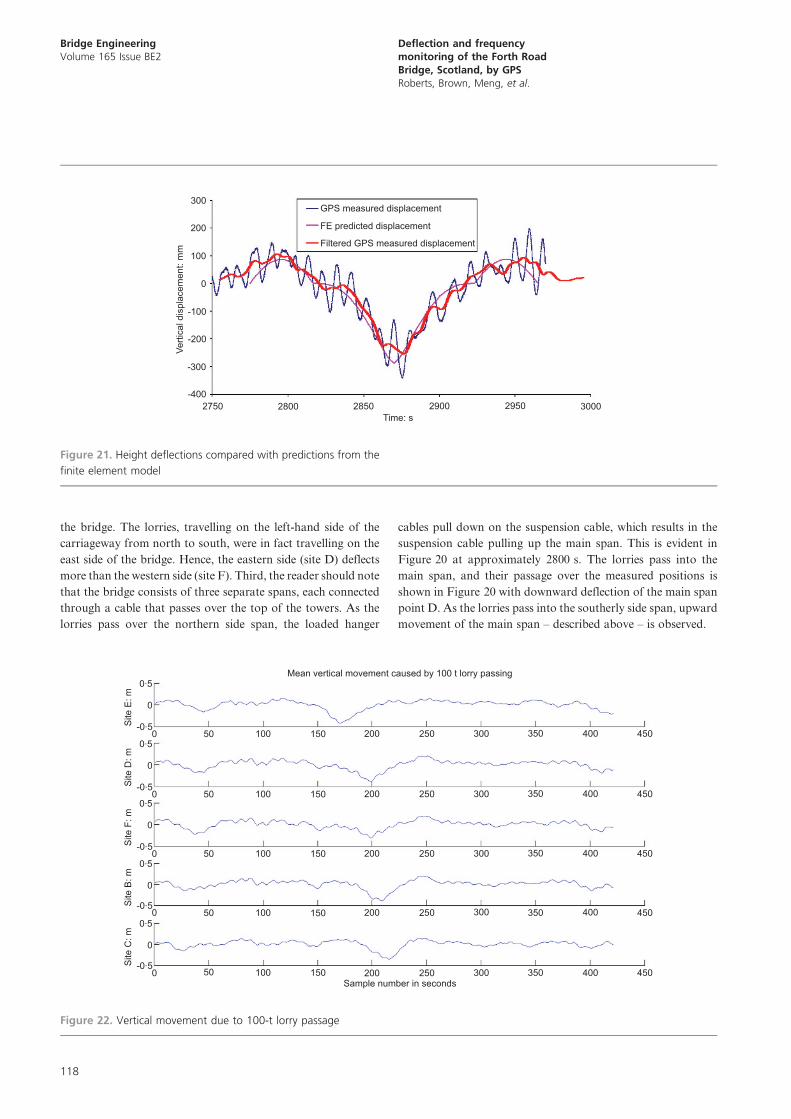
Figure 21. Height deflections compared with predictions from the
finite element model
0.5
-0.5
0
Mean vertical movement caused by 100 t lorry passing
Site
E: m
0 50 100 150 200 250 300 350 400 4500.5
-0.5
0
Site
D: m
0 50 100 150 200 250 300 350 400 4500.5
-0.5
0
Site
F: m
0 50 100 150 200 250 300 350 400 4500.5
-0.5
0
Site
B: m
0 50 100 150 200 250 300 350 400 4500.5
-0.5
0
Site
C: m
0 50 100 150 200Sample number in seconds
250 300 350 400 450
Figure 22. Vertical movement due to 100-t lorry passage
Bridge EngineeringVolume 165 Issue BE2
Deflection and frequencymonitoring of the Forth RoadBridge, Scotland, by GPSRoberts, Brown, Meng, et al.
118
The results are also compared with those predicted by an
existing FEM of the bridge (see Acknowledgements). The
FEM used predicted a deflection of 280 mm under the loading
of the two 40-t lorries. The mean deflection of the GPS receiver
located at point D can be seen to match this prediction of
280 mm extremely well in Figure 20. Further to this, Figure 21
compares the actual measurements at location D, as well as a
filtered version of the GPS results using a moving average filter
of 100 samples, as well as the FEM results. The moving
average filter is used to reduce the higher frequency vibrations,
leaving behind the deformations caused by the lorries’ mass.
Again, it is evident from Figure 21 that there is a very good
correlation between the actual and predicted data.
4.3 Other measured deflections
During the trial period a 100-t lorry passed over the bridge.
The lorry was precisely weighed and this section of the data
was analysed in more detail. Figure 22 illustrates the height
component of all the bridge deck GPS receivers. It can be seen
that the bridge deflects by approximately 40 cm, and that the
maximum deflections at each point are offset from each other
along the bridge.
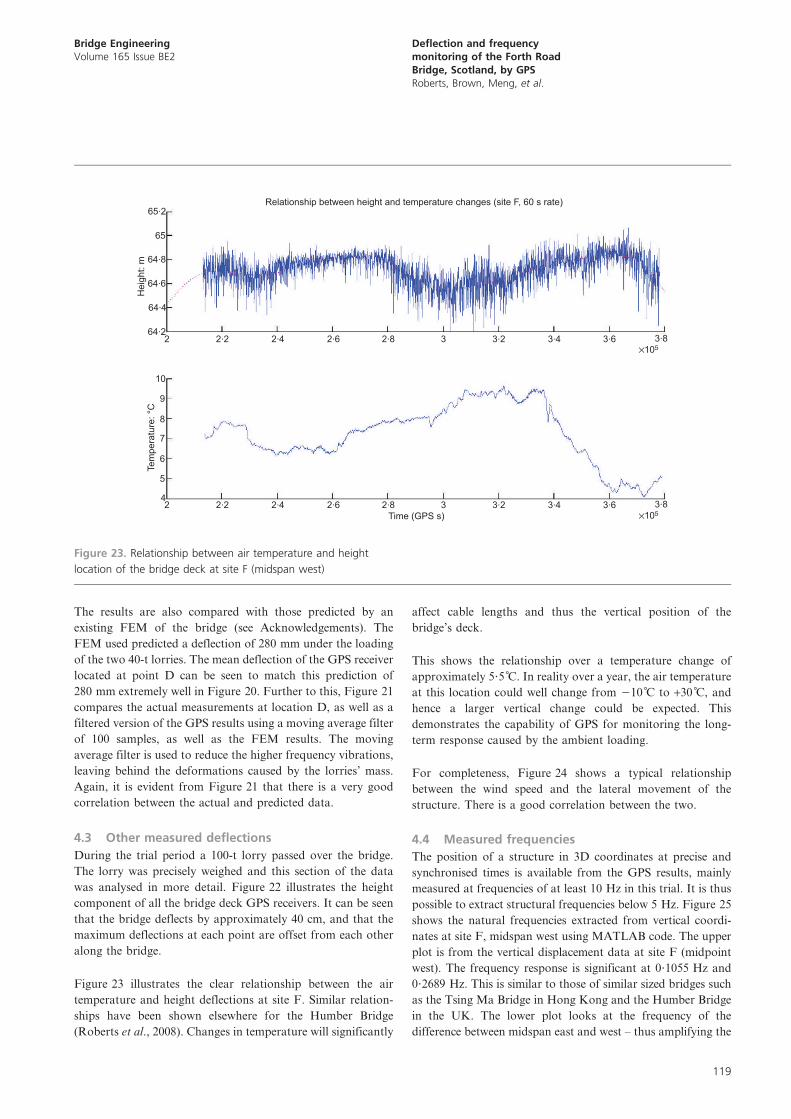
Figure 23 illustrates the clear relationship between the air
temperature and height deflections at site F. Similar relation-
ships have been shown elsewhere for the Humber Bridge
(Roberts et al., 2008). Changes in temperature will significantly
affect cable lengths and thus the vertical position of the
bridge’s deck.
This shows the relationship over a temperature change of
approximately 5?5 C̊. In reality over a year, the air temperature
at this location could well change from 210 C̊ to +30 C̊, and
hence a larger vertical change could be expected. This
demonstrates the capability of GPS for monitoring the long-
term response caused by the ambient loading.
For completeness, Figure 24 shows a typical relationship
between the wind speed and the lateral movement of the
structure. There is a good correlation between the two.
4.4 Measured frequencies
The position of a structure in 3D coordinates at precise and
synchronised times is available from the GPS results, mainly
measured at frequencies of at least 10 Hz in this trial. It is thus
possible to extract structural frequencies below 5 Hz. Figure 25
shows the natural frequencies extracted from vertical coordi-
nates at site F, midspan west using MATLAB code. The upper
plot is from the vertical displacement data at site F (midpoint
west). The frequency response is significant at 0?1055 Hz and
0?2689 Hz. This is similar to those of similar sized bridges such
as the Tsing Ma Bridge in Hong Kong and the Humber Bridge
in the UK. The lower plot looks at the frequency of the
difference between midspan east and west – thus amplifying the
65.2
65
Relationship between height and temperature changes (site F, 60 s rate)
Hei
ght:
m 64.8
64.6
64.4
64.22.2 2.4 2.6 2.8 3.2 3.4 3.6 3.8
10532
2.2 2.4 2.6 2.8 3.2 3.4 3.6 3.8 105
3Time (GPS s)
24
5
6
7
8
Tem
pera
ture
: °C
9
10
Figure 23. Relationship between air temperature and height
location of the bridge deck at site F (midspan west)
Bridge EngineeringVolume 165 Issue BE2
Deflection and frequencymonitoring of the Forth RoadBridge, Scotland, by GPSRoberts, Brown, Meng, et al.
119
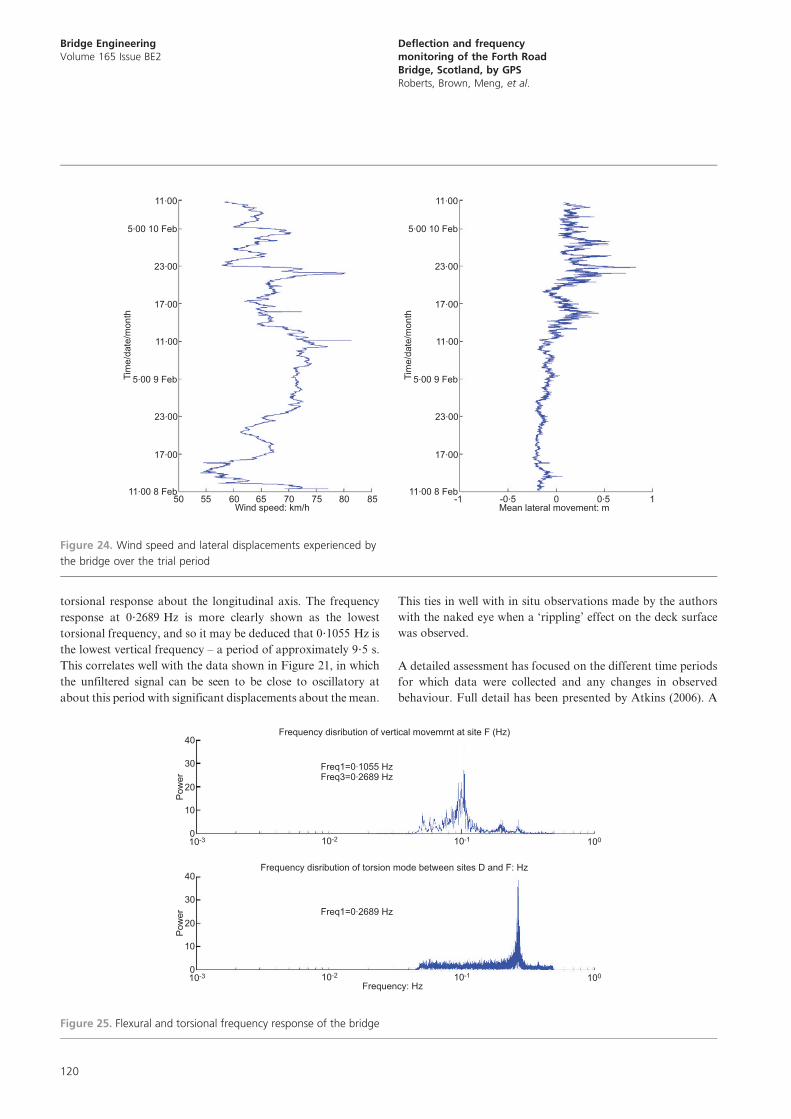
torsional response about the longitudinal axis. The frequency
response at 0?2689 Hz is more clearly shown as the lowest
torsional frequency, and so it may be deduced that 0?1055 Hz is
the lowest vertical frequency – a period of approximately 9?5 s.
This correlates well with the data shown in Figure 21, in which
the unfiltered signal can be seen to be close to oscillatory at
about this period with significant displacements about the mean.
This ties in well with in situ observations made by the authors
with the naked eye when a ‘rippling’ effect on the deck surface
was observed.
A detailed assessment has focused on the different time periods
for which data were collected and any changes in observed
behaviour. Full detail has been presented by Atkins (2006). A
11.00
5.00 10 Feb
5.00 9 Feb
11.00 8 Feb
23.00
17.00
11.00
Tim
e/da
te/m
onth
23.00
17.00
50 55 60 65Wind speed: km/h
70 8075 85
11.00
5.00 10 Feb
5.00 9 Feb
11.00 8 Feb
23.00
17.00
11.00
Tim
e/da
te/m
onth
23.00
17.00
-1 -0.5 0.50Mean lateral movement: m
1
Figure 24. Wind speed and lateral displacements experienced by
the bridge over the trial period
40
Freq1=0.1055 HzFreq3=0.2689 Hz
Frequency disribution of vertical movemrnt at site F (Hz)
30
20
Pow
er
10
010-3 10-2 10-1 100
40
Freq1=0.2689 Hz
Frequency disribution of torsion mode between sites D and F: Hz
30
20
Pow
er
10
Frequency: Hz
010-3 10-2 10-1 100
Figure 25. Flexural and torsional frequency response of the bridge
Bridge EngineeringVolume 165 Issue BE2
Deflection and frequencymonitoring of the Forth RoadBridge, Scotland, by GPSRoberts, Brown, Meng, et al.
120
summary of the data for natural frequency is shown in Table 2,
and shows a very good correlation between the different sites,
but significantly different natural frequencies for busy and
quiet periods. This is to be expected for such suspension
structures, as the mass of vehicles traversing the bridge during
a busy period will add significantly to the vibrating mass while
having no effect on the structural stiffness.
5. Further observations
The focused objective of the study, of which the GPS trial was
part, was not related to any potential condition monitoring of the
bridge – in fact it was associated with enhanced knowledge of
precise positions on the bridge at various times. The good offices
of the FETA, along with support from the authors’ universities
enabled a lengthier study to be conducted. However, one of the
key advantages of using GPS is the relative ease of implementa-
tion achieved on structures such as long-span bridges where
alternative surveying methods may be problematical.
Opportunities to carry out GPS-based assessments would lead
to more information about the state of key infrastructure
projects, and improved knowledge of ‘as-built’ or in-service
performance. This then provides a datum against which future
reliability assessments can be made. Issues such as long-term
movement (such as has been demonstrated with dams) can be
readily assessed, while the combination of high precision and
high frequency gives truly four-dimensional (4D) measurements.
The measurements can be taken over short periods in
intermittent campaigns, and would be very repeatable if
housings for antennas were fitted ab initio and remain in place.
Currently, GPS equipment is not cheap, and maintaining it in
position on a longer-term basis would not be possible (when
trials are carried out in publicly accessible spaces we currently
require a person to stay with each station at all times for security
purposes, and are indebted to the many students and colleagues
who have helped us in this task). Conversely, unit costs could be
significantly reduced if teams were established to carry out this
work on a rota basis over several infrastructure sites.
Are the data useful? The three trials on public infrastructure
for which results have been produced (the Forth Road Bridge
is the third) have been funded by industry. In each case the
results have been accepted as meeting the three different briefs.
The potential for a longer-term monitoring campaign has been
demonstrated, and further work has been commissioned by
others responsible for the condition of the infrastructure.
6. Conclusions
The trials have shown that GPS gives the magnitude and
frequencies of the bridge’s deflections in 3D. This is possible at a
rate of up to 10 Hz, and all the results are synchronised to each
other – essentially providing a 4D assessment. Although the trials
were carried out in a post-processing manner, it is possible to have
carried out these trials in real time, as discussed by Dodson et al.
(2004). While real time processing is possible, establishing real
time communications was beyond the scope of this trial.
The paper not only illustrates the technique, but analyses only
a small portion of the vast amount of data gathered during the
trials, sufficient to demonstrate the accuracy and repeatability
of the procedure. The challenge for the synthesis of such large
datasets for useful structural health monitoring has been
recognised, but the authors would argue that accurate and
absolute position data are an essential element of any
assessment, particularly when they can be allied to load data
and predictive models.
The results have been compared with displacement data
available from the FEM of the bridge, and show agreement.
The GPS procedures described provide a basis for structural
monitoring systems when used in conjunction with pre-
dictive models. Real GPS data from specific points can
validate such models and assess as-built and in-service
behaviour. It has been demonstrated that relatively small
changes in mass, in this case from traffic load, can be
detected as changes in natural frequency. It is reasonable to
assume that changes in stiffness could equally well be
detected. If the structure were to deteriorate over a period of
many years under normal load actions or as a result of any
specific mishap that should occur, then this may well be
identified through the use of GPS as the reference satellites
will provide a stable datum.
Data from Mode 02:00–03:30 (quiet period) 07:30–09:00 (busy period)
Mid span E Vertical 0?1041 0?1026
Mid span W Vertical 0?1041 0?1026
Mid span E–W Torsional 0?2699 0?2684
3/8 Span Vertical 0?1040 0?1027
1/4 Span Vertical 0?1041 0?1027
Table 2. Frequencies (Hz) detected for ‘quiet’ and ‘busy’ periods
Bridge EngineeringVolume 165 Issue BE2
Deflection and frequencymonitoring of the Forth RoadBridge, Scotland, by GPSRoberts, Brown, Meng, et al.
121

AcknowledgementsThe trial reported in this paper was funded by the Forth
Estuary Transport Authority. The authors gratefully acknowl-
edge support from staff and researchers at the IESSG and
FETA.
The authors would like to acknowledge the help of Colin Clark
of W.A. Fairhurst and Partners for assistance in providing the
displacement result from the FEM.
REFERENCES
Anderson JK, Hamilton JAK, Henderson W, et al. (1965) Forth
Road Bridge. Proceedings of the Institution of Civil
Engineers 32(3): 321–512.
Ashkenazi V and Roberts GW (1997) Experimental Monitoring
the Humber Bridge with GPS. Proceedings of the Institution
of Civil Engineers – Civil Engineering 120(4): 177–182.
Ashkenazi V, Dodson AH, Moore T and Roberts GW (1996) Real
time OTF GPS monitoring of the Humber Bridge.
Surveying World 4(4): 26–28.
Atkins C (2006) Deflection Monitoring of the Forth Road Bridge
and Wilford Footbridge using GNSS. MSc thesis, University
of Nottingham, UK.
Barnes J, Rizos C, Wang J, et al. (2003) The monitoring of bridge
movements using GPS and pseudolite. In 11th International
Symposium on Deformation Measurements. International
Federation of Surveyors (FIG), Santorini, Greece, 25–28
May 2003, pp. 563–572.
Brown CJ, Karuna R, Ashkenazi V, Roberts GW and Evans R
(1999) Monitoring of structures using GPS. Proceedings of
the Institution of Civil Engineers – Structures 134(1): 97–
105.
Brown CJ, Roberts GW and Meng X (2006) Developments in the
use of GPS for bridge monitoring. Proceedings of the
Institution of Civil Engineers – Bridge Engineering 159(3):
117–119.
Brown CJ, Meng X and Roberts GW (2008) Deflection
monitoring of bridges: a case study of the Forth Road
Bridge. In Bridge Maintenance, Safety, Management,
Health Monitoring and Informatics (IABMAS08) (Koh H-
M and Frangopol D (eds)). Balkema Press, Taylor and
Francis, London, UK, p. 413.
Brownjohn JMW (2005) Lateral loading and response for a tall
building in the non-seismic doldrums. Engineering
Structures 27(12): 1801–1812.
Brownjohn JMW, Rizos C, Tan GH and Pan TC (2004) Real-Time
Long-Term Monitoring of Static and Dynamic
Displacements of an Office Tower, Combining RTK GPS
and Accelerometer Data. In Proceedings of the 1st FIG
International Symposium on Engineering Surveys for
Construction Works and Structural Engineering,
Nottingham, UK, 28 June–1 July 2004.
Cosser E, Roberts GW, Meng X and Dodson AH (2003) The
Comparison of Single Frequency and Dual Frequency GPS
for Bridge Deflection and Vibration Monitoring. In
Proceedings of the Deformation Measurements and Analysis,
11th International Symposium on Deformation
Measurements. International Federation of Surveyors
(FIG), Santorini, Greece, May 2003.
Dan D, Sun L, Meng X and Xie D (2008) The statistical
investigation on one year GPS monitoring data from
Donghai Bridge Health Monitoring System. In Bridge
Maintenance, Safety, Management, Health Monitoring and
Informatics (IABMAS08) (Koh H-M and Frangopol D
(eds)). Balkema Press, Taylor and Francis, London, UK.
Dodson AH, Meng X, Andreotti M, Roberts GW and Walker M
(2004) Design and realization of RTK GPS over internet
for a ‘smart bridge’. Transactions of the Journal of Nanjing
University of Aeronautics and Astronautics 22(2): 91–97.
Fujino Y, Murata M, Okano S and Takeguchi M (2000)
Monitoring system of the Akashi Kaikyo Bridge and
displacement measurement using GPS. Proceedings of
SPIE 3995: 229–236.
Guo J, Xu L, Dai L, et al. (2000) Application of the real-time
kinematic global positioning system in bridge safety
monitoring. ASCE Journal of Bridge Engineering 10(2):
163–168.
Hancock C, Roberts GW and Taha A (2009) Satellite mapping in
cities: how good can it get? Proceedings of the Institution of
Civil Engineers – Civil Engineering 162(3): 122–128.
Hide C, Blake S, Meng X, et al. (2005) An investigation in the use
of GPS and INS sensors for structural health monitoring.
In Proceedings of ION GNSS, Long Beach, California, 13–
16 September 2005.
Hofmann-Wellenhof B, Lichtenegger H and Collins J (2001) GPS
Theory and Practice, 5th edn. Springer, New York, USA.
Karuna R, Yao MS, Brown CJ and Evans RA (1997) Modelling and
analysis of the Humber Bridge. In IASS International
Colloquium on Computation of Shell and Spatial Structures
(ICCSS’97), Taiwan, November 1997.
Karuna R, Yao MS, Brown CJ and Evans RA (1998) In-service
modelling of the Humber Bridge. In IABSE Symposium
‘Long Span and High-Rise Structures’, Kobe, 2–4
September 1998, pp. 441–446.
Leick A (2004) GPS Satellite Surveying. John Wiley, Hoboken,
NJ, USA.
Meng X (2002) Real-time deformation monitoring of bridges
using GPS/accelerometers. PhD thesis, University of
Nottingham, Nottingham, UK.
Meng X, Roberts GW and Dodson AH (2005) GNSS for
structural deflection monitoring: implementation and data
analysis. (Chang FK (ed)). Structural health monitoring
2005: advancements and challenges for implementation. In
Proceedings of 5th International Workshop on Structural
Health Monitoring. Stanford University, USA, 12–14
September 2005.
Meng X, Dodson AH and Roberts GW (2007a) Detecting bridge
Bridge EngineeringVolume 165 Issue BE2
Deflection and frequencymonitoring of the Forth RoadBridge, Scotland, by GPSRoberts, Brown, Meng, et al.
122

dynamics with GPS and triaxial accelerometers.
Engineering Structures 29(11): 3178–3184. ISSN: 0141-
0296.
Meng X, Brown CJ, Roberts GW and Andrew A (2007b) Using
GPS to measure the response of the Forth Road Bridge to
wind and temperature loading. Hong Kong Institution of
Engineering Surveyors. Journal of Geospatial Engineering
9(1–2): 1–11.
Ordnance Survey (2008) Welcome to the OS Net Free Services.
See http://www.ordnancesurvey.co.uk (accessed 25/11/
2008).
Roberts GW, Meng X, Dodson AH and Cosser E (2002) Multipath
mitigation for bridge deformation monitoring. International
Journal of GPS 1(1): 25–33. ISSN 1446-3156. See http://
www.cpgps.org/journal/journal.html (accessed 20/04/2009).
Roberts GW, Meng X and Dodson AH (2004) Integrating a global
positioning system and accelerometers to monitor the
deflection of bridges. American Society of Civil Engineers.
Journal of Surveying Engineering 130(2): 65–72.
Roberts GW, Meng X, Brown CJ and Dallard P (2006) GPS
measurements on the London Millennium Bridge.
Proceedings of the Institution of Civil Engineers – Bridge
Engineering 159(4): 153–161.
Roberts GW, Meng X and Brown CJ (2008) Research into the use
of GNSS to monitor the deflections of suspension
bridges, and the role of the FIG in deformation
monitoring of bridges. In Bridge Maintenance, Safety,
Management, Health Monitoring and Informatics
(IABMAS08) (Koh H-M and Frangopol D (eds)).
Balkema Press, Taylor and Francis, London, UK,
p. 412.
Wong K-Y (2007) Design of a structural health monitoring
system for long-span bridges. Structure and Infrastructure
Engineering 3(2): 169–185.
WHAT DO YOU THINK?
To discuss this paper, please email up to 500 words to the
editor at [email protected]. Your contribution will be
forwarded to the author(s) for a reply and, if considered
appropriate by the editorial panel, will be published as
discussion in a future issue of the journal.
Proceedings journals rely entirely on contributions sent in
by civil engineering professionals, academics and stu-
dents. Papers should be 2000–5000 words long (briefing
papers should be 1000–2000 words long), with adequate
illustrations and references. You can submit your paper
online via www.icevirtuallibrary.com/content/journals,
where you will also find detailed author guidelines.
Bridge EngineeringVolume 165 Issue BE2
Deflection and frequencymonitoring of the Forth RoadBridge, Scotland, by GPSRoberts, Brown, Meng, et al.
123