deflection control of reinforced concrete slab …jestec.taylors.edu.my/vol 14 issue 6 december...
TRANSCRIPT

Journal of Engineering Science and Technology Vol. 14, No. 6 (2019) 3387 - 3405 © School of Engineering, Taylor’s University
3387
DEFLECTION CONTROL OF REINFORCED CONCRETE SLAB STRENGTHENED WITH CFRP PLATES
PREEDA CHAIMAHAWAN*, SOMBOON SHAINGCHIN
School of Engineering, University of Phayo Maeka, Muang, Phayao, 56000, Thailand
*Corresponding Author: [email protected]
Abstract
Carbon Fiber Reinforced Polymer (CFRP) is usually used to strengthen RC
flexural members but most engineers do not consider in deflection aspect. In this
paper, nine RC slab specimens, represented RC slab strengthened with CFRP,
were tested under four-point and three-point bending in order to observe the
deflection behaviour. It was found that using CFRP was effective to control the
deflection of the slab. The deflection of strengthened specimens less than one of
specimens without strengthening around 30% - 60%. The design charts based on
Bischoff’s model, which can predict the deflection from test results in the elastic
range, were constructed to support engineers for selecting a proper area of CFRP
for deflection control of slab.
Keywords: Deflection, Design chart, Fibre-reinforced polymer, RC slab,
Strengthening.
3388 P. Chaimahawan and S. Shaingchin
Journal of Engineering Science and Technology December 2019, Vol. 14(6)
1. Introduction
The buildings, which constructed with reinforced concrete slab usually have problem
with crack when its age is above 10-30 years [1]. Sometimes crack pattern may be
found at the bottom of the slab because of long term deflection. The causes of this
scenario may come from many reasons such as creep of concrete, and deterioration
of building from usage. Hence, rehabilitation is necessary for the building. In case of
renovation building in order to have more service live load, the strengthening is
required. Many techniques have been developed and succeeded in rehabilitating and
strengthening the RC slab [2-4], including steel plate or steel beam bonding, external
prestressing, section enlargement, reinforced concrete jacketing and ferrocement
cover. The Fibre Reinforced Polymer (FRP) strengthening technique is the famous
one that can be upgraded to the existing RC slab to carry out more service live load.
Effectiveness characteristics of FRP composite materials such as high strength-to-
weight ratio, ease in installation, and high resistance to corrosion are helpful for
strengthening RC slabs. Many researches [5-11] were focussed on the type of FRP,
strengthening technique to increase flexural resistance and bonding strength of epoxy
adhesive between concrete and FRP. In this study, deflection control of RC slab
strengthened by CFRP plate is study.
Moment capacity of a reinforced concrete section can be calculated according to
ACI318-14 code [12]. The neutral axis of the section is located where the summation
of compression and tension forces is zero, called equilibrium equation of section.
Generally, the distance from the extreme compression layer to the neutral axis (c) is
calculated from the equilibrium equation. Consequently, the moment capacity of the
section is determined by the couple moment of compression and tension forces. For
the RC section strengthened by external FRP, the moment capacity is calculated
following ACI440.2R-17 [13]. As the same flexural theory provided by ACI318-14
[12], the tension force from FRP is added in the equilibrium equation as shown in Eq.
(1). After solving the length of compression zone (c), the moment capacity of the
strengthened section can be calculated using Eq. (2).
10.85 c y s f f cu
h cf b c f A E A
c
(1)
2
110.85
2n c y s f f cu
h ccM f b c c f A d c E A
c (2)
where b is the width of the section
c is the distance from the extreme compression layer to neutral axis
d is the distance from the extreme compression layer to the centroid
of tension reinforcement
h is the overall thickness of section
As is the area of tension reinforcement
Ef is the tensile modulus of elasticity of FRP
is the compressive strength of concrete
fy is the yield strength of steel reinforcement
1 is factor shall be taken as 0.85 for concrete strength less than 30 MPa.
For concrete strength 30 MPa up, shall be reduced continuously
cf
1

Deflection Control of Reinforced Concrete Slab Strengthened with . . . . 3389
Journal of Engineering Science and Technology December 2019, Vol. 14(6)
at a rate 0.05 for 7 MPa increasing of concrete strength, but shall
not less than 0.65
cu is the strain at concrete crushing = 0.003
is FRP strength reduction factor = 0.85 for flexure
Guide for the design and construction of externally bonded FRP systems for
strengthening concrete structures [13] does not give the equation for predicting
deflection of members after strengthening with FRP, but it can be found in guide
for the design and construction of structural concrete reinforced with FRP bar
(ACI440.1R-06) [14], which is internally bonded in concrete. Gao et al [15]
proposed the assumption for compute deflection is the same as a flexural theory by
replacing the moment of inertia with an effective moment of inertia (Ie) based on
the model by which, is adopt from Branson [16] model. The effective moment of
inertia is depended on the ratio of cracking moment to apply moment (Mcr/Ma),
which is accounted for nonlinear behaviour after concrete crack. It is gradually
degraded from the moment of inertia of gross-section (Ig) to moment of inertia of
cracked section (Icr). The equation for the calculated effective moment of inertia
(Ie) is shown in Eq. (3) [15].
3
cre cr d g cr g
a
MI I I I I
M
(3)
where Mcr is cracking moment calculated from 0.5 /cr c g bM f I y
Ma is applied the moment
Ig is the moment of inertia of gross section
Icr is the moment of inertia of cracked section
d is reduction coefficient related to the reduced tension stiffening
exhibited by FRP-reinforced members calculated from d =
f/(5fb) where f and fb is actual and balanced FRP reinforcement
ratio, respectively
Bischoff [17] proposes more accurately models, which account for the
instantaneous tension-stiffening phenomenon. The rationally predicting value of Ie
for both RC beams and FRP RC beams is expressed in Eq. (4).
2
1 1
cre g
cr cr
g a
II I
I M
I M
(4)
The use of FRP plates for flexural strengthening of RC members has proven to
be effective in enhancing both strength and stiffness [5-11]. The deflection of slab
strengthened by using FRP strengthening technique is reduced significantly [5-6, 18].
However, engineers always abandon the reduction of deflection of the slab after
strengthening with FRP technique because they believed that the moment of inertia
of section after strengthening increase a little bit compared to the other technique such
as steel plate or steel beam bonding. In addition, it is complicated to calculate the
deflection of RC slab strengthened by FRP. The method that usually is selected for
inspection of floor slab deflection after strengthening by FRP is in-situ full load test.
However, it is expensive and consumes time for 4-5 day of testing.
1

3390 P. Chaimahawan and S. Shaingchin
Journal of Engineering Science and Technology December 2019, Vol. 14(6)
This paper presents an effort of doing an experiment to investigate the deflection
behaviour and proposing charts for selecting the area of FRP for control the deflection
of RC slab. The charts can help engineers to quickly estimate a proper area of FRP
according to the allowable deflection and applied load.
2. Experimental Program
The slab specimens were designed and constructed to represent RC slab. The
dimensions of specimens are 600 mm width, 100 mm thickness and 3,000 mm
length. The longitudinal steel of 5 and 10 mm diameter deformed bars (s = 0.010),
and the transverse steel of 12 and 9 mm rounded bars were used. There were two
series of specimens, the 1st series was tested under four points bending while the 2nd
series was tested under 3 points bending.
Specimens of the 1st series consisted of one control specimen (C1) (represented a
prototype without strengthening) and three strengthened specimens. The dimensions
and steel reinforcement details of the strengthened specimens were identical with the
control specimen but it was different in number and locations of the installed CFRP
as shown in Fig. 1. In order to study deflection behaviour with different CFRP
configurations, there are three configurations of 100 mm width and 1.2 mm thickness
CFRP plate. The strengthened specimens consisted of one row-1 ply CFRP (S1-1
specimen), two rows-1ply CFRP (S1-2 specimen) and one row-2 ply CFRP (S1-3).
It should be noted that specimen S1-2 and S1-3 had the same area of CFRP plates,
but it was different in locations of installation. Specimen S1-2 installed separately
while specimen S1-3 installed overlapped in the same location. All specimens in the
1st series were tested under four points bending through a 100 kN hydraulic jack and
transfer beam. Schematic of tested set up for 1st series specimens is shown in Fig. 2.
Fig. 1. Dimensions and reinforcement details of 1st series specimens.
600 mm
5-DB10
Specimen S1-1
1row-1 ply
CFRP 1.2mm
2rows -1 ply
CFRP 1.2mm2rows-2 plies
CFRP 1.2mm
100 mm
Specimen S1-2 Specimen S1-3
[email protected]@[email protected]
100mm
600 mm
5-DB10
Specimen C1
100 mm
5-DB10 5-DB10
2.8 m
5-DB10
65 mm

Deflection Control of Reinforced Concrete Slab Strengthened with . . . . 3391
Journal of Engineering Science and Technology December 2019, Vol. 14(6)
Fig. 2. Schematic figure of 1st series test set up.
Dimension and details of 2nd series specimens are shown in Fig. 3. This series
consisted of 1 control specimen (C2) and 4 strengthened specimens. Specimen S2-
1 was strengthened with 1 row-1 ply CFRP plate 50 mm width and 1.2 mm
thickness. Specimen S2-2 was strengthened with 2 rows- 1 ply CFRP. Specimen
S2-3 was strengthened with 1 row-2 plies CFRP. Specimen S2-4 was strengthened
with 2 rows-2 plies CFRP. All specimens in 2nd series were tested under 3 points
bending. Tested set up is shown in Fig. 4.
Concrete mix proportion for 1 cubic meter, using the ratio of water and cement
of value 0.49, consisted of cement 282 kg, coarse aggregate 1015 kg, fine aggregate
930 kg, admixture type B&D 700 millilitres and water 137 litres. Table 1 shows
the properties of materials for all specimens. The unidirectional carbon-fibre
reinforced panel with epoxy resin dipped and cured 50 and 100 mm width and 1.2
mm thickness were used for this study.
Fig. 3. Dimensions and reinforcement details of 2nd series specimens.
L/3L/3L/3
L = 2.8 m
Hydraulic jackTransfer beamspecimen
Suppport
Rubber
LVDT
LVDT LVDT
2P
PP
Moment diagramM=(P).(L/3)
P P
or wood
C1
600 mm
5-DB10
Specimen S2-2
2rows-1 ply
CFRP 1.2mm
100 mm
Specimen S2-3 Specimen S2-4
[email protected]@[email protected]
600 mm
5-DB10
Specimen C2
100 mm
5-DB10 5-DB10
600 mm
5-DB10
Specimen S2-11row-1 ply
CFRP 1.2mm
100 mm
50mm
50mm 50mm
1row-2 plies
CFRP 1.2mm 50mm 50mm 50mm
2rows-2 plies
CFRP 1.2mm
65 mm

3392 P. Chaimahawan and S. Shaingchin
Journal of Engineering Science and Technology December 2019, Vol. 14(6)
Fig. 4. Schematic figure of 2nd series test set up.
Table 1. Properties of materials.
Strength of bar DB10
Yield strength 502.5 MPa
Ultimate strength 538.0 MPa
Strength of bar RB9
Yield strength 353.2 MPa
Ultimate strength 497.5 MPa
Compressive strength of concrete (28 days)
1st series 23.4 MPa
2nd series 22.4 MPa
Strength of CFRP plate
Ultimate tensile strength 3,008 MPa
Modulus of elasticity 165 GPa
Epoxy adhesive
Compressive strength 100 MPa
Flexural strength 32 MPa
Bonding strength to concrete 3.4 MPa
Bonding strength to steel 25 MPa
3. Experimental Results
All specimens were loaded until the specimens failed or the stroke of hydraulic
jack reach its maximum displacement (60 mm). The flexural cracks were
observed at the bottom of all slab specimens as shown in Figs. 5 and 6. It was
observed that the 1st series specimens had a number of cracks comparing with
the 2nd series of specimens.
The specimens of the 1st series were tested by four-point bending and the
maximum moments were applied through the middle part of slabs. Therefore, the
reinforcing bars resisted the distributed tension force and many cracks were
observed. For 2nd series specimens, which were tested by three-point bending, the
maximum applied moments were at the centre point and the reinforcing bars were
applied by the concentrated tension force. The crack spacing observed in 2nd series
specimens was larger than one observed in 1st series specimens.
L/2 L/2
L = 2.8 m
Hydraulic jackspecimen
SuppportRubber
LVDT
LVDT LVDT P
P/2P/2
Moment diagramM=(PL/4)
or wood

Deflection Control of Reinforced Concrete Slab Strengthened with . . . . 3393
Journal of Engineering Science and Technology December 2019, Vol. 14(6)
(a) Specimen C1. (b) Specimen S1-1.
(c) Specimen S1-2. (d) Specimen C2.
(e) Specimen S2-2.
Fig. 5. Crack patterns of specimens C1, S1-1, S1-2 and C2.

3394 P. Chaimahawan and S. Shaingchin
Journal of Engineering Science and Technology December 2019, Vol. 14(6)
(a) Specimen S1-3. (b) Specimen S2-1.
(c) Specimen S2-3. (d) Specimen S2-4.
Fig. 6 Crack patterns and debonding of CFRP
for specimens S1-3, S2-1, S2-3 and S2-4.
The relationship between load and deflection for all specimens are shown in
Fig. 7 and Table 2 summarises the test results at yielding of longitudinal bars and
failure mode. Specimens C1, S1-1, S1-2, C2 and S2-2 were tested until the
deflection reached maximum stroke of hydraulic jack (60 mm) while specimens
S1-3, S2-1, S2-3 and S2-4 were failed by debonding of CFRP as shown in Fig. 6.
The load versus strain for all specimens are plotted in Fig. 8. Comparing with the
yield strain of longitudinal bars (2500 micron), the bars in all specimens were yielded except the specimens S1-3. Specimen S1-3 failed by debonding of CFRP
before yielding of longitudinal bars while specimens S2 -1, S2-3 and S2-4 failed
by debonding of CFRP after yielding of longitudinal bars . It should be noted that
engineers must carefully consider the strength of debonding of CFRP in order to
ensure the ductility of the slab. To define the mode of flexural failure, the strain
of longitudinal bars from testing should more than an analytical value
corresponding to the ultimate compressive strain of concrete (0.003). Based on
the assumption that strain diagram of the section is linear, the analytical strains
of longitudinal bars is equal to 0.003(d-c)/c where the compressive length (c) is
calculated from equilibrium equation as expressed in Eq. (1). The strains of
longitudinal bars from the experiment and the analysis are shown in Table 3. It is

Deflection Control of Reinforced Concrete Slab Strengthened with . . . . 3395
Journal of Engineering Science and Technology December 2019, Vol. 14(6)
indicated that the measured strains of longitudinal bars for all specimens except
specimen S1-3 were more than the analytical values. This is implied that all
specimens except specimen S1-3 were failed by flexural mode while the
specimen S1-3 was failed by debonding of CFRP.
It should be noted that the measured strains in 1st series specimens were less
than the strains observed in the 2nd series of specimens. As described in the
previous paragraph, the 1st series specimens were tested by four-point bending
and the reinforcing bars resisted the distributed tension force through the middle
part of slabs while the 2nd series specimens were tested by three-point bending
and the reinforcing bars resisted the concentrated tension force at the centre point.
The strengthening specimens had a significant reduction of slab deflection.
Consider the control specimen C1 in the elastic range, the yield load was 10.4 kN
with 42 mm of deflection. It found that, at the same load, CFRP strengthening could
reduce deflection about 27 mm (reduce 36%), 20 mm (reduce 51%) and 19 mm
(reduce 55%) for specimen S1-1, S1-2 and S1-3, respectively.
The deflection behaviour for the 2nd series specimens trended to be the same as
the 1st series of specimens. Considering the control specimen C2 in elastic range,
the yield load was 10.1 kN with 30 mm of deflection.
The CFRP strengthening could also reduce deflection about 19 mm (reduce
36%), 16 mm (reduce 46%), 14 mm (reduce 55%) and 10 mm (reduce 67%) for
specimen S2-1, S2-2, S2-3 and S2-4, respectively. The specimens S1-3 and S2-3,
which had CFRP configuration of 2 layers attached CFRP plates were more stiffed
than the specimens S1- 2 and S2-2, which attached CFRP 2 rows and 2 plies. This
fact can be confirmed by the value of elastic stiffness in column 8 of Table 2. The
strengthened specimens have a higher value of stiffness than the control specimens.
The comparison of the tested moment and moment capacity calculated from
ACI318-14 [12] for control specimens and ACI440.2R-17 [13] for strengthened
specimens are shown in Table 3. Based on perfect bonding between the CFRP plate
and concrete, the equations from ACI318- 14 [12] and ACI440.2R-17 [13] can
predict the moment capacity agreed with the tested result. The moment capacity
ratio of tested result per predicted equation is around 0.86-1.20 except the specimen
S1-3 and S2-3, which the ratios are around 0.78-0.79. This is because the specimens
S1-3 and S2-3 failed by debonding of CFRP before yielding of longitudinal bars.
For the 1st series, the moment capacity was increased for strengthened specimens
compared with control specimen, approximately 1.5 and 2.0 times depending on the
amount of CFRP. For the 2nd series, the moment capacity had a similar trend as the 1st series. It was increased about 1.6, 2.4 and 3.3 times for specimens strengthened with
one plate, two plates and four plates of CFRP, respectively.
However, the strengthened specimens with 1 row and 2 plies of CFRP plates
(S1-3 and S2-3) was not successful to increase load capacity as expected because
of premature debonding between CFRP and slab . It is implied that the
configuration that CFRP plate installed directly to the surface of a concrete slab
is more efficient than the overlay installed CFRP configuration . Design
recommendation for overlay CFRP configuration maybe uses a maximum load
around three-quarters of the calculated capacity.

3396 P. Chaimahawan and S. Shaingchin
Journal of Engineering Science and Technology December 2019, Vol. 14(6)
(a) 1st series. (b) 2nd series.
Fig. 7. Relationship between load and deflection.
(a) 1st series. (b) 2nd series.
Fig. 8. Relationship between load and strain of longitudinal bar.
Table 2. Summary of experimental results.
Series Specimen
Area
(CFRP)
(mm2)
Pyield
(kN) yield
(mm)
Pmax
(kN) Max
(mm)
Stiffness
(kN/mm)
Failure
mode*
1st
C1 - 10.40 41.8 13.39 60.8 0.249 Y and S
S1-1 120 18.27 46.6 22.68 60.8 0.392 Y and S
S1-2 240 21.58 44.7 26.94 60.8 0.483 Y and S
S1-3 240 - - 20.48 39.9 0.513 D
2nd
C2 - 10.08 30.1 11.97 60.2 0.335 Y and S
S2-1 60 14.49 30.1 18.59 50.0 0.481 Y and D
S2-2 120 20.48 36.0 29.30 60.0 0.569 Y and S
S2-3 120 17.01 28.1 20.48 34.9 0.606 Y and D
:S2-4 240 35.28 46.1 39.38 58.0 0.766 Y and D
*Y: Yielding of longitudinal bar, D: Debonding of CFRP, S: Stroke limitation.
0
5
10
15
20
25
30
35
40
0 10 20 30 40 50 60
Lo
ad
P(k
N)
deflection (mm)
C1
S1-1
S1-2
S1-3
0
5
10
15
20
25
30
35
40
0 10 20 30 40 50 60
Lo
ad
P(k
N)
deflection (mm)
C2
S2-1
S2-2
S2-3
S2-4
0
10
20
30
40
0 2000 4000 6000 8000
Lo
ad
k
N
strain (micron)
C1
S1-1
S1-2
S1-3
yield strain0
10
20
30
40
0 5000 10000 15000 20000
Lo
ad
k
N
strain (micron)
C2S2-1S2-2S2-3S2-4
yield strain
Deflection Control of Reinforced Concrete Slab Strengthened with . . . . 3397
Journal of Engineering Science and Technology December 2019, Vol. 14(6)
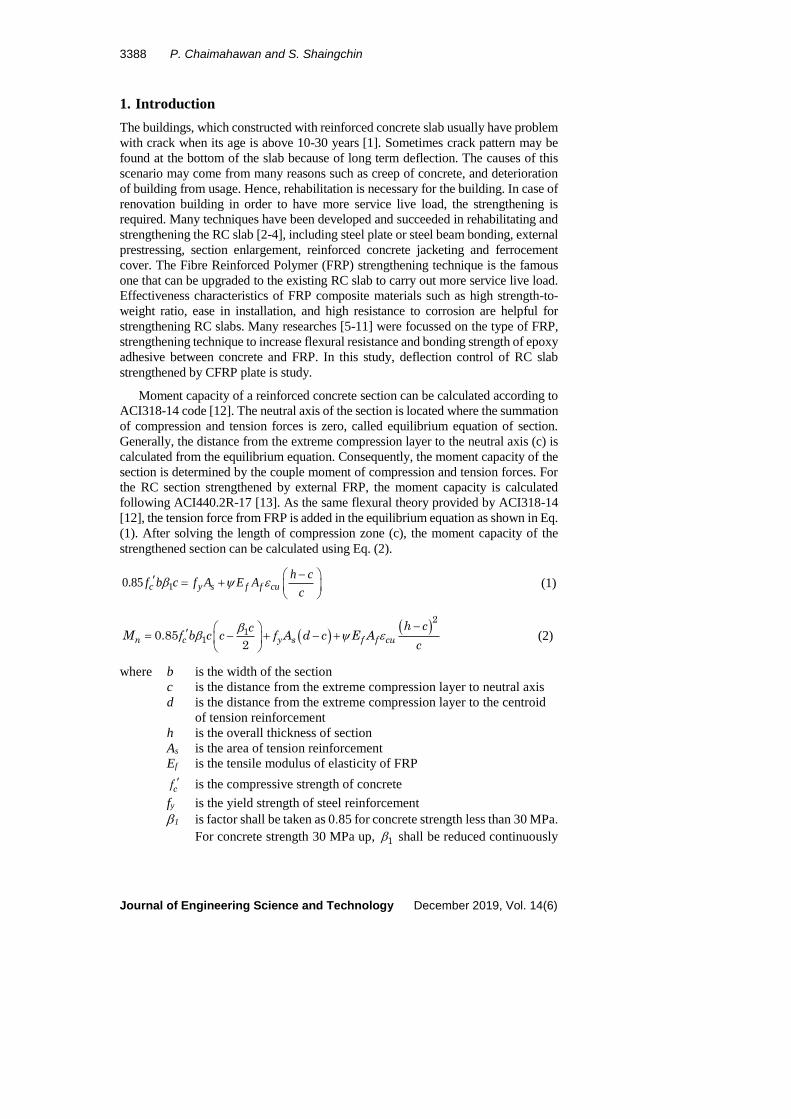
Table 3. Moment capacity and strains of longitudinal bars.
Series Specimen
Maximum
moment (kN.m)
Strains of long.
bars (micron) Ratio
MTest/MPredict MTest MPredict Test Predict
1st
C1 12.50 11.20 8,000 7,020 1.12
S1-1 21.17 19.80 3,000 3,100 1.07
S1-2 25.14 23.86 2,940 2,240 1.05
S1-3 19.11 24.18 1,625 2,240 0.79
2nd
C2 8.38 9.76 22,300 6,600 0.86
S2-1 13.01 15.06 18,100 3,930 0.86
S2-2 20.51 18.85 21,500 2,940 1.09
S2-3 14.33 18.85 4,100 2,940 0.78
S2-4 27.56 22.94 8,300 2,168 1.20
4. Deflection Prediction
An elastic deflection () at mid-span can be calculated based on the theory of
structure as shown in Eqs. (5) and (6) [19] for 1st and 2nd series specimens,
respectively.
2 23 424 c e
PaL a
E I (5)
3
48 c e
PL
E I (6)
where P is load on the specimen
L is the span of specimen
is shear span, which is equal to L/3 for 1st series
E c is the modulus of elasticity of concrete
Ie is an effective moment of inertia as previously shown in Eq. (4)
based on Bischoff [17] model.
The effective moment of inertia as expressed in Eq. (4) depends on the moment
of inertia of cracked section (Icr) and the ratio between applied moment and cracked
moment. The moment of inertia of cracked section (Icr) can be calculated as Eq. (7)
by transforming the area of reinforcing bars and CFRP to be an area of concrete.
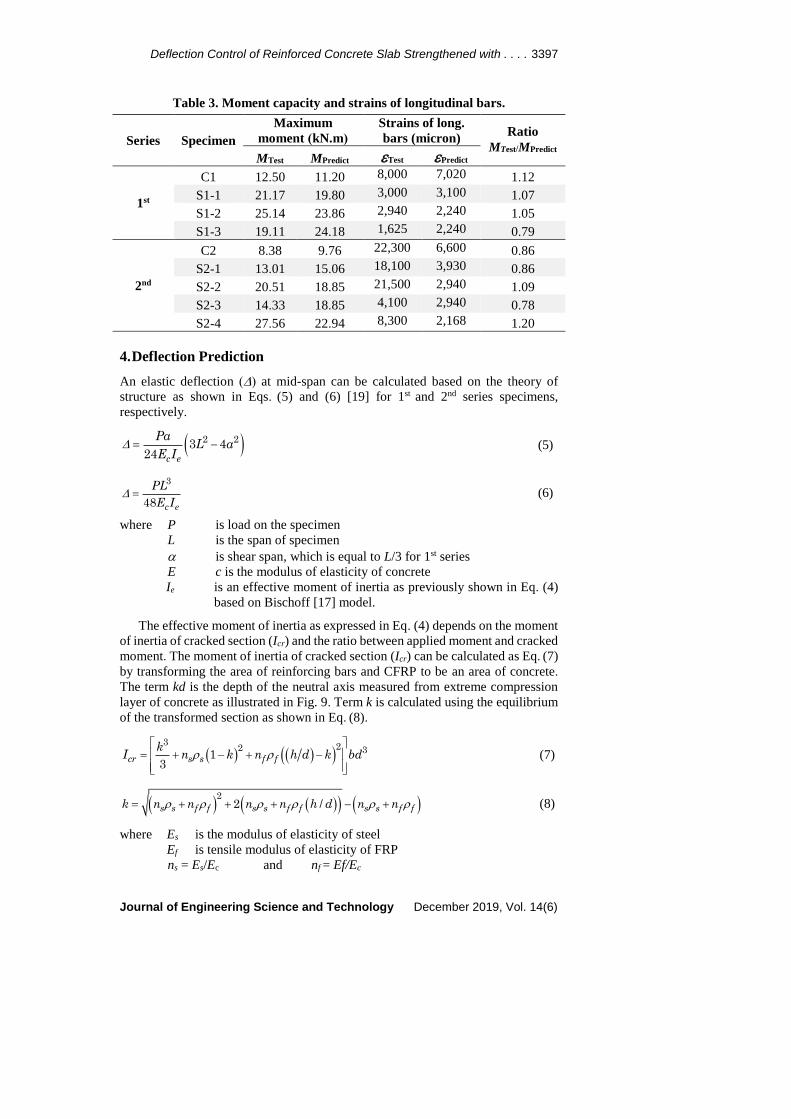
The term kd is the depth of the neutral axis measured from extreme compression
layer of concrete as illustrated in Fig. 9. Term k is calculated using the equilibrium
of the transformed section as shown in Eq. (8).
3 22 313
cr s s f f
kI n k n h d k bd (7)
22 /s s f f s s f f s s f fk n n n n h d n n (8)
where Es is the modulus of elasticity of steel
Ef is tensile modulus of elasticity of FRP
ns = Es/Ec and nf = Ef/Ec
3398 P. Chaimahawan and S. Shaingchin
Journal of Engineering Science and Technology December 2019, Vol. 14(6)
s is ratio of reinforcement = As/(bd)
f is FRP reinforcement ratio = Af/(bd)
As is the area of tension reinforcement
Af is the area of FRP external reinforcement
h is the overall thickness of the section
Fig. 9 Transformed section, strain and
stress diagrams of strengthened RC section.
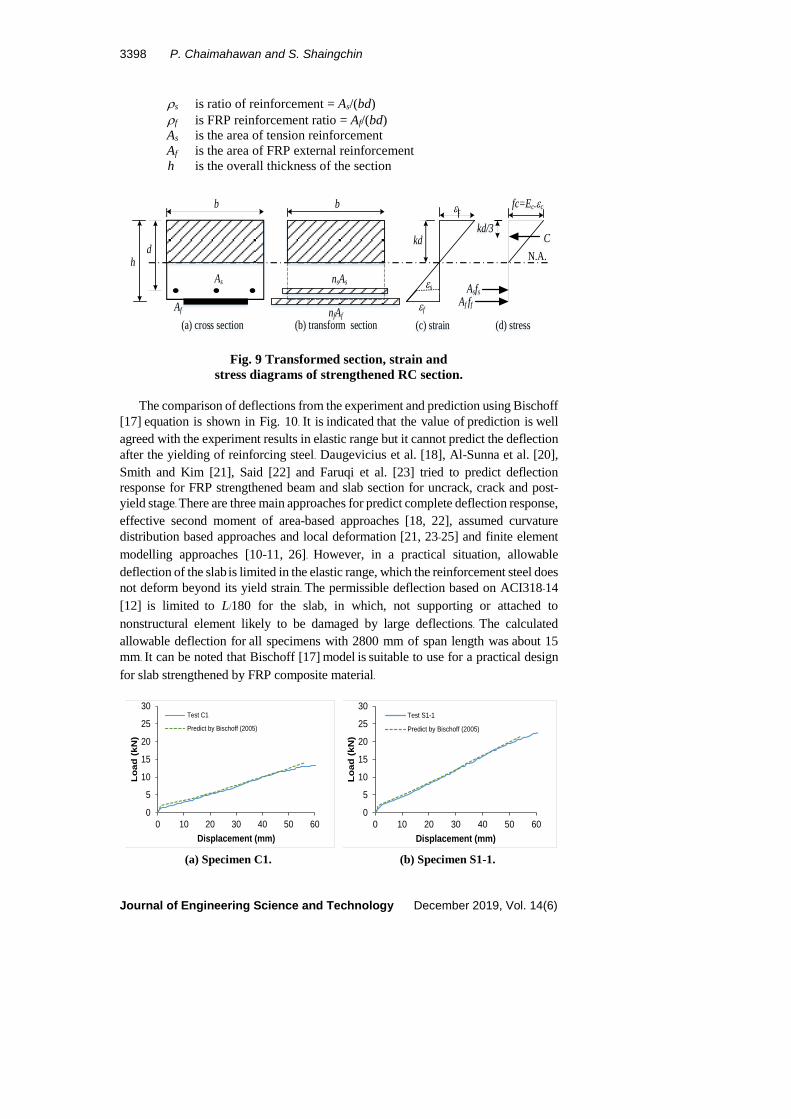
The comparison of deflections from the experiment and prediction using Bischoff [17] equation is shown in Fig. 10. It is indicated that the value of prediction is well
agreed with the experiment results in elastic range but it cannot predict the deflection
after the yielding of reinforcing steel. Daugevicius et al. [18], Al-Sunna et al. [20],
Smith and Kim [21], Said [22] and Faruqi et al. [23] tried to predict deflection
response for FRP strengthened beam and slab section for uncrack, crack and post-
yield stage. There are three main approaches for predict complete deflection response,
effective second moment of area-based approaches [18, 22], assumed curvature
distribution based approaches and local deformation [21, 23-25] and finite element
modelling approaches [10-11, 26]. However, in a practical situation, allowable
deflection of the slab is limited in the elastic range, which the reinforcement steel does
not deform beyond its yield strain. The permissible deflection based on ACI318-14
[12] is limited to L/180 for the slab, in which, not supporting or attached to
nonstructural element likely to be damaged by large deflections. The calculated
allowable deflection for all specimens with 2800 mm of span length was about 15
mm. It can be noted that Bischoff [17] model is suitable to use for a practical design
for slab strengthened by FRP composite material.
(a) Specimen C1. (b) Specimen S1-1.
d
As
c
kd
N.A.
b
(a) cross section (c) strain (d) stress
h
Af
Asfs
Af ff
kd/3
fc=Ec.c
C
s
f
nsAs
b
(b) transform sectionnfAf
0
5
10
15
20
25
30
0 10 20 30 40 50 60
Lo
ad
(k
N)
Displacement (mm)
Test C1
Predict by Bischoff (2005)
0
5
10
15
20
25
30
0 10 20 30 40 50 60
Lo
ad
(kN
)
Displacement (mm)
Test S1-1
Predict by Bischoff (2005)

Deflection Control of Reinforced Concrete Slab Strengthened with . . . . 3399
Journal of Engineering Science and Technology December 2019, Vol. 14(6)
(c) Specimen S1-2. (d) Specimen S1-3.
(e) Specimen C2. (f) Specimen S2-1.
(g) Specimen S2-2. (h) Specimen S2-3.
(i) Specimen S2-4.
Fig. 10. Comparison of deflections from
experiment and prediction using Bischoff’s equation.
0
5
10
15
20
25
30
0 10 20 30 40 50 60
Lo
ad
(k
N)
Displacement (mm)
TEST_S1-2
Predict by Bischoff (2005)
0
5
10
15
20
25
30
0 10 20 30 40 50 60
Lo
ad
(k
N)
Displacement (mm)
TEST_S1-3
Predict by Bischoff (2005)
0
5
10
15
20
25
30
0 10 20 30 40 50 60
Lo
ad
(k
N)
Displacement (mm)
Test-C2
Predict by Bischoff (2005)
0
5
10
15
20
25
30
0 10 20 30 40 50 60
Lo
ad
(k
N)
Displacement (mm)
Test-S2-1
Predict by Bischoff (2005)
0
5
10
15
20
25
30
0 10 20 30 40 50 60
Lo
ad
(kN
)
Displacement (mm)
Test-S2-2
Predict by Bischoff (2005)
0
5
10
15
20
25
30
0 10 20 30 40 50 60
Lo
ad
(kN
)
Displacement (mm)
Test-S2-3
Predict by Bischoff (2005)
0
5
10
15
20
25
30
35
40
0 10 20 30 40 50 60
Lo
ad
(kN
)
Displacement (mm)
Test-S2-4
Predict by Bischoff(2005)

3400 P. Chaimahawan and S. Shaingchin
Journal of Engineering Science and Technology December 2019, Vol. 14(6)
5. Proposed Charts for Deflection Control
Two charts are proposed for estimating the area of CFRP that the effective moment
of inertia (Ie) is stiff enough to control the deflection of RC slabs in-service stage.
The charts are constructed from Bischoff [17] model and formatted in unitless.
Equations (4) and (7) can be rewritten in a unitless format by dividing the moment
of inertia of gross section as shown in Eqs. (9) and (10).
2
/1
1 1
cr ge
gcr cr
g a
I II
I I M
I M
(9)
32234 12 1 12cr
s s f fg
I dk n k n h d k
I h (10)
Chart no.1 (Fig. 11) is the relationship of the ratios of (Mcr/Ma), (Ie/Ig) and (Icr/Ig)
constructed from Eq. (9). Engineers must know the cracking moment, an applied
moment from service load, the moment of inertia of gross section, and effective
moment of inertia for control deflection. Then, using chart no.1, the ratio of (Icr/Ig)
can be obtained from the known values of the ratios (Ie/Ig) and (Mcr/Ma).
Fig. 11. Proposed design chart no. 1.
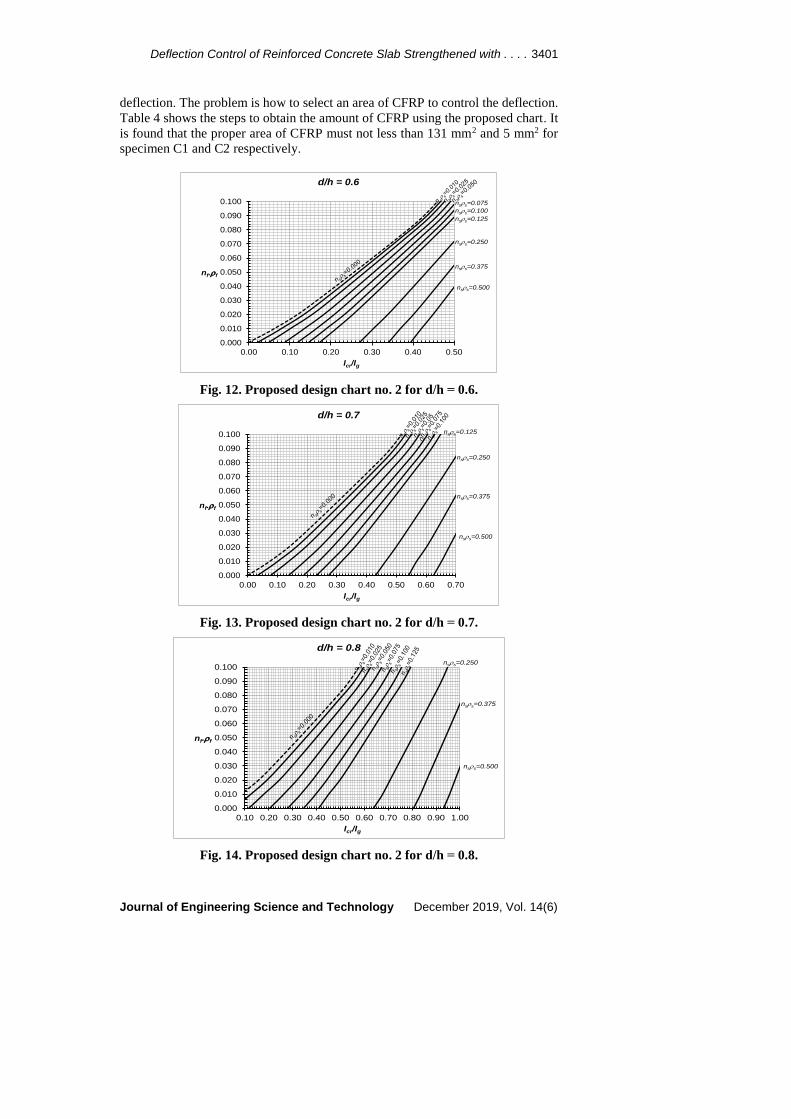
Chart no. 2 (Figs. 12-14) is the relationship of the ratio of (Icr/Ig), transformed
area of reinforcement ratio (ns s) and transformed area of CFRP ratio (nf.f)
constructed from Eqs. (8) and (10) by ratios of h/d equal to 0.6, 0.7, and 0.8.
Engineers know the transformed area of reinforcement ratio (ns s) before
strengthening and know the required ratio of (Icr/Ig) to control the deflection from
the previous step. Then, using chart no. 2, the transformed area of CFRP ratio (nf
f) can be easily obtained.
To illustrate how to use the proposed design chart, the control specimens C1
and C2 are picked to consider in deflection aspect. If the service loads are about
two-thirds of the yield loads, the service load P is about 7 kN. The deflections from
the experiment are about 28.9 mm and 19.5 mm for specimen C1 and C2
respectively. It is shown that the deflections are larger than 15 mm of the control
0.00
0.05
0.10
0.15
0.20
0.25
0.30
0.35
0.40
0.45
0.50
0.00 0.10 0.20 0.30 0.40 0.50 0.60 0.70 0.80
Icr/Ig
Ie/Ig
Deflection Control of Reinforced Concrete Slab Strengthened with . . . . 3401
Journal of Engineering Science and Technology December 2019, Vol. 14(6)
deflection. The problem is how to select an area of CFRP to control the deflection.
Table 4 shows the steps to obtain the amount of CFRP using the proposed chart. It
is found that the proper area of CFRP must not less than 131 mm2 and 5 mm2 for
specimen C1 and C2 respectively.
Fig. 12. Proposed design chart no. 2 for d/h = 0.6.
Fig. 13. Proposed design chart no. 2 for d/h = 0.7.
Fig. 14. Proposed design chart no. 2 for d/h = 0.8.
0.000
0.010
0.020
0.030
0.040
0.050
0.060
0.070
0.080
0.090
0.100
0.00 0.10 0.20 0.30 0.40 0.50
nf.f
Icr/Ig
d/h = 0.6
nss=0.500
nss=0.375
nss=0.250
nss=0.125
nss=0.100
nss=0.075
0.000
0.010
0.020
0.030
0.040
0.050
0.060
0.070
0.080
0.090
0.100
0.00 0.10 0.20 0.30 0.40 0.50 0.60 0.70
nf.f
Icr/Ig
d/h = 0.7
nss=0.500
nss=0.375
nss=0.250
nss=0.125
0.000
0.010
0.020
0.030
0.040
0.050
0.060
0.070
0.080
0.090
0.100
0.10 0.20 0.30 0.40 0.50 0.60 0.70 0.80 0.90 1.00
nf.f
Icr/Ig
d/h = 0.8
nss=0.500
nss=0.375
nss=0.250

3402 P. Chaimahawan and S. Shaingchin
Journal of Engineering Science and Technology December 2019, Vol. 14(6)
Table 4. Illustration of using proposed chart for deflection control.
Steps
Specimens
C1 C2
1. Control displacement (mm) 15 15
2. Service load P (kN) 7 7
3. Required Ie (mm4) Eq. (4) 15.99×10⁶ 9.59×10⁶
4. Known Ig (mm4) 50.00×10⁶ 50.00×10⁶
5. Parameter Ie/Ig 0.32 0.19
6. Mcr (kN-mm) 2,419 2,366
7. Ma (kN-mm) 6,533 4,900
8. Mcr/Ma 0.29 0.15
9. Icr/Ig (from chart no.1, Fig. 10) 0.24 0.37
10. ns = Es/Ec 8.80 8.99
11. nf = Ef/Ec 7.42 8.42
12. f = As/(bd) 0.010 0.010
13. ns. f 0.09 0.09
14. Parameter d/h 0.65 0.65
15. nf. f (from chart no. 2, Fig. 11 d/h = 0.60) 0.036 0.002
16. nf. f (from chart no. 2, Fig. 12 d/h = 0.70) 0.014 0.000
17. nf. f (interpolation for d/h = 0.65) 0.025 0.001
18. Required Af (mm2) 131 5
6. Conclusions
From this study and test results, the conclusions can be drawn:
The deflection of RC slab strengthened with CFRP plate was reduced
significantly about 36%-55% for the 1st series specimens and about 36%-67%
for the 2nd series specimens. The moment capacity was increased about 1.5-3.3
times depends on the area of the CFRP plate.
The effective configuration is that CFRP plates were installed directly to the
surface of the concrete slab. It is not recommended to install CFRP by
overlaying because there is a chance to fail due to debonding of CFRP before
yielding of longitudinal bars.
The design charts for selecting the proper area of CFRP to control the deflection
of the RC slab are proposed. The charts are constructed from Bischoff’s equation,
which can predict the deflection agreed with the experimental results and
formatted in unitless. Moreover, the charts are simple to estimate the area of
strengthening the CFRP plate for controlling service deflection.
In this paper, the RC slabs strengthened by CFRP plate were studied in one-
way bending behaviour. Further study should be extended to investigate the
deflection behaviour of two-ways slab or flat slab system.
Acknowledgements
The authors would like to acknowledge PRM concrete co, ltd. for supporting the
test facilities. This research is financially supported by University of Phayao
research fund no. RD60056.

Deflection Control of Reinforced Concrete Slab Strengthened with . . . . 3403
Journal of Engineering Science and Technology December 2019, Vol. 14(6)
Nomenclatures
a Shear span, which is equal to L/3 for series 1
Af Area of FRP external reinforcement
As Area of tension reinforcement
b Width of section
c
Distance from extreme compression fibre to neutral axis
d Distance from extreme compression fibre to centroid
of tension reinforcement
df Distance from extreme compression fibre to centroid
of tension reinforcement
Ec Modulus of elasticity of concrete
Ef Tensile modulus of elasticity of FRP
Es Modulus of elasticity of steel
fy Specified yield strength of non-prestressed steel reinforcement
cf Specified compressive strength of concrete
h Overall thickness of section
Icr Moment of inertia of cracked section transformed to concrete
Ie Effective moment of inertia
Ig Moment of inertia of gross section
kd Depth of neutral axis measured from extreme
compression fibre
L Span of specimen
Ma Apply moment
Mcr Cracking moment
Mn Moment capacity of strengthened section
nf Modular ratio of elasticity between FRP and concrete = Ef/Ec
ns Modular ratio of elasticity between steel and concrete = Es/Ec
P Load apply on specimen
Greek Symbols
1 Factor shall be taken as 0.85 for concrete strength up to and
including 30 MPa. For strength above 30 MPa, 1 shall be
reduced continuously at a rate 0.05 for each 7 MPa of strength in
excess of 30 MPa, but 1 shall not be taken less than 0.65
d Reduction coefficient related to the reduced tension stiffening
exhibited by FRP-reinforced members
cu Strain at concrete crushing = 0.003
f FRP reinforcement ratio = Af/(bd)
s Ratio of non-prestressed reinforcement = As/(bd)
FRP strength reduction factor = 0.85 for flexure
Abbreviations
CFRP Carbon Fibre Reinforced concrete
FRP Fibre Reinforced Polymer
RC Reinforced Concrete

3404 P. Chaimahawan and S. Shaingchin
Journal of Engineering Science and Technology December 2019, Vol. 14(6)
References
1. Wight, J.K.; and Macgregor, J.G. (2012). Reinforced concrete mechanics and
design. (6th ed.). Upper Saddle River, New Jersey, United States of America:
Pearson Education, Inc.
2. Banu, D.; and Taranu, N. (2010). Traditional solutions for strengthening
reinforced concrete slabs. Bulletin of the Polytechnic Institute of Jassy,
3(3), 53-62.
3. Oehlers, D.J.; and Seracino, R. (2004). Design of FRP and steel plated RC
structures. Retrofitting beams and slabs for strength, stiffness and ductility.
Oxford, United Kingdom: Elsevier Ltd.
4. Al-Kubaisy, M.A.; and Jumaat, M.Z. (2000). Flexural behaviour of reinforced
concrete slabs with ferrocement tension zone cover. Construction and Building
Materials, 14(5), 245-252.
5. Al-Rousan, R.; Issa, M.; and Shabila, H. (2012). Performance of reinforced
concrete slabs strengthened with different types and configurations of CFRP.
Composites Part B: Engineering, 43(2), 510-521.
6. Fathelbab, F.A.; Ramadan, M.S.; and Al-Tantawy, A. (2014). Strengthening of RC
bridge slabs using CFRP sheets. Alexandria Engineering Journal, 53(4), 843-854.
7. Smith, S.T.; Zhang, H.; and Wang, Z. (2013). Influence of FRP anchors on the
strength and ductility of FRP-strengthened RC slabs. Construction and
Building Materials, 49, 998-1012.
8. Soudki, K.; and Maaddawy, T.E. (2008). Strengthening of reinforced concrete
slabs with mechanically-anchored unbonded FRP system. Construction and
Building Materials, 22(4), 444-455.
9. Soudki, K.; El-Sayed, A.K.; and Vanzwol, T. (2012). Strengthening of
concrete slab-column connections using CFRP strips. Journal of King Saud
University-Engineering Sciences, 24(1), 25-33.
10. Liu, I.S.T.; Oehlers, D.J.; and Seracino, R. (2007). Study of intermediate crack
debonding in adhesively plated beams. Journal of Composites for
Construction, 11(2), 175-183.
11. Baky, H.A.; Ebead, U.A.; and Neale, K.W. (2007). Flexural and interfacial
behaviour of FRP-strengthened reinforced concrete beams. Journal of
Composites for Construction, 11(6), 629-639.
12. ACI Committee 440. (2014). Building code requirements for structural
concrete. ACI Standards, ACI318-14.
13. ACI Committee 440. (2017). Guide for the design and construction of
externally bonded FRP systems for strengthening concrete structures. ACI
Standards, ACI440.2R-17.
14. ACI Committee 440. (2006). Guide for the design and construction of
structural concrete reinforced with Fibers-Reinforced Polymer (FRP) bars.
ACI Standards, ACI 440.1R-06.
15. Gao, D.; Benmokrane, B.; and Masmoudi, R. (1998). A calculating method of
flexural properties of FRP-reinforced concrete beam: Part 1: Crack width and
deflection. Technical Report. Department of Civil Engineering, University of
Sherbrooke, Sherbrooke, Québec, Canada.
Deflection Control of Reinforced Concrete Slab Strengthened with . . . . 3405
Journal of Engineering Science and Technology December 2019, Vol. 14(6)
16. Branson, D.E. (1965). Instantaneous and time-dependent deflections of
simple and continuous reinforced concrete beams. Alabama, United
States of America: State of Alabama Highway Department, Bureau of
Research and Development .
17. Bischoff, P.H. (2005) Reevaluation of deflection prediction for concrete beams
reinforced with steel and fiber reinforced polymer bars. Journal of Structural
Engineering, 131(5), 752-767.
18. Daugevicius, M.; Valivonis, J.; Marciukaitis, G. (2012). Deflection analysis of
reinforced concrete beams strengthened with carbon fibre reinforced polymer
under long-term load action. Journal of Zheijiang University - Science A: Applied Physics & Engineering, 13(8), 571-583.
19. Pytel, A.; and Kiusalaas, J. (2012). Mechanics of materials (2nd ed.). Stamford,
United States of America: Cengage Learning.
20. Al-Sunna, R.; Pilakoutas, K.; Hajirasouliha, I.; and Guadagnini, M. (2012). Deflection behavior of FRP reinforced concrete beams and slabs: An
experimental investigation. Composites Part B: Engineering, 43(5), 2125-2134.
21. Smith S.T.; and Kim S.J. (2010). Deflection calculation of FRP-strengthened
reinforced concrete flexural members. Australian Journal of Structural
Engineering, 11(2), 75-86.
22. Said, H. (2010). Deflection prediction for FRP-strengthened concrete beams.
Journal of Composites for Construction, 14(2), 244-248.
23. Faruqi, M.; Wu, C.C.; and Benson, F. (2003). Development of deflection
equations using moment-curvature relationships for reinforced concrete beams
strengthened with fibre-reinforced polymer (FRP) plates. Magazine of
Concrete Research, 55(6), 549-557.
24. Charkas, H.; Rasheed, H.A.; and Melhem, H. (2003). Rigorous procedure for
calculating deflections of fiber-reinforced polymer-strengthened reinforced
concrete beams. ACI Structural Journal, 100(4), 529-539.
25. Rasheed, H.A.; Charkas, H.; and Melham, H. (2004). Simplified nonlinear
analysis of strengthened concrete beams based on a rigorous approach. Journal
of Structural Engineering, 130(7), 1087-1096.
26. Smith, S.T.; and Gravina, R.J. (2007). Modelling debonding failure in FRP
flexurally strengthened members using a local deformation model. Journal of
Composites for Construction, 11(2), 184-191.