deforestation, climate change and the fate of the amazon ... · deforestation, climate change and...
TRANSCRIPT

Foto: David McGrath
Deforestation, Climate Change Deforestation, Climate Change and the Fate of the Amazon Forestsand the Fate of the Amazon Forests
Carlos A NobreBrazilian Institute for Space Research – INPE
Session II: “The Challenge of Environmental Preservation and Infrastructure Development: The Case for Brazil”
Infrastructure Integration and Environmental Preservation in the AmazonBrazil Institute of the Woodrow Wilson Center
Washington, DC, 16 January 2008
Outline of Presentation
• Is there a ‘Tipping Point’ in the Amazon?.
• LUC Drivers and Infrastructure
• A new and sustainable model for the tropics

1Is there a ‘Tipping Point’ in the Amazon?

Humanity has entered the Anthropocene without truly understanding its consequences.
• Growing understanding that the Earth system with its myriad of ecosystems present highly non-linear responses to human pressure, generating regime shifts and alternate stable states, with long periods of slow change followed by periods of abrupt change.
• The integrated nature of Planet Earth, where atmospheric, terrestrial and oceanic processes interact and reinforce each other, generating system feedbacks.
• Nature and humans are intrinsically coupled in social-ecological systems, generating self-reinforcing feedbacks between ecological regime shifts and social transformations.

Are there tipping points we must not cross in theAmazon? How much deforestation? Degree of global warming?
How to to establish a more solid knowledge base on thesystem-wide boundary conditions for Amazon andplanetary sustainability?
Governance and management remain alien to complexities of human life on Planet Earth, and are still focused on optimization of welfare anddevelopment under assumptions of eternal linearityand ability to control “nature”.

Question: are there “tipping points” of deforestation and/or climate change of
other drivers of change to induce abrupt changes to the second biome-climate
stable equilibrium?
Stable State I Stable State II

Externally driven equilibrium change

Need to advance our understanding of critical tipping-points and hot-spot systems at risk.
The picture remains relatively scanty, with limited system-wide mapping of thresholds, cross-scale interactions and how system components reinforce each other amplifying the risk of crossing thresholds.

In 2007, total deforested area (clear-cutting) is 700,000 km2 in Brazilian Amazonia (18%)
Source: Greenpeace/Daniel Beltra
Anthropoenic and Natural Drivers of Environmental Change in Amazonia
DROUGHTS FIRE
DEFORESTATIONGLOBAL WARMING

LAND USE AND COVER CHANGE
DEFORESTATION AND BURNING AROUND THE XINGU INDIGENOUS PARK, MATO GROSSO STATE, BRAZIL, 2004.Source: Tropical deforestation and climate change / edited by Paulo Moutinho and Stephan
Schwartzman. -- IPAM - Instituto de Pesquisa Ambiental da Amazônia, 2005.

PROJECTED LAND COVER CHANGE SCENARIOSControl 20% 40% 50%
60% 80% 100%
or Soybean
Source: Soares-Filho et al., 2006 - Amazon Scenarios Project, LBA Sampaio et al., 2007

Season All Pasture All SoybeanJJA -27.5%
-28.1%SON-39.8%-39.9%
PrecipitationAmazonia - PASTUREArea: East/Northeast
0.6
0.7
0.8
0.9
1.0
1.1
1.2
0% 20% 40% 60% 80% 100%
Deforestation Area (%)
Rel
ativ
e Pr
ecip
itatio
n (p
/p0)
DJFMAMJJASON
Amazonia - SOYBEANArea: East/Northeast
0.6
0.7
0.8
0.9
1.0
1.1
1.2
0% 20% 40% 60% 80% 100%
Deforestation Area (%)
Rela
tive
Prec
ipita
tion
(p/p
0)
DJFMAMJJASON
PASTURE SOYBEAN
Precipitation Anomaly (%)
Sampaio et al., 2007
The reduction in precipitation is larger during the dry season, and is more evident when the deforested area is larger than 40% !

20% 40% 50% 60% 80% 100%
20% 40% 50% 60% 80% 100%
PastagemControle
Threshold of Deforestation at 40%!

70.00%
75.00%
80.00%
85.00%
90.00%
95.00%
100.00%
0% 20% 40% 60% 80% 100% 120%
Área inicial de floresta (%)
Áre
a re
man
esce
nte
de fl
ores
ta (%
)
amzdes
amzflo
abc
e
dcb
a1
2
45
3
Initial Area of Forest Cover (%)
de
1
234
5 Sampaio 2008 PhD Thesis
Fina
l Are
a of
For
est C
over
(%)

GLOBAL WARMING
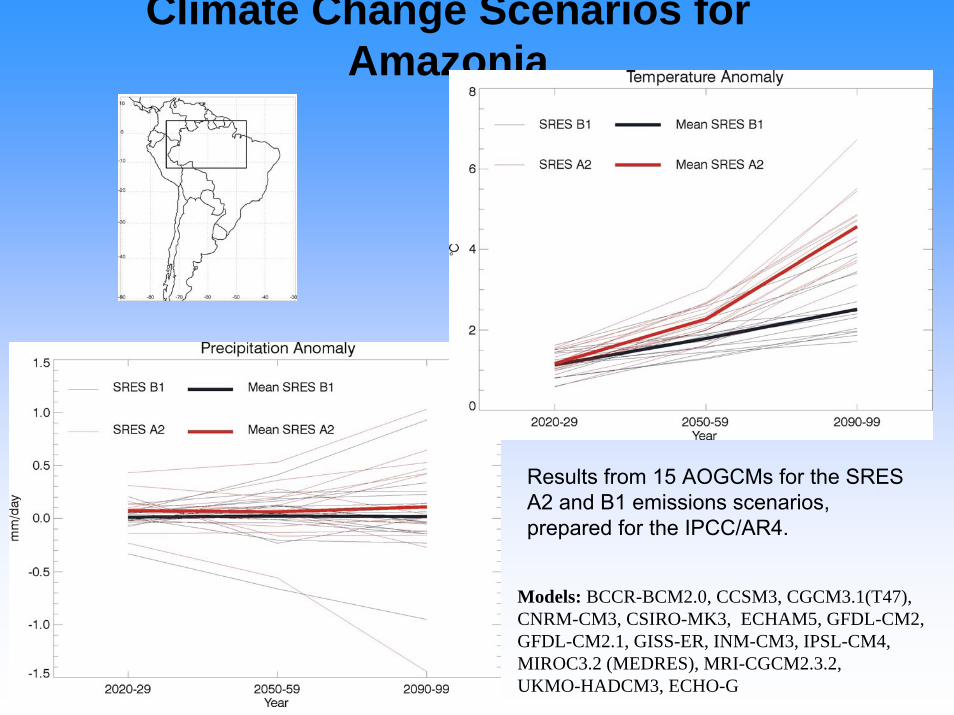
Climate Change Scenarios for Amazonia
Results from 15 AOGCMs for the SRES A2 and B1 emissions scenarios, prepared for the IPCC/AR4.
Models: BCCR-BCM2.0, CCSM3, CGCM3.1(T47), CNRM-CM3, CSIRO-MK3, ECHAM5, GFDL-CM2, GFDL-CM2.1, GISS-ER, INM-CM3, IPSL-CM4, MIROC3.2 (MEDRES), MRI-CGCM2.3.2, UKMO-HADCM3, ECHO-G

Projected distribution of natural biomes in South America for 2090-2099 from 15 AOGCMs for the A2 emissions scenarios, calculated by using CPTEC-INPE PVM.
Climate Change Consequences on the Biome distribution intropical South America
Salazar et al., 2007

Grid points where more than 75% of the models used (> 11 models) coincide as projecting the future condition of the tropical forest and the savanna in relation with the current potential vegetation. The figure also shows the grid points where a consensus amongst the models of the future condition of the tropical forest was not found. for the periods (a) 2020-2029, (b) 2050-2059 and (c) 2090-2099 for B1 GHG emissions scenario and (d), (e) and (f) similarly for A2 GHG emissions scenario.
2050-2059 2090-20992020-2029
Salazar et al., 2007 GRL (accepted)
Climate Change Consequences on the Biome distribution intropical South America
SRES B1 SRES B1 SRES B1
SRES A2 SRES A2 SRES A2

2LUC Drivers and Infrastructure

•• desmatamento acompanhou desmatamento acompanhou EixosEixos (do PIN) e (do PIN) e PPóóloslos (dos PND)(dos PND)•• 90%90% dentro de 100 km dos eixos rodovidentro de 100 km dos eixos rodoviáários principais (1991rios principais (1991--1997)1997)•• 86%86% dentro de 25 km das dentro de 25 km das ááreas de desmatamento reas de desmatamento ““pioneiropioneiro”” anos 70anos 70•• concentraconcentraçção ão -- limites limites CodCod Flor 1965 são excedidos frequentementeFlor 1965 são excedidos frequentemente•• agregaagregaçção de clareiras ão de clareiras ⇒⇒ ““inversãoinversão”” da matriz da matriz (predom(predomíínio de pastos e nio de pastos e
culturas com poucos remanescentes florestais)culturas com poucos remanescentes florestais)
Anos: 1977,Anos: 1977,1985, 1995 1985, 1995
(floresta < 20%)(floresta < 20%)

FIRES and ROADS

Car
valh
o et
al.
(200
1)Land use
Dry season
At year-decade time scales, the majority of fires in Amazonia occur during the dry season as a result of land use
Total prec. index
Dist. main roads index
Prob
. fire
Model
Data
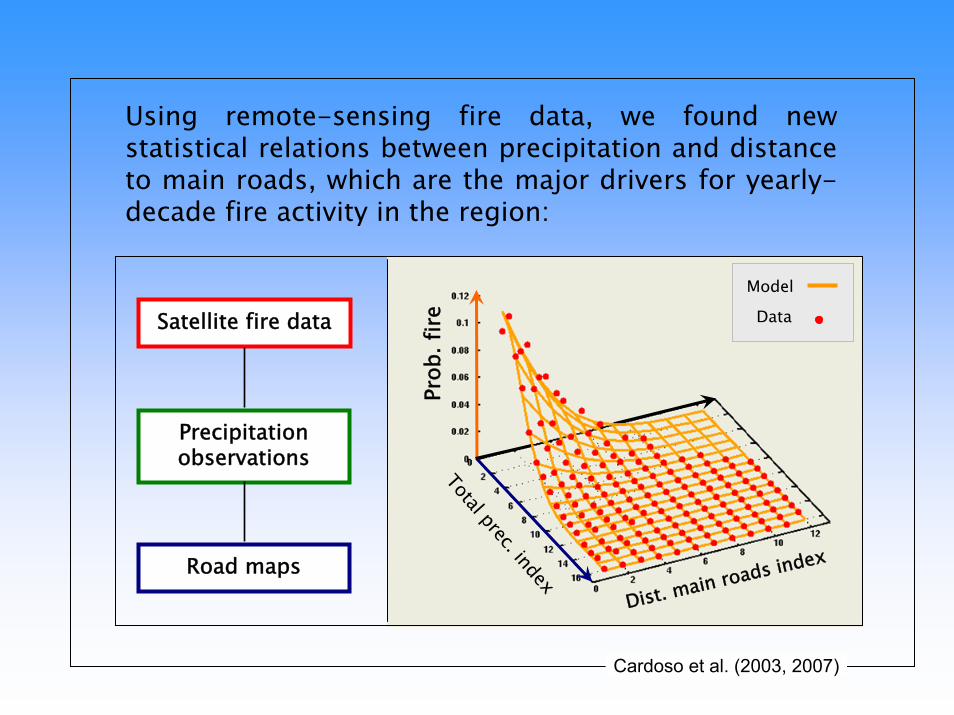
Using remote-sensing fire data, we found new statistical relations between precipitation and distance to main roads, which are the major drivers for yearly-decade fire activity in the region:
Satellite fire data
Precipitation observations
Road maps
Cardoso et al. (2003, 2007)

Estimated deforestation in the Amazon by 2050Amazon Scenarios Project; Soares-Filho et al., 2004
Roads and Deforestation, Deforestation and Roads …

3A new and sustainable model
for the tropics
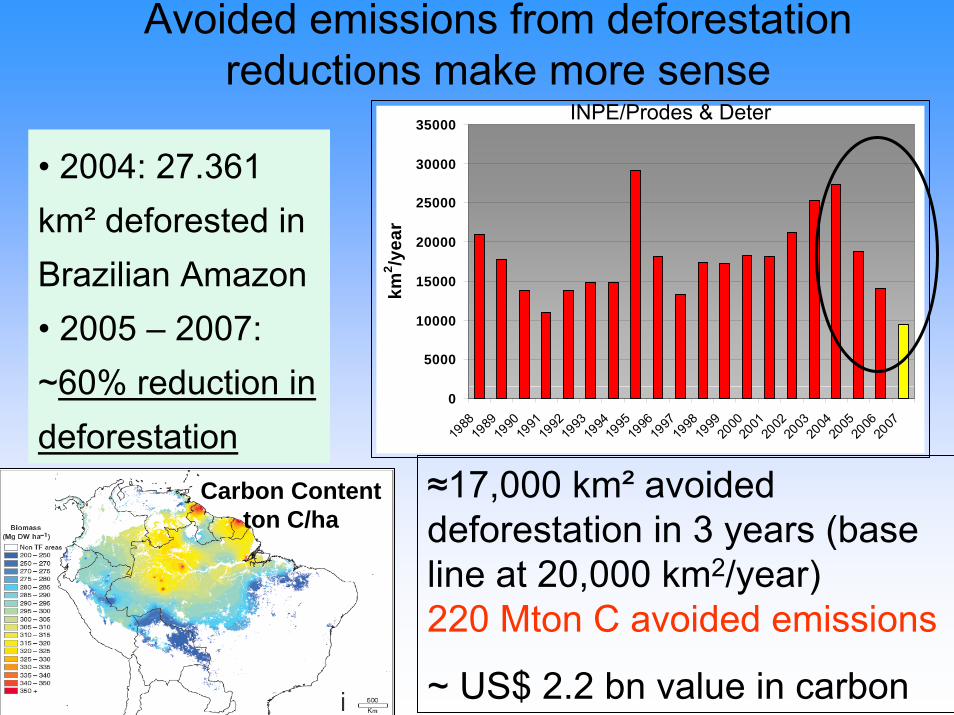
Avoided emissions from deforestation reductions make more sense
• 2004: 27.361 km² deforested in Brazilian Amazon• 2005 – 2007: ~60% reduction in deforestation
≈17,000 km² avoideddeforestation in 3 years (base line at 20,000 km2/year) 220 Mton C avoided emissions
~ US$ 2.2 bn value in carbon
0
5000
10000
15000
20000
25000
30000
35000
1988
1989
1990
1991
1992
1993
1994
1995
1996
1997
1998
1999
2000
2001
2002
2003
2004
2005
2006
2007
km2 /y
ear
INPE/Prodes & Deter
Carbon Contentton C/ha
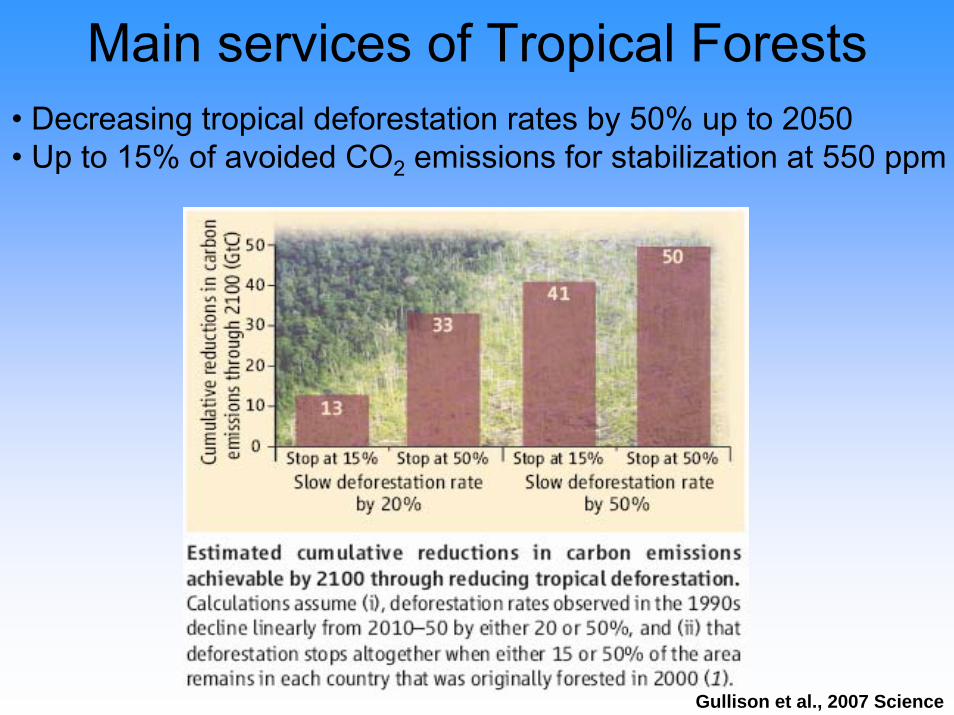
Main services of Tropical Forests
Gullison et al., 2007 Science
• Decreasing tropical deforestation rates by 50% up to 2050• Up to 15% of avoided CO2 emissions for stabilization at 550 ppm
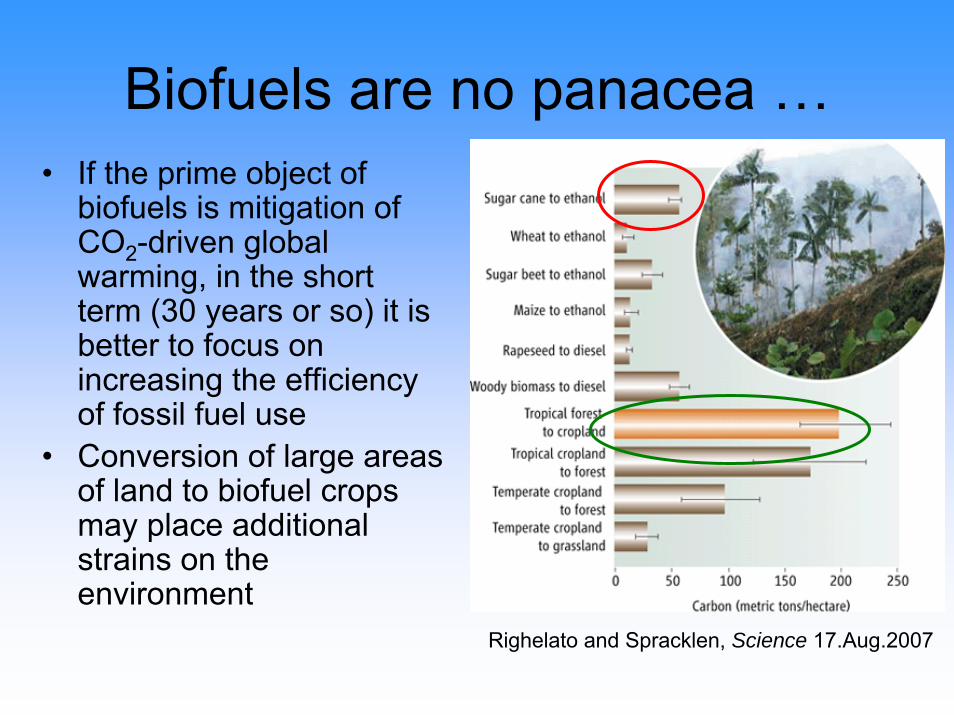
Biofuels are no panacea …• If the prime object of
biofuels is mitigation ofCO2-driven global warming, in the short term (30 years or so) it is better to focus onincreasing the efficiencyof fossil fuel use
• Conversion of large areasof land to biofuel cropsmay place additionalstrains on theenvironment
Righelato and Spracklen, Science 17.Aug.2007

Need for a new model in the tropics
Timber
Regional Plan
Soy farmers
Small Holders
Water user groups Biodiversity and
environmental services
Ranchers
Can Brazil become an ‘environmental’ power?
Can Brazil become an ‘environmental’ power?
Yes, but if and only if Brazil can create a completely new paradigm for the
sustainable development of the Amazon …
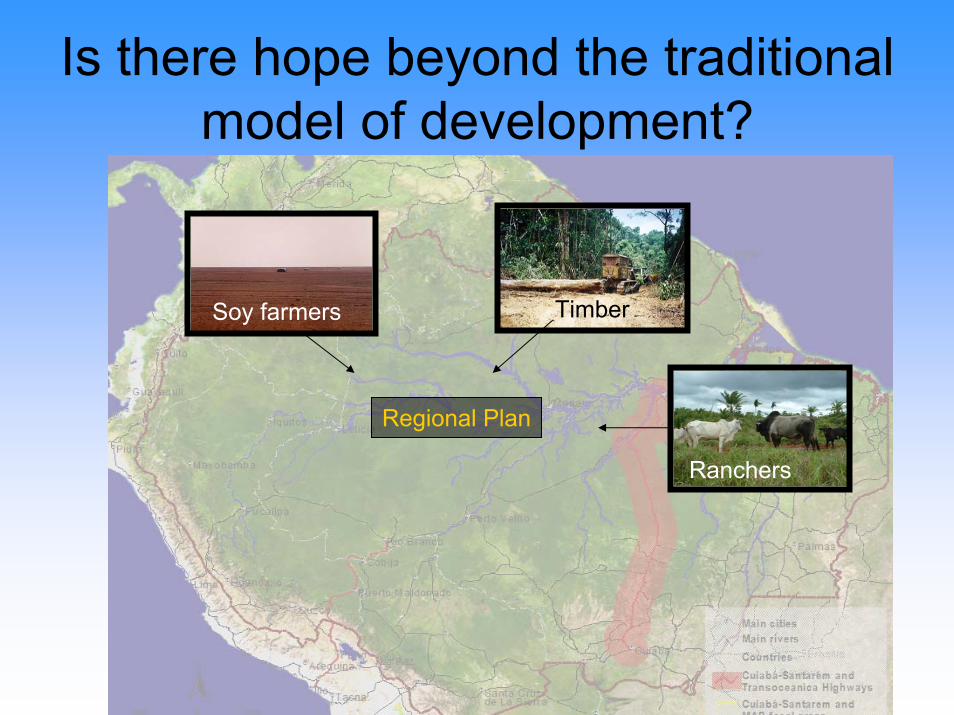
Is there hope beyond the traditional model of development?
Timber
Regional Plan
Soy farmers
Ranchers

Challenge:How to develop the Amazon sustainably?
Regional Plan
Small Holders
Water Resources Biodiversity and
environmental services

The concept of ITAs:“Institutes of Technology for
Amazonia”
• Network of several Institutes of Technology focused on economic and environmental questions of regional importance
• Technological education, graduate programs and advanced research addressing specific areas (e.g., forest products, aquatic products, mineral resources, biodiversity, ecosystem services, etc.).
• Relatively small in size (200 to 500 faculty size; 1000 to1500 undergraduate and graduate students)
• State-of-the-art research labs

The concept of ITAs:“Institutes of Technology for
Amazonia”
• Two-tier approach for R&D– Development of capacity for ‘globalization’ of 50 to 100
products of biodiversity (science base, appropriate technologies, capacity of entrepreneurship, full productive chain approach)
– High end technology: biotechnology, biomimicry and nanosciences
• International cooperation in all levels (education, fundamental and applied research) seen as essential

THANK YOU!