deforestation in southeast asiathe inter-annual dynamics ... · mr. jojo bernardo, neda ms....
TRANSCRIPT

Case Studies & Diagnostic Models ofthe Inter-annual Dynamics of
Deforestation in Southeast Asia
Dave SkoleBasic Science & Remote Sensing Initiative
Department of GeographyMichigan State University

LC LUC Dynamics and SecondaryGrowth
■ Global Carbon Budget: Tropics (Ciais et al. 1995)◆ Northern Tropics - source◆ Southern Tropics - small sink
■ Explanations:◆ Increase in Tropical NEP offsets deforestation source◆ Reduced rate of deforestation w/increased secondary
growth of previously cleared land■ Inconsistent with inter-decadal deforestation data
derived from satellite imagery

LC LUC Dynamics and Sec. Growth,Cont.
■ Significant Inter-annual Differences in Rates ofDeforestation asynchrony in relative contributionof the net flux from clearing and re-growth
◆ Inter-annual departures in rates of deforestation fromdecadal mean
◆ Significant abandonment of land to secondary growth
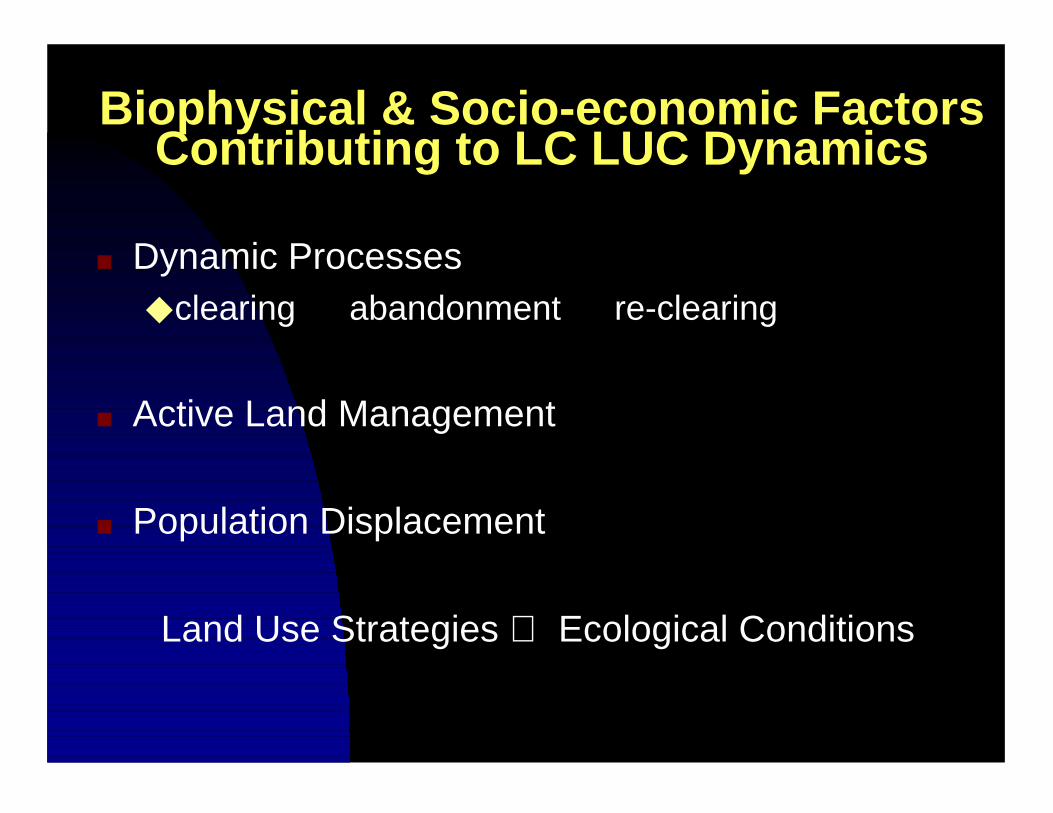
Biophysical & Socio-economic FactorsContributing to LC LUC Dynamics
■ Dynamic Processes◆ clearing abandonment re-clearing
■ Active Land Management
■ Population Displacement
Land Use Strategies ⇔ Ecological Conditions
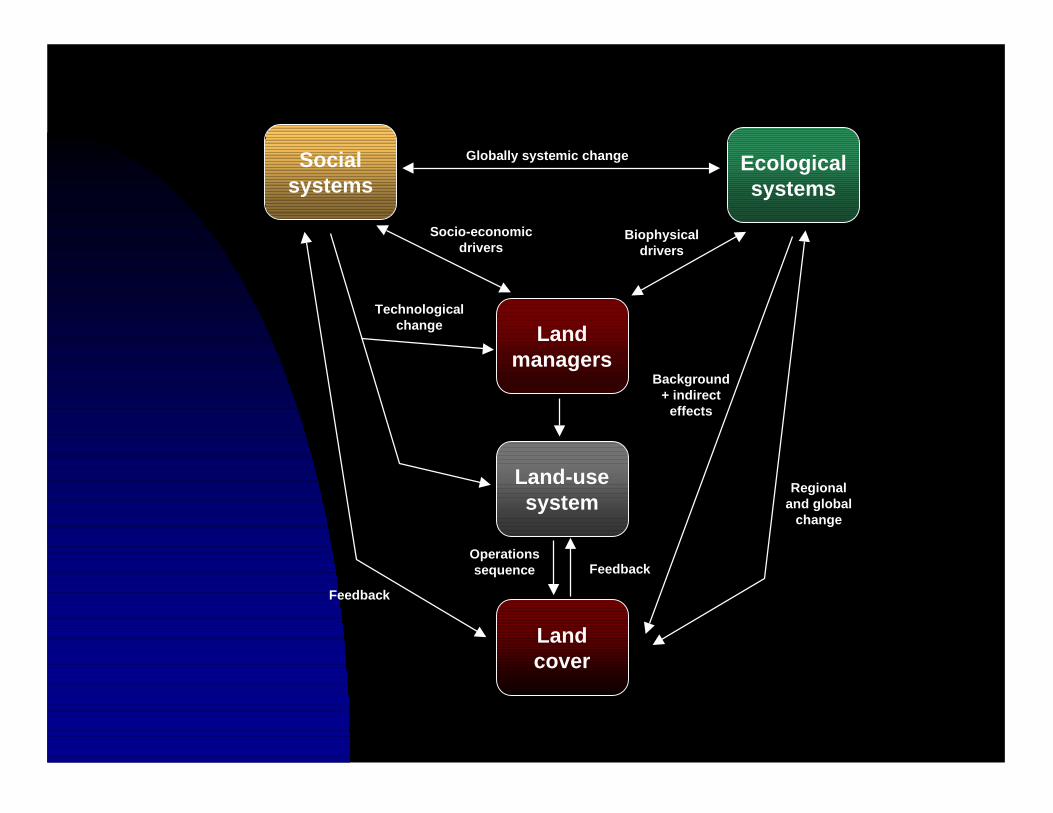
FeedbackOperationssequence
Socialsystems
Ecologicalsystems
Landmanagers
Land-usesystem
Landcover
Globally systemic change
Socio-economicdrivers
Biophysicaldrivers
Regionaland global
change
Technologicalchange
Background+ indirect
effects
Feedback
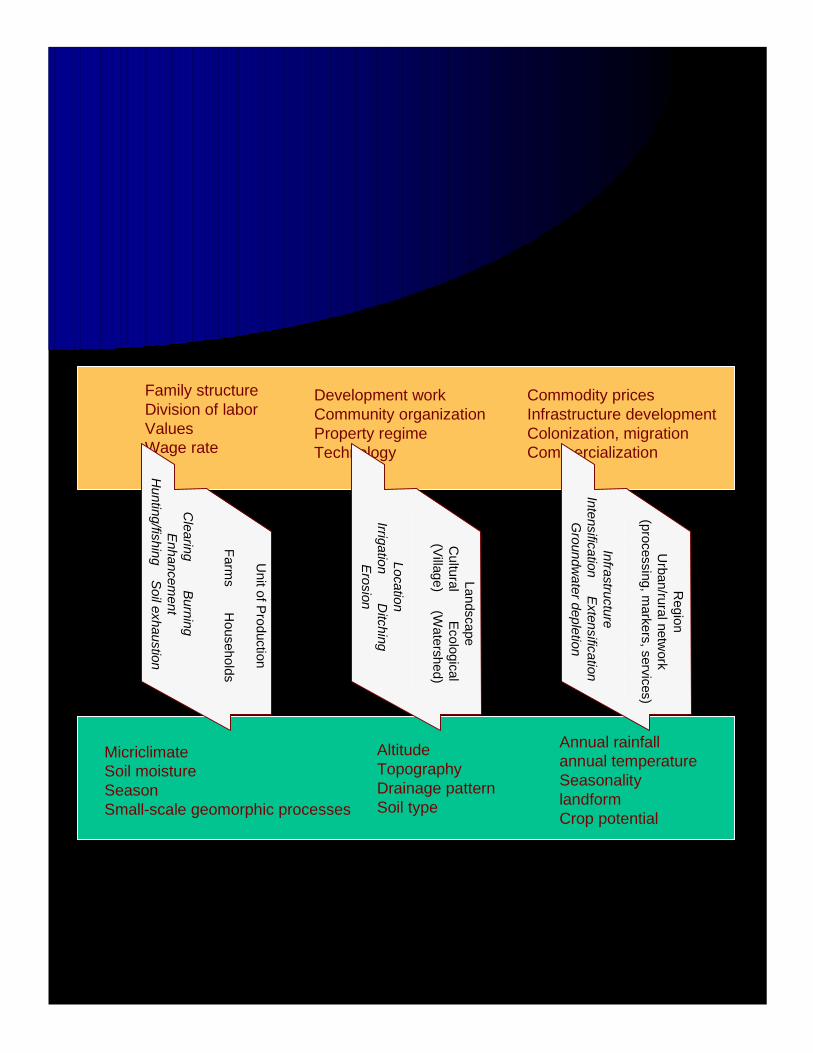
Commodity pricesInfrastructure developmentColonization, migrationCommercialization
Development workCommunity organizationProperty regimeTechnology
Family structureDivision of laborValuesWage rate
Annual rainfallannual temperatureSeasonalitylandformCrop potential
AltitudeTopographyDrainage patternSoil type
MicriclimateSoil moistureSeasonSmall-scale geomorphic processes
Region
Urban/rural netw
ork(processing, m
arkers, services)
InfrastructureIntensification Extensification
Groundw
ater depletion
LandscapeC
ultural Ecological(Village) (W
atershed)
Unit of Production
Farms H
ouseholds
LocationIrrigation D
itchingErosion
Clearing Burning
Enhancement
Hunting/fishing Soil exhaustion

Research Questions
■ Are the inter-annual dynamics and rates ofdeforestation and abandonment to secondaryforest significantly different than the decadal meanin Southeast Asia…
■ ...and can this account for a dampening of thebiogenic source of carbon apparent in annualobservations of atmospheric carbon dioxide andoxygen?

Research Questions, cont...
■ Through the integration of socio-economic andsatellite data and the development of dynamicdeforestation models, can we improve ourunderstanding of the dynamics of deforestation inthe tropics…
■ ... and the various controls on rates ofdeforestation and re-growth and land use transitionsequences?

■ 1. Develop case studies to determine deforestationdynamics: is secondary growth important and does landuse change dynamically on an annual basis; what are theland use transition probabilities?
■ 2. Determine if the annual rates of deforestation have beensignificantly different from the decadal mean rate over largeareas and the region as a whole
■ 3. Develop diagnostic models of the deforestation processto better understand and quantify the different controls onrates of deforestation and abandonment
Research Activities

■ Thailand◆ National Resource Council of Thailand◆ Land Development Department◆ Royal Forestry Department of Thailand◆ Kesetsart University◆ Mahidol University◆ Chiang Mai University
■ Malaysia◆ University Kebangsaan Malaysia◆ Department of Agriculture Malaysia◆ Forestry Department Malaysia◆ Malaysian Center for Remote Sensing (MACRES)
Southeast Asia ScienceNetwork
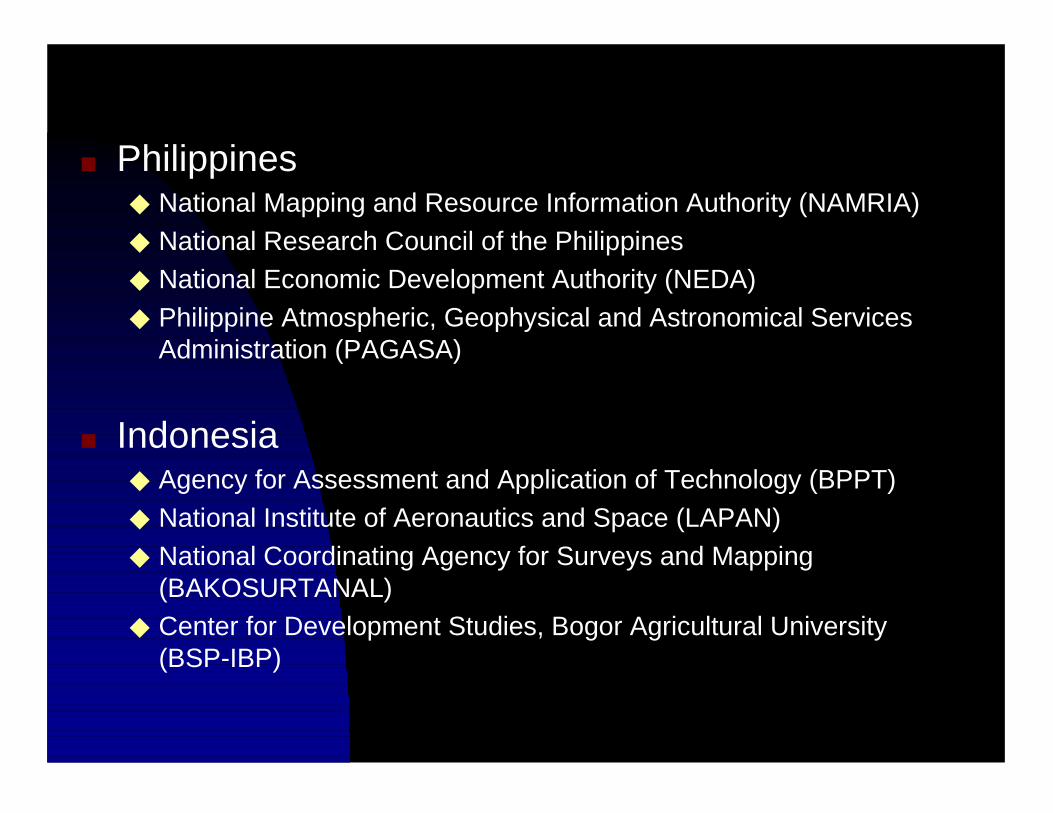
■ Philippines◆ National Mapping and Resource Information Authority (NAMRIA)◆ National Research Council of the Philippines◆ National Economic Development Authority (NEDA)◆ Philippine Atmospheric, Geophysical and Astronomical Services
Administration (PAGASA)
■ Indonesia◆ Agency for Assessment and Application of Technology (BPPT)◆ National Institute of Aeronautics and Space (LAPAN)◆ National Coordinating Agency for Surveys and Mapping
(BAKOSURTANAL)◆ Center for Development Studies, Bogor Agricultural University
(BSP-IBP)

NASA LCLUC Southeast Asia ScienceTeam
■ USADr. David L. Skole, Director, Basic Science and Remote
Sensing Initiative, Dept. of Geography, Michigan StateUniversity (Principal Investigator)
Dr. Maureen Cropper, UMD and The World BankMr. Walter Chometowski, BSRSI, Dept. of Geography,
Michigan State UniversityMr. Jay Samek, BSRSI, Dept. of Geography, Michigan State
UniversityMr. William Salas, University of New Hampshire
■ IndonesiaDr. Ir. Indroyono Soesilo, BPPTDr. Ir. Mahdi Kartasasmita, LAPANDr. Iwan Gunumwan, BPPTMr. Asep Karsidi, BPPTIr. Muchamad Muchlis JI., LAPANDr. Arco Nurlambang, University of IndonesiaMr. Hartanto Sanjaya, BPPTMr. Andi Rahmadi, BPPTDr. Siti Adiprigandari Adiwoso Suprato, University of Indonesia
■ PhilippinesDr. Flaviana D. Hilario, PAGASADr. Virgilio S. Santos, NAMRIAMs. Alma Arquero, NAMRIAMr. Romeo Tejada, NAMRIA,Mr. Bobby Crisostomo, NAMRIAMr. Leo Belgria, NAMRIAMr. Rodel Lasco, NAMRIAMs. Melo Jane Roa, NAMRIAMr. Victor Bato, NAMRIAMs. Solita Castro, NAMRIAMrs. Ernestine Gayban, NAMRIAMs. Elma Rayes, NAMRIAMr. Sunday Langad, NAMRIAMr. Jojo Bernardo, NEDAMs. Cresencia Cadiente, NAMRIAMs. Evangeline Saracanlao, NAMRIA
■ China -TaipeiDr. Chin-Hong Sun, National Taiwan UniversityDr. David Chang, National Taiwan University
■ MalaysiaDr. Sharifah Mastura Syed Abdullah, Dept. of Geography,Universiti Kebangsaan
MalaysiaDr. Othman Bin A. Karim, Dept. of Civil & Structural Engineering Faculty of
Engineering, Universiti Kebangsaan MalaysiaDr. Abdul Rahim Md. Nor, Dept. of Geography, Universiti Kebangsaan MalaysiaDr. Abd. Rahim Md. Nor, Dept. of Geography, Universiti Kebangsaan MalaysiaDr. Asmah Ahmad, Dept. of Geography, Universiti Kebangsaan MalaysiaDr. Rahimah Adb. Aziz, Dept of Anthopology and Sociology, Universiti
Kebangsaan MalaysiaDr. Maimon Abdullah, Dept. of Zoology, Universiti Kebangsaan MalaysiaDr. Zuriata Zakaria, Dept. of Chemestry, Universiti Kebangsaan MalaysiaDr. Juhari Mat Akhir, Dept. of Geology, University of Kebangsaan MalaysiaDr. Mahamud Ismail, Dept. of Civil Engineering, Universiti Kebangsan MalaysiaMr. Mokhtar Jaafar, Dept. of Geography, Universiti Kebangsaan MalaysiaMr. Hlmi Kadir, Dept. of Geography, Universiti Kebangsaan MalaysiaMr. Lam Kuok, Dept. of Geography, Universiti Kebangsaan MalaysiaMr. Alias Sood, Malasia Forestry DepartmentMr. Laili Nordin, MACRES
■ ThailandDr. Yothin Sawangdee, Institute for Population and Social Research
Mahidol University at SalayaDr. Charlie Navanugraha, Faculty of Environment and Resource Studies
Mahidol UniversityDr. Suwit Ongsomwang, Forest Research Office
Royal Forest DepartmentDr. Chumpol Wantanasarn, Director, Land Use Planing Division
Department of Land DevelopmentMr. Kamron Saifuk, Department of Land Development
Landuse Planning DivisionMs. Dararat Disbunchong , Remote Sensing Division
National Research Council of ThailandDr. Pong-In Rakariyatham, Faculty of Social Sciences
Chiang Mai UniversityProf. Kasem Chunkao, Faculty of Forestry, Kasetsart University
Dr. Wasant Pongsapich, The Environmental Research Institute,Chulalongkorn University
Mr. Chetphong Butthep, National Research Council of ThailandDr. Jariya Boonjawat, SEA START RC, The Environmental Research Institute,
Chulalongkorn University
■ VietnamDr. Hoang Minh Hien, Hydro-Meteorological Service of VietnamMs. Tran Thi Bang Tam, Hanoi Agricultural University

Southeast Asia Case StudiesBuilding on Phase 1 under IGBP LUCC SARCS
■ Multi-date Analysis of Landsat Imagery at 4 study sites◆ Land Cover / Land Use Change Detection
■ Sites:◆ Thailand: Mae Chaem Watershed, Chiang Mai◆ Malaysia: Klang Langat Watershed, Selangor◆ Philippines: Magat Watershed, Nueva Viscaya, Luzon◆ Indonesia: Upper Citarum Watershed, Java
■ Quantitative analysis of socio-economic factors and LCLUC analysis

Phase 1 Southeast Asia Sites
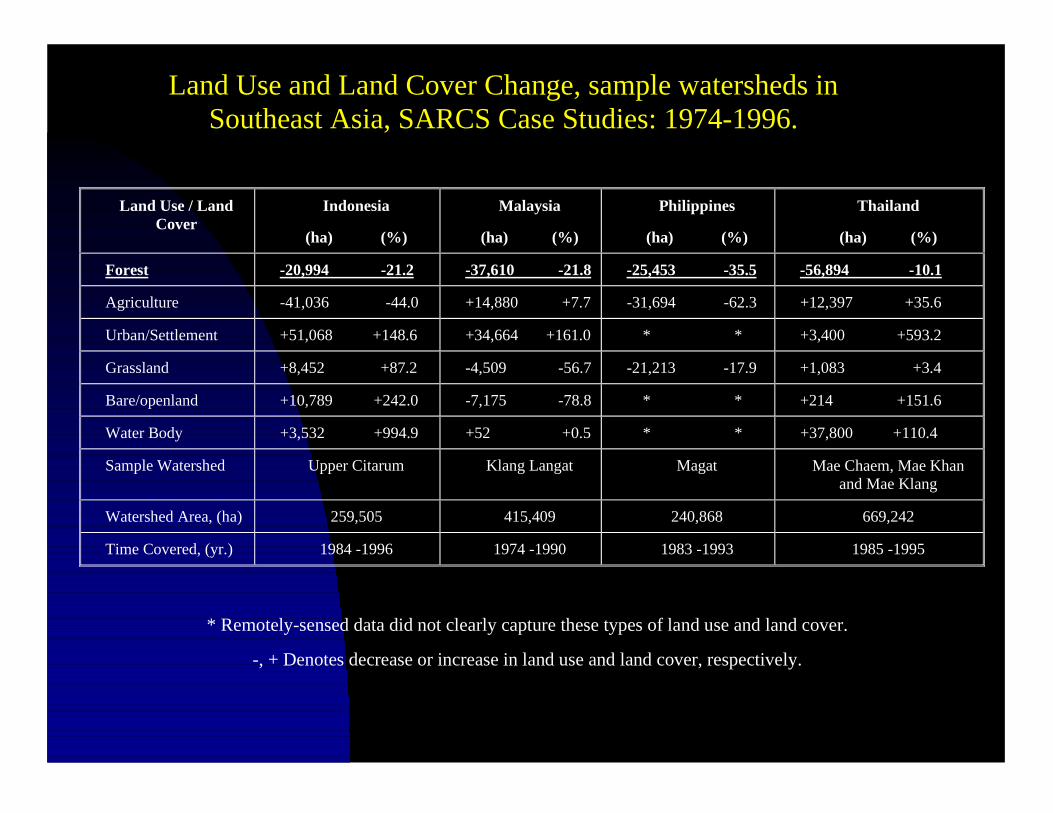
Land Use and Land Cover Change, sample watersheds inSoutheast Asia, SARCS Case Studies: 1974-1996.
Land Use / LandCover
Indonesia
(ha) (%)
Malaysia
(ha) (%)
Philippines
(ha) (%)
Thailand
(ha) (%)
Forest -20,994 -21.2 -37,610 -21.8 -25,453 -35.5 -56,894 -10.1
Agriculture -41,036 -44.0 +14,880 +7.7 -31,694 -62.3 +12,397 +35.6
Urban/Settlement +51,068 +148.6 +34,664 +161.0 * * +3,400 +593.2
Grassland +8,452 +87.2 -4,509 -56.7 -21,213 -17.9 +1,083 +3.4
Bare/openland +10,789 +242.0 -7,175 -78.8 * * +214 +151.6
Water Body +3,532 +994.9 +52 +0.5 * * +37,800 +110.4
Sample Watershed Upper Citarum Klang Langat Magat Mae Chaem, Mae Khanand Mae Klang
Watershed Area, (ha) 259,505 415,409 240,868 669,242
Time Covered, (yr.) 1984 -1996 1974 -1990 1983 -1993 1985 -1995
* Remotely-sensed data did not clearly capture these types of land use and land cover.
-, + Denotes decrease or increase in land use and land cover, respectively.

Moving to Phase 2
■ Year 1 of NASA LCLUC project is focused onexpanding the initial Phase 1 effort: emphasis onforests and initially Thailand
■ Collaboration between LUCC and START todevelop the project with comparable results toother regions,
■ Utilizes the IGBP-IHDP framework for linkingphysical and social science.

Phase 2, continued■ Initial emphasis on LUCC Focus 2, Direct Observations and
Empirical Models.■ Emphasis now shifting toward integration of LUCC Focus 1,
Land Use Dynamics, which incorporates socioeconomicdata.
■ The project takes an interdisciplinary look at the drivingforces of land use and cover change in the region.
■ To do this, the project has developed a common protocol formethods and datasets, aimed at providing a framework forintercomparison.
■ Although isolated studies have been done in specificlocales, there are virtually none which provide a region-wideperspective built from case studies with common protocols.

Phase 2, continued■ The project has also aimed at developing a network of
practicing scientists in the region.■ This network has been centered on the case studies
countries, with additional participation from other countrieseven though they are not currently hosting a case study(e.g. Vietnam).
■ This network could and should be expanded over the courseof the next phase.
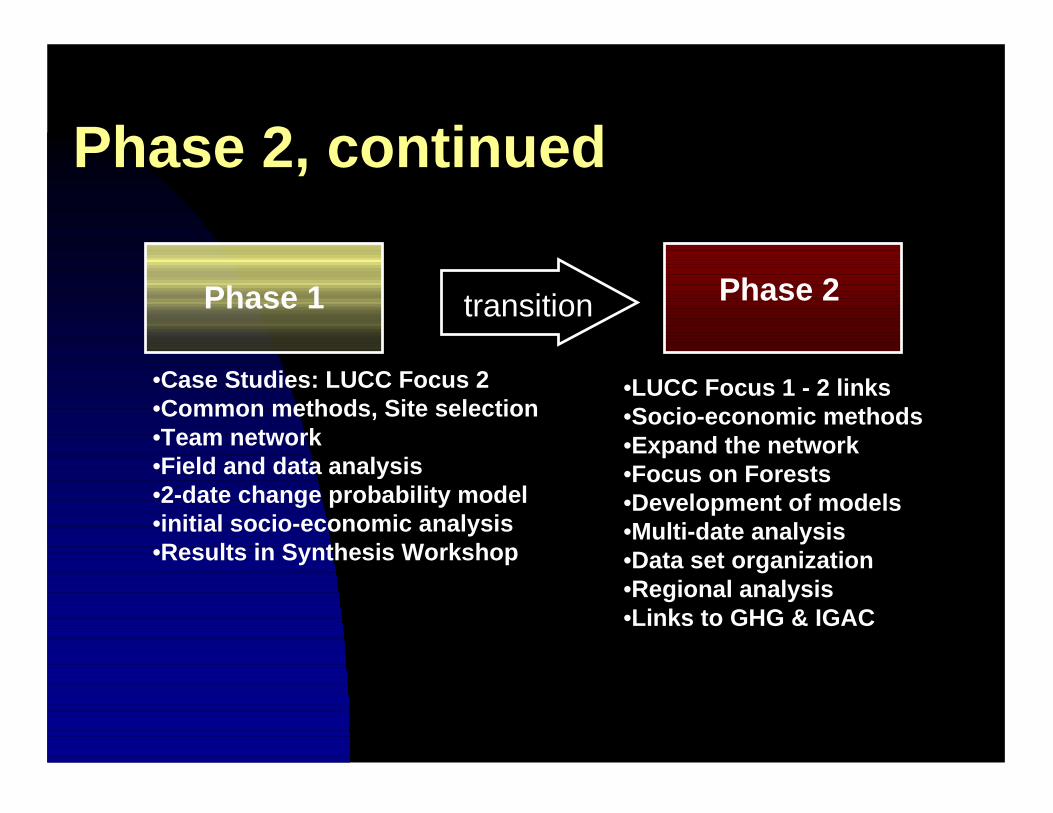
Phase 2, continued
Phase 1 Phase 2transition
•Case Studies: LUCC Focus 2•Common methods, Site selection•Team network•Field and data analysis•2-date change probability model•initial socio-economic analysis•Results in Synthesis Workshop
•LUCC Focus 1 - 2 links•Socio-economic methods•Expand the network•Focus on Forests•Development of models•Multi-date analysis•Data set organization•Regional analysis•Links to GHG & IGAC
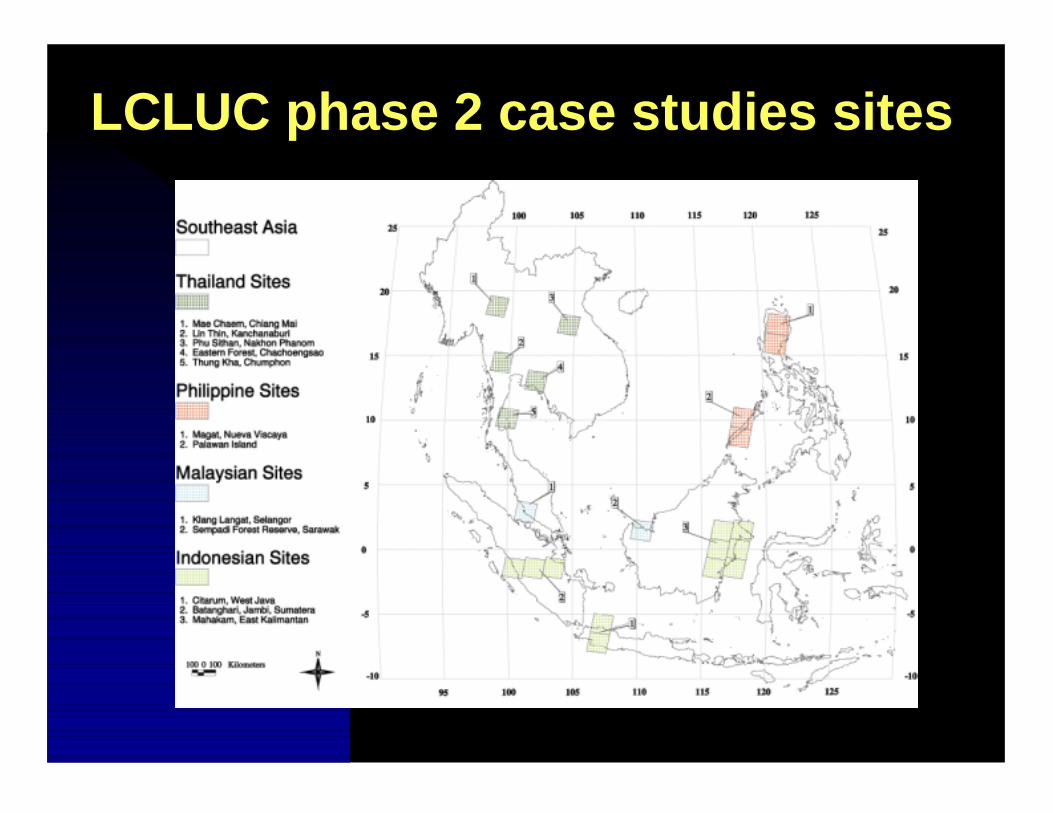
LCLUC phase 2 case studies sites
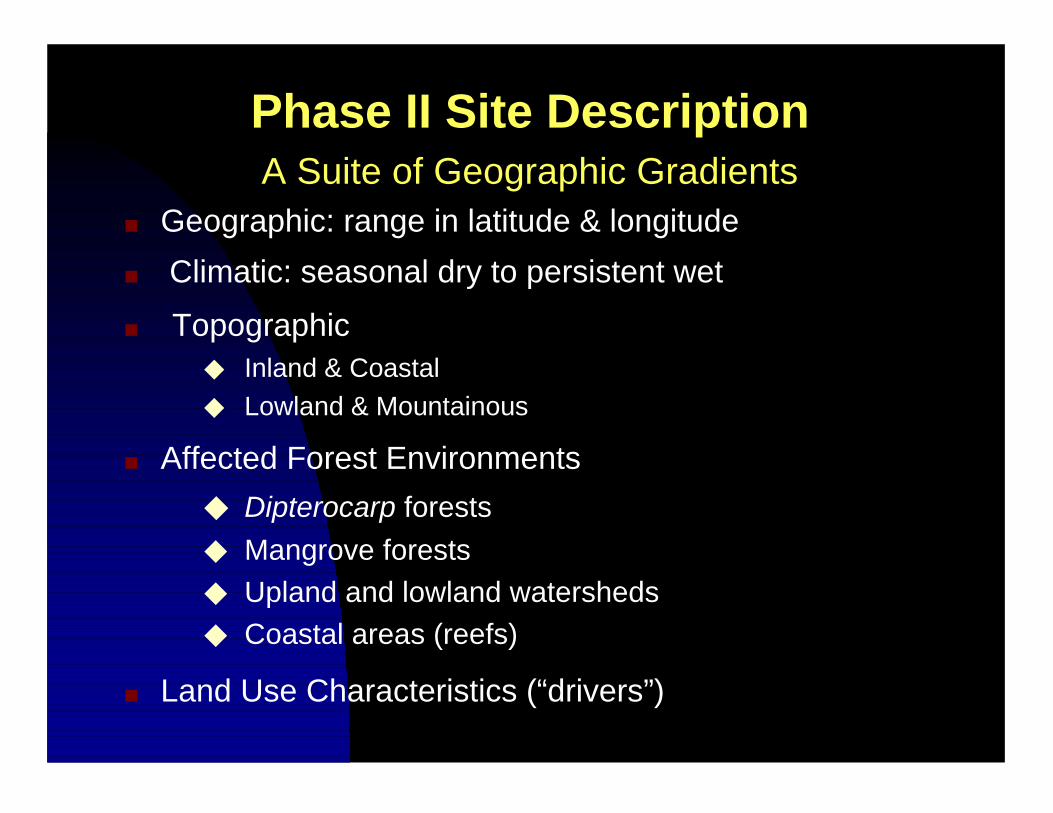
Phase II Site DescriptionA Suite of Geographic Gradients
■ Geographic: range in latitude & longitude■ Climatic: seasonal dry to persistent wet■ Topographic
◆ Inland & Coastal◆ Lowland & Mountainous
■ Affected Forest Environments◆ Dipterocarp forests◆ Mangrove forests◆ Upland and lowland watersheds◆ Coastal areas (reefs)
■ Land Use Characteristics (“drivers”)
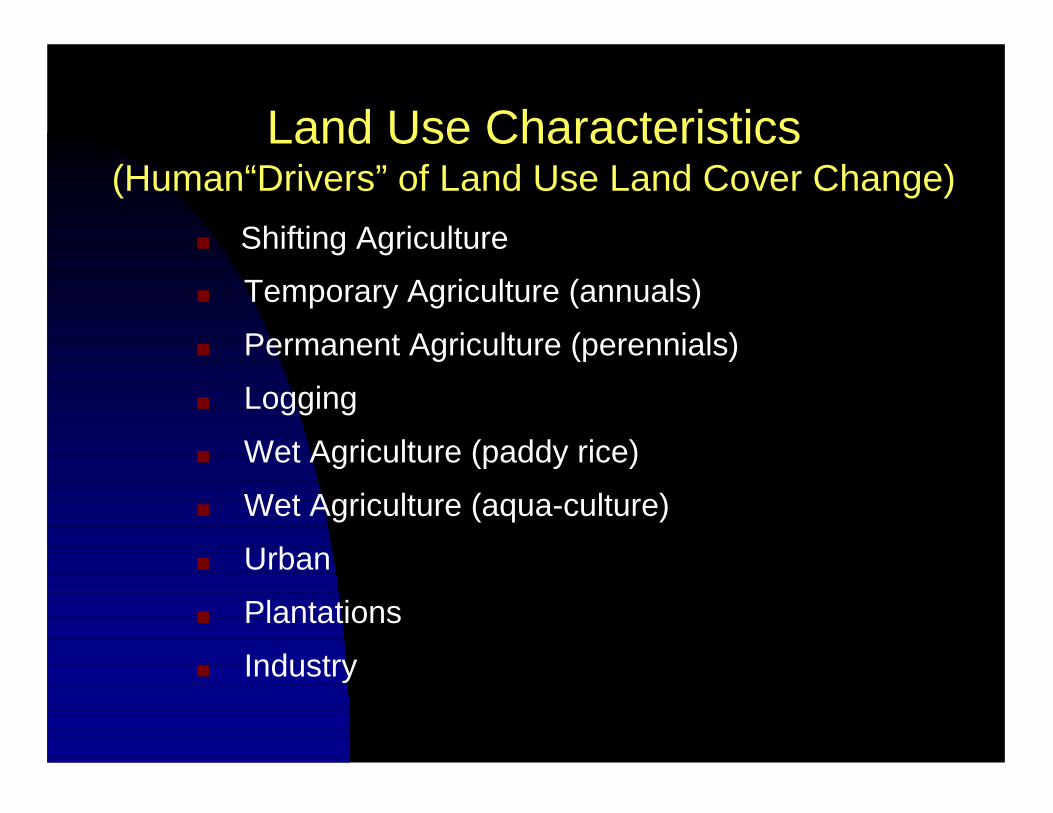
Land Use Characteristics(Human“Drivers” of Land Use Land Cover Change)
■ Shifting Agriculture■ Temporary Agriculture (annuals)■ Permanent Agriculture (perennials)■ Logging■ Wet Agriculture (paddy rice)■ Wet Agriculture (aqua-culture)■ Urban■ Plantations■ Industry

Land Use Thailand Indonesia Malaysia PhilippinesShifting Agriculture T1 & T2 I1 & I3 P1 & P2Temporary Agriculture (annuals) T1-T5 I1-I3 M1 & M2 P1 & P2Permanent Ag. (perennials) T1 I2 M1 & M2 P2Logging T1 & T4 I1 & I3 (M1) & M2 P1 & P2Wet Agriculture (paddy rice) T1, T4 & T5 I1 & I2 M1 & M2 P1 & P2Wet Agriculture (aqua-culture) T5 I1-I3 M1 P2Urban T1, T3-T5 I2 M1 P2Plantation T1-T5 I1, I3 M1 & M2 P1 & P2Industry T5 I2 & I3 M1
Phase II Case Study SitesThailand:
T1 = Mae ChaemT2 = Lin ThinT3 = Phu SithanT4 = Eastern ForestT5 = Thung Kha
Indonesia:
I1 = CitarumI2 = BatanghariI3 = Mahakam
Malaysia:
M1 = Klang LangatM2 = Sarawak
Philippines:
P1 = MagatP2 = Palawan Island
Variation in Land Use by Case Study
Expansion of the Network
■ Vietnam■ Laos■ Cambodia■ Myanmar
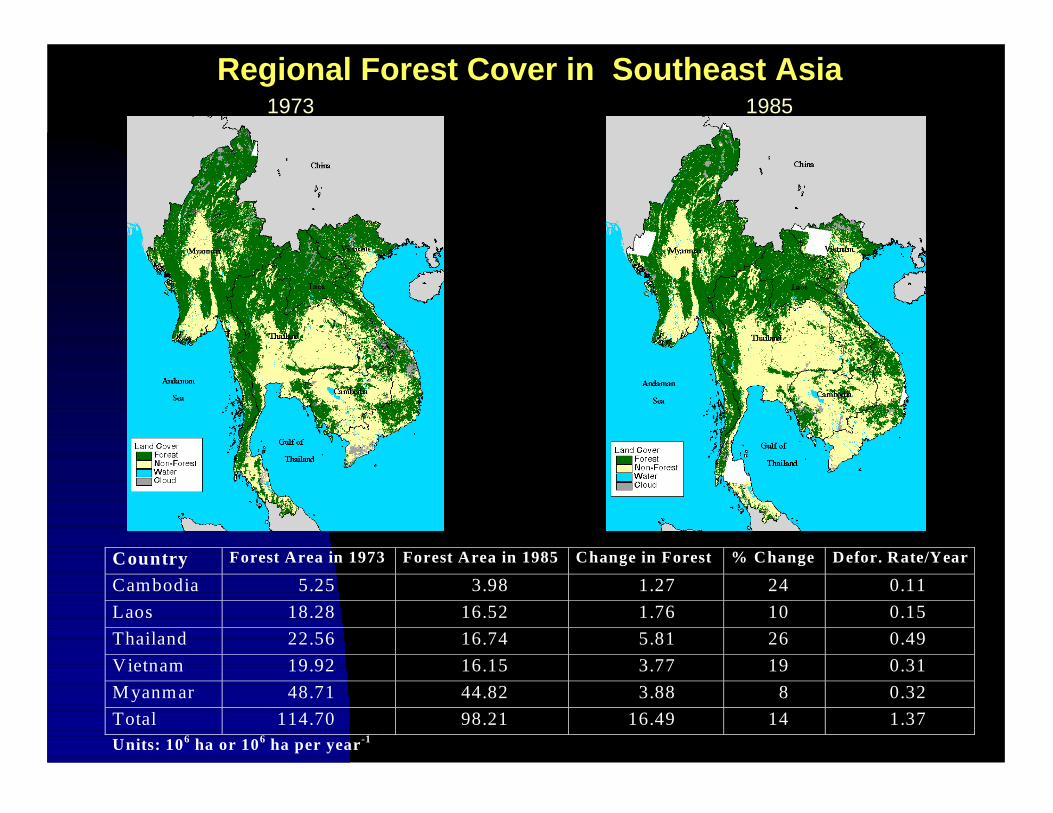
Regional Forest Cover in Southeast Asia1973 1985
Country Forest Area in 1973 Forest Area in 1985 Change in Forest % Change Defor. Rate/Year
Cambodia 5.25 3.98 1.27 24 0.11Laos 18.28 16.52 1.76 10 0.15Thailand 22.56 16.74 5.81 26 0.49Vietnam 19.92 16.15 3.77 19 0.31M yanmar 48.71 44.82 3.88 8 0.32Total 114.70 98.21 16.49 14 1.37Units: 106 ha or 106 ha per year-1
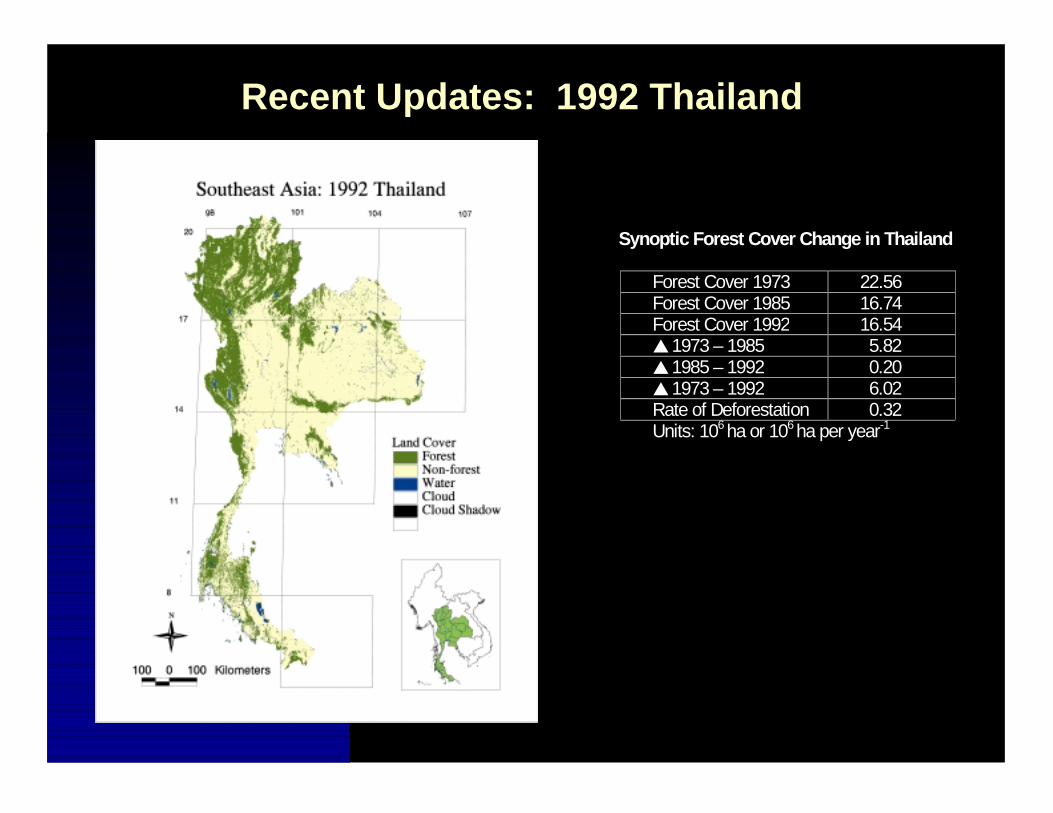
Recent Updates: 1992 Thailand
Synoptic Forest Cover Change in Thailand
Forest Cover 1973 22.56Forest Cover 1985 16.74Forest Cover 1992 16.54▲1973 – 1985 5.82▲1985 – 1992 0.20▲1973 – 1992 6.02Rate of Deforestation 0.32Units: 106 ha or 106 ha per year-1

Thailand case study■■ Importance:Importance:
◆◆ Deforested area in Northern Thailand has increasedDeforested area in Northern Thailand has increasedby 36 % between 1980-90.by 36 % between 1980-90.
◆◆ Largest absolute amount of deforestation amongstLargest absolute amount of deforestation amongstall regionsall regions
Causes of deforestation■ Logging
◆ Thailand has been a net exporter of wood since theearly seventies
◆ Contribution to GDP has been negligible◆ Thailand banned logging in 1986
■ Agriculture: Main reason◆ pushing forward the extensive margin of cultivation
(Intensification either not economically possible or isunsustainable)
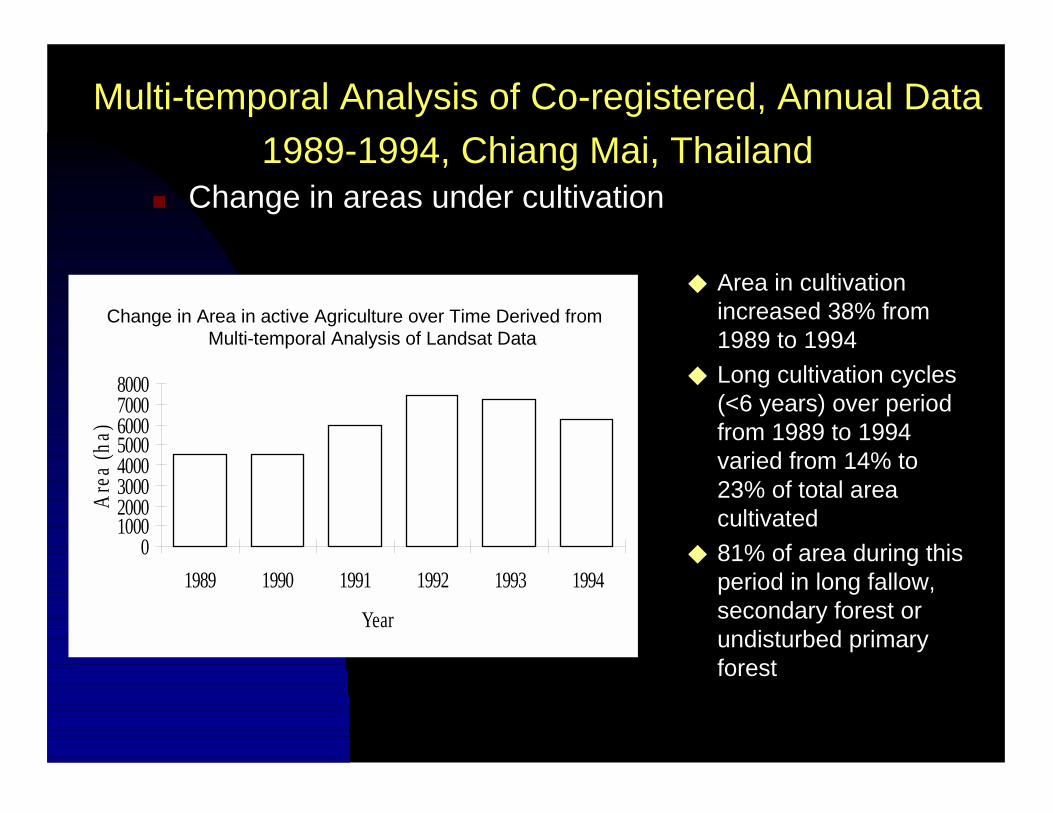
Multi-temporal Analysis of Co-registered, Annual Data1989-1994, Chiang Mai, Thailand
010002000300040005000600070008000
1989 1990 1991 1992 1993 1994
Year
Are
a (h
a)
◆ Area in cultivationincreased 38% from1989 to 1994
◆ Long cultivation cycles(<6 years) over periodfrom 1989 to 1994varied from 14% to23% of total areacultivated
◆ 81% of area during thisperiod in long fallow,secondary forest orundisturbed primaryforest
Change in Area in active Agriculture over Time Derived fromMulti-temporal Analysis of Landsat Data
■ Change in areas under cultivation

Inter-annual Analysis Chiang Mai, Thailand
◆ Clearings Varied: low of 2.3x 10³ ha in 1990 to peak of3.7 x 103 ha in 1992
◆ Decline to 2.4 x 10³ ha in1994
◆ In 1990 and 1991 over 50%of cultivated area was onareas just cleared
◆ Decrease in newly clearedcultivated lands to 38% in1994
◆ Smallest amount ofabandonment (1991) 1.8 x10³ ha
◆ Largest amount ofabandonment 1993 and1994 3.5 x 10³ ha and 3.4 x10³ ha respectively
0
500
1000
1500
2000
2500
3000
3500
4000
1990 1991 1992 1993 1994
Year
Are
a (h
a)
Annual Rates of Formation of New Clearings(empty cols.) and Abandonment (solid cols.)
■ Annual Extent of New Clearings and Abandonment
Inter-annual AnalysisChiang Mai,Thailand
■ Conclusions◆ Annual deforestation rates highly variable◆ Rate of abandonment highly variable and
asynchronous with clearing◆ Carbon-accumulating re-growth a predominant
feature of the Chiang Mai landscape◆ Pulse of deforestation in the late 1980s slowing
down in the 1990s

New LCLUC Models■ Regional Analysis
◆ von Thünen Equilibrium Land Use Model; one date◆ Markov Model of Land Use Change; three dates◆ Fixed Effects Logit Model of Land Use Change;
three dates
■ Case Study Analysis◆ Markov Model; annual analysis (change matrix)◆ Fixed Effects Model; annual analysis
Approach to modeling
■ Two Types of Models◆ Explain land use at a point of time◆ Explain change in land use between two points of
time
■ Two Levels of Spatial Disaggregation◆ Landscape (pixel) level◆ District or provincial level

Purpose of Models■ Understand Patterns of Land Use
■ Predict Patterns of Land Use◆ Local level – e.g., for natural resource management◆ Regional level – e.g. to forecast carbon emissions
■ Predict Impacts of Policy Levers◆ Agricultural policies◆ Employment policies◆ Road building

Types of Land Use Models
■ Long Run Equilibrium Models◆ Explain land use at a point of time, independently of
past land use◆ Predict P(Plot i is in use k at time t)◆ Can be estimated using a single cross section of
data or multiple cross sections◆ Can be used to predict land use change if future
values of explanatory variables can be predicted
Types of Land Use Models, cont.
■ Markov Models of Land Use Change◆ Explain probability of land use at t+1 given land use at t◆ Predict P(Plot i in use k at t| Plot i in use j at t-1)◆ Allows for state dependence◆ Estimation requires observations on land use at 2 or
more points of time◆ Can be used to predict land use change if future values
of explanatory variables can be predicted

A Landsat-based deforestationmodel
■ We hypothesize that the farm creation process unfolds in two sequentialphases:
◆ the initial, deforestation phase,◆ and the regrowth clearance phase.
■ The timing of these phases depends on the number (m) and intervalbetween deforestation events,
■ which in turn is related to the shift time for annual plots (∆t), or thenumber of years a field producing annuals is used before abandonment(to regrowth) or allocation to pasture or perennials

Deforestation model, cont.■ Consider the three decisions faced by farmers:
◆ (1) deforestation decision,◆ (2) field decision,◆ (3) regrowth decision.
■ Each of these decisions determines how a particular piece of land will beused, as defined by its groundcover.
■ In the deforestation decision, the farmer decides, in the wake ofdeforesting old forest, the proportions to allocate to annuals production(a), pasture (pa), and perennials (pe).
■ With the field decision, the farmer reallocates land used in annualsproduction to pasture, perennials, or to regrowth (r).
■ The regrowth decision involves clearance for annuals, pasture, orperennials.
Deforestation model, cont.
■ During the deforestation phase, both deforestation and field decisionsare made, although the first field decision occurs with the seconddeforestation event,
■ Thus, the first deforestation event occurs at t= 0, and the first fielddecision, at t = ∆t. The final deforestation event, with decision, takesplace at year, t = (m-1)∆t.
■ After this, regrowth is cleared to annuals, pasture, and perennials in acycle similar to that of old forest.
Deforestation model, cont.■ Consider the land area cleared in a deforestation event; call this the
deforestation event magnitude, or DEM. DEM is a function of thehuman resources (h), natural resources, i.e. the physical environment(n), and location (l), or
DEMt = DEM (ht, nt, l).
■ Similarly, consider the probability of transitions between the land coverclasses old forest (o), regrowth (r), annuals (a), pasture (pa), andperennials (pe), or
pti,j = pt
i,j (ht, nt, l)., whereI ∈ (o, a, r), j ∈ (a, pa, pe, r).

Deforestation model, cont.■ Stocks of land cover type I at time t are given, in areal terms, as xt
I ; stockchange at time ?t is ?xt
i. Hence, the transitions in land cover classes inthe deforestation phase are at t = 0, conversion of primary forest, withinitial land cover stocks:∆x0
o, a = p0o, a DEM0 and x0
a = ∆ x0o, a ( = x1
a )∆ x0
o, pa = p0o, pa DEM0 and x0
pa = ∆ x0o, pa ( = x1
pa )∆ x0
o, pe = p0o, pe DEM0 and x0
pe = ∆ x0o, pe ( = x1
pe )
■ At t = 2, conversion of plots under annuals production:∆ x2
a, pa = p2a, pa x0
a
∆ x2a, pe = p2
a, pe x0 a
∆ x2a, r = p2
a,r x0 a

Deforestation model, cont.
■ in addition to the conversion of primary forest:∆ x2
o, a = p2o, a DEM2
∆ x2o, pa = p2
o, pa DEM2
∆ x2o, pe = p2
o, pe DEM2
■ yields the land cover stocks in time period 2:x2
a = x0 a + ∆ x2
o, a - S ∆ x2a, j , j ∈ (pa, pe, r)
x2 pa = x0
pa + ∆ x2o, pa + ∆ x2
a, pa
x2 pe = x0
pe + ∆ x2o, pe + ∆ x2
a, pe
x2 r = ∆ x2
a,r