degrees of risk - e3g — third generation … · 2015-08-02 · degrees of risk defining a risk...
TRANSCRIPT

Nick Mabey, E3G
December 2013
Degrees of Risk Defining a Risk Management Framework for Climate Security

December 2013 E3G 2
Background to the Report
• Builds on E3G’s climate security work since 2005
• Seminars with climate and security experts in 2009-10
• Joint analysis and drafting process with climate and security experts; Jay Gulledge and Bernard Finel
• Testing ideas: UK National Security Council; Halifax Security Conference; Global Military Advisory Group etc.
The report aimed to open a debate on how to frame national climate change politics and policy

Key Messages
December 2013 E3G 3
• Managing climate risk effectively requires incorporation of the full range of uncertainties into decision making at all levels.
• Neither international and national climate change decision making currently manages risk well. It does not incorporating best practice from areas such as security, health or infrastructure planning
• Many under-managed risks come from interdependencies (e.g. food trade) and impacts of climate regime failure on global cooperation
• The 2C goal inside the UNFCCC is a meaningful risk threshold but insufficient to drive international risk management.
• The international climate regime must reform but also needs to be built on much stronger national risk management frameworks and public debates. National mitigation plans must be consistent with 2C under multiple scenarios of climate sensitivity and policy failure.

December 2013 E3G 4
Why Risk Management?
• E3G’s work on climate security showed the importance of considering the full range of climate scenarios for effective security planning
• Most analysis uses median IPCC scenarios which do not reflect latest science on extreme impacts or analysis on instability
• Public debates unhelpfully equate uncertainty with inaction
• In contrast major security decisions made on far more uncertain data than climate policy; “what threat will China pose in 2050?”
Question: what would climate strategy look like if we treated it as seriously as nuclear proliferation?

December 2013 E3G 5 5
Risk Management is…
• Broader than optimisation, cost-benefit, real options….
• A pragmatic approach to making policy decisions under uncertainty
• Built on a long history of success – and failure – in security (and finance, resource management, infrastructure management etc)
• About “who” as well as “what” and “how much”
• A way of framing political debates but not replacing them
• Something we do all the time: deterrence vs disarmament; civil
liberties vs terrorism risks; intervention vs isolationism.
How much risk should we take?

December 2013 E3G 6
Methodology Underpinning the Report
• Information Gathering: systematic analysis of major impacts and uncertainties across climate science, impacts and mitigation/adaptation options.
• Assessment: of the policy implications of current information, including limits to what we know, what we could know and biases in how we understand issues and threats.
• Risk Management Analysis: evaluation of current risk management approaches to assess gaps or flaws in risk management frameworks; risk management instruments; and delivery of risk management
We are not managing any of the risks well!

December 2013 E3G 7 7 E3G 7
The Climate System is Historically Volatile
Source: Hansen (2005)

Human civilisation has evolved in an unusually stable climatic period
December 2013 E3G 8

Rising CO2 emissions are pushing us into unprecedented risk areas
December 2013 E3G 9

December 2013 E3G 10 10
Scientific Uncertainty is Endemic
Source: IPCC, 2007
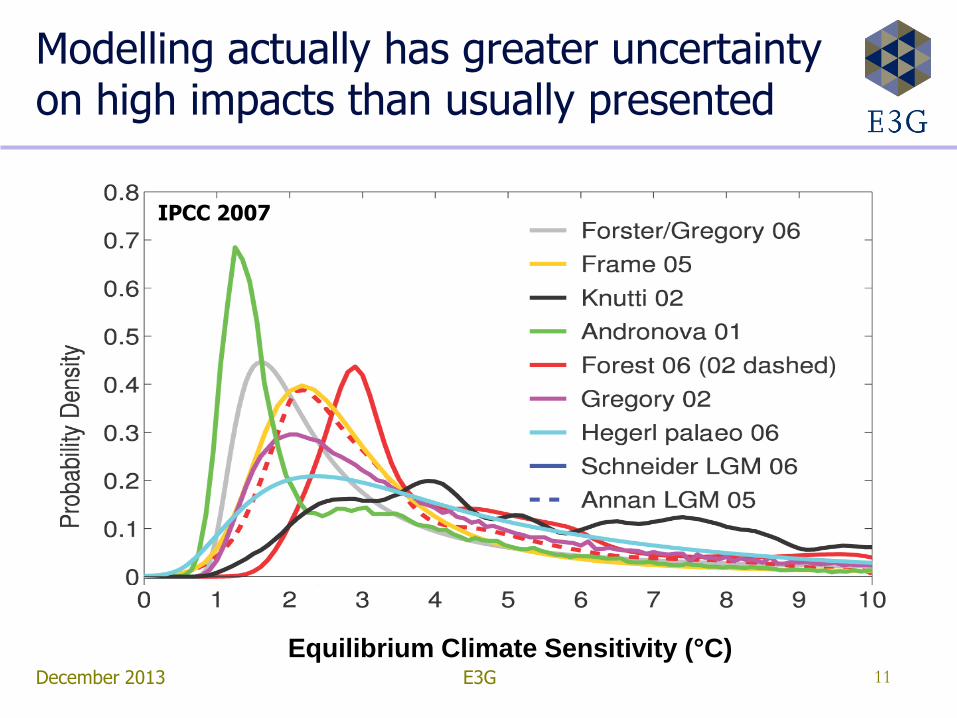
Modelling actually has greater uncertainty on high impacts than usually presented
December 2013 E3G 11
Equilibrium Climate Sensitivity (°C)
IPCC 2007

High risks increase faster than mean risks
December 2013 E3G 12
0
5
10
15
20
25
30
35
40
0 2 4 6 8 10 12 Change in global mean surface temperature (°C)
Pro
ba
bil
ity (
%)
-0.8° -1.3°
No policy
Mitigation
Climate Sensitivity
Leftward shift relative to climate sensitivity of 1.5
2030 2050 2100
2.0 2.5 3.0 4.5 6.0
1.2 1.3 1.4 1.7 1.8
1.2 1.4 1.5 1.8 2.0
1.2 1.5 1.7 2.1 2.4
Reduced “expected”
change
Most severe outcome is
off the table
Source: Gulledge, 2010

Climate Extremes Rise Non-Linearly
December 2013 E3G 13
2°C above pre-
industrial
Source: PIK, 2013
Percentage of Global Land Area impacted by Heatwaves

December 2013 E3G 14 14 E3G 14
Estimates of impacts at 2C have worsened over time
Source: Smith et al., 2007 Dangerous Climate Change: An Update of the IPCC Reasons for Concern
2C

Global Tipping Points are not included in most assessments
December 2013 E3G 15
Source: Lenton, 2010

Tipping Point Probabilities?
December 2013 E3G 16
Source: Lenton, 2010
“2C”

December 2013 E3G 17 17 E3G 17
Large scale adaptation is needed for at least 40 years – even with the most aggressive mitigation measures
Source: Hadley Centre (2006)
Emission Scenarios Diverge Radically … But impacts only begin to slow after 2030-40
The low emissions scenario is consistent with a 450ppm (CO2 eq) atmospheric concentration
This effort would give a 50% chance of limiting temperature rise to 2C, and requires global emissions to peak by 2020

Many Estimates of Relative Climate Impacts have Been Developed
December 2013 E3G 18

Large differences exist between current
vulnerability methodologies;
E3G - EWI 19
• Equilibrium sea level rise and changes in water supply dominate results
• Capacity to adapt usual assessed in terms of GDP not social systems
• Large differences in rankings of even G20 countries
• US suffered 1.4% GDP losses from extreme climate events in 2012. Four times that of the EU.
• Rankings do not address dynamic vulnerabilities like food or energy price shocks

Food Price Volatility Estimates 2030
E3G - EWI 20
0 100 200 300 400 500 600
% increase on 2010 baseline
% increase in
average world market export
price 2010-2030 (caused
by climate change and
other factors)
Additional %
increase in world market
export price in 2030 due to
weather related shock
NORTH AMERICA SHOCK:
140% additional price increase on 2030 baseline
177% increase
on 2010 baseline
by 2030
NORTH AMERICA SHOCK:
33% additional price increase
on 2030 baseline
120% increase
on 2010 baseline
by 2030
MAIZE
WHEAT
Source: Oxfam 2012

December 2013 E3G 21
Emissions on 4.0-6C trajectory; probability of delivering 2C mitigation pathway falling
Short-term • Reverse emission trajectory • Emissions peak by 2020
Medium-term • Sustain emission trajectory • Around 3%/yr reductions globally
Long-term • Net negative emissions • CCS technologies
Source: Peters et al. 2012a; Global Carbon Project 2012

November 2013 E3G 22
Belgium Increased Nuclear
Reduced Oil
Sweden Increased Nuclear
Reduced Oil
France Increased Nuclear
Reduced Oil & Coal
United Kingdom Coal to gas
Reduced Oil Increased Nuclear
History shows that this is possible

E3G
Transformation means: driving peak oil demand around 2020
Global oil consumption
0
500
1,000
1,500
2,000
2,500
3,000
3,500
4,000
4,500
5,000
2000 2010 2020 2030
MT
oe Shell Scenarios
IEA 450
January 2013 23

E3G
a sharp decline in coal consumption
Global coal consumption
0
500
1,000
1,500
2,000
2,500
3,000
3,500
4,000
4,500
5,000
2000 2010 2020 2030
MT
oe Shell Scenarios
IEA 450
January 2013 24

E3G
… and a progressive increase in the proportion of low carbon energy consumption
Percentage low carbon energy consumption
0%
5%
10%
15%
20%
25%
30%
35%
2000 2010 2020 2030
IEA 450
Shell Scenarios
January 2013 25
Key Mitigation Uncertainties
• Ability to agree co-operative climate regime covering most emissions
• Shift $25 trillion from high to low carbon sectors to 2030
• Double current rate of global technology diffusion
• 50% of carbon savings from additional energy efficiency per unit GDP by 2050
• 100ppm from avoiding deforestation by 2030
• CCS and nuclear makes up 20-30% of “standard mitigation paths” – technology and accident uncertainties
• But current modelling also underestimated falls in solar, wind and LED costs by 20-30 years and assumed oil would be below $100 bbl
Mitigation uncertainty as important as science
December 2013 E3G 26

Consistent Biases in Treatment of Climate Risk
• Climate Sensitivity: Even with high mitigation actions the world could face higher climate change. 2C is a meaningful risk threshold for extreme damage – chance of overshoot should be minimised.
• Vulnerability: Impact analysis is immature and tends to underestimate the impacts of growing volatility, extreme weather events, system interdependencies, and security/stability impacts.
• Mitigation Uncertainties: Mitigation pathways are highly uncertain and prone to technological disruption. Technology cooperation, global supply chains and international finance can radically raise diffusion rates
• International Cooperation: Analysis ignores consequences of mitigation failure for resilience and growth through the erosion of co-operation, globalisation and rules-based international systems.
December 2013 E3G 27

December 2013 E3G 28 28
Risk scenarios assuming agreement to keep global temperatures below 2C
Could breach tipping points even if mitigation policy is successful
High Climate Sensitivity
Low Climate Sensitivity
Failed Mitigation Policies
Successful Mitigation Policies
Collapse and
Competition
6-8C
Defensive
Adaptation
2-4C
Crash
Response
3-5C
Robust
Regime
2-3C

December 2013 E3G 29
The “ABC” Risk Management framework
• Aim to mitigate to stay below 2°C;
• Build and budget for resilience to 3-4°C;
• Contingency plan for capability to respond to 5-7°C
Elements same for all countries/actors but goals will differ; there is no universal risk management approach

December 2013 E3G 30
Ten Steps to implement a Risk Management Framework
Aim to stay below 2°C
Sufficient mitigation goals
Increased investment in transformational RD&D
Resilient and flexible global climate regime
Independent national climate security risk assessment
Build and budget for 3-4°C
Adaptation strategies for “perfect storms” and interdependent impacts
Improved cooperation on preventive and humanitarian intervention
Increased resilience of international resource management frameworks
Provision of data and tools decision-makers need
Contingency plan for 5-7°C
Contingency ‘crash mitigation” planning’
Systematic monitoring of tipping points

December 2013 E3G 31
Building a credible climate risk mitigation strategy
1. Sufficient Mitigation Goals: Globally governments have agreed to keep average temperatures “below 2C” as the ultimate objective of the UNFCCC. A 66% likelihood of achieving long term below 2C stabilisation requires all countries to reach “net zero” emissions between 2050 and 2070. National plans must be consistent with this goal and capable of “flexing” to achieve faster reductions under high climate sensitivity.
2. Increased transformational RD&D: Nations should increase their clean energy RD&D spending by five times by 2020, and designate a share – at least 10-20 percent – of increased RD&D spending to cooperative activity with developing countries.
3. Resilient International Climate Regime: As in arms control, the principle of “trust and verify” is a good foundation for control of greenhouse gas emissions. If it is not possible to determine whether a nation knowingly missed a target or made a good-faith effort but failed, there is a high potential for mistrust. The global climate regime must include strong rules for reporting, and should promote a high level of transparency to help distinguish between intentional freeloading and honest failure.
National UNFCCC positions should reflect these risk management principles
Aim to stay below 2°C
Build and budget for 3-4°C
Contingency plan for 5-7°C

December 2013 E3G 32
Sustainable global response relies on National Climate Risk Assessments
4. National Climate Risk Assessments
• A clear view on national interests is the necessary foundation on which to build an effective global regime to manage climate change. Most countries have yet to develop clear goals which reflect their core national interests e.g. effectively eliminating the chance of 4°C? a 1% chance of materially shifting the Indian Monsoon?
• Current assessment is dominated by ministries in charge of implementing policy; need to separate the assessment and policy functions.
• Actors responsible for areas of economy, infrastructure and security most impacted by climate change (“climate takers”) do not yet have as strong an input on the effectiveness and scale of domestic and international climate mitigation policy as fossil energy industries (“climate makers”)
Without a “whole of government” risk assessment countries cannot effectively define their national interests
Aim to stay below 2°C
Build and budget for 3-4°C
Contingency plan for 5-7°C

Examples of Defining National Climate Risk Goals
• UK Climate Risk Goal: UK Climate Change Committee sets overall UK goal: “Central estimates of global temperature increase by 2100 should be limited to as little above 2°C over pre-industrial levels as possible, and the likelihood of a 4°C increase should be kept to very low levels (e.g. less than 1%)”
• Key UK climate impacts: domestic floods; heat waves; global food price rises; international stability and security risks
• Japanese climate risk goal? Key Japanese impacts?
– Minimise risk of 1-2m sea level rise and storm surges?
– Impacts on domestic rice production and food imports?
– Risks of domestic extreme weather events?
– Impacts on manufacturing supply chains?
December 2013 E3G 33

December 2013 E3G 34
Need to plan for “Perfect Storm” and Policy Failure Scenarios
5. Planning for High and Interdependent Impacts
• Effective investment in national resilience requires clear identification of planning scenarios (2, 3, 4°C or higher). Long lived infrastructure design must assess probability of mitigation failure and high climate sensitivity
• In the near term highest risks come from the combination of climatic volatility, resource scarcity, poor governance and high energy prices.
• 2008 energy and food price shocks showed the impact of interdependencies. The Thailand floods resulted in large re-evaluation of global supply chains.
• Planning must go beyond the technical to address the impact of instability on adaptation e.g. in Pakistan post-flood reconstruction and post-Arab Spring stability investment programmes
Remove divide between national and international impacts
Aim to stay below 2°C
Build and budget for 3-4°C
Contingency plan for 5-7°C

December 2013 E3G 35
Building international resilience
6. Improved cooperation on preventive and humanitarian intervention: The impacts of climate change will require larger and more frequent humanitarian and preventive missions by the international and regional organizations. These will require better coordination, higher levels of civilian capability, and greater investment in preventive approaches to natural disasters.
7. Increased resilience of international resource management frameworks: peaceful resolution of resource tensions created by climate change will necessitate updating international management efforts in order to preserve a rule-based global order. The time to strengthen international mechanisms to reduce resource conflict is now, when the impacts of climate change are still at relatively low levels, by action to reform a range of international, regional and bilateral agreements.
8. Providing the data and tools that decision-makers need : Specific information gaps - particularly in the likely response of social and economic systems to climate change - are a significant source of uncertainty in managing strategic security risks, including climate risk. Projections that provide actionable information on relevant social and landscape scales are required to enable more focused risk management.
Large potential for cooperative action in building resilience, and developing better tools and decision support systems
Aim to stay below 2°C
Build and budget for 3-4°C
Contingency plan for 5-7°C

December 2013 E3G 36
Preparing Crash Programmes
9. Preparing Contingency Crash Programmes
• In the case of policy failure and/or high climate sensitivity there will be strong political pressure (panic?) for “crash responses”
• Many technological options are available, but some have high climatic, security and feasibility risks e.g. proliferation risks of a global crash nuclear fission programme. Prudent now to develop contingency plans – and international controls – over major geo-engineering and technological options
10. Monitoring Tipping Points
• Currently there is no systematic monitoring of climate system tipping points. This removes the opportunity to anticipate approaching thresholds and respond with “crash” mitigation.
No sensible risk management framework should ignore the worst case scenarios
Aim to stay below 2°C
Build and budget for 3-4°C
Contingency plan for 5-7°C

December 2013 E3G 37
Risk management gives an opportunity to reframe the public debate
• Current debates – especially in US – split into climate “sceptics” and “believers”; has led to an under-emphasis of both scientific uncertainties and extreme scenarios
• This debate alienates the majority of people who do not identify with either camp; undermining effective policy making
• Risk management allows a debate where all information can be used and assessed; a pragmatic not a belief based approach
• Need to reframe debate to a public conversation
“How much climate risk are you prepared to take?”

December 2013 E3G 38

December 2013 E3G 39
Thank You!
Please visit www.e3g.org to see our recent work on risk management
If you would like to know more please contact [email protected]

December 2013 E3G 40 40
Annex: Background Analysis of Elements of a Risk Management Approach
1. Defining Risks?
– Intrinsic uncertainty or scenario-based
– Impacts
– Reversibility/threshold effects
2. What likelihood?
3. Visibility and monitoring strategies
4. Current risk management strategy
– What?
– Who?
– Consequences/effectiveness
5. Alternative risk management strategy

December 2013 E3G 41 41
Key Climate System Uncertainties
Normal Uncertainty? • Rate of GHG accumulation in Atmosphere
– Terrestrial and oceanic sinks
• Radiative forcing impact of GHGs – Ozone, CH4 and Ch2 Forcing – Aerosol Forcing
• Climatic impact of radiative forcing
– Cloud behaviour – Albedo effects
Extreme Impacts • Tipping point positive feedback loops
– Methane hydrates – Permafrost methane – Boreal and Tropical Forest dieback
Climate Sensitivity?

December 2013 E3G 42 42
Risk Management Table
Risk Impact Dynamics Likelihood Visibility Current Risk Mgt
Alt. Risk Management
Sinks Double CO2 accumulation rate
Gradual and irreversible
? Immediate impact on GHG rates
2C target Crash GHG reduction
Artificial sinks
Climate Sensitivity
2-3 C? NA NA Modelled quantity
2C target Crash GHG reduction
Geoengineering
4C Adaptation
Methane Hydrates
Catastrophic
Threshold and irreversible; gradual impact?
Unknown threshold
Thresholds not monitorable
2C target ?
Forest Dieback
2C additional?
Gradual and irreversible
From 2-3C onwards?
Early signs observable
2C target Crash GHG reduction
Geoengineering
4C Adaptation
Permafrost Methane
Low Gradual and irreversible
Occurring now?
Observable 2C target

December 2013 E3G 43 43
Key risk management conclusions
• Need to redefine “climate sensitivity” to make this useful for decision makers. Minimising risk of triggering tipping point effects is critical for maintaining security objectives. Need for “post-IPCC” structure to drive science?
• Monitoring of key tipping points events is very unsystematic giving little early warning of approaching thresholds. Cooperative action could improve this.
• Underlying instability of climate system suggests that emission cuts will need to be far steeper than current trajectories
• Significant probability of a crash GHG reduction programme in next decades.
– Need for contingency planning to make this feasible, including geo-engineering.
– The implications of rapid global nuclear fission build for proliferation and safety need immediate consideration.
• Need to sensitise decision makers to the reality of different scenarios beyond reports and studies; immersive gaming is probably the best way to engage at a deep level and challenge implicit assumptions on climate stability

December 2013 E3G 44 44
Key Climate Impact Uncertainties
Normal Uncertainty?
• River basin hydrological cycles
• Glacial melting changing major river flows
• Speed of Greenland ice-shelf melting
• Frequency of extreme weather events
• Ocean acidification/ecosystem impacts
• Impact of maladaptation and climate driven conflict
Tipping Point Impacts
• Indian Monsoon weakening/increased volatility
• Arctic Sea Ice Melting
• West Antarctic Iceshelf melting
• Atlantic circulation shifting

December 2013 E3G 45 45
Risk Management Table
Risk Impact Dynamics Likelihood Visibility Current Risk Management
Alt. Risk Mgt
Hydrological cycles
High and variable
Gradual and unpredictable
High Volatility masks shifts
Water management adaptation
Glacier Melt Reduction in river flows
Threshold and irreversible
High Retreat monitorable
?
Greenland Icesheet
1-2m rise by 2100; max 7m
Threshold and irreversible
High after 1.5C warming
Melting rate monitorable
Additional sea defences
Migration
Extreme weather events
High impacts Gradual and irreversible
? Volatility masks shifts
Preventive disaster relief
planning
Ocean ecosystem disruption
High but variable on fish stocks
Gradual and irreversible
High Volatility masks shifts
None Fisheries adaptation
Migration
Climate driven conflict
High Gradual High but regional
Poor monitoring of impacts
None Investment in resilience

December 2013 E3G 46 46
Risk Management Table II
Risk Impact Dynamics Likelihood Visibility Current Risk Management
Alt. Risk Management
Indian Monsoon
Unclear High above 3-4C?
Volatility mask shifts
?
Arctic Sea Ice
Positive? Gradual with possible threshold
High Ongoing measurement
Resource agreements
between Arctic powers
West Antarctic Ice Shelf
1m by 2100? Maximum 7m
Threshold and irreversible?
High above 3-4C?
Unclear 2C limit
Atlantic circulation
Large cooling in Europe
Threshold and irreversible?
High above 3-4C?
Weakening could be monitored
2C limit

December 2013 E3G 47 47
Key Risk Management Conclusions
• Current approach of fragmenting impacts does not capture the elements of most interest of security actors; there is a need for new analysis frames.
• For near term security planning critical interest is “perfect storm” events where climate stresses/extreme events combine with water, food, energy and governance issues to drive emergencies and instability
• For the longer term analysis understanding resilience in response to multiple shocks is critical; especially in developed countries where resilience is overestimated.
• There is a gap in practical tools to guide investment in resilience to climate change/resource pressures in unstable regions. Risk that adaptation funds will drive hard engineering response and may ignore or heighten instability e.g. on transboundary waterways
• Critical to understand how to reduce risk that countries will shift their adaptation strategies from a reliance on interdependence (e.g. food trade) to a focus on resource capture? Need for pre-emptive investment in cooperative frameworks.

December 2013 E3G 48
Climate Mitigation Challenges
• Current goal of stabilisation at 450ppm CO2eq gives 50:50 chance of 2C rise, and a 20% chance of 4C rise
• Under higher climate sensitivities there will be a need for zero net emissions by 2050 and negative emissions for the next century
• Developed country emission must peak now; developing countries starting from 2025 onwards?
• 450ppm scenario requires around $1.3 trillion in low carbon investment annually to 2030
• Additional cost of this is 1-2% GDP but costs fall to zero when oil price sustained at $100-140 bbl
• Diffusion rate of new technologies needs to double to meet 450 trajectory

December 2013 E3G 49 49
Preserving Climate Security: Understanding Mitigation Policy Risks
Normal Risks? • Slower energy efficiency increases (reducing the 50% of planned reductions by 2050)
• Higher BAU projections (20-50% higher emissions)
– Global GDP growth – Oil price/energy security politics – Transportation use in developing countries
• Slower reduction in deforestation rates (10-20% of emissions cuts)
• Underperformance/failure of new low carbon technologies
– CCS (20% of 2050 reductions?) – Biofuels (10-20% of 2050 reductions?) – Nuclear (10% of 2050 reductions?)
Tipping Point Impacts • Collapse in integrity of the climate change control regime • Impact of serial nuclear accidents/terrorism • Positive impact of development of surprise low carbon technologies (e.g. cheap solar)

December 2013 E3G 50 50
Risk Management Table
Risk Impact Dynamics Likelihood Visibility Current Risk Mgt
Alt. Risk Mgt
Efficiency High – 50% abatement to 2050
Gradual Medium Visible but monitoring poor
Weak Increased low carbon energy
BAU High Gradual High Monitored Annex I caps
Increased low carbon energy
Deforestation Move to 550ppm trajectory
Gradual except food /oil shock
High Monitored but shocks not modelled
None Increased low carbon energy
Technology failure
CCS failure 70% cost increase
Gradual Medium Unclear due to commercial interests
None Increase RD&D/TAPs
Integrity of Climate regime
10 year mitigation delay
Threshold Medium UN monitoring
Nuclear accidents/ profliferation
Low on most scenarios
Shock ? Only after event
NPT regime
IAEA system
NPT review
Gen IV

December 2013 E3G 51 51
Key Risk Management Conclusions
• Mitigation risks are less examined than scientific risks, but are of similar or larger scale. General complacency among policy makers on the expected delivery of fundamental changes, especially in energy efficiency and forestry.
• There will be a need for more low carbon energy technologies much earlier than on current plans. Increased cooperative international RD&D is a vital risk management tool but track record of success is low.
• Pre-emptive investment in infrastructure (e.g. advanced grids) would give flexibility to quickly increase mitigation rates but this is difficult under current regulations in most countries.
• Energy security and resilience benefits of new energy systems should be a major driver for early deployment; though cybersecurity risks need to be better managed.
• UNFCCC system is critical to set goals and monitor and verify progress. Need for effective and independent verification of country actions to make system resilient in face of shocks. Mixed record of trust in UN: IAEA vs Bioweapons
• Large oil price rises could stimulate more use of clean tech or a retreat to unabated coal; carbon capture and storage is a critical technology to hedge this eventuality. Understanding the real potential for nuclear energy is critical for understanding proliferation risks.