del mar collegeadministration. trey mccampbell, chair gabriel rivas iii, first vice chair carol...
TRANSCRIPT

DEL MAR COLLEGEStatistical Profile Volume 32
An annual publication of the Office of Strategic Planning and Institutional Research
2017-2018
Institutional Fact Book

2017-2018Statistical Profile, Vol. 32
An Institutional Fact Book
Del Mar College 101 Baldwin Blvd., HA-106
Corpus Christi, TX 78404-3897 Voice: (361) 698-1207 Fax: (361) 698-1090
http://www.delmar.edu/spir/
Prepared by: Lenora Keas, Vice President of Workforce Development and Strategic Initiatives
Sushil Pallemoni, Director of Institutional Research Jane Haas, Sr. Research Associate Shane Stewart, Research Associate Newman Wong, Research Associate
Carolyn Sorrels, Administrative Assistant
August 2018

On the cover: The Emergency Training Building on the Del Mar College West Campus serves as a training space for students in fire, police and occupational safety programs. It can also serve as an emergency management center during declared emergencies.
Del Mar College commits to not discriminating against any student, employee or prospective employee on the basis of race, gender, age, disability, creed, marital status, national origin, political affiliation or sexual orientation.
If you require assistance with this document, contact the Office of Strategic Planning and Institutional Research at: (361)698-1207

Table of Contents Page
Section I: College Profile Introduction .................................................................................................................................................................................. 1Philosophy and Mission .............................................................................................................................................................. 2 Board of Regents and Administration ......................................................................................................................................... 3 Organizational Chart ................................................................................................................................................................... 4 College and Student Profile ......................................................................................................................................................... 5 Texas Higher Education Strategic Plan – 60x30TX .................................................................................................................... 6 Del Mar College Single Member Districts – Map ........................................................................................................................ 7
Section II: Student Profile Highlights / Terms and Definitions .............................................................................................................................................. 9 Chapter Summary ......................................................................................................................................................................... 10 Student Profile, Fall 2014 – Fall 2017 ......................................................................................................................................... 15 Student Residency ....................................................................................................................................................................... 16 Student Headcount by Department .............................................................................................................................................. 17 Students by Declared Major ........................................................................................................................................................ 18 East and West Campus Headcount by Declared Major ............................................................................................................... 25 Student Characteristics: Fall Semesters, 1985-2017 ................................................................................................................... 26 Student Characteristics by Gender ............................................................................................................................................... 27 Student Profile: Unduplicated Headcount Enrolled in Each Discipline ...................................................................................... 28 Student Headcount by Semester .................................................................................................................................................. 41 Financial Aid Awards .................................................................................................................................................................. 42 Financial Aid Distribution ............................................................................................................................................................ 43 Students Enrolled by Semester Credit Hour ................................................................................................................................ 44 Profile of First-Time-in-College Students ................................................................................................................................... 45 Developmental Course Enrollments, Fall Semesters ................................................................................................................... 47 Three year FTIC Student Grade Distribution in Developmental Education ................................................................................ 48 Area High School Graduates Enrolling Three Months after Graduation ...................................................................................... 49 Area High School Graduates Enrolling at Least Once as of Fall 2017 ........................................................................................ 50
Section III: Graduates and Outcomes Highlights / Terms and Definitions ............................................................................................................................................. 51 Chapter Summary ......................................................................................................................................................................... 52 Course Plans and Program Offerings ........................................................................................................................................... 53 Degrees and Certificates Awarded by Year, 1935-2017 ............................................................................................................... 57 Associate in Arts Transfer Degrees Conferred by Declared Majors ............................................................................................ 58 Associate of Arts in Teaching and Associate in Science Transfer Degrees Conferred by Declared Majors ................................ 59 Associate in Applied Science Degrees Conferred by Declared Majors ........................................................................................ 60 Certificates Awarded by Occupational Programs ......................................................................................................................... 62 Other Awards Conferred by Declared Majors ............................................................................................................................ 63 Three Year Summary of Degrees and Certificates Conferred by Gender and Race/Ethnicity ...................................................... 64 Summary of Degrees and Certificates Awarded for 2016-2017 by Type, Ethnicity/Race, and Gender ....................................... 65 2015-2016 Graduates and Leavers Transferring as of Fall 2016 .................................................................................................. 69 Location of Fall Students One Year Later ................................................................................................................................... 70 Retention and Graduation Rates for FTIC Students by Cohort .................................................................................................... 71 Graduating Students Who Were Enrolled in Developmental Education ...................................................................................... 73 General Educational Development Testing Program .................................................................................................................... 74
Section IV: Contact Hours Highlights / Terms and Definitions .............................................................................................................................................. 75 Chapter Summary ......................................................................................................................................................................... 76 Annual Contact Hour Totals by Division .................................................................................................................................... 77 Arts and Sciences Contact Hour Totals by Department ............................................................................................................... 78 Business, Industrial and Public Safety Education Division Contact Hour Totals by Department ................................................ 79 Health Sciences and Professional Education Division Contact Hour Totals by Department ........................................................ 80 Contact Hours by Discipline and Semester ................................................................................................................................. 81 Contact Hours for Developmental Courses ................................................................................................................................. 94 Contact Hours Not Funded by State Appropriations ................................................................................................................... 97Contact Hours Not Funded by State Appropriations by Discipline ............................................................................................. 98
Del Mar College Statistical Profile 2017/18 iii

Table of Contents Page
Section V: Semester Credit Hours and Grades Highlights / Terms and Definitions .............................................................................................................................................. 101 Chapter Summary ......................................................................................................................................................................... 102 Semester Credit Hours by Discipline ........................................................................................................................................... 103 Student FTE to Teaching Staff FTE Ratio ................................................................................................................................... 106 Percent of Semester Credit Hours Taught by Part-time Faculty .................................................................................................. 109 Average Class Size by Discipline ................................................................................................................................................. 112 Grade Distribution by Division for College-Level Courses ......................................................................................................... 116 Grade Distribution by Discipline for Developmental Courses .................................................................................................... 117
Section VI: eLearning and Other Special Programs Highlights / Terms and Definitions .............................................................................................................................................. 119 Chapter Summary ......................................................................................................................................................................... 120 Enrollment in Non-Traditional Courses ....................................................................................................................................... 121 Contact Hours for Non-Traditional Courses ................................................................................................................................ 122 Unduplicated Headcount of Students Enrolled in eLearning by Tuition Status ............................................................................ 123 eLearning Enrollment - Internet ................................................................................................................................................... 124 eLearning Enrollment - Hybrid and Interactive Video ................................................................................................................. 128 eLearning Enrollment - Virtual College of Texas ....................................................................................................................... 131 Collegiate High School Course Enrollment .................................................................................................................................. 132 Dual Credit Course Enrollment .................................................................................................................................................... 133 Off-Campus Course Enrollment ................................................................................................................................................... 136 Annual Enrollment in Dual Credit and Off-Campus Courses by Location ................................................................................ 138 Flexible Scheduling Course Enrollment - Eight-Week ................................................................................................................ 139 Flexible Scheduling Course Enrollment - Rapid Track ............................................................................................................... 141 Flexible Scheduling Course Enrollment - Weekend ..................................................................................................................... 142
Section VII: Continuing Education Highlights / Terms and Definitions .............................................................................................................................................. 143 Chapter Summary ......................................................................................................................................................................... 144 Average Class Size for Continuing Education Programs ............................................................................................................. 145 Continuing Education Contact Hours by Program and Quarter ................................................................................................... 147 Annual Contact Hour Totals for Continuing Education Programs by Funding ............................................................................ 149 Profile of Students Enrolled in Funded Continuing Education Courses ...................................................................................... 150 Enrollment and Contact Hours for Continuing Education Contracted Courses .......................................................................... 151 Contract Training - Companies Served ....................................................................................................................................... 152
Section VIII: Faculty and Staff Highlights / Terms and Definitions .............................................................................................................................................. 153 Chapter Summary ......................................................................................................................................................................... 154 Faculty by Division and Rank ..................................................................................................................................................... 155 Tenured and Tenure-track Faculty by Rank and Education ......................................................................................................... 157 Faculty by Rank and Gender ....................................................................................................................................................... 158 Faculty by Rank and Ethnicity .................................................................................................................................................... 159 Departmental Full-time Equivalent Teaching Staff, Fall 2017 ..................................................................................................... 160 Average Nine-month Tenured/Tenure-track Faculty Salaries by Rank and by Division .............................................................. 163 Employee Groups by Gender ...................................................................................................................................................... 164 Employee Groups by Ethnicity/Race ........................................................................................................................................... 165
Section IX: Budget and Finance Highlights / Terms and Definitions ............................................................................................................................................. 167 Chapter Summary ......................................................................................................................................................................... 168 Operating Budget, 2017-2018 ...................................................................................................................................................... 169 Operating Fund Expenditures by Object ..................................................................................................................................... 170 Summary of Capital Assets ......................................................................................................................................................... 171 Summary of Annual Revenues by Source ................................................................................................................................... 172 Summary of Annual Expenses by Function ................................................................................................................................. 173 Del Mar College Foundation Summary of Revenues, Expenses, and Changes in Net Assets ...................................................... 174 District Assessed Valuation, Local Tax Rate, and Capital Investment ........................................................................................ 175 Buildings and Grounds ................................................................................................................................................................ 176
iv Del Mar College Statistical Profile 2017/18

Del Mar College Statistical Profile Introduction Using This Book
The Del Mar College Statistical Profile is an annual Every effort has been made to edit and update our publication of the Office of Strategic Planning and data resources and to include as many prior years of Institutional Research. It is designed to provide information as possible for each data element. Past reliable, consistent, and longitudinal information editions are available in print and online for anyone about the Institution and its students. Information seeking more historical data than is provided in this from this and prior editions can be used to evaluate edition. programs and operations, and is a convenient You may access this publication on the Del Mar reference for answering the most frequently asked College Web site at http://www.delmar.edu/ under questions about the College. By reviewing the Offices and Facilities, followed by Strategic College’s historical development and current trends, Planning and Institutional Research. Let us know if we may better anticipate and plan for the future. this document meets or does not meet yourOccasionally, modifications of the data published in expectations. Suggestions for future editions are prior editions are required due to audits, welcomed and encouraged. E-mail responses can be reorganization, programs and courses title changes, or sent to Sushil Pallemoni. We look forward to hearing typographical errors. from you.
Del Mar College History
Del Mar College was founded in 1935, under the The philosophy and mission statements for Del Mar control of the Board of Trustees of the Corpus Christi College are evaluated regularly as part of theIndependent School District, to provide two years of College’s compliance process for reaffirmation ofpost-secondary education. In 1951, the College accreditation by the Commission on Colleges of thebecame an independent political sub-division, legally Southern Association of Colleges and Schools. The Corpus Christi Junior College District. In 1999, the Board of Regents adopted the current College Vision Board of Regents adopted Del Mar College District Statement, Mission Statement, Core Values, and as the official name of the institution. Guiding Principles on August 9, 2011.
Del Mar College started 80 years ago in borrowed Every ten years the College undergoes a regional classrooms with 154 students in the first class. Today reaccreditation process to ensure compliance with the the College serves over 24,000 learners each year in principles set forth by the Commission on Collegesacademic, career and technical, and continuing of the Southern Association of Colleges and Schools education courses. The College now offers programs (SACS). The most recent reaffirmation ofon two campuses, at the Del Mar College Center for accreditation was announced in June 2011, with noEconomic Development, at the Northwest Center, recommendations. The College’s programs andand the hangar at the Corpus Christi International courses are approved by the Texas Higher Education Airport, with combined physical assets of almost Coordinating Board and the Texas Education$275 million. Agency.
Del Mar College Statistical Profile 2017/18 1

Vision Statement
Del Mar College empowers student learners in our communities through comprehensive, accessible, quality education.
Mission Statement
Del Mar College provides access to quality education, workforce preparation, and lifelong learning for student and community success.
Core Values
• Learning: meeting individual needs • Student Success: achieving full potential • Excellence: high-quality instruction • Integrity: honesty and transparency • Access: open to all • Accountability: responsibility to stakeholders • Innovation: progressive programs and services • Diversity: valuing differences
Guiding Principles Quality Education Challenge students to engage in academic and occupational programs through high-quality teaching and learning. Academic Excellence Promote the full range of intellectual achievement from basic literacy to successful academic transfer. Academic Freedom and Responsibility Provide the foundation for a learning environment that promotes academic excellence, independent and creative thinking, and respect for the individual. Workforce Preparation Collaborate with business and industry partners to equip students to compete in the marketplace and to augment economic development. Student Success Empower students inside and outside of the classroom to achieve their greatest potential. Educational Access Provide affordable educational opportunities for all, developing responsible citizens who enhance their communities. Personal Enrichment Foster lifelong learning, citizenship, and health and wellness through educational, cultural, and recreational pursuits.
Adopted by the Del Mar College Board of Regents, August 9, 2011
2 Del Mar College Statistical Profile 2017/18

Del Mar College Board of Regents
The Board of Regents, the governing body for Del Mar College, is elected by the citizens of the Del Mar College District. Three positions are filled every two years, with board members serving staggered six-year terms. In 1989, the Board adopted a modified single-member district plan with five Regents elected to represent single-member districts and four members elected at large. Vacancies on the Board are filled for an unexpired term according to Board bylaws.
Term Ending Position
2016 At-Large 2018 District 1 2020 At-Large 2020 At-Large 2022 District 5 2018 District 3 2022 At-Large 2020 District 4 2018 At-Large
Administration
Trey McCampbell, Chair Gabriel Rivas III, First Vice Chair Carol Scott, Second Vice Chair Nicholas L. Adame, Secretary Ed Bennett Elva Estrada Susan Hutchinson Dr. Mary Sherwood Sandra L. Messbarger
Del Mar College Statistical Profile 2017/18 3
President and CEO Executive Vice President & Chief Academic Officer Chief Financial Officer Vice President of Workforce Development and Strategic Initiatives Vice President of Student Affairs Vice President of Administration and Human Resources Vice President of Facilities Operations and Chief Information Officer General Counsel Executive Director of Strategic Communication and Government Relations Executive Director of Development Dean of Arts and Sciences Dean of Business, Industrial and Public Safety Education Dean of Health Sciences and Professional Education Dean of Institutional Effectiveness and Assessment Dean of Workforce Programs and Corporate Services Dean of Continuing Education and Off-Campus Programs Dean of Student Engagement and Retention Dean of Student Outreach and Enrollment Services Dean of Learning Resources
Dr. Mark S. Escamilla Dr. Elizabeth Lewis
Raul Garcia Lenora Keas
Dr. Rito Silva Tammy McDonald
August Alfonso Augustin Rivera, Jr.
Claudia Jackson Mary McQueen
Dr. Jonda Halcomb Charles McKinny
Dr. Shannon Ydoyaga Dr. Kristina Wilson
Daniel Korus Dr. Leonard Rivera
Cheryl Garner Patricia Benavides- Dominguez
Cody Gregg

4 Del Mar College Statistical Profile 2017/18

College Profile
Type Del Mar College, a two-year comprehensive community college founded in 1935, is one of 80 state- and locally-supported community colleges in the 50 public community college districts in Texas.
Funding More than half (52.8%) of the Del Mar College’s 2017-2018 operating budget is funded by local property taxes and another 24.4 percent of the revenue comes from student tuition and fees. The proportion of 2017-2018 operating budget supported by state funds is only 16.3 percent, while in 1987-1988, 50.3 percent of the College’s actual income came from state legislative appropriations.
Organization The four general divisional areas of instruction are Arts and Sciences; Business, Industrial, and Public Safety Education; Health Sciences and Professional Education; and Continuing Education.
Faculty Total tenured tenured/tenure-track faculty numbered 260 for the fall 2017 semester. Over one-fourth (22%) hold a doctorate, and about half (49%) hold master’s degrees. Seventy-six percent of the full-time tenure-track faculty members are tenured. The average length of service for tenured/tenure-track faculty members is 16.1 years.
Enrollment The College served 11,476 credit students in fall 2017. The fall 2016 census credit headcount enrollment was 11,689.
Graduates In academic year 2016-2017, the College awarded 1,822 degrees and certificates, as well as 101 Marketable Skills Achievements and Field of Study awards and 222 Core Curriculum Completers.
Fall 2017 Credit Student Profile
Age The average student age is 24 years.
Gender Women make up about three-fifths (56.8%) of Del Mar College students.
Ethnic Origin More than three out of five (67.0%) of the students are identified as members of ethnic or racial minority groups.
Full/Part-time Over two-thirds of the students (76.7%) attend classes part-time.
Residence Three out of four students (73.6%) are classified as in-district students.
Major Type More than one-half of credit students (54%) are classified as academic; the rest (46%) are career and technical education students.
Del Mar College Statistical Profile 2017/18 5

Texas Higher Education Strategic Plan – 60x30TX
60x30TX, the state’s new strategic plan for higher education, is focused on student success over the next 15 years. The four goals of the plan aim to increase substantially the overall educational attainment among younger adults, achieve more student completions that reflect the state’s changing demographics, ensure that students gain marketable skills they can articulate to employers, and hold student debt to its current level for students who graduate with debt from Texas public two- and four-year institutions. Each goal contains a set of targets and strategies that will help the state reach one or more of the goals.
Goal One: Educated Population By 2030, at least 60 percent of Texans ages 25-34 will have a postsecondary credential or degree.
Target: Incrementally increase overall postsecondary attainment. Status: Del Mar College has increased degree and certificate attainment by 75.4% between FY2000 and FY2017.
Goal Two: Completion By 2030, at least 550,000 students in that year will complete a certificate, associate, bachelor’s, or master’s from an institution of higher education in Texas.
Target: Increase the number of Hispanic, African American, and Male completers. Status: Del Mar College has increased the number of college completers in the above groups over the last 17 years.
Goal Three: Marketable Skills By 2030, all graduates from Texas public institutions of higher education will have completed programs with identified marketable skills.
Target: Maintain the percentage of students who are found working or enrolled within one year of graduation. Status: Del Mar College has increased the percentage of completers and leavers employed and/or enrolled at four-year institutions in the past three years.
Goal Four: Student Debt By 2030, undergraduate student loan debt will not exceed 60 percent of first-year wages for graduates of Texas public institutions.
Target: No more than half of all students who earn an undergraduate degree or certificate will have debt. Status: Percent of undergraduate students earning an associate degree or certificate with student loan debt.
6 Del Mar College Statistical Profile 2017/18

United States Highway 77Ih 37 I-37
State Highway 35
State Highway 44
S High
way 77
United States Highway 1
81
Stat
e H
ighw
ay 3
58
Stat
e Sp
ur 4
07
Leop
ard
St
Stat
e H
ighw
ay 3
61
Aven
ue J
Wes
tern
Ave
Stat
e Hi
ghwa
y 35
7
Sara
toga
Blvd
Agne
s S
tS
t ate
Hig
hway
44D
( Bus
) State Highway 286
Crosstown Fwy
Sta
te S
pur 5
44
N Water StMesquite St
Ayers St
County Road 45
S Pa
dre
Isla
nd D
r
Rodd Field Rd
State Park Rd 22
State Highway Park Rd 22
Cemetery Rd Cotter Ave
Cut-Off Rd
Sta
te P
ark
Roa
d 22
Agn
es
Del
Mar
Col
lege
- Si
ngle
Mem
ber D
istr
icts
App
rove
d by
the
Boa
rd o
f Reg
ents
May
7, 2
002
Sin
gle
Mem
ber D
istri
ct 1
Sin
gle
Mem
ber D
istri
ct 2
Sin
gle
Mem
ber D
istri
ct 3
SIn
gle
Mem
ber D
istri
ct 4
Sin
gle
Mem
ber D
istri
ct 5
Del
Mar
Col
lege
Sin
gle
Mem
ber D
istr
icts
200
2D
el M
ar C
olle
ge S
ingl
e M
embe
r Dis
tric
ts 2
002
1 1 11 11 1 11
3 3 33 33 3 332 2 22 22 2 22
4 4 44 44 4 44
5 5 55 55 5 55
Del Mar College Statistical Profile 2017/18 7

12
34
5
14
92
37
510
616
2142
128
1724
4815
1826
3050
1619
2931
5320
4032
3356
2364
6738
5728
6570
3958
3481
8841
5943
8911
244
6271
9011
545
6373
9111
646
6674
9211
947
6875
109
124
4969
8011
712
551
7283
120
5284
9312
260
8697
6187
9876
9410
777
9511
078
9611
379
106
114
8211
812
385
121
99 100
101
103
111VO
TIN
G P
REC
INC
TS B
Y
DEL
MA
R C
OLL
EGE
DIS
TRIC
TSI
NG
LE M
EMB
ER D
ISTR
ICT
Dis
tric
t
Kostor
yz R
d
Cres
tvilla
Dr
0001
0001
0001
0001
0001
0001
0001
0001
0001
0002
0002
0002
0002
0002
0002
0002
0002
0002
0004
0004
0004
0004
0004
0004
0004
0004
0004
0005
0005
0005
0005
0005
0005
0005
0005
0005
0017
0017
0017
0017
0017
0017
0017
0017
0017
0020
0020
0020
0020
0020
0020
0020
0020
0020
0031
0031
0031
0031
0031
0031
0031
0031
0031
0032
0032
0032
0032
0032
0032
0032
0032
0032
0033
0033
0033
0033
0033
0033
0033
0033
0033
0039
0039
0039
0039
0039
0039
0039
0039
0039
0041
0041
0041
0041
0041
0041
0041
0041
0041
0042
0042
0042
0042
0042
0042
0042
0042
0042
0043
0043
0043
0043
0043
0043
0043
0043
0043
0044
0044
0044
0044
0044
0044
0044
0044
0044
0045
0045
0045
0045
0045
0045
0045
0045
0045
0046
0046
0046
0046
0046
0046
0046
0046
0046
0047
0047
0047
0047
0047
0047
0047
0047
0047
0048
0048
0048
0048
0048
0048
0048
0048
0048
0050
0050
0050
0050
0050
0050
0050
0050
0050
0052
0052
0052
0052
0052
0052
0052
0052
0052
0053
0053
0053
0053
0053
0053
0053
0053
0053
0056
0056
0056
0056
0056
0056
0056
0056
0056
0057
0057
0057
0057
0057
0057
0057
0057
0057
0058
0058
0058
0058
0058
0058
0058
0058
0058
0059
0059
0059
0059
0059
0059
0059
0059
0059
0060
0060
0060
0060
0060
0060
0060
0060
0060
0061
0061
0061
0061
0061
0061
0061
0061
0061
0062
0062
0062
0062
0062
0062
0062
0062
0062
0063
0063
0063
0063
0063
0063
0063
0063
0063 00
6400
6400
6400
6400
6400
6400
6400
6400
64
0066
0066
0066
0066
0066
0066
0066
0066
0066
0068
0068
0068
0068
0068
0068
0068
0068
0068 00
6900
6900
6900
6900
6900
6900
6900
6900
69
0070
0070
0070
0070
0070
0070
0070
0070
0070
0071
0071
0071
0071
0071
0071
0071
0071
0071
0072
0072
0072
0072
0072
0072
0072
0072
0072
0073
0073
0073
0073
0073
0073
0073
0073
0073
0074
0074
0074
0074
0074
0074
0074
0074
007400
7500
7500
7500
7500
7500
7500
7500
7500
750076
0076
0076
0076
0076
0076
0076
0076
0076
0077
0077
0077
0077
0077
0077
0077
0077
0077
0078
0078
0078
0078
0078
0078
0078
0078
0078
0079
0079
0079
0079
0079
0079
0079
0079
0079
0080
0080
0080
0080
0080
0080
0080
0080
0080
0082
0082
0082
0082
0082
0082
0082
0082
0082
0083
0083
0083
0083
0083
0083
0083
0083
0083
0084
0084
0084
0084
0084
0084
0084
0084
0084
0085
0085
0085
0085
0085
0085
0085
0085
0085
0086
0086
0086
0086
0086
0086
0086
0086
0086
0087
0087
0087
0087
0087
0087
0087
0087
0087
0089
0089
0089
0089
0089
0089
0089
0089
0089
0090
0090
0090
0090
0090
0090
0090
0090
0090
0092
0092
0092
0092
0092
0092
0092
0092
0092
0093
0093
0093
0093
0093
0093
0093
0093
0093
0094
0094
0094
0094
0094
0094
0094
0094
0094
0095
0095
0095
0095
0095
0095
0095
0095
0095
0096
0096
0096
0096
0096
0096
0096
0096
0096
0097
0097
0097
0097
0097
0097
0097
0097
0097
0098
0098
0098
0098
0098
0098
0098
0098
0098
0099
0099
0099
0099
0099
0099
0099
0099
0099
0106
0106
0106
0106
0106
0106
0106
0106
0106
0109
0109
0109
0109
0109
0109
0109
0109
0109
0112
0112
0112
0112
0112
0112
0112
0112
0112
0113
0113
0113
0113
0113
0113
0113
0113
0113
0114
0114
0114
0114
0114
0114
0114
0114
0114
0115
0115
0115
0115
0115
0115
0115
0115
0115
0116
0116
0116
0116
0116
0116
0116
0116
0116
0118
0118
0118
0118
0118
0118
0118
0118
0118
0119
0119
0119
0119
0119
0119
0119
0119
0119
01 01 0101 010 0 001
0121
0121
0121
0121
0121
0121
0121
0121
0121
0124
0124
0124
0124
0124
0124
0124
0124
0124
Betty Jean DrWilliams Dr
Holid
ayL
Airline RdLyon
s St
Andr
ews
Dr
Sevil
le D
r
Lare
do S
t
Stat
e Hi
ghwa
y 35
7
Los Robles Dr
Greenwood Dr
State Highway 286
S Staples St
St And
rews Dr
Mald
en D
r
ket R
oad
665
S Upper Broadway
ate
Spu
r 407
Talis
man
St
Navigation Blvd
Mc Campbell Rd
n
Westchest
e Dr
C
St
int R
d
Flato Rd
S Navigation Blvd
PkyBea
r Ln
Cliff Maus Dr
Wes
t Poi
n t R
d
Wes
tway
Dr Omaha Dr
Baldw
in Bl
vd
Villa Dr
Cl
Nep
tune
St
St a
te S
pur 5
44
Old Brow
nsvil
le Rd
Leop
ard
St
Bea
c on
St
Bartl
ett D
r
Driscoll Dr
Flores St
Henry St
Ethel St
San
ta E
lena
St
Guatemozin St
Lou
St
Hor
ne R
d
Airport Rd
Dryer Cir
Molina Dr
Elvira Dr
Lind
a V
ista
St
Theresa St Clo
ver C
irHa
rriet
t Dr
Shaw St
Huds
on S
t
Leon St
Castenon St
Balsam Dr
Le
C
Rossit
er St
Alta Plz
Hewi
t Dr
meda St
P
Crosstown Fwy
44D (Bus)
ueller St
Pierpont StBattlin Buc Blvd
N Port Ave
Osage St
Hid
algo
StMohawk St
Virginia Ave
Eas
t ern
St
Post Ave
Rey
na S
t
Duncan St
S Port Ave Crews St
Leary St
Culberson St
Patto
n St
Mes
tina
St
22nd St Nia
gara
StMorris St
12th St
14th St
Pres
cott
St
Elgin St Sarita St
Tarlton
St
Sono
ra S
tNi
mitz
St
Shel
y St
Pres
a St
Tasc
o St
Vestal St Ayers St
David St
Tom
pkin
s St
Fern
Dr16th St
Rojo Ct
Norton
St
Naples St
Lewis St
17th StFlorida Ave
Lipa
n S
t
N Tancahua St
Col
eman
Ave
N Water St
Bor
n S
t
10th St
Han
cock
St
11th StS Alameda St
Cra
ig S
t
5th St2nd St 3rd StOcean Dr
15th St Indi
ana
Ave
Cactus Rd
Range
r Ave
Green
Gro
ve D
rLazy
Ln
Swantne
r Dr
Daytona Dr
Reid Dr
Texa
n Tr
lOrla
ndo D
rCas
a Blan
ca D
rAustin St
Santa Fe St
Ft W
orth
StBeverly Dr
Dod
drid
ge S
t
Topeka St
Bush St
State Highway 286A (Bus)
Crosstown Access Rd
S P
adr e
Isla
nd D
r
Gav
ilan
St
Martin St
Farm
-to-M
arke
t Roa
d 43
Civitan Dr
Victor Lara Ortegon St
Pamona St
Wood St
Harwick Dr
Crosstown Expy Crest Pebble Dr
Christine St
Sara
toga
Blvd
Ranch Rd
Road 43
Coun
ty R
oad
26A
Brezina Rd
Viol
a Av
eSu
nnyb
rook
Rd
Archer DrDodd StM
ansh
eim B
lvd
Richter St Larcade St
Franklin Dr
Gre
en S
t
Mc A
rdle
Rd
Gra
ciela
Dr
Joha
nna
StSa
cky D
r
Cosner Dr
Carroll Ln
Southwood St
Laura Pl
Soko
l Dr
Hakel Dr
Mas
ters
on D
r
Kosarek Dr
Alvin
Dr
Cres
tsid
e Dr
Cre
st C
liff D
r
Cres
thill
Dr
Weber
Rd
Wow
Rd
Sun V
alley
Dr
Capr
i Dr
Cara
velle
Pky
Holly
Rd
Biltmore Dr
Senators Dr
Tige
r Ln
Pana
ma
Dr
N Flynn Pky
Dunb
rook
Dr
Coo
pers
Aly
Crane St
Braw
ner P
ky
Monito
r St
Golliha
r RdLin
den
St
Jo Ann St
Dody St
Jean St
Pope
Dr
Redw
ood
St
Robi
nhoo
d DrDoddridge Cir
Marie St
Allen Pl
Cora
l Pl
Calvin Dr Mildred Dr
Brus
hwoo
d Ln
Trip
oli D
r
Embassy Dr
Baha
ma
Dr
Sch
anen
Blv
d
Bray
Dr E Shea Pky
Higgins Dr
Bonner Dr
Trieste Dr
Wei
skop
f Dr
Nie
d D
r
Con
gres
sion
al D
r
Cain
Dr
Lamon
t St
Lost Creek Dr
Mon
tecit
a DrEverhart R
d
Etheridge Dr
Aaron Dr
Sanders Dr aesvalley Dr
Edgebrook Dr
Taos Dr Vail S
t
Che
rry
Hill
Dr
Gol
dene
ye D
r
Win
gfoo
t Ln
timbers D
r
gate Dr
Blvd
Staples St
Hunt Dr
Lokey St
Cricket Hollow Dr
Bays
ide
Bayr
idge
Dr
Jack
son
Pl
Pasa
dena
Pl
Berm
uda
Pl Dolphin
Pl
Aberde
en A
ve
Carm
el P
ky
Tarpon Pl
Jans
sen
Dr
Tim
Ln
Caddo St
Robert
Dr
Gaines
St
Sharon Dr
Paloma St
Mon
ette
Dr
Chase DrMeadowbrook Dr
Belm
eade
Dr
S Shore Pl
Cape Cod Dr
Waltham Dr
Stat
e Hi
ghwa
y 358
Zarsky Dr Lesle LnW
Man
or D
r
Bradshaw Dr Lum St
Park
St
Crestview Dr
Orms D
rLu
cille
Dr
Crescent Dr
Spicewood Dr
Hidden Cv
Clare Dr
Burr
Dr Daly DrMon
Mea
dowh
eigh
ts Dr
Mea
dowv
ista
DrThed
a D
r
Fulton Dr
Rh
Savo
y St
nt Dr
Squire Dr
Wal
es D
r
vyridge St
Green Branch Dr
Calle Cuernavaca
olonias
Beve
cres
t St
Tripl
e Cro
wn Dr
Eldora
Dr
Mercer Cir
Silverberry Dr
1 1 11 11 1 11
2 2 22 22 2 22
5 5 55 55 5 55
3 3 33 33 3 33
This
inse
t is
a cr
oss-
sect
ion
of a
por
tion
of a
ll th
e D
el M
ar C
olle
ge S
ingl
e M
embe
r D
istr
icts
4 4 44 44 4 44
8 Del Mar College Statistical Profile 2017/18

Del Mar College Statistical Profile
Student Profile Terms and Definitions
Contact Hours
A measure of time that a student spends in a class or in contact with a faculty member, such as in a lab. Contact hours are based primarily on an estimate of clock hours spent in instructional activities.
Enrollments
The number of students enrolled in a given course or course section (class). Since individual students may be enrolled in more than one section or course, they may be counted more than once in any summary class count. Non-duplicative counts are called Unduplicated Headcounts (see below).
First-Time-In-College (FTIC)
First-time-in-college (FTIC) students are students who enter the College having never attended college previously at this or at any other institution of higher education. Dual credit students are counted as FTICs after they graduate from high school and reenroll in college-level credit courses.
Full-Time Students who are enrolled in 12 or more credit hours of courses in a fall or spring semester are classified as full time.
Full-Time Equivalent (FTE)
Full-time student equivalent (FTE) is a measure of a student’s instructional activity (course taking, etc.) as a portion of a full-time load. FTE is calculated as the number of total semester credit hours attempted (in a fall or spring semester) divided by 12.
Part-Time
Students enrolled in fewer than 12 semester credit hours in courses in a fall or spring semester are classified as part time.
Unduplicated Headcount
Unduplicated headcount enrollment is a count of the number of students enrolled according to specified criteria, with each individual student counted only once.
Highlights • Fall 2017 credit headcount enrollment was 11,476, down
2 percent from fall 2016.
• About three-fifths (56.8%) of the fall 2017 credit students are female, and 76 percent of all students are classified as part-time.
• The number of students enrolled in developmental courses decreased by about five percent from last fall.
• The proportion of students receiving financial assistance in 2016-2017 who are members of racial or ethnic minorities was 69 percent. The percentage of all students receiving financial aid in 2016-2017 was at 62 percent, two percentage point increase from the previous year.
• About 77 percent of entering first-time-in-college students were evaluated as requiring developmental work in mathematics, writing, and/or reading.
• Seventy-six percent of Del Mar College students are from Nueces County, and twelve percent come from San Patricio County.
Del Mar College Statistical Profile 2017/18 9

Chapter Summary Student Profile
Student headcount enrollment in credit courses for the fall of 2017 was 11,476. A decrease of 213 students—down 2 percent from fall 2016.
Female students continue to outnumber male students by about four to three. More than 90 percent of students who indicated their reason for attending Del Mar College responded that their primary reason is to earn either an associate's degree (57%) or a certificate of achievement (7.9%), or to earn credits toward a four-year degree (29.1%).
Freshman students comprise the majority of the student body (70%). Since 1992, at least two-thirds of students have enrolled part-time, compared to less than one-half of students in 1970s. In the fall of 2017, only 23 percent of students were enrolled full-time.
Between 1978 and 1998, the average age of credit students held constant at around 26.5. As Dual Credit enrollments have become a more significant segment of the College population during the most recent decade, the average age of students has steadily decreased—from 26.4 in fall 1998 to 23 in fall 2017—despite the accelerating aging of the general population. One-third of students (36.6%) are under age 20. Students over age 40 account for eight percent of the student body.
The proportion of in-district high school graduates who attended Del Mar College at least one semester within fifteen months after their high school graduation for the class of 2016 was 50 percent.
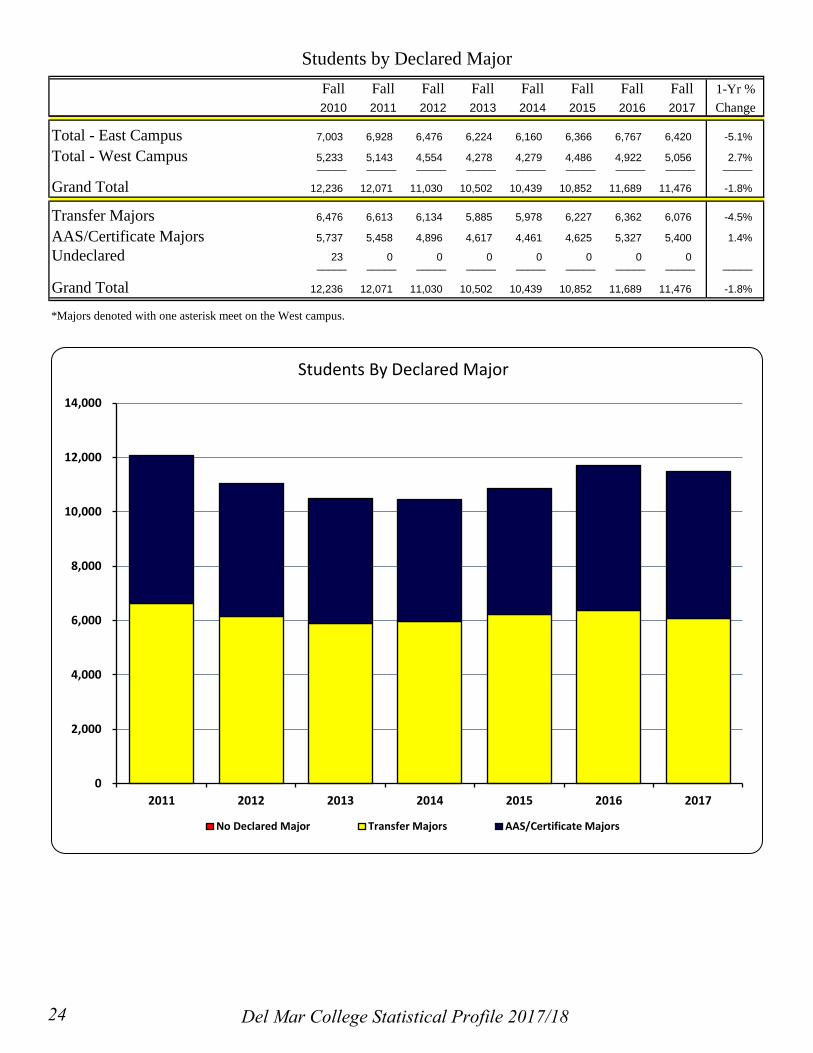
Declared Majors
While the number of students declaring a transfer (academic) major (6076) was lower than last year, the percentage of total remained the same, at about 54 percent. The percent of students declaring a career or technical major leading towards an associate in applied science degree or a certificate has remained stable for the last seven years, at about 47 percent. The number of undeclared majors dropped significantly from 2,886 in fall 2006 to 645 students in fall 2007 to zero in fall 2011. This resulted from a change in matriculation procedures of assigning undeclared students a default major of liberal arts.
Financial Aid
Over two decades, the proportion of the student body receiving financial aid steadily increased from 27 percent in 1990‑1991 to a high of 62 percent of the annual unduplicated headcount of students during 2016-2017.
For decades, the percentage of students receiving financial aid who are members of racial or ethnic minorities hovered in the low 60s. In 2007‑2008, that proportion rose to 70 percent. That proportion remained at 69 percent for academic year 2016-2017.
Developmental Placement
Seventy seven percent of entering first-time-in-college students were evaluated as requiring developmental work in mathematics, writing, and/or reading. Twenty-eight percent of all students were enrolled in at least one English course during the fall 2017 semester, and 32 percent were enrolled in mathematics. About 45 percent of students taking math were enrolled in a developmental-level course, and 16 percent of students studying English were enrolled in a developmental-level English course. In the fall of 2017, almost one-sixth (17%) of the student body was enrolled in one or more developmental courses.
A table is included in this chapter that illustrates three year grade distribution by discipline in developmental courses for first time in college students. The accompanying graphs illustrate success and withdrawal rates in developmental reading, writing and mathematics for first time in college students.
10 Del Mar College Statistical Profile 2017/18

Fall 2017
Classification of Students
Freshman70.0%
Sophomore20.8%
Other 9.5%
Tuition Status
Out-of-District21.7% Out-of-State/
International2.1%
In-District76.1%
Del Mar College Statistical Profile 2017/18 11

Fall 2017
Gender
Male43.2%
Female56.8%
Enrollment Status
Full-time24.5%
Part-time75.5%
12 Del Mar College Statistical Profile 2017/18
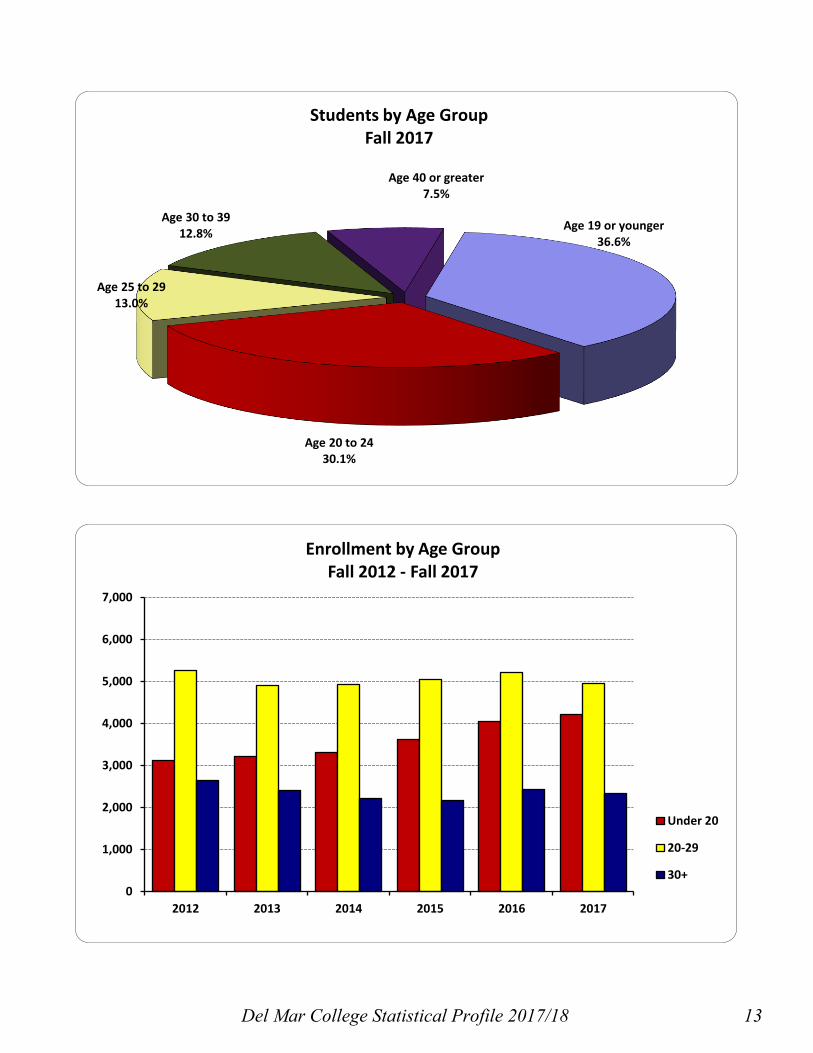
Students by Age GroupFall 2017
Age 19 or younger36.6%
Age 20 to 2430.1%
Age 25 to 2913.0%
Age 30 to 3912.8%
Age 40 or greater7.5%
Enrollment by Age GroupFall 2012 - Fall 2017
0
1,000
2,000
3,000
4,000
5,000
6,000
7,000
2012 2013 2014 2015 2016 2017
Under 20
20-29
30+
Del Mar College Statistical Profile 2017/18 13

Hispanic67.0%
White, non-Hispanic24.8%
Black, non-Hispanic2.8% Other
5.5%
Students by Race/EthnicityFall 2017
Enrollment by Race/Ethnic GroupsFall 2012 - Fall 2017
0
1,000
2,000
3,000
4,000
5,000
6,000
7,000
8,000
9,000
2012 2013 2014 2015 2016 2017
Hispanic
White,non-HispanicOther
14 Del Mar College Statistical Profile 2017/18

Number Percent Number Percent Number Percent Number PercentTotal Headcount 10,439 10,852 11,689 11,476
Full-time Equivalent 7,096 7,325 7,816 7,224
Full-time/Part-time Status
Full-time 2,831 27.1% 2,806 25.9% 2,983 25.5% 2,671 23.3%
Part-time 7,608 72.9% 8,046 74.1% 8,706 74.5% 8,805 76.7%Gender
Female 5,854 56.1% 6,107 56.3% 6,636 56.8% 6,515 56.8%
Male 4,585 43.9% 4,745 43.7% 5,053 43.2% 4,961 43.2%
Classification
Freshman 7,010 67.2% 7,448 68.6% 8,106 69.3% 8,036 70.0%
Sophomore 2,442 23.4% 2,372 21.9% 2,474 21.2% 2,384 20.8%
Other 987 9.5% 1,032 9.5% 1,109 9.5% 1,056 9.2%
Ethnic/Race Group
Hispanic 6,620 63.4% 7,088 65.3% 7,676 65.7% 7,684 67.0%
White, non-Hispanic 2,850 27.3% 2,769 25.5% 2,960 25.3% 2,841 24.8%
Black, non-Hispanic 299 2.9% 311 2.9% 342 2.9% 318 2.8%
Asian/Pacific Islander 190 1.8% 216 2.0% 205 1.8% 200 1.7%
Indian/Alaskan Native 29 0.3% 20 0.2% 28 0.2% 22 0.2%
Other 451 4.3% 448 4.1% 478 4.1% 411 3.6%
Age Group
Under 20 3,296 31.6% 3,626 33.4% 4,054 34.7% 4,203 36.6%
20-24 3,412 32.7% 3,528 32.5% 3,628 31.0% 3,449 30.1%
25-29 1,522 14.6% 1,527 14.1% 1,589 13.6% 1,491 13.0%
30-34 844 8.1% 835 7.7% 955 8.2% 875 7.6%
35-39 509 4.9% 542 5.0% 554 4.7% 594 5.2%
40-44 334 3.2% 313 2.9% 387 3.3% 350 3.0%
45-49 235 2.3% 225 2.1% 223 1.9% 240 2.1%
50+ 287 2.7% 256 2.4% 299 2.6% 274 2.4%
Average Age 25.3 0.2% 24.5 0.2% 24.5 0.2% 23.0 0.2%
Residence
Nueces County 8,207 78.6% 8,275 76.3% 8,902 76.2% 8,711 75.9%
San Patricio County 1,132 10.8% 1,271 11.7% 1,433 12.3% 1,344 11.7%
Aransas County 207 2.0% 243 2.2% 270 2.3% 211 1.8%
Jim Wells County 100 1.0% 110 1.0% 121 1.0% 123 1.1%
Other Texas Counties 456 4.4% 530 4.9% 562 4.8% 723 6.3%
Other States 227 2.2% 288 2.7% 284 2.4% 231 2.0%
Other Countries 110 1.1% 135 1.2% 117 1.0% 133 1.2%
Tuition Status
In-District 8,278 79.3% 8,079 74.4% 8,630 73.8% 8,449 73.6%
Out-of-District 1,890 18.1% 2,117 19.5% 2,383 20.4% 2,411 21.0%
Out-of-State/International 271 2.6% 334 3.1% 313 2.7% 237 2.1%
Total Semester Hours 85,155 87,904 93,719 86,686Average Semester Hours
per Student 8.2 8.1 8.0 7.6
Total Contact Hours 1,834,584 1,880,216 2,013,636 1,924,028
Student ProfileFall 2017Fall 2014 Fall 2015 Fall 2016
Del Mar College Statistical Profile 2017/18 15

Student Residency in South Texas and Mexico - Fall 2017
Mexico 53
4
8 1
10
3 19
2
5
7
35
12
123
36
34
64
95
8
23
18 23
211 1344
8,711
Webb Duval
Kenedy
Starr
Bee
Hidalgo
La Salle
Nueces
Zapata
Kleberg
Brooks
Calhoun
Goliad
Cameron
Live Oak McMullen
Victoria
Jim Hogg
Willacy
Refugio
Jim Wells
Aransas San Patricio
16 Del Mar College Statistical Profile 2017/18

Fall 2014 Fall 2015 Fall 2016 Fall 2017Art and Drama 146 1.4% 134 1.2% 142 1.2% 154 1.3%Communications, Languages and Reading 373 3.6% 407 3.8% 418 3.6% 421 3.6%English and Philosophy 86 0.8% 78 0.7% 83 0.7% 74 0.6%Kinesiology 206 2.0% 212 2.0% 230 2.0% 206 1.8%Mathematics 92 0.9% 98 0.9% 97 0.8% 75 0.6%Music 174 1.7% 190 1.8% 178 1.5% 158 1.4%Natural Sciences 638 6.1% 646 6.0% 730 6.2% 579 5.0%Social Sciences 389 3.7% 412 3.8% 421 3.6% 374 3.2%______ ______ ______ ______ ______ ______ ______ ______
Arts and Sciences 2,104 20.2% 2,177 20.1% 2,299 19.7% 2,041 17.5%
Business Administration 963 9.2% 1,031 9.5% 1,149 9.8% 1,126 9.6%Industrial Education** 364 3.5% 504 4.6% 708 6.1% 734 6.3%Public Safety Education 648 6.2% 648 6.0% 693 5.9% 595 5.1%Technology Education** 437 4.2% 408 3.8% 494 4.2% 500 4.3%______ ______ ______ ______ ______ ______ ______ ______
Business, Industrial & Public Safety* 2,412 23.1% 2,591 23.9% 3,044 26.0% 2,955 25.3%
Allied Health 612 5.9% 635 5.9% 658 5.6% 647 5.5%Computer Science, Engineering, and Advanced Technology* 698 6.7% 712 6.6% 738 6.3% 772 6.6%
Dental and Imaging Technology 552 5.3% 573 5.3% 551 4.7% 629 5.4%Human Sciences and Education 416 4.0% 427 3.9% 419 3.6% 409 3.5%Nurse Education 1,345 12.9% 1,393 12.8% 1,508 12.9% 1,637 14.0%______ ______ ______ ______ ______ ______ ______ ______
Health Sci & Professional Education* 3,623 34.7% 3,740 34.5% 3,874 33.1% 4,094 35.0%
Liberal Arts 2,300 22.0% 2,344 21.6% 2,472 21.1% 2,386 20.4%Mexican American Studies 6 0.1% 5 0.0% 11 0.1% 7 0.1%
Interdisciplinary Studies 2,306 22.1% 2,349 22.5% 2,483 23.8% 2,393 22.9%
Grand Total 10,439 10,852 11,689 11,476
* Programs and Departments in the Division of Business, Professional and Technology Education were re-aligned in Fall 2015.** The totals reflect re-alignment of programs in the Industrial Ed. and Technology Ed. Departments and will differ from prior editions.
Student Headcount by Department Based on Declared Major
0
500
1,000
1,500
2,000
2,500
3,000
3,500
4,000
Fall 2014 Fall 2015 Fall 2016 Fall 2017
Students by Declared Major
Arts and Sciences Business, Industrialand Public Safety
Health Sciences andProfessional Education
Liberal Arts
Del Mar College Statistical Profile 2017/18 17

Fall Fall Fall Fall Fall Fall Fall Fall 1-Yr %2010 2011 2012 2013 2014 2015 2016 2017 Change
Division of Arts and SciencesAAT: Art Education 19 15 7 8 12 11 17 17 0.0%Art 125 102 96 94 96 90 92 109 18.5%Drama 36 36 30 37 37 33 33 28 -15.2%IDS: Art Education 1 0 0 1 1_____ _____ _____ _____ _____ _____ _____ _____ _____
Art and Drama 181 153 133 140 146 134 142 154 8.5%
AAT: Bilingual Generalist 15 3AAT: Comm, Lang, Reading 1 1 0 1AAT: Languages 6 3AAT: Generalist 57 134 143 131 169 136 159 196 23.3%AAT: Journalism 4 2 3 1AAT: Special Education 15 28 21 15 15 24 20 28 40.0%AAT: Speech 0 1 3 2 2 7 3 0 -100.0%Advertising/Public Relations 39 18 20 19 30 43 46 32 -30.4%Digital Media 38 43 59 51 53 68 57 57 0.0%IDS: Bilingual Education 1 2IDS: Special Education 0 1Journalism 48 41 36 28 34 34 34 37 8.8%Foreign Languages 15 26 16 33 31 33 37 26 -29.7%Radio/Television 49 30 32 33 28 38 35 26 -25.7%Speech 7 8 20 18 11 24 27 18 -33.3%_____ _____ _____ _____ _____ _____ _____ _____ _____
295 341 353 331 373 407 418 421 0.7%
AAT: English, Lang Arts, Reading 29 25 23 27 24 33 33 23 -30.3%English 11 10 2 7 5 6 2 0 -100.0%English - Emphasis in Language 29 25 26 24 20 8 3 2 -33.3%English - Emphasis in Literature 57 41 36 35 32 27 41 37 -9.8%English - Emphasis in Philosophy 10 9 7 5 5 4 4 12 200.0%IDS: English 0 2 0 1_____ _____ _____ _____ _____ _____ _____ _____ _____
136 112 94 99 86 78 83 74 -10.8%
Health Studies 40 26 6 1Kinesiology 243 216 221 208 206 212 230 206 -10.4%Recreation Leadership 0 1_____ _____ _____ _____ _____ _____ _____ _____ _____
Kinesiology 283 243 227 209 206 212 230 206 -10.4%
AAT: Mathematics 16 19 15 15 11 13 14 15 7.1%IDS: Mathematics 0 0 0 2Mathematics 79 55 65 93 81 85 83 60 -27.7%_____ _____ _____ _____ _____ _____ _____ _____ _____
Mathematics 95 74 80 110 92 98 97 75 -22.7%
AAT: Music Education 41 0 4 3Music Education 4 63 57 58 66 74 70 30 -57.1%Music Performance 84 54 42 37 37 37 23 52 126.1%Music Theory and Composition 12 15 18 18 17 24 35 19 -45.7%Sound Recording Tech (AAS) 62 58 44 53 48 51 47 53 12.8% SRT: Music Business (Cert) 1 2 7 7 6 4 3 4 33.3%_____ _____ _____ _____ _____ _____ _____ _____ _____
Music 204 192 172 176 174 190 178 158 -11.2%
Students by Declared Major
Communications, Languages and Reading
English and Philosophy
Del Mar College Statistical Profile 2017/18 18

Fall Fall Fall Fall Fall Fall Fall Fall 1-Yr %2010 2011 2012 2013 2014 2015 2016 2017 Change
Students by Declared Major
AAT: Life/Earth Science 3 4 4 6 4 6 6 8 33.3%AAT: Physical Science 0 1 3 4 2 4 0 0Biology 391 391 369 397 395 382 465 352 -24.3%Biotechnology (AAS) 26 17 34 27 39 37 41 36 -12.2% Biotechnology (Cert) 5 0 8 7 11 8 10 8 -20.0%Chemistry 95 98 88 91 116 140 143 116 -18.9%Geology 29 33 37 41 51 42 36 32 -11.1%
IDS: Life/Earth SciencePhysics 71 30 31 27 20 27 29 27 -6.9%
_____ _____ _____ _____ _____ _____ _____ _____ _____
Natural Sciences 620 574 574 600 638 646 730 579 -20.7%
AAS: History 1AAT: History/Social Studies 16 21 24 14 17 24 33 20 -39.4%Geography 8 4 8 5 4 3 4 1 -75.0%History 71 66 69 50 60 53 46 52 13.0%IDS: History/Social Studies 2Political Science 29 27 36 33 37 30 32 30 -6.3%Psychology 228 221 210 208 202 220 219 189 -13.7%Social Work 51 46 37 69 52 54 63 57 -9.5%Sociology 38 25 22 24 17 28 24 25 4.2%_____ _____ _____ _____ _____ _____ _____ _____ _____
Social Sciences 441 412 406 404 389 412 421 374 -11.2%
Total Arts and Sciences 2,255 2,101 2,039 2,069 2,104 2,177 2,299 2,041 -11.2%
Division of Business, Industrial and Public Safety Education*
Administrative Assistant 20 22 27 26 24 12 3 0 -100.0% General Office Clerk Cert 6 8 9 6 1 1Banking and Finance 1 3 2 1 Banking Certificates 14 7 3 1 3 9 2 0 -100.0%Business Administration (Transfer) 565 544 548 573 603 657 758 718 -5.3% Business Administration Cert 3 1 3 1 0 -100.0%Court Reporting 57 49 42 43 47 51 48 56 16.7% Court Reporting Cert 1 2 1 1 3 9 200.0% Information Reporting Cert 1 1 1 1 2 2 2 12 500.0%Legal Prof: Legal Secretary Specialty 4 11 2 2 2 0 6 0 -100.0% Legal Prof: Admin Ass't Cert 6 5 7 13 10 5 1 2 100.0%Legal Prof: Paralegal Specialty 63 59 55 52 49 53 66 62 -6.1% Legal Prof: Legal Ass't Cert 2 7 250.0%Management Development 0 1 0 1 0 0 1 0 -100.0% Mgt Development (MSA) 2 1 0 8 5 11 6 3 -50.0%Mgt Dev: Administrative Specialization 2 11 17 14 -17.6%Mgt Dev: General Management 50 36 36 33 42 39 56 69 23.2%Human Resources Cert 2 Mgt Dev: Leadership Cert 5 6 2 1 1 4 4 5 25.0%Mgt Dev: Marketing Spec 44 35 31 44Mgt Dev: Prof Sales 1 3 4 1 0 0 4 0 -100.0%Mgt Dev: Production and Logistics 31 15 19 9 12 7 15 14 -6.7% Mgt Dev: Logistics Cert 13 9 7 9 7 8 4 6 50.0%
Del Mar College Statistical Profile 2017/18 19
Fall Fall Fall Fall Fall Fall Fall Fall 1-Yr %2010 2011 2012 2013 2014 2015 2016 2017 Change
Students by Declared Major
Mgt Dev: Supply Chain Mgt (MSA) 1 0 0 1Mgt Dev: Quality Control Mgt 7 5 2 1 Mgt Dev: Quality Control Mgt Cert 2 1 0 1Mgt Dev: Real Estate Cert 9 8 2Mgt Dev: Small Bus Mgt Cert 28 18 16 14 16 22 35 23 -34.3%Management Info Systems (Transfer) 10 0 1 Medical Secretary 20 20 19 19 17 5 Medical Insurance Billing Cert 8 0 2 2 1 0 Para-Professional Acct 82 80 92 74 75 60 63 99 57.1% Accounting TechCert 42 51 39 47 42 70 52 25 -51.9%_____ _____ _____ _____ _____ _____ _____ _____ _____
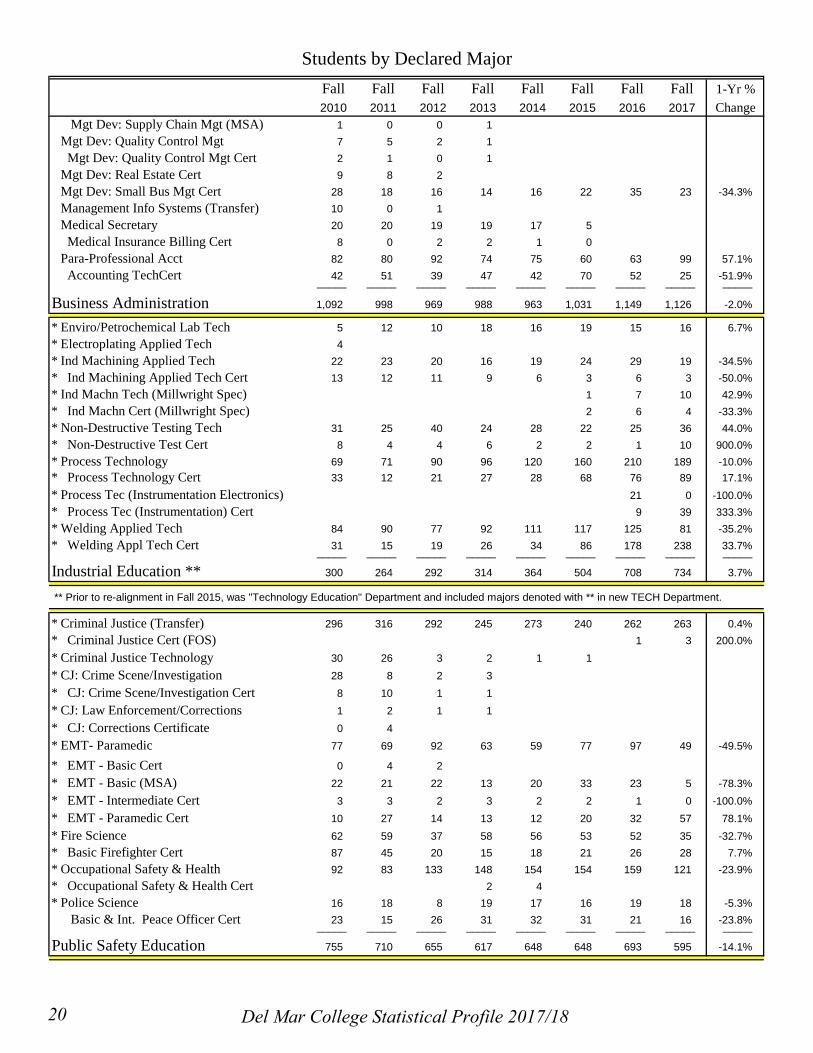
Business Administration 1,092 998 969 988 963 1,031 1,149 1,126 -2.0%
* Enviro/Petrochemical Lab Tech 5 12 10 18 16 19 15 16 6.7%* Electroplating Applied Tech 4* Ind Machining Applied Tech 22 23 20 16 19 24 29 19 -34.5%* Ind Machining Applied Tech Cert 13 12 11 9 6 3 6 3 -50.0%* Ind Machn Tech (Millwright Spec) 1 7 10 42.9%* Ind Machn Cert (Millwright Spec) 2 6 4 -33.3%* Non-Destructive Testing Tech 31 25 40 24 28 22 25 36 44.0%* Non-Destructive Test Cert 8 4 4 6 2 2 1 10 900.0%* Process Technology 69 71 90 96 120 160 210 189 -10.0%* Process Technology Cert 33 12 21 27 28 68 76 89 17.1%* Process Tec (Instrumentation Electronics) 21 0 -100.0%* Process Tec (Instrumentation) Cert 9 39 333.3%* Welding Applied Tech 84 90 77 92 111 117 125 81 -35.2%* Welding Appl Tech Cert 31 15 19 26 34 86 178 238 33.7%_____ _____ _____ _____ _____ _____ _____ _____ _____
Industrial Education ** 300 264 292 314 364 504 708 734 3.7%
** Prior to re-alignment in Fall 2015, was "Technology Education" Department and included majors denoted with ** in new TECH Department.
* Criminal Justice (Transfer) 296 316 292 245 273 240 262 263 0.4%* Criminal Justice Cert (FOS) 1 3 200.0%* Criminal Justice Technology 30 26 3 2 1 1* CJ: Crime Scene/Investigation 28 8 2 3* CJ: Crime Scene/Investigation Cert 8 10 1 1* CJ: Law Enforcement/Corrections 1 2 1 1* CJ: Corrections Certificate 0 4* EMT- Paramedic 77 69 92 63 59 77 97 49 -49.5%
* EMT - Basic Cert 0 4 2 * EMT - Basic (MSA) 22 21 22 13 20 33 23 5 -78.3%* EMT - Intermediate Cert 3 3 2 3 2 2 1 0 -100.0%* EMT - Paramedic Cert 10 27 14 13 12 20 32 57 78.1%* Fire Science 62 59 37 58 56 53 52 35 -32.7%* Basic Firefighter Cert 87 45 20 15 18 21 26 28 7.7%* Occupational Safety & Health 92 83 133 148 154 154 159 121 -23.9%* Occupational Safety & Health Cert 2 4 * Police Science 16 18 8 19 17 16 19 18 -5.3%
Basic & Int. Peace Officer Cert 23 15 26 31 32 31 21 16 -23.8%_____ _____ _____ _____ _____ _____ _____ _____ _____
Public Safety Education 755 710 655 617 648 648 693 595 -14.1%
Del Mar College Statistical Profile 2017/18 20

Fall Fall Fall Fall Fall Fall Fall Fall 1-Yr %2010 2011 2012 2013 2014 2015 2016 2017 Change
Students by Declared Major
* A/C Applied Technology 80 65 67 40 27 40 54 49 -9.3%* Air Conditioning Cert 34 30 16 12 9 10 28 35 25.0%* Architecture/Drafting (Transfer)** 21 12 6 4 3 20 24 69 187.5%* Architectural/Drafting/Construction** 78 66 72 79 85 75 69 50 -27.5%* Architecture/Drafting Cert** 18 12 22 17 31 29 20 26 30.0%* Construction Tech Spec Cert** 5 16 4 -75.0%
* Airframe Appl Tech (Transfer)** 1 * Aviation: Airframe Applied Tech** 77 77 60 48 39 22 23 18 -21.7%* Aviation: Airframe Appl Tech Cert** 32 32 20 30 26 14 14 9 -35.7%* Aviation: Airframe Appl Tech (MSA)** 1 3 2 1 1
* Aviation: Power Plant Technology** 35 22 21 27 25 22 22 17 -22.7%* Aviation: Power Plant Tech Cert** 8 7 9 5 5 6 9 4 -55.6%* Avionics Electrical Tech Spec** 42 26 20 11 14 9 4 5 25.0%* Avionics Electrical Tech Spec Cert** 0 1 1 0 0 0 2 1 -50.0%* Auto Body Applied Tech 0 6 6 1 9 5 6 11 83.3%* Auto Body Applied Tech Cert 0 0 0 0 5 0 1 14 1300.0%* Auto Body Refinishing Cert 13 16 8 14 8 5 7 2 -71.4%* Auto Body Collision Cert 6 2 2 3 1 3 4 6 50.0%* Automotive Applied Tech 65 62 43 28 40 47 55 44 -20.0%* Automotive Certificates 37 33 26 38 36 30 46 24 -47.8%* Building Maint Applied Tech 12 13 12 8 10 5 8 15 87.5%* Building Maint Appl Tech Cert 5 8 5 4 2 3 11 19 72.7%* Diesel Applied Technology 12 27 16 23 26 30 39 34 -12.8%* Diesel Engine Specialist Cert 13 15 19 28 35 26 32 34 6.3%* Diesel Systems Specialist Cert 0 2 1 0 0 2 0 10_____ _____ _____ _____ _____ _____ _____ _____ _____
Technology Education** 590 537 454 421 437 408 494 500 1.2%
2,737 2,509 2,370 2,340 2,412 2,591 3,044 2,955 -2.9%
* Former "Business & Technology Programs" under the Division of Business, Professional & Technology Education also included CSEAT Dept.
** Prior to re-alignment in Fall 2015, was "Industrial Education" Department. Majors denoted with ** were moved from old TECH Department.
Division of Health Sciences and Professional Education** Health Information Tech 47 45 58 52 44 34 57 44 -22.8%* Health Info Tech Cert 12 8 4 7 2 5 11 16 45.5%* Medical Laboratory Tech 33 54 49 40 39 33 37 41 10.8%* Occupational Therapy Asst 127 121 122 110 111 135 133 136 2.3%* Pharmacy Technician 58 60 57 38 47 37 37 32 -13.5%* Pharmacy Technician Cert 9 3 5 2 0 2 1 3 200.0%* Physical Therapist Asst 215 247 241 226 214 216 207 199 -3.9%* Physical Therapist Asst Cert 1 1 1 0 -100.0%
* Pre-Medical Technology (Transfer) 38 32 29 18 24 22 8 16 100.0%
* Respiratory Therapy 66 76 79 70 58 71 95 72 -24.2%
* Surgical Technology 51 60 56 61 53 71 67 85 26.9%* Surgical Technology Cert 11 14 8 19 19 8 4 3 -25.0%_____ _____ _____ _____ _____ _____ _____ _____ _____
Allied Health 667 720 708 643 612 635 658 647 -1.7%
Total Business, Industrial and Public Safety Education*
Del Mar College Statistical Profile 2017/18 21
Fall Fall Fall Fall Fall Fall Fall Fall 1-Yr %2010 2011 2012 2013 2014 2015 2016 2017 Change
Students by Declared Major
Computer Information Technology Systems Computer Info Systems (Transfer) 58 52 54 53 38 24 27 36 33.3%Computer Info Systems 1 1 1 3 1 0 1 2 100.0% Information Tech Career Core Cert 4 5 5 7 7 8 11 10 -9.1%Computer Programming (Transfer) 42 58 53 84 124 133 135 119 -11.9%Computer Programming 23 27 32 24 31 31 41 36 -12.2% Computer Programming Cert 20 16 14 14 17 12 18 24 33.3% Interactive Game Cert 7 6 11 9 8 13 16 11 -31.3%Computer Science (Transfer) 0 5 0 6 1 2 5 0 -100.0%Digital Media Forensics 12 9 5 Digital Media & Web Design 10 11 15 15 30 20 23 15 -34.8% Info Tech - Digital Med/Web Dev't Cert 7Information Systems Security 11 5 10 10 5 11 7 4 -42.9% Info Systems Security (MSA) 2 2 0.0%Geographic Info System (Transfer) 11 6 11 11 11 10 15 14 -6.7%Geographic Info System 2 11 10 7 10 7 0 -100.0% Geographic Info System Cert 3 0 3 8 2 2 1 9 800.0% Geographic Info System (MSA) 1 1 0 3 2 5 2 0 -100.0% Multimedia Internet Cert 3 5 3 4 5 3 3 2 -33.3%Microcomputers for Business 19 6 3 1 2 0 0 4Network Technology 67 59 76 54 61 60 84 88 4.8% Network Technology Cert 19 11 12 9 12 13 24 11 -54.2%
Engineering Electrical Engineering (AA) 51 22 23 15 11 4 1 0 -100.0%Electrical Engineering (AS) 11 52 75 88 80 78 141 99 -29.8% Electrical Engineering (AAS) 1 8 4 10 17 0 0 Industrial Engineering (AS) 14Mechanical Engineering (AS) 51 98 122 170 189 135 171 26.7%
Engineering Technology/Computer-Network Electronics Technology Comp Network Electr/Comm 39 40 38 41 25 10 3 0 -100.0% C-Network Elect/Comm Cert 20 20 11 19 7 15 8 2 -75.0%Electronics/Elect Engr Tech 0 6 Engineering Technology (AAS) 23 19 29 30 36 24 45 87.5% Engineering Technology Cert 1 1 6 2 12 500.0%Instrumentation (AAS) 29Instrumentation Electronics Cert 2 6 200.0%_____ _____ _____ _____ _____ _____ _____ _____ _____
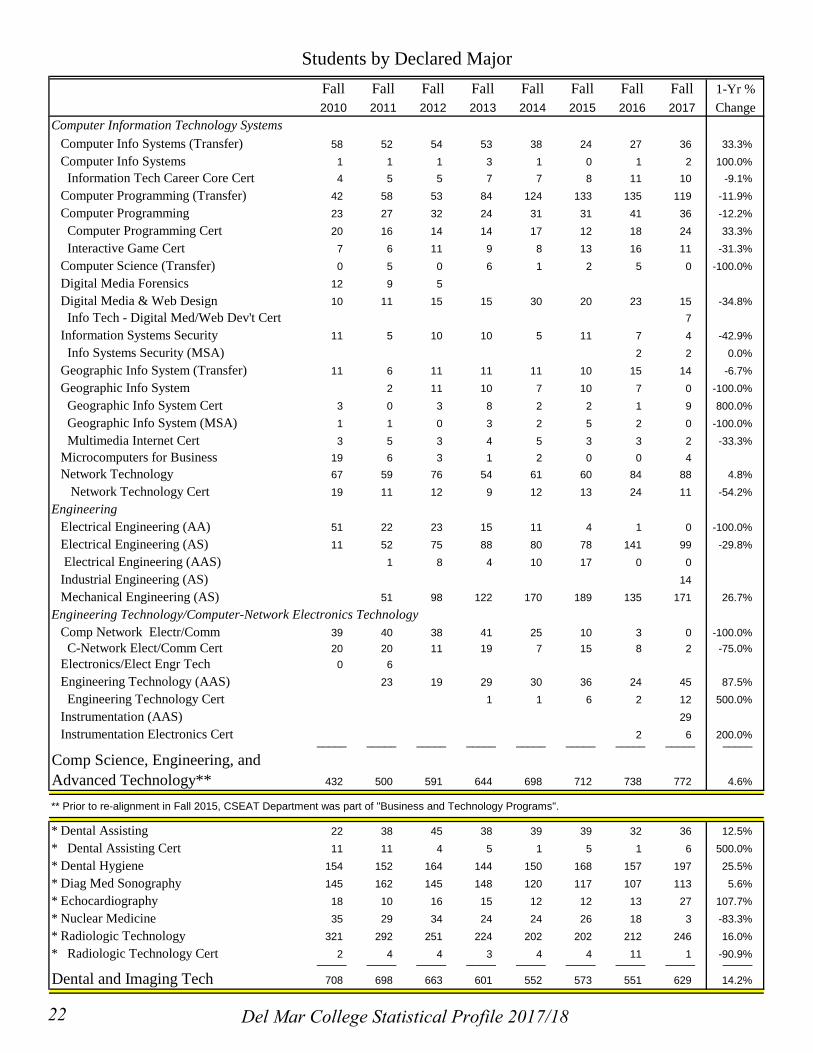
432 500 591 644 698 712 738 772 4.6%
** Prior to re-alignment in Fall 2015, CSEAT Department was part of "Business and Technology Programs".
* Dental Assisting 22 38 45 38 39 39 32 36 12.5%* Dental Assisting Cert 11 11 4 5 1 5 1 6 500.0%* Dental Hygiene 154 152 164 144 150 168 157 197 25.5%* Diag Med Sonography 145 162 145 148 120 117 107 113 5.6%* Echocardiography 18 10 16 15 12 12 13 27 107.7%* Nuclear Medicine 35 29 34 24 24 26 18 3 -83.3%* Radiologic Technology 321 292 251 224 202 202 212 246 16.0%* Radiologic Technology Cert 2 4 4 3 4 4 11 1 -90.9%_____ _____ _____ _____ _____ _____ _____ _____ _____
Dental and Imaging Tech 708 698 663 601 552 573 551 629 14.2%
Comp Science, Engineering, and Advanced Technology**
Del Mar College Statistical Profile 2017/18 22
Fall Fall Fall Fall Fall Fall Fall Fall 1-Yr %2010 2011 2012 2013 2014 2015 2016 2017 Change
Students by Declared Major
* ASL/Deaf Education (Transfer) 5 17 13 16 10 13 9 8 -11.1%* ASL and Interpreter Preparation 32 43 40 38 31 33 26 41 57.7%* ASL and Interpreter Preparation Cert 10 8 10 4 5 9 6 6 0.0%
AAT: Early Childhood (Transfer) 111 21 12 11 0 0 5 2 -60.0%CD/Early Childhood Admin 3 5 20 22 13 8 1 0 -100.0% CD/Early Child Admin Cert 26 10 3 2 2 5 5 11 120.0%CD/Early Childhood 135 96 88 73 63 64 81 70 -13.6% CD/Early Childhood Cert 31 22 18 13 11 16 9 6 -33.3% Child Care Pract Cert 0 3 1CD/Educational Assistant 18 5 8 11 6 9 8 6 -25.0%IDS: CD/ Early Child (Transfer) 2 3
* Cosmetology Certificate 94 89 74 83 82 91 95 111 16.8%* Culinary Arts 130 118 104 103 78 70 70 49 -30.0%* Baking/Pastry 32 33 31 32 39 28 22 18 -18.2%* Cook/Baker Certificate 9 14 7 9 9 13 11 12 9.1%* Kitchen Supervisor Cert 3 2 2 2 0 -100.0%* Dietary Manager 1 1* Hospitality/Restaurant Mgt 18 16 21 10* Hospitality/Restaurant Mgt Cert 0 1 1* Hotel/Motel Management 13 5 5 7 10 12 16 12 -25.0%* Hotel/Motel Mgt Cert 1 1 7 7 7 3 1 1 0.0%* Human Services 1 0 1 3 1 2 0 0* Human Services/Generalist 4 9 10 10 6 6 6 7 16.7%* Human Services/Addiction 40 44 29 23 25 26 28 40 42.9%* Human Services Cert 21 10 16 17 16 13 12 6 -50.0%* Long Term Care Adm Cert 7 0 0 1 0 4 6 2 -66.7%* Travel and Tourism Cert 2_____ _____ _____ _____ _____ _____ _____ _____ _____
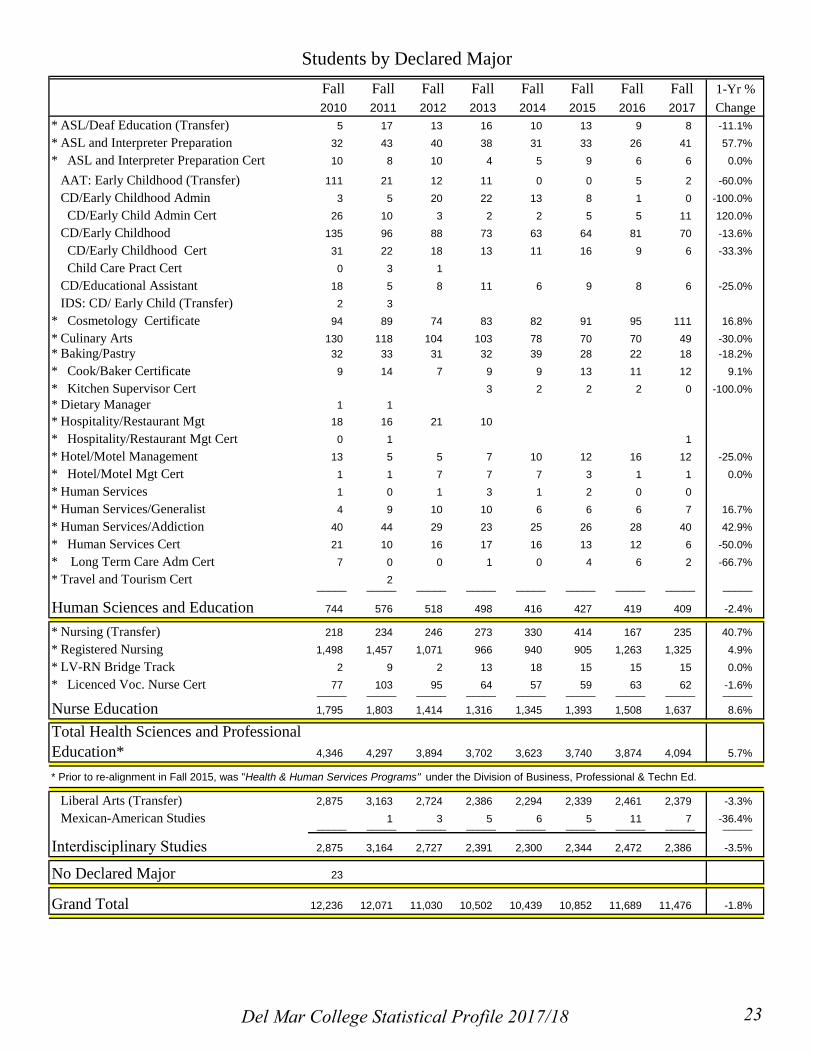
744 576 518 498 416 427 419 409 -2.4%
* Nursing (Transfer) 218 234 246 273 330 414 167 235 40.7%* Registered Nursing 1,498 1,457 1,071 966 940 905 1,263 1,325 4.9%* LV-RN Bridge Track 2 9 2 13 18 15 15 15 0.0%* Licenced Voc. Nurse Cert 77 103 95 64 57 59 63 62 -1.6%_____ _____ _____ _____ _____ _____ _____ _____ _____
Nurse Education 1,795 1,803 1,414 1,316 1,345 1,393 1,508 1,637 8.6%
4,346 4,297 3,894 3,702 3,623 3,740 3,874 4,094 5.7%
* Prior to re-alignment in Fall 2015, was "Health & Human Services Programs" under the Division of Business, Professional & Techn Ed.
Liberal Arts (Transfer) 2,875 3,163 2,724 2,386 2,294 2,339 2,461 2,379 -3.3%Mexican-American Studies 1 3 5 6 5 11 7 -36.4%_____ _____ _____ _____ _____ _____ _____ _____ _____
Interdisciplinary Studies 2,875 3,164 2,727 2,391 2,300 2,344 2,472 2,386 -3.5%
No Declared Major 23
Grand Total 12,236 12,071 11,030 10,502 10,439 10,852 11,689 11,476 -1.8%
Total Health Sciences and Professional Education*
Human Sciences and Education
Del Mar College Statistical Profile 2017/18 23
Fall Fall Fall Fall Fall Fall Fall Fall 1-Yr %2010 2011 2012 2013 2014 2015 2016 2017 Change
Students by Declared Major
Total - East Campus 7,003 6,928 6,476 6,224 6,160 6,366 6,767 6,420 -5.1%
Total - West Campus 5,233 5,143 4,554 4,278 4,279 4,486 4,922 5,056 2.7%_____ _____ _____ _____ _____ _____ _____ _____ _____
Grand Total 12,236 12,071 11,030 10,502 10,439 10,852 11,689 11,476 -1.8%
Transfer Majors 6,476 6,613 6,134 5,885 5,978 6,227 6,362 6,076 -4.5%
AAS/Certificate Majors 5,737 5,458 4,896 4,617 4,461 4,625 5,327 5,400 1.4%
Undeclared 23 0 0 0 0 0 0 0_____ _____ _____ _____ _____ _____ _____ _____ _____
Grand Total 12,236 12,071 11,030 10,502 10,439 10,852 11,689 11,476 -1.8%
*Majors denoted with one asterisk meet on the West campus.
0
2,000
4,000
6,000
8,000
10,000
12,000
14,000
2011 2012 2013 2014 2015 2016 2017
Students By Declared Major
No Declared Major Transfer Majors AAS/Certificate Majors
Del Mar College Statistical Profile 2017/18 24

Fall Fall Fall Fall Fall Fall Fall Fall 1-Yr %2010 2011 2012 2013 2014 2015 2016 2017 Change
Arts and Sciences 2,255 2,101 2,039 2,069 2,104 2,177 2,299 2,041 -11.2%
Business, Industrial and Public Safety Education 1,092 998 969 988 963 1,031 1,149 1,126 -2.0%
Health Sciences and Professional Education 758 665 741 776 793 814 847 867 2.4%
Liberal Arts 2,875 3,164 2,727 2,391 2,300 2,344 2,472 2,386 -3.5%
Undeclared 23 0 0 0 0 0 0 0 0.0%_____ _____ _____ _____ _____ _____ _____ _____ _____
Total - East Campus 7,003 6,928 6,476 6,224 6,160 6,366 6,767 6,420 -5.1%
Business, Industrial and Public Safety Education 1,645 1,511 1,401 1,352 1,449 1,560 1,895 1,829 -3.5%
Health Sciences and Professional Education 3,588 3,632 3,153 2,926 2,830 2,926 3,027 3,227 6.6%_____ _____ _____ _____ _____ _____ _____ _____ _____
Total West Campus 5,233 5,143 4,554 4,278 4,279 4,486 4,922 5,056 2.7%
Grand Total 12,236 12,071 11,030 10,502 10,439 10,852 11,689 11,476 -1.8%
East and West Campus Headcount by Declared Major
0
1,000
2,000
3,000
4,000
5,000
6,000
7,000
8,000
2010 2011 2012 2013 2014 2015 2016 2017
Fall Semester
Student Headcount by Campus
East Campus West Campus
Del Mar College Statistical Profile 2017/18 25
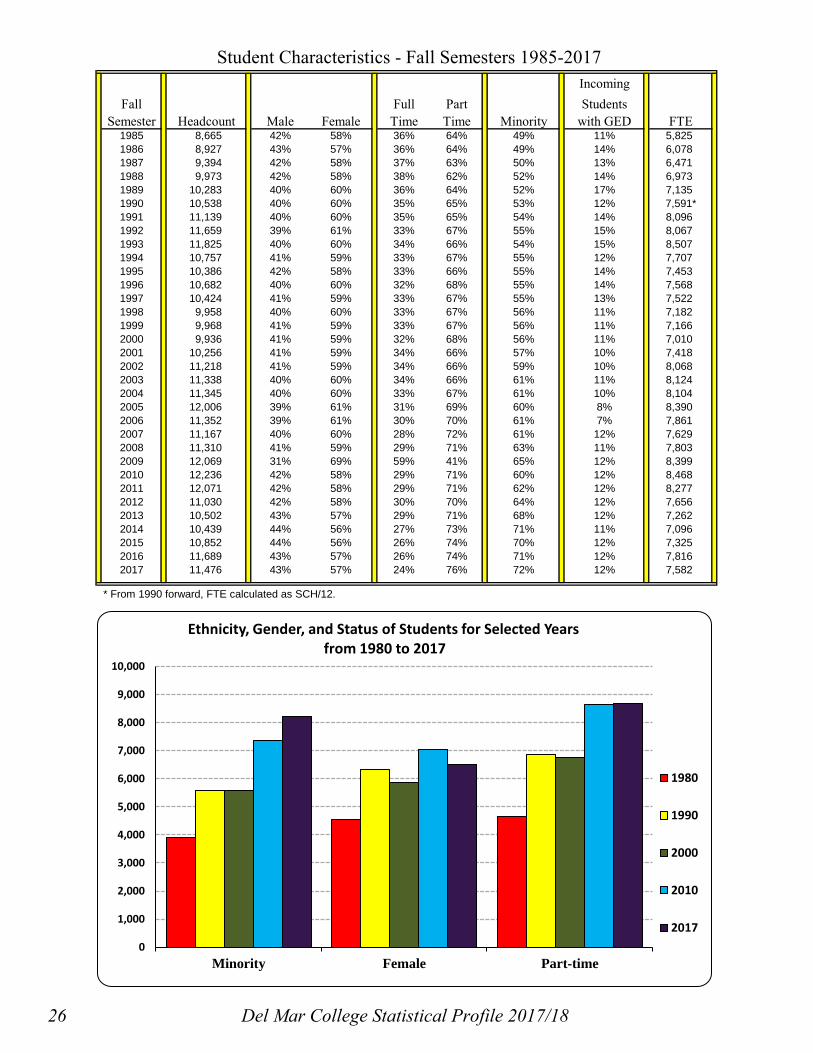
IncomingFall Full Part Students
Semester Headcount Male Female Time Time Minority with GED FTE1985 8,665 42% 58% 36% 64% 49% 11% 5,8251986 8,927 43% 57% 36% 64% 49% 14% 6,0781987 9,394 42% 58% 37% 63% 50% 13% 6,4711988 9,973 42% 58% 38% 62% 52% 14% 6,9731989 10,283 40% 60% 36% 64% 52% 17% 7,1351990 10,538 40% 60% 35% 65% 53% 12% 7,591*1991 11,139 40% 60% 35% 65% 54% 14% 8,0961992 11,659 39% 61% 33% 67% 55% 15% 8,0671993 11,825 40% 60% 34% 66% 54% 15% 8,5071994 10,757 41% 59% 33% 67% 55% 12% 7,7071995 10,386 42% 58% 33% 66% 55% 14% 7,4531996 10,682 40% 60% 32% 68% 55% 14% 7,5681997 10,424 41% 59% 33% 67% 55% 13% 7,5221998 9,958 40% 60% 33% 67% 56% 11% 7,1821999 9,968 41% 59% 33% 67% 56% 11% 7,1662000 9,936 41% 59% 32% 68% 56% 11% 7,0102001 10,256 41% 59% 34% 66% 57% 10% 7,4182002 11,218 41% 59% 34% 66% 59% 10% 8,0682003 11,338 40% 60% 34% 66% 61% 11% 8,1242004 11,345 40% 60% 33% 67% 61% 10% 8,1042005 12,006 39% 61% 31% 69% 60% 8% 8,3902006 11,352 39% 61% 30% 70% 61% 7% 7,8612007 11,167 40% 60% 28% 72% 61% 12% 7,6292008 11,310 41% 59% 29% 71% 63% 11% 7,8032009 12,069 31% 69% 59% 41% 65% 12% 8,3992010 12,236 42% 58% 29% 71% 60% 12% 8,4682011 12,071 42% 58% 29% 71% 62% 12% 8,2772012 11,030 42% 58% 30% 70% 64% 12% 7,6562013 10,502 43% 57% 29% 71% 68% 12% 7,2622014 10,439 44% 56% 27% 73% 71% 11% 7,0962015 10,852 44% 56% 26% 74% 70% 12% 7,3252016 11,689 43% 57% 26% 74% 71% 12% 7,8162017 11,476 43% 57% 24% 76% 72% 12% 7,582
* From 1990 forward, FTE calculated as SCH/12.
Student Characteristics - Fall Semesters 1985-2017
0
1,000
2,000
3,000
4,000
5,000
6,000
7,000
8,000
9,000
10,000
Minority Female Part-time
Ethnicity, Gender, and Status of Students for Selected Yearsfrom 1980 to 2017
1980
1990
2000
2010
2017
26 Del Mar College Statistical Profile 2017/18
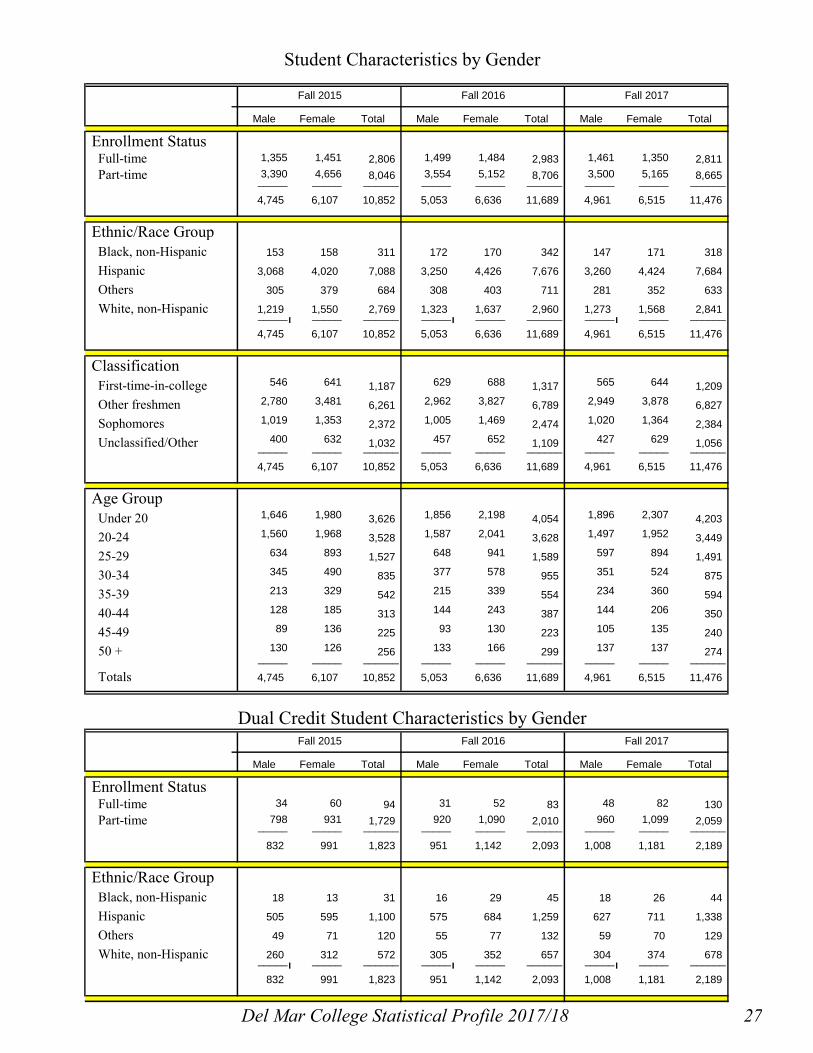
Male Female Total Male Female Total Male Female Total
Enrollment StatusFull-time 1,355 1,451 2,806 1,499 1,484 2,983 1,461 1,350 2,811Part-time 3,390 4,656 8,046 3,554 5,152 8,706 3,500 5,165 8,665 _____ _____ ______ _____ _____ ______ _____ _____ ______
4,745 6,107 10,852 5,053 6,636 11,689 4,961 6,515 11,476
Ethnic/Race GroupBlack, non-Hispanic 153 158 311 172 170 342 147 171 318
Hispanic 3,068 4,020 7,088 3,250 4,426 7,676 3,260 4,424 7,684
Others 305 379 684 308 403 711 281 352 633
White, non-Hispanic 1,219 1,550 2,769 1,323 1,637 2,960 1,273 1,568 2,841 _____ _____ ______ _____ _____ ______ _____ _____ ______
4,745 6,107 10,852 5,053 6,636 11,689 4,961 6,515 11,476
ClassificationFirst-time-in-college 546 641 1,187 629 688 1,317 565 644 1,209
Other freshmen 2,780 3,481 6,261 2,962 3,827 6,789 2,949 3,878 6,827
Sophomores 1,019 1,353 2,372 1,005 1,469 2,474 1,020 1,364 2,384
Unclassified/Other 400 632 1,032 457 652 1,109 427 629 1,056 _____ _____ ______ _____ _____ ______ _____ _____ ______
4,745 6,107 10,852 5,053 6,636 11,689 4,961 6,515 11,476
Age GroupUnder 20 1,646 1,980 3,626 1,856 2,198 4,054 1,896 2,307 4,203
20-24 1,560 1,968 3,528 1,587 2,041 3,628 1,497 1,952 3,449
25-29 634 893 1,527 648 941 1,589 597 894 1,491
30-34 345 490 835 377 578 955 351 524 875
35-39 213 329 542 215 339 554 234 360 594
40-44 128 185 313 144 243 387 144 206 350
45-49 89 136 225 93 130 223 105 135 240
50 + 130 126 256 133 166 299 137 137 274 _____ _____ ______ _____ _____ ______ _____ _____ ______
Totals 4,745 6,107 10,852 5,053 6,636 11,689 4,961 6,515 11,476
Male Female Total Male Female Total Male Female Total
Enrollment StatusFull-time 34 60 94 31 52 83 48 82 130Part-time 798 931 1,729 920 1,090 2,010 960 1,099 2,059 _____ _____ ______ _____ _____ ______ _____ _____ ______
832 991 1,823 951 1,142 2,093 1,008 1,181 2,189
Ethnic/Race GroupBlack, non-Hispanic 18 13 31 16 29 45 18 26 44
Hispanic 505 595 1,100 575 684 1,259 627 711 1,338
Others 49 71 120 55 77 132 59 70 129
White, non-Hispanic 260 312 572 305 352 657 304 374 678 _____ _____ ______ _____ _____ ______ _____ _____ ______
832 991 1,823 951 1,142 2,093 1,008 1,181 2,189
Student Characteristics by Gender
Fall 2015 Fall 2016
Fall 2017
Fall 2017
Fall 2016Fall 2015
Dual Credit Student Characteristics by Gender
Del Mar College Statistical Profile 2017/18 27
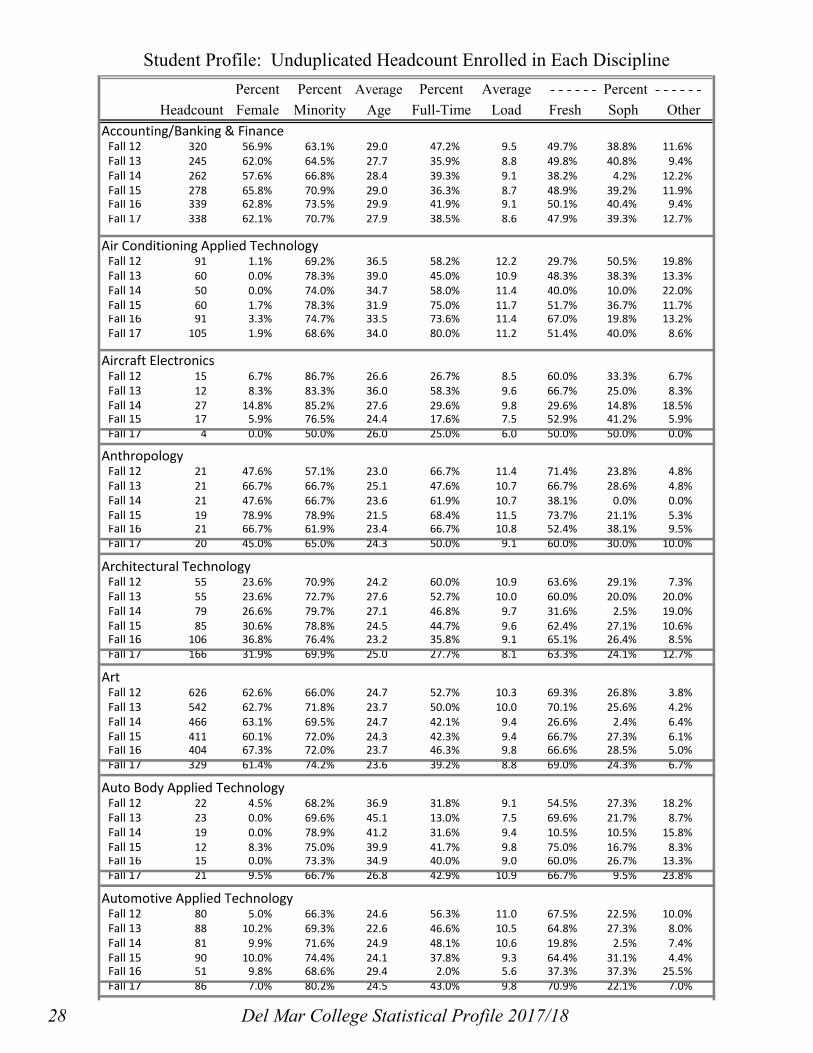
Percent Percent Average Percent Average - - - - - - Percent - - - - - -Headcount Female Minority Age Full-Time Load Fresh Soph Other
Accounting/Banking & Finance Fall 12 320 56.9% 63.1% 29.0 47.2% 9.5 49.7% 38.8% 11.6%Fall 13 245 62.0% 64.5% 27.7 35.9% 8.8 49.8% 40.8% 9.4%Fall 14 262 57.6% 66.8% 28.4 39.3% 9.1 38.2% 4.2% 12.2%Fall 15 278 65.8% 70.9% 29.0 36.3% 8.7 48.9% 39.2% 11.9%Fall 16 339 62.8% 73.5% 29.9 41.9% 9.1 50.1% 40.4% 9.4%Fall 17 338 62.1% 70.7% 27.9 38.5% 8.6 47.9% 39.3% 12.7%
Air Conditioning Applied TechnologyFall 12 91 1.1% 69.2% 36.5 58.2% 12.2 29.7% 50.5% 19.8%Fall 13 60 0.0% 78.3% 39.0 45.0% 10.9 48.3% 38.3% 13.3%Fall 14 50 0.0% 74.0% 34.7 58.0% 11.4 40.0% 10.0% 22.0%Fall 15 60 1.7% 78.3% 31.9 75.0% 11.7 51.7% 36.7% 11.7%Fall 16 91 3.3% 74.7% 33.5 73.6% 11.4 67.0% 19.8% 13.2%Fall 17 105 1.9% 68.6% 34.0 80.0% 11.2 51.4% 40.0% 8.6%
Aircraft ElectronicsFall 12 15 6.7% 86.7% 26.6 26.7% 8.5 60.0% 33.3% 6.7%Fall 13 12 8.3% 83.3% 36.0 58.3% 9.6 66.7% 25.0% 8.3%Fall 14 27 14.8% 85.2% 27.6 29.6% 9.8 29.6% 14.8% 18.5%Fall 15 17 5.9% 76.5% 24.4 17.6% 7.5 52.9% 41.2% 5.9%Fall 17 4 0.0% 50.0% 26.0 25.0% 6.0 50.0% 50.0% 0.0%
AnthropologyFall 12 21 47.6% 57.1% 23.0 66.7% 11.4 71.4% 23.8% 4.8%Fall 13 21 66.7% 66.7% 25.1 47.6% 10.7 66.7% 28.6% 4.8%Fall 14 21 47.6% 66.7% 23.6 61.9% 10.7 38.1% 0.0% 0.0%Fall 15 19 78.9% 78.9% 21.5 68.4% 11.5 73.7% 21.1% 5.3%Fall 16 21 66.7% 61.9% 23.4 66.7% 10.8 52.4% 38.1% 9.5%Fall 17 20 45.0% 65.0% 24.3 50.0% 9.1 60.0% 30.0% 10.0%
Architectural TechnologyFall 12 55 23.6% 70.9% 24.2 60.0% 10.9 63.6% 29.1% 7.3%Fall 13 55 23.6% 72.7% 27.6 52.7% 10.0 60.0% 20.0% 20.0%Fall 14 79 26.6% 79.7% 27.1 46.8% 9.7 31.6% 2.5% 19.0%Fall 15 85 30.6% 78.8% 24.5 44.7% 9.6 62.4% 27.1% 10.6%Fall 16 106 36.8% 76.4% 23.2 35.8% 9.1 65.1% 26.4% 8.5%Fall 17 166 31.9% 69.9% 25.0 27.7% 8.1 63.3% 24.1% 12.7%
ArtFall 12 626 62.6% 66.0% 24.7 52.7% 10.3 69.3% 26.8% 3.8%Fall 13 542 62.7% 71.8% 23.7 50.0% 10.0 70.1% 25.6% 4.2%Fall 14 466 63.1% 69.5% 24.7 42.1% 9.4 26.6% 2.4% 6.4%Fall 15 411 60.1% 72.0% 24.3 42.3% 9.4 66.7% 27.3% 6.1%Fall 16 404 67.3% 72.0% 23.7 46.3% 9.8 66.6% 28.5% 5.0%Fall 17 329 61.4% 74.2% 23.6 39.2% 8.8 69.0% 24.3% 6.7%
Auto Body Applied TechnologyFall 12 22 4.5% 68.2% 36.9 31.8% 9.1 54.5% 27.3% 18.2%Fall 13 23 0.0% 69.6% 45.1 13.0% 7.5 69.6% 21.7% 8.7%Fall 14 19 0.0% 78.9% 41.2 31.6% 9.4 10.5% 10.5% 15.8%Fall 15 12 8.3% 75.0% 39.9 41.7% 9.8 75.0% 16.7% 8.3%Fall 16 15 0.0% 73.3% 34.9 40.0% 9.0 60.0% 26.7% 13.3%Fall 17 21 9.5% 66.7% 26.8 42.9% 10.9 66.7% 9.5% 23.8%
Automotive Applied TechnologyFall 12 80 5.0% 66.3% 24.6 56.3% 11.0 67.5% 22.5% 10.0%Fall 13 88 10.2% 69.3% 22.6 46.6% 10.5 64.8% 27.3% 8.0%Fall 14 81 9.9% 71.6% 24.9 48.1% 10.6 19.8% 2.5% 7.4%Fall 15 90 10.0% 74.4% 24.1 37.8% 9.3 64.4% 31.1% 4.4%Fall 16 51 9.8% 68.6% 29.4 2.0% 5.6 37.3% 37.3% 25.5%Fall 17 86 7.0% 80.2% 24.5 43.0% 9.8 70.9% 22.1% 7.0%
Student Profile: Unduplicated Headcount Enrolled in Each Discipline
28 Del Mar College Statistical Profile 2017/18
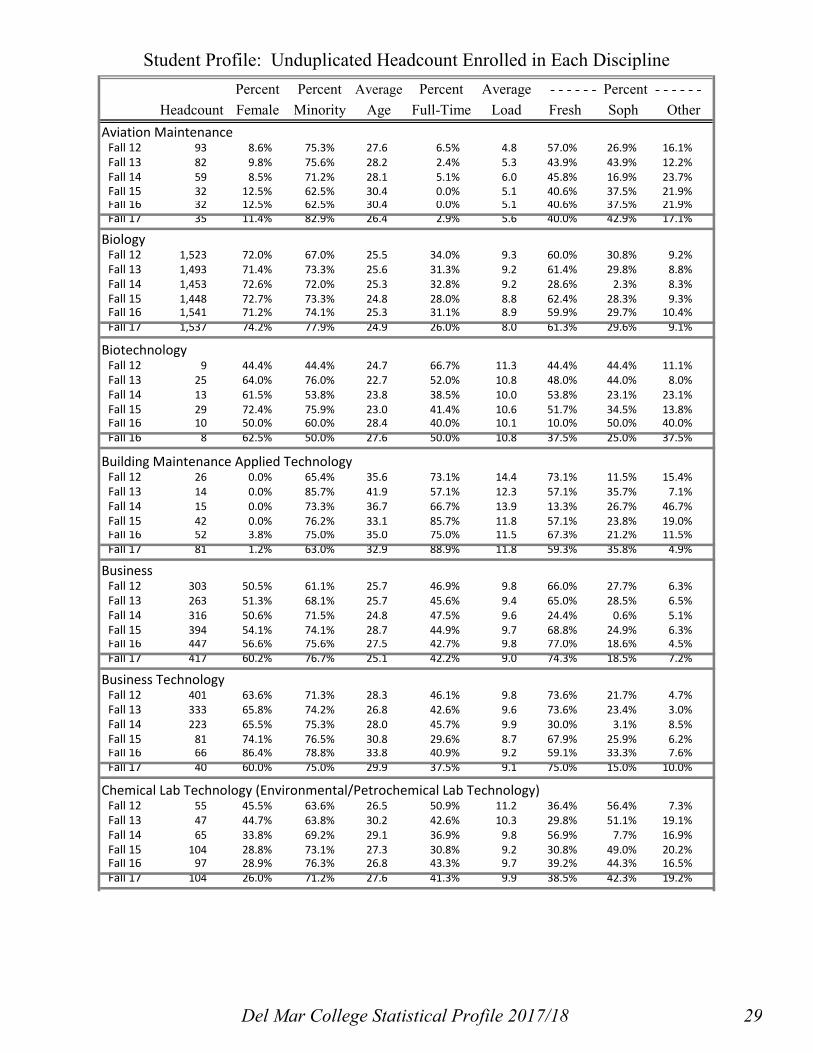
Percent Percent Average Percent Average - - - - - - Percent - - - - - -Headcount Female Minority Age Full-Time Load Fresh Soph Other
Student Profile: Unduplicated Headcount Enrolled in Each Discipline
Aviation MaintenanceFall 12 93 8.6% 75.3% 27.6 6.5% 4.8 57.0% 26.9% 16.1%Fall 13 82 9.8% 75.6% 28.2 2.4% 5.3 43.9% 43.9% 12.2%Fall 14 59 8.5% 71.2% 28.1 5.1% 6.0 45.8% 16.9% 23.7%Fall 15 32 12.5% 62.5% 30.4 0.0% 5.1 40.6% 37.5% 21.9%Fall 16 32 12.5% 62.5% 30.4 0.0% 5.1 40.6% 37.5% 21.9%Fall 17 35 11.4% 82.9% 26.4 2.9% 5.6 40.0% 42.9% 17.1%
BiologyFall 12 1,523 72.0% 67.0% 25.5 34.0% 9.3 60.0% 30.8% 9.2%Fall 13 1,493 71.4% 73.3% 25.6 31.3% 9.2 61.4% 29.8% 8.8%Fall 14 1,453 72.6% 72.0% 25.3 32.8% 9.2 28.6% 2.3% 8.3%Fall 15 1,448 72.7% 73.3% 24.8 28.0% 8.8 62.4% 28.3% 9.3%Fall 16 1,541 71.2% 74.1% 25.3 31.1% 8.9 59.9% 29.7% 10.4%Fall 17 1,537 74.2% 77.9% 24.9 26.0% 8.0 61.3% 29.6% 9.1%
BiotechnologyFall 12 9 44.4% 44.4% 24.7 66.7% 11.3 44.4% 44.4% 11.1%Fall 13 25 64.0% 76.0% 22.7 52.0% 10.8 48.0% 44.0% 8.0%Fall 14 13 61.5% 53.8% 23.8 38.5% 10.0 53.8% 23.1% 23.1%Fall 15 29 72.4% 75.9% 23.0 41.4% 10.6 51.7% 34.5% 13.8%Fall 16 10 50.0% 60.0% 28.4 40.0% 10.1 10.0% 50.0% 40.0%Fall 16 8 62.5% 50.0% 27.6 50.0% 10.8 37.5% 25.0% 37.5%
Building Maintenance Applied TechnologyFall 12 26 0.0% 65.4% 35.6 73.1% 14.4 73.1% 11.5% 15.4%Fall 13 14 0.0% 85.7% 41.9 57.1% 12.3 57.1% 35.7% 7.1%Fall 14 15 0.0% 73.3% 36.7 66.7% 13.9 13.3% 26.7% 46.7%Fall 15 42 0.0% 76.2% 33.1 85.7% 11.8 57.1% 23.8% 19.0%Fall 16 52 3.8% 75.0% 35.0 75.0% 11.5 67.3% 21.2% 11.5%Fall 17 81 1.2% 63.0% 32.9 88.9% 11.8 59.3% 35.8% 4.9%
BusinessFall 12 303 50.5% 61.1% 25.7 46.9% 9.8 66.0% 27.7% 6.3%Fall 13 263 51.3% 68.1% 25.7 45.6% 9.4 65.0% 28.5% 6.5%Fall 14 316 50.6% 71.5% 24.8 47.5% 9.6 24.4% 0.6% 5.1%Fall 15 394 54.1% 74.1% 28.7 44.9% 9.7 68.8% 24.9% 6.3%Fall 16 447 56.6% 75.6% 27.5 42.7% 9.8 77.0% 18.6% 4.5%Fall 17 417 60.2% 76.7% 25.1 42.2% 9.0 74.3% 18.5% 7.2%
Business TechnologyFall 12 401 63.6% 71.3% 28.3 46.1% 9.8 73.6% 21.7% 4.7%Fall 13 333 65.8% 74.2% 26.8 42.6% 9.6 73.6% 23.4% 3.0%Fall 14 223 65.5% 75.3% 28.0 45.7% 9.9 30.0% 3.1% 8.5%Fall 15 81 74.1% 76.5% 30.8 29.6% 8.7 67.9% 25.9% 6.2%Fall 16 66 86.4% 78.8% 33.8 40.9% 9.2 59.1% 33.3% 7.6%Fall 17 40 60.0% 75.0% 29.9 37.5% 9.1 75.0% 15.0% 10.0%
Chemical Lab Technology (Environmental/Petrochemical Lab Technology)Fall 12 55 45.5% 63.6% 26.5 50.9% 11.2 36.4% 56.4% 7.3%Fall 13 47 44.7% 63.8% 30.2 42.6% 10.3 29.8% 51.1% 19.1%Fall 14 65 33.8% 69.2% 29.1 36.9% 9.8 56.9% 7.7% 16.9%Fall 15 104 28.8% 73.1% 27.3 30.8% 9.2 30.8% 49.0% 20.2%Fall 16 97 28.9% 76.3% 26.8 43.3% 9.7 39.2% 44.3% 16.5%Fall 17 104 26.0% 71.2% 27.6 41.3% 9.9 38.5% 42.3% 19.2%
Del Mar College Statistical Profile 2017/18 29

Percent Percent Average Percent Average - - - - - - Percent - - - - - -Headcount Female Minority Age Full-Time Load Fresh Soph Other
Student Profile: Unduplicated Headcount Enrolled in Each Discipline
ChemistryFall 12 438 60.5% 64.8% 25.6 49.1% 10.7 52.3% 36.8% 11.0%Fall 13 430 57.7% I could 25.8 40.0% 10.0 47.2% 38.1% 14.7%Fall 14 465 58.7% 70.5% 25.0 39.6% 10.2 36.8% 2.8% 12.3%Fall 15 477 59.7% 70.9% 24.6 39.4% 9.9 56.4% 32.9% 10.7%Fall 16 520 61.5% 72.1% 24.1 38.3% 10.0 53.3% 35.6% 11.2%Fall 17 468 61.3% 76.3% 24.6 37.2% 9.2 54.3% 32.3% 13.5%
Child Development/Early Childhood Fall 12 141 94.3% 75.9% 28.5 29.1% 8.1 52.5% 36.9% 10.6%Fall 13 120 90.8% 76.7% 27.5 35.8% 9.3 51.7% 38.3% 10.0%Fall 14 118 87.3% 79.7% 26.7 36.4% 8.5 37.3% 4.2% 9.3%Fall 15 110 91.8% 80.0% 25.4 31.8% 9.2 65.5% 20.9% 13.6%Fall 16 111 96.4% 77.5% 25.6 30.6% 9.0 62.2% 27.9% 9.9%Fall 17 92 94.6% 91.3% 24.9 31.5% 8.6 63.0% 32.6% 4.3%
CommunicationsFall 12 96 49.0% 58.3% 24.7 45.8% 9.7 58.3% 36.5% 5.2%Fall 13 85 58.8% 62.4% 23.8 44.7% 9.9 47.1% 47.1% 5.9%Fall 14 402 53.7% 80.6% 46.8 27.9% 18.4 11.2% 1.5% 3.7%Fall 15 88 53.4% 61.4% 24.3 50.0% 9.9 65.9% 29.5% 4.5%Fall 16 100 56.0% 72.0% 24.4 49.0% 10.0 58.0% 33.0% 9.0%Fall 17 100 38.0% 78.0% 22.8 54.0% 10.1 60.0% 33.0% 7.0%
Computer Information SystemsFall 05 1,541 46.7% 57.9% 25.9 42.1% 10.1 47.6% 18.8% 33.7%Fall 12 773 45.1% 65.2% 26.3 44.8% 9.8 65.5% 27.4% 7.1%Fall 13 748 49.6% 67.2% 26.3 39.0% 9.3 66.6% 26.2% 7.2%Fall 14 610 43.8% 73.8% 25.9 36.4% 9.2 27.4% 2.6% 7.7%Fall 15 605 37.7% 70.2% 25.7 34.0% 9.1 67.4% 21.3% 11.2%Fall 16 641 33.5% 70.8% 25.2 36.8% 9.0 65.5% 24.6% 9.8%Fall 17 652 32.5% 71.3% 25.8 37.3% 8.9 68.9% 21.6% 9.5%
Computer-Network Electronic TechnologyFall 12 73 11.0% 67.1% 30.1 38.4% 9.2 54.8% 35.6% 9.6%Fall 13 79 10.1% 75.9% 27.4 41.8% 9.4 65.8% 26.6% 7.6%Fall 14 88 13.6% 73.9% 26.7 37.5% 9.6 20.5% 10.2% 12.5%Fall 15 80 12.5% 71.3% 23.8 37.5% 9.5 68.8% 22.5% 8.8%Fall 16 65 4.6% 76.9% 24.9 53.8% 10.4 76.9% 18.5% 4.6%Fall 17 80 8.8% 76.3% 23.9 46.3% 10.0 71.3% 26.3% 2.5%
Computer ScienceFall 12 179 30.7% 60.3% 25.9 55.3% 10.5 67.6% 24.0% 8.4%Fall 13 199 25.1% 65.8% 25.1 46.7% 10.2 68.3% 22.1% 9.5%Fall 14 208 24.5% 61.5% 24.7 44.2% 10.0 22.6% 2.9% 8.2%Fall 15 210 27.1% 73.3% 24.0 51.4% 10.5 69.0% 21.4% 9.5%Fall 16 211 22.7% 68.7% 24.3 42.2% 9.6 61.6% 27.5% 10.9%Fall 17 159 21.4% 74.8% 23.4 39.0% 9.4 57.9% 30.2% 11.9%
CosmetologyFall 12 105 88.6% 71.4% 22.5 57.1% 9.6 90.5% 7.6% 1.9%Fall 13 95 96.8% 76.8% 20.9 63.2% 10.1 94.7% 5.3% 0.0%Fall 14 95 92.6% 89.5% 20.7 57.9% 9.5 6.3% 2.1% 2.1%Fall 15 120 93.3% 81.7% 19.9 47.5% 8.7 91.7% 6.7% 1.7%Fall 16 103 94.2% 80.6% 19.7 53.4% 9.2 95.1% 3.9% 1.0%Fall 17 114 91.2% 84.2% 20.4 47.4% 8.7 96.5% 1.8% 1.8%
30 Del Mar College Statistical Profile 2017/18

Percent Percent Average Percent Average - - - - - - Percent - - - - - -Headcount Female Minority Age Full-Time Load Fresh Soph Other
Student Profile: Unduplicated Headcount Enrolled in Each Discipline
Court ReportingFall 12 52 88.5% 69.2% 27.7 38.5% 9.8 28.8% 30.8% 40.4%Fall 13 55 90.9% 70.9% 28.2 43.6% 9.9 29.1% 34.5% 36.4%Fall 14 54 85.2% 72.2% 28.3 24.1% 9.4 25.9% 27.8% 40.7%Fall 15 63 87.3% 81.0% 29.3 28.6% 8.4 41.3% 23.8% 34.9%Fall 16 55 92.7% 72.7% 31.8 23.6% 8.5 40.0% 36.4% 23.6%Fall 17 72 83.3% 72.2% 30.8 5.6% 6.7 44.4% 23.6% 31.9%
Criminal Justice Law EnforcementFall 12 20 10.0% 80.0% 28.9 60.0% 16.0 70.0% 5.0% 25.0%Fall 13 28 17.9% 82.1% 33.7 60.7% 15.5 67.9% 14.3% 17.9%Fall 14 27 14.8% 66.7% 32.4 48.1% 14.4 14.8% 0.0% 14.8%Fall 15 25 20.0% 84.0% 27.7 52.0% 15.2 80.0% 4.0% 16.0%Fall 16 19 21.1% 63.2% 30.9 94.7% 19.3 78.9% 5.3% 15.8%Fall 17 14 7.1% 85.7% 25.9 92.9% 18.6 78.6% 7.1% 14.3%
Criminal Justice TransferFall 12 188 54.8% 73.4% 24.6 56.4% 10.3 70.2% 27.1% 2.7%Fall 13 180 50.0% 78.9% 24.4 55.6% 10.2 71.7% 21.7% 6.7%Fall 14 169 48.5% 72.2% 67.3 53.8% 15.8 26.6% 2.4% 3.0%Fall 15 187 50.8% 77.5% 23.3 54.0% 9.9 76.5% 20.3% 3.2%Fall 16 182 50.5% 76.4% 24.0 45.1% 9.2 70.9% 26.4% 2.7%Fall 17 165 52.1% 76.4% 24.9 50.9% 9.3 75.8% 19.4% 4.8%
Culinary ArtsFall 12 159 61.0% 61.0% 24.4 46.5% 9.2 67.3% 22.0% 10.7%Fall 13 148 52.7% 67.6% 26.0 51.4% 9.2 68.2% 21.6% 10.1%Fall 14 118 60.2% 66.1% 26.1 45.8% 8.9 23.7% 2.5% 10.2%Fall 15 121 63.6% 65.3% 26.3 41.3% 9.2 52.9% 35.5% 11.6%Fall 16 91 59.3% 67.0% 26.2 37.4% 9.1 62.6% 26.4% 11.0%Fall 17 81 54.3% 69.1% 27.5 38.3% 8.8 55.6% 29.6% 14.8%
DanceFall 12 108 86.1% 68.5% 22.7 41.7% 9.5 75.9% 23.1% 0.9%Fall 13 79 70.9% 79.7% 21.5 41.8% 9.9 70.9% 26.6% 2.5%Fall 14 81 79.0% 86.4% 22.4 49.4% 10.5 27.2% 1.2% 1.2%Fall 15 64 76.6% 75.0% 23.7 54.7% 10.7 73.4% 21.9% 4.7%Fall 16 72 72.2% 79.2% 24.5 56.9% 10.6 63.9% 29.2% 6.9%Fall 17 82 68.3% 84.1% 26.1 51.2% 9.8 58.5% 35.4% 6.1%
Dental AssistingFall 12 22 100.0% 81.8% 23.9 100.0% 18.0 68.2% 27.3% 4.5%Fall 13 23 91.3% 87.0% 22.3 100.0% 18.1 73.9% 26.1% 0.0%Fall 14 18 94.4% 72.2% 23.3 100.0% 18.0 22.2% 0.0% 5.6%Fall 15 19 94.7% 84.2% 23.4 100.0% 18.0 73.7% 21.1% 5.3%Fall 16 16 100.0% 56.3% 23.1 100.0% 18.2 81.3% 18.8% 0.0%Fall 17 18 100.0% 94.4% 23.7 100.0% 18.0 83.3% 11.1% 5.6%
Dental HygieneFall 12 46 91.3% 54.3% 25.3 52.2% 11.6 34.8% 32.6% 32.6%Fall 13 46 87.0% 52.2% 25.4 45.7% 11.4 32.6% 41.3% 26.1%Fall 14 47 89.4% 57.4% 26.2 48.9% 11.5 40.4% 10.6% 23.4%Fall 15 48 93.8% 64.6% 26.8 54.2% 10.6 31.3% 41.7% 27.1%Fall 16 48 97.9% 77.1% 26.5 50.0% 10.5 27.1% 45.8% 27.1%Fall 17 48 100.0% 75.0% 25.8 54.2% 10.6 27.1% 50.0% 22.9%
Del Mar College Statistical Profile 2017/18 31

Percent Percent Average Percent Average - - - - - - Percent - - - - - -Headcount Female Minority Age Full-Time Load Fresh Soph Other
Student Profile: Unduplicated Headcount Enrolled in Each Discipline
Diagnostic Medical SonographyFall 12 30 90.0% 50.0% 26.4 50.0% 10.5 16.7% 53.3% 30.0%Fall 13 28 89.3% 57.1% 27.5 50.0% 10.5 17.9% 64.3% 17.9%Fall 14 21 95.2% 61.9% 27.2 47.6% 10.2 52.4% 14.3% 33.3%Fall 15 20 90.0% 45.0% 30.7 50.0% 10.0 10.0% 50.0% 40.0%Fall 16 21 95.2% 38.1% 31.7 57.1% 10.2 9.5% 47.6% 42.9%Fall 17 22 90.9% 63.6% 30.7 45.5% 9.7 9.1% 40.9% 50.0%
Diesel Applied TechnologyFall 12 31 6.5% 48.4% 22.1 48.4% 12.1 77.4% 19.4% 3.2%Fall 13 34 0.0% 67.6% 23.8 82.4% 13.4 82.4% 8.8% 8.8%Fall 14 50 0.0% 66.0% 22.7 54.0% 11.3 38.0% 2.0% 4.0%Fall 15 55 0.0% 61.8% 25.1 38.2% 9.4 67.3% 29.1% 3.6%Fall 16 63 1.6% 73.0% 23.8 38.1% 8.9 66.7% 33.3% 0.0%Fall 17 81 2.5% 65.4% 23.5 34.6% 8.8 70.4% 23.5% 6.2%0.0%
Drafting TechnologyFall 12 51 29.4% 66.7% 25.5 54.9% 10.5 64.7% 31.4% 3.9%Fall 13 51 19.6% 70.6% 27.6 41.2% 9.1 64.7% 17.6% 17.6%Fall 14 56 21.4% 71.4% 26.9 33.9% 8.3 21.4% 0.0% 14.3%Fall 15 74 20.3% 77.0% 27.0 35.1% 8.9 63.5% 20.3% 16.2%Fall 16 75 28.0% 78.7% 24.9 32.0% 8.3 60.0% 25.3% 14.7%Fall 17 80 32.5% 68.8% 27.8 17.5% 7.2 68.8% 22.5% 8.8%
DramaFall 12 308 53.6% 66.6% 23.1 62.3% 10.8 70.8% 26.9% 2.3%Fall 13 285 57.5% 64.9% 22.4 56.5% 10.5 63.2% 34.4% 2.5%Fall 14 275 54.5% 76.4% 22.9 53.8% 10.3 31.3% 2.2% 2.9%Fall 15 336 63.1% 75.0% 23.3 55.1% 10.4 67.6% 28.6% 3.9%Fall 16 341 61.9% 78.0% 23.2 43.1% 9.8 68.0% 28.4% 3.5%Fall 17 373 59.8% 79.6% 22.7 41.6% 9.1 71.0% 25.2% 3.8%
EchocardiographyFall 12 10 70.0% 50.0% 26.0 50.0% 10.5 10.0% 70.0% 20.0%Fall 13 9 77.8% 44.4% 27.6 44.4% 10.3 22.2% 66.7% 11.1%Fall 14 8 100.0% 50.0% 28.6 50.0% 10.0 50.0% 25.0% 50.0%Fall 15 8 100.0% 50.0% 31.1 50.0% 10.0 0.0% 37.5% 62.5%Fall 16 8 100.0% 37.5% 28.8 50.0% 9.5 12.5% 50.0% 37.5%Fall 17 8 75.0% 50.0% 31.0 50.0% 9.5 0.0% 37.5% 62.5%
EconomicsFall 12 530 48.7% 55.8% 22.5 33.6% 9.1 63.2% 30.9% 5.8%Fall 13 587 56.6% 61.2% 21.5 25.4% 8.3 74.6% 20.1% 5.3%Fall 14 519 49.7% 60.9% 21.8 24.5% 8.2 19.8% 1.2% 5.8%Fall 15 550 48.2% 67.1% 22.8 31.8% 8.6 70.0% 23.6% 6.4%Fall 16 557 51.9% 67.5% 22.5 28.7% 8.5 68.2% 25.7% 6.1%Fall 17 539 49.9% 69.6% 21.6 31.4% 8.4 71.2% 23.9% 4.8%
EducationFall 12 82 81.7% 64.6% 24.7 53.7% 10.3 39.0% 51.2% 9.8%Fall 13 71 78.9% 77.5% 24.6 42.3% 10.3 47.9% 47.9% 4.2%Fall 14 60 83.3% 70.0% 24.6 58.3% 10.6 45.0% 0.0% 1.7%Fall 15 79 82.3% 65.8% 24.9 53.2% 10.0 41.8% 50.6% 7.6%Fall 16 85 90.6% 71.8% 25.2 52.9% 10.2 43.5% 44.7% 11.8%Fall 17 93 83.9% 75.3% 25.3 40.9% 9.4 53.8% 40.9% 5.4%
32 Del Mar College Statistical Profile 2017/18

Percent Percent Average Percent Average - - - - - - Percent - - - - - -Headcount Female Minority Age Full-Time Load Fresh Soph Other
Student Profile: Unduplicated Headcount Enrolled in Each Discipline
Emergency Medical TechnicianFall 12 127 29.1% 70.9% 24.5 10.2% 7.1 65.4% 27.6% 7.1%Fall 13 142 30.3% 66.9% 25.0 21.1% 8.2 58.5% 36.6% 4.9%Fall 14 107 33.6% 67.3% 23.9 1.9% 5.4 24.3% 2.8% 6.5%Fall 15 145 26.2% 66.2% 24.9 4.8% 5.2 64.8% 17.9% 17.2%Fall 16 108 19.4% 60.2% 26.5 12.0% 7.4 51.9% 25.9% 22.2%Fall 17 80 23.8% 51.3% 26.8 6.3% 5.5 31.3% 20.0% 48.8%
EngineeringFall 05 43 9.3% 53.5% 23.3 67.4% 11.7 32.6% 25.6% 41.9%Fall 12 89 21.3% 53.9% 23.9 57.3% 11.0 60.7% 32.6% 6.7%Fall 13 143 14.0% 62.2% 24.1 47.6% 10.7 52.4% 36.4% 11.2%Fall 14 122 10.7% 71.3% 23.8 46.7% 10.7 32.0% 3.3% 8.2%Fall 15 155 10.3% 71.6% 23.0 46.5% 10.3 62.6% 29.7% 7.7%Fall 16 176 18.8% 68.8% 23.1 43.2% 9.7 58.5% 30.7% 10.8%Fall 17 134 17.9% 73.9% 23.4 44.8% 9.6 55.2% 28.4% 16.4%
EnglishFall 12 3,727 57.0% 67.6% 22.9 40.9% 9.2 84.5% 13.2% 2.3%Fall 13 3,467 57.3% 73.0% 22.5 37.5% 9.0 84.7% 13.1% 2.1%Fall 14 3,111 57.3% 71.7% 22.1 38.0% 9.2 12.1% 0.9% 2.1%Fall 15 3,149 58.4% 75.0% 22.0 35.4% 9.1 86.6% 10.8% 2.6%Fall 16 3,385 59.9% 76.0% 22.1 35.0% 9.1 86.4% 11.3% 2.3%Fall 17 3,177 59.3% 74.3% 22.0 32.7% 8.8 87.2% 10.7% 2.1%
English for Speakers of Other LanguagesFall 11 66 68.2% 77.3% 28.1 59.1% 10.1 93.9% 0.0% 6.1%Fall 12 41 68.3% 95.1% 30.5 41.5% 9.2 92.7% 2.4% 4.9%Fall 13 42 71.4% 97.6% 28.0 40.5% 9.1 95.2% 0.0% 4.8%Fall 14 30 66.7% 100.0% 28.8 80.0% 11.6 0.0% 0.0% 13.3%Fall 15 23 73.9% 91.3% 27.1 34.8% 10.0 87.0% 0.0% 13.0%Fall 16 22 81.8% 90.9% 24.9 40.9% 9.6 95.5% 0.0% 4.5%Fall 17 0 #DIV/0! #DIV/0! 0.0 #DIV/0! 0.0 #DIV/0! #DIV/0! #DIV/0!
Fire ScienceFall 12 81 21.0% 75.3% 24.7 63.0% 10.9 64.2% 23.5% 12.3%Fall 13 85 25.9% 80.0% 21.9 51.8% 10.5 77.6% 20.0% 2.4%Fall 14 83 25.3% 81.9% 23.7 53.0% 10.7 25.3% 2.4% 7.2%Fall 15 59 20.3% 66.1% 21.8 44.1% 9.5 81.4% 11.9% 6.8%Fall 16 82 14.6% 69.5% 23.2 34.1% 8.0 69.5% 11.0% 19.5%Fall 17 67 14.9% 59.7% 21.7 37.3% 7.8 64.2% 6.0% 29.9%
GeographyFall 12 50 50.0% 56.0% 25.7 64.0% 10.8 54.0% 40.0% 6.0%Fall 13 58 37.9% 69.0% 26.8 50.0% 10.4 58.6% 34.5% 6.9%Fall 14 53 41.5% 62.3% 25.3 50.9% 10.0 34.0% 0.0% 9.4%Fall 15 17 41.2% 64.7% 26.4 52.9% 10.2 76.5% 11.8% 11.8%Fall 16 48 50.0% 54.2% 28.1 45.8% 9.5 54.2% 27.1% 18.8%Fall 17 42 42.9% 59.5% 25.5 45.2% 9.9 57.1% 35.7% 7.1%
GeologyFall 12 412 57.3% 63.1% 25.6 53.6% 10.7 37.4% 56.6% 6.1%Fall 13 350 60.0% 69.1% 24.8 53.4% 10.7 39.1% 55.4% 5.4%Fall 14 337 59.3% 68.0% 24.5 47.5% 10.4 56.1% 6.5% 9.2%Fall 15 338 58.3% 71.3% 25.4 53.6% 10.5 38.2% 53.8% 8.0%Fall 16 329 52.9% 70.2% 26.1 49.8% 10.1 38.3% 52.9% 8.8%Fall 17 314 56.1% 73.9% 25.8 49.7% 9.6 39.8% 50.6% 9.6%
Del Mar College Statistical Profile 2017/18 33

Percent Percent Average Percent Average - - - - - - Percent - - - - - -Headcount Female Minority Age Full-Time Load Fresh Soph Other
Student Profile: Unduplicated Headcount Enrolled in Each Discipline
GovernmentFall 12 1,304 57.7% 62.5% 23.8 49.9% 10.2 59.7% 34.7% 5.6%Fall 13 1,104 58.1% 66.2% 23.5 50.7% 10.2 63.0% 30.5% 6.5%Fall 14 1,344 57.5% 68.4% 22.6 46.3% 9.8 29.4% 1.1% 4.5%Fall 15 1,459 57.2% 73.1% 23.1 44.4% 9.8 69.0% 25.2% 5.8%Fall 16 1,493 61.5% 71.9% 22.5 40.7% 9.5 68.5% 27.0% 4.6%Fall 17 1,465 60.0% 72.2% 22.2 36.9% 9.1 70.1% 25.4% 4.5%
Health Information TechnologyFall 12 58 74.1% 51.7% 32.6 25.9% 8.9 50.0% 29.3% 20.7%Fall 13 62 72.6% 51.6% 33.8 19.4% 8.4 48.4% 27.4% 24.2%Fall 14 46 76.1% 60.9% 33.3 21.7% 7.7 21.7% 2.2% 23.9%Fall 15 51 88.2% 72.5% 28.8 17.6% 7.6 66.7% 17.6% 15.7%Fall 16 63 84.1% 73.0% 33.3 20.6% 8.0 50.8% 27.0% 22.2%Fall 17 62 85.5% 66.1% 31.6 11.3% 7.9 53.2% 22.6% 24.2%0.0
Health ScienceFall 12 359 69.1% 74.4% 25.6 23.1% 8.4 72.1% 18.4% 9.5%Fall 13 276 68.5% 75.4% 25.1 18.1% 7.9 65.9% 24.3% 9.8%Fall 14 187 75.4% 72.7% 25.7 18.2% 7.6 21.4% 1.6% 7.0%Fall 15 165 70.9% 73.3% 25.4 17.0% 7.2 62.4% 24.2% 13.3%Fall 16 151 65.6% 79.5% 25.4 19.2% 7.5 65.6% 21.2% 13.2%Fall 17 173 76.3% 71.7% 24.7 13.3% 6.4 67.6% 22.5% 9.8%
HistoryFall 12 1,819 56.5% 62.9% 22.6 47.7% 9.7 81.4% 14.2% 4.4%Fall 13 1,639 55.7% 68.6% 22.4 47.2% 9.8 80.9% 15.8% 3.3%Fall 14 1,886 56.6% 70.4% 22.5 41.7% 9.3 13.7% 0.6% 4.2%Fall 15 1,838 58.0% 70.1% 22.2 38.1% 9.1 82.8% 12.9% 4.3%Fall 16 1,963 58.3% 72.3% 22.3 40.2% 9.1 83.1% 12.9% 4.0%Fall 17 1,930 57.3% 72.5% 21.8 33.9% 8.3 83.8% 12.7% 3.5%
Hospitality/Restaurant ManagementFall 12 93 64.5% 59.1% 26.2 66.7% 11.1 65.6% 23.7% 10.8%Fall 13 78 48.7% 60.3% 27.1 78.2% 11.4 74.4% 16.7% 9.0%Fall 14 73 64.4% 72.6% 26.4 64.4% 10.5 15.1% 1.4% 8.2%Fall 15 46 65.2% 73.9% 27.8 67.4% 11.0 65.2% 26.1% 8.7%Fall 16 52 59.6% 57.7% 26.6 46.2% 10.1 59.6% 28.8% 11.5%Fall 17 28 42.9% 60.7% 26.9 46.4% 9.9 71.4% 21.4% 7.1%50.0%
Hotel/Motel ManagementFall 12 22 68.2% 45.5% 27.3 45.5% 10.0 54.5% 36.4% 9.1%Fall 13 26 57.7% 53.8% 29.0 65.4% 11.2 50.0% 38.5% 11.5%Fall 14 13 53.8% 61.5% 26.8 61.5% 10.2 23.1% 0.0% 23.1%Fall 15 21 52.4% 66.7% 30.7 57.1% 10.7 38.1% 47.6% 14.3%Fall 16 15 60.0% 66.7% 30.2 20.0% 8.7 33.3% 40.0% 26.7%Fall 17 10 60.0% 60.0% 26.8 40.0% 8.8 70.0% 20.0% 10.0%
Human ServicesFall 12 50 74.0% 44.0% 39.3 56.0% 9.9 38.0% 50.0% 12.0%Fall 13 50 72.0% 66.0% 38.2 44.0% 9.5 44.0% 42.0% 14.0%Fall 14 36 63.9% 61.1% 40.0 38.9% 8.3 30.6% 8.3% 13.9%Fall 15 46 65.2% 56.5% 39.3 50.0% 9.8 47.8% 26.1% 26.1%Fall 16 39 71.8% 76.9% 40.9 41.0% 8.9 51.3% 28.2% 20.5%Fall 17 50 72.0% 70.0% 40.1 32.0% 8.5 50.0% 28.0% 22.0%
34 Del Mar College Statistical Profile 2017/18

Percent Percent Average Percent Average - - - - - - Percent - - - - - -Headcount Female Minority Age Full-Time Load Fresh Soph Other
Student Profile: Unduplicated Headcount Enrolled in Each Discipline
HumanitiesFall 12 204 65.2% 64.7% 26.1 46.6% 9.8 67.2% 23.0% 9.8%Fall 13 222 63.1% 69.4% 26.3 48.2% 10.0 62.2% 32.0% 5.9%Fall 14 206 64.6% 70.9% 26.4 48.1% 10.2 35.4% 2.4% 5.3%Fall 15 215 65.6% 76.7% 25.0 40.5% 9.5 59.5% 34.9% 5.6%Fall 16 202 63.9% 78.2% 25.6 46.0% 10.0 68.8% 28.7% 2.5%Fall 17 208 70.2% 76.0% 24.8 40.4% 9.3 71.2% 26.4% 2.4%
Industrial Education Fall 12 166 9.0% 68.7% 27.1 69.3% 12.1 73.5% 25.3% 1.2%Fall 13 177 7.3% 78.0% 25.2 59.3% 10.9 78.0% 19.8% 2.3%Fall 14 164 5.5% 71.3% 26.0 61.0% 11.7 22.0% 3.0% 4.9%Fall 15 183 7.1% 78.7% 24.1 57.4% 10.9 78.7% 19.7% 1.6%Fall 16 190 4.7% 79.5% 23.8 60.0% 11.1 82.1% 16.3% 1.6%Fall 17 190 4.7% 79.5% 23.8 60.0% 11.1 82.1% 16.3% 1.6%
Industrial Machining Applied TechnologyFall 05 34 8.8% 47.1% 34.6 11.8% 6.7 47.1% 26.5% 26.5%Fall 12 32 3.1% 53.1% 33.9 40.6% 8.8 46.9% 43.8% 9.4%Fall 13 31 3.2% 51.6% 37.3 54.8% 9.8 51.6% 35.5% 12.9%Fall 14 31 3.2% 58.1% 35.6 64.5% 10.8 12.9% 6.5% 25.8%Fall 15 29 3.4% 72.4% 32.0 55.2% 10.5 55.2% 34.5% 10.3%Fall 16 40 5.0% 62.5% 34.3 55.0% 9.9 50.0% 32.5% 17.5%Fall 17 40 5.0% 62.5% 34.3 55.0% 9.9 50.0% 32.5% 17.5%
Interpreter PreparationFall 12 72 81.9% 61.1% 27.7 38.9% 9.4 45.8% 34.7% 19.4%Fall 13 77 83.1% 58.4% 24.9 41.6% 9.2 58.4% 18.2% 23.4%Fall 14 71 83.1% 66.2% 27.5 45.1% 9.3 26.8% 7.0% 26.8%Fall 15 71 81.7% 64.8% 25.9 36.6% 9.0 52.1% 26.8% 21.1%Fall 16 68 89.7% 72.1% 25.5 36.8% 9.2 51.5% 38.2% 10.3%Fall 17 88 87.5% 65.9% 25.3 31.8% 8.7 63.6% 15.9% 20.5%
KinesiologyFall 12 1,109 59.2% 64.9% 24.5 39.0% 9.4 59.8% 33.7% 6.5%Fall 13 946 63.0% 72.0% 24.2 33.8% 9.0 58.5% 35.3% 6.2%Fall 14 861 60.5% 72.5% 24.1 35.5% 8.9 32.9% 1.6% 6.3%Fall 15 999 53.1% 75.2% 26.3 41.1% 9.4 63.6% 27.6% 8.8%Fall 16 753 59.5% 78.2% 25.8 42.9% 9.7 65.7% 27.9% 6.4%Fall 17 670 63.6% 80.4% 23.0 32.8% 8.8 69.4% 26.0% 4.6%
Languages (French, German)Fall 12 15 73.3% 33.3% 25.2 60.0% 11.3 40.0% 40.0% 20.0%Fall 13 19 47.4% 47.4% 28.4 21.1% 8.6 21.1% 42.1% 36.8%Fall 15 9 44.4% 66.7% 31.3 44.4% 9.6 44.4% 33.3% 22.2%Fall 16 16 37.5% 68.8% 28.0 62.5% 10.6 56.3% 6.3% 37.5%Fall 17 12 58.3% 91.7% 29.2 50.0% 9.1 33.3% 41.7% 25.0%
Legal ProfessionsFall 12 56 85.7% 73.2% 31.6 37.5% 9.6 58.9% 33.9% 7.1%Fall 13 57 82.5% 77.2% 28.5 40.4% 9.7 49.1% 42.1% 8.8%Fall 14 56 83.9% 67.9% 29.5 42.9% 9.2 26.8% 1.8% 14.3%Fall 15 52 88.5% 78.8% 28.2 42.3% 9.7 57.7% 38.5% 3.8%Fall 16 62 83.9% 75.8% 28.5 46.8% 9.9 45.2% 38.7% 16.1%Fall 17 65 78.5% 69.2% 29.2 38.5% 9.0 55.4% 24.6% 20.0%
Del Mar College Statistical Profile 2017/18 35
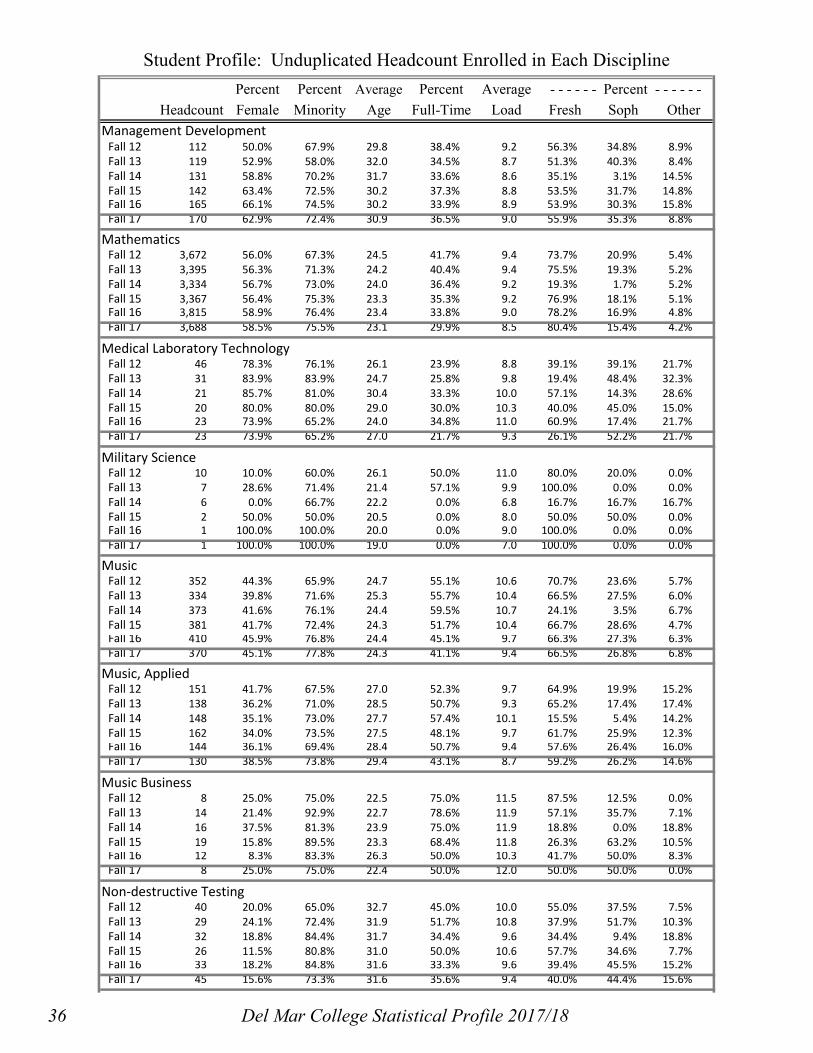
Percent Percent Average Percent Average - - - - - - Percent - - - - - -Headcount Female Minority Age Full-Time Load Fresh Soph Other
Student Profile: Unduplicated Headcount Enrolled in Each Discipline
Management DevelopmentFall 05 445 57.3% 52.6% 28.5 42.0% 9.0 32.6% 27.6% 39.8%Fall 12 112 50.0% 67.9% 29.8 38.4% 9.2 56.3% 34.8% 8.9%Fall 13 119 52.9% 58.0% 32.0 34.5% 8.7 51.3% 40.3% 8.4%Fall 14 131 58.8% 70.2% 31.7 33.6% 8.6 35.1% 3.1% 14.5%Fall 15 142 63.4% 72.5% 30.2 37.3% 8.8 53.5% 31.7% 14.8%Fall 16 165 66.1% 74.5% 30.2 33.9% 8.9 53.9% 30.3% 15.8%Fall 17 170 62.9% 72.4% 30.9 36.5% 9.0 55.9% 35.3% 8.8%
MathematicsFall 12 3,672 56.0% 67.3% 24.5 41.7% 9.4 73.7% 20.9% 5.4%Fall 13 3,395 56.3% 71.3% 24.2 40.4% 9.4 75.5% 19.3% 5.2%Fall 14 3,334 56.7% 73.0% 24.0 36.4% 9.2 19.3% 1.7% 5.2%Fall 15 3,367 56.4% 75.3% 23.3 35.3% 9.2 76.9% 18.1% 5.1%Fall 16 3,815 58.9% 76.4% 23.4 33.8% 9.0 78.2% 16.9% 4.8%Fall 17 3,688 58.5% 75.5% 23.1 29.9% 8.5 80.4% 15.4% 4.2%
Medical Laboratory TechnologyFall 12 46 78.3% 76.1% 26.1 23.9% 8.8 39.1% 39.1% 21.7%Fall 13 31 83.9% 83.9% 24.7 25.8% 9.8 19.4% 48.4% 32.3%Fall 14 21 85.7% 81.0% 30.4 33.3% 10.0 57.1% 14.3% 28.6%Fall 15 20 80.0% 80.0% 29.0 30.0% 10.3 40.0% 45.0% 15.0%Fall 16 23 73.9% 65.2% 24.0 34.8% 11.0 60.9% 17.4% 21.7%Fall 17 23 73.9% 65.2% 27.0 21.7% 9.3 26.1% 52.2% 21.7%
Military ScienceFall 12 10 10.0% 60.0% 26.1 50.0% 11.0 80.0% 20.0% 0.0%Fall 13 7 28.6% 71.4% 21.4 57.1% 9.9 100.0% 0.0% 0.0%Fall 14 6 0.0% 66.7% 22.2 0.0% 6.8 16.7% 16.7% 16.7%Fall 15 2 50.0% 50.0% 20.5 0.0% 8.0 50.0% 50.0% 0.0%Fall 16 1 100.0% 100.0% 20.0 0.0% 9.0 100.0% 0.0% 0.0%Fall 17 1 100.0% 100.0% 19.0 0.0% 7.0 100.0% 0.0% 0.0%
MusicFall 12 352 44.3% 65.9% 24.7 55.1% 10.6 70.7% 23.6% 5.7%Fall 13 334 39.8% 71.6% 25.3 55.7% 10.4 66.5% 27.5% 6.0%Fall 14 373 41.6% 76.1% 24.4 59.5% 10.7 24.1% 3.5% 6.7%Fall 15 381 41.7% 72.4% 24.3 51.7% 10.4 66.7% 28.6% 4.7%Fall 16 410 45.9% 76.8% 24.4 45.1% 9.7 66.3% 27.3% 6.3%Fall 17 370 45.1% 77.8% 24.3 41.1% 9.4 66.5% 26.8% 6.8%
Music, AppliedFall 12 151 41.7% 67.5% 27.0 52.3% 9.7 64.9% 19.9% 15.2%Fall 13 138 36.2% 71.0% 28.5 50.7% 9.3 65.2% 17.4% 17.4%Fall 14 148 35.1% 73.0% 27.7 57.4% 10.1 15.5% 5.4% 14.2%Fall 15 162 34.0% 73.5% 27.5 48.1% 9.7 61.7% 25.9% 12.3%Fall 16 144 36.1% 69.4% 28.4 50.7% 9.4 57.6% 26.4% 16.0%Fall 17 130 38.5% 73.8% 29.4 43.1% 8.7 59.2% 26.2% 14.6%
Music Business Fall 12 8 25.0% 75.0% 22.5 75.0% 11.5 87.5% 12.5% 0.0%Fall 13 14 21.4% 92.9% 22.7 78.6% 11.9 57.1% 35.7% 7.1%Fall 14 16 37.5% 81.3% 23.9 75.0% 11.9 18.8% 0.0% 18.8%Fall 15 19 15.8% 89.5% 23.3 68.4% 11.8 26.3% 63.2% 10.5%Fall 16 12 8.3% 83.3% 26.3 50.0% 10.3 41.7% 50.0% 8.3%Fall 17 8 25.0% 75.0% 22.4 50.0% 12.0 50.0% 50.0% 0.0%
Non-destructive TestingFall 12 40 20.0% 65.0% 32.7 45.0% 10.0 55.0% 37.5% 7.5%Fall 13 29 24.1% 72.4% 31.9 51.7% 10.8 37.9% 51.7% 10.3%Fall 14 32 18.8% 84.4% 31.7 34.4% 9.6 34.4% 9.4% 18.8%Fall 15 26 11.5% 80.8% 31.0 50.0% 10.6 57.7% 34.6% 7.7%Fall 16 33 18.2% 84.8% 31.6 33.3% 9.6 39.4% 45.5% 15.2%Fall 17 45 15.6% 73.3% 31.6 35.6% 9.4 40.0% 44.4% 15.6%
36 Del Mar College Statistical Profile 2017/18
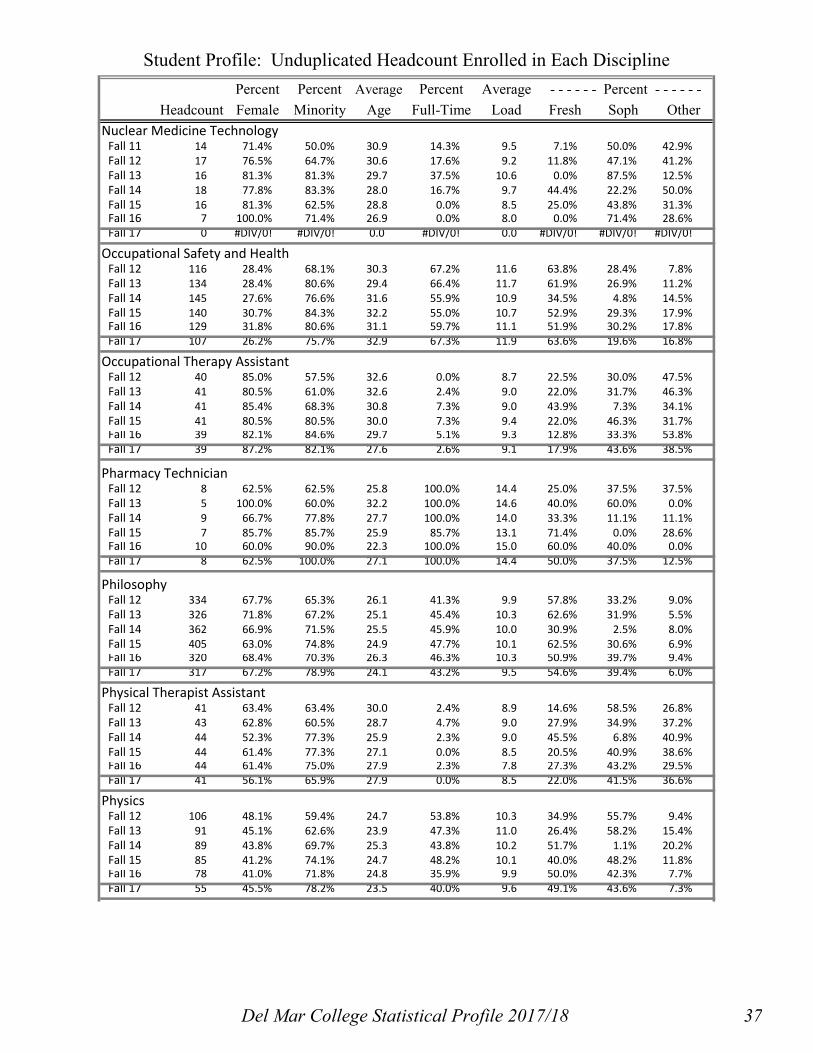
Percent Percent Average Percent Average - - - - - - Percent - - - - - -Headcount Female Minority Age Full-Time Load Fresh Soph Other
Student Profile: Unduplicated Headcount Enrolled in Each Discipline
Nuclear Medicine TechnologyFall 11 14 71.4% 50.0% 30.9 14.3% 9.5 7.1% 50.0% 42.9%Fall 12 17 76.5% 64.7% 30.6 17.6% 9.2 11.8% 47.1% 41.2%Fall 13 16 81.3% 81.3% 29.7 37.5% 10.6 0.0% 87.5% 12.5%Fall 14 18 77.8% 83.3% 28.0 16.7% 9.7 44.4% 22.2% 50.0%Fall 15 16 81.3% 62.5% 28.8 0.0% 8.5 25.0% 43.8% 31.3%Fall 16 7 100.0% 71.4% 26.9 0.0% 8.0 0.0% 71.4% 28.6%Fall 17 0 #DIV/0! #DIV/0! 0.0 #DIV/0! 0.0 #DIV/0! #DIV/0! #DIV/0!
Occupational Safety and HealthFall 12 116 28.4% 68.1% 30.3 67.2% 11.6 63.8% 28.4% 7.8%Fall 13 134 28.4% 80.6% 29.4 66.4% 11.7 61.9% 26.9% 11.2%Fall 14 145 27.6% 76.6% 31.6 55.9% 10.9 34.5% 4.8% 14.5%Fall 15 140 30.7% 84.3% 32.2 55.0% 10.7 52.9% 29.3% 17.9%Fall 16 129 31.8% 80.6% 31.1 59.7% 11.1 51.9% 30.2% 17.8%Fall 17 107 26.2% 75.7% 32.9 67.3% 11.9 63.6% 19.6% 16.8%
Occupational Therapy AssistantFall 12 40 85.0% 57.5% 32.6 0.0% 8.7 22.5% 30.0% 47.5%Fall 13 41 80.5% 61.0% 32.6 2.4% 9.0 22.0% 31.7% 46.3%Fall 14 41 85.4% 68.3% 30.8 7.3% 9.0 43.9% 7.3% 34.1%Fall 15 41 80.5% 80.5% 30.0 7.3% 9.4 22.0% 46.3% 31.7%Fall 16 39 82.1% 84.6% 29.7 5.1% 9.3 12.8% 33.3% 53.8%Fall 17 39 87.2% 82.1% 27.6 2.6% 9.1 17.9% 43.6% 38.5%
Pharmacy TechnicianFall 12 8 62.5% 62.5% 25.8 100.0% 14.4 25.0% 37.5% 37.5%Fall 13 5 100.0% 60.0% 32.2 100.0% 14.6 40.0% 60.0% 0.0%Fall 14 9 66.7% 77.8% 27.7 100.0% 14.0 33.3% 11.1% 11.1%Fall 15 7 85.7% 85.7% 25.9 85.7% 13.1 71.4% 0.0% 28.6%Fall 16 10 60.0% 90.0% 22.3 100.0% 15.0 60.0% 40.0% 0.0%Fall 17 8 62.5% 100.0% 27.1 100.0% 14.4 50.0% 37.5% 12.5%
PhilosophyFall 12 334 67.7% 65.3% 26.1 41.3% 9.9 57.8% 33.2% 9.0%Fall 13 326 71.8% 67.2% 25.1 45.4% 10.3 62.6% 31.9% 5.5%Fall 14 362 66.9% 71.5% 25.5 45.9% 10.0 30.9% 2.5% 8.0%Fall 15 405 63.0% 74.8% 24.9 47.7% 10.1 62.5% 30.6% 6.9%Fall 16 320 68.4% 70.3% 26.3 46.3% 10.3 50.9% 39.7% 9.4%Fall 17 317 67.2% 78.9% 24.1 43.2% 9.5 54.6% 39.4% 6.0%
Physical Therapist AssistantFall 12 41 63.4% 63.4% 30.0 2.4% 8.9 14.6% 58.5% 26.8%Fall 13 43 62.8% 60.5% 28.7 4.7% 9.0 27.9% 34.9% 37.2%Fall 14 44 52.3% 77.3% 25.9 2.3% 9.0 45.5% 6.8% 40.9%Fall 15 44 61.4% 77.3% 27.1 0.0% 8.5 20.5% 40.9% 38.6%Fall 16 44 61.4% 75.0% 27.9 2.3% 7.8 27.3% 43.2% 29.5%Fall 17 41 56.1% 65.9% 27.9 0.0% 8.5 22.0% 41.5% 36.6%
PhysicsFall 12 106 48.1% 59.4% 24.7 53.8% 10.3 34.9% 55.7% 9.4%Fall 13 91 45.1% 62.6% 23.9 47.3% 11.0 26.4% 58.2% 15.4%Fall 14 89 43.8% 69.7% 25.3 43.8% 10.2 51.7% 1.1% 20.2%Fall 15 85 41.2% 74.1% 24.7 48.2% 10.1 40.0% 48.2% 11.8%Fall 16 78 41.0% 71.8% 24.8 35.9% 9.9 50.0% 42.3% 7.7%Fall 17 55 45.5% 78.2% 23.5 40.0% 9.6 49.1% 43.6% 7.3%
Del Mar College Statistical Profile 2017/18 37

Percent Percent Average Percent Average - - - - - - Percent - - - - - -Headcount Female Minority Age Full-Time Load Fresh Soph Other
Student Profile: Unduplicated Headcount Enrolled in Each Discipline
Process TechnologyFall 12 114 12.3% 70.2% 27.6 37.7% 10.0 69.3% 20.2% 10.5%Fall 13 147 6.1% 77.6% 25.7 43.5% 10.0 78.9% 13.6% 7.5%Fall 14 158 10.8% 74.1% 25.6 37.3% 9.5 22.8% 2.5% 9.5%Fall 15 218 12.4% 71.1% 24.9 41.7% 9.7 74.3% 17.4% 8.3%Fall 16 266 9.4% 77.1% 26.1 47.4% 10.1 77.4% 13.5% 9.0%Fall 17 292 7.2% 82.5% 26.7 45.9% 10.0 67.8% 24.0% 8.2%
PsychologyFall 12 1,198 70.2% 67.6% 24.1 43.7% 9.7 78.5% 17.3% 4.2%Fall 13 147 6.1% 77.6% 25.7 43.5% 10.0 78.9% 13.6% 7.5%Fall 14 1,098 68.9% 73.9% 22.9 37.8% 9.1 18.7% 0.6% 3.7%Fall 15 1,196 67.7% 75.1% 22.6 37.3% 9.1 75.8% 19.6% 4.6%Fall 16 1,239 71.6% 72.1% 22.9 34.1% 8.8 78.5% 17.7% 3.9%Fall 17 1,230 72.4% 75.1% 22.5 30.7% 8.2 81.5% 14.8% 3.7%
Radiologic TechnologyFall 12 41 58.5% 61.0% 28.7 2.4% 8.5 4.9% 61.0% 34.1%Fall 13 47 72.3% 66.0% 31.7 10.6% 8.7 4.3% 63.8% 31.9%Fall 14 52 71.2% 73.1% 29.4 11.5% 9.1 57.7% 15.4% 36.5%Fall 15 50 74.0% 58.0% 30.3 0.0% 7.5 2.0% 66.0% 32.0%Fall 16 53 73.6% 66.0% 28.6 1.9% 7.4 11.3% 54.7% 34.0%Fall 17 47 76.6% 72.3% 27.7 0.0% 7.5 17.0% 46.8% 36.2%
ReadingFall 12 492 61.2% 82.9% 23.1 41.3% 9.5 96.3% 3.3% 0.4%Fall 13 439 61.3% 86.1% 23.3 36.2% 9.2 97.3% 2.3% 0.5%Fall 14 172 61.0% 87.2% 23.4 47.1% 10.2 2.3% 0.6% 2.9%Fall 15 222 63.1% 86.5% 21.3 36.5% 9.4 95.5% 3.2% 1.4%Fall 16 234 62.4% 85.9% 21.4 38.9% 9.3 97.0% 1.7% 1.3%Fall 17 218 66.1% 91.3% 21.1 24.8% 8.6 97.2% 2.3% 0.5%
Registered Nurse EducationFall 12 356 83.1% 57.9% 30.7 7.3% 7.8 13.8% 50.6% 35.7%Fall 13 218 78.4% 70.2% 30.2 7.3% 8.2 10.1% 56.9% 33.0%Fall 14 239 77.0% 69.0% 31.4 5.4% 8.2 59.8% 20.9% 33.5%Fall 15 242 76.0% 74.0% 30.9 7.4% 9.1 7.9% 48.8% 43.4%Fall 16 260 80.8% 75.0% 31.1 3.5% 8.9 12.7% 41.5% 45.8%Fall 17 279 83.5% 69.2% 29.6 1.8% 8.6 9.3% 54.8% 35.8%
Respiratory TherapyFall 12 31 74.2% 77.4% 30.6 6.5% 7.6 3.2% 67.7% 29.0%Fall 13 33 69.7% 72.7% 31.0 3.0% 8.0 3.0% 75.8% 21.2%Fall 14 32 71.9% 84.4% 27.4 3.1% 8.1 59.4% 25.0% 31.3%Fall 15 32 78.1% 81.3% 28.9 3.1% 7.5 9.4% 53.1% 37.5%Fall 16 34 85.3% 76.5% 29.0 0.0% 7.2 5.9% 50.0% 44.1%Fall 17 31 77.4% 93.5% 27.4 3.2% 7.5 12.9% 41.9% 45.2%
Social WorkFall 12 35 80.0% 48.6% 33.4 62.9% 11.3 42.9% 54.3% 2.9%Fall 13 27 63.0% 81.5% 32.9 59.3% 10.7 55.6% 40.7% 3.7%Fall 14 23 65.2% 52.2% 36.4 52.2% 10.2 26.1% 0.0% 4.3%Fall 15 42 66.7% 66.7% 36.8 57.1% 10.0 57.1% 33.3% 9.5%Fall 16 32 78.1% 81.3% 34.0 46.9% 9.8 71.9% 25.0% 3.1%Fall 17 44 84.1% 75.0% 35.0 38.6% 9.3 52.3% 36.4% 11.4%
38 Del Mar College Statistical Profile 2017/18

Percent Percent Average Percent Average - - - - - - Percent - - - - - -Headcount Female Minority Age Full-Time Load Fresh Soph Other
Student Profile: Unduplicated Headcount Enrolled in Each Discipline
SociologyFall 12 408 66.2% 60.3% 23.7 54.2% 10.2 74.0% 20.8% 5.1%Fall 13 353 60.3% 73.4% 24.6 52.4% 10.2 70.8% 24.9% 4.2%Fall 14 393 61.6% 72.8% 23.0 52.2% 10.2 21.1% 1.5% 3.3%Fall 15 446 64.3% 71.7% 23.0 41.9% 9.6 79.4% 17.3% 3.4%Fall 16 481 61.7% 73.6% 23.1 39.9% 9.0 80.7% 14.6% 4.8%Fall 17 426 67.4% 80.3% 22.7 35.0% 8.9 76.1% 20.0% 4.0%
Sound Recording TechnologyFall 12 36 16.7% 66.7% 20.9 55.6% 11.2 80.6% 19.4% 0.0%Fall 13 47 12.8% 87.2% 22.5 51.1% 10.2 70.2% 23.4% 6.4%Fall 14 46 17.4% 84.8% 23.2 63.0% 11.4 28.3% 0.0% 4.3%Fall 15 43 23.3% 79.1% 23.6 60.5% 11.3 55.8% 32.6% 11.6%Fall 16 40 22.5% 77.5% 23.1 57.5% 11.2 65.0% 25.0% 10.0%Fall 17 39 12.8% 87.2% 22.4 66.7% 11.3 79.5% 15.4% 5.1%
SpanishFall 12 250 67.2% 62.0% 23.7 34.8% 9.1 65.6% 26.0% 8.4%Fall 13 216 63.9% 64.4% 22.7 33.8% 9.0 68.5% 23.1% 8.3%Fall 14 194 65.5% 74.7% 23.4 24.7% 8.5 25.3% 1.5% 8.2%Fall 15 160 62.5% 79.4% 22.7 33.8% 9.6 70.0% 25.0% 5.0%Fall 16 175 71.4% 71.4% 24.7 33.1% 8.9 57.1% 29.1% 13.7%Fall 17 137 63.5% 75.2% 24.3 32.1% 8.8 62.0% 27.7% 10.2%
SpeechFall 12 1,075 60.8% 67.7% 24.2 50.9% 10.1 76.4% 20.1% 3.5%Fall 13 963 62.4% 71.3% 23.7 55.2% 10.4 78.6% 18.9% 2.5%Fall 14 848 61.8% 73.2% 23.3 47.9% 10.0 17.2% 1.5% 2.8%Fall 15 976 58.8% 71.8% 23.6 48.6% 10.0 78.0% 18.0% 4.0%Fall 16 1,012 61.8% 73.1% 23.7 45.3% 9.8 80.0% 16.0% 4.0%Fall 17 1,044 63.4% 75.3% 22.9 40.0% 9.1 80.8% 15.6% 3.5%
Student Success (Formerly Freshman Seminar)Fall 12 305 53.1% 76.7% 23.8 28.5% 9.4 96.4% 3.6% 0.0%Fall 13 294 56.5% 75.9% 23.3 28.9% 9.2 97.3% 2.7% 0.0%Fall 14 479 60.8% 85.4% 22.6 31.3% 9.8 1.5% 0.2% 0.4%Fall 15 689 59.1% 82.9% 21.8 26.4% 9.3 97.2% 2.3% 0.4%Fall 16 748 60.2% 85.6% 22.1 27.1% 9.3 97.3% 1.9% 0.8%Fall 17 713 62.8% 84.2% 22.6 22.7% 8.8 97.3% 2.4% 0.3%
Surgical TechnologyFall 12 15 80.0% 73.3% 30.5 20.0% 9.2 6.7% 73.3% 20.0%Fall 13 12 83.3% 75.0% 27.3 25.0% 9.5 0.0% 75.0% 25.0%Fall 14 13 76.9% 69.2% 28.1 15.4% 8.5 69.2% 15.4% 15.4%Fall 15 15 73.3% 86.7% 27.8 20.0% 9.3 6.7% 66.7% 26.7%Fall 16 10 90.0% 50.0% 26.9 0.0% 8.3 30.0% 40.0% 30.0%Fall 17 13 84.6% 76.9% 28.8 30.8% 8.9 7.7% 61.5% 30.8%
Vocational Nurse EducationFall 12 4 100.0% 25.0% 29.5 0.0% 8.3 0.0% 75.0% 25.0%Fall 14 1 100.0% 0.0% 29.0 0.0% 10.0 0.0% 100.0% 100.0%Fall 15 7 71.4% 85.7% 28.4 0.0% 8.6 42.9% 57.1% 0.0%Fall 16 5 80.0% 80.0% 32.8 0.0% 7.8 0.0% 0.0% 100.0%Fall 17 2 100.0% 100.0% 36.0 0.0% 7.0 0.0% 50.0% 50.0%
Welding Applied TechnologyFall 12 122 5.7% 76.2% 23.7 73.0% 11.8 71.3% 24.6% 4.1%Fall 13 147 7.5% 76.9% 25.4 69.4% 11.6 70.7% 26.5% 2.7%Fall 14 185 5.9% 71.9% 22.8 53.5% 10.2 20.0% 2.2% 2.7%Fall 15 236 5.5% 75.8% 22.3 35.2% 9.1 77.1% 20.8% 2.1%Fall 16 336 5.1% 69.6% 21.6 36.3% 8.9 80.1% 17.9% 2.1%Fall 17 334 5.4% 75.4% 21.8 28.1% 8.3 79.0% 17.7% 3.3%
Del Mar College Statistical Profile 2017/18 39

Unduplicated Headcount by Department
0 1,000 2,000 3,000 4,000 5,000 6,000
Art and Drama
Comm, Lang, and Reading
English and Philosophy
Kinesiology
Mathematics
Music
Natural Sciences
Social Sciences
Division of Arts and Sciences
Fall 2017
Fall 2016
0 500 1,000 1,500 2,000
Business Administration
Industrial Education
Public Safety Education
Technical Education
Business, Industrial and Public Safety Education
Fall 2017
Fall 2016
0 500 1,000 1,500 2,000
Business Administration
Industrial Education
Public Safety Education
Technical Education
Health Sciences and Professional Education
Fall 2017
Fall 2016
40 Del Mar College Statistical Profile 2017/18

AnnualYear Fall Spring Summer I Summer II Unduplicated
Headcount1987-88 9,394 8,799 4,636 2,086 13,9011988-89 9,973 9,635 6,081 3,202 16,4691989-90 10,283 9,494 5,011 2,365 14,7471990-91 10,538 9,939 5,203 2,501 15,2591991-92 11,139 10,444 5,330 2,578 16,1461992-93 11,659 11,275 5,340 2,621 16,8851993-94 11,825 11,267 4,964 2,290 16,7721994-95 10,757 10,263 4,572 2,100 15,8541995-96 10,386 10,080 4,702 2,249 15,4481996-97 10,682 10,460 4,551 2,165 15,8291997-98 10,424 10,021 4,586 2,066 15,2381998-99 9,958 9,419 4,633 2,146 14,3971999-00 9,968 9,713 4,713 2,136 14,5322000-01 9,936 9,636 4,705 2,284 14,4842001-02 10,256 10,085 5,233 2,400 15,1802002-03 11,218 11,074 4,743 2,336 15,9512003-04 11,338 10,803 4,949 2,440 15,9122004-05 11,345 11,532 5,173 2,524 16,2442005-06 12,006 11,322 4,894 2,484 16,4552006-07 11,352 11,027 4,943 2,395 15,6062007-08 11,167 10,728 4,948 2,305 15,3442008-09 11,310 10,927 5,103 2,614 15,5442009-10 12,069 12,063 5,707 3,143 16,1822010-11 12,236 11,989 5,643 2,968 16,9232011-12 12,071 11,478 4,527 2,537 16,2312012-13 11,030 10,360 4,419 2,517 15,0492013-14 10,502 9,889 4,283 2,406 14,4372014-15 10,439 9,992 4,621 2,326 14,3322015-16 10,852 10,554 3,890 3,684 15,2942016-17 11,689 11,190 4,021 3,892 16,045
Student Headcount by Semester for Credit Courses
0
2,000
4,000
6,000
8,000
10,000
12,000
14,000
Student Headcount by Semester
Fall Spring Summer I Summer II
Del Mar College Statistical Profile 2017/18 41

Financial Aid Awards
Type of Aid 2010-11 2011-12 2012-13 2013-14 2014-15 2015-16 2016-17
Federal/State Grants $21,890,818 $20,910,096 $17,666,818 $15,721,107 $15,770,366 $15,217,179 $16,046,232
Federal/State Loans 7,764,763 7,658,012 6,761,711 3,927,132 2,842,268 3,116,938 3,471,357
Employment 842,837 818,045 984,965 1,000,399 942,484 980,686 913,481
Scholarships 781,533 742,407 806,713 1,123,101 1,360,438 1,500,497 1,219,009
Local Grants 667,091 579,057 760,750 695,608 651,735 878,106 762,151_________ _________ _________ _________ _________ _________ _________
Total $31,947,042 $30,707,617 $26,980,957 $22,467,347 $21,567,291 $21,693,406 $22,412,230
Annual unduplicated headcount receiving financial aid 10,800 12,539 11,304 9,459 9,369 9,153 9,409
Percent minority 70% 71% 69% 70% 70% 70% 69%
Average annual financial aid amount per recipient* $2,958 $2,449 $2,387 $2,375.23 $2,301.98 $2,370.09 $2,382.00 Percent of total annual unduplicated headcount receiving financial aid 64% 77% 75% 66% 65% 60% 62%
* Does not include VA, Workforce Commission or employer assistance. Source: Financial Aid Office
0
2
4
6
8
10
12
14
16
18
20
22
24
26
28
30
32
2010-11 2011-12 2012-13 2013-14 2014-15 2015-16 2016-17
MillionsAnnual Financial Aid Awards
Loans
Grants
Scholarships
Employment
42 Del Mar College Statistical Profile 2017/18

Type of AidNumber of Students Amount
Number of Students Amount
Number of Students Amount
Federal/State/Institutional Loans
Federal Direct Student Loan - Subsidized 889 2,223,778 904 2,228,246 984 2,454,563
Federal Direct Student Loan - Unsubsidized 238 566,443 335 822,412 412 1,008,937
Parent Loan Undergraduate Students 9 52,047 14 66,280 2 7,857
Alternative/Private Student Loans 52 337,521 36 207,998 33 188,391
Del Mar College Short-Term Loan 38 16,850 38 19,559 48 24,956 __________ _____________ __________ _____________ __________ _____________Total 1,226 $ 3,196,639 1,327 $ 3,344,495 1,479 $ 3,684,704
Federal/State/Institutional Grants
Pell Grants 4390 14,074,486 4507 14,086,352 4680 15,030,293
Supplemental Educational Opportunity Grants 401 251,060 333 230,653 345 215,363
Academic Competitive Grant - - - - - -
LEAP - - - - - -
SLEAP - - - - - -
DMC Student Grant (TPEG) 664 553,971 711 639,851 616 615,424
DMC Student Grant (Nonresident) 21 20,762 21 23,776 20 20,705
Early Graduate Tuition ExemptionDMC Continuing Education Grant 50 71,851 81 204,393 70 121,026
DMC Dual Credit Grant 21 5,151 22 10,086 14 4,996
Certified Educational Aide Exemption - - - - - -
Robert C. Byrd Scholarship - - - - - -
Valedictorian Waiver 3 2,240 1 1,120 4 2,352
TEXAS Grant - Initial - - - - - -
TEXAS Grant - Renewal 175 182,344 15 16,563 2 2,832
Texas Educational Opportunity Grant - Initial 691 1,048,487 285 396,947 271 405,470
Texas Educational Opportunity Grant - Renewal 112 206,789 265 486,664 214 389,922
Top 10% Scholarship 12 7,200
Charlie Wooten Grant Program 0 - 0 - 0 - __________ _____________ __________ _____________ __________ _____________TOTAL 6,540 $ 16,424,341.00 6,241 $ 16,096,405.00 6,236 $ 16,808,383.00
Employment
College Work-Study 145 189,427 138 220,387 123 214,629
Texas Work Study Mentorship 7 39,451
Student Assistant 313 700,708 306 711,089 317 610,616
Texas College Work-Study 48 52,349 40 49,210 37 48,785 __________ _____________ __________ _____________ __________ _____________TOTAL 506 $ 942,484 484 $ 980,686 484 $ 913,481
Scholarships
Institutional Music 17 4,640 8 2,774 15 7,804
Other 62 122,895 122 93,431 52 33,249
Donor Awarded - - - - - -
Coordinating Board Nursing Scholarship - - - - - -
Del Mar College Foundation * 1018 1,232,851 971 1,404,292 1143 1,177,956 __________ _____________ __________ _____________ __________ _____________TOTAL 1097 $ 1,360,386.00 1101 $ 1,500,496.50 1210 $ 1,219,009.00
Total Financial Aid Operation and
Unduplicated Student Count 9,369 $ 21,923,850 9,153 $ 21,922,082 9,409 $ 22,625,577
Financial Aid Distribution2014-2015 2016-20172015-2016
Del Mar College Statistical Profile 2017/18 43

SemesterCredit Number Cumulative Number Cumulative Number Cumulative Number CumulativeHours Enrolled Percent Enrolled Percent Enrolled Percent Enrolled Percent
1 83 0.8% 34 0.3% 44 0.4% 40 0.3%2 46 1.2% 79 1.0% 72 1.0% 106 1.3%3 1531 15.9% 1530 15.1% 1794 16.3% 1761 16.6%4 570 21.4% 668 21.3% 747 22.7% 760 23.2%5 161 22.9% 157 22.7% 131 23.9% 156 24.6%6 1772 39.9% 1904 40.3% 2022 41.1% 2006 42.1%7 878 48.3% 945 49.0% 955 49.3% 904 50.0%8 484 52.9% 323 52.0% 402 52.8% 501 54.3%9 1157 64.0% 1420 65.1% 1529 65.8% 1495 67.3%
10 683 70.6% 759 72.1% 758 72.3% 691 73.4%11 243 72.9% 227 74.1% 252 74.5% 245 75.5%12 1370 86.0% 1461 87.6% 1568 87.9% 1493 88.5%13 841 94.1% 802 95.0% 838 95.1% 791 95.4%14 292 96.9% 239 97.2% 259 97.3% 224 97.4%15 168 98.5% 167 98.7% 188 98.9% 166 98.8%16 81 99.2% 63 99.3% 51 99.3% 62 99.3%17 20 99.4% 19 99.5% 17 99.5% 19 99.5%18 32 99.7% 32 99.8% 34 99.8% 31 99.8%19 9 99.8% 5 99.8% 5 99.8% 7 99.8%20 13 100.0% 16 100.0% 21 100.0% 17 100.0%21 2 100.0% 0 100.0% 1 100.0% 0 100.0%22 2 100.0% 2 100.0% 0 100.0% 0 100.0%23 0 100.0% 0 100.0% 1 100.0% 0 100.0%24 0 100.0% 0 100.0% 0 100.0% 1 100.0%25 0 100.0% 0 100.0% 0 100.0% 0 100.0%26 1 100.0% 0 100.0% 0 100.0% 0 100.0%27 0 100.0% 0 100.0% 0 100.0% 0 100.0%
10,439 10,852 11,689 11,476Average SCH per Student 8.2 8.1 8.0 8.0
Fall 2017
Students Enrolled by Semester Credit HoursFall 2014 Fall 2015 Fall 2016
0
500
1000
1500
2000
2500
3000
3500
4000
4500
Graph: 1-3 4-6 7-11 12-15 16+
Student Headcount by Semester Credit Hours EnrolledFall 2014 - Fall 2017
Series1Series2Series3Series4
44 Del Mar College Statistical Profile 2017/18

Total % Total % Total % Total % Age Groups
Under 20 876 70% 829 70% 902 68% 868 72% 20-24 217 17% 242 20% 253 19% 204 17% 25-29 59 5% 45 4% 72 5% 50 4% 30-39 60 5% 46 4% 58 4% 56 5% 40 + 35 3% 25 2% 32 2% 31 3% _______ _______ _______ _______
1,247 1,187 1,317 1,209
Average Age 20.73 20.45 20.8 20.6
GenderMale 617 49% 546 46% 629 48% 565 47%Female 630 51% 641 54% 688 52% 644 53% _______ _______ _______ _______
1,247 1,187 1,317 1,209
Ethnicity/RaceWhite, non-Hispanic 277 22% 255 21% 267 20% 240 20%Black, non-Hispanic 31 2% 34 3% 39 3% 31 3%Hispanic 855 69% 836 70% 941 71% 877 73%Asian 23 2% 13 1% 10 1% 11 1%Native American 5 0% 0 0% 2 0% 3 0%International 4 0% 1 0% 2 0% 2 0%Other/Unknown 52 4% 48 4% 56 4% 45 4% _______ _______ _______ _______
1,247 1,187 1,317 1,209
Enrollment StatusFull-time 540 43% 472 40% 560 43% 491 41%Part-time 707 57% 715 60% 757 57% 718 59% _______ _______ _______ _______
1,247 1,187 1,317 1,209
Placed as Requiring Developmental Course WorkEnglish Only 24 2% 28 2% 13 1% 9 1%Math Only 345 28% 336 28% 452 34% 386 32%Reading Only 10 1% 6 1% 4 0% 15 1%English and Math 76 6% 21 2% 13 1% 9 1%English and Reading 30 2% 97 8% 72 5% 56 5%Math and Reading 53 4% 51 4% 49 4% 283 23%English, Math, and Reading 257 21% 326 27% 300 23% 179 15%None/Unknown 452 36% 322 27% 414 31% 271 22% ______ ______ ______ ______
1,247 1,187 1,317 1,208
Dual Credit and Collegiate High School students are not included in First-Time-In-College data.
Profile of First-Time-In-College Students
Fall 2017Fall 2014 Fall 2015 Fall 2016
Del Mar College Statistical Profile 2017/18 45
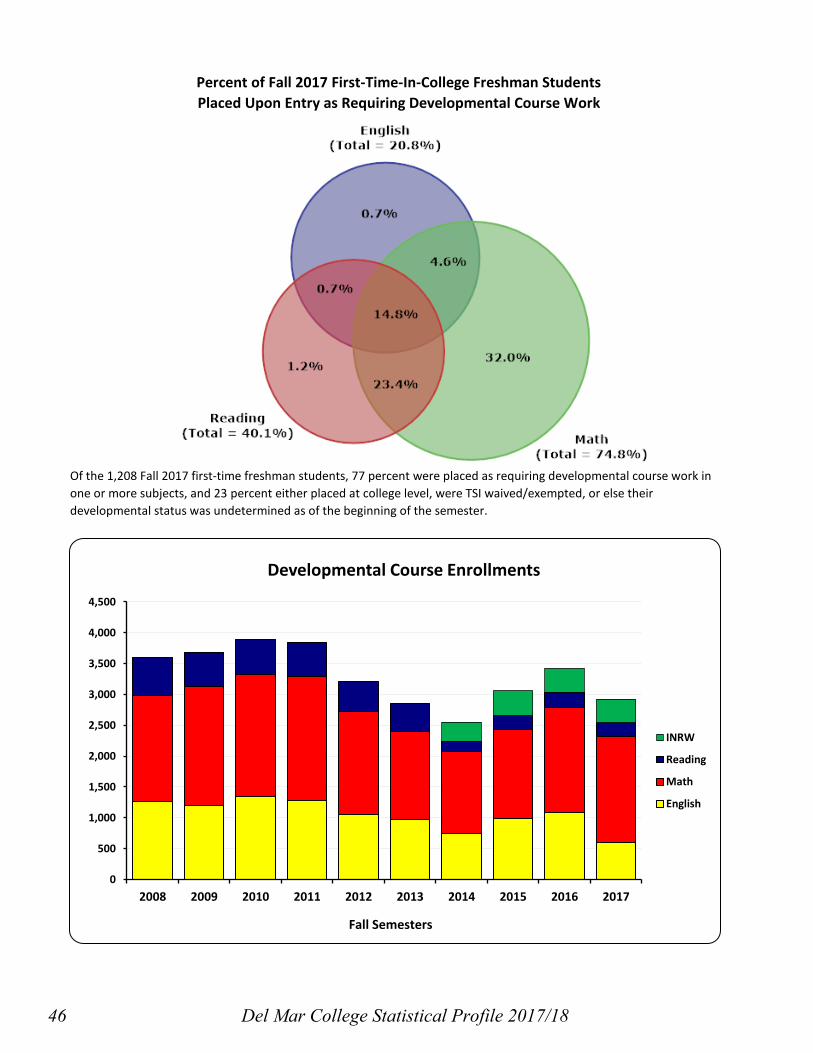
Percent of Fall 2017 First-Time-In-College Freshman Students
Placed Upon Entry as Requiring Developmental Course Work
Of the 1,208 Fall 2017 first-time freshman students, 77 percent were placed as requiring developmental course work in
one or more subjects, and 23 percent either placed at college level, were TSI waived/exempted, or else their
developmental status was undetermined as of the beginning of the semester.
0
500
1,000
1,500
2,000
2,500
3,000
3,500
4,000
4,500
2008 2009 2010 2011 2012 2013 2014 2015 2016 2017
Fall Semesters
Developmental Course Enrollments
INRW
Reading
Math
English
46 Del Mar College Statistical Profile 2017/18

Fall Fall Fall Fall Fall Fall Fall Fall Fall Fall2008 2009 2010 2011 2012 2013 2014 2015 2016 2017
Freshman Seminar/Student Success248 272 342 334 306 288 465 679 737 714
Integrated Reading & Writing309 400 384 378
EnglishDE02-0005 7 2 1 3 2
0305 411 370 412 369 310 285 327 415 507 281
0306 411 370 412 369 311 285 327 415 505 281
0307 286 313 382 390 336 308_____ _____ _____ _____ _____ _____ _____ _____ _____ _____
1,108 1,053 1,206 1,128 957 885 656 831 1,015 564
English for Speakers of Other Languages 0305 20 22 20 21 11 13 13 20 18
0306 20 22 20 21 12 15 13 20 18
0307 14 16 14 7 19
0309 12
0320's 50 41 19 26 32 63 24 24
0340's 38 81 64 64 53 14 30 54 21 10
0354 9 20 9_____ _____ _____ _____ _____ _____ _____ _____ _____ _____151 153 145 159 92 87 88 157 81 34
MathematicsDE02-0002 1 1 2
0370 208 241 288 318 399 309 384 420 557 591
0371 645 772 785 781 616 611 513 595 730 685
0373 867 916 897 906 667 514 435 415 407 436_____ _____ _____ _____ _____ _____ _____ _____ _____ _____
1,720 1,929 1,970 2,005 1,682 1,434 1,334 1,451 1,696 1,712
ReadingDE02-0004 3 1 4 11 15
0305 329 243 201 185 152 148 164 216 235 220
0306 289 305 366 369 327 289_____ _____ _____ _____ _____ _____ _____ _____ _____ _____
618 548 567 554 479 440 165 220 246 235
TotalDevelopmental 3,845 3,955 4,230 4,180 3,516 3,134 3,017 3,738 4,159 3,637
Unduplicated Headcount in Course-based Developmental2,393 2,493 2,471 2,430 2,042 1,812 1,660 1,884 2,070 1,965
Developmental Course Enrollments - Fall Semesters
Del Mar College Statistical Profile 2017/18 47

Developmental Percent Percent Percent Percent Percent Percent AverageGrades Total Grade A Grade B Grade C Grade W Grade I Grade R Grade
Fall 2014 FTIC
English 255 11.0% 27.5% 31.4% 9.8% 0.4% 19.6% 2.70Student Success 402 26.1% 25.4% 17.4% 8.5% 0.0% 22.6% 3.13Integrated Reading & Writing 259 17.0% 24.7% 27.0% 10.8% 0.0% 20.5% 2.85Mathematics 569 23.6% 16.5% 20.4% 9.7% 0.2% 29.7% 3.05Reading 125 18.4% 29.6% 14.4% 13.6% 0.0% 24.0% 3.06
Total 1,610 20.7% 22.8% 22.0% 9.9% 0.1% 24.4% 2.98
Fall 2013 FTICEnglish 388 12.6% 27.8% 31.4% 10.6% 0.3% 17.3% 2.74Student Success 305 30.2% 25.9% 13.8% 16.1% 0.0% 14.1% 3.23Integrated Reading & Writing 95 11.6% 23.2% 29.5% 8.4% 0.0% 27.4% 2.72Mathematics 569 22.5% 17.0% 16.7% 13.7% 0.0% 30.1% 3.10Reading 275 12.4% 22.2% 27.3% 16.0% 0.0% 22.2% 2.76
Total 1,632 19.2% 22.5% 22.2% 13.5% 0.1% 22.5% 2.95
Fall 2012 FTIC
English 387 19.1% 26.6% 24.5% 11.6% 0.0% 18.1% 2.92Student Success 248 44.0% 19.4% 4.4% 15.3% 0.0% 16.9% 3.58Integrated Reading & Writing 35 17.1% 14.3% 37.1% 11.4% 0.0% 20.0% 2.71Mathematics 640 23.4% 20.0% 16.9% 12.0% 0.0% 27.7% 3.11Reading 290 9.0% 32.4% 24.1% 13.8% 0.0% 20.7% 2.77
Total 1,600 22.8% 23.6% 18.6% 12.8% 0.0% 22.3% 3.07
Three Year FTIC Grade Distribution by Discipline for Developmental Courses
0%
5%
10%
15%
20%
25%
Fall 2014 Fall 2013 Fall 2012
Three Year FTIC Course Grade Percentages
Grade A Grade B Grade C Grade W
48 Del Mar College Statistical Profile 2017/18
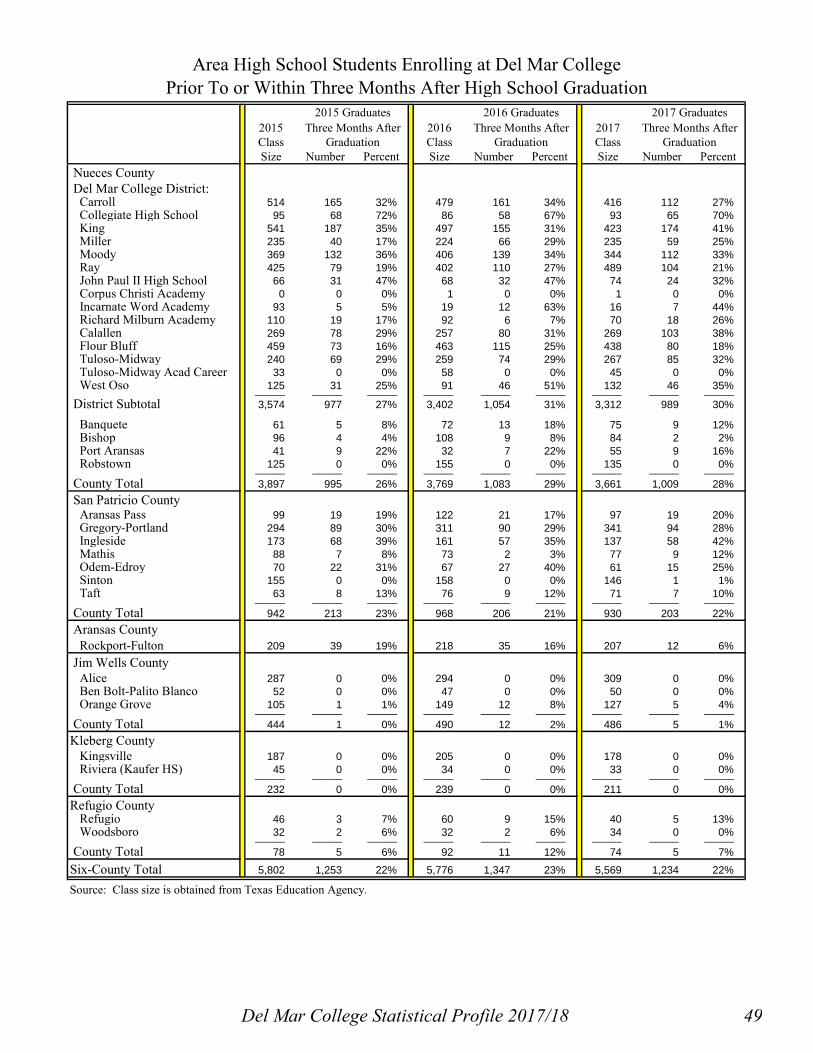
2015 Graduates 2016 Graduates 2017 Graduates2015 Three Months After 2016 Three Months After 2017 Three Months AfterClass Graduation Class Graduation Class GraduationSize Number Percent Size Number Percent Size Number Percent
Nueces County Del Mar College District:
Carroll 514 165 32% 479 161 34% 416 112 27%Collegiate High School 95 68 72% 86 58 67% 93 65 70%King 541 187 35% 497 155 31% 423 174 41%Miller 235 40 17% 224 66 29% 235 59 25%Moody 369 132 36% 406 139 34% 344 112 33%Ray 425 79 19% 402 110 27% 489 104 21%John Paul II High School 66 31 47% 68 32 47% 74 24 32%Corpus Christi Academy 0 0 0% 1 0 0% 1 0 0%Incarnate Word Academy 93 5 5% 19 12 63% 16 7 44%Richard Milburn Academy 110 19 17% 92 6 7% 70 18 26%Calallen 269 78 29% 257 80 31% 269 103 38%Flour Bluff 459 73 16% 463 115 25% 438 80 18%Tuloso-Midway 240 69 29% 259 74 29% 267 85 32%Tuloso-Midway Acad Career 33 0 0% 58 0 0% 45 0 0%West Oso 125 31 25% 91 46 51% 132 46 35%_____ _____ _____ _____ _____ _____ _____ _____ _____
District Subtotal 3,574 977 27% 3,402 1,054 31% 3,312 989 30%
Banquete 61 5 8% 72 13 18% 75 9 12%Bishop 96 4 4% 108 9 8% 84 2 2%Port Aransas 41 9 22% 32 7 22% 55 9 16%Robstown 125 0 0% 155 0 0% 135 0 0%_____ _____ _____ _____ _____ _____ _____ _____ _____
County Total 3,897 995 26% 3,769 1,083 29% 3,661 1,009 28% San Patricio County
Aransas Pass 99 19 19% 122 21 17% 97 19 20%Gregory-Portland 294 89 30% 311 90 29% 341 94 28%Ingleside 173 68 39% 161 57 35% 137 58 42%Mathis 88 7 8% 73 2 3% 77 9 12%Odem-Edroy 70 22 31% 67 27 40% 61 15 25%Sinton 155 0 0% 158 0 0% 146 1 1%Taft 63 8 13% 76 9 12% 71 7 10%_____ _____ _____ _____ _____ _____ _____ _____ _____
County Total 942 213 23% 968 206 21% 930 203 22% Aransas County
Rockport-Fulton 209 39 19% 218 35 16% 207 12 6% Jim Wells County
Alice 287 0 0% 294 0 0% 309 0 0%Ben Bolt-Palito Blanco 52 0 0% 47 0 0% 50 0 0%Orange Grove 105 1 1% 149 12 8% 127 5 4%_____ _____ _____ _____ _____ _____ _____ _____ _____
County Total 444 1 0% 490 12 2% 486 5 1%Kleberg County
Kingsville 187 0 0% 205 0 0% 178 0 0%Riviera (Kaufer HS) 45 0 0% 34 0 0% 33 0 0%_____ _____ _____ _____ _____ _____ _____ _____ _____
County Total 232 0 0% 239 0 0% 211 0 0%Refugio County
Refugio 46 3 7% 60 9 15% 40 5 13%Woodsboro 32 2 6% 32 2 6% 34 0 0%_____ _____ _____ _____ _____ _____ _____ _____ _____
County Total 78 5 6% 92 11 12% 74 5 7%
Six-County Total 5,802 1,253 22% 5,776 1,347 23% 5,569 1,234 22%
Source: Class size is obtained from Texas Education Agency.
Area High School Students Enrolling at Del Mar CollegePrior To or Within Three Months After High School Graduation
Del Mar College Statistical Profile 2017/18 49

2014 Graduates 2015 Graduates 2016 Graduates2014 One Year After 2015 One Year After 2016 One Year AfterClass Graduation Class Graduation Class GraduationSize Number Percent Size Number Percent Size Number Percent
Nueces County Del Mar College District:
Carroll 474 428 90% 514 417 81% 479 418 87%King 562 434 77% 541 344 64% 497 375 75%Miller 210 46 22% 235 84 36% 224 119 53%Moody 393 244 62% 369 267 72% 406 291 72%Ray 445 288 65% 425 203 48% 402 271 67%Corpus Christi Academy 0 0 0% 0 0 0% 1 0 0%Incarnate Word Academy 72 21 29% 93 21 23% 19 9 47%Richard Milburn Academy 247 16 6% 110 39 35% 92 33 36%Calallen 289 157 54% 269 132 49% 257 147 57%Flour Bluff 442 198 45% 459 200 44% 463 275 59%Tuloso-Midway 255 211 83% 240 192 80% 259 189 73%Tuloso-Midway Acad Career 27 0 0% 33 0 0% 58 0 0%West Oso 109 32 29% 125 94 75% 91 80 88%_____ _____ _____ _____ _____ _____ _____ _____ _____
District Subtotal 3,525 2,075 59% 3,413 1,993 58% 3,248 2,207 68%Agua Dulce 0 0 0% 0 0 0% 0 0 0%Banquete 49 13 27% 61 24 39% 72 37 51%Bishop 75 9 12% 96 12 13% 108 31 29%Port Aransas 48 9 19% 41 16 39% 32 10 31%Robstown 145 0 0% 125 0 0% 155 0 0%_____ _____ _____ _____ _____ _____ _____ _____ _____
County Total 3,842 2,106 55% 3,736 2,045 55% 3,615 2,285 63% San Patricio County
Aransas Pass 103 48 47% 99 44 44% 122 53 43%Gregory-Portland 312 169 54% 294 210 71% 311 213 68%Ingleside 132 74 56% 173 103 60% 161 94 58%Mathis 83 9 11% 88 16 18% 73 6 8%Odem 69 43 62% 70 32 46% 67 47 70%Sinton 132 2 2% 155 0 0% 158 0 0%Taft 72 36 50% 63 29 46% 76 25 33%_____ _____ _____ _____ _____ _____ _____ _____ _____
County Total 903 381 42% 942 434 46% 968 438 45% Aransas County
Rockport-Fulton 199 49 25% 209 77 37% 218 49 22% Jim Wells County
Alice 283 0 0% 287 0 0% 294 0 0%Ben Bolt-Palito 44 0 0% 52 0 0% 47 0 0%Orange Grove 123 9 7% 105 10 10% 149 25 17%Premont 0 0 0% 0 0 0% 0 0 0%_____ _____ _____ _____ _____ _____ _____ _____ _____
County Total 450 9 2% 444 10 2% 490 25 5% Kleberg County
Kingsville 189 0 0% 187 0 0% 205 0 0%Riviera (Kaufer HS) 43 0 0% 45 0 0% 34 0 0%_____ _____ _____ _____ _____ _____ _____ _____ _____
County Total 232 0 0% 232 0 0% 239 0 0% Refugio County
Austwell-Tivoli 0 0 0% 0 0 0% 0 0 0%Refugio 51 13 25% 46 13 28% 60 0%Woodsboro 39 0 0% 32 3 9% 32 0%_____ _____ _____ _____ _____ _____ _____ _____ _____
County Total 90 13 14% 78 16 21% 92 0 0% Six-County Total 5,716 2,558 45% 5,641 2,582 46% 5,622 2,797 50%
Source: Class size is obtained from state graduation reports from the Texas Education Agency.
Area High School Graduates Who Have AttendedDel Mar College at Least One Semester as of Fall 2017
50 Del Mar College Statistical Profile 2017/18

Del Mar College Statistical Profile Graduates and Outcomes
Terms and Definitions Cohort
A group of students who can be identified as starting their education at the same time. The cohorts discussed in this book are categorized as entering cohorts. All of the students in these cohorts began their college education at Del Mar College in the same semester.
First-Time-in-College (FTIC)
First-time-in-college (FTIC) students are students who enter the College and have never attended college previously at this or any other postsecondary institution. Dual Credit students are counted as FTICs in the first semester they reenroll at Del Mar College following their high school graduation.
Leaver
An individual who leaves the institution without completing a degree or certificate.
Retention
The number or percentage of students who enter Del Mar College at a specific point in time and continue to return to complete work toward their educational programs. Retention is usually expressed in terms of a time period, such as One-Year Retention or Two-Year Retention.
Highlights
Del Mar College offers an Associate in Arts (AA) degree, an Associate of Arts in Teaching (AAT) degree, and an Associate in Science (AS) degree for students completing a university transfer course plan; an Associate in Applied Science (AAS) degree for completers of a two-year technical degree plan; a Certificate of Achievement for completion of a less-than-two-year technical program; an Enhanced Skills Certificates in designated Tech-Prep programs; and a postbaccalaureate certificate in Long-term Care Administration.
From 1936 through 2017, Del Mar College conferred a total of 61,467 awards: 39,635 degrees and 21,832 certificates. In 2016-2017, Del Mar College students earned 1,822 degrees and certificates. The total of 1,315 associate degrees awarded in 2016-2017 represents the highest number of degrees ever awarded in one academic year.
Of all Del Mar College students who graduated (received degrees and/or certificates) in academic year 2016‑2017, over 33 percent were enrolled in at least one developmental course during their academic careers at the College.
Of the graduates and leavers who transferred to another Texas public postsecondary institution in academic year 2015-2016, 90 percent went on to a senior institution in the Fall of 2016, with the largest number transferring to Texas A&M University–Corpus Christi.
Del Mar College Statistical Profile 2017/18 51

Chapter Summary Graduates
Students at Del Mar College may choose from among 42 Associate in Arts/Science transfer degree plans, 10 Associate of Arts in Teaching degree plans, 59 associate technical degree plans, and 89 technical programs offering certificates of achievement. Eighteen of the technical programs are designated as Tech-Prep.
Del Mar College awarded its first degrees in 1936; a total of 61,467 degrees and certificates have been awarded to Del Mar College students over the last 81 years. Del Mar College students earned 1,315 degrees and 507 certificates in 2016-2017. This annual total of 1,822 degrees and certificates represents a 40 percent increase from the 2006-2007 academic year. The programs with the largest number of graduates in academic year 2016-2017 were liberal arts, business administration nurse education, cosmetology, occupational safety and health, process technology and welding applied technology.
In 2000-2001 the College awarded its first Core Curriculum Completer (CCC) award to 196 students, and CCCs totaled 5456 for the most recent ten years. The first Field of Study (FOS) awards were earned in 2002-2003 by 141 students; to date FOS awards total 2,105. The Marketable Skills Achievement (MSA) award was first conferred in 2004-2005 to three students; another 101 students received this award in academic year 2016-2017.
Women represented 54 percent of the 2016-2017 graduates; about 70 percent of the graduates were members of ethnic minority groups.
Retention and Transfer
From Fall 2016 to Fall 2017, the College’s Fall-to-Fall retention rate in Texas public higher education was 58.7 percent, down by two percent from previous year. The College’s student retention rate compares favorably with the Texas community college average, which is 57.8 percent.
Almost 71 percent of the 2015-2016 Del Mar College academic graduates who transferred chose to attend Texas A&M University-Corpus Christi. When all graduates and leavers from 2015-2016 who transferred are combined, about 52 percent chose Texas A&M University-Corpus Christi.
The combined figures include the influx of summer transient students who return to their primary campuses in the Fall semester. The second most popular transfer destination in 2015-2016 was Texas A&M University, Kingsville. Six Texas universities accounted for over seventy five percent of the 2015-2016 Del Mar College graduates and leavers who transferred.
Developmental Education
About 15 percent of the Fall 2010 first-time-in-college (FTIC) students who began in developmental courses have graduated from Del Mar College after seven years, and 25 percent of the Fall 2010 entering students who were not enrolled in developmental classes have also graduated in the same period. By 2017, 26 percent of Fall 2010 FTIC students in developmental classes graduated and/or transferred compared to 36 percent of Fall 2010 FTIC students not in developmental classes.
Although students not starting in developmental classes generally have higher graduation and transfer rates than those students who do, the retention of students in developmental classes is somewhat higher than those who did not start in developmental education. After seven years, 7.0 percent of Fall 2010 entering students enrolled in developmental work were still enrolled at Del Mar College, compared to just 4.8 percent of the others.
Of all Del Mar College students who graduated (received degrees and/or certificates) in academic year 2016‑2017, about 33% had enrolled in at least one developmental course during their academic careers at the College. A table is included in this chapter that illustrates the numbers and percentages of graduating students by division, academic program, and the developmental subjects and levels in which they were enrolled.
GED Testing
In 2017, 454 examinees took the GED test at the Del Mar College Testing Center. Of those tested, 235 students (52%) passed all segments of the test and were awarded a GED certificate.
52 Del Mar College Statistical Profile 2017/18

Associate Associate Associatein Arts/ of Arts in in AppliedScience Teaching Science Certificate
Arts and Sciences
Liberal Arts AAMexican-American Studies AA
Art Emphasis, Grades 8-12; EC-12 AATArt (Studio) AADrama AA
Advertising/Public Relations AADigital Media AAForeign Language AAJournalism AARadio and Television AASpeech AATeaching EC-6 AAT Journalism Emphasis, Grades 8-12; EC-12 AAT Special Education, Grades 4-8; EC-12 AAT Speech Emphasis, Grades 8-12; EC-12 AAT
English (with emphasis in Literature) AAEnglish (with emphasis in Philosophy) AAEng., Lang. Arts and Reading, Grades 8-12; EC-12 AAT
Kinesiology AA
Mathematics ASMathematics, Grades 8-12; EC-12 AAT
Music Education - Instrumental AAMusic Education - Vocal AAMusic Theory and Composition AASound Recording Technology AAS Sound Recording Business (Level 1) Certificate
Biology (incl: pre-Chiro, pre-Dental, pre-Med, pre-Vet) AABiotechnology AAS CertificateChemistry (incl: pre-Pharmacy, pre-Physical Therapy) AA Chemistry Emphasis Chemical Engineering AS Chemistry Emphasis Natural Gas Engineering ASGeology AALife Science Emphasis, Grades 8-12; EC-12 AATPhysical Science Emphasis, Grades 8-12; EC-12 AATPhysics AS
Kinesiology
Mathematics
Music
Natural Sciences
Course Plans and Program Offerings for Degrees and Certificates
Interdisciplinary Studies
Communications, Languages and Reading
Art and Drama
English and Philosophy
Del Mar College Statistical Profile 2017/18 53

Associate Associate Associatein Arts/ of Arts in in AppliedScience Teaching Science Certificate
Course Plans and Program Offerings for Degrees and Certificates
Geography, Cultural AAGeography, Physical AAHistory AAHistory/Social Studies, Grades 8-12; EC-12 AATPolitical Science AAPsychology AASocial Work AASociology AA
Business and Technology Programs
Accounting Specialist AAS Certificates Business Administration AACourt Reporting AAS CertificatesManagement Development Administrative-Legal Option AAS Certificate Administrative Specialization AAS General Management Specialization AAS Human Resources Certificate Leadership Development Certificate Logistics and Supply Chain Management Certificates Management Development Certificate Office Professional-Legal Certificate Production and Logistics Management AAS Small Business Management CertificateParalegal Studies AAS
Computer Science, Engineering, and Advanced TechnologyComputer Information Systems AS Computer Programming Emphasis AASComputer Programming AS CertificatesEngineering Technology Engineering Technology AAS Certificates Electrical Engineering (with TAMU-K) AS Industrial Engineering AS Mechanical Engineering ASGeographical Information Systems Geographical Information System Emphasis AAS Certificates Geographical Information System (GIS) AS Geographic Information Systems Analyst CertificateDigital Media/Internet Developer Digital Media For Web Design and eLearning AAS CertificatesInformation Technology Computer Programming Certificate Geographical Information System (GIS) Certificate Information Technology Career Foundation Core Certificate Interactive Game Tech and Simulation Certificate Network Support Certificate Digital Media/Web Developer Certificate
Business Administration
Social Sciences
54

Associate Associate Associatein Arts/ of Arts in in AppliedScience Teaching Science Certificate
Course Plans and Program Offerings for Degrees and Certificates
Networking Administration and Information Security Network Administration and Information Security AAS Certificates Networking Technology - Cisco CertificateProfessional Electronics Avionics Electronics Technology Specialty AAS Certificates Ramp Tech Certificate
Environmental/Petrochemical Lab Technology AAS CertificateElectroplating Applied Technology CertificateIndustrial Machining Applied Tech. AAS CertificateIndustrial Machining Applied Tech.-Millwright AAS CertificateNondestructive Testing Technology AAS CertificateProcess Technology AAS CertificateProcess Technology-Industrial Instrumentation AAS CertificatesWelding Applied Technology AAS Certificates
Criminal Justice AA CertificateCriminal Justice Technology Police Science Option AAS Certificate Basic Peace Officer Certificate Intermediate Police Officer CertificateEmergency Medical Technician Paramedic AAS CertificatesFire Science-Basic Firefighting Option AAS CertificateOccupational Safety and Health AAS
Air Conditioning Applied Technology AAS CertificatesArchitectural/Drafting Technology Architecture AS Technical Drafting Specialization AAS Certificates Architectural Technology Specialization AAS Construction Technology Specialization AASAuto Body Applied Technology AAS CertificatesAutomotive Applied Technology AAS CertificatesAviation Maintenance Airframe Applied Technology AAS Certificates Power Plant Applied Technology AAS CertificateBuilding Maintenance Applied Technology AAS CertificatesDiesel Applied Technology AAS Certificates
Health and Human Sciences Programs
Health Information Technology AAS Coding Specialist CertificateMedical Laboratory Technology AASOccupational Therapy Assistant AAS CertificatePharmacy Technician AAS CertificatePhysical Therapist Assistant AASPre-Medical Technology AARespiratory Therapy AASSurgical Technology AAS Certificate
Allied Health
Industrial Education
Public Safety Education
Technology Education
Del Mar College Statistical Profile 2017/18 55

Associate Associate Associatein Arts/ of Arts in in AppliedScience Teaching Science Certificate
Course Plans and Program Offerings for Degrees and Certificates
Dental Assisting AAS CertificateDental Hygiene AASDiagnostic Medical Sonography AASEchocardiography AASNuclear Medicine Technology AASRadiologic Technology AAS Certificate Mammography Registry Preparation Certificate Computed Tomography Certificate
American Sign Language and Interpreting Program American Sign Language/Deaf Studies AA Deaf Studies Certificate Interpreter Preparation AASChild Development/Early Childhood AAS Certificate CD/ Early Childhood Education Assistant AAS CD/Early Childhood Administrator Level II CertificateCosmetology CertificateCulinary Arts Baking/Pastry Specialization AAS Cook/Baker Certificate Culinary Arts (Chef Training) AASHospitality Management AAS CertificateHuman Services Addiction Studies in Human Services AAS Generalist Studies in Human Services AAS Human Services Certificate Long Term Care Nursing Home Administrator Post BA Cert
LVN-RN Transition AASRegistered Nurse Education AA AASVocational Nurse Education Certificate
Note: AA and AS are transfer degrees.
Dental and Imaging Technology
Human Sciences and Education
Nurse Education
56

Year Degrees Certificates Total Year Degrees Certificates Total1935 to 1945 226 226 1987-88 690 197 8871946 to 1955 911 172 1,083 1988-89 632 153 7851955 to 1960 774 612 1,386 1989-90 575 172 7471960-61 158 123 281 1990-91 494 156 6501961-62 186 155 341 1991-92 623 202 8251962-63 208 172 380 1992-93 659 344 1,0031963-64 194 220 414 1993-94 619 379 9981964-65 214 187 401 1994-95 617 380 9971965-66 255 216 471 1995-96 563 400 9631966-67 294 295 589 1996-97 576 412 9881967-68 281 328 609 1997-98 659 419 1,0781968-69 405 360 765 1998-99 668 319 9871969-70 370 365 735 1999-00 728 296 1,0241970-71 495 392 887 2000-01 712 359 1,0711971-72 536 531 1,067 2001-02 744 378 1,1221972-73 588 566 1,154 2002-03 791 389 1,1801973-74 600 456 1,056 2003-04 791 453 1,2441974-75 774 470 1,244 2004-05 868 447 1,3151975-76 640 532 1,172 2005-06 957 499 1,4561976-77 637 551 1,188 2006-07 902 401 1,3031977-78 722 478 1,200 2007-08 1,018 315 1,3331978-79 670 486 1,156 2008-09 1,113 423 1,5361979-80 597 372 969 2009-10 1,033 456 1,4891980-81 581 457 1,038 2010-11 1,096 539 1,6351981-82 691 427 1,118 2011-12 988 493 1,4811982-83 550 371 921 2012-13 1,100 555 1,6551983-84 508 373 881 2013-14 993 454 1,4471984-85 668 385 1,053 2014-15 1,016 394 1,4101985-86 590 231 821 2015-16 1,125 447 1,5721986-87 647 211 858 2016-17 1,315 507 1,822
Total 39,635 21,832 61,467
Degrees and Certificates Awarded 1935-2017
0
100
200
300
400
500
600
700
800
900
1,000
1,100
1,200
1,300
1,400
1,500
1,600
1,700
1,800
1,900Del Mar College Awards by Type and Academic Year
Degrees Certificates
Del Mar College Statistical Profile 2017/18 57

2007-08 2008-09 2009-10 2010-11 2011-12 2012-13 2013-14 2014-15 2015-16 2016-17
Arts and Sciences
Advertising/Public Relations 5 5 5 10 3 0 3 7 5 3Art Studio 7 17 9 8 11 9 19 11 15 17Biology 2 2 5 0 4 1 7 2 0 0Chemistry 1 0 1 0 1 1 2 2 0 0Digital Media 2 0 1 1 2 1 3 4 1 4Drama 3 1 3 0 5 2 0 3 1 5English 14 11 11 11 7 11 8 7 5 4Foreign Languages 7 3 3 15 11 19 8 8 4 6History 4 7 7 9 3 5 2 2 1 4IDS: Art Education 1 0 0 1 0 1 1 0 0 0IDS: Bilingual Education 0 1 IDS: Health Studies (Kinesiology) 3 6 2IDS: Music Education Instrumental/Vocal 3 4 0 0 0 2 2 0 4 9Journalism 9 8 9 6 6 4 7 9 4 4Kinesiology 12 14 16 16 19 9 19 19 18 20Liberal Arts 128 125 166 199 201 292 180 182 192 222Mathematics 2 1 0 1Mexican American Studies 1 0 1 0 2Music Applied 2 1 1 0 4 1 2 6 2 0Music Theory and Composition 1 2 1 0 0 1 0 0 0 1Physics 1 1 2 3 0 2 0 0 0 0Political Science 7 4 2 2 3 4 2 4 1 0Psychology 26 40 21 32 42 24 30 21 30 20Radio and Television 3 7 6 11 5 3 9 5 3 7Social Work 10 6 1 7 11 8 5 9 9 9Sociology 10 8 8 12 10 6 3 0 6 3Speech 0 3 6 1 1 5 2 3 11 6
Business, Industrial and Public Safety EducationBusiness Administration 68 64 51 62 56 65 80 65 103 101Criminal Justice 28 43 42 43 24 31 28 40 47 34Architecture 2 2 2
Health Sciences and Professional EducationCIS: Management Information Systems 1 1 1 1Electrical Engineering 1 1IDS: Deaf Education Emphasis 2 1 1 0 4 4 3 3 1 1IDS: Early Childhood Emphasis 11 1Pre-Nursing 2 1 1 2 1 1 0 4 0 0Pre-Medical Technology 1 0 0Registured Nurse Education 1 36 49
Total AA Degrees 376 389 385 453 434 513 425 418 501 533
Associate in Arts Transfer Degrees Conferred by Declared Majors
58 Del Mar College Statistical Profile 2017/18

2007-08 2008-09 2009-10 2010-11 2011-12 2012-13 2013-14 2014-15 2015-16 2016-17
Arts and Sciences
Art Education, Grades EC-12 1 2 4 1 4 3 1 2 2 4Bilingual Generalist EC-4 1 3EC-6 7 11 11 10 7 26English Language Arts and Reading 1 3 0 3 1 3 4 2 0 1Generalist (Grade 4-8) 1 1 2History/Social Studies, Grades 8-12 2 4 10 3 1 1 2 0 0 1Journalism, Grades 4-8 2Languages 3 9 2 0 0 1Life-Earth Science 0 0 0 0 1 0 0 1 0 0Mathematics 2 0 2 3 0 1 3 0 0
Music Education - Instrumental/Vocal 2 1 1Special Education, Grades EC-12 4 0 1 2 6 2Speech, Grades EC-12 1 0 1 0
Health Sciences and Professional Education
Early Childhood Emph - 4th Grade Sp. 33 40 19 26 3Special Education, EC - 12 1 5 2 1Physical Science Emph, EC - 12 1 0 0
Total AAT Degrees 44 70 43 36 24 19 21 21 16 34
2007-08 2008-09 2009-10 2010-11 2011-12 2012-13 2013-14 2014-15 2015-16 2016-17
Arts and Sciences
Biology 6 2 9 12 8 4 11 10 5 11Chemistry 3 3 4 3 4 0 7 10 4 12Geology 1 0 0 0 0 2 2 4 1Mathematics 1 2 2 8 3 9 17 19 18 15Physics 4 5 2 1 3 4 1 2
Business, Industrial and Public Safety Education
Architecture 1 1
Health Sciences and Professional Education
Computer Information Systems 0 0 1 0 0 0 2 1 3 1Computer Programming 1 1 0 2 0 1 7 6Electrical Engineering 1 0 1 0 0 0 2 5 2 1Geographic Info Systems 1 2Industrial Engineering 1 0
Mechanical Engineering 7 4 7
Total AS Degrees 11 8 22 29 17 16 44 59 51 59
Total Transfer Degrees 431 467 450 518 475 548 490 498 568 626
Associate of Arts in Teaching Degrees Conferred by Declared Majors
Associate in Science Transfer Degrees Conferred by Declared Majors
Del Mar College Statistical Profile 2017/18 59
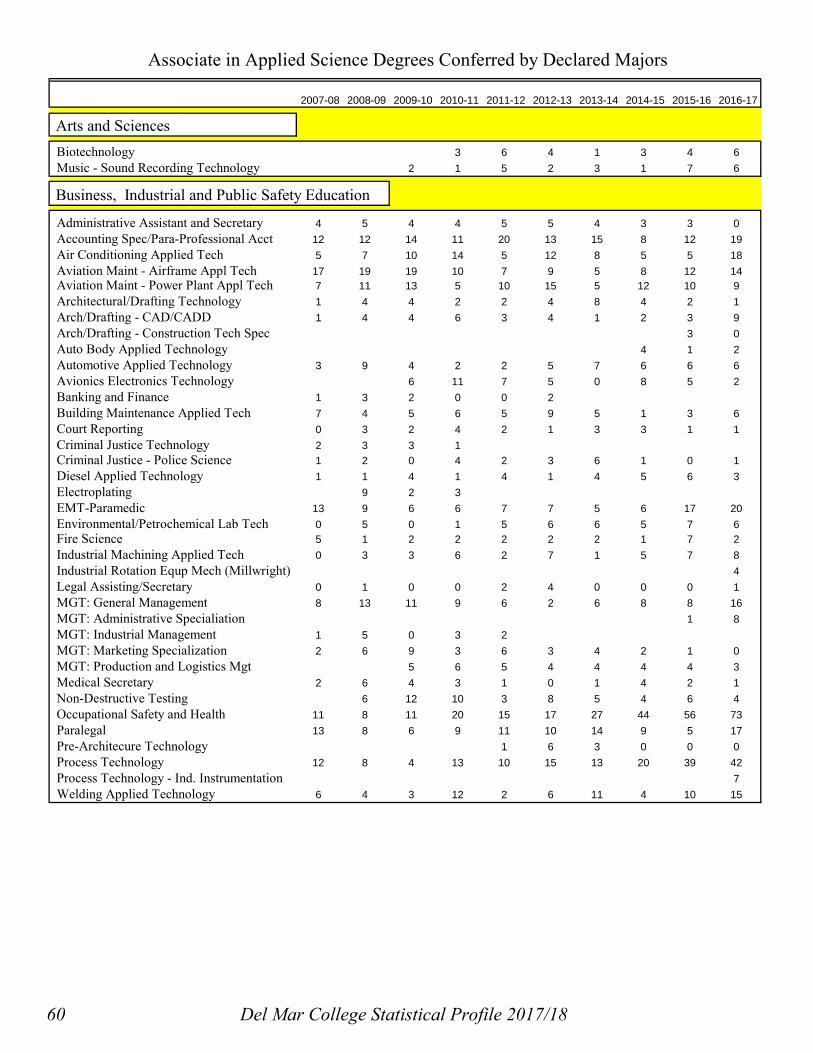
2007-08 2008-09 2009-10 2010-11 2011-12 2012-13 2013-14 2014-15 2015-16 2016-17
Arts and SciencesBiotechnology 3 6 4 1 3 4 6Music - Sound Recording Technology 2 1 5 2 3 1 7 6
Business, Industrial and Public Safety Education
Administrative Assistant and Secretary 4 5 4 4 5 5 4 3 3 0Accounting Spec/Para-Professional Acct 12 12 14 11 20 13 15 8 12 19Air Conditioning Applied Tech 5 7 10 14 5 12 8 5 5 18Aviation Maint - Airframe Appl Tech 17 19 19 10 7 9 5 8 12 14Aviation Maint - Power Plant Appl Tech 7 11 13 5 10 15 5 12 10 9Architectural/Drafting Technology 1 4 4 2 2 4 8 4 2 1Arch/Drafting - CAD/CADD 1 4 4 6 3 4 1 2 3 9Arch/Drafting - Construction Tech Spec 3 0Auto Body Applied Technology 4 1 2Automotive Applied Technology 3 9 4 2 2 5 7 6 6 6Avionics Electronics Technology 6 11 7 5 0 8 5 2Banking and Finance 1 3 2 0 0 2Building Maintenance Applied Tech 7 4 5 6 5 9 5 1 3 6Court Reporting 0 3 2 4 2 1 3 3 1 1Criminal Justice Technology 2 3 3 1Criminal Justice - Police Science 1 2 0 4 2 3 6 1 0 1Diesel Applied Technology 1 1 4 1 4 1 4 5 6 3Electroplating 9 2 3EMT-Paramedic 13 9 6 6 7 7 5 6 17 20Environmental/Petrochemical Lab Tech 0 5 0 1 5 6 6 5 7 6Fire Science 5 1 2 2 2 2 2 1 7 2Industrial Machining Applied Tech 0 3 3 6 2 7 1 5 7 8Industrial Rotation Equp Mech (Millwright) 4Legal Assisting/Secretary 0 1 0 0 2 4 0 0 0 1MGT: General Management 8 13 11 9 6 2 6 8 8 16MGT: Administrative Specialiation 1 8MGT: Industrial Management 1 5 0 3 2MGT: Marketing Specialization 2 6 9 3 6 3 4 2 1 0MGT: Production and Logistics Mgt 5 6 5 4 4 4 4 3Medical Secretary 2 6 4 3 1 0 1 4 2 1Non-Destructive Testing 6 12 10 3 8 5 4 6 4Occupational Safety and Health 11 8 11 20 15 17 27 44 56 73Paralegal 13 8 6 9 11 10 14 9 5 17Pre-Architecure Technology 1 6 3 0 0 0Process Technology 12 8 4 13 10 15 13 20 39 42Process Technology - Ind. Instrumentation 7Welding Applied Technology 6 4 3 12 2 6 11 4 10 15
Associate in Applied Science Degrees Conferred by Declared Majors
60 Del Mar College Statistical Profile 2017/18

2007-08 2008-09 2009-10 2010-11 2011-12 2012-13 2013-14 2014-15 2015-16 2016-17
Health Sciences and Professional EducationComputer Information Systems 4 2CIS: Computer Programming 1 3 3 3 3 1 4 1 4 1CIS: Data Base Emphasis 2 2 1CIS: Digital Media and Web Design 4 3 2 1 3 0 6CIS: Geographic Info Systems 3 4 0 4 1 1 0 0 0 1CIS: Microcomputers for Business/ Geograph 1 0 2 0 0 0 2 2 1 3CIS: Multimedia Emphasis 2 8 3 0 1CIS: Network Support and Admin & Info Sec 12 30 18 24 17 16 12 15 12 15CIS: Security Associate 7 8 6 8 1 0 0 1 0 0CIS: Object Oriented Programming 3 2Culinary Arts 22 23 13 10 24 21 18 11 14 19Dental Assisting 3 4 2 3 1 10 5 8 9 6Dental Hygiene 21 21 22 25 19 25 19 24 23 25Diagnostic Medical Sonography 15 13 10 10 10 9 10 7 6 5Early Childhood Administrator 8 4 5 1Early Childhood Specialist 13 8 7 10 9 12 17 17 9 14Early Childhood Education Assistant 0 2 2 1 0 1 1 0 3 2Echocardiography 5 5 5 4 5 5 4 2 4Electronic/Computer-Network Tech 6 10 6 3 2 2 5 5 5 2Engineering Technology 1 7 5Generalist Studies 5 2 3 2 4 1 0Health Information Technology 7 4 5 9 4 3 10 10 2 6Hotel/Motel Management 1 2 3 3 0 1 7 3 9 8Human Services 3 1 0 1 2Human Services/Addiction 6 3 3 11 7 3 8 7 3 7Human Services/Intergeneration 6 8 3 1Interpreter Preparation 0 2 2 4 5 5 7 4 6 3Licensed Vocation Nursing - Bridge 6 10Medical Laboratory Technology 6 6 8 3 11 10 14 10 7 12Nuclear Medicine Technology 7 6 5 8 6 8 6 8 6 6Occupational Therapy Assistant 18 20 17 21 19 19 21 20 21 19Pharmacy Technology 4 1 4 4 3 6 3 4 4 4Physical Therapist Assistant 13 21 18 22 20 18 20 21 22 21Radiologic Technology 22 26 23 18 16 18 16 19 18 18Registered Nurse Education 212 187 181 134 133 134 86 92 78 110Respiratory Therapy 12 17 13 18 14 13 16 15 16 16Restaurant Management 5 1 5 4 5 6 1 1 0 0Surgical Technology 7 11 13 11 7 7 10 11 10 11
Total AAS Degrees 584 646 581 574 502 552 503 518 557 689
Associate in Applied Science Degrees Conferred by Declared Majors
Del Mar College Statistical Profile 2017/18 61

2007-08 2008-09 2009-10 2010-11 2011-12 2012-13 2013-14 2014-15 2015-16 2016-17
Arts and Sciences Biotechnology 3 4 8 2 5 3 6Music-Sound Recording Business 1 0 3 2 2 2 1 5
Business, Industrial and Public Safety Education
Accounting Technician 11 7 11 8 15 7 9 6 9 19Air Conditioning Applied Tech 43 36 30 60 36 50 28 11 23 32Aviation Maint - Airframe Appl Tech 15 14 10 8 5 8 3 4 2 6Aviation Maint - Power Plant Appl Tech 6 7 11 4 3 10 4 8 0 4ARCH/DRAFT: Architectural Tech 1 15ARCH/DRAFT: Computer Aided Drafing 7 2ARCH/DRAFT: Technical Drafting 2 3 8 7 17 21 20 14 13 2ARCH/DRAFT: Pipe Drafting Tech 5 9Auto Body Applied Technology 2 13 17 6 11 10 4 19 18 4Automotive Applied Technology 22 46 33 23 43 42 44 25 14 12Avionics Electronics Technology 13 15 18 0 17 20 3Banking 5 4 3 2 0 4Basic Peace Officer 8 28 69 48 26 42 42 31 36 28Building Maintenance Applied Tech 10 8 9 18 17 19 10 3 8 10Court/Information Reporting 2 9 5 9 2 19 3 9 8 16Court Reporting/Captioning (ESC) 3 1 0 1 3 2 1Criminal Justice Technology 8 3 1 3 2Diesel Applied Technology/Eng Spec 12 16 19 14 19 13 20 22 20 14Emergency Medical Services 10 2 1 4 4 14 8 6 14 5Environmental/Petrochem Lab Tech (ESC) 2 0 0 1 3 0 1 1 0Fire Science/Fire fighter 3 10 5 40 26 7 2 11 1 41General Office/Office Assist 8 12 5 7 3 9 7 10 2 0Industrial Machining Applied Tech 6 13 20 17 18 23 7 7 3 10Industrial Rotation Equp Mech (Millwright) 4Legal Professions- Admin Assistant 1 4 4 1 1 3 0MGT: Industrial Management 7 13MGT: Leadership Development 7 7 9 9 6 3 4 4 3 13MGT: Logistics and Supply Chain Mgt 10 17 3 2 5 1 3 1MGT: Professional Sales 4 3 6 4 3 1 1 1 1 0MGT: Quality Assurance/Control Management 1 3 3 1MGT: Real Estate 2 2 2 1 1MGT: Small Business Management 7 2 9 9 0 4 1 5 5 8Medical Insurance Billing 1 4 4 1 0Medical Secretary Specialist 2 5 4 0 1Non-Destructive Testing 4 13 11 6 14 9 4 5 3Process Technology 20 23 32 41 41 55 34 28 50 59Welding Applied Technology 14 23 36 55 30 40 67 37 67 61
Health Sciences and Professional EducationChild Care Practitioner 0 1Computer Information Systems 1 9Computer Information Systems (ESC) 0 0 0 2CIS:Career Foundation Core 1 4 2 0 1 1 0 0CIS:Computer Programming 1 1 2 1 3 1 2 1 3 3CIS:Computer Programming (ESC) 1 0 0 1CIS:Geographic Information System 1 2 5 0 0 0 5 2 0 3CIS Interactive Game Tech 1 1 0 0 0 3 0 4 4CIS:LAN Technology (ESC) 1 5 0 3 2 0 0 0 1 0CIS:Multimedia 0 3 3 3 3 0 0 7 1 0
Certificates Awarded by Occupational Programs
62 Del Mar College Statistical Profile 2017/18

2007-08 2008-09 2009-10 2010-11 2011-12 2012-13 2013-14 2014-15 2015-16 2016-17CIS:Networking Technology 2 3 2 12 8 6 15 7 6 1Cosmetology 20 32 14 22 29 31 33 32 43 41Culinary Arts 7 5 1 4 18 4 4 3 3 2Deaf Studies 3 3 1 2 4 5 6 8 2 1Dental Assisting 11 11 13 13 18 21 15 10 7 2Dgital Media 5Early Childhood Administrator 0 1 2 1 2 0 4 0 1 0Early Childhood Specialist 2 2 0 1 2 1 3 1 2 2Electronic/Computer-Network Tech 7 8 3 6 4 5 3 1 3 10Engineering Technology Spec 2 8 5Instrumentation Electronics 1 1Health Information Technology 11 5 6 3 3 2 5 4 1 3Hotel/Motel Management 0 2 1 0 0 2 0 0 2 7Human Services 1 0 0 0 1 2 3 1 0 0Long Term Care Nursing Home Admin 1 3 0 0 0 0 0 2 2Pharmacy Technology 2 0 1 0 0 0 1 0Radiologic Technology (ESC) 7 4 9 8 6 8 2 7Restaurant Management 2 2 1 1 3 4 1 0 0 0Surgical Technology 10 5 4 5 6 3 2 2 3 1Vocational Nurse Education 1 5 4 4 5 6 1 5 3 14
Total Certificates 318 423 456 539 493 555 454 394 447 507
Grand Total Degrees and Certificates 1,333 1,536 1,487 1,631 1,470 1,655 1,447 1,410 1,572 1,822
Note: ESC = Enhanced Skills Certificate
2007-08 2008-09 2009-10 2010-11 2011-12 2012-13 2013-14 2014-15 2015-16 2016-17
Core Curriculum Completer (CCC)
Liberal Arts 318 363 348 482 646 780 922 838 537 222
Field of Study (FOS)
Criminal Justice 45 49 35
IDS: Middle School Education 7
Management Development 42 54 19 69 19 29 11Registered Nurse Education 211 185 177 135 159 55
Marketable Skills Achievement (MSA)Accounting Clerk (Bookkeeper) 2 10 13
Aviation Maint- Aiframe Applied Tech 1 1 0 0 0 2 0 0
Computer Info Systems-Foundation 1 0 17
Geographic Information Systems 5 9 8 2 2 5 4 22 11 0
Emergency Medical Technician 4 1 2 2 2 11 4 6 9 51
MGT: Management Development 1 0 3 6 20
MGT: Supply Chain Management 8 3 8 14 6 1 0 2 3 0MGT: Quality Management 0 0 2 3 2 1 1 0 0 0
Medical Office Skills 5 1 0
Office Skills 12 11 5 3 0
Total Other Awards 546 561 546 688 871 885 1,011 950 658 369
Certificates Awarded by Occupational Programs
Other Awards Conferred by Declared Majors
Del Mar College Statistical Profile 2017/18 63

Degrees Cert Total Degrees Cert Total Degrees Cert TotalBlack, non-Hispanic male 14 6 20 8 9 17 24 8 32Black, non-Hispanic female 17 1 18 21 2 23 31 7 38
Total Black, non-Hispanic 31 7 38 29 11 40 55 15 70
Hispanic male 238 187 425 295 198 493 302 232 534Hispanic female 379 97 476 409 109 518 536 102 638
Total Hispanic 617 284 901 704 307 1011 838 334 1172
Asian, Pacific Islander male 12 2 14 15 1 16 9 7 16Asian, Pacific Islander female 14 0 14 18 2 20 13 5 18
Total Asian, Pacific Islander 26 2 28 33 3 36 22 12 34
Indian, Alaskan native male 2 0 2 2 0 2 0 0 0Indian, Alaskan native female 3 1 4 1 1 2 2 0 2
Total Indian, Alaskan native 5 1 6 3 1 4 2 0 2
White, non-Hispanic male 118 61 179 143 82 225 144 88 232White, non-Hispanic female 169 18 187 180 36 216 214 44 258
Total White, non-Hispanic 287 79 366 323 118 441 358 132 490
Other/Unknown male 29 14 43 12 6 18 17 10 27Other/Unknown female 21 7 28 21 1 22 23 4 27
Total Other/Unknown 50 21 71 33 7 40 40 14 54
Total male 413 270 683 475 296 771 496 345 841 Total female 603 124 727 650 151 801 819 162 981
% female 59.4% 31.5% 51.6% 57.8% 33.8% 51.0% 62.3% 32.0% 53.8%
Total minority 679 294 973 769 322 1091 917 361 1278% minority 66.8% 74.6% 69.0% 68.4% 72.0% 69.4% 69.7% 71.2% 70.1%
Grand Total 1,016 394 1,410 1,125 447 1,572 1,315 507 1,822
2016-17
Three-Year Summary of Degrees and Certificates Conferred by Gender and Race/Ethnic Origin
2014-15 2015-16
66.8%
74.6%68.4%
72.0%69.7% 71.2%
59.4%
31.5%
57.8%
33.8%
62.3%
32.0%
0%
10%
20%
30%
40%
50%
60%
70%
80%
90%
100%
Degrees Certificates
Graduates by Type of Award by Percent Minority and Female
2014-15Minority
2015-16Minority
2016-17Minority
2014-15Female
2015-16Female
2016-17Female
64 Del Mar College Statistical Profile 2017/18

by Type, Ethnicity/Race, and GenderBlack Hispanic White Other Total Total
Award M F M F M F M F M F Grads
Division of Arts and SciencesArt Emphasis, Grades 8-12; EC-12 AAT 1 1 2 1 3 4Drama AA 3 2 3 2 5Studio Art AA 1 1 8 2 4 1 3 14 17 ___ ___ ___ ___ ___ ___ ___ ___ ___ ___
Art and Drama Total 0 1 5 9 2 8 0 1 7 19 26
Advertising/Public Relations AA 2 1 0 3 3Digital Media AA 1 2 1 3 1 4Foreign Languages AA 1 3 1 1 2 4 6Journalism AA 1 1 2 2 2 4Radio and Television AA 1 2 2 2 4 3 7Special Education, Grades 4-8; EC-12 AAT 1 1 1 1 2Speech AA 2 1 3 2 4 6Speech Emphasis, Grades 8-12; EC-12 AAT 0 0 0Teaching Grades EC-6 AAT 1 2 19 3 1 3 23 26 ___ ___ ___ ___ ___ ___ ___ ___ ___ ___ ___
2 1 9 25 6 14 0 1 17 41 58
Liberal Arts AA 4 7 42 109 13 36 4 7 63 159 222Mexican American Studies AA 2 0 2 2 ___ ___ ___ ___ ___ ___ ___ ___ ___ ___ ___
Interdisciplinary Studies 4 7 42 111 13 36 4 7 63 161 224
English Emphasis AA 1 1 2 1 3 4English Emphasis, Grades 8-12; EC-12 AAT 1 0 1 1 ___ ___ ___ ___ ___ ___ ___ ___ ___ ___ ___
English and Philosophy Total 0 0 0 1 1 2 0 1 1 4 5
Kinesiology AA 1 1 4 12 1 1 6 14 20 ___ ___ ___ ___ ___ ___ ___ ___ ___ ___ ___
Kinesiology Total 1 1 4 12 0 0 1 1 6 14 20
Mathematics AS 5 5 3 2 10 5 15 ___ ___ ___ ___ ___ ___ ___ ___ ___ ___ ___
Mathematics Total 0 0 5 5 3 0 2 0 10 5 15
Music (Applied) AA 5 2 1 1 6 3 9Music Education AA 1 1 0 1Sound Recording Technology AAS 3 1 2 5 1 6Sound Recording Business Cert 4 1 5 0 5 ___ ___ ___ ___ ___ ___ ___ ___ ___ ___ ___
Music Total 0 0 13 3 4 0 0 1 17 4 21
Biology AS 2 3 1 2 1 2 7 4 11Biotechnology AAS 1 2 2 1 1 5 6Biotechnology Cert 1 1 2 2 1 5 6Chemistry AS 2 7 1 1 1 3 9 12Geology AS 1 1 0 1Physics AS 1 1 2 0 2 ___ ___ ___ ___ ___ ___ ___ ___ ___ ___ ___
Natural Sciences Total 2 0 9 10 3 7 1 6 15 23 38
History AA 1 2 1 3 1 4History/Social Studies Emp AAT 1 1 0 1Political Science AA 0 0 0Psychology AA 2 11 1 6 3 17 20Social Work AA 2 1 4 2 1 8 9Sociology AA 1 2 1 2 3 ___ ___ ___ ___ ___ ___ ___ ___ ___ ___ ___
Social Sciences Total 0 2 4 18 4 8 1 0 9 28 37
Arts and Sciences Total 9 12 91 194 36 75 9 18 145 299 444
Summary of Degrees and Certificates Awarded for 2016-2017
Communication, Languages & Reading Total
Del Mar College Statistical Profile 2017/18 65

by Type, Ethnicity/Race, and GenderBlack Hispanic White Other Total Total
Award M F M F M F M F M F Grads
Summary of Degrees and Certificates Awarded for 2016-2017
Division of Business, Industrial and Public Safety EducationAccounting Spec/Paraprof Accountant AAS 2 14 1 2 3 16 19Accounting Technician Cert 3 12 1 3 4 15 19Administrative Assistant/Secretary AAS 0 0 0Admin Office Assistant/Clerk Cert 0 0 0Business Administration AA 2 1 12 52 12 17 1 4 27 74 101Court Reporting AAS 1 0 1 1Court/Information Reporting Cert 1 2 8 1 3 1 3 13 16Judicial Realtime/Captioning ESC 1 0 1 1Legal Professions/Paralegal AAS 1 13 2 2 1 17 18Legal Professions Cert 0 0 0Management Development AAS 1 4 15 2 5 7 20 27Management Development Cert 1 5 11 2 3 8 14 22Medical Secretary AAS 1 0 1 1Medical Secretary/Insurance Billing Cert 0 0 0Professional Sales Cert 0 0 0 ___ ___ ___ ___ ___ ___ ___ ___ ___ ___ ___
Business Administration Total 4 2 29 128 19 35 1 7 53 172 225
Enviro/Petrochemical Lab Tech AAS 4 2 4 2 6Enviro/Petrochemical Lab Tech ESC 0 0 0Industrial Machining Appl Tech AAS 7 5 12 0 12Industrial Machining Appl Tech Cert 10 3 1 13 1 14Nondestructive Testing AAS 1 2 1 2 2 4Nondestructive Testing Cert 2 1 2 1 3Process Technology AAS 1 24 3 11 3 36 6 42Process Technology Cert 1 38 2 16 1 1 56 3 59Welding Applied Technology AAS 5 1 7 2 12 3 15Welding Applied Technology Cert 41 3 9 6 2 52 9 61 ___ ___ ___ ___ ___ ___ ___ ___ ___ ___ ___
*Industrial Education Total 2 0 132 14 52 13 3 0 189 27 216
Basic Peace Officer Cert 16 1 9 1 1 26 2 28Criminal Justice AA 1 1 9 14 5 4 15 19 34EMS: Paramedic AAS 6 4 9 1 15 5 20EMS: Paramedic Cert 1 3 1 4 1 5Fire Science AAS 2 2 0 2Basic Firefighter Cert 1 20 4 12 1 2 1 35 6 41Occupation Safety and Health Tech AAS 1 37 17 11 7 49 24 73Police Science AAS 1 1 0 1 ___ ___ ___ ___ ___ ___ ___ ___ ___ ___ ___
Public Safety Education Total 3 1 90 40 51 15 3 1 147 57 204
Air Conditioning Applied Tech AAS 13 1 4 17 1 18Air Conditioning Applied Tech Cert 23 6 1 2 31 1 32Auto Body Applied Technology AAS 1 1 2 0 2Auto Body Applied Technology Cert 7 3 10 0 10Automotive Applied Technology AAS 1 2 3 6 0 6Automotive Applied Technology Cert 4 1 1 5 1 6
* Aviation Maint-Airframe Appl Tech AAS 7 5 2 14 0 14* Aviation Maint-Airframe Appl Tech Cert 1 3 2 6 0 6* Aviation Maint-Power Plant Appl Tech AAS 5 3 1 9 0 9* Aviation Maint-Power Plant Appl Tech Cert 3 1 4 0 4* Avionics AAS 1 1 2 0 2* Avionics Cert 1 1 1 3 0 3* Architecture AA 1 1 2 0 2* Architecture AS 1 0 1 1* Architectural/Drafting Tech AAS 6 2 1 1 6 4 10* Drafting Technology Cert 1 14 4 1 5 1 2 16 12 28
Building Maintenance Appl Tech AAS 3 1 2 5 1 6Building Maintenance Appl Tech Cert 7 3 10 0 10Diesel Applied Technology AAS 2 1 3 0 3Diesel Engines/Systems Spec. Cert 9 4 1 14 0 14 ___ ___ ___ ___ ___ ___ ___ ___ ___ ___ ___
Technology Education Total 2 1 105 10 44 7 14 3 165 21 186
11 4 356 192 166 70 21 11 554 277 831
* Industrial Education and Technical Education Departments were re-aligned in Fall 2015.
Business, Industrial and Public Safety Education Total
66 Del Mar College Statistical Profile 2017/18

by Type, Ethnicity/Race, and GenderBlack Hispanic White Other Total Total
Award M F M F M F M F M F Grads
Summary of Degrees and Certificates Awarded for 2016-2017
Division of Health Sciences and Professional EducationHealth Information Technology AAS 5 1 0 6 6Health Information Technology Cert 2 1 1 2 3Medical Laboratory Tech AAS 1 3 3 1 3 1 4 8 12Occupational Therapy Assistant AAS 1 2 11 3 1 1 4 15 19Pharmacy Technician AAS 4 0 4 4Pharmacy Technician Cert 0 0Physical Therapist Assistant AAS 3 10 1 7 4 17 21Respiratory Therapy AAS 1 2 6 1 6 3 13 16Surgical Technology AAS 1 3 5 1 1 2 9 11Surgical Technology Cert 1 0 1 1 ___ ___ ___ ___ ___ ___ ___ ___ ___ ___ ___
Allied Health Total 1 2 11 44 4 25 2 4 18 75 93
Computer Programming AAS 0 0 0Computer Programming AS 1 3 4 0 4Computer Programming Cert 1 1 0 1CIS: Computer Information Systems AS 1 1 0 1CIS: Geographic Information Syst AS 2 2 0 2CIS: Geographic Information Systems AAS 1 1 1 2 1 3CIS: Geographic Information Systems Cert 1 2 1 3 1 4CIS: Interactive Game Technology Cert 1 1 2 4 0 4CIS: Network Support Administration AAS 7 3 2 2 1 10 5 15CIS: Networking Technology-CISCO Cert 6 2 1 1 7 3 10CIS: Network Support Cert 1 1 1 3 0 3Comp-Network Electronics Tech AAS 2 2 0 2Comp-Network Electronics Tech AS 0 0 0Comp-Network Electronics Tech Cert 0 0 0Comp Programming Specialization AAS 1 0 1 1Comp Programming AS 1 1 1 1 2Digital Media Essentials Cert 2 3 5 5Digital Media and Web Design AAS 1 1 4 1 5 6Engineering - Electrical AS 1 1 0 1Engineering: Industrial AS 0 0Engineering - Mechanical AS 5 1 1 7 0 7Engineering Technology AAS 3 2 5 0 5Engineering Technology Cert 4 1 5 0 5Instrumentation Cert 1 1 0 1Process Tech - Ind. Instrumentation AAS 3 4 7 0 7 ___ ___ ___ ___ ___ ___ ___ ___ ___ ___
3 3 43 16 17 3 4 0 67 22 89
Dental Assisting AAS 2 4 0 6 6Dental Assisting Cert 2 0 2 2Dental Hygiene AAS 1 1 13 9 1 1 24 25Health Information Tech - Coding CERT 0 0 0Diagnostic Medical Sonography AAS 1 1 3 1 4 5Echocardiography AAS 4 0 4 4Nuclear Medicine AAS 4 2 0 6 6Radiologic Technology AAS 1 8 2 6 1 3 15 18Rad Tech (Comp Tomography) ESC 4 2 1 4 3 7 ___ ___ ___ ___ ___ ___ ___ ___ ___ ___ ___
Dental and Imaging Technology Total 0 1 6 30 3 31 0 2 9 64 73
Computer Science, Engineering and Advanced Technology Total
Del Mar College Statistical Profile 2017/18 67

by Type, Ethnicity/Race, and GenderBlack Hispanic White Other Total Total
Award M F M F M F M F M F Grads
Summary of Degrees and Certificates Awarded for 2016-2017
American Sign Lang/Deaf Studies AA 1 0 1 1ASL/Interpreter Preparation AAS 3 0 3 3ASL/Interpreter Prep/Deaf Studies Cert 1 0 1 1Child Developm/Early Child Admin AAS 2 10 1 1 0 14 14Child Developm/Early Child Admin Cert 0 0 0Child Developm/Early Childhood AAS 2 0 2 2Child Developm/Early Childhood Cert 2 0 2 2Cosmetology Cert 3 32 5 1 0 41 41Culinary Arts AAS 2 7 1 5 4 3 16 19Culinary Arts Cert 1 1 0 2 2Generalist Studies AAS 0 0 0Hospitality Management AAS 1 1 1 3 2 4 4 8Hospitality Management Cert 1 1 3 2 3 4 7Human Services AAS 1 4 2 1 6 7Long Term Care Nurs Home Adm. ATC 1 1 2 0 2 ___ ___ ___ ___ ___ ___ ___ ___ ___ ___ ___
Human Sciences and Education Total 1 5 5 63 3 22 4 6 13 96 109
Licensed Vocational Nurse Cert 1 3 8 1 1 4 10 14
LV-RN Bridge Track AAS AAS 9 1 0 10 10Pre-Nursing AA 2 5 5 24 1 9 1 2 9 40 49Registered Nurse Education AAS 4 6 14 58 2 21 2 3 22 88 110 ___ ___ ___ ___ ___ ___ ___ ___ ___ ___ ___
Nurse Education Total 7 11 22 99 3 32 3 6 35 148 183
12 22 87 252 30 113 13 18 142 405 547
Grand Total 32 38 534 638 232 258 43 47 841 981 1,822
Health Sciences and Professional Education Total
68 Del Mar College Statistical Profile 2017/18

2015-2016 Del Mar College Graduates and Leavers Transferring to Texas Public Institutions of Higher Education as of Fall 2016
Graduates Leaversby Type of Major 1 by Type of Major 2 % of
Academic Technical Academic Technical Tech-Prep Total Total
Public Senior InstitutionsTexas A&M University-Corpus Christi 169 21 685 875 46%Texas A&M University 1 151 152 8%Texas A&M University-Kingsville 25 1 171 197 10%The University of Texas at Austin 5 80 85 4%The University of Texas at San Antonio 11 1 100 112 6%Texas State University-San Marcos 8 1 110 119 6%The University of Texas at Arlington 3 1 11 15 <1%University of North Texas 1 16 17 <1%Sam Houston State University 1 12 13 <1%University of Houston- Clear Lake 1 17 18 <1%Tarlenton State University 1 1 7 9 <1%University of Houston- Downtown 2 15 17 <1%Lamar University 1 5 6 <1%The University of Texas-Pan American 5 5 <1%University of Houston-Victoria 6 6 <1%University of Texas at Dallas 7 7 <1%Lamar University 3 3 <1%Texas A&M University-Gaveston 1 4 5 <1%Texas Womans University 3 3 <1% All Other Public Senior Institutions 9 1 25 35 2%
Public Senior Institution Totals 237 29 1,433 0 0 1,699 90%474
Public Community and Technical CollegesBlinn College 21 21 1%Austin Community College 19 1 1 21 1%Coastal Bend College 20 14 34 2%Northwest Vista College-Alamo CCD 7 7 <1%San Antonio College-Alamo CCD 5 2 7 <1%Houston Community College 1 3 3 <1%Victoria College 12 1 13 <1%South Texas College 1 6 3 9 <1%CyFair College-Lone Star CCD 2 2 <1%St. Philips College-Alamo CCD 1 1 <1%Palo Alto College-Alamo CCD 1 1 <1%Wharton County Junior College 3 3 <1%Montgomery College-Lone Star CCD 2 2 <1%Laredo Community College 1 2 3 <1% All other community colleges 1 30 23 2 55 3%
Public Community College Total 3 1 133 44 4 185 10%
Public Health Institutions 1 5 6 <1%
Total Transfers 241 30 1,571 44 4 1,890 100%
2015-2016 Graduates reenrolled at Del Mar College, Fall 2016 66 66
Source: The Texas Higher Education Coordinating Board, On-demand Student Tracking System. The tracking system matches the IDs of students who were enrolled at Del Mar College during the fall of 2015, spring 2016, or summer 2016 semesters and who did not reenroll in fall 2016 with the fall 2016 student enrollments reported by all Texas public higher education institutions. Graduates who earned more than one award during the academic year and then transferred are counted only once.1 Of most recent major declared at Del Mar College2 Of major declared at transfer school
All percentages of the total are rounded to the nearest whole number.
Del Mar College Statistical Profile 2017/18 69

Fall-to-Fall Retention of Texas PublicCommunity College Students
Total Fall-to-Enrolled at Enrolled at Enrolled at Fall Retention
Same Other Senior in Texas PublicTracking Period Institution 2-Year College Institution Higher Education
Fall 2006 to Fall 2007Del Mar College 48.9% 1.8% 10.1% 60.7%
Texas Community Colleges 40.4% 5.4% 12.5% 58.4%
Fall 2007 to Fall 2008Del Mar College 47.8% 2.2% 10.9% 60.9%
Texas Community Colleges 40.5% 5.6% 12.7% 58.9%
Fall 2008 to Fall 2009Del Mar College 48.9% 2.0% 11.0% 61.9%
Texas Community Colleges 42.1% 5.8% 12.7% 60.6%
Fall 2009 to Fall 2010Del Mar College 48.6% 1.7% 11.4% 61.7%
Texas Community Colleges 41.7% 5.9% 12.3% 60.0%
Fall 2010 to Fall 2011Del Mar College 48.0% 1.5% 9.9% 59.4%
Texas Community Colleges 40.5% 6.0% 11.7% 58.2%
Fall 2011 to Fall 2012Del Mar College 45.8% 1.8% 10.8% 58.4%
Texas Community Colleges 38.7% 6.1% 11.9% 56.7%
Fall 2012 to Fall 2013Del Mar College 45.9% 1.7% 10.8% 58.4%
Texas Community Colleges 38.7% 6.1% 11.6% 56.4%
Fall 2013 to Fall 2014Del Mar College 46.1% 1.5% 11.2% 58.8%
Texas Community Colleges 39.1% 6.3% 12.2% 57.6%
Fall 2014 to Fall 2015Del Mar College 47.8% 1.4% 10.7% 59.9%
Texas Community Colleges 39.6% 6.2% 12.3% 58.0%
Fall 2015 to Fall 2016Del Mar College 48.1% 1.5% 11.2% 60.8%
Texas Community Colleges 40.1% 5.7% 12.6% 58.4%
Fall 2016 to Fall 2017Del Mar College 46.4% 1.4% 11.0% 58.7%
Texas Community Colleges 39.7% 5.4% 12.7% 57.8%
Source: Texas Higher Education Coordinating Board Student Migration Report
70 Del Mar College Statistical Profile 2017/18

GraduatedFall Spring Fall Spring Fall Spring Fall Spring Fall Spring Fall Spring Fall Spring Fall Graduation or
Entering Students 2010 2011 2011 2012 2012 2013 2013 2014 2014 2015 2015 2016 2016 2017 2017 Rate 1 Transferred 2
Fall 2010 Cohort 1,522 73.5% 50.1% 43.8% 32.9% 27.7% 22.9% 18.8% 14.5% 11.8% 10.9% 9.1% 8.1% 7.0% 5.9% 19.6% 30.6%#DIV/0! In Developmental Ed. 787 75.0% 49.9% 42.3% 35.1% 29.5% 25.7% 21.1% 15.2% 12.3% 11.4% 8.9% 8.0% 7.5% 7.0% 14.9% 26.0%
Not in Developmental Ed. 735 71.8% 50.3% 45.3% 30.6% 25.9% 19.9% 16.3% 13.7% 11.2% 10.3% 9.4% 8.3% 6.5% 4.8% 24.8% 35.5%
Spring 2011 Cohort 722 45.4% 38.2% 26.7% 22.9% 17.6% 15.4% 13.3% 11.5% 10.4% 8.2% 6.2% 6.1% 6.0% 12.5% 22.7%#DIV/0! #DIV/0! In Developmental Ed. 402 47.0% 38.6% 24.9% 22.4% 18.7% 15.9% 14.2% 11.7% 10.9% 8.2% 7.0% 7.0% 6.2% 9.0% 18.9%
Not in Developmental Ed. 320 43.4% 37.8% 29.1% 23.4% 16.3% 14.7% 12.2% 11.3% 9.7% 8.1% 5.3% 5.0% 5.6% 16.9% 27.5%
Fall 2011 Cohort 1,502 74.6% 48.5% 39.5% 30.6% 25.9% 20.2% 17.3% 15.3% 12.6% 11.7% 10.0% 8.7% 16.4% 30.4%##### #DIV/0! In Developmental Ed. 802 74.1% 45.3% 36.7% 31.0% 25.6% 21.3% 18.6% 16.2% 13.3% 13.2% 11.3% 9.7% 12.8% 23.4%
Not in Developmental Ed. 700 75.3% 52.1% 42.7% 30.0% 26.3% 18.9% 15.9% 14.3% 11.9% 9.9% 8.4% 7.4% 20.6% 38.4%
Spring 2012 Cohort 539 46.2% 38.6% 27.6% 26.9% 20.8% 15.6% 12.6% 13.0% 9.5% 8.2% 7.1% 12.8% 23.2%#DIV/0! In Developmental Ed. 315 45.4% 41.3% 28.9% 28.9% 23.2% 17.1% 14.6% 13.7% 9.5% 8.6% 8.6% 10.2% 19.0%
Not in Developmental Ed. 224 47.3% 34.8% 25.9% 24.1% 17.4% 13.4% 9.8% 12.1% 9.4% 7.6% 4.9% 16.5% 29.0%
Fall 2012 Cohort 1,237 74.2% 50.5% 41.6% 33.3% 28.1% 23.4% 19.7% 17.1% 14.7% 13.7% 14.6% 27.1% In Developmental Ed. 667 74.2% 49.6% 41.5% 34.6% 30.7% 26.8% 23.5% 19.8% 17.1% 16.5% 11.1% 21.9%
Not in Developmental Ed. 570 74.2% 51.6% 41.8% 31.8% 25.1% 19.3% 15.3% 14.0% 11.9% 10.5% 18.8% 33.2%
Spring 2013 Cohort 490 47.8% 37.6% 29.4% 23.3% 18.6% 16.9% 12.7% 11.0% 10.6% 11.6% 23.1% In Developmental Ed. 250 45.2% 34.8% 28.4% 22.4% 18.4% 16.0% 14.0% 12.8% 14.8% 5.6% 12.8%
Not in Developmental Ed. 240 50.4% 40.4% 30.4% 24.2% 18.8% 17.9% 11.3% 9.2% 6.3% 17.9% 33.8%
Fall 2013 Cohort 1,218 74.5% 52.5% 46.7% 35.6% 31.2% 27.0% 21.5% 15.7% 15.4% 27.9% In Developmental Ed. 619 72.9% 50.6% 44.6% 35.5% 29.6% 27.6% 22.3% 16.6% 9.2% 18.9%
Not in Developmental Ed. 599 76.3% 54.4% 48.9% 35.6% 32.9% 26.4% 20.7% 14.7% 21.9% 37.2%
Spring 2014 Cohort 506 51.0% 43.7% 30.6% 28.7% 23.1% 21.3% 14.4% 10.7% 20.2% In Developmental Ed. 273 51.3% 45.1% 32.2% 31.1% 24.2% 24.5% 13.9% 8.8% 15.8%
Not in Developmental Ed. 233 50.6% 42.1% 28.8% 25.8% 21.9% 17.6% 15.0% 12.9% 25.3%
Fall 2014 Cohort 1247 77.0% 54.3% 46.1% 36.6% 30.1% 21.7% 13.6% 16.5% In Developmental Ed. 541 73.0% 51.0% 42.0% 34.8% 29.2% 22.9% 5.0% 13.5%
Not in Developmental Ed. 706 80.0% 56.8% 49.3% 38.0% 30.7% 20.8% 20.3% 33.0%
Spring 2015 Cohort 461 52.1% 44.3% 31.2% 23.6% 19.1% 7.6% 18.2% In Developmental Ed. 221 53.8% 47.5% 34.4% 27.6% 22.2% 2.3% 11.3%
Not in Developmental Ed. 240 50.4% 41.3% 28.3% 20.0% 16.3% 12.5% 24.6%
Fall 2015 Cohort 1187 76.7% 54.6% 43.6% 34.1% 3.6% 12.9% In Developmental Ed. 707 77.9% 55.9% 43.8% 35.5% 6.1% 9.2%
Not in Developmental Ed. 480 74.8% 52.7% 43.1% 32.1% 8.1% 18.3%
Spring 2016 Cohort 471 54.6% 44.8% 33.1% 2.8% 10.4% In Developmental Ed. 267 52.8% 45.3% 35.2% 0.4% 4.1%
Not in Developmental Ed. 204 56.9% 44.1% 30.4% 5.9% 18.6%
Fall 2016 Cohort 1318 77.3% 54.5% 0.6% 5.8% In Developmental Ed. 763 76.4% 52.3% 0.0% 4.5%
Not in Developmental Ed. 555 78.6% 57.5% 1.4% 7.7%
Spring 2017 Cohort 496 57.7% 0.6% 5.6%
In Developmental Ed. 265 57.0% 0.0% 3.4%
Not in Developmental Ed. 231 58.4% 1.3% 8.2%
Fall 2017 Cohort 1211 0.0% 4.2%
In Developmental Ed. 687 0.0% 2.9%
Not in Developmental Ed. 524 0.0% 5.9%
2 Awarded a degree or certificate from Del Mar College or enrolled in another Texas public college or university as of Fall 2017
1 Awarded a degree or certificate from Del Mar College as of Fall 2017
Retention and Graduation Rates for First-Time-In-College Students by Cohort
Source: Each semester, students entering Del Mar College who have no prior college experience are identified as that semester's first-time-in-college (FTIC) cohort. Transfer and graduation data from the Texas Higher Education Coordinating Board's statewide data system is merged with the cohort files. This methodology of updating defined cohorts makes it possible to study the persistence and completion rates of groups of students over time. Dual credit students are counted as FTICs when and if they reenroll at Del Mar College following their high school graduation. Includes full- and part-time students.
Semester Enrolled
Del Mar College Statistical Profile 2017/18 71

0%
10%
20%
30%
40%
50%
60%
70%
80%
90%
100%
Fall 2010 FTIC Student Retention by SemesterThrough Fall 2017
In Developmental Ed. Not in Developmental Ed.
14.9%
22.0%
26.0%24.8%
26.1%
35.5%
0%
10%
20%
30%
40%
50%
Graduated Transferred Graduated or Transferred
Fall 2010 FTIC Student Graduation and Transfers Ratesas of Fall 2017
In Developmental Ed. Not in Developmental Ed.
72 Del Mar College Statistical Profile 2017/18

AwardTotal
AwardsENGL
0305/06ENGL 0307
MATH 0370
MATH 0371
MATH 0373
READ 0305
READ 0306
INRW 0408
AA in Arts and Sciences 346 19 13 26 46 34 5 17 4 104 30.1%AA in Business, Industrial and Public Safety Education 137 10 14 9 22 30 4 7 4 63 46.0%
AA in Health Sciences and Professional Education 50 2 5 1 12 7 0 2 0 22 44.0% ______ _____ _____ _____ _____ _____ _____ _____ _____ _____ _______
Total AA Degrees 533 31 32 36 80 71 9 26 8 189 35.5%
AAT in Arts and Sciences 34 2 3 3 11 5 1 2 2 19 55.9% ______ _____ _____ _____ _____ _____ _____ _____ _____ _____ _______
Total AAT Degrees 34 2 3 3 11 5 1 2 2 19 55.9%
AS in Arts and Sciences 41 6 1 2 4 1 2 4 2 11 26.8%
AS in Health Sciences and Professional Education 18 1 0 0 0 2 0 0 1 3 16.7% ______ _____ _____ _____ _____ _____ _____ _____ _____ _____ _______
Total AS Degrees 59 7 1 2 4 3 2 4 3 14 23.7%
Total Transfer Degrees 626 40 36 41 95 79 12 32 13 222 35.5%
AAS in Arts and Sciences 12 0 1 1 0 3 0 1 0 4 33.3%
AAS in Business, Industrial and Public Safety Education 311 31 15 38 35 33 16 12 25 106 34.1%AAS in Health Sciences and Professional Education 366 24 20 25 52 47 14 21 4 133 36.3% ______ _____ _____ _____ _____ _____ _____ _____ _____ _____ _______
Total AAS Degrees 689 55 36 64 87 83 30 34 29 243 35.3%
Certificates in Arts and Sciences 11 0 1 1 1 2 0 1 0 4 36.4%
Certificates in Business, Industrial and Public Safety Education 382 25 8 26 38 16 17 10 15 75 19.6%
Certificates in Health Sciences and Professional Education 114 7 5 7 7 8 1 7 3 24 21.1% ______ _____ _____ _____ _____ _____ _____ _____ _____ _____ _______
Total Certificates 507 32 14 34 46 26 18 18 18 103 20.3%
Grand Total Degrees and Certificates 1,822 127 86 139 228 188 60 84 60 568 31.2%
Unduplicated Totals 1,501 495 33.0%
Percentages by program include students who earned multiple awards. Does not include FOS, CCC, or MSA awards.
Del Mar College 2016-2017 Graduates by Initial Developmental Subject and LevelLowest-Level Developmental Course Attempted Undup
Total in Dev
Undup Percent in Dev
35.5%
55.9%
23.7%
35.5% 35.3%
20.3%
33.0%
0%
10%
20%
30%
40%
50%
60%
AA Degrees AAT Degrees AS Degrees All Transfer… AAS Degrees Certificates All…
Percent of 2015-2016 Graduates Enrolled in Developmental Coursesby Type of Award
Del Mar College Statistical Profile 2017/18 73

2008 2009 2010 2011 2012 2013 2014 2015 2016 2017
Passing 685 718 693 530 631 636 62 183 224 235
Not passing 406 467 423 321 269 311 213 209 216 219___________ ___________ ___________ ___________ ___________ ___________ ___________ ___________ ___________ ___________
Total Examinees 1,091 1,185 1,116 851 900 947 275 392 440 454
Percent Passing 63% 61% 62% 62% 70% 67% 23% 47% 51% 52%
Number of Persons Attempting the GED at Del Mar College
General Educational Development Testing Program
In 2014, Del Mar College had a significant decrease in the number of GED examinees due to the administration of the new fifth-generation test, increase in the cost, changes to public school exam TASKS to STARS, and large number of examinees whocompleted their tests in 2013 before the expiration. The 2017 GED passing rate for Del Mar College was 52 percent. Forty-fivepercent of Del Mar examinees were motivated to take the test for educational gain and 22 percent took the test for work-relatedreasons. Twenty-four percent of examinees took the GED test for personal satisfaction.
Young adults (between the ages of 20 and 24) accounted for 22 percent of examinees at Del Mar College. Females accountedfor 57 percent of examinees. Seventy-six percent of Del Mar College examinees were members of racial or ethnic minoritygroups, with Hispanic or Latino examinees accounting for 62 percent.
The General Educational Development program began in 1942 and is designed to provide candidates an opportunity to earn ahigh school equivalency diploma or certificate. GED tests are sponsored by the American Council on Education, Washington,D.C. All 50 states use GED test results as the basis for issuing high school equivalency credentials. Del Mar College has beendesignated as an official GED testing center under the direction of the Texas Education Agency and the American Council onEducation. Neighboring GED centers are located in Kingsville, Alice, Beeville, and Victoria.
The highest volume of test takers (1,712) in the 60-year history of the GED program attempted the GED battery during 2001because the fourth generation of the GED battery of tests became effective January 1, 2002, and score requirements for passingthe test were revised. Administration of the fifth-generation of GED testing was implemented on January 1, 2014. The newfifth-generation GED test is a much more rigorous test which now includes content derived from national common corecurriculum standards and has moved away from pencil and paper based testing to computer based testing. The new fifth-generation GED test also increased in price from $75 to $135.
0
200
400
600
800
1,000
1,200
2008 2009 2010 2011 2012 2013 2014 2015 2016 2017
General Educational Development Testing Program
Not passing
Passing
74 Del Mar College Statistical Profile 2017/18

Del Mar College Statistical Profile
Contact Hours Terms and Definitions
Contact Hours A measure of time that a student spends in a class or in contact with a faculty member, such as in a lab. Contact hours are based primarily on an estimate of clock hours spent in instructional activities.
Credit Contact Hours
Contact hours attempted or earned in a course taken for college credit.
Non-credit Contact Hours
Contact hours attempted or earned in continuing education courses not taken for college credit. Continuing education courses are generally offered through the Division of Workforce and Economic Development.
Reimbursable Contact Hours
Contact hours attempted or earned in continuing education courses that are included in the state’s counts for funding purposes.
Non-Reimbursable Contact Hours Contact hours attempted or earned in continuing education courses that are not included in the state’s counts for funding purposes.
Highlights
Annual credit contact hours increased by 5.1 percent from 2015-2016 to 2016-2017.
State-reimbursable continuing education contact hours increased by 3.1 percent, while TWC-reimbursable contact hours decreased by 55.9 percent, and non-reimbursable contact hours increased by 71.9 percent, resulting overall in a 29.4 percent decrease in continuing education contact hours in 2016-2017.
In the last year, the combined total of credit and continuing education contact hours increased by 12 percent, from 5,120,149 in 2015-2016 to 5,736,710 in 2016-2017.
Fall 2017 contact hours in credit courses decreased by 2.4 percent compared to Fall 2016.
Del Mar College Statistical Profile 2017/18 75

Chapter Summary Annual Contact Hours
Annual credit contact hours increased by 5.1 percent (+231,636 hours) between academic years 2015-2016 and 2016-2017, while annual contact hours in continuing education classes decreased 29.4 percent (-404,418 hours) during the same period. The combined increase of 616,561 contact hours resulted in an overall increase of 12 percent for the 2016 2017 academic year.
Out of 17 academic departments, the largest increase in annual contact hours from 2014-2015 to 2015-2016 was in Industrial Education (+26.3%) with a gain of 73,280 contact hours. The largest decrease of 12.6 percent (-40,160 hours) was in the Department of Public Safety.
Only two of the eight departments in the Division of Arts and Sciences experienced a decrease in annual contact hours from 2014-2015 to 2015-2016, resulting in a 3.6 percent increase for the division. Of the four departments in the Division of Business, Industrial, and Public Safety Education, only one experienced a decrease in annual contact hours. The Public Safety department decreased by 12.6 percent resulting in an increase of 10.3 percent for the division. Of the five departments in the Division of Health Sciences and Professional Education, only two departments experienced a decrease in contact hours. The Department of Dental and Imaging Techology decreased by 8.2 percent while the Human Sciences and Education Department retracted by 2.6 percent, totaling up to a 2.6 percent rise in division contact hours.
Annual contact hours in developmental courses increased by 6.2 percent from 2015-2016 to 2016-2017.
Contact hours from enrollment in courses attempted for the third time or more decreased by 4.2 percent, developmental hours in excess of the 27-hour limit increased by one percent from 2015-2016 and 2016-2017, resulting in an overall increase of 0.3 percent for the total annual contact hours not funded by state appropriations.
Fall Contact Hours
With respect to Fall-to-Fall changes, four of the 17 departments had an increase in contact hours in Fall 2016, resulting in an overall decrease of 2.4 percent from Fall of 2016 to Fall of 2017.
Of the eight departments in the Division of Arts and Sciences, all eight experienced a decrease in contact hours in Fall 2017. The Department of Social Science had the greatest decrease (-9.6%), while the Department of Kinesiology had the smallest decrease (-1.9%), resulting in an overall decrease of 3.8 percent from Fall 2016 to Fall 2017. Two of the four departments in the Division of Business, Industrial and Public Safety Education had an increase in contact hours from Fall 2016 to Fall 2017. Industrial Education programs increased the most by 5.6 percent since the previous Fall, while the Department of Public Safety Education had the largest decrease of 13.4 percent, resulting in an overall decrease of 0.7 percent for the division. Two of the five departments in the Division of Health Sciences and Professional Education had an increase in contact hours from Fall 2016 to Fall 2017. Nurse Education programs increased the most, by 4.9 percent since last Fall, while the largest decrease was in the department of Dental and Imaging Technology (-4.5%), resulting in a largely unchanged total for the division, a decrease of 0.3 percent. Developmental contact hours for Fall 2017 decreased by 12.8 percent compared to Fall 2016. Non-funded contact hours for Fall 2017 decreased by 13.7 percent from the previous Fall.
Note
All disciplines have been organized with current and historical data subtotaled by the instructional departments as they currently exist. In addition, some historical records have been modified in order to group courses under their current titles rather than under previous titles. These changes are intended to facilitate a more accurate longitudinal record for individual disciplines.
76 Del Mar College Statistical Profile 2017/18

Annual Contact Hour Totals by Division
1 Yr %2010-11 2011-12 2012-13 2013-14 2014-15 2015-16 2016-17 Change
Credit Courses
Arts and Sciences 2,995,584 2,873,328 2,634,304 2,477,168 2,368,768 2,458,400 2,546,640 3.6%
Business, Industrial andPublic Safety Education* 1,230,784 1,100,160 1,014,192 1,002,096 1,014,240 1,152,496 1,271,440 10.3%
Health Sciences andProfessional Education*
1,225,565 1,115,008 1,041,320 958,656 932,620 923,616 948,068 2.6%
Total Credit Hours 5,451,933 5,088,496 4,689,816 4,437,920 4,315,628 4,534,512 4,766,148 5.1%
Continuing Education Courses
State-Reimbursable 169,525 175,467 302,851 317,063 318,802 492,590 508,523 3.2%
TWC-Reimbursable 108,157 211,453 221,674 244,995 230,362 825,350 363,997 -55.9%
Non-Reimbursable 46,929 38,489 60,234 12,646 36,473 57,040 98,042 71.9%
Total Continuing Ed. Hours 324,611 425,409 584,759 574,704 585,637 1,374,980 970,562 -29.4%
Grand Total 5,776,544 5,413,107 5,115,225 5,022,679 4,890,332 5,120,149 5,736,710 12.0%
* Prior to re-alignment in Fall 2015 was part of Division of Business, Professional and Technology Education.
0
500,000
1,000,000
1,500,000
2,000,000
2,500,000
3,000,000
2010-11 2011-12 2012-13 2013-14 2014-15 2015-16 2016-17
Annual Contact Hours by Division
Arts andSciences
Business, Industrial andPublic Safety Education
Health Sciences andProfessional Education
ContinuingEducation
Del Mar College Statistical Profile 2017/18 77

Arts and Sciences DivisionAnnual Contact Hour Totals by Department
1 Yr %2010-11 2011-12 2012-13 2013-14 2014-15 2015-16 2016-17 Change
Art and Drama 173,296 160,960 160,672 148,384 132,528 132,320 137,840 4.2%
Communications, Languages, and Reading
310,640 298,832 255,952 236,480 222,496 248,704 252,128 1.4%
English and Philosophy 594,688 565,648 509,568 464,880 398,784 411,760 434,528 5.5%
Kinesiology 166,944 160,944 158,160 140,448 119,904 104,304 102,432 -1.8%
Mathematics 463,248 452,336 420,992 395,424 386,144 404,608 429,152 6.1%
Music 140,176 118,048 97,056 99,664 110,976 114,688 105,984 -7.6%
Natural Sciences 528,496 542,528 505,968 489,824 476,848 481,888 499,360 3.6%
Social Sciences 618,096 574,032 525,936 502,064 521,088 560,128 585,216 4.5%
Total Arts and Sciences 2,995,584 2,873,328 2,634,304 2,477,168 2,368,768 2,458,400 2,546,640 3.6%
0 100,000 200,000 300,000 400,000 500,000 600,000 700,000
Art and Drama
Communications,Languages,
and Reading
English andPhilosophy
Kinesiology
Mathematics
Music
Natural Sciences
Social Sciences
Annual Contact Hour Totals by Department within Arts and Sciences Division
2014-15
2015-16
2016-17
78 Del Mar College Statistical Profile 2017/18

Business, Industrial and Public Safety Education DivisionAnnual Contact Hour Totals by Department
1 Yr %
2010-11 2011-12 2012-13 2013-14 2014-15 2015-16 2016-17 Change
Business Administration 327,200 299,408 272,224 246,640 245,728 243,088 259,584 6.8%
Industrial Education** 233,040 223,168 233,872 247,328 278,544 351,824 459,456 30.6%
Public Safety Education 332,816 276,960 258,256 280,640 254,432 319,264 279,104 -12.6%
Technology Education** 337,728 300,624 249,840 227,488 235,536 238,320 273,296 14.7%
1,230,784 1,100,160 1,014,192 1,002,096 1,014,240 1,152,496 1,271,440 10.3%
* Prior to re-alignment in Fall 2015 was "Business and Technology Programs" under the Division of Business, Professional and Technology Education.
** Industrial Education and Technology Education Departments were re-aligned in Fall 2015, so totals will differ in prior Statistical Profiles.
Total Business, Industrial and Public Safety Education*
0 100,000 200,000 300,000 400,000 500,000
Business Administration
Industrial Education
Public Safety Education
Technology Education
Annual Contact Hour Totals by Departmentwithin Business, Industrial and Public Safety Education Division
2014-15
2015-16
2016-17
Del Mar College Statistical Profile 2017/18 79

Health Sciences and Professional Education DivisionAnnual Contact Hour Totals by Department
1 Yr % 2010-11 2011-12 2012-13 2013-14 2014-15 2015-16 2016-17 Change
Allied Health 250,405 239,728 231,336 193,248 178,152 169,888 182,312 7.3%
Computer Science, Engineering,and Advanced Technology**
280,520 254,080 251,424 258,000 231,496 234,048 238,124 1.7%
Dental and Imaging Technology 147,296 153,680 151,616 148,528 142,704 134,784 123,760 -8.2%
Human Sciences and Education 286,096 249,984 247,440 221,456 215,664 212,560 206,992 -2.6%
Nurse Education 261,248 217,536 159,504 137,424 164,604 172,336 196,880 14.2%
1,225,565 1,115,008 1,041,320 958,656 932,620 923,616 948,068 2.6%
* Prior to re-alignment in Fall 2015 was "Health and Human Services Programs" under the Division of Business, Professional and Technology Education.
** Prior to re-alignment CSEAT Department was part of Business and Technology Programs.
In fall 2016 Health Science program moved from Nurse Education Department to Allied Health Department.
Total Health Sciences and Professional Education*
0 100,000 200,000 300,000
Allied Health
Computer Science,Engineering, and
Advanced Technology
Dental and ImagingTechnology
Human Sciencesand Education
Nurse Education
Annual Contact Hour Totals by Departmentwithin Health Sciences and Professional Education Division
2014-15
2015-16
2016-17
80 Del Mar College Statistical Profile 2017/18

Contact Hours by Discipline and Semester1 Yr %
2011-12 2012-13 2013-14 2014-15 2015-16 2016-17 2017-18 Change
Division of Arts and Sciences
Department of Art and DramaArt Fall 50,448 49,584 47,328 36,432 33,408 32,592 27,792 -14.7%(ARTS) Spring 51,024 48,528 44,736 31,536 30,960 30,432
Sum I 7,584 7,488 3,840 3,648 3,024 2,928Sum II 1,776 2,160 2,448 3,168 2,592 2,592_______ _______ _______ _______ _______ _______
110,832 107,760 98,352 74,784 69,984 68,544
Drama Fall 22,592 21,904 19,968 23,168 29,200 30,800 33,216 7.8%(DRAM) Spring 23,680 23,680 22,064 22,752 23,536 27,648
Sum I 1,296 1,488 2,816 7,264 5,472 6,000Sum II 2,560 5,840 5,184 4,560 4,128 4,848_______ _______ _______ _______ _______ _______
50,128 52,912 50,032 57,744 62,336 69,296
Art and Drama Fall 73,040 71,488 67,296 59,600 62,608 63,392 61,008 -3.8% Department Spring 74,704 72,208 66,800 54,288 54,496 58,080 Total Sum I 8,880 8,976 6,656 10,912 8,496 8,928
Sum II 4,336 8,000 7,632 7,728 6,720 7,440_______ _______ _______ _______ _______ _______160,960 160,672 148,384 132,528 132,320 137,840
Department of Communications, Languages, and ReadingCommunications Fall 8,000 7,792 7,680 6,752 7,376 8,736 8,848 1.3%(COMM) Spring 9,328 8,576 8,432 7,632 8,736 7,936
Sum I 0 0 0 0 624 816Sum II 96 576 1,056 384 0 384_______ _______ _______ _______ _______ _______
17,424 16,944 17,168 14,768 16,736 17,872
English for Speakers of Fall 9,840 5,712 5,488 5,424 2,240 2,016 0 -100.0% Other Languages Spring 6,864 4,544 4,736 1,456 14,368 3,776(ESOL) Sum I 0 0 0 4,736 1,408 2,432
Sum II 0 0 0 0 0 0_______ _______ _______ _______ _______ _______16,704 10,256 10,224 11,616 18,016 8,224
French Fall 1,488 1,040 1,296 0 640 1,120 960 -14.3%(FREN) Spring 0 560 0 0 1,280 1,360
Sum I 0 0 0 0 0 0Sum II 0 0 0 0 0 0_______ _______ _______ _______ _______ _______
1,488 1,600 1,296 0 1,920 2,480
Freshman Seminar Fall 5,344 4,672 4,384 7,440 ***(FSEM) Spring 4,320 4,336 3,296 0
Sum I 560 592 752 0*** Replaced by Student Sum II 592 320 432 0_______ _______ _______ _______
Success in Spring 2015 10,816 9,920 8,864 7,440
Integrated Reading Fall 11,328 13,696 11,584 11,328 -2.2% and Writing Spring 832 11,584 11,904 13,440(INRW) Sum I 512 1,792 1,536 1,920
Sum II 704 1,344 1,856 1,152_______ _______ _______ _______2,048 26,048 28,992 28,096
*ESOL Classes in Fall 17 were flex entry, reported in Spring 18 CBM004
Del Mar College Statistical Profile 2017/18 81
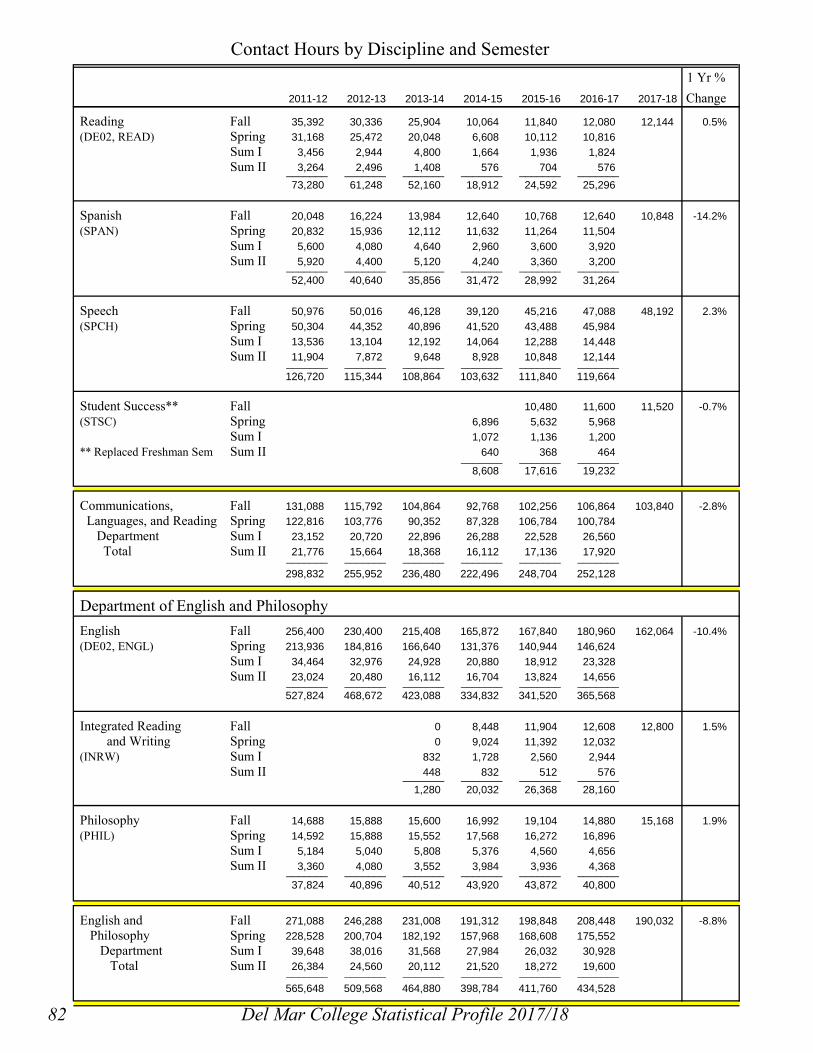
Contact Hours by Discipline and Semester1 Yr %
2011-12 2012-13 2013-14 2014-15 2015-16 2016-17 2017-18 Change
Reading Fall 35,392 30,336 25,904 10,064 11,840 12,080 12,144 0.5%(DE02, READ) Spring 31,168 25,472 20,048 6,608 10,112 10,816
Sum I 3,456 2,944 4,800 1,664 1,936 1,824Sum II 3,264 2,496 1,408 576 704 576_______ _______ _______ _______ _______ _______
73,280 61,248 52,160 18,912 24,592 25,296
Spanish Fall 20,048 16,224 13,984 12,640 10,768 12,640 10,848 -14.2%(SPAN) Spring 20,832 15,936 12,112 11,632 11,264 11,504
Sum I 5,600 4,080 4,640 2,960 3,600 3,920Sum II 5,920 4,400 5,120 4,240 3,360 3,200_______ _______ _______ _______ _______ _______
52,400 40,640 35,856 31,472 28,992 31,264
Speech Fall 50,976 50,016 46,128 39,120 45,216 47,088 48,192 2.3%(SPCH) Spring 50,304 44,352 40,896 41,520 43,488 45,984
Sum I 13,536 13,104 12,192 14,064 12,288 14,448Sum II 11,904 7,872 9,648 8,928 10,848 12,144_______ _______ _______ _______ _______ _______
126,720 115,344 108,864 103,632 111,840 119,664
Student Success** Fall 10,480 11,600 11,520 -0.7%(STSC) Spring 6,896 5,632 5,968
Sum I 1,072 1,136 1,200** Replaced Freshman Sem Sum II 640 368 464_______ _______ _______
8,608 17,616 19,232
Communications, Fall 131,088 115,792 104,864 92,768 102,256 106,864 103,840 -2.8% Languages, and Reading Spring 122,816 103,776 90,352 87,328 106,784 100,784 Department Sum I 23,152 20,720 22,896 26,288 22,528 26,560 Total Sum II 21,776 15,664 18,368 16,112 17,136 17,920_______ _______ _______ _______ _______ _______
298,832 255,952 236,480 222,496 248,704 252,128
Department of English and Philosophy English Fall 256,400 230,400 215,408 165,872 167,840 180,960 162,064 -10.4%(DE02, ENGL) Spring 213,936 184,816 166,640 131,376 140,944 146,624
Sum I 34,464 32,976 24,928 20,880 18,912 23,328Sum II 23,024 20,480 16,112 16,704 13,824 14,656_______ _______ _______ _______ _______ _______
527,824 468,672 423,088 334,832 341,520 365,568
Integrated Reading Fall 0 8,448 11,904 12,608 12,800 1.5% and Writing Spring 0 9,024 11,392 12,032(INRW) Sum I 832 1,728 2,560 2,944
Sum II 448 832 512 576_______ _______ _______ _______1,280 20,032 26,368 28,160
Philosophy Fall 14,688 15,888 15,600 16,992 19,104 14,880 15,168 1.9%(PHIL) Spring 14,592 15,888 15,552 17,568 16,272 16,896
Sum I 5,184 5,040 5,808 5,376 4,560 4,656Sum II 3,360 4,080 3,552 3,984 3,936 4,368_______ _______ _______ _______ _______ _______
37,824 40,896 40,512 43,920 43,872 40,800
English and Fall 271,088 246,288 231,008 191,312 198,848 208,448 190,032 -8.8% Philosophy Spring 228,528 200,704 182,192 157,968 168,608 175,552 Department Sum I 39,648 38,016 31,568 27,984 26,032 30,928 Total Sum II 26,384 24,560 20,112 21,520 18,272 19,600_______ _______ _______ _______ _______ _______
565,648 509,568 464,880 398,784 411,760 434,528
82 Del Mar College Statistical Profile 2017/18
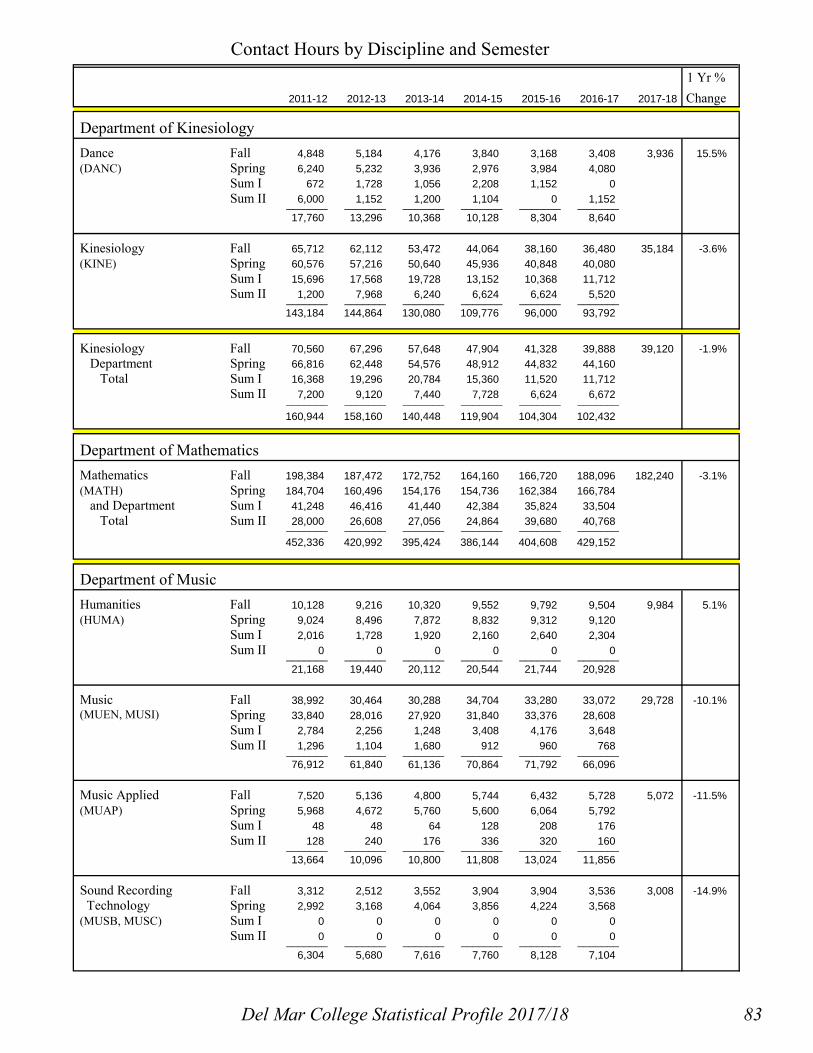
Contact Hours by Discipline and Semester1 Yr %
2011-12 2012-13 2013-14 2014-15 2015-16 2016-17 2017-18 Change
Department of KinesiologyDance Fall 4,848 5,184 4,176 3,840 3,168 3,408 3,936 15.5%(DANC) Spring 6,240 5,232 3,936 2,976 3,984 4,080
Sum I 672 1,728 1,056 2,208 1,152 0Sum II 6,000 1,152 1,200 1,104 0 1,152_______ _______ _______ _______ _______ _______
17,760 13,296 10,368 10,128 8,304 8,640
Kinesiology Fall 65,712 62,112 53,472 44,064 38,160 36,480 35,184 -3.6%(KINE) Spring 60,576 57,216 50,640 45,936 40,848 40,080
Sum I 15,696 17,568 19,728 13,152 10,368 11,712Sum II 1,200 7,968 6,240 6,624 6,624 5,520_______ _______ _______ _______ _______ _______
143,184 144,864 130,080 109,776 96,000 93,792
Kinesiology Fall 70,560 67,296 57,648 47,904 41,328 39,888 39,120 -1.9% Department Spring 66,816 62,448 54,576 48,912 44,832 44,160 Total Sum I 16,368 19,296 20,784 15,360 11,520 11,712
Sum II 7,200 9,120 7,440 7,728 6,624 6,672_______ _______ _______ _______ _______ _______160,944 158,160 140,448 119,904 104,304 102,432
Department of MathematicsMathematics Fall 198,384 187,472 172,752 164,160 166,720 188,096 182,240 -3.1%(MATH) Spring 184,704 160,496 154,176 154,736 162,384 166,784 and Department Sum I 41,248 46,416 41,440 42,384 35,824 33,504 Total Sum II 28,000 26,608 27,056 24,864 39,680 40,768_______ _______ _______ _______ _______ _______
452,336 420,992 395,424 386,144 404,608 429,152
Department of MusicHumanities Fall 10,128 9,216 10,320 9,552 9,792 9,504 9,984 5.1%(HUMA) Spring 9,024 8,496 7,872 8,832 9,312 9,120
Sum I 2,016 1,728 1,920 2,160 2,640 2,304Sum II 0 0 0 0 0 0_______ _______ _______ _______ _______ _______
21,168 19,440 20,112 20,544 21,744 20,928
Music Fall 38,992 30,464 30,288 34,704 33,280 33,072 29,728 -10.1%(MUEN, MUSI) Spring 33,840 28,016 27,920 31,840 33,376 28,608
Sum I 2,784 2,256 1,248 3,408 4,176 3,648Sum II 1,296 1,104 1,680 912 960 768_______ _______ _______ _______ _______ _______
76,912 61,840 61,136 70,864 71,792 66,096
Music Applied Fall 7,520 5,136 4,800 5,744 6,432 5,728 5,072 -11.5%(MUAP) Spring 5,968 4,672 5,760 5,600 6,064 5,792
Sum I 48 48 64 128 208 176Sum II 128 240 176 336 320 160_______ _______ _______ _______ _______ _______
13,664 10,096 10,800 11,808 13,024 11,856
Sound Recording Fall 3,312 2,512 3,552 3,904 3,904 3,536 3,008 -14.9% Technology Spring 2,992 3,168 4,064 3,856 4,224 3,568(MUSB, MUSC) Sum I 0 0 0 0 0 0
Sum II 0 0 0 0 0 0_______ _______ _______ _______ _______ _______6,304 5,680 7,616 7,760 8,128 7,104
Del Mar College Statistical Profile 2017/18 83

Contact Hours by Discipline and Semester1 Yr %
2011-12 2012-13 2013-14 2014-15 2015-16 2016-17 2017-18 Change
Music Fall 59,952 47,328 48,960 53,904 53,408 51,840 47,792 -7.8% Department Spring 51,824 44,352 45,616 50,128 52,976 47,088 Total Sum I 4,848 4,032 3,232 5,696 7,024 6,128
Sum II 1,424 1,344 1,856 1,248 1,280 928_______ _______ _______ _______ _______ _______118,048 97,056 99,664 110,976 114,688 105,984
Department of Natural SciencesBiology Fall 147,936 137,952 139,296 132,144 131,760 140,640 144,752 2.9%(BIOL) Spring 148,224 140,800 132,784 122,320 126,672 135,280
Sum I 29,088 25,776 26,544 32,880 30,864 31,584Sum II 16,368 17,760 19,584 14,592 19,056 24,048_______ _______ _______ _______ _______ _______
341,616 322,288 318,208 301,936 308,352 331,552
Biotechnology Fall 3,696 4,704 2,464 4,256 3,472 3,808 896 -76.5%(BITC**) Spring 4,256 4,592 3,808 3,696 3,808 1,680
Sum I 5,136 3,136 4,176 4,032 0 0Sum II 896 0 0 0 2,592 2,016_______ _______ _______ _______ _______ _______
13,984 12,432 10,448 11,984 9,872 7,504
Chemistry Fall 46,656 42,160 40,576 44,032 44,240 49,472 45,136 -8.8%(CHEM) Spring 43,024 38,064 37,456 39,200 42,864 42,464
Sum I 6,240 6,432 6,432 6,640 9,056 6,816Sum II 7,968 6,976 7,008 8,640 8,752 10,240_______ _______ _______ _______ _______ _______
103,888 93,632 91,472 98,512 104,912 108,992
Geology Fall 31,152 30,192 26,352 23,184 19,824 20,064 18,480 -7.9%(GEOL) Spring 29,760 24,960 23,664 22,656 21,216 17,616
Sum I 2,688 2,880 2,208 1,920 3,072 3,552Sum II 3,168 2,448 1,632 1,920 1,584 0_______ _______ _______ _______ _______ _______
66,768 60,480 53,856 49,680 45,696 41,232
Physics Fall 6,432 6,960 6,192 6,000 5,472 4,704 3,312 -29.6%(PHYS) Spring 6,480 4,992 5,136 4,800 5,952 4,704
Sum I 2,112 4,512 4,512 3,936 0 0Sum II 1,248 672 0 0 1,632 672_______ _______ _______ _______ _______ _______
16,272 17,136 15,840 14,736 13,056 10,080
Natural Fall 235,872 221,968 214,880 209,616 204,768 218,688 212,576 -2.8% Sciences Spring 231,744 213,408 202,848 192,672 200,512 201,744 Department Sum I 45,264 42,736 43,872 49,408 42,992 41,952 Total Sum II 29,648 27,856 28,224 25,152 33,616 36,976_______ _______ _______ _______ _______ _______
542,528 505,968 489,824 476,848 481,888 499,360
Department of Social SciencesAnthropology Fall 2,304 1,008 720 816 816 1,008 960 -4.8%(ANTH) Spring 2,256 864 912 912 432 576
Sum I 0 0 0 0 0 0Sum II 0 0 0 0 0 0_______ _______ _______ _______ _______ _______
4,560 1,872 1,632 1,728 1,248 1,584
**Starting in Spring 2011 Biotechnology includes BIOL-1414 and BIOL-1415 courses in Contact Hour totals.
84 Del Mar College Statistical Profile 2017/18

Contact Hours by Discipline and Semester1 Yr %
2011-12 2012-13 2013-14 2014-15 2015-16 2016-17 2017-18 Change
Geography Fall 4,752 2,256 2,832 2,352 624 2,208 2,016 -8.7%(GEOG) Spring 2,736 3,072 2,592 1,488 720 1,584
Sum I 672 720 432 384 576 0Sum II 1,440 480 912 528 0 624_______ _______ _______ _______ _______ _______
9,600 6,528 6,768 4,752 1,920 4,416
History Fall 90,000 87,312 79,488 89,664 89,328 95,808 94,272 -1.6%(HIST) Spring 83,760 78,816 80,640 84,336 85,728 84,912
Sum I 15,024 9,456 10,128 13,344 15,216 15,840Sum II 11,952 8,448 9,744 10,176 11,328 11,952_______ _______ _______ _______ _______ _______
200,736 184,032 180,000 197,520 201,600 208,512
Military Science Fall 192 192 128 96 96 80 80 0.0%(MSCI) Spring 240 192 192 96 16 16
Sum I 0 0 0 0 0 0Sum II 0 0 0 0 0 0_______ _______ _______ _______ _______ _______
432 384 320 192 112 96
Political Science Fall 55,680 61,440 52,848 62,688 72,720 75,888 75,552 -0.4%(GOVT) Spring 61,248 58,128 62,976 62,640 70,896 71,568
Sum I 18,960 21,360 22,080 23,136 25,296 23,616Sum II 13,584 15,024 13,920 7,728 7,584 7,872_______ _______ _______ _______ _______ _______
149,472 155,952 151,824 156,192 176,496 178,944
Psychology Fall 70,896 56,736 58,368 50,832 57,504 58,416 60,000 2.7%(PSYC) Spring 66,432 54,192 43,008 44,544 50,064 54,048
Sum I 16,752 12,336 9,792 12,432 12,816 15,408Sum II 4,896 7,968 6,384 7,296 5,568 6,000_______ _______ _______ _______ _______ _______
158,976 131,232 117,552 115,104 125,952 133,872
Social Work Fall 864 336 480 624 720 384 576 50.0%(SOCW) Spring 288 336 528 0 432 1,200
Sum I 0 0 0 0 576 624Sum II 0 0 0 0 0 0_______ _______ _______ _______ _______ _______
1,152 672 1,008 624 1,728 2,208
Sociology Fall 22,368 19,200 16,704 18,240 21,024 22,608 20,448 -9.6%(SOCI) Spring 19,728 19,200 19,008 19,344 22,608 24,960
Sum I 4,368 4,272 4,464 3,600 4,080 2,832Sum II 2,640 2,592 2,784 3,792 3,360 5,184_______ _______ _______ _______ _______ _______
49,104 45,264 42,960 44,976 51,072 55,584
Social Fall 247,056 228,480 211,568 225,312 242,832 256,400 253,904 -1.0% Sciences Spring 236,688 214,800 209,856 213,360 230,896 238,864 Department Sum I 55,776 48,144 46,896 52,896 58,560 58,320 Total Sum II 34,512 34,512 33,744 29,520 27,840 31,632_______ _______ _______ _______ _______ _______
574,032 525,936 502,064 521,088 560,128 585,216
Arts and Fall 1,287,040 1,186,112 1,108,976 1,044,576 1,072,768 1,133,616 1,090,512 -3.8% Sciences Spring 1,197,824 1,072,192 1,006,416 959,392 1,021,488 1,033,056 Division Sum I 235,184 228,336 217,344 230,928 212,976 218,032 Total Sum II 153,280 147,664 144,432 133,872 151,168 161,936_______ _______ _______ _______ _______ _______
2,873,328 2,634,304 2,477,168 2,368,768 2,458,400 2,546,640
Del Mar College Statistical Profile 2017/18 85

Contact Hours by Discipline and Semester1 Yr %
2011-12 2012-13 2013-14 2014-15 2015-16 2016-17 2017-18 Change
Division of Business, Industrial and Public Safety Education**
Department of Business AdministrationAccounting Fall 18,528 17,408 15,184 16,640 17,920 20,480 20,960 2.3%(ACCT, ACNT, BNKG) Spring 21,152 17,392 19,184 15,488 18,512 22,192
Sum I 4,320 4,368 3,408 5,088 4,272 4,032Sum II 2,064 2,448 1,968 2,832 3,216 3,696_______ _______ _______ _______ _______ _______
46,064 41,616 39,744 40,048 43,920 50,400
Business Fall 15,216 14,208 12,912 14,688 17,424 20,448 20,544 0.5%(BUSI) Spring 13,872 12,240 11,664 16,272 19,104 18,384
Sum I 2,784 4,128 2,544 4,992 5,568 6,192Sum II 1,968 2,928 3,024 1,920 2,640 3,216_______ _______ _______ _______ _______ _______
33,840 33,504 30,144 37,872 44,736 48,240
Business Technology* Fall 28,528 26,512 22,336 16,896 5,488 4,368 2,256 -48.4%(MRMT, POFI, POFM, Spring 25,872 28,592 20,432 15,456 5,200 4,192POFT) Sum I 6,288 7,456 4,960 3,424 1,248 528
Sum II 2,096 1,248 1,040 672 2,080 656_______ _______ _______ _______ _______ _______*Part of Mgt. Devt. from Fall 14 62,784 63,808 48,768 36,448 14,016 9,744
Court Reporting Fall 20,768 16,432 16,672 14,432 15,584 14,784 16,416 11.0%(CRTR) Spring 20,528 13,440 16,608 17,584 16,192 16,544
Sum I 6,000 5,552 5,440 6,352 6,272 6,224Sum II 0 0 0 0 0 0_______ _______ _______ _______ _______ _______
47,296 35,424 38,720 38,368 38,048 37,552
Economics Fall 25,968 24,144 26,640 24,192 24,960 25,392 25,440 0.2%(ECON) Spring 16,320 18,432 15,600 17,856 24,432 25,632
Sum I 8,736 7,584 7,488 8,304 7,104 7,248Sum II 6,000 4,752 4,128 5,328 4,464 4,272_______ _______ _______ _______ _______ _______
57,024 54,912 53,856 55,680 60,960 62,544
Legal Professions Fall 10,096 9,152 8,864 6,704 6,864 8,240 8,400 1.9%(LGLA, POFL) Spring 12,848 8,256 6,960 5,872 6,480 8,736
Sum I 0 2,448 1,600 0 0 0Sum II 0 0 0 0 896 1,792_______ _______ _______ _______ _______ _______
22,944 19,856 17,424 12,576 14,240 18,768
Management Developm Fall 15,376 10,624 9,296 12,048 10,064 15,056 13,808 -8.3%(BMGT, BUSG, HRPO, Spring 13,552 11,472 8,688 9,904 14,144 14,576 IBUS, LMGT, MRKG, Sum I 528 720 0 2,544 2,880 1,440 QCTC) Sum II 0 288 0 240 80 1,264_______ _______ _______ _______ _______ _______
29,456 23,104 17,984 24,736 27,168 32,336
Business Fall 134,480 118,480 111,904 105,600 98,304 108,768 107,824 -0.9% Administration Spring 124,144 109,824 99,136 98,432 104,064 110,256 Department Sum I 28,656 32,256 25,440 30,704 27,344 25,664 Total Sum II 12,128 11,664 10,160 10,992 13,376 14,896_______ _______ _______ _______ _______ _______
299,408 272,224 246,640 245,728 243,088 259,584
* Includes Banking from Fall 2008
86 Del Mar College Statistical Profile 2017/18

Contact Hours by Discipline and Semester1 Yr %
2011-12 2012-13 2013-14 2014-15 2015-16 2016-17 2017-18 Change
Department of Industrial Education (Re-aligned TECH Department from Fall 2015)
Environmental/ Fall 9,792 7,120 6,864 8,800 14,752 12,640 15,488 22.5% Petrochemical Spring 8,000 9,024 9,856 9,408 11,280 11,440 Lab Technology Sum I 2,176 5,136 4,448 3,520 0 0(CTEC, SCIT) Sum II 0 0 1,440 0 5,024 4,240_______ _______ _______ _______ _______ _______*Chem Lab Tech before Fall 13 19,968 21,280 22,608 21,728 31,056 28,320
Electroplating * Fall 0 0 0 0 0 0 0(METL) Spring 0 0 0 0 0 0
Sum I 576 1,008 768 480 0 0Sum II 0 0 0 0 768 960_______ _______ _______ _______ _______ _______
576 1,008 768 480 768 960
Industrial Machining Fall 9,680 7,264 8,208 8,368 7,088 12,944 8,928 -31.0% Applied Technology Spring 8,576 7,552 7,328 7,136 9,568 9,744(INMT, MCHN) Sum I 3,776 4,176 2,768 3,552 0 0
Sum II 0 0 0 0 5,568 5,888_______ _______ _______ _______ _______ _______* Includes Millwright from Fall 15 22,032 18,992 18,304 19,056 22,224 28,576
Instrumentation Fall 560 0 0 1,200 6,256 11,136 14,624 31.3%(INTC) Spring 320 0 880 768 10,032 17,760
Sum I 0 0 0 320 0 1,536Sum II 0 0 0 0 3,280 4,368_______ _______ _______ _______ _______ _______
880 0 880 2,288 19,568 34,800
Nondestructive Testing Fall 7,984 9,552 7,568 8,592 6,288 7,408 10,080 36.1%(NDTE) Spring 9,936 11,056 6,576 7,760 7,728 9,344
Sum I 2,368 3,312 2,720 1,920 0 0*Prior to 2016/17 Stat Profile Sum II 0 0 0 0 2,640 3,232_______ _______ _______ _______ _______ _______included Electroplating (METL) 20,288 23,920 16,864 18,272 16,656 19,984
Occupational Learning Fall 10,944 9,504 9,504 8,880 10,608 11,040 12,240 10.9%(COMG, TECM) Spring 9,504 7,536 7,440 8,208 10,080 9,744
Sum I 3,552 3,024 4,368 3,216 528 2,160Sum II 0 0 0 0 4,416 4,752_______ _______ _______ _______ _______ _______
24,000 20,064 21,312 20,304 25,632 27,696
Process Technology Fall 12,864 15,744 20,352 20,448 25,680 34,896 49,296 41.3%(PTAC, PTRT) Spring 19,968 21,312 22,496 27,392 29,856 47,216
Sum I 7,200 14,592 16,272 18,544 0 0Sum II 0 0 0 0 19,088 24,128_______ _______ _______ _______ _______ _______
40,032 51,648 59,120 66,384 74,624 106,240
Welding Applied Fall 40,368 37,760 44,848 53,792 61,680 92,208 81,904 -11.2% Technology Spring 42,592 41,072 44,656 55,520 66,560 88,192(WLDG) Sum I 12,432 18,128 17,968 20,720 1,984 640
Sum II 0 0 0 0 31,072 31,840_______ _______ _______ _______ _______ _______95,392 96,960 107,472 130,032 161,296 212,880
Industrial Fall 92,192 86,944 97,344 110,080 132,352 182,272 192,560 5.6% Education Spring 98,896 97,552 99,232 116,192 145,104 193,440 Department Sum I 32,080 49,376 49,312 52,272 2,512 4,336 Total Sum II 0 0 1,440 0 71,856 79,408_______ _______ _______ _______ _______ _______
223,168 233,872 247,328 278,544 351,824 459,456
*Was "Industrial Education" in IEDU Dept until Fall 15
*Prior to Fall 15 reported under Engineering Tech
*Prior to 2015 reported under Nondestructive Testing
Del Mar College Statistical Profile 2017/18 87

Contact Hours by Discipline and Semester1 Yr %
2011-12 2012-13 2013-14 2014-15 2015-16 2016-17 2017-18 Change
Department of Public Safety EducationCriminal Justice Fall 20,688 15,600 15,600 13,680 18,624 15,792 15,168 -4.0% Transfer Spring 16,656 14,448 14,304 13,824 16,032 14,928(CRIJ) Sum I 3,552 1,776 2,688 2,304 2,592 3,120
Sum II 2,640 1,440 1,872 2,112 1,920 2,016_______ _______ _______ _______ _______ _______43,536 33,264 34,464 31,920 39,168 35,856
Emergency Medical Fall 36,224 22,880 30,928 18,160 28,816 22,928 25,696 12.1% Services Professions Spring 30,480 32,352 26,416 33,008 54,448 25,600(EMSP) Sum I 39,872 34,896 22,048 24,176 30,304 20,768
Sum II 1,280 9,232 4,848 4,880 13,552 15,152_______ _______ _______ _______ _______ _______107,856 99,360 84,240 80,224 127,120 84,448
Fire Science/ Fall 16,416 15,600 16,096 17,088 13,968 19,776 12,864 -35.0% Fire Academy Spring 19,024 14,704 16,720 14,992 16,256 33,264(FIRS, FIRT) Sum I 10,192 4,464 8,864 4,896 0 0
Sum II 0 0 0 0 10,592 5,760_______ _______ _______ _______ _______ _______45,632 34,768 41,680 36,976 40,816 58,800
Law Enforcement Fall 0 11,264 15,136 13,024 13,376 12,672 9,152 -27.8%(CJLE, CJCR, CJSA, SLPS) Spring 26,048 14,784 28,160 11,968 0 0
Sum I 0 0 0 7,744 16,896 7,040Sum II 8,448 9,152 8,448 0 13,376 12,672_______ _______ _______ _______ _______ _______
* Includes Cr. Justice Tech 34,496 35,200 51,744 32,736 43,648 32,384
Occupational Safety Fall 14,528 20,208 22,464 24,768 26,880 23,232 18,912 -18.6% and Health Spring 20,560 23,552 30,016 31,968 27,104 28,592
Sum I 10,352 11,904 16,032 15,840 0 0Sum II 0 0 0 0 14,528 15,792_______ _______ _______ _______ _______ _______
45,440 55,664 68,512 72,576 68,512 67,616
Public Safety Fall 87,856 85,552 100,224 86,720 101,664 94,400 81,792 -13.4% Education Spring 112,768 99,840 115,616 105,760 113,840 102,384 Department Sum I 63,968 53,040 49,632 54,960 49,792 30,928 Total Sum II 12,368 19,824 15,168 6,992 53,968 51,392_______ _______ _______ _______ _______ _______
276,960 258,256 280,640 254,432 319,264 279,104
Department of Technology Education (Re-aligned IEDU Department from Fall 2015)Air Conditioning Fall 23,616 19,088 10,944 9,200 10,368 15,856 15,136 -4.5% Applied Technology Spring 22,800 12,752 8,192 7,328 10,736 18,256(HART) Sum I 4,912 4,080 4,976 4,784 0 0
Sum II 1,888 0 0 0 6,832 9,824_______ _______ _______ _______ _______ _______53,216 35,920 24,112 21,312 27,936 43,936
Architectural Fall 3,872 4,704 4,656 8,496 8,016 12,096 15,808 30.7% Technology Spring 6,576 7,792 6,384 9,392 11,248 14,032(ARCE, ARCH, ARTV, Sum I 528 768 1,344 2,016 0 0 CNBT, SRVY) Sum II 0 0 0 0 5,760 3,552_______ _______ _______ _______ _______ _______* Under TECH Dept until Fall 15 10,976 13,264 12,384 19,904 25,024 29,680
(CNSE, CVOP, EPCT, INSR, OSHT)
88 Del Mar College Statistical Profile 2017/18

Contact Hours by Discipline and Semester1 Yr %
2011-12 2012-13 2013-14 2014-15 2015-16 2016-17 2017-18 Change
Aviation Maintenance Fall 14,016 9,472 12,432 11,936 6,656 9,856 4,752 -51.8%(AERM) Spring 35,024 32,448 29,456 24,320 21,360 22,336
Sum I 30,416 30,224 25,536 15,168 13,584 10,416Sum II 6,704 4,976 2,160 2,208 2,752 3,136_______ _______ _______ _______ _______ _______
* Under TECH Dept until Fall 15 86,160 77,120 69,584 53,632 44,352 45,744
Avionics Fall 0 1,728 1,920 4,128 2,144 0 384(AVNC) Spring 2,208 3,184 3,136 2,656 2,800 480
Sum I 1,632 1,632 960 864 0 192Sum II 0 0 0 0 192 0_______ _______ _______ _______ _______ _______
* Under TECH Dept until Fall 15 3,840 6,544 6,016 7,648 5,136 672
Drafting Technology Fall 6,720 5,888 5,760 5,344 8,208 8,224 5,536 -32.7%(DFTG) Spring 6,736 5,376 5,952 8,160 8,384 10,304
Sum I 4,304 3,824 3,584 5,600 1,728 5,184Sum II 0 0 0 0 1,728 1,824_______ _______ _______ _______ _______ _______
* Under TECH Dept until Fall 15 17,760 15,088 15,296 19,104 20,048 25,536
Auto Body Applied Fall 9,088 4,864 4,864 4,736 2,560 3,456 5,632 63.0% Technology Spring 7,552 5,120 4,992 5,632 3,456 3,840(ABDR) Sum I 3,840 3,840 3,072 2,176 0 0
Sum II 0 0 0 0 2,304 3,712_______ _______ _______ _______ _______ _______20,480 13,824 12,928 12,544 8,320 11,008
Automotive Applied Fall 21,712 20,768 20,736 21,712 21,296 23,008 21,072 -8.4% Technology Spring 25,744 20,208 19,728 20,320 22,336 22,704(AUMT) Sum I 11,776 7,040 6,528 9,600 0 0
Sum II 0 0 0 0 7,040 8,448_______ _______ _______ _______ _______ _______59,232 48,016 46,992 51,632 50,672 54,160
Building Maintenance Fall 8,000 3,360 1,440 1,680 4,160 6,400 9,104 42.3% Applied Technology Spring 4,976 4,240 2,528 2,480 2,720 4,800(CBFM, MAIR) Sum I 5,024 3,808 3,744 4,912 0 0
Sum II 0 0 0 0 8,352 8,592_______ _______ _______ _______ _______ _______18,000 11,408 7,712 9,072 15,232 19,792
Diesel Applied Fall 12,128 10,112 11,712 14,656 15,040 16,288 17,792 9.2% Technology Spring 12,416 9,280 11,456 14,400 15,296 13,216(DEMR, HEMR) Sum I 6,416 9,264 9,296 11,632 0 0
Sum II 0 0 0 0 11,264 13,264_______ _______ _______ _______ _______ _______30,960 28,656 32,464 40,688 41,600 42,768
Technology Fall 99,152 79,984 74,464 81,888 78,448 95,184 95,216 0.0% Education Spring 124,032 100,400 91,824 94,688 98,336 109,968 Department Sum I 68,848 64,480 59,040 56,752 15,312 15,792 Total Sum II 8,592 4,976 2,160 2,208 46,224 52,352_______ _______ _______ _______ _______ _______
300,624 249,840 227,488 235,536 238,320 273,296
Business, Industrial Fall 413,680 370,960 383,936 384,288 410,768 480,624 477,392 -0.7%
and Public Safety Spring 459,840 407,616 405,808 415,072 461,344 516,048
Education Division** Sum I 193,552 199,152 183,424 194,688 94,960 76,720
Total Sum II 33,088 36,464 28,928 20,192 185,424 198,048_______ _______ _______ _______ _______ _______
1,100,160 1,014,192 1,002,096 1,014,240 1,152,496 1,271,440
** Prior to re-alignment in Fall 2015 "Business and Technology Programs " included BUSI, COMS, IEDU, PUBS and TECH departments
Del Mar College Statistical Profile 2017/18 89

Contact Hours by Discipline and Semester1 Yr %
2011-12 2012-13 2013-14 2014-15 2015-16 2016-17 2017-18 Change
Division of Health Sciences and Professional Education Department of Allied HealthHealth Information Fall 4,336 5,632 6,032 4,416 3,920 5,824 6,288 8.0% Technology Spring 3,728 4,192 4,704 3,472 4,240 5,696(HITT, HPRS 2301) Sum I 2,224 2,640 2,896 1,184 240 0
Sum II 0 0 0 0 2,608 2,336_______ _______ _______ _______ _______ _______10,288 12,464 13,632 9,072 11,008 13,856
Health Science Fall 37,056 30,592 19,424 14,656 13,280 12,736 11,680 -8.3%(HPRS) Spring 37,616 32,720 18,752 13,056 12,640 13,760
Sum I 9,760 8,352 3,712 3,648 1,344 2,144Sum II 4,128 2,816 1,184 1,600 2,976 2,624_______ _______ _______ _______ _______ _______
*Under RNED Dept till Fall 16 88,560 74,480 43,072 32,960 30,240 31,264
Medical Laboratory Fall 11,760 12,144 11,648 7,392 6,512 8,992 8,528 -5.2% Technology Spring 10,768 12,096 10,336 7,248 4,800 6,608(MLAB, PLAB) Sum I 3,024 3,456 1,920 2,016 1,584 1,296
Sum II 1,728 1,440 1,728 1,440 2,208 2,256_______ _______ _______ _______ _______ _______27,280 29,136 25,632 18,096 15,104 19,152
Occupational Therapy Fall 12,704 12,208 13,056 12,848 13,200 12,560 12,400 -1.3% Assistant Spring 14,640 15,584 16,048 16,144 16,560 16,000(OTHA) Sum I 4,256 4,704 4,480 4,704 1,920 1,920
Sum II 1,824 2,016 1,920 2,016 4,480 4,480_______ _______ _______ _______ _______ _______33,424 34,512 35,504 35,712 36,160 34,960
Pharmacy Technology Fall 4,992 4,736 2,960 5,328 3,904 5,920 4,736 -20.0%(PHRA) Spring 5,328 4,224 2,304 4,736 2,880 5,760 Sum I 2,112 2,816 1,408 2,112 480 960
Sum II 480 640 320 400 1,600 3,200_______ _______ _______ _______ _______ _______12,912 12,416 6,992 12,576 8,864 15,840
Physical Therapist Fall 12,896 12,992 13,232 14,000 15,248 14,432 13,888 -3.8% Assistant Spring 5,408 6,000 6,112 6,400 6,688 6,720(PTHA) Sum I 11,136 11,096 11,360 11,752 8,624 8,232
Sum II 2,160 2,400 2,640 2,400 3,360 3,360_______ _______ _______ _______ _______ _______31,600 32,488 33,344 34,552 33,920 32,744
Respiratory Therapy Fall 8,960 8,880 9,360 9,040 8,640 9,600 8,720 -9.2%(RSPT) Spring 9,248 8,032 8,832 8,480 8,384 8,704
Sum I 2,304 3,072 2,880 3,072 0 0Sum II 0 0 0 0 3,072 3,072_______ _______ _______ _______ _______ _______
20,512 19,984 21,072 20,592 20,096 21,376
Surgical Technology Fall 5,568 6,960 5,568 5,648 6,576 4,640 5,648 21.7%(SRGT) Spring 5,104 5,568 5,104 5,104 5,104 4,640
Sum I 4,480 3,328 3,328 3,840 0 0Sum II 0 0 0 0 2,816 3,840_______ _______ _______ _______ _______ _______
15,152 15,856 14,000 14,592 14,496 13,120
Allied Health Fall 98,272 94,144 81,280 73,328 71,280 74,704 71,888 -3.8% Department Spring 91,840 88,416 72,192 64,640 61,296 67,888 Total Sum I 39,296 39,464 31,984 32,328 14,192 14,552
Sum II 10,320 9,312 7,792 7,856 23,120 25,168_______ _______ _______ _______ _______ _______239,728 231,336 193,248 178,152 169,888 182,312
90 Del Mar College Statistical Profile 2017/18
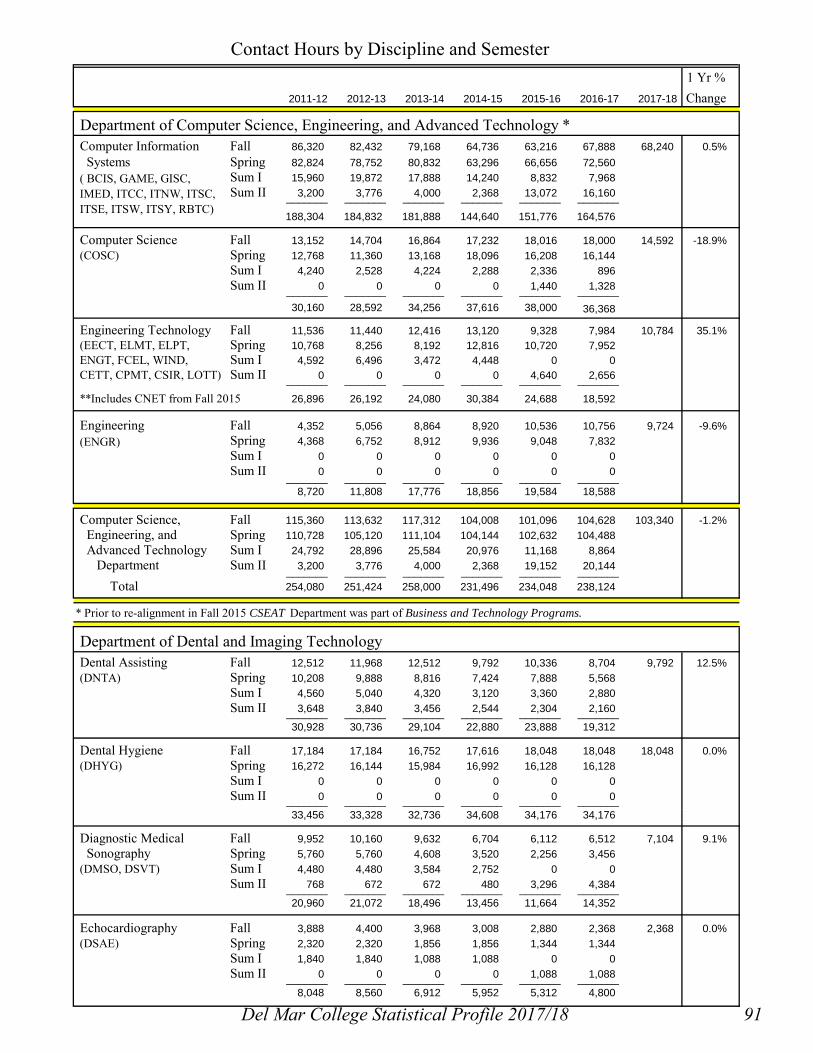
Contact Hours by Discipline and Semester1 Yr %
2011-12 2012-13 2013-14 2014-15 2015-16 2016-17 2017-18 Change
Department of Computer Science, Engineering, and Advanced Technology *Computer Information Fall 86,320 82,432 79,168 64,736 63,216 67,888 68,240 0.5% Systems Spring 82,824 78,752 80,832 63,296 66,656 72,560
Sum I 15,960 19,872 17,888 14,240 8,832 7,968Sum II 3,200 3,776 4,000 2,368 13,072 16,160_______ _______ _______ _______ _______ _______
188,304 184,832 181,888 144,640 151,776 164,576
Computer Science Fall 13,152 14,704 16,864 17,232 18,016 18,000 14,592 -18.9%(COSC) Spring 12,768 11,360 13,168 18,096 16,208 16,144
Sum I 4,240 2,528 4,224 2,288 2,336 896Sum II 0 0 0 0 1,440 1,328_______ _______ _______ _______ _______ _______
30,160 28,592 34,256 37,616 38,000 36,368
Engineering Technology Fall 11,536 11,440 12,416 13,120 9,328 7,984 10,784 35.1%(EECT, ELMT, ELPT, Spring 10,768 8,256 8,192 12,816 10,720 7,952ENGT, FCEL, WIND, Sum I 4,592 6,496 3,472 4,448 0 0CETT, CPMT, CSIR, LOTT) Sum II 0 0 0 0 4,640 2,656_______ _______ _______ _______ _______ _______
**Includes CNET from Fall 2015 26,896 26,192 24,080 30,384 24,688 18,592
Engineering Fall 4,352 5,056 8,864 8,920 10,536 10,756 9,724 -9.6%(ENGR) Spring 4,368 6,752 8,912 9,936 9,048 7,832
Sum I 0 0 0 0 0 0Sum II 0 0 0 0 0 0_______ _______ _______ _______ _______ _______
8,720 11,808 17,776 18,856 19,584 18,588
Computer Science, Fall 115,360 113,632 117,312 104,008 101,096 104,628 103,340 -1.2% Engineering, and Spring 110,728 105,120 111,104 104,144 102,632 104,488 Advanced Technology Sum I 24,792 28,896 25,584 20,976 11,168 8,864 Department Sum II 3,200 3,776 4,000 2,368 19,152 20,144_______ _______ _______ _______ _______ _______ Total 254,080 251,424 258,000 231,496 234,048 238,124
* Prior to re-alignment in Fall 2015 CSEAT Department was part of Business and Technology Programs.
Department of Dental and Imaging TechnologyDental Assisting Fall 12,512 11,968 12,512 9,792 10,336 8,704 9,792 12.5%(DNTA) Spring 10,208 9,888 8,816 7,424 7,888 5,568
Sum I 4,560 5,040 4,320 3,120 3,360 2,880Sum II 3,648 3,840 3,456 2,544 2,304 2,160_______ _______ _______ _______ _______ _______
30,928 30,736 29,104 22,880 23,888 19,312
Dental Hygiene Fall 17,184 17,184 16,752 17,616 18,048 18,048 18,048 0.0%(DHYG) Spring 16,272 16,144 15,984 16,992 16,128 16,128
Sum I 0 0 0 0 0 0Sum II 0 0 0 0 0 0_______ _______ _______ _______ _______ _______
33,456 33,328 32,736 34,608 34,176 34,176
Diagnostic Medical Fall 9,952 10,160 9,632 6,704 6,112 6,512 7,104 9.1% Sonography Spring 5,760 5,760 4,608 3,520 2,256 3,456(DMSO, DSVT) Sum I 4,480 4,480 3,584 2,752 0 0
Sum II 768 672 672 480 3,296 4,384_______ _______ _______ _______ _______ _______20,960 21,072 18,496 13,456 11,664 14,352
Echocardiography Fall 3,888 4,400 3,968 3,008 2,880 2,368 2,368 0.0%(DSAE) Spring 2,320 2,320 1,856 1,856 1,344 1,344
Sum I 1,840 1,840 1,088 1,088 0 0Sum II 0 0 0 0 1,088 1,088_______ _______ _______ _______ _______ _______
8,048 8,560 6,912 5,952 5,312 4,800
( BCIS, GAME, GISC, IMED, ITCC, ITNW, ITSC, ITSE, ITSW, ITSY, RBTC)
Del Mar College Statistical Profile 2017/18 91

Contact Hours by Discipline and Semester1 Yr %
2011-12 2012-13 2013-14 2014-15 2015-16 2016-17 2017-18 ChangeNuclear Medicine Fall 6,592 8,096 7,552 8,560 6,512 3,424 0 -100.0%(NMTT) Spring 5,824 7,072 6,656 6,240 5,776 2,912
Sum I 2,688 2,352 3,024 2,688 2,688 384Sum II 0 0 0 0 672 416_______ _______ _______ _______ _______ _______
15,104 17,520 17,232 17,488 15,648 7,136
Radiologic Technology Fall 16,656 15,760 15,616 17,888 16,912 17,120 16,320 -4.7%Spring 13,792 12,640 15,232 17,760 15,664 15,536Sum I 7,440 4,704 5,328 4,800 3,456 4,032
Sum II 7,296 7,296 7,872 7,872 8,064 7,296_______ _______ _______ _______ _______ _______45,184 40,400 44,048 48,320 44,096 43,984
Dental and Imaging Fall 66,784 67,568 66,032 63,568 60,800 56,176 53,632 -4.5% Technology Spring 54,176 53,824 53,152 53,792 49,056 44,944 Department Sum I 21,008 18,416 17,344 14,448 9,504 7,296 Total Sum II 11,712 11,808 12,000 10,896 15,424 15,344_______ _______ _______ _______ _______ _______
153,680 151,616 148,528 142,704 134,784 123,760
Department of Human Sciences and EducationAmerican Sign Fall 13,472 8,208 9,152 9,616 8,416 7,152 10,752 50.3% Language and Spring 12,896 9,360 8,320 10,416 7,024 7,808 Interpreting Sum I 1,984 384 1,312 1,248 1,088 1,088(SLNG, SGNL) Sum II 0 0 896 1,280 1,088 1,376_______ _______ _______ _______ _______ _______
28,352 17,952 19,680 22,560 17,616 17,424
Child Development/ Fall 17,504 14,128 12,960 12,144 11,488 12,480 10,832 -13.2% Early Childhood Spring 17,040 13,776 12,496 11,392 10,400 10,784(CDEC, TECA) Sum I 3,568 2,656 2,464 1,312 1,488 1,056
Sum II 0 0 0 0 768 0_______ _______ _______ _______ _______ _______38,112 30,560 27,920 24,848 24,144 24,320
Cosmetology Fall 33,856 40,480 39,040 36,368 41,520 38,720 40,640 5.0%(CSME) Spring 30,528 38,960 33,808 40,768 32,608 39,312
Sum I 17,920 24,448 16,096 18,976 0 160Sum II 0 0 0 0 20,224 20,288_______ _______ _______ _______ _______ _______
82,304 103,888 88,944 96,112 94,352 98,480
Culinary Arts Fall 27,648 26,448 22,928 17,296 18,240 15,168 13,360 -11.9%(CHEF, IFWA, PSTR) Spring 26,976 25,248 20,272 20,592 18,688 15,168
Sum I 2,432 720 1,664 1,440 0 0Sum II 2,208 1,920 0 0 0 0_______ _______ _______ _______ _______ _______
59,264 54,336 44,864 39,328 36,928 30,336
Education Fall 4,928 5,568 4,800 3,776 4,928 5,376 5,824 8.3%(EDUC) Spring 5,120 3,904 5,184 3,328 4,800 5,696
Sum I 0 0 576 0 0 1,344Sum II 640 1,472 1,088 384 448 0_______ _______ _______ _______ _______ _______
10,688 10,944 11,648 7,488 10,176 12,416
Hospitality/Restaurant Fall 6,256 5,072 4,672 4,192 2,400 3,648 1,888 -48.2% Management Spring 5,216 5,584 5,712 4,064 2,784 2,368(RSTO) Sum I 0 0 0 0 0 0
Sum II 0 0 0 0 0 0_______ _______ _______ _______ _______ _______11,472 10,656 10,384 8,256 5,184 6,016
(CTMT, CVIR, MAMT, MRIT, RADR)
(Program discontinued starting Fall 2017)
92 Del Mar College Statistical Profile 2017/18

Contact Hours by Discipline and Semester1 Yr %
2011-12 2012-13 2013-14 2014-15 2015-16 2016-17 2017-18 ChangeHotel/Motel Fall 1,232 4,016 3,984 1,968 5,520 2,688 880 -67.3% Management Spring 1,216 672 432 1,872 1,472 624(HAMG) Sum I 0 0 0 0 0 0
Sum II 0 0 0 0 0 0_______ _______ _______ _______ _______ _______2,448 4,688 4,416 3,840 6,992 3,312
Human Services Fall 7,856 6,912 6,992 4,688 8,288 5,184 7,104 37.0%Spring 7,584 5,952 5,936 6,480 7,456 7,344Sum I 1,904 1,552 672 2,064 0 0Sum II 0 0 0 0 1,424 2,160_______ _______ _______ _______ _______ _______
17,344 14,416 13,600 13,232 17,168 14,688
Human Sciences Fall 112,752 110,832 104,528 90,048 100,800 90,416 91,280 1.0% and Education Spring 106,576 103,456 92,160 98,912 85,232 89,104 Department Sum I 27,808 29,760 22,784 25,040 2,576 3,648 Total Sum II 2,848 3,392 1,984 1,664 23,952 23,824_______ _______ _______ _______ _______ _______
249,984 247,440 221,456 215,664 212,560 206,992
Department of Nurse EducationNurse Education Fall 92,400 84,032 65,584 74,864 81,056 88,976 93,312 4.9%(RNSG, VNSG) Spring 122,032 73,776 63,696 89,292 83,328 90,368 and Department Sum I 3,104 1,696 8,144 448 432 1,248 Total Sum II 0 0 0 0 7,520 16,288_______ _______ _______ _______ _______ _______
217,536 159,504 137,424 164,604 172,336 196,880
Health Sciences and Fall 485,568 470,208 434,736 405,816 415,032 414,900 413,452 -0.3%
Professional Education Spring 485,352 424,592 392,304 410,780 381,544 396,792
Division Sum I 116,008 118,232 105,840 93,240 37,872 35,608
Total Sum II 28,080 28,288 25,776 22,784 89,168 100,768_______ _______ _______ _______ _______ _______
1,115,008 1,041,320 958,656 932,620 923,616 948,068
GRAND Fall 2,186,288 2,027,280 1,927,648 1,834,680 1,898,568 2,029,140 1,981,356 -2.4%
TOTAL Spring 2,143,016 1,904,400 1,804,528 1,785,244 1,864,376 1,945,896
Sum I 544,744 545,720 506,608 518,856 345,808 330,360
Sum II 214,448 212,416 199,136 176,848 425,760 460,752_______ _______ _______ _______ _______ _______
5,088,496 4,689,816 4,437,920 4,315,628 4,534,512 4,766,148
Note: Enrollments in classes that begin after the census date (flexible entry) are posted in the next semester.
(CMSW, DAAC, FMLD, GERS, LTCA, PMHS, SCWK)
Del Mar College Statistical Profile 2017/18 93
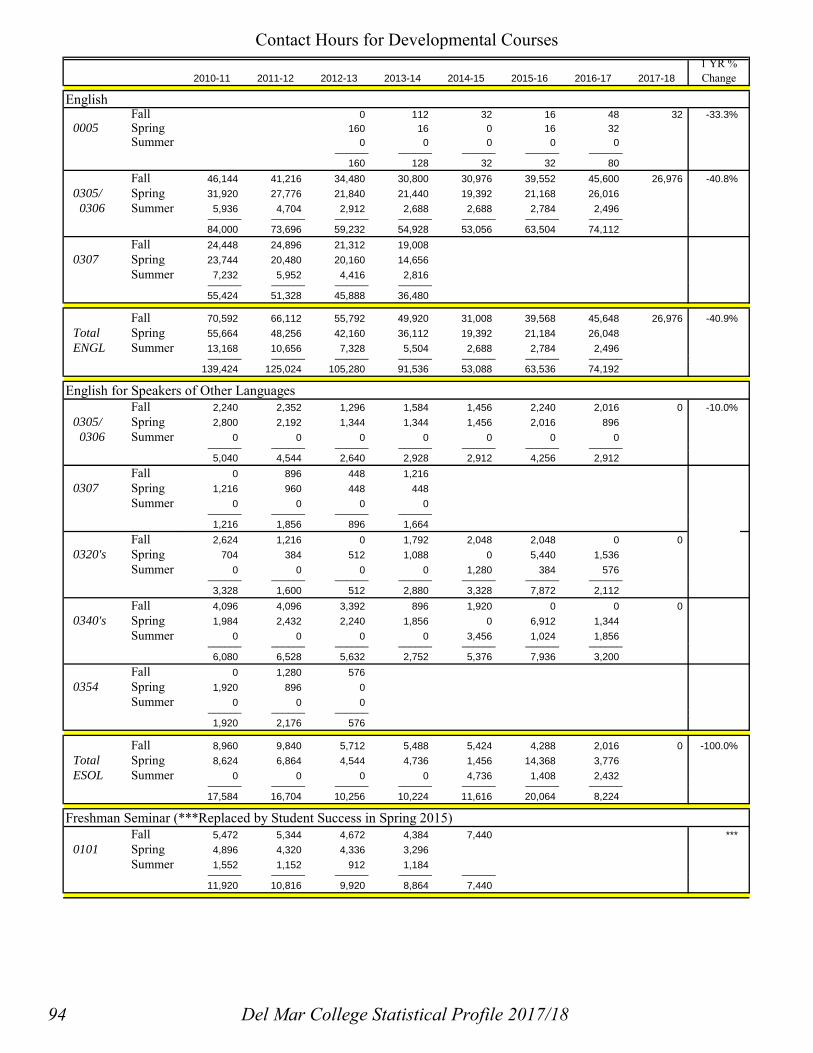
2010-11 2011-12 2012-13 2013-14 2014-15 2015-16 2016-17 2017-18
EnglishFall 0 112 32 16 48 32 -33.3%
0005 Spring 160 16 0 16 32Summer 0 0 0 0 0______ ______ ______ ______ ______
160 128 32 32 80Fall 46,144 41,216 34,480 30,800 30,976 39,552 45,600 26,976 -40.8%
0305/ Spring 31,920 27,776 21,840 21,440 19,392 21,168 26,016 0306 Summer 5,936 4,704 2,912 2,688 2,688 2,784 2,496______ ______ ______ ______ ______ ______ ______
84,000 73,696 59,232 54,928 53,056 63,504 74,112Fall 24,448 24,896 21,312 19,008
0307 Spring 23,744 20,480 20,160 14,656Summer 7,232 5,952 4,416 2,816______ ______ ______ ______
55,424 51,328 45,888 36,480
Fall 70,592 66,112 55,792 49,920 31,008 39,568 45,648 26,976 -40.9%Total Spring 55,664 48,256 42,160 36,112 19,392 21,184 26,048ENGL Summer 13,168 10,656 7,328 5,504 2,688 2,784 2,496______ ______ ______ ______ ______ ______ ______
139,424 125,024 105,280 91,536 53,088 63,536 74,192
English for Speakers of Other LanguagesFall 2,240 2,352 1,296 1,584 1,456 2,240 2,016 0 -10.0%
0305/ Spring 2,800 2,192 1,344 1,344 1,456 2,016 896 0306 Summer 0 0 0 0 0 0 0______ ______ ______ ______ ______ ______ ______
5,040 4,544 2,640 2,928 2,912 4,256 2,912Fall 0 896 448 1,216
0307 Spring 1,216 960 448 448Summer 0 0 0 0______ ______ ______ ______
1,216 1,856 896 1,664Fall 2,624 1,216 0 1,792 2,048 2,048 0 0
0320's Spring 704 384 512 1,088 0 5,440 1,536Summer 0 0 0 0 1,280 384 576______ ______ ______ ______ ______ ______ ______
3,328 1,600 512 2,880 3,328 7,872 2,112Fall 4,096 4,096 3,392 896 1,920 0 0 0
0340's Spring 1,984 2,432 2,240 1,856 0 6,912 1,344Summer 0 0 0 0 3,456 1,024 1,856______ ______ ______ ______ ______ ______ ______
6,080 6,528 5,632 2,752 5,376 7,936 3,200Fall 0 1,280 576
0354 Spring 1,920 896 0Summer 0 0 0______ ______ ______
1,920 2,176 576
Fall 8,960 9,840 5,712 5,488 5,424 4,288 2,016 0 -100.0%Total Spring 8,624 6,864 4,544 4,736 1,456 14,368 3,776ESOL Summer 0 0 0 0 4,736 1,408 2,432______ ______ ______ ______ ______ ______ ______
17,584 16,704 10,256 10,224 11,616 20,064 8,224
Freshman Seminar (***Replaced by Student Success in Spring 2015)Fall 5,472 5,344 4,672 4,384 7,440 ***
0101 Spring 4,896 4,320 4,336 3,296Summer 1,552 1,152 912 1,184______ ______ ______ ______ ______
11,920 10,816 9,920 8,864 7,440
Contact Hours for Developmental Courses1 YR %Change
94 Del Mar College Statistical Profile 2017/18
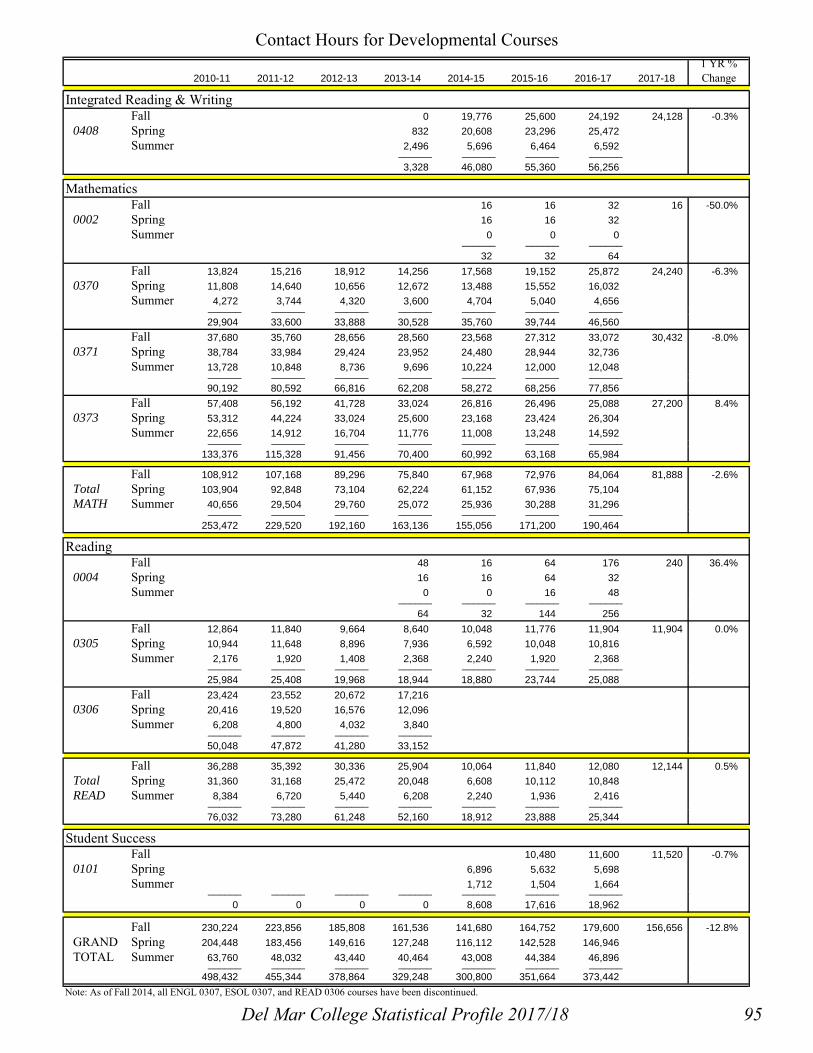
2010-11 2011-12 2012-13 2013-14 2014-15 2015-16 2016-17 2017-18
Contact Hours for Developmental Courses1 YR %Change
Integrated Reading & WritingFall 0 19,776 25,600 24,192 24,128 -0.3%
0408 Spring 832 20,608 23,296 25,472Summer 2,496 5,696 6,464 6,592______ ______ ______ ______
3,328 46,080 55,360 56,256
MathematicsFall 16 16 32 16 -50.0%
0002 Spring 16 16 32Summer 0 0 0______ ______ ______
32 32 64Fall 13,824 15,216 18,912 14,256 17,568 19,152 25,872 24,240 -6.3%
0370 Spring 11,808 14,640 10,656 12,672 13,488 15,552 16,032Summer 4,272 3,744 4,320 3,600 4,704 5,040 4,656______ ______ ______ ______ ______ ______ ______
29,904 33,600 33,888 30,528 35,760 39,744 46,560Fall 37,680 35,760 28,656 28,560 23,568 27,312 33,072 30,432 -8.0%
0371 Spring 38,784 33,984 29,424 23,952 24,480 28,944 32,736Summer 13,728 10,848 8,736 9,696 10,224 12,000 12,048______ ______ ______ ______ ______ ______ ______
90,192 80,592 66,816 62,208 58,272 68,256 77,856Fall 57,408 56,192 41,728 33,024 26,816 26,496 25,088 27,200 8.4%
0373 Spring 53,312 44,224 33,024 25,600 23,168 23,424 26,304Summer 22,656 14,912 16,704 11,776 11,008 13,248 14,592______ ______ ______ ______ ______ ______ ______
133,376 115,328 91,456 70,400 60,992 63,168 65,984
Fall 108,912 107,168 89,296 75,840 67,968 72,976 84,064 81,888 -2.6%Total Spring 103,904 92,848 73,104 62,224 61,152 67,936 75,104MATH Summer 40,656 29,504 29,760 25,072 25,936 30,288 31,296______ ______ ______ ______ ______ ______ ______
253,472 229,520 192,160 163,136 155,056 171,200 190,464
ReadingFall 48 16 64 176 240 36.4%
0004 Spring 16 16 64 32Summer 0 0 16 48______ ______ ______ ______
64 32 144 256Fall 12,864 11,840 9,664 8,640 10,048 11,776 11,904 11,904 0.0%
0305 Spring 10,944 11,648 8,896 7,936 6,592 10,048 10,816Summer 2,176 1,920 1,408 2,368 2,240 1,920 2,368______ ______ ______ ______ ______ ______ ______
25,984 25,408 19,968 18,944 18,880 23,744 25,088Fall 23,424 23,552 20,672 17,216
0306 Spring 20,416 19,520 16,576 12,096Summer 6,208 4,800 4,032 3,840______ ______ ______ ______
50,048 47,872 41,280 33,152
Fall 36,288 35,392 30,336 25,904 10,064 11,840 12,080 12,144 0.5%Total Spring 31,360 31,168 25,472 20,048 6,608 10,112 10,848READ Summer 8,384 6,720 5,440 6,208 2,240 1,936 2,416______ ______ ______ ______ ______ ______ ______
76,032 73,280 61,248 52,160 18,912 23,888 25,344
Student SuccessFall 10,480 11,600 11,520 -0.7%
0101 Spring 6,896 5,632 5,698Summer 1,712 1,504 1,664______ ______ ______ ______ ______ ______ ______
0 0 0 0 8,608 17,616 18,962
Fall 230,224 223,856 185,808 161,536 141,680 164,752 179,600 156,656 -12.8%GRAND Spring 204,448 183,456 149,616 127,248 116,112 142,528 146,946TOTAL Summer 63,760 48,032 43,440 40,464 43,008 44,384 46,896______ ______ ______ ______ ______ ______ ______
498,432 455,344 378,864 329,248 300,800 351,664 373,442Note: As of Fall 2014, all ENGL 0307, ESOL 0307, and READ 0306 courses have been discontinued.
Del Mar College Statistical Profile 2017/18 95

0
50,000
100,000
150,000
200,000
250,000
300,000
2010-11 2011-12 2012-13 2013-14 2014-15 2015-16 2016-17
Annual Contact Hours for Developmental Courses
Math
English
Reading
ESOL
0
20,000
40,000
60,000
80,000
100,000
120,000
2010-11 2011-12 2012-13 2013-14 2014-15 2015-16 2016-17
Contact Hours Not Funded by State Appropriations
Excess Developmental Attempted 3+ times
96 Del Mar College Statistical Profile 2017/18

English Math Reading Academic Technical
2011-12Fall 5,184 5,408 2,112 12,704 33,008 8,144 41,152 53,856Spring 4,704 6,384 3,840 14,928 36,448 8,520 44,968 59,896Summer I 480 1,456 384 2,320 10,176 4,976 15,152 17,472Summer II 368 800 512 1,680 6,192 544 6,736 8,416______ _______ ______ ________ ________ ________ _______ ________ Total 10,736 14,048 6,848 31,632 85,824 22,184 108,008 139,640
2012-13Fall 4,464 6,560 2,560 13,584 35,760 7,152 42,912 56,496Spring 4,096 5,840 2,624 12,560 36,976 7,824 44,800 57,360Summer I 128 1,184 256 1,568 10,912 3,840 14,752 16,320Summer II 256 480 192 928 6,368 496 6,864 7,792______ _______ ______ ________ ________ ________ _______ ________ Total 8,944 14,064 5,632 28,640 90,016 19,312 109,328 137,968
2013-14Fall 1,248 3,120 1,088 5,456 34,080 8,096 42,176 47,632Spring 736 1,776 896 3,408 34,608 6,784 41,392 44,800Summer I 544 896 192 1,632 8,144 4,224 12,368 14,000Summer II 64 560 64 688 5,008 96 5,104 5,792______ _______ ______ ________ ________ ________ _______ ________ Total 2,592 6,352 2,240 11,184 81,840 19,200 101,040 112,224
2014-15Fall 592 2,752 192 3,536 31,936 7,184 39,120 42,656Spring 1,024 2,880 576 4,480 31,472 6,256 37,728 42,208Summer I 0 757 336 1,093 8,496 3,168 11,664 12,757Summer II 128 304 80 512 3,488 224 3,712 4,224______ _______ ______ ________ ________ ________ _______ ________ Total 1,744 6,693 1,184 9,621 75,392 16,832 92,224 101,845
2015-16Fall 2,112 3,248 1,280 6,640 33,840 5,200 39,040 45,680Spring 1,264 2,336 704 4,304 32,736 4,544 37,280 41,584Summer I 240 1,077 128 1,445 7,072 1,344 8,416 9,861Summer II 64 1,076 16 1,156 5,664 880 6,544 7,700______ _______ ______ ________ ________ ________ _______ ________ Total 3,680 7,737 2,128 13,545 79,312 11,968 91,280 104,825
2016-17Fall 1,376 2,954 1,072 5,402 34,416 5,568 39,984 45,386Spring 1,077 2,377 1,248 4,702 31,520 4,624 36,144 40,846Summer I 320 1,291 128 1,739 8,336 1,376 9,712 11,451Summer II 160 912 64 1,136 5,328 992 6,320 7,456______ _______ ______ ________ ________ ________ _______ ________ Total 2,933 7,534 2,512 12,979 79,600 12,560 92,160 105,139
2017-18Fall 816 1,918 384 3,118 30,544 5,488 36,032 39,150
Note: Per Texas Education Code, colleges may not submit for formula funding contact hours attempted by a student enrolled in developmental education course work if cumulative attempted developmental course work exceeds 27 semester credit hours. In addition, colleges may not submit for formula funding any contact hours attempted by a student enrolled in a course containing the same content for the third time or more.
Contact Hours Not Funded by State Appropriations
Developmental Hours in Excess of 27-Hour Limit
Total Excess Developmental
Hours
Contact Hour Enrollment in Courses Attempted for
Third Time or More
Total Third Time
Hours
Total Non-Funded
Hours
Del Mar College Statistical Profile 2017/18 97
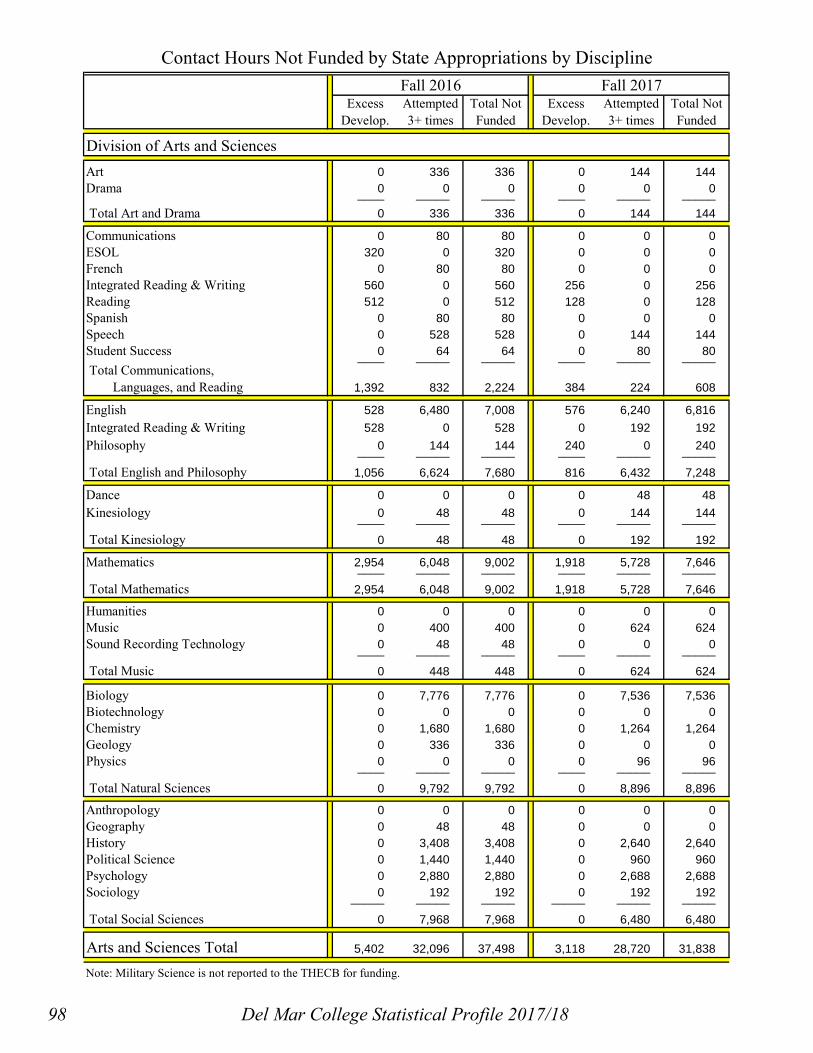
ExcessDevelop.
Attempted3+ times
Total NotFunded
ExcessDevelop.
Attempted3+ times
Total NotFunded
Art 0 336 336 0 144 144Drama 0 0 0 0 0 0____ _____ _____ ____ _____ _____ Total Art and Drama 0 336 336 0 144 144
Communications 0 80 80 0 0 0ESOL 320 0 320 0 0 0French 0 80 80 0 0 0Integrated Reading & Writing 560 0 560 256 0 256Reading 512 0 512 128 0 128Spanish 0 80 80 0 0 0Speech 0 528 528 0 144 144Student Success 0 64 64 0 80 80____ _____ _____ ____ _____ _____ Total Communications, Languages, and Reading 1,392 832 2,224 384 224 608
English 528 6,480 7,008 576 6,240 6,816Integrated Reading & Writing 528 0 528 0 192 192Philosophy 0 144 144 240 0 240____ _____ _____ ____ _____ _____
Total English and Philosophy 1,056 6,624 7,680 816 6,432 7,248
Dance 0 0 0 0 48 48Kinesiology 0 48 48 0 144 144____ _____ _____ ____ _____ _____
Total Kinesiology 0 48 48 0 192 192
Mathematics 2,954 6,048 9,002 1,918 5,728 7,646____ _____ _____ ____ _____ _____
Total Mathematics 2,954 6,048 9,002 1,918 5,728 7,646
Humanities 0 0 0 0 0 0Music 0 400 400 0 624 624Sound Recording Technology 0 48 48 0 0 0____ _____ _____ ____ _____ _____
Total Music 0 448 448 0 624 624
Biology 0 7,776 7,776 0 7,536 7,536Biotechnology 0 0 0 0 0 0Chemistry 0 1,680 1,680 0 1,264 1,264Geology 0 336 336 0 0 0Physics 0 0 0 0 96 96____ _____ _____ ____ _____ _____
Total Natural Sciences 0 9,792 9,792 0 8,896 8,896
Anthropology 0 0 0 0 0 0Geography 0 48 48 0 0 0History 0 3,408 3,408 0 2,640 2,640Political Science 0 1,440 1,440 0 960 960Psychology 0 2,880 2,880 0 2,688 2,688Sociology 0 192 192 0 192 192_____ _____ _____ _____ _____ _____
Total Social Sciences 0 7,968 7,968 0 6,480 6,480
Arts and Sciences Total 5,402 32,096 37,498 3,118 28,720 31,838
Note: Military Science is not reported to the THECB for funding.
Fall 2017
Contact Hours Not Funded by State Appropriations by Discipline
Division of Arts and Sciences
Fall 2016
98 Del Mar College Statistical Profile 2017/18

ExcessDevelop.
Attempted3+ times
Total NotFunded
ExcessDevelop.
Attempted3+ times
Total NotFunded
Fall 2017
Contact Hours Not Funded by State Appropriations by DisciplineFall 2016
Accounting 0 288 288 0 240 240Business 0 288 288 0 144 144Business Technology 0 48 48 0 48 48Court Reporting 0 1,952 1,952 0 1,760 1,760Economics 0 864 864 0 816 816Legal Professions 0 0 0 0 192 192Management Development 0 48 48 0 0 0____ _____ _____ ____ _____ _____ Total Business Administration 0 3,488 3,488 0 3,200 3,200
Environmental/Petrochem Lab Tech 0 0 0 0 0 0Electroplating 0 0 0 0 0 0Industrial Machining Applied Technology 0 64 64 0 0 0Instrumentation 0 0 0 0 0 0Nondestructive Testing 0 0 0 0 0 0Occupational Learning (Industrial Ed)* 0 144 144 0 144 144Process Technology 0 240 240 0 384 384Welding Applied Technology 0 320 320 0 672 672____ _____ _____ ____ _____ _____ Total Industrial Education* 0 768 768 0 1,200 1,200
Criminal Justice Transfer 0 48 48 0 0 0Emergency Medical Services Professions 0 0 0 0 96 96Fire Science/Fire Academy 0 0 0 0 0 0Law Enforcement 0 0 0 0 0 0Occupational Safety and Health 0 0 0 0 0 0____ _____ _____ ____ _____ _____ Total Public Safety Education 0 48 48 0 96 96
Air Conditioning Applied Technology 0 0 0 0 160 160Airframe Applied Technology* 0 0 0 0 0 0Architectural Technology* 0 48 48 0 48 48Auto Body Applied Technology 0 256 256 0 0 0Automotive Applied Technology 0 0 0 0 0 0Building Maintenance Appl. Tech. 0 0 0 0 0 0Diesel Applied Technology 0 0 0 0 0 0Drafting Technology* 0 0 0 0 0 0____ _____ _____ ____ _____ _____ Total Technology Education** 0 304 304 0 208 208
Business, Industrual & Public Safety Education Total 0 4,608 4,608 0 4,704 4,704
Note: Former Industrial Education** and Technology Education* departments were re-aligned in Fall 2015.
Division of Business, Industrial and Public Safety Education
Del Mar College Statistical Profile 2017/18 99
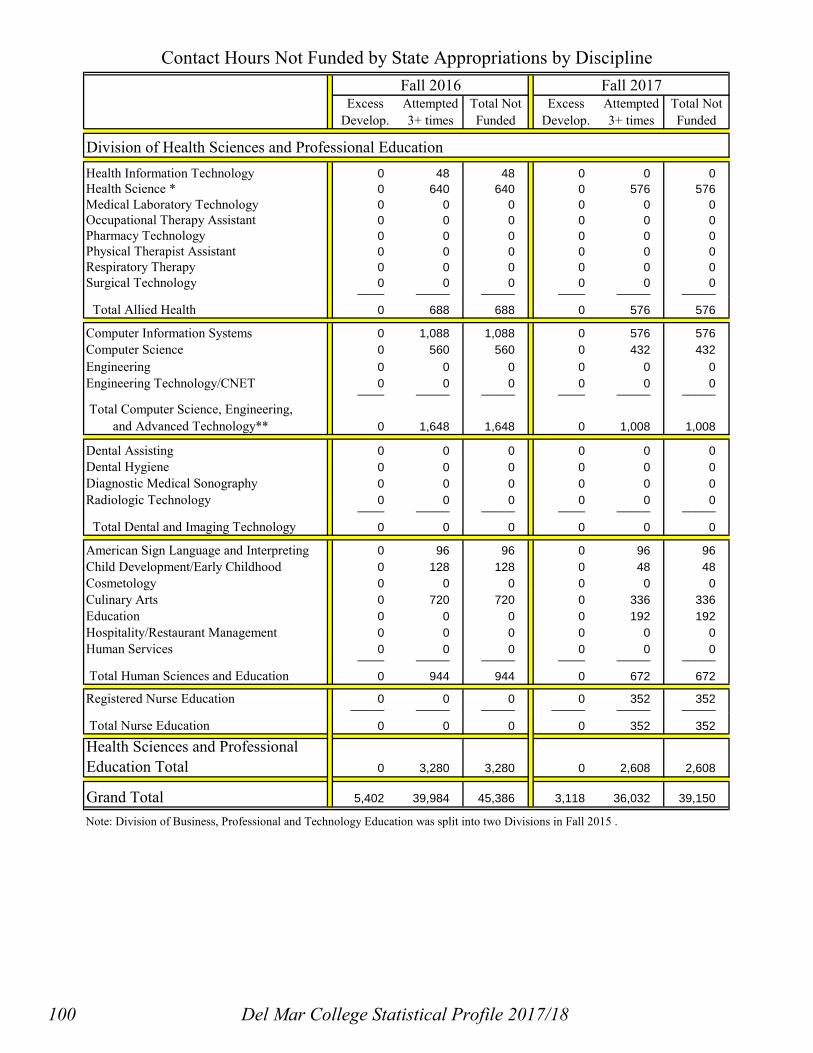
ExcessDevelop.
Attempted3+ times
Total NotFunded
ExcessDevelop.
Attempted3+ times
Total NotFunded
Fall 2017
Contact Hours Not Funded by State Appropriations by DisciplineFall 2016
Health Information Technology 0 48 48 0 0 0Health Science * 0 640 640 0 576 576Medical Laboratory Technology 0 0 0 0 0 0Occupational Therapy Assistant 0 0 0 0 0 0Pharmacy Technology 0 0 0 0 0 0Physical Therapist Assistant 0 0 0 0 0 0Respiratory Therapy 0 0 0 0 0 0Surgical Technology 0 0 0 0 0 0____ _____ _____ ____ _____ _____
Total Allied Health 0 688 688 0 576 576
Computer Information Systems 0 1,088 1,088 0 576 576Computer Science 0 560 560 0 432 432Engineering 0 0 0 0 0 0Engineering Technology/CNET 0 0 0 0 0 0____ _____ _____ ____ _____ _____
Total Computer Science, Engineering, and Advanced Technology** 0 1,648 1,648 0 1,008 1,008
Dental Assisting 0 0 0 0 0 0Dental Hygiene 0 0 0 0 0 0Diagnostic Medical Sonography 0 0 0 0 0 0Radiologic Technology 0 0 0 0 0 0____ _____ _____ ____ _____ _____
Total Dental and Imaging Technology 0 0 0 0 0 0
American Sign Language and Interpreting 0 96 96 0 96 96Child Development/Early Childhood 0 128 128 0 48 48Cosmetology 0 0 0 0 0 0Culinary Arts 0 720 720 0 336 336Education 0 0 0 0 192 192Hospitality/Restaurant Management 0 0 0 0 0 0Human Services 0 0 0 0 0 0____ _____ _____ ____ _____ _____
Total Human Sciences and Education 0 944 944 0 672 672
Registered Nurse Education 0 0 0 0 352 352_____ _____ _____ _____ _____ _____
Total Nurse Education 0 0 0 0 352 352
Health Sciences and Professional Education Total 0 3,280 3,280 0 2,608 2,608
Grand Total 5,402 39,984 45,386 3,118 36,032 39,150
Note: Division of Business, Professional and Technology Education was split into two Divisions in Fall 2015 .
Division of Health Sciences and Professional Education
100 Del Mar College Statistical Profile 2017/18

Del Mar College Statistical Profile
Semester Hours and Grades Terms and Definitions
Semester Credit Hours (SCH)
Semester credit hours (SCH) are the units of credit students earn for the courses in which they are enrolled in a given semester. A typical class meeting three hours per week in a Fall or Spring semester counts for three semester credit hours.
Enrollments
A tally of the number of students enrolled in a given course section (class). Since individual students may be enrolled in more than one course section, they may be counted more than once in any summary report. A grade is awarded for each class enrollment.
Full-time
A full-time student is one enrolled in 12 or more credit hours in a Fall or Spring semester—or six hours or more in a summer semester.
Full-time Student Equivalent (FTE)
Full-time student equivalent (FTE) is a measure of student instructional activity (course taking, etc.) as if full-time students were generating all of the activity. FTE is calculated by dividing by 12 the total number of semester credit hours generated in a given period—usually one Fall or Spring semester.
Full-Time Equivalent (FTE) Staff
Full-time equivalent (FTE) staff is a measure of staff activity based on a sum of the percentage of effort of all staff being counted. Part-time staff effort is computed using a ratio based on the hours worked in relation to full-time employees. For example, one half-time employee plus one full-time employee equals one and one-half FTE.
Highlights
• In Fall 2017, Del Mar College students enrolled for a total of 92,131 semester credit hours, a decrease of 2.7 percent over Fall 2016.
• The Fall 2017 FTE-student-to-FTE-teaching staff ratio was 14.96 to 1 overall, with the Division of Arts and Sciences having the highest ratio (20.90 to 1) and the Health Sciences and Professional Education programs the lowest (7.64 to 1).
• Over four-fifths (81.1%) of all semester credit hours in Fall 2017 were taught by full-time faculty. The Department of Mathematics had the highest (32.3%) and the Department of Industrial Education had the lowest (1.6%) with only 105 of 6,488 semester credit hours taught by part-time faculty in Fall 2017.
• The average class size for Fall 2017 was 17.6 students per class. The Division of Arts and Sciences had the largest average class size at 20.2. The Division of Business, Industrial, and Public Safety Education had an average of 13.8 students per class during that term and the Division of Health Sciences and Professional Education’s average was 14.4 students per class.
• In Fall 2017, 73 percent of all grades earned in college-level courses were As, Bs, or Cs. The College-wide withdrawal rate in Fall 2017 was 10.2 percent.
Del Mar College Statistical Profile 2017/18 101

Chapter Summary Semester Credit Hours
The Division of Arts and Sciences generated 65.6 percent of total College semester credit hours in Fall 2017. The Division of Business, Industrial, and Public Safety Education generated 20.6 percent of total semester credit hours . About 13.8 percent of total semester credit hours were generated by the Division of Health Sciences and Professional Education. Annual total semester credit hours increased by five percent between 2015-2016 and 2016-2017. Fall semester credit hours decreased by 2.7 percent from Fall 2016 to Fall 2017.
Full-Time Equivalency
Of the 18 departments, 13 had an increase in student FTE from Fall 2016 to Fall 2017—the three highest being the Departments of Public Safety (+14.1%), Computer Science, Engineering, and Advanced Technology (+11.3%), and English and Philosophy (+9.7%). Five departments had a decrease compared to the prior Fall. The most significant decreases were in the Departments of Industrial Education (9.1%) and Nurse Education (-2.5%).
The College-wide full-time-student-to-teaching staff ratio decreased from 15.71 to 1 in Fall 2016 to 15 to 1 in Fall 2017. By division, the student-to-teaching staff ratio was 20.9 in the Division of Arts and Sciences, 11.84 in the Division of Business, Industrial, and Public Safety Education, and Division of Health Sciences and Professional Education had a ratio of 7.64 to 1.
In the Fall of 2017, 18.9 percent of semester credit hours were taught by part-time faculty, compared to 20.1 percent in Fall 2016 and 20.9 percent in Fall 2015.
Average Class Size
The average class size for Fall 2017 decreased to 17.6 students, as compared to 17.9 in Fall 2016. The programs with the largest average class size in Fall 2017 were Occupational Safety and Health (30.9), Biology (28.0), and Business (26.8). Those with the smallest average class size were Applied Music (2.2), Industrial Machining Applied Technology (3.8), and Avionics (4.0).
College-Level Courses Grades
In the Fall of 2017 successful completions (A-C grades) experienced a decrease of 1.7 percentage points, while failures (grade of F) increased, with 10.1 percent of the students receiving a grade of F, compared to 9.3 percent in Fall 2016.
Students withdrew from 10.2 percent of their college-level courses during the Fall 2017 semester, with that rate increasing by 0.2 percentage points from Fall 2016. Withdrawal rates were higher in the Division of Arts and Sciences (12.4%) and Division of Business, Industrial, and Public Safety Education (6.6%) in Fall 2017 with a nearly one percent decrease in Health Science and Professional Education (7.0%).
The overall course grade-point average (GPA) for Fall 2017 was stable, with a very slight decrease to 2.78 from the Fall 2016 GPA of 2.79. The summer course grade-point average historically has been higher than Fall and Spring, averaging 3.00 in Summer 2017.
Historically, the percentage of A-C grades in the Division of Business, Industrial and Public Safety Education has been higher than the College-wide average. In the Fall of 2017, the College average was 73.0 percent and the Division of Business, Industrial and Public Safety Education was 79.5 percent.
Developmental Courses Grades
Over a quarter of developmental course enrollments (27.7%) resulted in a grade of R (repeat required), and another 11.6 percent ended in a withdrawal, yielding a 60.5 percent successful completion rate (A-C grades) in developmental courses during Fall 2017. This is a 0.7 percentage point increase in the rate of successful completions compared to Fall 2016 (59.8%).
Summer semesters historically have higher passing rates for developmental courses than Fall and Spring semesters, with Summer 2017 yielding a 69.4 percent successful completion rate, which has decreased from Summer 2016 (73.3%).
102 Del Mar College Statistical Profile 2017/18

2015-16 2016-17 2017-18
Fall Spring Summer Total Fall Spring Summer Total FallArt 1,308 1,176 213 2,697 1,347 1,155 117 2,619 1,125
Drama 1,062 918 390 2,370 1,078 916 213 2,207 1,170______ ______ ______ _______ ______ ______ ______ _______ ______
Art and Drama 2,370 2,094 603 5,067 2,425 2,071 330 4,826 2,295
Communications 353 402 35 790 391 402 75 868 429
ESOL^ 120 687 66 873 108 183 114 405 0
French 32 64 0 96 56 68 0 124 48
Freshman Seminar 856 352 94 1,302 725 373 104 1,202 720
Integrated Reading & Writing 556 744 212 1,512 724 840 192 1,756 708
Reading 575 475 124 1,174 569 507 113 1,189 573
Spanish 2,826 598 348 3,772 650 586 356 1,592 546
Speech 655 2,718 1,446 4,819 2,943 2,874 1,662 7,479 3,012______ ______ ______ _______ ______ ______ ______ _______ ______
5,973 6,040 2,325 14,338 6,166 5,833 2,616 14,615 6,036
English 10,490 8,809 2,046 21,345 11,310 9,164 2,374 22,848 10,129
Integrated Reading & Writing 744 712 192 1,648 792 752 457 2,001 800
Philosophy 1,194 1,017 531 2,742 930 1,056 564 2,550 948______ ______ ______ _______ ______ ______ ______ _______ ______
12,428 10,538 2,769 25,735 13,032 10,972 3,395 27,399 11,877
Dance 166 213 135 514 213 227 72 512 222
Kinesiology 1,594 1,850 683 4,127 1,665 1,801 830 4,296 1,618______ ______ ______ _______ ______ ______ ______ _______ ______
1,760 2,063 818 4,641 1,878 2,028 902 4,808 1,840
Mathematics 10,006 9,783 4,511 24,300 11,364 10,013 4,414 25,791 10,965______ ______ ______ _______ ______ ______ ______ _______ ______
10,006 9,783 4,511 24,300 11,364 10,013 4,414 25,791 10,965
Humanities 612 582 165 1,359 594 570 144 1,308 624
Music 1,305 1,283 307 2,895 1,362 1,138 264 2,764 1,235
Music Applied 402 379 33 814 358 362 21 741 317
Sound Recording Technology 223 174 0 397 198 150 0 348 174______ ______ ______ _______ ______ ______ ______ _______ ______
2,542 2,418 505 5,465 2,512 2,220 429 5,161 2,350
Biology 5,605 5,397 2,212 13,214 6,018 5,795 2,467 14,280 6,172Biotechnology 124 136 27 287 136 60 21 217 32
Chemistry 1,816 1,766 737 4,319 2,021 1,744 706 4,471 1,850
Geology 1,059 1,134 229 2,422 1,068 951 164 2,183 1,017
Physics 272 288 68 628 238 238 28 504 175______ ______ ______ _______ ______ ______ ______ _______ ______
8,876 8,721 3,273 20,870 9,481 8,788 3,386 21,655 9,246
Anthropology 51 27 78 63 36 0 99 60
Geography 39 45 36 120 138 99 39 276 126
History 5,583 5,358 1,659 12,600 5,988 5,307 1,737 13,032 5,892
Military Science 4 1 0 5 3 1 0 4 3
Political Science 4,545 4,431 2,055 11,031 4,743 4,473 1,968 11,184 4,722
Psychology 3,594 3,129 1,149 7,872 3,651 3,378 1,338 8,367 3,750
Social Work 45 27 36 108 24 75 39 138 36
Sociology 1,314 1,413 465 3,192 1,413 1,560 501 3,474 1,278______ ______ ______ _______ _______ ______ ______ _______ _______
15,175 14,431 5,400 35,006 16,023 14,929 5,622 36,574 15,867
59,130 56,088 20,204 135,422 62,881 56,854 21,094 140,829 60,476
^ESOL Classes in Fall 2017 were flex entry courses reported to THECB in Spring 2018
Semester Credit Hours for Arts and Sciences
Communications, Languages, and Reading
English and Philosophy
Kinesiology
Mathematics
Music
Natural Sciences
Social Sciences
Arts and Sciences
Del Mar College Statistical Profile 2017/18 103

2015-16 2016-17 2017-18Fall Spring Summer Total Fall Spring Summer Total Fall
Accounting+960 1,077 468 2,505 1,104 1,131 483 2,718 1,134
Business 1,089 1,194 513 2,796 1,278 1,149 588 3,015 1,284
Business Technology 321 245 118 684 219 201 56 476 141
Court Reporting 481 472 170 1,123 436 492 170 1,098 504
Economics 1,560 1,527 723 3,810 1,587 1,602 720 3,909 1,590
Legal Professions 341 311 8 660 445 408 16 869 459
Management Development 549 772 185 1,506 765 735 169 1,669 735______ ______ ______ _______ ______ ______ ______ _______ ______
5,301 5,598 2,185 13,084 5,834 5,718 2,202 13,754 5,847
Enviro/Petrochem Lab Tech 458 376 140 974 405 344 112 861 502
Electroplating 0 0 48 48 0 0 60 60 0
Industrial Machining Appl Tech 243 312 168 723 414 294 168 876 315
Instrumentation 219 0 0 219 359 570 181 1,110 462
Nondestructive Testing 191 245 165 601 226 325 202 753 315
Occupational Learning** 663 630 309 1,602 690 609 432 1,731 765
Process Technology 1,269 1,347 859 3,475 1,637 2,053 1,035 4,725 1,916
Welding Applied Technology 1,682 1,860 902 4,444 2,528 2,559 864 5,951 2,213______ ______ ______ _______ ______ ______ ______ _______ ______
4,725 4,770 2,591 12,086 6,259 6,754 3,054 16,067 6,488
Criminal Justice Transfer 1,164 1,002 282 2,448 987 933 321 2,241 948Emergency Medical Service Prof. 742 1,196 974 2,912 509 620 884 2,013 571
Fire Science/Fire Academy 496 554 343 1,393 684 1,089 195 1,968 453
Law Enforcement 380 0 860 1,240 360 0 560 920 260
Occupational Safety and Health 1,249 1,288 680 3,217 1,036 1,360 679 3,075 901______ ______ ______ _______ ______ ______ ______ _______ ______
4,031 4,040 3,139 11,210 3,576 4,002 2,639 10,217 3,133
A/C Applied Technology 498 534 340 1,372 778 878 482 2,138 729
Architectural Technology* 450 515 228 1,193 580 631 153 1,364 746
Aviation Maintenance* 231 595 519 1,345 301 601 398 1,300 169
Avionics* 74 93 6 173 0 18 6 24 12
Drafting Technology* 261 260 108 629 253 320 213 786 169
Auto Body Applied Tech 74 108 59 241 100 120 97 317 157
Automotive Applied Tech 664 705 214 1,583 727 721 258 1,706 657
Building Maint Appl Tech 193 122 373 688 275 210 376 861 382
Diesel Applied Technology 377 387 301 1,065 401 343 331 1,075 475______ ______ ______ _______ ______ ______ ______ _______ ______
2,822 3,319 2,148 8,289 3,415 3,842 2,314 9,571 3,496
16,879 17,727 10,063 44,669 19,084 20,316 10,209 49,609 18,964
* Technology Ed Department renamed to Industrial Ed Department. ARCH/DFTG, AERM, and AVNC program moved.
** Industrial Ed Department renamed to Technology Education Department. Industrial Education program renamed and moved.
Note 1: Classes started after 12 class day.
Note 2: INTC moved from Computer Information Systems to TECH
Note 3: + Accounting includes both transfers and technical programs
Business, Industrial and Public Safety Education
Technology Education**
Semester Credit Hours for Business, Industrial and Public Safety Education
Business Administration
Industrial Education*
Public Safety Education
104 Del Mar College Statistical Profile 2017/18
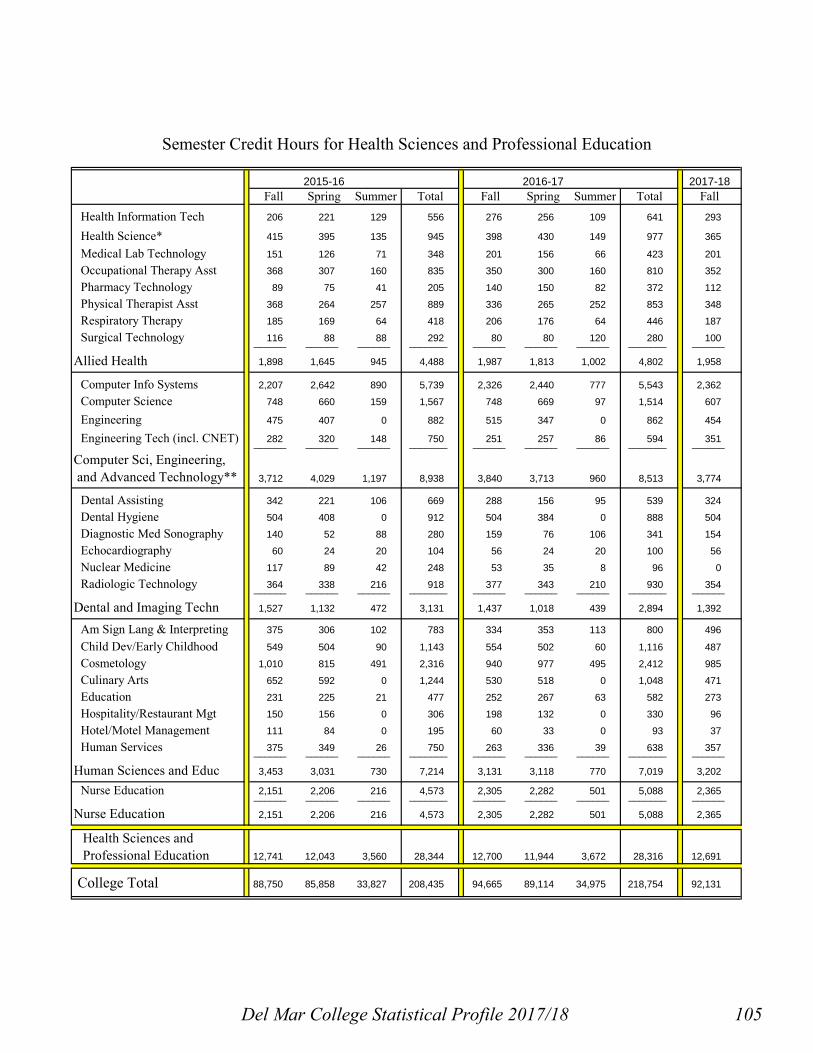
2015-16 2016-17 2017-18Fall Spring Summer Total Fall Spring Summer Total Fall
Health Information Tech 206 221 129 556 276 256 109 641 293
Health Science* 415 395 135 945 398 430 149 977 365
Medical Lab Technology 151 126 71 348 201 156 66 423 201
Occupational Therapy Asst 368 307 160 835 350 300 160 810 352
Pharmacy Technology 89 75 41 205 140 150 82 372 112
Physical Therapist Asst 368 264 257 889 336 265 252 853 348
Respiratory Therapy 185 169 64 418 206 176 64 446 187
Surgical Technology 116 88 88 292 80 80 120 280 100______ ______ ______ _______ ______ ______ ______ _______ ______
1,898 1,645 945 4,488 1,987 1,813 1,002 4,802 1,958
Computer Info Systems 2,207 2,642 890 5,739 2,326 2,440 777 5,543 2,362
Computer Science 748 660 159 1,567 748 669 97 1,514 607
Engineering 475 407 0 882 515 347 0 862 454
Engineering Tech (incl. CNET) 282 320 148 750 251 257 86 594 351______ ______ ______ _______ ______ ______ ______ _______ ______
3,712 4,029 1,197 8,938 3,840 3,713 960 8,513 3,774
Dental Assisting 342 221 106 669 288 156 95 539 324
Dental Hygiene 504 408 0 912 504 384 0 888 504
Diagnostic Med Sonography 140 52 88 280 159 76 106 341 154
Echocardiography 60 24 20 104 56 24 20 100 56
Nuclear Medicine 117 89 42 248 53 35 8 96 0
Radiologic Technology 364 338 216 918 377 343 210 930 354______ ______ ______ _______ ______ ______ ______ _______ ______
1,527 1,132 472 3,131 1,437 1,018 439 2,894 1,392
Am Sign Lang & Interpreting 375 306 102 783 334 353 113 800 496
Child Dev/Early Childhood 549 504 90 1,143 554 502 60 1,116 487
Cosmetology 1,010 815 491 2,316 940 977 495 2,412 985
Culinary Arts 652 592 0 1,244 530 518 0 1,048 471
Education 231 225 21 477 252 267 63 582 273
Hospitality/Restaurant Mgt 150 156 0 306 198 132 0 330 96
Hotel/Motel Management 111 84 0 195 60 33 0 93 37
Human Services 375 349 26 750 263 336 39 638 357______ ______ ______ _______ ______ ______ ______ _______ ______
3,453 3,031 730 7,214 3,131 3,118 770 7,019 3,202
Nurse Education 2,151 2,206 216 4,573 2,305 2,282 501 5,088 2,365______ ______ ______ _______ ______ ______ ______ _______ ______
2,151 2,206 216 4,573 2,305 2,282 501 5,088 2,365
12,741 12,043 3,560 28,344 12,700 11,944 3,672 28,316 12,691
College Total 88,750 85,858 33,827 208,435 94,665 89,114 34,975 218,754 92,131
Dental and Imaging Techn
Human Sciences and Educ
Nurse Education
Health Sciences and Professional Education
Semester Credit Hours for Health Sciences and Professional Education
Allied Health
Computer Sci, Engineering, and Advanced Technology**
Del Mar College Statistical Profile 2017/18 105

Student StudentTeaching FTE to Teaching FTE to
Student Staff Teaching Student Staff TeachingFTE FTE Staff FTE FTE FTE Staff FTE
Arts and SciencesArt and Drama 202.08 14.10 14.33 191.25 13.89 13.77
Communications, Languages, and Reading
513.83 27.53 18.66 503.00 27.14 18.53
English and Philosophy 1,086.00 48.14 22.56 989.75 48.80 20.28
Kinesiology 156.50 8.21 19.06 153.33 7.97 19.24
Mathematics 947.00 46.84 20.22 913.75 46.44 19.68
Music 209.33 22.87 9.15 195.83 21.63 9.05
Natural Sciences 790.08 31.67 24.95 770.50 32.35 23.82
Social Sciences 1,335.25 41.57 32.12 1,322.25 42.97 30.77________ ______ ______ ________ ______ ______
Arts and Sciences Total 5,240.08 240.93 21.75 5,039.67 241.19 20.90
Business, Industrial, and Public Safety EducationBusiness Administration 486.17 22.85 21.28 487.25 23.42 20.80
Industrial Education 491.67 45.95 10.70 540.67 55.05 9.82
Public Safety Education 298.00 21.12 14.11 261.08 20.69 12.62
Technology Education 284.58 31.48 9.04 291.33 34.33 8.49________ ______ ______ ________ ______ ______Business, Ind & Pub Safety Ed Total 1,560.42 121.40 12.85 1,580.33 133.49 11.84
Health Sciences and Professional EducationAllied Health 165.58 28.15 5.88 163.17 27.08 6.03
Computer Science, Engineering, and Advanced Technology*
349.92 24.68 14.18 314.50 25.25 12.46
Dental and Imaging Technology 119.75 28.64 4.18 116.00 26.41 4.39
Human Sciences and Education 260.92 20.71 12.60 266.83 19.72 13.53
Nurse Education 192.08 37.55 5.12 197.08 40.05 4.92________ ______ ______ ________ ______ ______Health Sciences and Prof Ed Total 1,088.25 139.73 7.79 1,057.58 138.51 7.64
College Total 7,888.75 502.06 15.71 7,677.58 513.19 14.96
Student FTE to Teaching Staff FTE Ratio by Department
Note: Adjustments have been made in FTE for full-time faculty with teaching loads split between two divisions. Student FTE is calculated as SCH/12.
Fall 2016 Fall 2017
106 Del Mar College Statistical Profile 2017/18

Del Mar College Statistical Profile 2017/18 107

108 Del Mar College Statistical Profile 2017/18

Fall Spring Summer Fall Spring Summer Fall2015 2016 2016 2016 2017 2017 2017
Art 28.9% 29.8% 35.2% 21.4% 28.3% 45.5% 23.5%
Drama 9.6% 10.1% 15.4% 22.5% 22.3% 15.5% 21.3%
Art and Drama 20.3% 21.2% 22.4% 21.9% 25.6% 25.6% 22.4%
Communication 0.0% 0.0% 0.0% 0.0% 0.0% 0.0% 0.0%ESOL 0.0% 43.7% 100.0% 0.0% 47.5% 36.8%French 100.0% 100.0% 100.0%Integrated Reading & Writing 8.4% 40.3% 20.8% 19.3% 14.8% 0.0% 0.0%Reading 47.5% 65.7% 41.1% 53.8% 76.9% 0.0% 45.0%Spanish 17.0% 39.1% 13.8% 43.8% 34.5% 0.0% 19.4%Speech 17.7% 16.2% 18.3% 15.2% 15.6% 11.9% 9.6%Student Success (Freshman Seminar) 36.8% 20.5% 23.4% 40.8% 34.0% 11.5% 41.7%
20.2% 28.5% 21.3% 24.8% 24.8% 9.6% 16.6%
English 39.1% 35.6% 3.1% 35.6% 24.1% 6.8% 35.8%Integrated Reading & Writing 38.7% 24.7% 35.4% 33.3% 40.4% 18.2% 15.5%Philosophy 24.4% 0.0% 0.0% 0.0% 6.8% 0.0% 0.0%
37.6% 31.4% 4.7% 32.9% 23.5% 6.4% 31.6%
Dance 0.0% 0.0% 0.0% 0.0% 0.0% 0.0% 0.0%Kinesiology 2.9% 0.0% 0.0% 4.2% 9.7% 6.3% 0.0%
Kinesiology 2.6% 0.0% 0.0% 3.7% 8.6% 5.8% 0.0%
Mathematics 36.9% 34.3% 46.3% 42.5% 34.1% 37.3% 32.3%
Mathematics 36.9% 34.3% 46.3% 42.5% 34.1% 37.3% 32.3%
Humanities 2.5% 0.0% 20.0% 0.0% 6.8% 0.0% 0.0%Music 6.9% 3.8% 0.0% 6.2% 1.6% 0.0% 3.7%Music Applied 17.2% 9.8% 12.1% 11.2% 13.0% 14.3% 8.8%Sound Recording Technology 37.7% 43.1% 28.8% 20.0% 36.2%
Music 10.1% 6.7% 7.3% 7.2% 6.0% 0.7% 5.8%
Biology 21.1% 24.2% 27.8% 14.2% 12.9% 31.3% 19.1%Biotechnology ** 0.0% 14.7% 100.0% 32.4% 0.0% 0.0% 0.0%Chemistry 22.5% 26.7% 33.6% 15.6% 15.8% 16.1% 23.6%Geology 0.0% 0.0% 0.0% 0.0% 0.0% 0.0% 0.0%Physics 20.6% 0.0% 0.0% 0.0% 0.0% 0.0% 0.0%
Natural Sciences 18.6% 20.6% 27.2% 12.8% 11.6% 26.2% 17.5%
Anthropology 100.0% 100.0% 100.0% 100.0% 100.0%Geography 100.0% 100.0% 100.0% 100.0% 100.0% 100.0% 100.0%History 11.6% 12.6% 0.0% 11.1% 21.0% 0.0% 17.9%Military Science 100.0% 100.0% 100.0% 100.0% 100.0%Political Science 24.4% 18.9% 0.0% 18.4% 20.9% 7.3% 13.0%Psychology 26.9% 13.6% 12.0% 29.3% 22.3% 11.0% 30.6%Social Work 100.0% 100.0% 100.0% 100.0% 100.0%Sociology 13.9% 36.3% 0.0% 13.4% 24.6% 0.0% 41.3%
Social Sciences 20.1% 17.7% 3.9% 18.9% 22.7% 6.6% 22.5%
25.5% 23.8% 19.7% 24.9% 22.3% 16.9% 23.4%
**Starting in Spring 2011 Biotechnology includes BIOL-1414 and BIOL-1415 courses in Semester Credit Hour totals.
Percent of Semester Credit Hours Taught by Part-time Faculty
Arts and Sciences Total
Division of Arts and Sciences
Communications, Languages, and Reading
English and Philosophy
Del Mar College Statistical Profile 2017/18 109

Fall Spring Summer Fall Spring Summer Fall2015 2016 2016 2016 2017 2017 2017
Accounting* 15.9% 15.3% 6.4% 13.9% 10.9% 17.4% 9.8%Business 25.6% 39.7% 38.6% 44.6% 42.6% 38.3% 25.2%
Business Technology 43.9% 17.1% 50.8% 37.0% 37.3% 0.0% 19.1%
Court Reporting 0.0% 0.0% 0.0% 0.0% 0.0% 0.0% 0.0%Economics 9.0% 10.2% 33.2% 5.1% 2.8% 44.2% 8.1%Legal Professions 61.6% 59.8% 57.3% 44.1% 0.0% 58.8%Management Development 21.3% 27.6% 22.7% 19.2% 15.5% 17.8% 12.7%
Business Administration 19.6% 22.1% 26.1% 22.1% 17.9% 29.8% 16.3%
Air Conditioning Applied Technology 22.9% 21.0% 11.5% 29.2% 17.3% 9.3% 13.6%Architectural Technology* 0.0% 25.6% 3.9% 8.8% 20.0% 0.0% 31.8%
Aviation Maintenance 0.0% 11.1% 6.8% 0.0% 0.0% 0.0% 17.8%
Avionics 0.0% 0.0% 0.0% 0.0% 0.0% 0.0%Drafting Technology 13.8% 0.8% 0.0% 0.0% 19.7% 0.0% 10.7%Auto Body Applied Technology 0.0% 0.0% 0.0% 0.0% 0.0% 0.0% 0.0%Automotive Applied Technology 4.2% 3.7% 0.0% 4.3% 8.3% 0.0% 0.0%Building Maint Applied Technology 0.0% 0.0% 4.8% 0.0% 0.0% 0.0% 0.0%Diesel Applied Technology 0.0% 0.0% 0.0% 0.0% 0.0% 0.0% 6.9%
Technology Education** 6.3% 10.2% 4.6% 9.0% 10.4% 1.9% 11.9%
Criminal Justice Transfer 6.7% 0.0% 0.0% 0.0% 0.0% 0.0% 0.0%
Emergency Medical Services Prof. 11.9% 20.8% 0.0% 6.9% 4.2% 10.2% 4.7%Fire Science/Fire Academy 42.3% 43.7% 19.7% 27.5% 33.2% 38.5% 36.9%Law Enforcement 0.0% 0.0% 0.0% 0.0% 0.0%Occupational Safety and Health 0.0% 6.1% 0.0% 0.0% 5.5% 0.0% 0.0%
Public Safety Education 9.3% 14.1% 2.2% 6.2% 11.6% 6.3% 6.2%
Electroplating 0.0% 0.0%Environmental/Petrochem Lab Tech 0.0% 0.0% 0.0% 0.0% 0.0% 0.0% 0.0%Industrial Machining Appl Tech 24.7% 26.0% 28.6% 15.2% 32.7% 22.3% 33.3%Instrumentation 5.4% 0.0% 0.0% 0.0% 0.0% 0.0%Nondestructive Testing 29.3% 26.9% 0.0% 0.0% 0.0% 0.0% 0.0%Occupational Learning** 0.0% 0.0% 0.0% 0.0% 0.0% 0.0% 0.0%Process Technology 10.4% 9.6% 10.5% 11.0% 0.0% 0.0% 0.0%Welding Applied Technology 0.0% 0.0% 0.0% 0.0% 0.0% 0.0% 0.0%
Industrial Education* 5.2% 5.8% 5.1% 3.9% 1.4% 1.2% 1.6%
10.9% 13.5% 8.6% 10.8% 9.8% 8.9% 8.8%
Business, Industrial and Public Safety Education Total
Percent of Semester Credit Hours Taught by Part-time FacultyDivision of Business, Industrial, and Public Safety Education
110 Del Mar College Statistical Profile 2017/18

Fall Spring Summer Fall Spring Summer Fall2015 2016 2016 2016 2017 2017 2017
Health Information Technology 49.5% 74.7% 96.1% 46.0% 65.2% 96.3% 45.1%
Health Science* 5.5% 5.1% 0.0% 4.0% 3.0% 6.0% 2.7%
Medical Lab Technology 6.8% 7.6% 25.4% 7.2% 1.9% 21.8% 8.0%Occupational Therapy Assistant 7.5% 16.4% 9.0% 7.4% 2.7% 2.5% 15.6%Pharmacy Technology 0.0% 0.0% 0.0% 0.0% 0.0% 0.0% 0.0%Physical Therapy Assistant 16.9% 7.9% 0.0% 12.8% 10.9% 7.9% 10.6%Respiratory Therapy 11.1% 9.3% 0.0% 14.8% 11.9% 0.0% 10.7%Surgical Technology 26.6% 27.5% 21.0% 27.5% 27.5% 31.0% 32.0%
Allied Health 14.6% 18.6% 21.9% 14.0% 14.5% 18.9% 15.4%
Computer Information Systems 19.8% 15.8% 9.3% 6.7% 7.9% 4.6% 11.8%Computer Science 5.6% 9.1% 1.9% 8.0% 15.8% 0.0% 7.4%Computer-Network Electronic Tech 14.9% 0.0% 0.0% 0.0% 0.0% 0.0% 0.0%Engineering 0.0% 0.0% 8.5% 4.3% 4.4%
14.0% 11.5% 6.9% 6.8% 8.5% 3.8% 9.1%
Dental Assisting 18.3% 48.8% 2.8% 0.0% 0.0% 5.1% 0.0%Dental Hygiene 13.7% 14.8% 8.3% 29.7% 27.6%Diagnostic Medical Sonography 22.1% 14.4% 19.6% 6.9% 15.8% 22.6% 9.7%Echocardiography 0.0% 0.0% 0.0% 0.0% 0.0% 0.0% 0.0%Nuclear Medicine 0.0% 0.0% 0.0% 26.4% 0.0% 0.0%Radiologic Technology 18.0% 18.2% 17.5% 16.5% 17.5% 20.6% 16.9%
Dental and Imaging Technology 14.9% 21.0% 12.3% 9.0% 18.3% 19.6% 18.2%
American Sign Lang & Interpreting 12.3% 0.0% 14.4% 1.8% 28.2%
Child Develop/Early Childhood 0.0% 0.0% 0.0% 0.0% 0.0% 0.0% 0.0%Cosmetology 0.0% 0.0% 0.0% 0.0% 0.0% 0.0% 0.0%
Culinary Arts 31.7% 21.3% 30.6% 17.4% 15.9%Education 0.0% 0.0% 0.0% 0.0% 0.0% 0.0%Hospitality/Restaurant Management 0.0% 0.0% 0.0% 0.0% 0.0%Hotel/Motel Management 62.2% 64.3% 25.0% 54.5% 40.5%Human Services 26.9% 9.5% 0.0% 28.5% 32.1% 0.0% 22.7%
Human Sciences and Education 12.3% 7.8% 0.0% 9.6% 9.6% 0.3% 9.7%
Nurse Education 7.7% 0.0% 2.1% 12.8% 12.9% 19.9% 16.8%
Nurse Education 7.7% 0.0% 2.1% 12.8% 12.9% 19.9% 16.8%
12.7% 10.5% 9.5% 9.9% 11.3% 10.9% 12.4%
20.9% 19.9% 15.4% 20.1% 18.0% 13.9% 18.9% All Credit Courses
Computer Science, Engineering, and Advanced Technology
Health Sciences and Professional Education Total
Percent of Semester Credit Hours Taught by Part-time FacultyDivision of Health Sciences and Professional Education
Del Mar College Statistical Profile 2017/18 111

Average Class SizeDivision of Arts and Sciences
Fall 2016 Spring 2017 Fall 2017Number Average Number Average Number Average
of Number Class of Number Class of Number ClassClasses Enrolled Size Classes Enrolled Size Classes Enrolled Size
Art 30 449 15.0 25 385 15.4 20 375 18.8Drama 15 368 24.5 15 310 20.7 16 400 25.0
Art and Drama 45 817 18.2 40 695 17.4 36 775 21.5
Communications 13 141 10.8 10 140 14.0 11 143 13.0ESOL* 2 36 18.0 7 61 8.7 0 0French 1 14 14.0 2 17 8.5 1 12 12.0Integrated Reading & Writing 10 181 18.1 12 210 17.5 10 177 17.7Reading 10 197 19.7 10 169 16.9 11 201 18.3Spanish 11 170 15.5 10 151 15.1 9 138 15.3Speech 40 981 24.5 40 958 24.0 45 1,004 22.3Student Success* 38 725 19.1 27 373 13.8 37 720 19.5
125 2,445 19.6 118 2,079 17.6 124 2,395 19.3
English 173 3,772 21.8 147 3,053 20.8 166 3,377 20.3Integrated Reading & Writing 11 198 18.0 11 188 17.1 12 200 16.7Philosophy 13 310 23.8 15 352 23.5 13 316 24.3
197 4,280 21.7 173 3,593 20.8 191 3,893 20.4
Dance 3 71 23.7 4 85 21.3 4 82 20.5Kinesiology 37 760 20.5 40 835 20.9 35 733 20.9
Kinesiology 40 831 20.8 44 920 20.9 39 815 20.9
Mathematics 185 3,722 20.1 164 3,270 19.9 177 3,600 20.3
Humanities 8 198 24.8 9 190 21.1 9 208 23.1Music (organized classes only) 47 631 13.4 45 540 12.0 48 571 11.9Music Applied 112 228 121 242 2.0 98 215 2.2Sound Recording Technology 6 64 10.7 4 50 12.5 6 58 9.7
Music 173 1,121 6.5 179 1,022 5.7 161 1,052 6.5
Biology 52 1,551 29.7 63 1,495 23.7 58 1,619 28.0Biotechnology ** 3 34 11.3 2 15 7.5 0 8 21.3Chemistry 24 547 22.8 23 481 20.9 24 492 20.5Geology 18 374 20.8 17 329 19.4 18 356 19.8Physics 4 70 17.5 4 70 17.5 3 53 17.7
Natural Sciences 101 2,576 25.4 109 2,390 21.9 103 2,528 24.5
Anthropology 1 21 21.0 1 12 12.0 1 20 20.0Geography 2 46 23.0 2 33 16.5 2 42 21.0History 75 1,996 26.6 69 1,769 25.6 74 1,964 26.5Military Science 1 1 1.0 1 1 1.0 1 1 1.0Political Science 57 1,581 27.7 56 1,491 26.6 58 1,574 27.1Psychology 46 1,217 26.5 45 1,126 25.0 47 1,250 26.6Social Work 1 8 8.0 2 25 12.5 2 12 6.0Sociology 20 471 23.6 20 520 26.0 18 426 23.7
Social Sciences 203 5,341 26.3 196 4,977 25.4 203 5,289 26.1
Arts and Sciences Total 1,069.3 21,133 19.8 1,023.0 18,946 18.5 1,034.1 20,347 19.7
**Starting in Spring 2011 Biotechnology includes BIOL-1414 and BIOL-1415 courses in Average Class Size totals.* ESOL classes were available only as Flex Entry courses in Fall 17 and were reported in Spring 18 to THECB
Communications, Languages, and Reading
English and Philosophy
112 Del Mar College Statistical Profile 2017/18
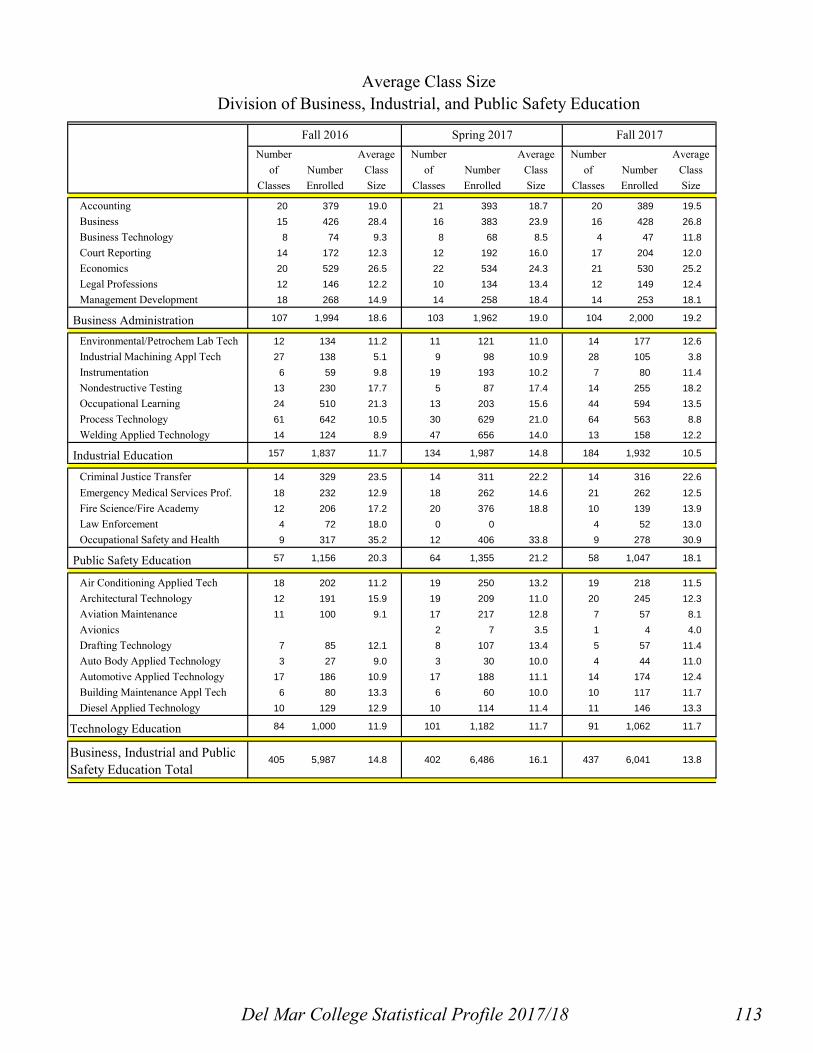
Average Class SizeDivision of Business, Industrial, and Public Safety Education
Fall 2016 Spring 2017 Fall 2017Number Average Number Average Number Average
of Number Class of Number Class of Number ClassClasses Enrolled Size Classes Enrolled Size Classes Enrolled Size
Accounting 20 379 19.0 21 393 18.7 20 389 19.5Business 15 426 28.4 16 383 23.9 16 428 26.8Business Technology 8 74 9.3 8 68 8.5 4 47 11.8Court Reporting 14 172 12.3 12 192 16.0 17 204 12.0Economics 20 529 26.5 22 534 24.3 21 530 25.2Legal Professions 12 146 12.2 10 134 13.4 12 149 12.4Management Development 18 268 14.9 14 258 18.4 14 253 18.1
Business Administration 107 1,994 18.6 103 1,962 19.0 104 2,000 19.2
Environmental/Petrochem Lab Tech 12 134 11.2 11 121 11.0 14 177 12.6Industrial Machining Appl Tech 27 138 5.1 9 98 10.9 28 105 3.8Instrumentation 6 59 9.8 19 193 10.2 7 80 11.4Nondestructive Testing 13 230 17.7 5 87 17.4 14 255 18.2Occupational Learning 24 510 21.3 13 203 15.6 44 594 13.5Process Technology 61 642 10.5 30 629 21.0 64 563 8.8Welding Applied Technology 14 124 8.9 47 656 14.0 13 158 12.2
Industrial Education 157 1,837 11.7 134 1,987 14.8 184 1,932 10.5
Criminal Justice Transfer 14 329 23.5 14 311 22.2 14 316 22.6Emergency Medical Services Prof. 18 232 12.9 18 262 14.6 21 262 12.5Fire Science/Fire Academy 12 206 17.2 20 376 18.8 10 139 13.9Law Enforcement 4 72 18.0 0 0 4 52 13.0Occupational Safety and Health 9 317 35.2 12 406 33.8 9 278 30.9
Public Safety Education 57 1,156 20.3 64 1,355 21.2 58 1,047 18.1
Air Conditioning Applied Tech 18 202 11.2 19 250 13.2 19 218 11.5Architectural Technology 12 191 15.9 19 209 11.0 20 245 12.3Aviation Maintenance 11 100 9.1 17 217 12.8 7 57 8.1Avionics 2 7 3.5 1 4 4.0Drafting Technology 7 85 12.1 8 107 13.4 5 57 11.4Auto Body Applied Technology 3 27 9.0 3 30 10.0 4 44 11.0Automotive Applied Technology 17 186 10.9 17 188 11.1 14 174 12.4Building Maintenance Appl Tech 6 80 13.3 6 60 10.0 10 117 11.7Diesel Applied Technology 10 129 12.9 10 114 11.4 11 146 13.3
Technology Education 84 1,000 11.9 101 1,182 11.7 91 1,062 11.7
405 5,987 14.8 402 6,486 16.1 437 6,041 13.8Business, Industrial and Public Safety Education Total
Del Mar College Statistical Profile 2017/18 113

Average Class SizeDivision of Health Sciences and Professional Education
Fall 2016 Spring 2017 Fall 2017Number Average Number Average Number Average
of Number Class of Number Class of Number ClassClasses Enrolled Size Classes Enrolled Size Classes Enrolled Size
Health Information Technology 8 99 12.4 7 101 14.4 8 104 13.0
Health Science 20 267 13.4 20 287 14.4 19 247 13.0Medical Lab Technology 7 71 10.1 5 48 10.7 6 70 11.7Occupational Therapy Asst 6 117 19.5 5 100 20.0 6 117 19.5Pharmacy Technology 5 50 10.0 5 50 10.0 5 40 8.0Physical Therapist Asst 6 124 20.7 3 66 22.0 6 123 20.5Respiratory Therapy 5 86 17.2 5 80 16.0 5 78 15.6Surgical Technology 2 20 10.0 2 20 10.0 2 25 12.5
Allied Health 59 834 14.1 52 752 14.6 57 804 14.1
Computer Info Systems 62.0 765 12.3 58.5 799 13.7 62.0 786 12.7Computer Science 16.0 217 13.6 11.5 188 16.3 15.0 170 11.3Computer-Network Electronic Tech 6 73 12.2 7 73 10.4 14 181 12.9Engineering 15 211 14.1 12 138 11.5 9 102 11.3
99 1,266 12.8 89 1,198 13.5 100 1,239 12.4
Dental Assisting 6 96 16.0 5 60 12.0 6 108 18.0Dental Hygiene 8 192 24.0 8 192 24.0 8 192 24.0Diagnostic Medical Sonography 7 55 7.9 3 28 9.3 7 56 8.0Echocardiography 5 20 4.0 2 8 4.0 5 20 4.0Nuclear Medicine 3 20 6.7 3 14 4.7Radiologic Technology 9 150 16.7 8 125 15.6 9 140 15.6
Dental and Imaging Technology 38 533 14.0 29 427 14.7 35 516 14.7
American Sign Lang & Interpreting 10 101 10.1 12 121 10.5 12 150 12.5Child Development/Early Childhood 13 199 15.3 11 173 15.7 13 173 13.3Cosmetology 17 278 16.4 18 300 16.7 16 290 18.1Culinary Arts 14 171 12.2 13 156 12.0 13 154 11.8Education 5 84 16.8 5 89 17.8 5 91 18.2Hospitality/Restaurant Mgt 4 66 16.5 3 44 14.7 2 32 16.0Hotel/Motel Management 3 20 6.7 2 11 5.5 3 13 4.3Human Services 11 90 8.2 14 110 7.9 9 119 13.2
Human Sciences and Education 77 1,009 13.1 78 1,004 13.0 73 1,022 14.0
Nurse Education 25 917 36.7 46 871 18.9 48 926 19.3
Nurse Education 25 917 36.7 46 871 18.9 48 926 19.3
298 4,559 15.3 293 4,252 14.5 313 4,507 14.4
1,772 31,679 17.9 1,718 29,684 17.3 1,784 30,895 17.3
Note: 1. Designated sections of honors-level classes meeting with regular classes are not counted separately.Note: 2. Based on payroll sheet, classes were identified as stacked or combined and reflected in Number of Classes.Note: 3. Enrollments in Virtual College of Texas courses, self-paced English labs, clinicals, practicums, internships, co-op courses, Dual Credit courses, and private music lessons are not included in this report.
Computer Science, Engineering, and Advanced Technology
Health Sciences and Professional Education Total
College Total
114 Del Mar College Statistical Profile 2017/18

Total Percent Percent PercentCollege-Level Grades Grade Grade Grade Grade Grade Average
Grades A-C D P F W I GradeFall 2017
Arts and Sciences 17,196 69.2% 6.5% 0.0% 11.7% 12.4% 0.3% 2.61Business, Industrial & Public Safety 6,176 79.5% 4.3% 0.0% 8.7% 6.6% 0.8% 2.97Health Sciences & Professional Ed 4,791 78.1% 2.9% 4.8% 6.0% 7.0% 1.1% 3.04
Total 28,163 73.0% 5.4% 0.8% 10.1% 10.2% 0.5% 2.76
Summer 2017Arts and Sciences 5,943 78.0% 6.0% 0.0% 8.7% 7.2% 0.0% 2.81Business, Industrial & Public Safety 2,839 88.1% 2.3% 0.0% 5.7% 3.9% 0.0% 3.26Health Sciences & Professional Ed 1,346 85.4% 2.7% 3.2% 4.3% 4.5% 0.0% 3.27
Total 10,128 81.8% 4.5% 0.4% 7.3% 5.9% 0.0% 3.00
Spring 2017Arts and Sciences 16,182 70.0% 6.1% 0.0% 11.1% 12.8% 0.0% 2.66Business, Industrial & Public Safety 6,326 83.0% 3.0% 0.0% 7.9% 6.1% 0.0% 3.05Health Sciences & Professional Ed 4,592 78.5% 2.9% 5.3% 6.0% 7.3% 0.0% 3.11
Total 27,100 74.5% 4.8% 0.9% 9.5% 10.3% 0.0% 2.83
Fall 2016Arts and Sciences 17,300 70.6% 6.8% 0.0% 10.6% 12.0% 0.0% 2.64Business, Industrial & Public Safety 6,349 82.4% 2.9% 0.0% 8.6% 6.1% 0.0% 2.99Health Sciences & Professional Ed 4,723 79.1% 2.7% 4.8% 5.6% 7.9% 0.0% 3.02
Total 28,372 74.7% 5.3% 0.8% 9.3% 10.0% 0.0% 2.79
Summer 2016Arts and Sciences 5,666 78.4% 5.5% 0.0% 8.7% 7.4% 0.0% 2.84Business, Industrial & Public Safety 2,713 89.2% 2.8% 0.0% 4.5% 3.5% 0.0% 3.20Health Sciences & Professional Ed 1,252 86.4% 1.6% 1.8% 3.8% 6.4% 0.0% 3.37
Total 9,631 82.5% 4.2% 0.2% 6.9% 6.2% 0.0% 3.01
Spring 2016Arts and Sciences 16,082 69.6% 5.7% 0.0% 11.6% 13.2% 0.0% 2.63Business, Industrial & Public Safety 5,935 82.5% 3.0% 0.0% 8.8% 5.7% 0.0% 2.99Health Sciences & Professional Ed 4,368 77.2% 2.9% 4.9% 6.4% 8.6% 0.0% 3.02
Total 26,385 73.7% 4.6% 0.8% 10.1% 10.7% 0.0% 2.78
Fall 2015Arts and Sciences 16,533 69.1% 6.6% 0.0% 11.7% 12.6% 0.0% 2.60Business, Industrial & Public Safety 5,718 80.7% 3.3% 0.0% 10.2% 5.7% 0.0% 2.94Health Sciences & Professional Ed 4,642 77.1% 2.9% 4.2% 7.0% 8.7% 0.0% 3.03
Total 26,893 73.0% 5.2% 0.7% 10.6% 10.5% 0.0% 2.75
Summer 2015Arts and Sciences 5,532 79.0% 5.3% 0.0% 7.5% 7.9% 0.3% 2.88Business, Industrial & Public Safety 2,412 86.2% 3.0% 0.0% 3.9% 5.4% 1.6% 3.20Health Sciences & Professional Ed 1,090 90.1% 2.7% 0.0% 3.0% 3.7% 0.6% 3.41
Total 9,034 82.3% 4.4% 0.0% 6.0% 6.7% 0.7% 3.03
Spring 2015Arts and Sciences 15,527 68.3% 6.7% 0.0% 11.7% 13.0% 0.3% 2.59Business, Industrial & Public Safety 5,109 79.2% 3.6% 0.0% 8.2% 6.9% 2.0% 2.98Health Sciences & Professional Ed 4,402 76.0% 3.4% 4.9% 6.0% 9.0% 0.6% 3.00
Total 25,038 71.9% 5.5% 0.9% 10.0% 11.1% 0.7% 2.74
Fall 2014Arts and Sciences 16,442 67.5% 6.8% 0.0% 12.1% 13.5% 0.0% 2.57Business, Industrial & Public Safety 5,193 78.8% 3.8% 0.0% 10.4% 6.9% 0.1% 2.86Health Sciences & Professional Ed 4,565 77.2% 2.4% 4.8% 7.7% 7.9% 0.0% 2.94
Total 26,200 71.5% 5.4% 0.8% 11.0% 11.2% 0.0% 2.69
Table 4A: Grade Distribution by Semester for College-Level CoursesPercent Passing Grades
Del Mar College Statistical Profile 2017/18 115

Total Percent Percent PercentCollege-Level Grades Grade Grade Grade Grade Grade Average
Grades A-C D P F W I Grade
Table 4A: Grade Distribution by Semester for College-Level CoursesPercent Passing Grades
Summer 2014Arts and Sciences 5,399 77.1% 5.8% 0.0% 7.9% 9.2% 0.0% 2.84Business, Industrial & Public Safety 2,332 81.9% 4.3% 0.0% 7.4% 6.4% 0.0% 3.02Health Sciences & Professional Ed 1,226 89.6% 1.5% 0.0% 4.4% 4.4% 0.0% 3.35
Total 8,957 80.0% 4.9% 0.0% 7.3% 7.8% 0.0% 2.96
Spring 2014Arts and Sciences 15,796 67.0% 6.3% 0.0% 11.3% 15.5% 0.0% 2.60Business, Industrial & Public Safety 5,073 76.6% 4.4% 0.0% 9.7% 9.4% 0.0% 2.87Health Sciences & Professional Ed 4,389 77.3% 3.1% 4.2% 7.3% 8.2% 0.0% 2.99
Total 25,258 70.7% 5.4% 0.7% 10.3% 13.0% 0.0% 2.72
Fall 2013Arts and Sciences 16,640 66.0% 6.6% 0.0% 11.5% 15.9% 0.0% 2.58Business, Industrial & Public Safety 5,257 78.1% 4.4% 0.0% 8.6% 8.9% 0.0% 2.86Health Sciences & Professional Ed 4,772 74.0% 2.8% 3.7% 8.7% 10.9% 0.0% 2.93
Total 26,669 69.8% 5.5% 0.7% 10.4% 13.6% 0.0% 2.70
Summer 2013Arts and Sciences 5,613 75.3% 5.9% 0.0% 8.8% 10.0% 0.0% 2.81Business, Industrial & Public Safety 2,492 83.4% 2.9% 0.0% 6.7% 6.9% 0.0% 3.13Health Sciences & Professional Ed 1,495 88.6% 2.1% 0.0% 4.6% 4.6% 0.0% 3.32
Total 9,600 79.5% 4.6% 0.0% 7.6% 8.3% 0.0% 2.98
Spring 2013Arts and Sciences 16,483 66.3% 6.0% 0.0% 11.7% 16.1% 0.0% 2.60Business, Industrial & Public Safety 5,324 75.7% 3.2% 0.0% 10.3% 10.7% 0.0% 2.81Health Sciences & Professional Ed 4,803 74.0% 3.0% 4.0% 9.0% 10.0% 0.0% 2.91
Total 26,610 69.6% 4.9% 0.7% 10.9% 13.9% 0.0% 2.70
Fall 2012Arts and Sciences 17,633 64.9% 6.3% 0.0% 12.4% 16.4% 0.0% 2.54Business, Industrial & Public Safety 5,272 75.6% 4.1% 0.0% 10.1% 10.1% 0.1% 2.77Health Sciences & Professional Ed 5,201 75.2% 2.6% 4.3% 9.4% 8.6% 0.0% 2.90
Total 28,106 68.8% 5.2% 0.8% 11.4% 13.8% 0.0% 2.66
0%
10%
20%
30%
40%
50%
60%
70%
80%
Fall 2012 Fall 2013 Fall 2014 Fall 2015 Fall 2016 Fall 2017
Figure 1: Successful Completions (Grades A-C) in College-Level Courses
Arts & Sciences Business, Industrial & Public Safety Health Sciences & Professional Ed
116 Del Mar College Statistical Profile 2017/18

Developmental Percent Percent Percent Percent Percent Percent AverageGrades Total Grade A Grade B Grade C Grade W Grade I Grade R Grade
Fall 2017DE NCBO 17 70.6% 11.8% 5.9% 5.9% 0.0% 5.9% 3.73English 562 12.1% 31.7% 23.0% 14.6% 0.0% 18.7% 2.84ESOL 34 44.1% 20.6% 14.7% 11.8% 0.0% 8.8% 3.37Student Success 714 44.8% 20.2% 10.1% 4.3% 0.0% 20.6% 3.46Integrated Reading & Writing 378 15.9% 25.7% 29.9% 4.8% 0.0% 23.8% 2.80Mathematics 1,699 16.5% 15.2% 17.3% 15.8% 0.2% 35.0% 2.98Reading 220 11.4% 28.6% 23.2% 7.7% 0.0% 29.1% 2.81
Total 3,624 21.5% 20.7% 18.3% 11.6% 0.1% 27.7% 3.05
Summer 2017DE NCBO 3 100.0% 0.00% 0.00% 0.00% 0.00% 0.00% 4.00English 52 3.8% 38.5% 26.9% 11.5% 0.0% 19.2% 2.67Student Success 100 47.0% 13.0% 21.0% 3.0% 0.0% 16.0% 3.32Integrated Reading & Writing 93 29.0% 34.4% 19.4% 2.2% 0.0% 15.1% 3.12Mathematics 543 27.1% 17.7% 19.3% 12.0% 0.0% 23.9% 3.12Reading 23 47.8% 30.4% 8.7% 0.0% 0.0% 13.0% 3.45
Total 814 29.1% 20.6% 19.7% 9.3% 0.0% 21.3% 3.14
Spring 2017DE NCBO 5 40.0% 20.0% 40.0% 0.0% 0.0% 0.0% 3.00English 492 12.8% 20.1% 27.0% 11.4% 0.0% 28.7% 2.76ESOL 54 31.5% 24.1% 18.5% 0.0% 0.0% 25.9% 3.18Student Success 379 43.5% 16.4% 15.3% 6.6% 0.0% 18.2% 3.38Integrated Reading & Writing 408 20.1% 26.2% 19.4% 8.6% 0.0% 25.7% 3.01Mathematics 1,429 15.5% 16.4% 18.8% 17.1% 0.1% 32.1% 2.93Reading 139 7.2% 21.6% 27.3% 18.7% 0.0% 25.2% 2.64
Total 2,906 19.3% 18.8% 20.2% 13.3% 0.0% 28.3% 2.98
Fall 2016DE NCBO 16 18.8% 37.5% 6.3% 0.0% 0.0% 37.5% 3.20English 1,012 11.5% 24.5% 25.8% 8.4% 0.0% 29.4% 2.76ESOL 81 39.5% 23.5% 16.0% 7.4% 0.0% 13.6% 3.30Student Success 740 40.7% 22.6% 11.2% 4.9% 0.0% 20.7% 3.40Integrated Reading & Writing 384 18.5% 24.7% 21.6% 9.1% 0.0% 26.0% 2.95Mathematics 1,693 14.3% 15.9% 20.3% 15.1% 0.1% 33.4% 2.85Reading 234 12.0% 26.9% 17.5% 4.7% 0.0% 37.6% 2.86
Total 4,160 19.1% 20.9% 19.8% 10.3% 0.0% 29.4% 2.97
Summer 2016DE NCBO 1 100.0% 0.00% 0.00% 0.00% 0.00% 0.00% 4.00English 58 6.9% 20.7% 34.5% 3.4% 0.0% 34.5% 2.56Student Success 80 57.5% 27.5% 5.0% 0.0% 0.0% 10.0% 3.58Integrated Reading & Writing 92 21.7% 34.8% 21.7% 5.4% 0.0% 16.3% 3.00Mathematics 512 32.0% 20.5% 18.2% 7.8% 0.0% 21.5% 3.20Reading 24 62.5% 20.8% 0.0% 4.2% 0.0% 12.5% 3.75
Total 767 32.6% 22.9% 17.9% 6.3% 0.0% 20.3% 3.20
Spring 2016DE NCBO 6 50.0% 0.0% 16.7% 0.0% 0.0% 33.3% 3.50English 441 10.9% 20.4% 24.5% 13.4% 0.0% 30.8% 2.76ESOL 128 43.8% 32.8% 12.5% 0.0% 0.0% 10.9% 3.35Student Success 366 40.7% 18.6% 7.9% 4.6% 0.0% 28.1% 3.49Integrated Reading & Writing 373 13.7% 29.2% 23.6% 6.4% 0.0% 27.1% 2.85Mathematics 1,305 12.4% 14.2% 15.6% 19.7% 0.1% 38.1% 2.93Reading 124 20.2% 18.5% 12.1% 11.3% 0.0% 37.9% 3.16
Total 2,743 18.0% 18.8% 16.8% 13.5% 0.0% 32.8% 3.02
Fall 2015DE NCBO 6 66.7% 16.7% 0.0% 0.0% 0.0% 16.7% 3.80English 830 9.4% 24.8% 29.4% 11.0% 1.1% 24.3% 2.69ESOL 157 40.8% 34.4% 11.5% 0.0% 0.0% 13.4% 3.34Student Success 679 47.6% 20.8% 9.7% 5.7% 0.0% 16.2% 3.48Integrated Reading & Writing 400 18.5% 25.0% 19.8% 10.0% 0.0% 26.8% 2.98Mathematics 1,450 14.7% 16.8% 19.0% 17.9% 0.0% 31.7% 2.91Reading 216 20.8% 20.8% 15.3% 12.0% 0.0% 31.0% 3.10
Total 3,738 21.4% 21.1% 19.2% 12.2% 0.2% 25.9% 3.04
Grade Distribution by Discipline for Developmental Courses
Del Mar College Statistical Profile 2017/18 117

0%
10%
20%
30%
40%
50%
60%
70%
80%
90%
Fall 2011 Fall 2012 Fall 2013 Fall 2014 Fall 2015 Fall 2016
Successful Completions (Grades A-C) in Developmental Courses
Freshman Seminar English Math Reading
0%
10%
20%
30%
40%
50%
60%
70%
80%
Fall 2011 Fall 2012 Fall 2013 Fall 2014 Fall 2015 Fall 2016
Successful Completions (Grades A-C) in College-Level Courses
Arts & Sciences Business, Industrial & Public Safety Health Sciences & Professional Ed
118 Del Mar College Statistical Profile 2017/18

Del Mar College Statistical Profile eLearning and Other Special Programs
Terms and Definitions Collegiate High School Students enrolled in the Collegiate High School program earn a high school diploma and an associate degree or transferable college credit.
Dual Credit Students enrolled in dual credit courses receive both college and high school credit simultaneously for taking college courses at their local high schools and/or at Del Mar College.
Flexible Scheduling (Short Semester Courses) To enhance students’ options for flexible scheduling and accelerated instruction, eight-week class sessions (instead of 16 weeks) are offered multiple times during the year. Rapid Track courses are taught in six-week terms with two sessions held each fall and spring semester. Maymester three-week courses are taught between spring and summer semesters. Short semester courses generate the same number of contact hours as their counterparts in a regular fall or spring semester.
Interactive Video A course taught through the use of closed-circuit video technology where students may be at one location and the instructor may conduct the class at another.
Internet/eLine Internet courses are taught through the use of e-mail, World Wide Web, and related technologies. Students do not attend traditional in-class lecture sections, and course materials, assignments, and exams are delivered electronically. Internet eLine courses provide flexible delivery of online, anywhere, anytime, competency-based curricula modules, allowing students to progress at their own pace.
Hybrid Courses Hybrid courses combine familiar classroom learning with Web-based online instruction.
Off-Campus Courses Credit courses offered at off-campus locations throughout the Coastal Bend.
Virtual College of Texas Del Mar College hosts students as they take online course work at other Texas community colleges.
Weekend Courses Courses offered on Friday nights, Saturdays, and Sundays.
Highlights
Almost 13,600 students took courses via the Internet in 2016-2017, a 10.1 percent increase from the prior year and another record-high. Annual enrollment in hybrid courses increased by 4.0 percent in 2016-2017, setting a new record with 913 students enrolled.
After more than 60 percent decrease in 2015-2016, enrollment in eight-week courses (+175.5%) and Rapid Track/Maymester courses (+188.4%) increased significantly in 2016-2017. Enrollment in weekend courses decreased by 34.3 percent in 2016-2017 over the previous year.
Annual enrollment in Dual Credit and Collegiate High School programs has increased another 14.4 percent from the prior year, setting a new decide-high record with 5,363 students taking college courses for dual credit. Almost 3,000 students (55%) took dual credit courses via the Internet.
Annual enrollment in courses offered off campus increased by 11.0 percent from the prior year, setting a new record-high of 1,170 students in 2016-2017.
Del Mar College Statistical Profile 2017/18 119

Chapter Summary
eLearning Annual contact hours (1,100,544) generated by students enrolled in eLearning and/or classes associated with other special programs accounted for 23.1 percent of the 2016-2017 annual credit contact hours. There was a 8.3 percent increase in contact hours for non-traditional classes in 2016-2017 compared to the previous year.
Internet courses were taught in 39 disciplines, with 13,592 students (+10.1%) enrolled during 2016-2017. Contact hours increased by 8.0 percent from prior year setting a new record with 685,728 hours taught via Internet in 2016-2017.
Enrollment in hybrid courses increased by 4.0 percent in 2016-2017 setting a new record high with 913 students taking hybrid courses, while no students were enrolled for Virtual College of Texas (VCT) or interactive video courses.
The unduplicated headcount of students (3,840) enrolled for credit in any eLearning class in fall 2017 increased by 4.8 percent compared to fall 2016. Nearly three of four (72.2%) distance learning students reside within the Del Mar College district. In fall 2017, of the 11,476 credit students one-third (33.5%) were enrolled in at least one eLearning class, compared to just 22.0 percent of unduplicated headcount in fall 2013.
Flexible Scheduling Enrollment in eight-week classes increased by 175.5 percent in 2016-2017 compared to prior year with 898 students taking 44 courses in nine disciplines.
Though enrollment in six-week Rapid Track courses increased by 161.6 percent in 2016-2017 to 191 students, it was still 39 percent lower compared to 313 students enrolled in 2014-2015. Enrollment in three-week Maymester courses increased by 208.1 percent from prior year with 305 students enrolled during 2016-2017, setting a new record-high. Short semester courses were taught in nine disciplines.
Weekend courses were offered in six disciplines with 434 students enrolled during 2016-2017, a 34.3 percent decrease compared to prior year. Nine fewer classes and 61 percent fewer contact hours were taught in Emergency Medical Technology courses in 2016-2017 compared to prior year.
Dual Credit/Collegiate High School Dual Credit annual enrollment increased by 14.4 percent in 2016-2017 from the previous year setting a new record with 5,363 students. Dual credit students from 16 schools took a variety of courses in 26 disciplines, generating 322,128 contact hours and accounting for 6.8 percent of the College’s total contact hours taught in 2016-2017, which is a significant increase compared to a 4.0 percent dual credit hours share taught five years ago. English continues to have the highest annual number (50) of dual credit classes with over 1,200 students enrolled.
With rapid expansion of dual credit program, starting in 2013-2014, section numbers previously reserved for Collegiate High School were allowed for reporting of any dual credit course taught on the Del Mar College campus. In 2016-2017, Collegiate High School reports just six history classes with 156 students enrolled, a 34.7 percent decrease from prior year. Enrollment in other dual credit courses taught on Del Mar College campus almost doubled (+95.1%) from prior year with 1,106 students taking dual credit classes on College campus in 2016-2017.
After setting a decade-high record in 2015-2016 with 1,658 students taking dual credit classes at their high school campus, enrollment decreased by 30.9 percent in 2016-2017 to 1,145 students, the same as in 2010-2011.
Enrollment in dual credit courses delivered via Internet in 2016-2017 increased by 33.0 percent from prior year to 2,956 students accounting for 55.1 percent of the annual dual credit enrollment.
Off-campus Classes Sixty-two classes in 15 disciplines were taught off campus in 2016-2017 with 1,170 students enrolled, an increase of 11.0 percent from the prior year setting a new record-high.
Enrollment at Fire Academy almost doubled from 311 students in 2015-2016 to 587 students in 2016-2017, enrollment at the Corpus Christi Army Depot also doubled from 35 to 75 students setting a new record. After setting a record with 706 students enrolled at the North-West Center in 2015-2016, enrollment decreased by 28.0 percent in 2016-2017.
120 Del Mar College Statistical Profile 2017/18

2011-12 2012-13 2013-14 2014-15 2015-16 2016-171 Year
% Change
Dual Credit and Collegiate High SchoolCollegiate High School 573 487 318 154 239 156 -34.7%Dual Credit DMC Campus 186 248 713 854 567 1,106 95.1%Dual Credit HS Campus 1,492 1,551 1,406 1,422 1,658 1,145 -30.9%Dual Credit Internet* 1,238 1,374 1,356 1,753 2,223 2,956 33.0%
Total Dual Credit & CHS 3,489 3,660 3,793 4,183 4,687 5,363 14.4%
% of Total College Enrollment 4.5% 5.2% 5.7% 6.3% 6.7% 7.4%
eLearningDual Credit Internet* 1,238 1,374 1,356 1,753 2,223 2,956 33.0%Internet Courses 8,362 8,467 8,100 8,617 10,122 10,636 5.1%eLine 163 89 10 0 0 0 0.0%Hybrid Courses 230 297 395 689 878 913 4.0%Video Courses 22 38 68 62 20 0 -100.0%Virtual College of Texas 11 7 5 3 3 0 -100.0%
Total eLearning 10,026 10,272 9,934 11,124 13,246 14,505 9.5%
% of Total College Enrollment 12.9% 14.5% 14.8% 16.8% 18.9% 19.9%
Flexible Scheduling (DMC Campus)Eight-Week Courses 1,137 620 633 859 326 898 175.5%Maymester 243 203 203 231 99 305 208.1%Rapid Track 311 203 275 313 73 191 161.6%Weekend Courses 824 532 413 463 661 434 -34.3%
Total Flexible Scheduling 2,515 1,558 1,524 1,866 1,159 1,828 57.7%
% of Total College Enrollment 3.2% 2.2% 2.3% 2.8% 1.7% 2.5%
Total Off-Campus Classes 286 303 266 444 1,054 1,170 11.0%
% of Total College Enroll 0.4% 0.4% 0.4% 0.7% 1.5% 1.6%
Non-traditional Total* 15,078 14,419 14,161 15,864 17,923 19,910 11.1%
% of Total College Enrollment 19.4% 20.3% 21.1% 23.9% 25.6% 27.3%
College Total Enrollment 77,791 71,040 66,993 66,308 69,910 72,896 4.3%
Annual Enrollment in Non-Traditional Courses
Note: Dual Credit and Collegiate High School data only includes enrollments in designated course sections as reported to THECB. An individual high school student blended in regular class taught by DMC faculty is not included in the Dual Credit data. *Non-traditional Total counts courses only once, regardless of delivery type.
0%
5%
10%
15%
20%
25%
2011-12 2012-13 2013-14 2014-15 2015-16 2016-17
Annual Non-Traditional Enrollment as a Percent of College Total
eLearning Dual Credit Flexible Scheduling Off-Campus
Del Mar College Statistical Profile 2017/18 121

2011-12 2012-13 2013-14 2014-15 2015-16 2016-171 Year
% Change
Dual Credit and Collegiate High SchoolCollegiate High School 34,336 25,344 15,616 7,392 11,472 7,488 -34.7%Dual Credit DMC Campus 19,744 25,016 54,480 75,632 58,192 107,168 84.2%Dual Credit HS Campus 86,608 89,008 80,960 75,328 102,880 62,880 -38.9%Dual Credit Internet* 63,408 68,960 68,672 85,392 107,808 144,592 34.1%
Total Dual Credit & CHS 204,096 208,328 219,728 243,744 280,352 322,128 14.9%% of Total College Hours 4.0% 4.4% 5.0% 5.6% 6.2% 6.8%
eLearningDual Credit eLearning* 63,408 68,960 68,672 85,392 107,808 144,592 34.1%Internet Courses 442,792 456,448 430,512 451,968 527,360 541,136 2.6%eLine 12,704 7,360 640 0 0 0 0.0%Hybrid Courses 16,656 23,440 26,336 45,616 56,720 41,184 -27.4%Video Courses 1,056 1,824 3,264 2,976 960 0 -100.0%Virtual College of Texas 576 448 336 176 144 0 -100.0%
Total eLearning 537,192 558,480 529,760 586,128 692,992 726,912 4.9%% of Total College Hours 10.6% 11.9% 11.9% 13.6% 15.3% 15.3%
Flexible Scheduling (DMC Campus)Eight-Week Courses 64,224 31,984 38,240 49,792 17,488 45,216 158.6%Maymester 11,856 9,744 10,000 11,088 4,752 14,640 208.1%Rapid Track 17,104 10,496 14,496 15,664 3,504 9,168 161.6%Weekend Courses 71,936 45,984 36,736 35,664 47,376 32,288 -31.8%
Total Flexible Scheduling 165,120 98,208 99,472 112,208 73,120 101,312 38.6%% of Total College Hours 3.2% 2.1% 2.2% 2.6% 1.6% 2.1%
Total Off-Campus Classes 14,192 21,280 19,312 31,280 77,280 94,784 22.7%% of Total College Hours 0.3% 0.5% 0.4% 0.7% 1.7% 2.0%
Total Non-Traditional* 857,192 817,336 799,600 887,968 1,015,936 1,100,544 8.3%
% Non-Traditional Delivery 16.8% 17.4% 18.0% 20.6% 22.4% 23.1%
Total College Contact Hours 5,088,496 4,689,816 4,437,920 4,315,628 4,534,512 4,766,148 5.1%
* For Total Non-Traditional, duplicate type courses count only once.
Annual Contact Hours for Non-Traditional Courses
0
1
2
3
4
5
6
2011-12 2012-13 2013-14 2014-15 2015-16 2016-17
Mill
ions
Annual Contact Hours by Delivery Type
TraditionalNon-Traditional
122 Del Mar College Statistical Profile 2017/18

Fall 2013 Fall 2014 Fall 2015 Fall 2016 Fall 20171 Year
% Change
In-District 1,840 2,149 2,159 2,694 2,772 2.9%
Out-of-District 413 610 763 875 980 12.0%
Out-of-State/International 53 58 74 96 88 -8.3%
Total eLearning Students 2,306 2,817 2,996 3,665 3,840 4.8%
College Total Credit Census Headcount 10,502 10,439 10,852 11,689 11,476 -1.8%
eLearning Percent of College Total 22.0% 27.0% 27.6% 31.4% 33.5%
Note: Includes Internet, Hybrid, eLine, VCT, Telecourse, and Interactive Video classes.
Unduplicated Headcount of Students Enrolled for Credit in any eLearning Class by Tuition Status
2,306
2,817
2,996
3,665
3,840
22.0%
27.0%
27.6%
31.4%
33.5%
15.0%
18.0%
21.0%
24.0%
27.0%
30.0%
33.0%
36.0%
39.0%
1,500
1,800
2,100
2,400
2,700
3,000
3,300
3,600
3,900
Fall 2013 Fall 2014 Fall 2015 Fall 2016 Fall 2017
Headcount of Students Enrolled in eLearning Classes
eLearning Students eLearning Percent of College Total
Del Mar College Statistical Profile 2017/18 123

Numberof
ClassesNumber Enrolled
AverageClassSize
Contact Hours
Numberof
ClassesNumber Enrolled
AverageClassSize
Contact Hours
Numberof
ClassesNumber Enrolled
AverageClassSize
Contact Hours
Internet CoursesAccountingFall 2 51 25.5 2,448 3 78 26.0 3,744 3 80 26.7 3,840Spring 2 59 29.5 2,832 3 69 23.0 3,312Summer 2 49 24.5 2,352 2 59 29.5 2,832
Total 6 159 26.5 7,632 8 206 25.8 9,888
Architectural/Drafting TechnologyFall 3 29 9.7 1,920 5 58 11.6 3,280 6 72 12.0 3,664Spring 6 37 6.2 2,000 8 103 12.9 7,152Summer 4 24 6.0 1,776 2 19 9.5 912
Total 13 90 6.9 5,696 15 180 12.0 11,344
ArtFall 2 54 27.0 2,592 2 62 31.0 2,976 2 60 30.0 2,880Spring 2 49 24.5 2,352 2 40 20.0 1,920Summer
Total 4 103 25.8 4,944 4 102 25.5 4,896
BiologyFall 7 153 21.9 8,736 10 222 22.2 14,208 9 214 23.8 13,728Spring 7 145 20.7 6,960 9 212 23.6 12,624Summer 8 146 18.3 7,680 9 168 18.7 8,976
Total 22 444 20.2 23,376 28 602 21.5 35,808
BusinessFall 3 90 30.0 4,320 3 86 28.7 4,128 4 114 28.5 5,472Spring 6 170 28.3 8,160 3 87 29.0 4,176Summer 7 133 19.0 6,384 5 101 20.2 4,848
Total 16 393 24.6 18,864 11 274 24.9 13,152
Business TechnologyFallSpringSummer 1 16 16.0 768
Total 1 16 16.0 768
ChemistryFall 2 43 21.5 4,128 2 45 22.5 4,320 2 46 23.0 4,416Spring 3 68 22.7 6,528 2 48 24.0 4,608Summer 2 39 19.5 3,744
Total 5 111 22.2 10,656 6 132 22.0 12,672
Child Development/Early ChildhoodFall 3 48 16.0 2,768 2 37 18.5 2,016 2 24 12.0 1,536Spring 2 33 16.5 2,112 2 36 18.0 1,936Summer 1 11 11.0 528 1 6 6.0 384
Total 6 92 15.3 5,408 5 79 15.8 4,336
eLearning Enrollment
2015-16 2016-17 2017-18
124 Del Mar College Statistical Profile 2017/18
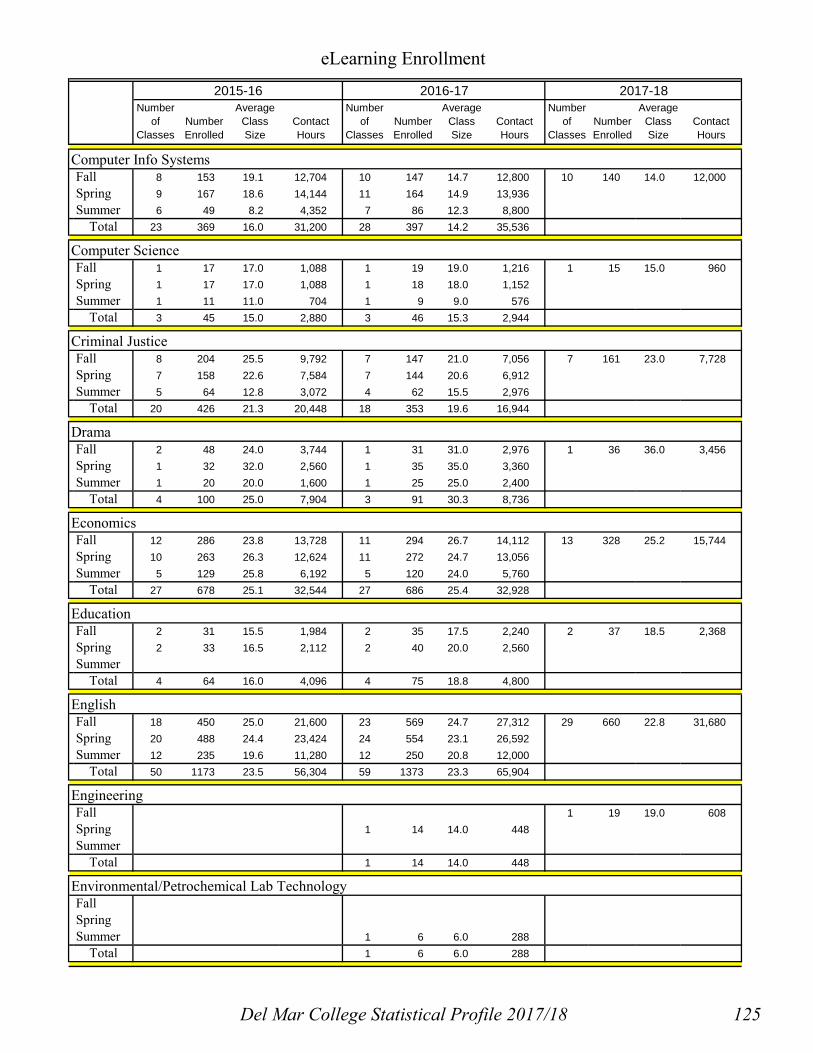
Numberof
ClassesNumber Enrolled
AverageClassSize
Contact Hours
Numberof
ClassesNumber Enrolled
AverageClassSize
Contact Hours
Numberof
ClassesNumber Enrolled
AverageClassSize
Contact Hours
eLearning Enrollment
2015-16 2016-17 2017-18
Computer Info SystemsFall 8 153 19.1 12,704 10 147 14.7 12,800 10 140 14.0 12,000Spring 9 167 18.6 14,144 11 164 14.9 13,936Summer 6 49 8.2 4,352 7 86 12.3 8,800
Total 23 369 16.0 31,200 28 397 14.2 35,536
Computer ScienceFall 1 17 17.0 1,088 1 19 19.0 1,216 1 15 15.0 960Spring 1 17 17.0 1,088 1 18 18.0 1,152Summer 1 11 11.0 704 1 9 9.0 576
Total 3 45 15.0 2,880 3 46 15.3 2,944
Criminal JusticeFall 8 204 25.5 9,792 7 147 21.0 7,056 7 161 23.0 7,728Spring 7 158 22.6 7,584 7 144 20.6 6,912Summer 5 64 12.8 3,072 4 62 15.5 2,976
Total 20 426 21.3 20,448 18 353 19.6 16,944
DramaFall 2 48 24.0 3,744 1 31 31.0 2,976 1 36 36.0 3,456Spring 1 32 32.0 2,560 1 35 35.0 3,360Summer 1 20 20.0 1,600 1 25 25.0 2,400
Total 4 100 25.0 7,904 3 91 30.3 8,736
EconomicsFall 12 286 23.8 13,728 11 294 26.7 14,112 13 328 25.2 15,744Spring 10 263 26.3 12,624 11 272 24.7 13,056Summer 5 129 25.8 6,192 5 120 24.0 5,760
Total 27 678 25.1 32,544 27 686 25.4 32,928
EducationFall 2 31 15.5 1,984 2 35 17.5 2,240 2 37 18.5 2,368Spring 2 33 16.5 2,112 2 40 20.0 2,560Summer
Total 4 64 16.0 4,096 4 75 18.8 4,800
EnglishFall 18 450 25.0 21,600 23 569 24.7 27,312 29 660 22.8 31,680Spring 20 488 24.4 23,424 24 554 23.1 26,592Summer 12 235 19.6 11,280 12 250 20.8 12,000
Total 50 1173 23.5 56,304 59 1373 23.3 65,904
EngineeringFall 1 19 19.0 608Spring 1 14 14.0 448Summer
Total 1 14 14.0 448
Environmental/Petrochemical Lab TechnologyFallSpringSummer 1 6 6.0 288
Total 1 6 6.0 288
Del Mar College Statistical Profile 2017/18 125
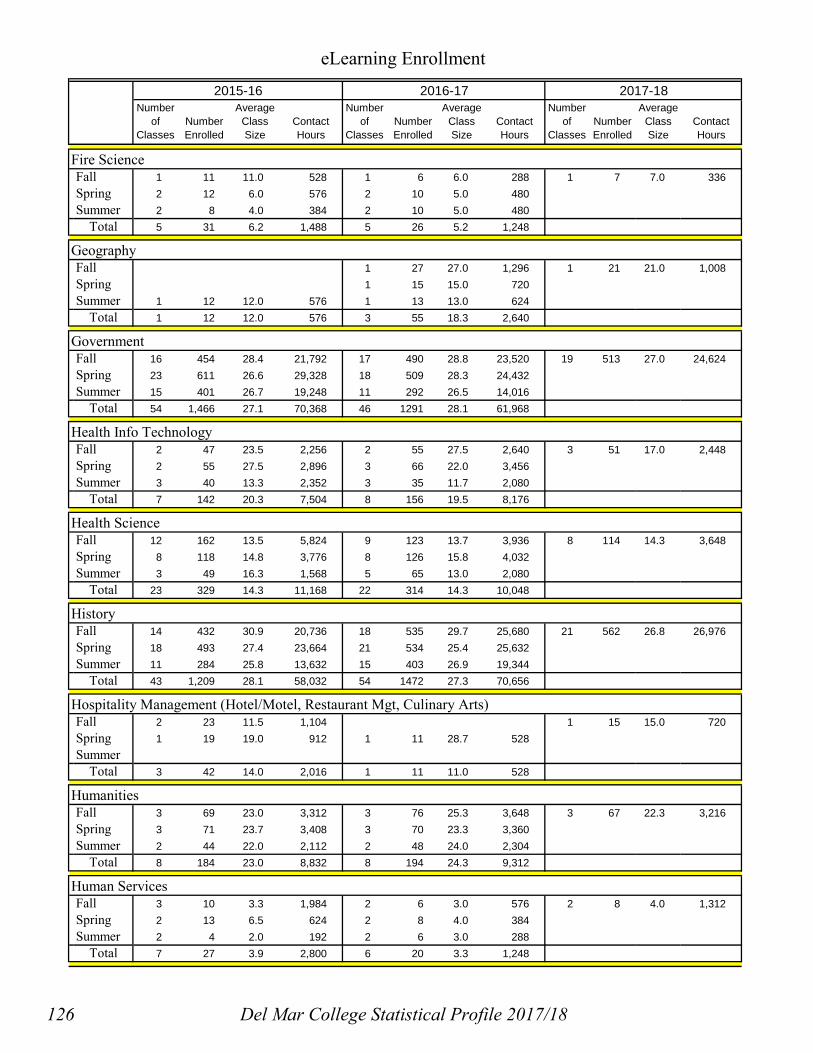
Numberof
ClassesNumber Enrolled
AverageClassSize
Contact Hours
Numberof
ClassesNumber Enrolled
AverageClassSize
Contact Hours
Numberof
ClassesNumber Enrolled
AverageClassSize
Contact Hours
eLearning Enrollment
2015-16 2016-17 2017-18
Fire ScienceFall 1 11 11.0 528 1 6 6.0 288 1 7 7.0 336Spring 2 12 6.0 576 2 10 5.0 480Summer 2 8 4.0 384 2 10 5.0 480
Total 5 31 6.2 1,488 5 26 5.2 1,248
GeographyFall 1 27 27.0 1,296 1 21 21.0 1,008Spring 1 15 15.0 720Summer 1 12 12.0 576 1 13 13.0 624
Total 1 12 12.0 576 3 55 18.3 2,640
GovernmentFall 16 454 28.4 21,792 17 490 28.8 23,520 19 513 27.0 24,624Spring 23 611 26.6 29,328 18 509 28.3 24,432Summer 15 401 26.7 19,248 11 292 26.5 14,016
Total 54 1,466 27.1 70,368 46 1291 28.1 61,968
Health Info TechnologyFall 2 47 23.5 2,256 2 55 27.5 2,640 3 51 17.0 2,448Spring 2 55 27.5 2,896 3 66 22.0 3,456Summer 3 40 13.3 2,352 3 35 11.7 2,080
Total 7 142 20.3 7,504 8 156 19.5 8,176
Health ScienceFall 12 162 13.5 5,824 9 123 13.7 3,936 8 114 14.3 3,648Spring 8 118 14.8 3,776 8 126 15.8 4,032Summer 3 49 16.3 1,568 5 65 13.0 2,080
Total 23 329 14.3 11,168 22 314 14.3 10,048
HistoryFall 14 432 30.9 20,736 18 535 29.7 25,680 21 562 26.8 26,976Spring 18 493 27.4 23,664 21 534 25.4 25,632Summer 11 284 25.8 13,632 15 403 26.9 19,344
Total 43 1,209 28.1 58,032 54 1472 27.3 70,656
Hospitality Management (Hotel/Motel, Restaurant Mgt, Culinary Arts)Fall 2 23 11.5 1,104 1 15 15.0 720Spring 1 19 19.0 912 1 11 28.7 528Summer
Total 3 42 14.0 2,016 1 11 11.0 528
HumanitiesFall 3 69 23.0 3,312 3 76 25.3 3,648 3 67 22.3 3,216Spring 3 71 23.7 3,408 3 70 23.3 3,360Summer 2 44 22.0 2,112 2 48 24.0 2,304
Total 8 184 23.0 8,832 8 194 24.3 9,312
Human ServicesFall 3 10 3.3 1,984 2 6 3.0 576 2 8 4.0 1,312Spring 2 13 6.5 624 2 8 4.0 384Summer 2 4 2.0 192 2 6 3.0 288
Total 7 27 3.9 2,800 6 20 3.3 1,248
126 Del Mar College Statistical Profile 2017/18

Numberof
ClassesNumber Enrolled
AverageClassSize
Contact Hours
Numberof
ClassesNumber Enrolled
AverageClassSize
Contact Hours
Numberof
ClassesNumber Enrolled
AverageClassSize
Contact Hours
eLearning Enrollment
2015-16 2016-17 2017-18
Industrial Education/Occupational LearningFall 1 21 21.0 1,008 2 33 16.5 1,584 4 67 16.8 3,216Spring 3 46 15.3 2,208 2 34 17.0 1,632Summer 1 11 11.0 528
Total 5 78 15.6 3,744 4 67 16.8 3,216
KinesiologyFall 4 95 23.8 4,560 6 127 21.2 6,096 6 144 24.0 6,912Spring 10 221 22.1 10,608 7 160 22.9 7,680Summer 7 147 21.0 7,056 6 121 20.2 5,808
Total 21 463 22.0 22,224 19 408 21.5 19,584
Management DevelopmentFall 2 27 13.5 1,296 3 66 22.0 3,168 4 96 24.0 4,608Spring 3 93 31.0 4,464 4 113 28.3 5,424Summer 2 35 17.5 1,680 2 39 19.5 1,872
Total 7 155 22.1 7,440 9 218 24.2 10,464
MathematicsFall 21 510 24.3 25,056 25 616 24.6 30,320 31 689 22.2 34,000Spring 20 462 23.1 22,784 23 614 26.7 30,320Summer 14 234 16.7 11,520 19 284 14.9 14,064
Total 55 1,206 21.9 59,360 67 1514 22.6 74,704
MusicFall 4 96 24.0 4,608 4 102 25.5 4,896 4 95 23.8 4,560Spring 4 101 25.3 4,848 4 101 25.3 4,848Summer 1 23 23.0 1,104 1 18 18.0 864
Total 9 220 24.4 10,560 9 221 24.6 10,608
Nurse Education (Internet + eLine)Fall 1 11 11.0 176 1 5 5.0 240 1 2 2.0 96Spring 1 1 1.0 32 9 271 30.1 6,352Summer 1 10 10.0 320 3 94 31.3 1,504
Total 3 22 7.3 528 13 370 28.5 8,096
Occupational Safety and Health FallSpring 1 6 6.0 192Summer 1 7 7.0 224
Total 1 7 7.0 224 1 6 6.0 192
PhilosophyFall 4 96 24.0 4,608 3 66 22.0 3,168 2 46 23.0 2,208Spring 2 46 23.0 2,208 2 45 22.5 2,160Summer 2 47 23.5 2,256 2 50 25.0 2,400
Total 8 189 23.6 9,072 7 161 23.0 7,728
PsychologyFall 13 358 27.5 17,184 14 364 26.0 17,472 14 344 24.6 16,512Spring 12 264 22.0 12,672 8 190 23.8 9,120Summer 9 162 18.0 7,776 7 141 20.1 6,768
Total 34 784 23.1 37,632 29 695 24.0 33,360
Del Mar College Statistical Profile 2017/18 127

Numberof
ClassesNumber Enrolled
AverageClassSize
Contact Hours
Numberof
ClassesNumber Enrolled
AverageClassSize
Contact Hours
Numberof
ClassesNumber Enrolled
AverageClassSize
Contact Hours
eLearning Enrollment
2015-16 2016-17 2017-18
Process TechnologyFall 7 189 27.0 13,728 10 246 24.6 17,376 8 137 17.1 9,280Spring 11 286 26.0 21,984 10 219 21.9 12,592Summer 10 215 21.5 13,520 9 125 13.9 7,056
Total 28 690 24.6 49,232 29 590 20.3 37,024
Sociology/Social WorkFall 4 113 28.3 5,424 6 175 29.2 8,400 5 118 23.6 5,664Spring 7 228 32.6 10,944 10 260 26.0 12,480Summer 3 69 23.0 3,312 5 96 19.2 4,608
Total 14 410 29.3 19,680 21 531 25.3 25,488
SpeechFall 5 111 22.2 5,328 9 210 23.3 10,080 14 299 21.4 14,352Spring 9 207 23.0 9,936 11 253 23.0 12,144Summer 5 98 19.6 4,704 4 84 21.0 4,032
Total 19 416 21.9 19,968 24 547 22.8 26,256
Student SuccessFall 7 117 16.7 1,872Spring 2 32 16.0 512Summer 4 60 15.0 960
Total 6 92 15.3 1,472
Welding Applied TechnologyFall 2 22 11.0 2,112Spring 1 11 11.0 704Summer 1 6 6.0 384
Total 2 17 8.5 1,088
Total Fall 192 4,492 23.4 232,064 218 5,158 23.7 266,768 253 5,540 21.9 279,760
Total Spr 219 5,066 23.1 262,352 240 5,494 22.9 272,928
Total Sum 148 2,787 18.8 140,752 156 2,940 18.8 146,032
559 12,345 22.1 635,168 614 13,592 22.1 685,728
Interactive Video CoursesSpeechFall 1 20 20.0 960SpringSummer
1 20 20.0 960
Internet Total
Video Total
128 Del Mar College Statistical Profile 2017/18

Numberof
ClassesNumber Enrolled
AverageClassSize
Contact Hours
Numberof
ClassesNumber Enrolled
AverageClassSize
Contact Hours
Numberof
ClassesNumber Enrolled
AverageClassSize
Contact Hours
eLearning Enrollment
2015-16 2016-17 2017-18
Hybrid CoursesAccountingFall 5 78 15.6 3,744 5 72 14.4 3,456 5 76 3,648Spring 5 78 15.6 3,744 6 94 15.7 4,512Summer 2 32 16.0 1,536 2 27 13.5 1,296
Total 12 188 15.7 9,024 13 193 14.8 9,264
American Sign Language and InterpretingFall 2 27 13.5 2,144 2 15 7.5 1,216 2 34 2,688SpringSummer
Total 2 27 13.5 2,144 2 15 7.5 1,216
BiologyFallSpring 1 27 27.0 2,592Summer
Total 1 27 27.0 2,592
Business TechnologyFall 1 8 8.0 384SpringSummer 2 20 10.0 960
Total 3 28 9.3 1,344
ChemistryFallSpringSummer 1 18 18.0 1,728
Total 1 18 18.0 1,728
Child Development/Early ChildhoodFall 1 15 15.0 720 1 17 17.0 1,088 3 39 2,048Spring 2 32 16.0 1,536 1 18 18.0 864Summer 1 15 15.0 960
Total 4 62 15.5 3,216 2 35 17.5 1,952
Computer Information SystemsFall 3 41 13.7 3,936 5 50 10.0 4,800 6 68 6,256Spring 9 119 13.2 11,424 3 28 9.3 2,688Summer 3 24 8.0 2,304 2 10 5.0 912
Total 15 184 12.3 17,664 10 88 8.8 8,400
Computer ScienceFall 1 15 15.0 1,200 1 11 11.0 880 1 3 240Spring 1 13 13.0 1,040 1 13 13.0 1,248Summer 1 3 3.0 240
Total 2 28 14.0 2,240 3 27 9.0 2,368
Court ReportingFallSpring 1 15 15.0 720Summer
Total 1 15 15.0 720
Del Mar College Statistical Profile 2017/18 129

Numberof
ClassesNumber Enrolled
AverageClassSize
Contact Hours
Numberof
ClassesNumber Enrolled
AverageClassSize
Contact Hours
Numberof
ClassesNumber Enrolled
AverageClassSize
Contact Hours
eLearning Enrollment
2015-16 2016-17 2017-18
EconomicsFallSpringSummer 2 27 13.5 1,296 2 29 14.5 1,392
Total 2 27 13.5 1,296 2 29 14.5 1,392
Health Information TechnologyFallSpringSummer 1 5 5.0 240
Total 1 5 5.0 240
Health ScienceFall 2 28 14.0 1,792 2 28 1,792Spring 2 27 13.5 1,728 2 29 14.5 1,856Summer 2 18 9.0 1,152 1 6 6.0 384
Total 4 45 11.3 2,880 5 63 12.6 4,032
Kinesiology (includes Dance)Fall 4 98 24.5 4,704 2 47 23.5 2,256Spring 3 65 21.7 3,120 2 48 24.0 2,304Summer
Total 7 163 23.3 7,824 4 95 23.8 4,560
Management DevelopmentFallSpringSummer 1 11 11.0 528 1 7 7.0 336
Total 1 11 11.0 528 1 7 7.0 336
Nurse EducationFall 8 330 41.3 6,672 9 281 5,504SpringSummer 2 22 11.0 592 1 31 31.0 992
Total 2 22 11.0 592 9 361 40.1 7,664
Process TechnologyFall 26 297 25,728SpringSummer 3 28 9.3 2,688
Total 3 28 9.3 2,688
Total Fall 17 282 16.6 16,832 26 570 21.9 22,160 54 826 15.3 47,904
Total Spr 24 376 15.7 25,904 15 230 15.3 13,472
Total Sum 20 220 11.0 13,984 10 113 11.3 5,552
61 878 14.4 56,720 51 913 17.9 41,184
Hybrid Total
130 Del Mar College Statistical Profile 2017/18
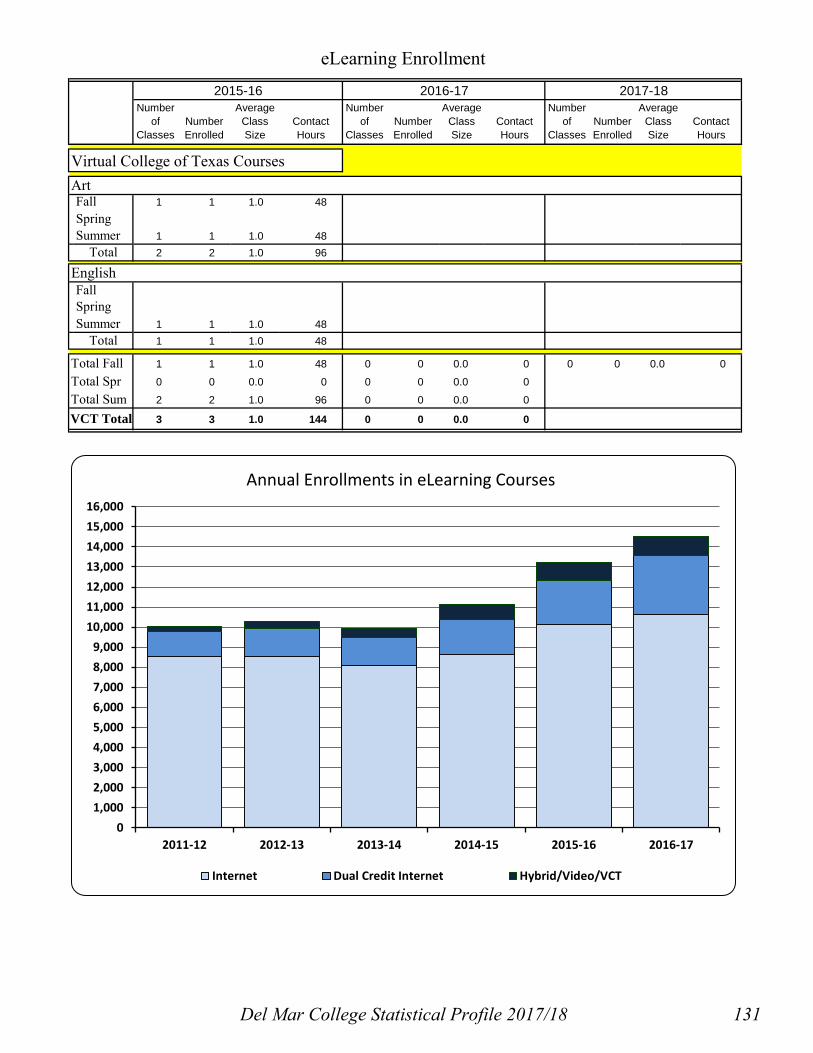
Numberof
ClassesNumber Enrolled
AverageClassSize
Contact Hours
Numberof
ClassesNumber Enrolled
AverageClassSize
Contact Hours
Numberof
ClassesNumber Enrolled
AverageClassSize
Contact Hours
eLearning Enrollment
2015-16 2016-17 2017-18
Virtual College of Texas CoursesArtFall 1 1 1.0 48SpringSummer 1 1 1.0 48
Total 2 2 1.0 96
EnglishFallSpringSummer 1 1 1.0 48
Total 1 1 1.0 48
Total Fall 1 1 1.0 48 0 0 0.0 0 0 0 0.0 0
Total Spr 0 0 0.0 0 0 0 0.0 0
Total Sum 2 2 1.0 96 0 0 0.0 0
3 3 1.0 144 0 0 0.0 0VCT Total
01,0002,0003,0004,0005,0006,0007,0008,0009,000
10,00011,00012,00013,00014,00015,00016,000
2011-12 2012-13 2013-14 2014-15 2015-16 2016-17
Annual Enrollments in eLearning Courses
Internet Dual Credit Internet Hybrid/Video/VCT
Del Mar College Statistical Profile 2017/18 131

Number of
Classes
Number Enrolled
Average Class Size
ContactHours
Number of
Classes
Number Enrolled
Average Class Size
ContactHours
Number of
Classes
Number Enrolled
Average Class Size
ContactHours
EnglishFall
Spring 2 55 27.5 2,640Total 2 55 27.5 2,640
GovernmentFall 4 75 18.8 3,600
Spring Total 4 75 18.8 3,600
HistoryFall 3 98 32.7 4,704 3 75 25.0 3,600 3 115 38.3 5,520
Spring 3 81 27.0 3,888Total 3 98 32.7 4,704 6 156 26.0 7,488 3 115 38.3 5,520
MathFall
Spring 1 9 9.0 432Total 1 9 9.0 432
MusicFall
Spring 1 2 2.0 96Total 1 2 2.0 96
Total Fall 7 173 24.7 8,304 3 75 25.0 3,600 3 115 38.3 5,520Total Spring 4 66 16.5 3,168 3 81 27.0 3,888Total Summer 0 0 0.0 0 0 0 0.0 0
TOTAL 11 239 21.7 11,472 6 156 26.0 7,488
Collegiate High School Course Enrollment2017-182016-172015-16
0
500
1,000
1,500
2,000
2,500
3,000
3,500
2011-12 2012-13 2013-14 2014-15 2015-16 2016-17
Annual Enrollments for High School Students
DMC Campus/Collegiate HS High School Campus Internet
132 Del Mar College Statistical Profile 2017/18

Number of
Classes
Number Enrolled
Average Class Size
ContactHours
Number of
Classes
Number Enrolled
Average Class Size
ContactHours
Number of
Classes
Number Enrolled
Average Class Size
ContactHours
Accounting Fall 1 22 22.0 1,056 1 22 22.0 1,056
Spring 1 11 11.0 528Total 2 33 16.5 1,584 1 22 22.0 1,056
Architectural TechnologyFall 2 31 15.5 2,448
Spring Total 2 31 15.5 2,448
Automotive Applied TechnologyFall 4 19 4.8 2,432 4 15 3.8 1,920 2 18 9.0 2,304
Spring 5 22 4.4 2,336 4 26 6.5 2,768Total 9 41 4.6 4,768 8 41 5.1 4,688 2 18 9.0 2,304
BiologyFall 5 56 11.2 5,376 4 41 10.3 3,936 4 48 12.0 4,608
Spring 4 41 10.3 3,936 4 42 10.5 4,032Total 9 97 10.8 9,312 8 83 10.4 7,968 4 48 12.0 4,608
Computer Information SystemsFall 2 34 17.0 3,264 5 55 11.0 4,000
Spring 1 23 23.0 2,208 2 28 14.0 2,272Total 1 23 23.0 2,208 4 62 15.5 5,536 5 55 11.0 4,000
CosmetologyFall 4 72 18.0 11,056 5 62 12.4 9,568 4 73 18.3 11,168
Spring 5 82 16.4 9,440.0 6 77 12.8 9,040Summer 3 30 10.0 4,640 3 39 13.0 6,032
Total 12 184 15.3 25,136 14 178 12.7 24,640 4 73 18.3 11,168
Culinary ArtsFall 2 14 7.0 896 1 3 3.0 144
Spring 2 13 6.5 1,040 2 9 4.5 720Total 4 27 6.8 1,936 3 12 4.0 864
Diesel Applied TechnologyFall 2 16 8.0 2,048 3 32 10.7 3,872 4 41 10.3 4,896
Spring 2 27 13.5 2,560 3 24 8.0 3,072Summer 1 14 14.0 896
Total 4 43 10.8 4,608 7 70 10.0 7,840 4 41 10.3 4,896
EconomicsFall 9 200 22.2 9,600 8 209 26.1 10,032 9 216 24.0 10,368
Spring 4 118 29.5 5,664 7 178 25.4 8,544Total 13 318 24.5 15,264 15 387 25.8 18,576 9 216 24.0 10,368
Emergency Medical ServicesFall
Spring 1 33 33.0 5,808 2 44 22.0 5,632Total 1 33 33.0 5,808 2 44 22.0 5,632
EngineeringFall 1 22 22.0 704 1 10 10.0 320
Spring 1 5 5.0 400Total 2 27 13.5 1,104 1 10 10.0 320
Dual Credit Course Enrollment
2015-16 2016-17 2017-18
Del Mar College Statistical Profile 2017/18 133

Number of
Classes
Number Enrolled
Average Class Size
ContactHours
Number of
Classes
Number Enrolled
Average Class Size
ContactHours
Number of
Classes
Number Enrolled
Average Class Size
ContactHours
Dual Credit Course Enrollment
2015-16 2016-17 2017-18
Engineering Technology (includes CNET)Fall
Spring 1 7 7.0 784 1 4 4.0 448Total 1 7 7.0 784 1 4 4.0 448
EnglishFall 25 597 23.9 28,656 25 632 25.3 30,336 30 661 22.0 31,728
Spring 23 539 23.4 25,872 25 585 23.4 28,080Total 48 1136 23.7 54,528 50 1217 24.3 58,416 30 661 22.0 31,728
Fire ScienceFall 4 48 12.0 4,704 4 46 11.5 4,496 4 38 9.5 3,792
Spring 4 38 9.5 3,344 4 36 9.0 3,168Total 8 86 10.8 8,048 8 82 10.3 7,664 4 38 9.5 3,792
GovernmentFall 5 164 32.8 7,872 12 329 27.4 15,792 9 239 26.6 11,472
Spring 13 284 21.8 13,632 14 326 23.3 15,648Total 18 448 24.9 21,504 26 655 25.2 31,440 9 239 26.6 11,472
HistoryFall 10 247 24.7 11,856 12 305 25.4 14,640 13 326 25.1 15,648
Spring 14 357 25.5 17,136 14 279 19.9 13,392Total 24 604 25.2 28,992 26 584 22.5 28,032 13 326 25.1 15,648
InstrumentationFall 1 11 11.0 880 2 9 4.5 752
Spring 1 1 1.0 96Total 1 11 11.0 880 3 10 3.3 848
KinesiologyFall
Spring 1 18 18.0 864Total 1 18 18.0 864
MathematicsFall 10 250 25.0 12,000 16 354 22.1 16,992 14 377 26.9 18,096
Spring 12 260 21.7 12,480 13 271 20.8 13,152Total 22 510 23.2 24,480 29 625 21.6 30,144 14 377 26.9 18,096
MusicFall 1 5 5.0 240 1 22 22.0 1,056 2 9 4.5 432
Spring 1 3 3.0 144Total 1 5 5.0 240 2 25 12.5 1,200 2 9 4.5 432
Occupational Learning (prior to Fall 2016 - Industrial Education)Fall 2 32 16.0 1,536
Spring Total 2 32 16.0 1,536
PhilosophyFall
Spring 1 23 23.0 1,104 1 26 26.0 1,248Total 1 23 23.0 1,104 1 26 26.0 1,248
134 Del Mar College Statistical Profile 2017/18

Number of
Classes
Number Enrolled
Average Class Size
ContactHours
Number of
Classes
Number Enrolled
Average Class Size
ContactHours
Number of
Classes
Number Enrolled
Average Class Size
ContactHours
Dual Credit Course Enrollment
2015-16 2016-17 2017-18
Process TechnologyFall 2 18 9.0 1,104 2 8 4.0 576 1 10 10.0 800
Spring 3 25 8.3 1,440 3 12 4.0 768Total 5 43 8.6 2,544 5 20 4.0 1,344 1 10 10.0 800
PsychologyFall 8 185 23.1 8,880 9 205 22.8 9,840 8 201 25.1 9,648
Spring 3 64 21.3 3,072 4 69 17.3 3,312Total 11 249 22.6 11,952 13 274 21.1 13,152 8 201 25.1 9,648
SociologyFall 1 29 29.0 1,392 2 56 28.0 2,688 1 27 27.0 1,296
Spring 5 154 30.8 7,392 7 177 25.3 8,496Total 6 183 30.5 8,784 9 233 25.9 11,184 1 27 27.0 1,296
SpanishFall 2 57 28.5 2,928 3 41 13.7 3,120 3 22 7.3 1,760
Spring 3 58 19.3 2,976 3 37 12.3 2,896Total 5 115 23.0 5,904 6 78 13.0 6,016 3 22 7.3 1,760
SpeechFall 3 57 19.0 2,736 3 77 25.7 3,696 5 90 18.0 4,320
Spring 3 58 19.3 2,784 3 71 23.7 3,408Total 6 115 19.2 5,520 6 148 24.7 7,104 5 90 18.0 4,320
Welding Applied TechnologyFall 7 80 11.4 12,800 11 79 7.2 12,576 13 161 12.4 26,592
Spring 7 67 9.6 11,776 17 192 67 24,528Summer
Total 14 147 10.5 24,576 28 271 9.7 37,104 13 161 12.4 26,592
Total Fall 105 2,125 20.2 127,456 131 2,603 19.9 151,056 137 2707 19.8 168,288
Total Spring 116 2,293 19.8 136,784 144 2,551 17.7 156,656
Total Summer 3 30 10.0 4,640 4 53 13.3 6,928
TOTAL 224 4,448 19.9 268,880 279 5,207 18.7 314,640 137 2,707 19.8 168,288
0
20,000
40,000
60,000
80,000
100,000
120,000
140,000
160,000
2011-12 2012-13 2013-14 2014-15 2015-16 2016-17
Annual Contact Hours for High School Students
DMC Campus/Collegiate HS High School Campus Internet
Del Mar College Statistical Profile 2017/18 135

Number of
Classes
Number Enrolled
Average Class Size
ContactHours
Number of
Classes
Number Enrolled
Average Class Size
ContactHours
Number of
Classes
Number Enrolled
Average Class Size
ContactHours
BiologyFall 3 48 16.0 4,608 2 34 17.0 3,264 2 38 19.0 3,648
Spring 3 36 12.0 3,456 2 20 10.0 1,920Summer
Total 6 84 14.0 8,064 4 54 13.5 5,184 2 38 19.0 3,648
ChemistryFall 1 21 21.0 2,016
Spring 1 21 21.0 2,016Summer
Total 1 21 21.0 2,016 1 21 21.0 2,016
Computer Information SystemsFall 2 32 16.0 3,072 2 23 11.5 2,208 2 27 13.5 2,592
Spring 2 30 15.0 2,880 2 30 15.0 2,880Summer 1 11 11.0 528
Total 5 73 14.6 6,480 4 53 13.3 5,088 2 27 13.5 2,592
EconomicsFall
Spring 2 42 21.0 2,016 1 9 9.0 432Summer
Total 2 42 21.0 2,016 1 9 9.0 432
Emergency Medical ServicesFall 2 59 29.5 5,664 2 36 18.0 4,608 8 135 16.9 11,440
Spring 7 187 26.7 19,984 3 97 32.3 9,312Summer 2 65 32.5 8,288 9 224 24.9 25,008
Total 11 311 28.3 33,936 14 357 25.5 38,928 8 135 16.9 11,440
EnglishFall 2 28 14.0 1,344 1 24 24.0 1,152 1 14 14.0 672
Spring 2 31 15.5 1,488 1 11 11.0 528Summer 1 9 9.0 432 2 26 13.0 1,248
Total 5 68 13.6 3,264 4 61 15.3 2,928 1 14 14.0 672
Fire ScienceFall 2 56 28.0 5,872
Spring 6 174 29.0 15,312 Summer
Total 8 230 28.8 21,184
GovernmentFall 3 58 19.3 2,784 1 15 15.0 720 2 69 34.5 3,312
Spring Summer
Total 3 58 19.3 2,784 1 15 15.0 720 2 69 34.5 3,312
Health ScienceFall 1 6 6.0 384
Spring 1 5 5.0 320Summer
Total 1 6 6.0 384 1 5 5.0 320
Off-Campus Course Enrollment
2017-182016-172015-16
136 Del Mar College Statistical Profile 2017/18

Number of
Classes
Number Enrolled
Average Class Size
ContactHours
Number of
Classes
Number Enrolled
Average Class Size
ContactHours
Number of
Classes
Number Enrolled
Average Class Size
ContactHours
Off-Campus Course Enrollment
2017-182016-172015-16
HistoryFall 3 56 18.7 2,688 3 61 20.3 2,928 3 64 21.3 3,072
Spring 3 54 18.0 2,592 3 55 18.3 2,640 Summer
Total 6 110 18.3 5,280 6 116 19.3 5,568 3 64 21.3 3,072
MathematicsFall 5 75 15.0 3,888 4 53 13.3 2,736 7 97 13.9 4,832
Spring 5 56 11.2 2,688 5 66 13.2 3,168Summer 3 35 11.7 1,952
Total 10 131 13.1 6,576 12 154 12.8 7,856 7 97 13.9 4,832
Nurse EducationFall
Spring Summer 1 2 2.0 384
Total 1 2 2.0 384
PhilosophyFall
Spring 1 10 10.0 480Summer
Total 1 10 10.0 480
PsychologyFall 1 27 27.0 1,296 1 26 26.0 1,248 1 22 22.0 1,056
Spring 3 64 21.3 3,072 1 16 16.0 768 Summer
Total 4 91 22.8 4,368 2 42 21.0 2,016 1 22 22.0 1,056
SociologyFall 2 35 17.5 1,680 2 22 11.0 1,056 2 31 15.5 1,488
Spring Summer
Total 2 35 17.5 1,680 2 22 11.0 1,056 2 31 15.5 1,488
SpeechFall 3 43 14.3 2,064 1 21 21.0 1,008 1 23 23.0 1,104
Spring Summer
Total 3 43 14.3 2,064 1 21 21.0 1,008 1 23 23.0 1,104
Total Fall 27 467 17.3 29,472 21 371 17.7 26,800 30 541 18.0 35,232
Total Spring 27 500 18.5 38,176 27 514 19.0 39,776
Total Summer 5 87 17.4 9,632 14 285 20.4 28,208
TOTAL 59 1,054 17.9 77,280 62 1,170 18.9 94,784
Del Mar College Statistical Profile 2017/18 137

Classes Enrolled Classes Enrolled Classes Enrolled Classes Enrolled Classes Enrolled
Dual Credit LocationsAransas Pass High School 2 39 0 0 0 0Calallen High School 2 65 2 82 2 76 4 115 8 214Carroll High School 3 156 3 68 4 128 5 101 2 43Collegiate High School 18 487 11 318 6 154 11 239 6 156Del Mar College Campus 20 248 53 713 68 854 42 567 95 1,106Flour Bluff High School 8 134 8 165 7 63 10 146 10 104Gregory-Portland H. S. 3 147 4 188 6 145 24 458 9 224Incarnate Word Academy 4 94 0 0 2 52 0 0 1 16Ingleside High School 0 0 0 0 0 0 5 45 0 0Internet Delivery 50 1,374 51 1,356 67 1,753 81 2,223 117 2,956Harold T. Branch H.S. 2 65John Paul II High School 2 4 4 29 6 48 6 48 2 11King High School 4 161 3 189 4 98 5 79 5 124London High School 1 10Mathis High School 2 47 0 0 0 0Miller High School 0 0 0 0 3 54 10 97 8 78Moody High School 6 153 2 16 3 64 1 11 0 0Odem-Edroy High School 2 47 2 40 0 0 0 0 0 0Port Aransas High School 6 86 6 82 6 60 5 44 4 23Ray High School 4 67 2 93 2 22 2 55 2 42Robstown High School 0 0 4 64Rockport High School 2 43 2 28 4 50 1 7 2 6Sinton High School 2 133 4 157 4 108 6 138 5 96Taft High School 2 39 2 17 0 0Tuloso-Midway H. S. 10 261 8 269 11 294 12 240 2 25West Oso High School 3 57 0 0
Total Dual Credit Locations 146 3,660 165 3,793 211 4,148 235 4,687 285 5,363
Off-Campus LocationsCC Army Depot/NAS 4 54 4 109 2 35 5 75Fire Academy 8 164 15 106 2 52 11 311 22 587North-West Center 17 139 11 106 21 283 45 706 35 508Spohn Hospital 1 2 0 0
Total Off-Campus Locations 25 303 30 266 27 444 59 1,054 62 1,170
Total All Locations 171 3,963 195 4,059 238 4,592 294 5,741 347 6,533
Annual Enrollment in Dual Credit and Off-Campus Courses by Location2015-16 2016-172012-13 2013-14 2014-15
138 Del Mar College Statistical Profile 2017/18

2015-16 2016-17 2017-18Number
of Classes
Number Enrolled
Average Class Size
Contact Hours
Number of
Classes
Number Enrolled
Average Class Size
Contact Hours
Number of
Classes
Number Enrolled
Average Class Size
Contact Hours
Eight-Week CoursesBusiness
Fall 1 25 25.0 1,200 1 29 29.0 1,392Spring 3 75 25.0 3,600
Summer 2 44 22.0 2,112Total 1 25 25.0 1,200 6 148 24.7 7,104
Computer Information SystemsFall 2 41 20.5 2,096 2 27 13.5 1,392
Spring 1 12 12.0 1,152 2 22 11.0 2,112Summer 1 13 13.0 1,248 2 14 7.0 1,344
Total 4 66 16.5 4,496 6 63 10.5 4,848
Culinary ArtsFall 1 6 6.0 480 1 8 8.0 640 1 8 8.0 640
Spring 1 1 1.0 80Summer
Total 1 6 6.0 480 2 9 4.5 720
DramaFall
Spring 1 10 10.0 800Summer
Total 1 10 10.0 800
EconomicsFall 1 23 23.0 1,104 1 24 24.0 1,152
Spring 2 49 24.5 2,352Summer 1 23 23.0 1,104
Total 1 23 23.0 1,104 4 96 24.0 4,608
GovernmentFall 2 56 28.0 2,688 3 73 24.3 3,504
Spring 4 109 27.3 5,232Summer 2 47 23.5 2,256
Total 2 56 28.0 2,688 9 229 25.4 10,992
HumanitiesFall
Spring Summer 1 11 11.0 528
Total 1 11 11.0 528
KinesiologyFall 2 46 23.0 2,208 1 18 18.0 864
Spring 2 45 22.5 2,160Summer
Total 2 46 23.0 2,208 3 63 21.0 3,024
Management DevelopmentFall 1 15 15.0 720
Spring 1 13 13.0 624 1 12 12.0 576Summer 1 14 14.0 672 1 10 10.0 480
Total 2 27 13.5 1,296 2 22 11.0 1,056
Flexible Scheduling Course Enrollment
Del Mar College Statistical Profile 2017/18 139

2015-16 2016-17 2017-18Number
of Classes
Number Enrolled
Average Class Size
Contact Hours
Number of
Classes
Number Enrolled
Average Class Size
Contact Hours
Number of
Classes
Number Enrolled
Average Class Size
Contact Hours
Flexible Scheduling Course Enrollment
PsychologyFall 2 43 21.5 2,064 3 74 24.7 3,552
Spring 1 13 13.0 624 5 115 23.0 5,520Summer 2 53 26.5 2,544
Total 3 56 18.7 2,688 10 242 24.2 11,616
Social WorkFall
Spring 1 18 18.0 864Summer 1 8 8.0 384
Total 2 26 13.0 1,248
Total Fall 11 240 21.8 11,840 12 253 21.1 12,496 2 23 11.5 1,360
Total Spring 4 48 12.0 3,200 21 446 21.2 22,496
Total Summer 3 38 12.7 2,448 11 199 18.1 10,224
TOTAL 18 326 18.1 17,488 44 898 20.4 45,216
Data included in the semester in which it was reported to the Texas Higher Education Coordinating Board.
0
200
400
600
800
1,000
1,200
2011-12 2012-13 2013-14 2014-15 2015-16 2016-17
Annual Enrollments in Flexible Scheduling Courses
Eight-Week Rapid Track/Maymester Weekend
140 Del Mar College Statistical Profile 2017/18

2015-16 2016-17 2017-18Number
of Classes
Number Enrolled
Average Class Size
Contact Hours
Number of
Classes
Number Enrolled
Average Class Size
Contact Hours
Number of
Classes
Number Enrolled
Average Class Size
Contact Hours
Rapid Track/Maymester CoursesArts
Fall Spring
Summer 1 24 24.0 1,152 1 17 17.0 816Total 1 24 24.0 1,152 1 17 17.0 816
BusinessFall
Spring Summer 1 12 12.0 576
Total 1 12 12.0 576
EnglishFall 1 25 25.0 1,200 1 24 24.0 1,152
Spring 2 46 23.0 2,208Summer 1 11 11.0 528 2 40 20.0 1,920
Total 2 36 18.0 1,728 5 110 22.0 5,280
GovernmentFall 2 57 28.5 2,736
Spring Summer 2 52 26.0 2,496
Total 2 52 26.0 2,496
HistoryFall
Spring Summer 1 23 23.0 1,104 1 10 10.0 480
Total 1 23 23.0 1,104 1 10 10.0 480
Kinesiology (includes Dance)Fall 2 48 24.0 2,304 1 22 22.0 1,056 3 69 23.0 3,312
Spring 2 48 24.0 2,304Summer 1 16 16.0 768 2 39 19.5 1,872
Total 3 64 21.3 3,072 5 109 21.8 5,232
Occupational LearningFall
Spring Summer 3 45 15.0 2,160
Total 3 45 15.0 2,160
PsychologyFall 2 50 25.0 2,400
Spring Summer 2 31 15.5 1,488
Total 2 31 15.5 1,488
SpeechFall
Spring Summer 2 25 12.5 1,200 6 110 18.3 5,280
Total 2 25 12.5 1,200 6 110 18.3 5,280
Total Fall 3 73 24.3 3,504 2 46 23.0 2,208 7 176 25.1 8,448Total Spring 0 0 0.0 0 4 94 23.5 4,512Total Summer 6 99 16.5 4,752 20 356 17.8 17,088
TOTAL 9 172 19.1 8,256 26 496 19.1 23,808
Flexible Scheduling Course Enrollment
Del Mar College Statistical Profile 2017/18 141

2015-16 2016-17 2017-18Number
of Classes
Number Enrolled
Average Class Size
Contact Hours
Number of
Classes
Number Enrolled
Average Class Size
Contact Hours
Number of
Classes
Number Enrolled
Average Class Size
Contact Hours
ArtFall 1 26 26.0 1,248 1 27 27.0 1,296
Spring Summer
Total 1 26 26.0 1,248
Aviation MaintenanceFall 1 7 7.0 2,128
Spring 1 11 11.0 3,344 1 14 14.0 4,256Summer
Total 1 11 11.0 3,344 2 21 10.5 6,384
Emergency Medical TechnologyFall 4 60 15.0 6,304 7 89 12.7 6,528 3 38 12.7 4,976
Spring 6 118 19.7 10,928 6 62 10.3 4,640Summer 14 321 22.9 18,928 2 26 13.0 2,944
Total 24 499 20.8 36,160 15 177 11.8 14,112
Health ScienceFall 1 9 9.0 576 1 6 6.0 384 1 10 10.0 640
Spring 1 12 12.0 768 1 7 7.0 448Summer 1 5 5.0 320
Total 2 21 10.5 1,344 3 18 6.0 1,152
MathematicsFall 4 59 14.8 3,120 6 92 15.3 4,592 3 47 15.7 2,528
Spring 2 20 10.0 960 3 47 15.7 2,256Summer
Total 6 79 13.2 4,080 9 139 15.4 6,848
PsychologyFall 1 33 33.0 1,584 1 30 30.0 1,440 1 30 30.0 1,440
Spring 1 18 18.0 864 1 23 23.0 1,104Summer
Total 2 51 25.5 2,448 2 53 26.5 2,544
Total Fall 10 161 16.1 11,584 17 250 14.7 16,320 9 152 16.9 10,880Total Spring 11 179 16.3 16,864 12 153 12.8 12,704Total Summer 14 321 22.9 18,928 3 31 10.3 3,264
TOTAL 35 661 18.9 47,376 32 434 13.6 32,288
Flexible Scheduling Course Enrollment
Weekend Courses
Data included in the semester in which it was reported to the Texas Higher Education Coordinating Board.
142 Del Mar College Statistical Profile 2017/18
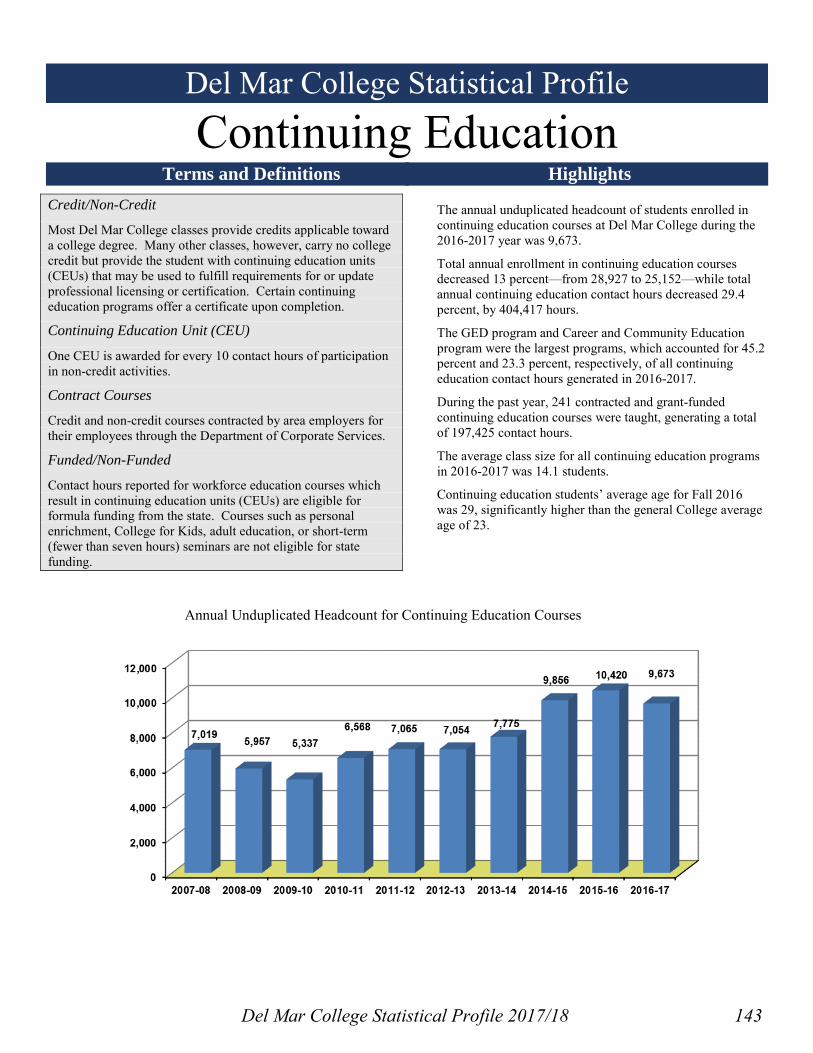
Del Mar College Statistical Profile
Continuing Education Terms and Definitions
Credit/Non-Credit
Most Del Mar College classes provide credits applicable toward a college degree. Many other classes, however, carry no college credit but provide the student with continuing education units (CEUs) that may be used to fulfill requirements for or update professional licensing or certification. Certain continuing education programs offer a certificate upon completion.
Continuing Education Unit (CEU)
One CEU is awarded for every 10 contact hours of participation in non-credit activities.
Contract Courses
Credit and non-credit courses contracted by area employers for their employees through the Department of Corporate Services.
Funded/Non-Funded
Contact hours reported for workforce education courses which result in continuing education units (CEUs) are eligible for formula funding from the state. Courses such as personal enrichment, College for Kids, adult education, or short-term (fewer than seven hours) seminars are not eligible for state funding.
Highlights
The annual unduplicated headcount of students enrolled in continuing education courses at Del Mar College during the 2016-2017 year was 9,673.
Total annual enrollment in continuing education courses decreased 13 percent—from 28,927 to 25,152—while total annual continuing education contact hours decreased 29.4 percent, by 404,417 hours.
The GED program and Career and Community Education program were the largest programs, which accounted for 45.2 percent and 23.3 percent, respectively, of all continuing education contact hours generated in 2016-2017.
During the past year, 241 contracted and grant-funded continuing education courses were taught, generating a total of 197,425 contact hours.
The average class size for all continuing education programs in 2016-2017 was 14.1 students.
Continuing education students’ average age for Fall 2016 was 29, significantly higher than the general College average age of 23.
Annual Unduplicated Headcount for Continuing Education Courses
Del Mar College Statistical Profile 2017/18 143

Chapter Summary Enrollment
An average of 446 continuing education courses were organized each quarter during 2016-2017, with an average of 6,288 quarterly enrollments. The average class size for continuing education classes was 14.1 in 2016-2017.
Enrollment in the Small Business Development program increased the most of any program, except Professional Development, by 258.8 percent from 2015-2016 and by 1410.5 percent from 2014-2015. The Transportation Services program enrollment increased by nearly two-thirds (61.7%) while maintaining an unchanged average class size of 4.1 in 2016-2017, the smallest overall in non-credit programs. Classes that were funded by grants from the TWC suffered the largest decrease as the grants associated with the program ended, changing from an average 49 students per class in 2015-2016 to 26.4 students in 2016-2017. After a 321.1 percent increase in enrollment in courses offered in the Small Business Development Center in 2015-2016, enrollment increased by 64.6 percent in 2016-2017.
2016-2017 was the sixth year that Professional Development for Del Mar College employees was offered as a continuing education course and 1,662 employees took 29 classes during the year. Enrollment in DMC Professional Development experienced the largest shift in contact hours, increasing by 866.3 percent from 2015-2016 and 511 percent from 2014-2015, reversing its overall decrease from the previous year.
In 2016-2017, a total of 241 contracted and TWC Grant-Funded classes were taught for 18 companies. Total annual enrollment in contracted and grant-funded courses for 2016-2017 was 4,386, a 22.3 percent decrease from 2015-2016.
Overall, total annual enrollment in continuing education courses decreased by 13.1 percent in 2016-2017 compared to the prior academic year.
.
Contact Hours
Total annual continuing education contact hours in 2016-2017 decreased by 29.4 percent from the previous academic year. Annual funded continuing education contact hours decreased by 28.3 percent and non-funded contact hours decreased by 54.7 percent from 2015-2016 to 2016-2017.
While the GED program was the largest program (438,395 hours) and accounted for 45.2 percent of all continuing education contact hours generated in 2016-2017, it also decreased by 9.2 percent from 2015-2016. After the Career and Community Education program rebounded in the previous year, the program suffered a 41.9 percent reduction from last year.
There were few increases in program hours in this reporting term, the largest percentage gain came from the Small Business Development Program, but it represented less than one half percent of the total.
Student Profile
The annual unduplicated headcount of students enrolled in continuing education courses at Del Mar College during the 2016-2017 year was 9,673, a 7.2 percent Decrease from 10,420 students in 2015-2016.
In the first quarter of 2016, over three-quarters (76%) of continuing education students were members of racial and ethnic minorities, while only 43.2 percent of the total headcount were female.
Continuing education students’ average age for Fall 2016 was 29, significantly higher than the general College average age of 23 but much lower than the previous year’s average of 34. One in ten continuing education students (10.3%) were identified as academically disadvantaged.
144 Del Mar College Statistical Profile 2017/18

Average Class Size for Continuing Education Programs
2014-15 2015-16 2016-17
Number Number Average Number Number Average Number Number Averageof Classes Enrolled Size of Classes Enrolled Size of Classes Enrolled Size
Career and Community Education*1st Quarter 141 1,855 13.2 219 1,761 8.0 183 1,349 7.42nd Quarter 182 2,060 11.3 218 2,604 11.9 148 1,049 7.13rd Quarter 143 1,784 12.5 119 1,627 13.7 99 975 9.84th Quarter 168 2,740 16.3 250 2,645 10.6 130 1,127 8.7______ ______ ______ ______ ______ ______ ______ ______ ______
634 8,439 13.3 806 8,637 10.7 560 4,500 8.0
Corporate Services 1st Quarter 59 810 13.7 40 544 13.6 28 327 11.72nd Quarter 79 894 11.3 27 363 13.4 42 490 11.73rd Quarter 121 1,373 11.3 28 332 11.9 39 507 13.04th Quarter 112 1,209 10.8 16 216 13.5 27 288 10.7______ ______ ______ ______ ______ ______ ______ ______ ______
371 4,286 11.6 111 1,455 13.1 136 1,612 11.9
Del Mar College ̶ Professional Development
1st Quarter 1 9 9.0 0 0 0.0 4 35 8.82nd Quarter 2 22 11.0 1 8 8.0 7 233 33.33rd Quarter 3 120 40.0 5 110 22.0 4 75 18.84th Quarter 7 121 17.3 1 54 54.0 14 1,319 94.2______ ______ ______ ______ ______ ______ ______ ______ ______
13 272 20.9 7 172 24.6 29 1,662 57.3
GED1st Quarter 83 1,950 23.5 163 3,155 19.4 153 3,312 21.62nd Quarter 100 2,120 21.2 165 3,488 21.1 150 3,098 20.73rd Quarter 122 2,623 21.5 172 3,418 19.9 173 3,032 17.54th Quarter 84 1,604 19.1 146 2,551 17.5 126 2,387 18.9______ ______ ______ ______ ______ ______ ______ ______ ______
389 8,297 21.3 646 12,612 19.5 602 11,829 19.6
Health Care Services1st Quarter 21 202 9.6 26 291 11.2 33 339 10.32nd Quarter 5 82 16.4 31 381 12.3 37 349 9.43rd Quarter 5 66 13.2 28 279 10.0 40 373 9.34th Quarter 0 0 32 359 36 393 10.9______ ______ ______ ______ ______ ______ ______ ______ ______
31 350 11.3 117 1,310 11.2 146 1,454 10.0
Public Safety Education1st Quarter 3 25 8.3 3 31 10.3 4 38 9.52nd Quarter 10 89 8.9 3 67 22.3 6 96 16.03rd Quarter 10 135 13.5 2 36 18.0 4 54 13.54th Quarter 4 89 22.3 6 84 14.0 9 162 18.0______ ______ ______ ______ ______ ______ ______ ______ ______
27 338 12.5 14 218 15.6 23 350 15.2
Small Business Development Center1st Quarter 0 0 0 0 0.0 0 0 0.02nd Quarter 0 0 0 0 0.0 1 6 6.03rd Quarter 1 19 19.0 1 18 18.0 15 273 18.24th Quarter 0 0 3 62 20.7 1 8 8.0______ ______ ______ ______ ______ ______ ______ ______ ______
1 19 19.0 4 80 20.0 17 287 16.9
Del Mar College Statistical Profile 2017/18 145

Average Class Size for Continuing Education Programs
2014-15 2015-16 2016-17
Number Number Average Number Number Average Number Number Averageof Classes Enrolled Size of Classes Enrolled Size of Classes Enrolled Size
Transportation Services1st Quarter 35 138 3.9 24 118 4.9 70 278 4.02nd Quarter 28 138 4.9 16 100 6.3 28 116 4.13rd Quarter 35 138 3.9 32 124 3.9 25 131 5.24th Quarter 33 120 3.6 31 81 2.6 43 159 3.7______ ______ ______ ______ ______ ______ ______ ______ ______
131 534 4.1 103 423 4.1 166 684 4.1
TWC Grant Funded**1st Quarter 23 2,111 91.8 21 776 37.02nd Quarter 22 669 30.4 25 866 34.63rd Quarter 17 608 35.8 24 351 14.64th Quarter 20 632 31.6 35 781 22.3______ ______ ______ ______ ______ ______ ______ ______ ______
82 4,020 49.0 105 2,774 26.4
Average Class Size for All Continuing Education Programs1st Quarter 343 4,989 14.5 498 8,011 16.1 496 6,454 13.02nd Quarter 406 5,405 13.3 483 7,680 15.9 444 6,303 14.23rd Quarter 440 6,258 14.2 404 6,552 16.2 423 5,771 13.64th Quarter 408 5,883 14.4 505 6,684 13.2 421 6,624 15.7______ ______ ______ ______ ______ ______ ______ ______ ______
1,597 22,535 14.1 1,890 28,927 15.3 1,784 25,152 14.1
*During 2013-2014 the Workforce and Personal Enrichment program changed to Career and Community Education.*** Corporate Services was split into two offices, creating the TWC Grant Funded category in 2015-2016
0 5 10 15 20 25 30 35 40 45 50 55
Transportation Services
Small Business Development Center
Public Safety Education
Health Care Services
GED
DMC-Professional Development
Corporate Services
Career and Community Education
TWC Grant Funded
Average Class Size for Continuing Education Programs
2016-17
2015-16
2014-15
146 Del Mar College Statistical Profile 2017/18

Continuing Education Contact Hours by Program and Quarter
1 Yr %2008-09 2009-10 2010-11 2011-12 2012-13 2013-14 2014-15 2015-16 2016-17 Change
Alternative Certification for Teachers1st Quarter 872 2nd Quarter 1,4123rd Quarter 3964th Quarter 400
3,080
Career and Community Education 1
1st Quarter 16,765 12,857 77,643 71,202 73,544 135,019 109,694.5 122,169 80,104 -34.4%2nd Quarter 13,438 10,866 63,597 72,199 82,135 110,248 120,301 126,788 74,785 -41.0%3rd Quarter 8,765 34,846 18,121 22,756 36,077 58,670 71,729.3 56,043 48,465 -13.5%4th Quarter 22,763 29,000 39,495 41,972 40,478 59,125 61,315.5 84,158 22,758 -73.0%
61,731 87,569 198,856 208,128 232,234 363,061 363,040 389,158 226,112 -41.9%
Corporate Services 2, 3
1st Quarter 18,381 10,481 27,110 6,917 31,079 32,988 39,983 37,908 4,248 -88.8%2nd Quarter 37,688 30,162 29,051 5,766 6,113 4,672 15,870 3,776 7,732 104.8%3rd Quarter 7,419 2,325 10,064 9,094 7,712 7,187 17,760 6,704 7,855 17.2%4th Quarter 9,960 4,834 11,995 8,000 6,088 6,916 44,316 4,160 4,386 5.4%
73,448 47,802 78,220 29,777 50,992 51,763 117,929 52,548 24,221 -53.9%
Del Mar College ̶ Professional Development1st Quarter 0 326 66 45 0 3822nd Quarter 268 0 0 44 12 1,354 11183.3%3rd Quarter 112 496 694 733 370 936 153.3%4th Quarter 658 376 132 526.5 432.0 4,504 942.6%
1,038 1,198 892 1,349 814 7,176 782.1%
GED 1st Quarter 26,350 64,263 57,895 70,259 69,587 69,303 81,345 132,443 131,985 -0.3%2nd Quarter 25,244 51,391 50,292 60,210 60,662 46,416 67,926 117,898 96,606 -18.1%3rd Quarter 35,056 57,965 60,102 67,739 67,408 51,315 105,913 148,944 120,374 -19.2%4th Quarter 21,507 37,834 53,385 46,787 32,705 28,398 70,584 83,477 89,430 7.1%
108,157 211,453 221,674 244,995 230,362 195,432 325,768 482,762 438,395 -9.2%
Health Care Services1st Quarter 9,548 11,511 11,776 12,428 7,689 6,122 9,470 17,365 14,693 -15.4%2nd Quarter 8,694 6,079 6,260 4,528 5,465 5,789 1,640 19,446 22,174 14.0%3rd Quarter 7,092 8,152 7,189 7,994 6,528 7,949 1,880 12,818 15,082 17.7%4th Quarter 10,963 11,426 12,619 8,977 8,832 7,267 0 21,249 15,362 -27.7%
36,297 37,168 37,844 33,927 28,514 27,127 12,990 70,878 67,311 -5.0%
Public Safety Education4
1st Quarter 4,445 8,272 2,072 1,200 3,128 1,216 1,560 1,880 660 -64.9%2nd Quarter 8,032 1,812 2,180 2,576 2,320 6,060 1,252 348 2,056 490.8%3rd Quarter 4,540 4,272 3,600 5,284 2,564 1,036 3,024 484 404 -16.5%4th Quarter 4,993 4,920 1,468 3,452 3,636 1,168 1,792 2,784 4,044 45.3%
22,010 19,276 9,320 12,512 11,648 9,480 7,628 5,496 7,164 30.3%
Del Mar College Statistical Profile 2017/18 147

Continuing Education Contact Hours by Program and Quarter
1 Yr %2008-09 2009-10 2010-11 2011-12 2012-13 2013-14 2014-15 2015-16 2016-17 Change
Small Business Development Center1st Quarter 350 384 769 0 0 270 0 0 02nd Quarter 562 478 154 152 0 324 0 0 1443rd Quarter 598 410 200 468 576 0 456 432 2,074 380.1%4th Quarter 448 369 914 595 0 0 0 1,032 192 -81.4%
1,958 1,641 2,037 1,215 576 594 456 1,464 2,410 64.6%
Transportation Services1st Quarter 5,530 3,540 10,696 9,324 7,288 11,908 10,600 7,786 5,950 -23.6%
2nd Quarter 4,420 4,000 9,920 10,600 7,970 13,085 9,154 8,210 3,345 -59.3%
3rd Quarter 3,880 5,440 8,792 14,325 6,289 12,589 9,121 8,266 9,175 11.0%
4th Quarter 4,100 7,520 7,400 8,863 8,566 11,538 9,035 5,010 6,099 21.7%
17,930 20,500 36,808 43,112 30,113 49,120 37,910 29,272 24,569 -16.1%
TWC Grant Funded1st Quarter 194,616 33,968 -82.5%2nd Quarter 55,585 83,657 50.5%3rd Quarter 51,840 29,032 -44.0%4th Quarter 40,547 26,547 -34.5%
342,588 173,204 -49.4%
Total All Continuing Education Programs1st Quarter 82,241 111,308 187,961 171,330 192,641 256,892 252,698 514,167 271,990 -47.1%2nd Quarter 99,490 104,788 161,454 156,299 164,665 186,594 216,187 332,063 291,853 -12.1%3rd Quarter 67,746 113,410 108,068 127,772 127,650 139,440 210,616 285,901 233,397 -18.4%4th Quarter 75,134 95,903 127,276 119,304 100,681 114,544 187,569 242,849 173,322 -28.6%
324,611 425,409 584,759 574,704 585,637 697,469 867,070 1,374,979 970,562 -29.4%
Note 1: The CCE program, formerly Workforce and Personal Enrichment, includes Business Technology, Youth Sports, and Kids Camp courses.Note 2: The Corporate Services program includes High School Regional Technical Center and Texas Workforce Commission courses. Note 3: The High School Regional Technical Center is usually reported in the 3rd Quarter for courses that run from September through May.Note 4: The Public Safety program includes Emergency Medical Services and Law Enforcement courses.
0 30 60 90 120 150 180 210 240 270 300 330 360 390 420 450 480 510
TWC Grant Funded
Transportation Services
Small Business Development Center
Public Safety Education
Health Care Services
GED
DMC-Professional Development
Corporate Services
Career and Community Education
Thousands
Annual Contact Hours for Continuing Education Programs
2014-15
2015-16
2016-17
148 Del Mar College Statistical Profile 2017/18

Annual Continuing Education Contact Hours by Funding Source and Program
2009-10 2010-11 2011-12 2012-13 2013-14 2014-15 2015-16 2016-171-yr %
Change
State-FundedCareer and Community Education** 78,768 184,829 197,551 223,086 344,501 336,100 363,990 208,866 -42.6%Corporate Services 19,795 32,654 29,401 26,242 24,311 87,175 22,056 23,929 8.5%Health Care Services 37,168 37,844 33,903 28,490 27,127 12,970 70,876 67,215 -5.2%Public Safety Education 19,236 8,808 12,088 10,652 8,596 6,820 5,100 6,764 32.6%Small Business Dev Center 1,908 1,200 432 594 456 1,464 1,931 31.9%Transportation Training Services 20,500 36,808 42,920 29,900 48,836 37,672 29,104 24,428 -16.1%
TWC-FundedGED 211,453 221,674 244,995 230,362 195,432 325,768 482,762 438,395 -9.2%TWC Grant Funded 342,588 173,204_______ _______ _______ _______ _______ _______ _______ _______ _______
Total Funded 386,920 524,525 562,058 549,164 649,397 806,961 1,317,940 944,732 -28.3%
Non-FundedCareer and Community Education** 8,801 14,027 10,577 9,148 18,560 26,941 25,168 17,246 -31.5%Corporate Services 28,007 45,566 376 24,750 27,452 30,754 30,492 292 -99.0%Del Mar College ̶ Professional Dev 1,038 1,198 892 1,349 814 7,176 782.1%
Health Care Services 24 24 0 20 2 96 4700.0%Public Safety Education 40 512 424 996 884 808 396 400 1.0%Small Business Dev Center 1,641 129 15 144 0 0 0 479 0.0%Transportation Training Services 192 213 284 238 168 141 -16.1%_______ _______ _______ _______ _______ _______ _______ _______ _______
Total Non-Funded 38,489 60,234 12,646 36,473 48,072 60,110 57,040 25,830 -54.7%
Grand Total 425,409 584,759 574,704 585,637 697,469 867,071 1,374,979 970,562 -29.4%
H.S. Regional Technical Center was combined with Corporate Services and activity has been provided by the college for a number of years, but 2006-2007 is the first year this activity has been reportable.**During 2013-2014 the Workforce and Personal Enrichment program changed to Career and Community Education.*** Corporate Services was split into two offices, creating the TWC Grant Funded category in 2015-2016
0
200,000
400,000
600,000
800,000
1,000,000
1,200,000
1,400,000
2009-10 2010-11 2011-12 2012-13 2013-14 2014-15 2015-16 2016-17
Continuing Education Annual Contact Hour Totals
Non-Funded TWC-Funded State-Funded
Del Mar College Statistical Profile 2017/18 149

Profile Of Students Enrolled in Funded Continuing Education Courses
1st Qtr 2016 2nd Qtr 2017 3rd Qtr 2017 4th Qtr 2017 1st Qtr 2017
Number Percent Number Percent Number Percent Number Percent Number Percent
Total Headcount 1,754 1,536 1,515 1,085 1,339
GenderMale 1,197 68.2% 1,109 72.2% 1,052 69.4% 674 62.1% 760 56.8%Female 557 31.8% 427 27.8% 463 30.6% 411 37.9% 579 43.2%
Ethnicity/RaceHispanic 1,100 62.7% 1,030 67.1% 977 64.5% 723 66.6% 962 71.8%White, non-Hispanic 346 19.7% 303 19.7% 351 23.2% 220 20.3% 255 19.0%Black, non-Hispanic 92 5.2% 53 3.5% 55 3.6% 70 6.5% 38 2.8%Asian/Pacific Islander 17 1.0% 11 0.7% 11 0.7% 7 0.6% 14 1.0%Indian/Alaskan Native 4 0.2% 6 0.4% 6 0.4% 2 0.2% 4 0.3%International 49 2.8% 29 1.9% 15 1.0% 25 2.3% 18 1.3%Unknown/Not Reported 146 8.3% 104 6.8% 100 6.6% 38 3.5% 48 3.6%
Age GroupUnder 17 0 0.0% 0 0.0% 0 0.0% 0 0.0% 240 17.9%17 34 1.9% 84 5.5% 0 0.0% 0 0.0% 199 14.9%18 69 3.9% 51 3.3% 84 5.5% 15 1.4% 77 5.8%19-21 109 6.2% 115 7.5% 138 9.1% 72 6.6% 93 6.9%22-24 132 7.5% 125 8.1% 101 6.7% 86 7.9% 76 5.7%25-30 316 18.0% 253 16.5% 226 14.9% 200 18.4% 148 11.1%31-35 224 12.8% 176 11.5% 212 14.0% 161 14.8% 118 8.8%36-50 539 30.7% 445 29.0% 475 31.4% 358 33.0% 234 17.5%51-64 273 15.6% 237 15.4% 247 16.3% 171 15.8% 132 9.9%65+ 58 3.3% 50 3.3% 32 2.1% 22 2.0% 21 1.6%Unknown/Not Reported 0 0.0% 0 0.0% 0 0.0% 0 0.0% 1 0.1%
Average Age 37 39 37 38 29
Special PopulationsAcademic Disadvantaged 203 11.6% 160 10.4% 190 12.5% 166 15.3% 138 10.3%Economic Disadvantaged 21 1.2% 14 0.9% 14 0.9% 25 2.3% 16 1.2%Disabled 23 1.3% 15 1.0% 17 1.1% 13 1.2% 18 1.3%Displaced Homemaker 0 0.0% 0 0.0% 0 0.0% 0 0.0% 0 0.0%Limited English 0 0.0% 0 0.0% 0 0.0% 0 0.0% 0 0.0%Single Parent 10 0.6% 9 0.6% 10 0.7% 19 1.8% 10 0.7%
Note: The information in this table is the data as certified to the Coordinating Board on the CBM00A report each quarter.
150 Del Mar College Statistical Profile 2017/18
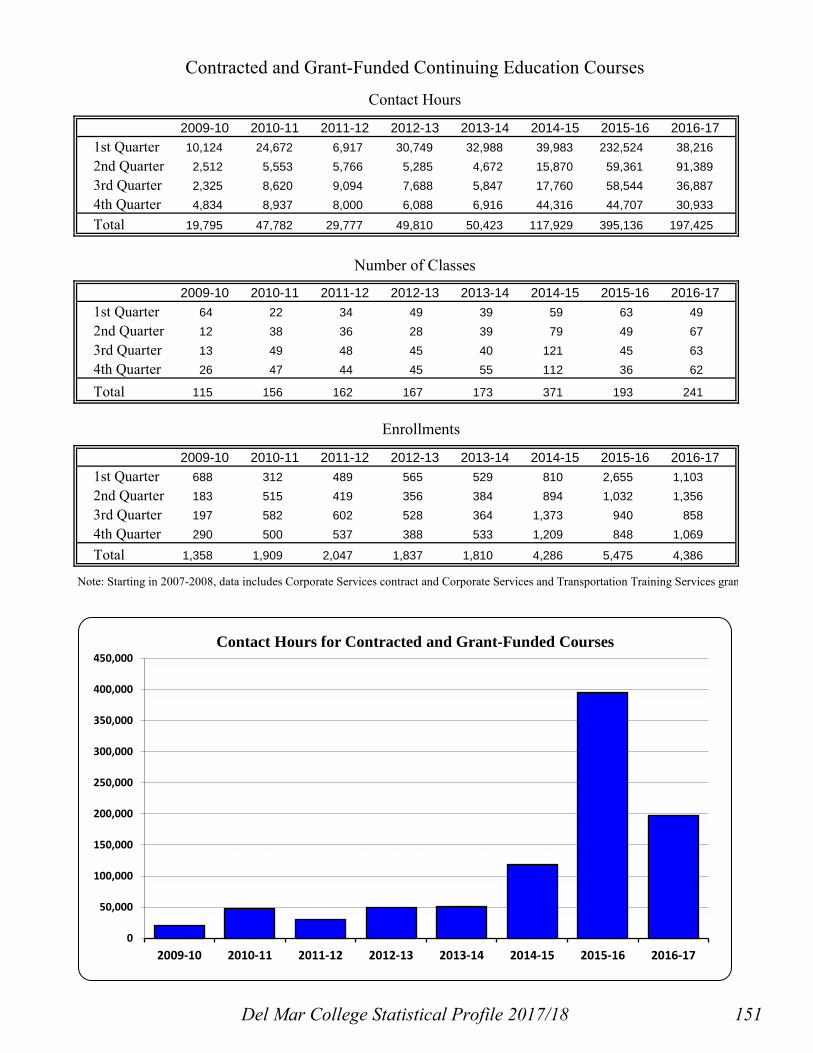
Contracted and Grant-Funded Continuing Education Courses
Contact Hours
2009-10 2010-11 2011-12 2012-13 2013-14 2014-15 2015-16 2016-171st Quarter 10,124 24,672 6,917 30,749 32,988 39,983 232,524 38,2162nd Quarter 2,512 5,553 5,766 5,285 4,672 15,870 59,361 91,3893rd Quarter 2,325 8,620 9,094 7,688 5,847 17,760 58,544 36,8874th Quarter 4,834 8,937 8,000 6,088 6,916 44,316 44,707 30,933
Total 19,795 47,782 29,777 49,810 50,423 117,929 395,136 197,425
Number of Classes
2009-10 2010-11 2011-12 2012-13 2013-14 2014-15 2015-16 2016-171st Quarter 64 22 34 49 39 59 63 492nd Quarter 12 38 36 28 39 79 49 673rd Quarter 13 49 48 45 40 121 45 634th Quarter 26 47 44 45 55 112 36 62
Total 115 156 162 167 173 371 193 241
Enrollments
2009-10 2010-11 2011-12 2012-13 2013-14 2014-15 2015-16 2016-171st Quarter 688 312 489 565 529 810 2,655 1,1032nd Quarter 183 515 419 356 384 894 1,032 1,3563rd Quarter 197 582 602 528 364 1,373 940 8584th Quarter 290 500 537 388 533 1,209 848 1,069
Total 1,358 1,909 2,047 1,837 1,810 4,286 5,475 4,386
Note: Starting in 2007-2008, data includes Corporate Services contract and Corporate Services and Transportation Training Services gran
0
50,000
100,000
150,000
200,000
250,000
300,000
350,000
400,000
450,000
2009-10 2010-11 2011-12 2012-13 2013-14 2014-15 2015-16 2016-17
Contact Hours for Contracted and Grant-Funded Courses
Del Mar College Statistical Profile 2017/18 151
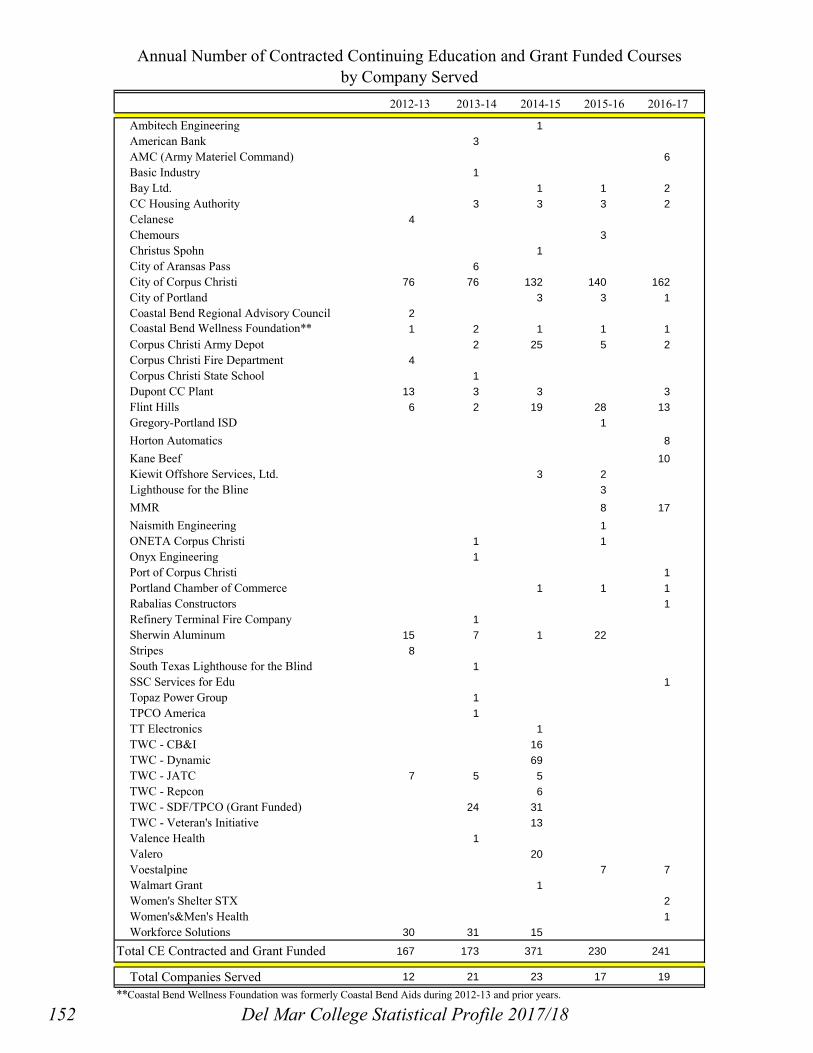
2012-13 2013-14 2014-15 2015-16 2016-17
Ambitech Engineering 1American Bank 3AMC (Army Materiel Command) 6Basic Industry 1Bay Ltd. 1 1 2CC Housing Authority 3 3 3 2Celanese 4Chemours 3Christus Spohn 1City of Aransas Pass 6City of Corpus Christi 76 76 132 140 162City of Portland 3 3 1Coastal Bend Regional Advisory Council 2Coastal Bend Wellness Foundation** 1 2 1 1 1Corpus Christi Army Depot 2 25 5 2Corpus Christi Fire Department 4Corpus Christi State School 1Dupont CC Plant 13 3 3 3Flint Hills 6 2 19 28 13Gregory-Portland ISD 1Horton Automatics 8Kane Beef 10Kiewit Offshore Services, Ltd. 3 2Lighthouse for the Bline 3MMR 8 17Naismith Engineering 1ONETA Corpus Christi 1 1Onyx Engineering 1Port of Corpus Christi 1Portland Chamber of Commerce 1 1 1Rabalias Constructors 1Refinery Terminal Fire Company 1Sherwin Aluminum 15 7 1 22Stripes 8South Texas Lighthouse for the Blind 1SSC Services for Edu 1Topaz Power Group 1TPCO America 1TT Electronics 1TWC - CB&I 16TWC - Dynamic 69TWC - JATC 7 5 5TWC - Repcon 6TWC - SDF/TPCO (Grant Funded) 24 31TWC - Veteran's Initiative 13Valence Health 1Valero 20Voestalpine 7 7Walmart Grant 1Women's Shelter STX 2Women's&Men's Health 1Workforce Solutions 30 31 15
167 173 371 230 241
Total Companies Served 12 21 23 17 19**Coastal Bend Wellness Foundation was formerly Coastal Bend Aids during 2012-13 and prior years.
Total CE Contracted and Grant Funded
Annual Number of Contracted Continuing Education and Grant Funded Coursesby Company Served
152 Del Mar College Statistical Profile 2017/18

Del Mar College Statistical Profile
Faculty and Staff Terms and Definitions
Exempt
Exempt personnel include non-faculty employees in administrative and professional positions having duties and responsibilities which involve administration and supervision in the management and direction of a division or department, and such other positions as are approved by the President and which meet the FLSA standards for exemption from overtime.
Non-Exempt
Personnel in positions which have been graded within the College's classification system and which do not meet the FLSA standards for exemption from overtime.
Externally-Funded
Non-budgeted positions funded by a specific grant for a specified amount of time.
Rank/Tenure
Ranked faculty are tenure-track full-time regular teachers, counselors, or librarians who hold a continuing budgeted position within a department as Instructor, Assistant Professor, Associate Professor, or Professor. Ranked faculty are eligible for tenure and promotion upon fulfillment of the appropriate requirements. Term faculty, assistant instructors, teaching fellows, and part-time (adjunct) faculty are not tenure-track and not eligible for promotion in rank.
Highlights
In Fall 2017, Del Mar College employed 698 persons in regular and externally-funded, half-time-or-greater positions, and 831 part-time faculty and staff.
A total of 539 (316 full-time instructional and 223 part-time adjunct) faculty taught credit courses during the Fall 2017 semester.
A total of 167 part-time instructional staff taught continuing education (non-credit) courses in Fall 2017.
Seventy-six percent of Del Mar College tenure-track faculty members are tenured.
Fifty-seven percent of tenure-track faculty hold a master’s degree, and 25 percent have a doctoral degree.
The average nine-month tenured/tenure-track faculty salary for 2017-2018 is $69,237.
Over half of the College’s total full-time (58%) and part-time (51%) employees are female.
Nearly one-half of all Del Mar College full-time (47%) and part-time (53%) employees are members of historically underrepresented minorities.
Del Mar College Statistical Profile 2017/18 153

Chapter Summary Full time Faculty
Del Mar College had 317 instructional faculty and six non-instructional library staff with faculty status in the fall of 2017. The total number of tenure-track faculty was 260. In addition, the College has 46 faculty members on a non-tenure-track term appointment and 17 assistant instructors.
Eighty-two percent of the tenured and tenure-track faculty hold a master’s degree or higher with 25 percent holding doctoral degrees; 76 percent are tenured. The average age of tenured and tenure-track faculty is 54 years and the average length of service is 16 years.
The proportion and number of tenured and tenure-track faculty who hold the rank of professor is 37 percent, with 95 professors. They have taught at the College for an average of 25 years.
The College-wide average nine-month contract tenured/tenure-track faculty salary for 2017-2018 is $69,237, an increase of 1.4 percent from 2016-2017. The average nine-month contract salary for a professor is $81,952 (+2.0%) and $52,830 (+1.3%) for an instructor.
Adjunct Faculty
Unduplicated headcount of adjunct faculty teaching credit courses in the fall of 2017 totaled 223 and represented 18.0 percent of the full-time equivalent (FTE) teaching staff. Departments with a relatively high number of adjunct faculty in the fall of 2017 were Mathematics (29.5%) and English and Philosophy (27.1%). Kinesiology (0.0%), Industrial Education (2.4%), and Computer Sciences, Engineering and Advanced Technology (7.0%) departments had the lowest part-time percent of FTE
Employee Demographics
Almost half of full-time faculty (49%) and adjunct faculty (52%) are female, compared to 54 percent College-wide. Over two-thirds of externally-funded employees (85%) and non-exempt employees (69%), 58 percent of exempt employees, and 50 percent of part-time employees are female.
The minority representation among full-time faculty is 33 percent and among adjunct faculty is 42 percent. The minority representation among exempt employees is 51 percent, non-exempt employees is 69 percent, externally-funded employees is 59 percent, part-time employees is 63 percent, and College-wide is 50 percent.
154 Del Mar College Statistical Profile 2017/18

Percent Percent Percent Percent PercentCount Tenured Count Tenured Count Tenured Count Tenured Count Tenured
Arts and Sciences Professor 46 100% 48 100% 56 100% 62 100% 65 100% Associate Professor 35 100% 39 79% 34 97% 30 97% 32 97% Assistant Professor 37 46% 31 52% 26 46% 26 46% 21 48% Instructor 7 0% 13 0% 11 0% 12 0% 11 0% Term appointment 8 n/a 0 n/a 11 n/a 15 n/a 17 n/a Assistant Instructor 12 n/a 15 n/a 13 n/a 11 n/a 12 n/a____ ____ ____ ____ ____
145 146 151 156 158
Business, Industrial and Public Safety Education* Professor 14 100% 10 100% 10 100% 13 100% 11 100% Associate Professor 9 100% 12 100% 12 100% 8 100% 13 100% Assistant Professor 13 92% 14 64% 14 86% 16 88% 9 100% Instructor 14 0% 10 0% 10 0% 9 0% 16 0% Term appointment 4 n/a 10 n/a 17 n/a 18 n/a 23 n/a Assistant Instructor 0 n/a 0 n/a 2 n/a 2 n/a 2 n/a____ ____ ____ ____ ____
54 56 65 66 74
Health Sciences and Professional Education* Professor 18 100% 12 100% 15 100% 19 100% 17 100% Associate Professor 17 100% 19 95% 20 95% 19 95% 21 95% Assistant Professor 26 88% 24 83% 20 95% 22 95% 20 90% Instructor 15 0% 18 0% 19 0% 16 0% 19 0% Term appointment 1 n/a 4 n/a 5 n/a 9 n/a 5 n/a Fellow 0 n/a 0 n/a 1 n/a 1 n/a 0 n/a Assistant Instructor 3 n/a 3 n/a 3 n/a 5 n/a 3 n/a____ ____ ____ ____ ____
80 80 83 91 85
Library and Counseling Professor 2 100% 2 100% 2 100% 2 100% 2 100% Associate Professor 1 100% 0 0% 1 100% 1 100% 1 100% Assistant Professor 2 100% 2 100% 1 100% 1 100% 1 100% Instructor 1 0% 0 0% 0 0% 1 0% 1 0% Term appointment 0 n/a 2 n/a 2 n/a 1 n/a 1 n/a____ ____ ____ ____ ____
6 6 6 6 6
Total College Professor 80 100% 72 100% 83 100% 96 100% 95 100% Associate Professor 62 100% 70 87% 67 97% 58 97% 67 97% Assistant Professor 78 69% 71 66% 61 72% 65 74% 51 75% Instructor 37 0% 41 0% 40 0% 38 0% 47 0%____ ____ ____ ____ ____Total Tenure-Track 257 77% 254 71% 251 76% 257 78% 260 76% Term appointment 13 n/a 16 n/a 35 n/a 43 n/a 46 n/a Fellow 0 n/a 0 n/a 1 n/a 1 n/a 0 n/a Assistant Instructor 15 n/a 18 n/a 18 n/a 18 n/a 17 n/a____ ____ ____ ____ ____
Total Non-Tenure-Track 28 34 54 62 63
Grand Total 285 288 305 319 323
* Prior to Fall 2015 was part of Business, Professional and Technology Education Division
Faculty by Division and RankFall 2013 Fall 2014 Fall 2015 Fall 2016 Fall 2017
Del Mar College Statistical Profile 2017/18 155

0
50
100
150
200
250
300
2008 2009 2010 2011 2012 2013 2014 2015 2016 2017
Tenured/Tenure-Track Faculty by Rank Fall 2008 - Fall 2017
Instructor
Assistant Professor
Associate Professor
Professor
Doctorate24.6%
Master's56.9%
Bachelor's7.7%
Associate's10.8%
Highest Degree Earned for Tenured/Tenure-Track FacultyFall 2017
156 Del Mar College Statistical Profile 2017/18
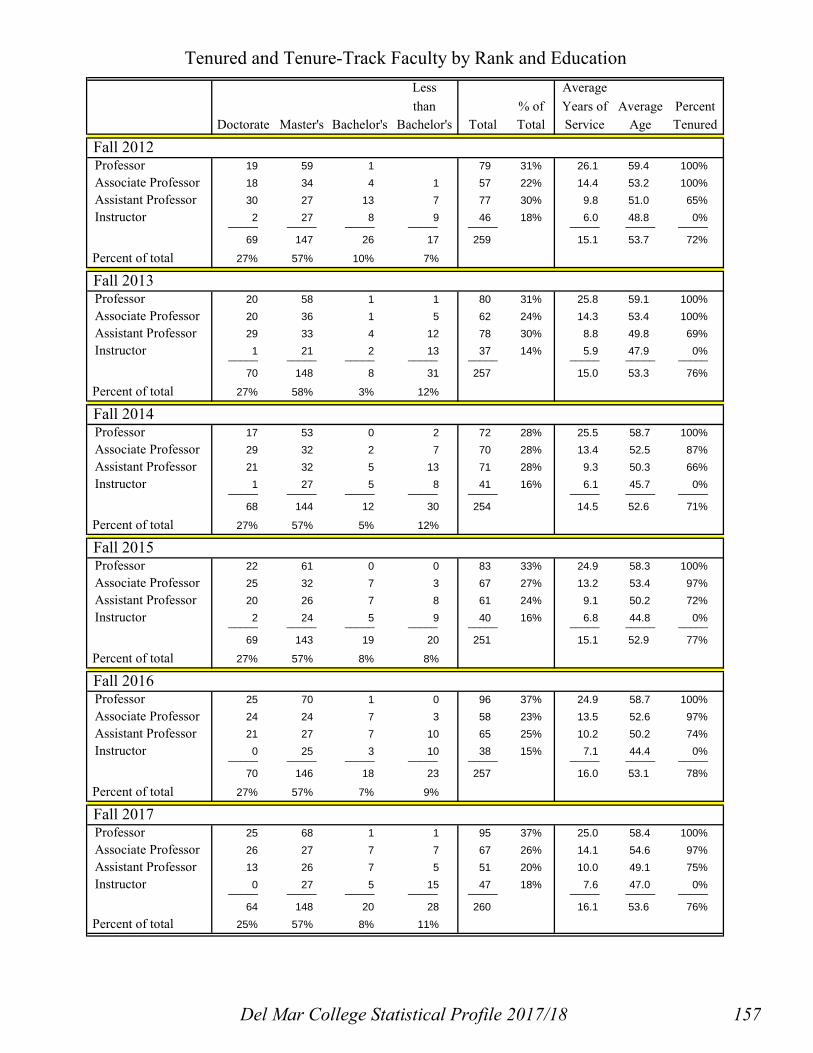
Less Averagethan % of Years of Average Percent
Doctorate Master's Bachelor's Bachelor's Total Total Service Age Tenured
Fall 2012Professor 19 59 1 79 31% 26.1 59.4 100%Associate Professor 18 34 4 1 57 22% 14.4 53.2 100%Assistant Professor 30 27 13 7 77 30% 9.8 51.0 65%Instructor 2 27 8 9 46 18% 6.0 48.8 0%_____ _____ _____ _____ _____ _____ _____ _____
69 147 26 17 259 15.1 53.7 72%
Percent of total 27% 57% 10% 7%
Fall 2013Professor 20 58 1 1 80 31% 25.8 59.1 100%Associate Professor 20 36 1 5 62 24% 14.3 53.4 100%Assistant Professor 29 33 4 12 78 30% 8.8 49.8 69%Instructor 1 21 2 13 37 14% 5.9 47.9 0%_____ _____ _____ _____ _____ _____ _____ _____
70 148 8 31 257 15.0 53.3 76%
Percent of total 27% 58% 3% 12%
Fall 2014Professor 17 53 0 2 72 28% 25.5 58.7 100%Associate Professor 29 32 2 7 70 28% 13.4 52.5 87%Assistant Professor 21 32 5 13 71 28% 9.3 50.3 66%Instructor 1 27 5 8 41 16% 6.1 45.7 0%_____ _____ _____ _____ _____ _____ _____ _____
68 144 12 30 254 14.5 52.6 71%
Percent of total 27% 57% 5% 12%
Fall 2015Professor 22 61 0 0 83 33% 24.9 58.3 100%Associate Professor 25 32 7 3 67 27% 13.2 53.4 97%Assistant Professor 20 26 7 8 61 24% 9.1 50.2 72%Instructor 2 24 5 9 40 16% 6.8 44.8 0%_____ _____ _____ _____ _____ _____ _____ _____
69 143 19 20 251 15.1 52.9 77%
Percent of total 27% 57% 8% 8%
Fall 2016Professor 25 70 1 0 96 37% 24.9 58.7 100%Associate Professor 24 24 7 3 58 23% 13.5 52.6 97%Assistant Professor 21 27 7 10 65 25% 10.2 50.2 74%Instructor 0 25 3 10 38 15% 7.1 44.4 0%_____ _____ _____ _____ _____ _____ _____ _____
70 146 18 23 257 16.0 53.1 78%
Percent of total 27% 57% 7% 9%
Fall 2017Professor 25 68 1 1 95 37% 25.0 58.4 100%Associate Professor 26 27 7 7 67 26% 14.1 54.6 97%Assistant Professor 13 26 7 5 51 20% 10.0 49.1 75%Instructor 0 27 5 15 47 18% 7.6 47.0 0%_____ _____ _____ _____ _____ _____ _____ _____
64 148 20 28 260 16.1 53.6 76% Percent of total 25% 57% 8% 11%
Tenured and Tenure-Track Faculty by Rank and Education
Del Mar College Statistical Profile 2017/18 157

Associate Assistant Term Assistant GrandProfessor Professor Professor Instructor Total Instructor Instructor Fellow Total Total
Fall 2011Male 50 33 33 23 139 4 4 0 8 147
Female 38 33 28 33 132 2 12 1 15 147____ ____ ____ ____ ____ ____ ____ ____ ____ _____
Total 88 66 61 56 271 6 16 1 23 294
% Female 43.2% 50.0% 45.9% 58.9% 48.7% 33.3% 75.0% 100.0% 65.2% 50.0%
Fall 2012Male 46 31 40 18 135 5 3 0 8 143
Female 33 26 37 28 124 6 13 0 19 143____ ____ ____ ____ ____ ____ ____ ____ ____ _____
Total 79 57 77 46 259 11 16 0 27 286
% Female 41.8% 45.6% 48.1% 60.9% 47.9% 54.5% 81.3% 70.4% 50.0%
Fall 2013Male 48 33 40 13 134 5 3 0 8 142
Female 32 29 38 24 123 8 12 0 20 143____ ____ ____ ____ ____ ____ ____ ____ ____ _____
Total 80 62 78 37 257 13 15 0 28 285
% Female 40.0% 46.8% 48.7% 64.9% 47.9% 61.5% 80.0% 71.4% 50.2%
Fall 2014Male 44 42 32 12 130 9 6 0 15 145
Female 28 28 39 29 124 7 12 0 19 143____ ____ ____ ____ ____ ____ ____ ____ ____ _____
Total 72 70 71 41 254 16 18 0 34 288
% Female 38.9% 40.0% 54.9% 70.7% 48.8% 43.8% 66.7% 55.9% 49.7%
Fall 2015Male 48 39 30 12 129 21 6 0 27 156
Female 35 28 31 28 122 14 12 1 27 149____ ____ ____ ____ ____ ____ ____ ____ ____ _____
Total 83 67 61 40 251 35 18 1 54 305
% Female 42.2% 41.8% 50.8% 70.0% 48.6% 40.0% 66.7% 100.0% 50.0% 48.9%
Fall 2016Male 54 34 30 13 131 25 7 0 32 163
Female 42 24 35 25 126 18 11 1 30 156____ ____ ____ ____ ____ ____ ____ ____ ____ _____
Total 96 58 65 38 257 43 18 1 62 319
% Female 43.8% 41.4% 53.8% 65.8% 49.0% 41.9% 61.1% 100.0% 48.4% 48.9%
Fall 2017Male 54 38 21 19 132 26 7 0 33 165
Female 41 29 30 28 128 20 10 0 30 158____ ____ ____ ____ ____ ____ ____ ____ ____ _____
Total 95 67 51 47 260 46 17 0 63 323
% Female 43.2% 43.3% 58.8% 59.6% 49.2% 43.5% 58.8% #DIV/0! 47.6% 48.9%
Faculty by Rank and GenderNon-Tenure TrackTenured/Tenure-Track Faculty
158 Del Mar College Statistical Profile 2017/18

Faculty by Rank and Ethnicity/Race
Tenured/Tenure-Track Faculty Non-Tenure Track Grand Total
of Total
Percent Assoc Asst
Prof Prof Prof Instr Total Term Instr
Asst Instr Fellow Total
Fall 2013 Black, non-Hispanic Hispanic Other Unknown
White, non-Hispanic
Total % Minority
3 20 3
54 ___
80
32.5%
2 11 1
48 ___
62
22.6%
1 21 5
51 ___
78
34.6%
3 10 1
23 ___
37
37.8%
9 62 10 0
176 ____
257
31.5%
3
2 8 ___
13
23.1%
6
9 ___ ___
15 0
40.0%
0 9 0 2
17 ___
28
32.1%
9 71 10 2
193 ____
285
31.6%
3.2% 24.9% 3.5% 0.7%
67.7% _____
100.0%
Fall 2014 Black, non-Hispanic Hispanic Other Unknown
White, non-Hispanic
Total % Minority
3 18 3
48 ___
72
33.3%
2 13 5
50 ___
70
28.6%
1 21 2
47 ___
71
33.8%
3 9 2 1
26 ___
41
34.1%
9 61 12 1
171 ____
254
32.3%
9
7 ___
16
56.3%
6
12 ___ ___
18 0
33.3%
0 15 0 0
19 ___
34
44.1%
9 76 12 1
190 ____
288
33.7%
3.1% 26.4% 4.2%0.3%
66.0% _____
100.0%
Fall 2015 Black, non-Hispanic Hispanic Other Unknown White, non-Hispanic
Total % Minority
3 19 3
58 ___
83
30.1%
2 14 6
45 ___
67
32.8%
1 16 1 1
42 ___
61
29.5%
2 12 1 1
24 ___
40
37.5%
8 61 11 2
169 ____
251
31.9%
14 1 2
18 ___
35
42.9%
6
12 ___
18
33.3%
1
___
1
0.0%
0 20 1 3
30 ___
54
38.9%
8 81 12 5
199 ____
305
33.1%
2.6% 26.6% 3.9%1.6%
65.2% _____
100.0%
Fall 2016 Black, non-Hispanic Hispanic Other Unknown White, non-Hispanic
Total % Minority
4 21 3
68 ___
96
29.2%
1 14 6
37 ___
58
36.2%
2 16 2
45 ___
65
30.8%
1 14 1 1
21 ___
38
42.1%
8 65 12 1
171 ____
257
33.1%
16 2 2
23 ___
43
41.9%
6
12 ___
18
33.3%
1
___
1
100.0%
0 23 2 2
35 ___
62
40.3%
8 88 14 3
206 ____
319
34.5%
2.5% 27.6% 4.4%0.9%
64.6% _____
100.0%
Fall 2017 Black, non-Hispanic Hispanic Other Unknown
White, non-Hispanic
Total % Minority
4 22 4
65 ___
95
31.6%
1 15 5 1
45 ___
67
31.3%
2 12 1
36 ___
51
29.4%
1 15 2 1
28 ___
47
38.3%
8 64 12 2
174 ____
260
32.3%
14
3 29 ___
46
30.4%
6
11 ___
17
35.3%
___
0
#DIV/0!
0 20 0 3
40 ___
63
31.7%
8 84 12 5
214 ____
323
32.2%
2.5% 26.0% 3.7%1.5%
66.3% _____
100.0%
Del Mar College Statistical Profile 2017/18 159

Full-Time Total FTE Part-timeFaculty Assistant Overload Faculty FTE FTE Teaching Percent
Headcount Instr. FTE FTE Headcount Regular DC Staff of FTE
Division of Arts and SciencesArt 6 5.75 0.13 4 1.17 7.05Drama 4 1 5.17 1.11 1 0.56 6.84_____ _____ _____ _____ _____ _____ _____ _____Art and Drama 10 1 10.92 1.24 5 1.73 0.00 13.89 12.5%
Communications 2 2.00 0.77 2.77ESOL 1 0.33 0.27 1 0.60 1.20French 1 0.20 0.20Reading 3 1 4.27 0.97 4 1.73 6.97Spanish 1 1.00 3 0.20 0.60 1.80Speech 7 1 8.00 3.00 3 0.80 11.80Student Success 1 1.00 0.13 3 1.27 2.40_____ ______ _____ _____ _____ _____ _____ _____Communications, Languages, and Reading 15 2 16.60 5.14 15 4.80 0.60 27.14 19.9%
English 24 6 30.00 2.98 32 10.42 2.80 46.20Philosophy 2 2.40 0.20 2.60_____ _____ _____ _____ _____ _____ _____ _____
English and Philosophy 26 6 32.40 3.18 32 10.42 2.80 48.80 27.1%
Kinesiology 7 7.00 0.97 7.97 0.0%
Mathematics 19 6 24.27 8.47 33 12.90 0.80 46.44 29.5%
Humanities 2 1.57 0.28 1.85Music 14 15.57 1.28 8 0.83 0.40 18.08Sound Recording 1 1.00 0.27 1 0.43 1.70_____ _____ _____ _____ _____ _____ _____
Music 17 18.14 1.83 9 1.26 0.40 21.63 7.7%
Biology 10 10.00 3.50 9 3.34 1.33 18.17Biotechnology 1 1.00 0.11 1 0.39 1.50Chemistry 6 6.00 0.78 4 1.67 8.45Geology 3 3.00 0.56 3.56Physics 1 0.67 0.67_____ _____ _____ _____ _____ _____ _____
Natural Sciences 21 20.67 4.95 14 5.40 1.33 32.35 20.8%
Anthropology 1 0.20 0.20Geography 1 0.40 0.40History 10 10.00 2.20 5 2.00 0.80 15.00Military Science 1 0.27 0.27Political Science 9 9.00 1.70 3 1.60 12.30Psychology 6 6.00 1.00 8 2.60 0.20 9.80Social Work 1 0.60 0.60Sociology 2 2.00 0.80 3 1.60 4.40_____ _____ _____ _____ _____ _____ _____
Social Sciences 27 27.00 5.70 23 9.27 1.00 42.97 23.9%
Total Arts and Sciences 142 15 157.00 31.48 131 45.78 6.93 241.19 21.9%
* Hourly staff teaching self-paced labs are not included in count and FTE.
Fall 2017 Full-time Equivalent Teaching Staff by Department and DisciplineAdjunct
160 Del Mar College Statistical Profile 2017/18
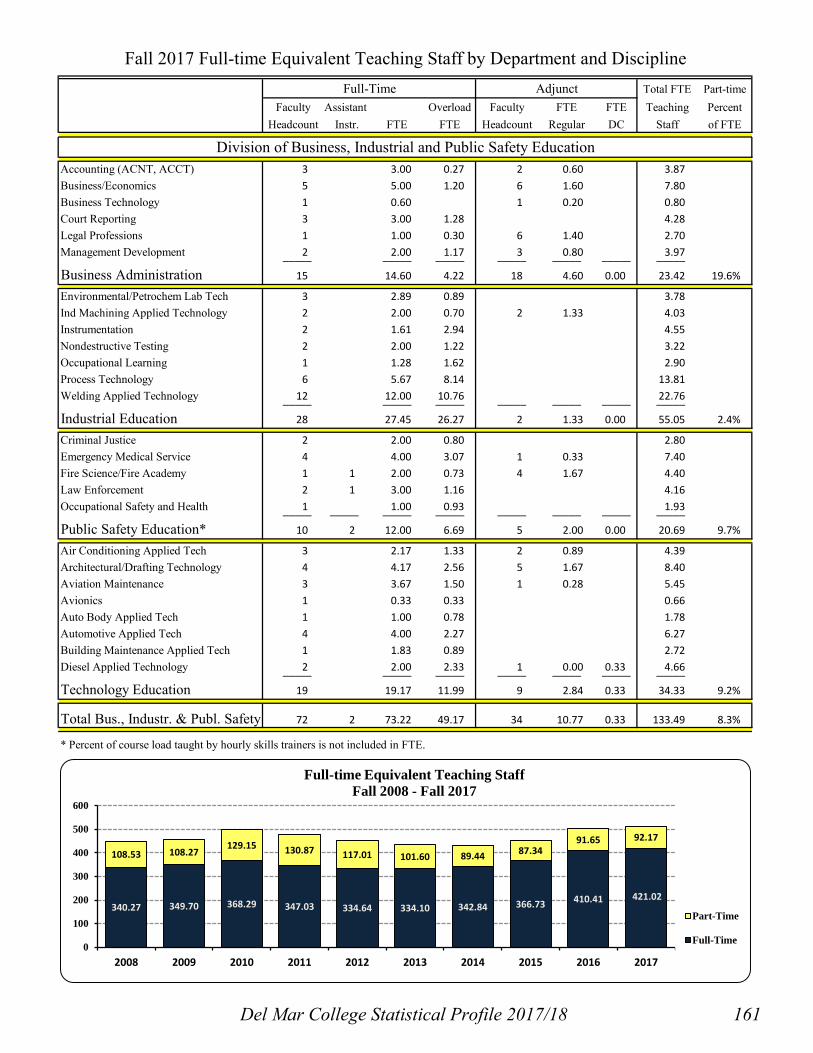
Full-Time Total FTE Part-timeFaculty Assistant Overload Faculty FTE FTE Teaching Percent
Headcount Instr. FTE FTE Headcount Regular DC Staff of FTE
Fall 2017 Full-time Equivalent Teaching Staff by Department and DisciplineAdjunct
Accounting (ACNT, ACCT) 3 3.00 0.27 2 0.60 3.87Business/Economics 5 5.00 1.20 6 1.60 7.80Business Technology 1 0.60 1 0.20 0.80Court Reporting 3 3.00 1.28 4.28Legal Professions 1 1.00 0.30 6 1.40 2.70Management Development 2 2.00 1.17 3 0.80 3.97_____ _____ _____ _____ _____ _____ _____
Business Administration 15 14.60 4.22 18 4.60 0.00 23.42 19.6%
Environmental/Petrochem Lab Tech 3 2.89 0.89 3.78Ind Machining Applied Technology 2 2.00 0.70 2 1.33 4.03Instrumentation 2 1.61 2.94 4.55Nondestructive Testing 2 2.00 1.22 3.22Occupational Learning 1 1.28 1.62 2.90Process Technology 6 5.67 8.14 13.81Welding Applied Technology 12 12.00 10.76 22.76_____ _____ _____ _____ _____ _____ _____
Industrial Education 28 27.45 26.27 2 1.33 0.00 55.05 2.4%
Criminal Justice 2 2.00 0.80 2.80Emergency Medical Service 4 4.00 3.07 1 0.33 7.40Fire Science/Fire Academy 1 1 2.00 0.73 4 1.67 4.40Law Enforcement 2 1 3.00 1.16 4.16Occupational Safety and Health 1 1.00 0.93 1.93_____ _____ _____ _____ _____ _____ _____ _____
Public Safety Education* 10 2 12.00 6.69 5 2.00 0.00 20.69 9.7%
Air Conditioning Applied Tech 3 2.17 1.33 2 0.89 4.39Architectural/Drafting Technology 4 4.17 2.56 5 1.67 8.40Aviation Maintenance 3 3.67 1.50 1 0.28 5.45Avionics 1 0.33 0.33 0.66Auto Body Applied Tech 1 1.00 0.78 1.78Automotive Applied Tech 4 4.00 2.27 6.27Building Maintenance Applied Tech 1 1.83 0.89 2.72Diesel Applied Technology 2 2.00 2.33 1 0.00 0.33 4.66_____ _____ _____ _____ _____ _____ _____
Technology Education 19 19.17 11.99 9 2.84 0.33 34.33 9.2%
Total Bus., Industr. & Publ. Safety 72 2 73.22 49.17 34 10.77 0.33 133.49 8.3%
* Percent of course load taught by hourly skills trainers is not included in FTE.
Division of Business, Industrial and Public Safety Education
340.27 349.70 368.29 347.03 334.64 334.10 342.84 366.73 410.41 421.02
108.53 108.27 129.15 130.87 117.01 101.60 89.44 87.34
91.65 92.17
0
100
200
300
400
500
600
2008 2009 2010 2011 2012 2013 2014 2015 2016 2017
Full-time Equivalent Teaching Staff Fall 2008 - Fall 2017
Part-Time
Full-Time
Del Mar College Statistical Profile 2017/18 161
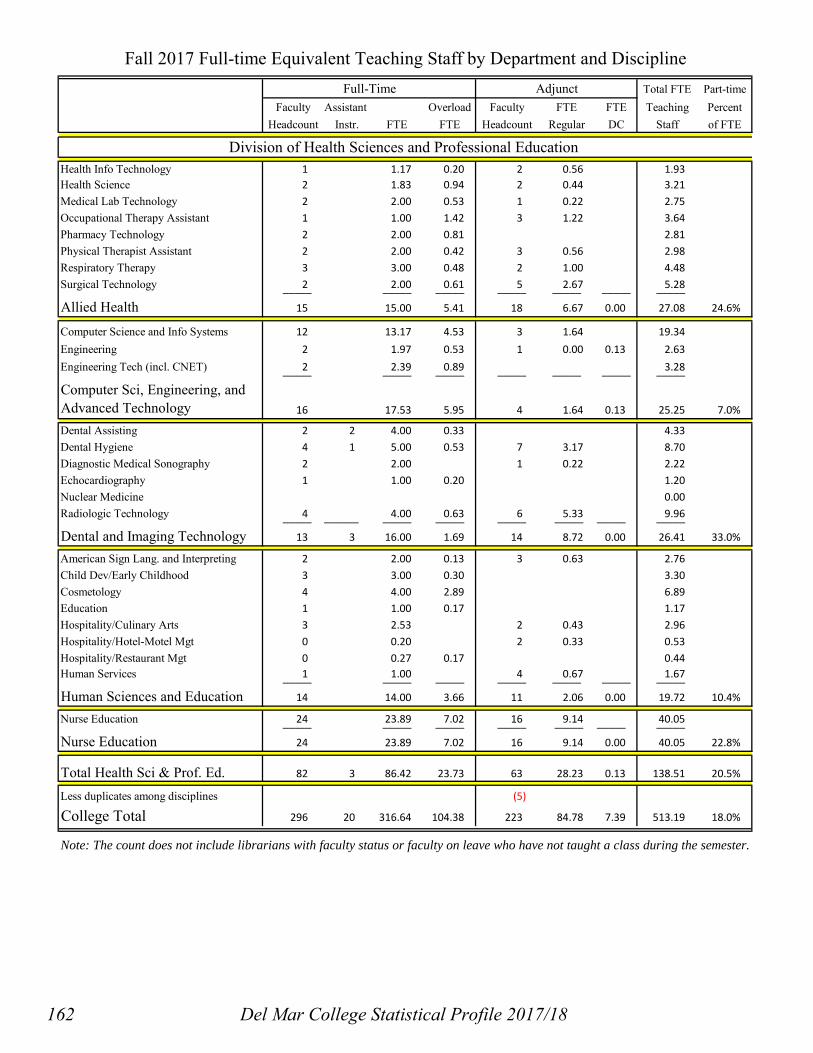
Full-Time Total FTE Part-timeFaculty Assistant Overload Faculty FTE FTE Teaching Percent
Headcount Instr. FTE FTE Headcount Regular DC Staff of FTE
Fall 2017 Full-time Equivalent Teaching Staff by Department and DisciplineAdjunct
Health Info Technology 1 1.17 0.20 2 0.56 1.93Health Science 2 1.83 0.94 2 0.44 3.21 Medical Lab Technology 2 2.00 0.53 1 0.22 2.75Occupational Therapy Assistant 1 1.00 1.42 3 1.22 3.64Pharmacy Technology 2 2.00 0.81 2.81Physical Therapist Assistant 2 2.00 0.42 3 0.56 2.98Respiratory Therapy 3 3.00 0.48 2 1.00 4.48Surgical Technology 2 2.00 0.61 5 2.67 5.28_____ _____ _____ _____ _____ _____ _____
Allied Health 15 15.00 5.41 18 6.67 0.00 27.08 24.6%
Computer Science and Info Systems 12 13.17 4.53 3 1.64 19.34Engineering 2 1.97 0.53 1 0.00 0.13 2.63Engineering Tech (incl. CNET) 2 2.39 0.89 3.28_____ _____ _____ _____ _____ _____ _____
Computer Sci, Engineering, and Advanced Technology 16 17.53 5.95 4 1.64 0.13 25.25 7.0%
Dental Assisting 2 2 4.00 0.33 4.33Dental Hygiene 4 1 5.00 0.53 7 3.17 8.70Diagnostic Medical Sonography 2 2.00 1 0.22 2.22Echocardiography 1 1.00 0.20 1.20Nuclear Medicine 0.00Radiologic Technology 4 4.00 0.63 6 5.33 9.96_____ ______ _____ _____ _____ _____ _____ _____
Dental and Imaging Technology 13 3 16.00 1.69 14 8.72 0.00 26.41 33.0%
American Sign Lang. and Interpreting 2 2.00 0.13 3 0.63 2.76Child Dev/Early Childhood 3 3.00 0.30 3.30Cosmetology 4 4.00 2.89 6.89Education 1 1.00 0.17 1.17Hospitality/Culinary Arts 3 2.53 2 0.43 2.96Hospitality/Hotel-Motel Mgt 0 0.20 2 0.33 0.53Hospitality/Restaurant Mgt 0 0.27 0.17 0.44Human Services 1 1.00 4 0.67 1.67_____ _____ _____ _____ _____ _____ _____
Human Sciences and Education 14 14.00 3.66 11 2.06 0.00 19.72 10.4%
Nurse Education 24 23.89 7.02 16 9.14 40.05 _____ _____ _____ _____ _____ _____ _____
Nurse Education 24 23.89 7.02 16 9.14 0.00 40.05 22.8%
Total Health Sci & Prof. Ed. 82 3 86.42 23.73 63 28.23 0.13 138.51 20.5%
Less duplicates among disciplines (5)
College Total 296 20 316.64 104.38 223 84.78 7.39 513.19 18.0%
Note: The count does not include librarians with faculty status or faculty on leave who have not taught a class during the semester.
Division of Health Sciences and Professional Education
162 Del Mar College Statistical Profile 2017/18

Average Nine-Month Tenured/Tenure-Track Faculty Salariesby Rank and by Division
2008-09 2009-10 2010-11 2011-12 2012-13 2013-14 2014-15 2015-16 2016-17 2017-18
Rank Professor $67,641 $67,491 $68,470 $68,349 $67,928 $68,956 $73,927 $76,920 $80,345 $81,952
Associate Professor $57,766 $56,911 $55,790 $55,566 $56,655 $57,686 $62,281 $65,076 $68,364 $68,895
Assistant Professor $51,834 $51,435 $50,473 $50,024 $49,869 $51,771 $53,658 $56,622 $59,818 $61,123
Instructor $44,995 $44,658 $44,085 $44,598 $44,881 $45,714 $46,696 $49,694 $52,138 $52,830
Division Arts and Sciences $58,277 $55,742 $57,733 $57,661 $58,395 $59,977 $63,143 $67,505 $71,266 $73,157
Business, Professional &Tech Ed. $54,438 $52,451 $54,094 $54,561 $53,412 $55,436 $57,880
*Business, Industrial & Public Safety $60,219 $63,872 $62,772
*Health Sciences & Professional Ed $61,862 $65,975 $66,851
Counseling $63,142 $64,072 $64,072 $61,796 $71,581
Library $59,124 $56,552 $56,919 $56,919 $54,784 $56,755 $61,828 $66,293 $66,148 $68,219
College-Wide Average Salary $56,529 $55,608 $56,071 $56,203 $55,919 $57,676 $60,656 $64,487 $68,279 $69,237
In 2009, 2010, and 2011 no salary increases were approved, with the exception of those contracted for promotion in rank.
* Prior to Fall 2015 part of Business, Professional and Technology Education Division.
Note: The College offered a Retirement Incentive Program in 2008 and 2012, resulting in higher than average annual number of faculty retirements.
$0
$10,000
$20,000
$30,000
$40,000
$50,000
$60,000
$70,000
$80,000
$90,000
2008-09 2009-10 2010-11 2011-12 2012-13 2013-14 2014-15 2015-16 2016-17 2017-18
Average Nine-Month Tenured/Tenure-Track Faculty Salaries by Rank
Professor Associate Professor Assistant Professor Instructor
Del Mar College Statistical Profile 2017/18 163

Male Female Total Male Female Total Male Female Total
Faculty 156 149 305 163 156 319 165 158 323
51.1% 48.9% 51.1% 48.9% 51.1% 48.9%
Exempt 58 76 134 58 82 140 64 90 154
43.3% 56.7% 41.4% 58.6% 41.6% 58.4%
Non-Exempt 50 115 165 50 126 176 57 125 182
30.3% 69.7% 28.4% 71.6% 31.3% 68.7%
Externally-Funded 13 30 43 8 37 45 6 33 39
30.2% 69.8% 17.8% 82.2% 15.4% 84.6%
Total Full-Time 277 370 647 279 401 680 292 406 698
Percent of Total 42.8% 57.2% 41.0% 59.0% 41.8% 58.2%
Adjunct Faculty, 102 139 241 96 137 233 103 144 247
Credit 42.3% 57.7% 41.2% 58.8% 41.7% 58.3%
Adjunct Faculty, 94 28 122 84 35 119 96 71 167
Continuing Education 77.0% 23.0% 70.6% 29.4% 57.5% 42.5%
Part-Time Staff 203 205 408 219 226 445 209 208 417
49.8% 50.2% 49.2% 50.8% 50.1% 49.9%
Total Part-Time 399 372 771 399 398 797 408 423 831
Percent of Total 51.8% 48.2% 50.1% 49.9% 49.1% 50.9%
Total 676 742 1,418 678 799 1,477 700 829 1,529
Percent of Total 47.7% 52.3% 45.9% 54.1% 45.8% 54.2%
College-Wide
Employee Groups by GenderFall 2015 Fall 2016 Fall 2017
Full-Time
Part-Time
0
50
100
150
200
250
Faculty Exempt Non-Exempt ExternallyFunded
AdjunctCredit
AdjunctContinuing Ed
Part-TimeStaff
Employee Groups by Gender Fall 2017
Male
Female
164 Del Mar College Statistical Profile 2017/18

Non- Externally Adjunct Adjunct Grand of Faculty Exempt Exempt Funded Total Credit Cont Ed Staff Total Total Total
Fall 2015 Black, non-Hispanic 8 10 4 4 26 5 4 8 17 43 3.0% Hispanic 81 61 99 19 260 75 35 229 339 599 42.2% Other 12 3 4 2 21 13 3 15 31 52 3.7% Unknown 5 5 2 2 14 5 6 7 18 32 2.3% White, non-Hispanic 199 55 56 16 326 143 74 149 366 692 48.8%____ ____ ____ ____ _____ _____ ____ ____ _____ _____ _______
Total 305 134 165 43 647 241 122 408 771 1,418 100.0%
% Minority 33.1% 55.2% 64.8% 58.1% 47.4% 38.6% 34.4% 61.8% 50.2% 48.9%
Fall 2016 Black, non-Hispanic 8 9 6 2 25 6 5 15 26 51 3.5% Hispanic 88 58 112 26 284 80 38 267 385 669 45.3% Other 14 4 3 0 21 14 3 16 33 54 3.7% Unknown 3 1 1 0 5 1 0 4 5 10 0.7% White, non-Hispanic 206 68 54 17 345 132 73 143 348 693 46.9%____ ____ ____ ____ _____ _____ ____ ____ _____ _____ _______
Total 319 140 176 45 680 233 119 445 797 1,477 100.0%
% Minority 34.5% 50.7% 68.8% 62.2% 48.5% 42.9% 38.7% 67.0% 55.7% 52.4%
Fall 2017 Black, non-Hispanic 8 8 5 1 22 7 5 16 28 50 3.3% Hispanic 85 64 116 21 286 80 58 235 373 659 43.1% Other 12 6 4 1 23 20 5 10 35 58 3.8% Unknown 2 1 1 0 4 4 2 4 10 14 0.9% White, non-Hispanic 216 75 56 16 363 136 97 152 385 748 48.9%____ ____ ____ ____ _____ _____ ____ ____ _____ _____ _______
Total 323 154 182 39 698 247 167 417 831 1,529 100.0%
% Minority 32.5% 50.6% 68.7% 59.0% 47.4% 43.3% 40.7% 62.6% 52.5% 50.2%
Employee Groups by Ethnicity/RaceFull-time Part-time Percent
Note: Minority include Black, Hispanic, and Other (American Indian or Alaskan Native, Asian, and Native Hawaiian/Pacific Islander).
0
50
100
150
200
250
300
Faculty Exempt Non-Exempt ExternallyFunded
AdjunctCredit
AdjunctContinuing Ed
Part-TimeStaff
Minority Distribution of Employee GroupsFall 2017
White,non-Hispanic
Minority
Del Mar College Statistical Profile 2017/18 165

0%
10%
20%
30%
40%
50%
60%
70%
80%
90%
100%
Faculty Exempt Non-Exempt ExternallyFunded
AdjunctCredit
AdjunctContinuing Ed
Part-TimeStaff
Employee Groups by Percent MinorityFall 2015 - Fall 2017
Fall 2015
Fall 2016
Fall 2017
0%
10%
20%
30%
40%
50%
60%
70%
80%
90%
100%
Faculty Exempt Non-Exempt ExternallyFunded
AdjunctCredit
AdjunctContinuing Ed
Part-TimeStaff
Employee Groups by Percent FemaleFall 2015 - Fall 2017
Fall 2015
Fall 2016
Fall 2017
166 Del Mar College Statistical Profile 2017/18

Del Mar College Statistical Profile
Budget and Finance Terms and Definitions
Operating Fund The Operating Fund accounts for current financial resources raised and expended for the core services provided by the College and is the only fund budgeted.
Instruction Expenses for academic, vocational, and technical instruction, developmental and tutorial instruction, continuing education instruction, and instructional administration.
Public Service Expenses for providing non-instructional services beneficial to individuals and groups external to the institution.
Academic Support Expenses for educational materials, libraries, galleries, curriculum development, computer and audio-visual services, and departmental office expenses.
Student Services Admissions, registration, counseling and testing, placement services, student financial aid, student development, and other student services.
Institutional Support Expenses for executive level management, fiscal operation, space management, personnel and records, information technology, central duplicating services, mailroom and telephone services, alumni relations, fundraising, etc.
Operations and Maintenance of Plant Salaries and wages for custodial and maintenance personnel, cost of utilities, cost of supplies and equipment for custodial and maintenance personnel, minor repairs and renovations, parking areas, and security.
Scholarships Expenses for scholarships and fellowships, including tuition remissions and exemptions in grants to students.
Staff Benefits Premiums paid toward benefit programs for all employees (includes FICA, life insurance, health insurance, unemployment insurance, workman’s compensation, etc)
Highlights
The 2017-2018 Operating Budget is $97,547,615, an 8.8 percent increase from the 2016-2017 budget.
Over half (60.9%) of this cycle’s budget will be spent on instruction, academic support, and student services, a 9.6 percent increase from the 2016-2017 budget.
Overall, the College's income from all sources ($120.9 million) exceeded expenses ($115.9 million) in 2016-2017 by 4.3 percent.
Funding Sources The majority of Del Mar College’s revenues come from a combination of student tuition and fees, Texas legislative appropriations, gifts to the College, grants, and taxes collected from the Del Mar College District, which currently includes the land within five contiguous independent school districts: Corpus Christi ISD, Calallen ISD, Flour Bluff ISD, Tuloso-Midway ISD, and West Oso ISD. State legislative appropriations are budgeted based on the number of contact hours (instructional hours the students spend in contact with faculty) generated by students enrolling at the College. Most of the federal grant funds that the College receives are from a Title IV grant for student financial aid.
Del Mar College Statistical Profile 2017/18 167

Chapter Summary
Budget
The operating budget for 2017-2018 is $97,547,615, an 8.8 percent increase from the 2016-2017 operating budget. Over half (55.7%) of the operating budget for 2017-2018 will be spent on salaries, an increase of 7.6 percent from the budgeted and 6.1 percent from the actual salaries expenditures for 2016-2017.
The College’s revenue from all funding sources ($120.9 million) increased by 2.2 percent in 2016-2017 compared to prior year and set a new record-high. The amount ($67,585,064) spent for instruction, academic support and student services in 2016-2017 increased by 4.6 percent, while its share in the total expenses (58.3%) decreased by 0.8 percentage point from 2015-2016. The amount spent on public service ($129,056) in 2016-2017 increased by 16.7 percent from 2015-2016 setting a new record-high.
State and Federal Funding
The dollar amount of the state appropriation ($15.9 million) budgeted for 2017-2018 is $1.2 million more (+8.2%) than the previous biennium budget ($14.7 million) though its proportion in the 2017-2018 budget decreased to 16.3 percent from 16.4 percent in 2016-2017 budget.
While actual state contribution toward employee benefits increased by 7.6 percent to $5.4 million in 2016-2017 from $5.0 million in 2015-2016, it was still significantly lower (-20.1%) than the highest $6.8 million contribution in 2009-2010.
In October 2016, the College unveiled the new 20,000 square-foot Emergency Training Building on the West Campus, which is a FEMA Safe Shelter or dome, with Public Safety Education programs using the space for instruction when not needed by the city.
Local Funding
The assessed value of property within the College’s taxing district for 2017-2018 increased by another 3.2 percent from the prior year value to over $25.7 billion. Local taxes collected for maintenance in 2016-2017 were $47.2 million, a 1.0 percent increase from 2015-2016, and accounted for 39.0 percent of the total revenue. Debt service taxes collected are used to repay the College’s obligations and are not included in the operating budget.
The College collected $12.8 million net of discounts student tuition and fees in 2016-2017, a 6.5 percent increase from 2015-2016, though it is still 14.2 percent less than $14.9 million collected in 2011-2012.
In November 2016, the voters approved a $139 million bond for the first phase of the future South Campus on the 95-acre property at Yorktown and Rodd Field Road, which is expected to open its doors by 2021.
Capital Investment
The College’s capital investment as of August 2017 was $185,179,162, a 1.7 percent increase from prior year. Net capital assets are required to be stated net of accumulated depreciation, which reached $95.6 million through fiscal year 2016-2017.
Foundation
The annual contribution to the Del Mar College Foundation was $4,744,478 in 2016-2017, a 32.5 percent increase from 2015-2016. The Foundation provided $1,194,401 in scholarships to 1,732 students during 2016-2017. The Foundation’s fund balance as of June 30, 2017 was approximately $20.7 million.
168 Del Mar College Statistical Profile 2017/18

Operating Budget 2017-2018$97,547,615
State Appropriation16.3%
State Benefits Contribution
5.8%
Net Tuition and Fees24.4%
Miscellaneous0.8%
Property Taxes52.8%
Revenues by Source
Instruction46.1%
Academic Support7.7%
Student Services7.2% Institutional
Support27.2%
Operation and Maintenance
11.7%
Public Service0.14%
Expenditures by Function
Del Mar College Statistical Profile 2017/18 169

Budget 2016
Actual 2016
Budget 2017
Actual 2017
Budget 2018
1-Year Budget% Change
Faculty Salaries $26,850,551 $28,031,186 $30,170,809 $31,010,136 $32,104,474 6.4%
Exempt Salaries 10,350,381 9,803,734 10,802,581 10,622,899 11,699,552 8.3%
Non-Exempt Salaries 7,919,705 8,247,879 8,773,048 8,716,414 9,666,997 10.2%
Student Assistant Salaries 818,836 728,646 755,164 852,661 849,195 12.5%
Total Salaries $45,939,473 $46,811,445 $50,501,602 $51,202,110 $54,320,218 7.6%
% of Total 54.0% 54.6% 56.3% 57.1% 55.7%
Health Insurance $7,758,000 $8,321,186 $9,012,069 $9,128,691 $9,856,285 9.4%
Other Benefits 7,270,000 7,718,164 7,634,504 8,745,903 8,349,675 9.4%
Total Benefits $15,028,000 $16,039,350 $16,646,573 $17,874,594 $18,205,960 9.4%
% of Total 17.7% 18.7% 18.6% 19.9% 18.7%
Prof Develop and Travel $753,430 $648,889 $713,818 $613,020 $761,299 6.7%
% of Total 0.9% 0.8% 0.8% 0.7% 0.8%
Operations and Maintenance $7,346,662 $7,305,713 $6,784,721 $6,796,946 $6,991,525 3.0%
% of Total 8.6% 8.5% 7.6% 7.6% 7.2%
Supplies and Equipment $7,532,625 $8,144,544 $6,387,993 $6,543,673 $7,121,722 11.5%
% of Total 8.8% 9.5% 7.1% 7.3% 7.3%
Contractual and Fees $6,121,804 $6,141,139 $6,489,952 $6,110,931 $6,451,847 -0.6%
% of Total 7.2% 7.2% 7.2% 6.8% 6.6%
Miscellaneous $1,122,396 $620,607 $779,601 $526,669 $1,631,830 109.3%
% of Total 1.3% 0.7% 0.9% 0.6% 1.7%
Contingency $1,273,832 $1,335,217 $2,063,214 54.5%
% of Total 1.5% 1.5% 2.1%
Total Expenditures $85,118,222 $85,711,687 $89,639,477 $89,667,943 $97,547,615 8.8%
Source: Del Mar College Budget.
Operating Fund Expenditures by Object
$0
$10,000
$20,000
$30,000
$40,000
$50,000
$60,000
Salaries Benefits Operations and Equipment Other Expenditures
Thousands Operating Fund Expenditures by Object
Budget2016
Actual2016
Budget2017
Actual2017
Budget2018
170 Del Mar College Statistical Profile 2017/18
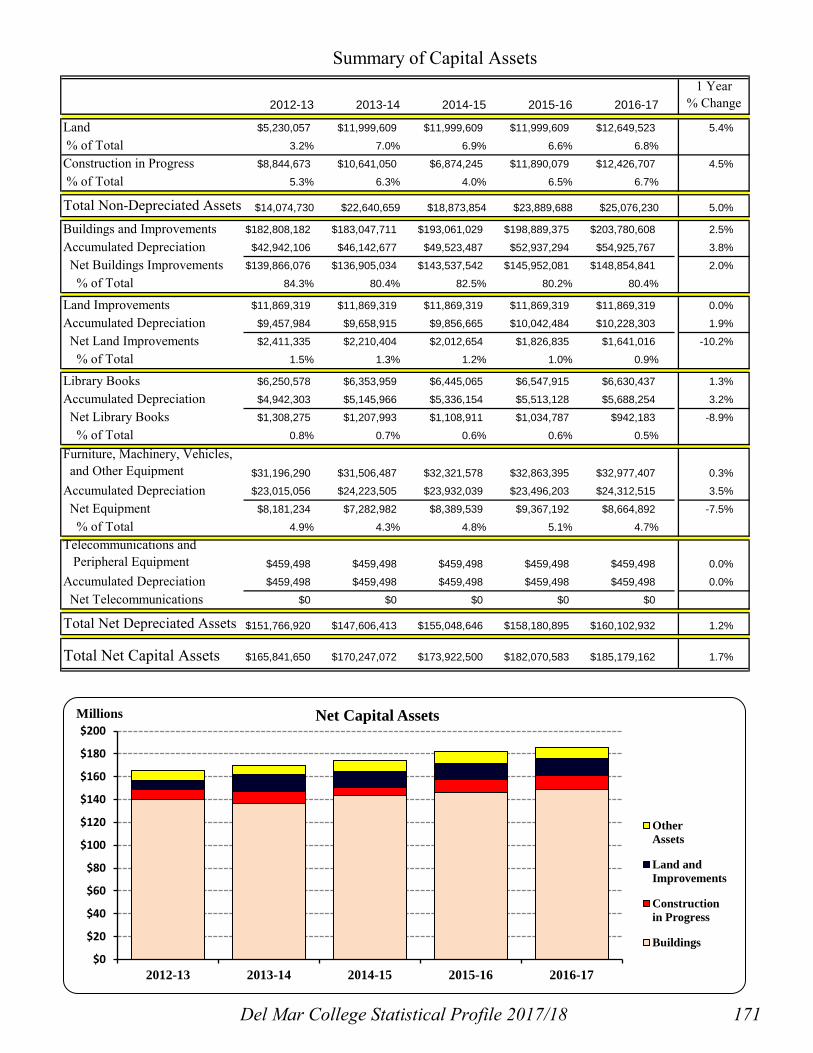
Summary of Capital Assets
2012-13 2013-14 2014-15 2015-16 2016-171 Year
% Change
Land $5,230,057 $11,999,609 $11,999,609 $11,999,609 $12,649,523 5.4%
% of Total 3.2% 7.0% 6.9% 6.6% 6.8%
Construction in Progress $8,844,673 $10,641,050 $6,874,245 $11,890,079 $12,426,707 4.5%
% of Total 5.3% 6.3% 4.0% 6.5% 6.7%
Total Non-Depreciated Assets $14,074,730 $22,640,659 $18,873,854 $23,889,688 $25,076,230 5.0%
Buildings and Improvements $182,808,182 $183,047,711 $193,061,029 $198,889,375 $203,780,608 2.5%
Accumulated Depreciation $42,942,106 $46,142,677 $49,523,487 $52,937,294 $54,925,767 3.8%
Net Buildings Improvements $139,866,076 $136,905,034 $143,537,542 $145,952,081 $148,854,841 2.0%
% of Total 84.3% 80.4% 82.5% 80.2% 80.4%
Land Improvements $11,869,319 $11,869,319 $11,869,319 $11,869,319 $11,869,319 0.0%
Accumulated Depreciation $9,457,984 $9,658,915 $9,856,665 $10,042,484 $10,228,303 1.9%
Net Land Improvements $2,411,335 $2,210,404 $2,012,654 $1,826,835 $1,641,016 -10.2%
% of Total 1.5% 1.3% 1.2% 1.0% 0.9%
Library Books $6,250,578 $6,353,959 $6,445,065 $6,547,915 $6,630,437 1.3%
Accumulated Depreciation $4,942,303 $5,145,966 $5,336,154 $5,513,128 $5,688,254 3.2%
Net Library Books $1,308,275 $1,207,993 $1,108,911 $1,034,787 $942,183 -8.9%
% of Total 0.8% 0.7% 0.6% 0.6% 0.5%
Furniture, Machinery, Vehicles, and Other Equipment $31,196,290 $31,506,487 $32,321,578 $32,863,395 $32,977,407 0.3%
Accumulated Depreciation $23,015,056 $24,223,505 $23,932,039 $23,496,203 $24,312,515 3.5%
Net Equipment $8,181,234 $7,282,982 $8,389,539 $9,367,192 $8,664,892 -7.5%
% of Total 4.9% 4.3% 4.8% 5.1% 4.7%
Telecommunications and Peripheral Equipment $459,498 $459,498 $459,498 $459,498 $459,498 0.0%
Accumulated Depreciation $459,498 $459,498 $459,498 $459,498 $459,498 0.0%
Net Telecommunications $0 $0 $0 $0 $0
Total Net Depreciated Assets $151,766,920 $147,606,413 $155,048,646 $158,180,895 $160,102,932 1.2%
Total Net Capital Assets $165,841,650 $170,247,072 $173,922,500 $182,070,583 $185,179,162 1.7%
$0
$20
$40
$60
$80
$100
$120
$140
$160
$180
$200
2012-13 2013-14 2014-15 2015-16 2016-17
Millions Net Capital Assets
OtherAssets
Land andImprovements
Constructionin Progress
Buildings
Del Mar College Statistical Profile 2017/18 171

2012-13 2013-14 2014-15 2015-16 2016-171 Year
% Change
Net Tuition and Fees $9,681,161 $10,683,123 $10,878,328 $11,975,986 $12,755,431 6.5% % of Total 9.4% 10.1% 9.8% 10.1% 10.6%
Grants and Contracts $5,916,013 $6,320,977 $9,106,975 $11,195,653 $7,533,981 -32.7% % of Total 5.8% 6.0% 8.2% 9.5% 6.2%
$1,172,798 $1,357,212 $1,378,951 $2,304,931 $1,767,755 -23.3% % of Total 1.1% 1.3% 1.2% 1.9% 1.5%
Auxiliary Enterprises $1,373,947 $1,397,476 $1,507,338 $1,323,238 $1,248,486 -5.6% % of Total 1.3% 1.3% 1.4% 1.1% 1.0%
Total Operating Revenues $18,143,919 $19,758,788 $22,871,592 $26,799,808 $23,305,653 -13.0%
State Appropriations $16,001,819 $15,353,344 $15,244,082 $14,757,925 $14,747,841 -0.1% % of Total 15.6% 14.6% 13.7% 12.5% 12.2%
State Insurance/ORP $3,533,408 $4,200,432 $4,673,662 $5,042,393 $5,428,010 7.6% % of Total 3.4% 4.0% 4.2% 4.3% 4.5%
Maintenance Taxes $37,311,571 $40,524,142 $43,341,908 $46,704,072 $47,179,178 1.0% % of Total 36.3% 38.5% 39.0% 39.5% 39.0%
Debt Service Taxes* $8,678,589 $8,639,074 $8,384,937 $8,338,292 $12,386,836 48.6% % of Total 8.4% 8.2% 7.6% 7.0% 10.2%
Federal Revenue $18,730,358 $16,521,106 $16,265,164 $16,322,598 $16,714,930 2.4% % of Total 18.2% 15.7% 14.7% 13.8% 13.8%
$390,110 $341,646 $235,862 $358,790 $1,119,684 212.1% % of Total 0.4% 0.3% 0.2% 0.3% 0.9%
Total Non-Operating Revenues $84,645,855 $85,579,744 $88,145,615 $91,524,070 $97,576,479 6.6%
Total Revenues $102,789,774 $105,338,532 $111,017,207 $118,323,878 $120,882,132 2.2%
Summary of Annual Revenues by Source
Source: Comprehensive Annual Financial Reports (Exhibit 2, Schedules A and C). *Debt service taxes collected are used to repay the College's obligations and are not included in the operating budget.
Other Revenue
General Operating Revenue
$0 $5 $10 $15 $20 $25 $30 $35 $40 $45 $50
Other Income
MaintenanceTaxes
Tuition and Fees
StateAppropriations
Millions
Operating Budget Revenues by Source
2016-17
2015-16
2014-15
2013-14
2012-13
172 Del Mar College Statistical Profile 2017/18

Summary of Annual Expenses by Function
2012-13 2013-14 2014-15 2015-16 2016-171 Year
% Change
Instruction $33,765,746 $35,017,334 $36,440,531 $39,580,321 $43,908,899 10.9%% of Total 36.6% 36.9% 35.8% 36.2% 37.9%
Academic Support $4,984,898 $5,553,605 $6,193,494 $6,946,425 $7,189,179 3.5%% of Total 5.4% 5.8% 6.1% 6.4% 6.2%
Student Services $12,439,289 $12,295,001 $16,105,881 $18,039,997 $16,486,986 -8.6%% of Total 13.5% 12.9% 15.8% 16.5% 14.2%
Public Service $21,359 $14,146 $21,290 $110,626 $129,056 16.7%% of Total 0.0% 0.0% 0.0% 0.1% 0.1%
Institutional Support $15,235,208 $16,637,302 $16,792,500 $18,690,329 $19,429,845 4.0%% of Total 16.5% 17.5% 16.5% 17.1% 16.8%
Operation and Maintenance $7,597,543 $8,112,724 $8,770,592 $9,701,525 $10,128,134 4.4%% of Total 8.2% 8.5% 8.6% 8.9% 8.7%
Scholarships and Fellowships $6,856,972 $5,980,411 $6,285,920 $5,111,125 $5,905,955 15.6%% of Total 7.4% 6.3% 6.2% 4.7% 5.1%
Auxiliary Enterprises $1,404,623 $1,339,143 $1,469,943 $1,417,025 $1,483,984 4.7%% of Total 1.5% 1.4% 1.4% 1.3% 1.3%
Depreciation $5,606,843 $5,570,425 $5,589,559 $5,515,438 $5,565,557 0.9%% of Total 6.1% 5.9% 5.5% 5.0% 4.8%
Total Operating Expenses $87,912,481 $90,520,091 $97,669,710 $105,112,811 $110,227,595 4.9%
Non-Operating Expenses $4,432,621 $4,488,396 $4,049,003 $4,176,905 $5,677,444 35.9%% of Total 4.8% 4.7% 4.0% 3.8% 4.9%
Total Expenses $92,345,102 $95,008,487 $101,718,713 $109,289,716 $115,905,039 6.1%
Source: Comprehensive Annual Financial Reports (Exhibit 2, Schedules B and C).
$0 $5 $10 $15 $20 $25 $30 $35 $40
Other Expenses
Operation andMaintenance
Student Servicesand Scholarships
Academic andInstitutional
Support
Instruction
Millions
Annual Expenses by Function
2016-17
2015-16
2014-15
2013-14
2012-13
Del Mar College Statistical Profile 2017/18 173
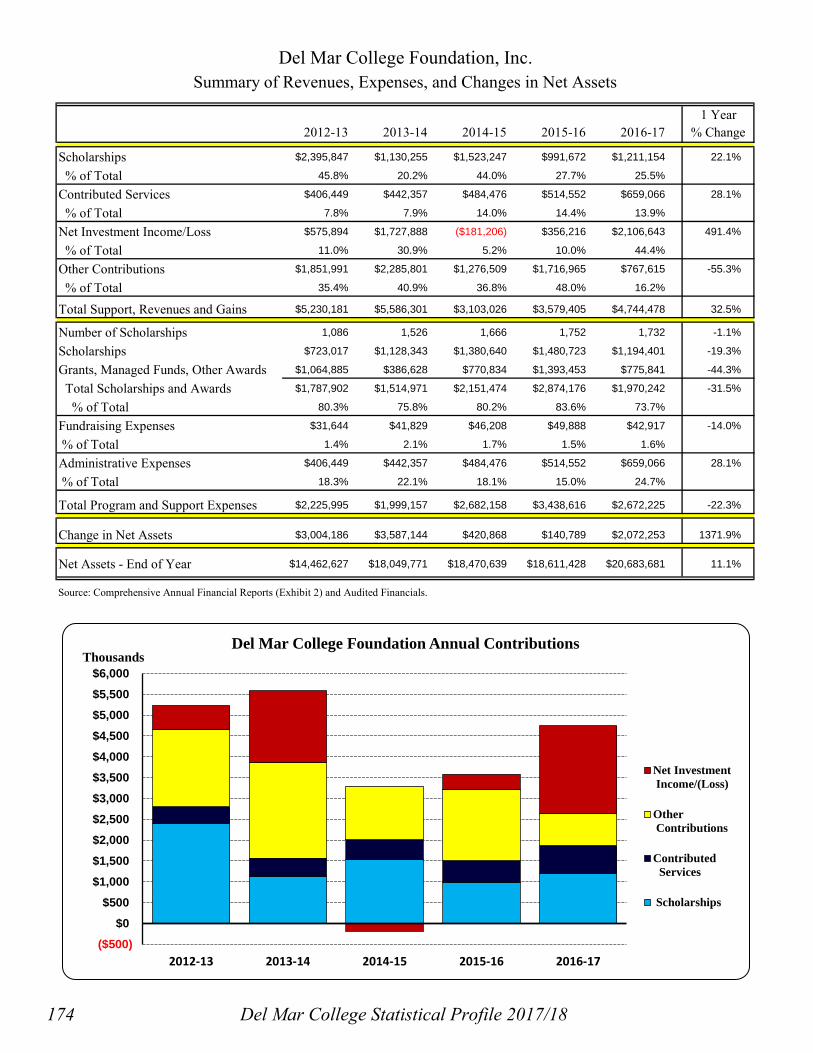
1 Year2012-13 2013-14 2014-15 2015-16 2016-17 % Change
Scholarships $2,395,847 $1,130,255 $1,523,247 $991,672 $1,211,154 22.1%
% of Total 45.8% 20.2% 44.0% 27.7% 25.5%
Contributed Services $406,449 $442,357 $484,476 $514,552 $659,066 28.1%
% of Total 7.8% 7.9% 14.0% 14.4% 13.9%
Net Investment Income/Loss $575,894 $1,727,888 ($181,206) $356,216 $2,106,643 491.4%
% of Total 11.0% 30.9% 5.2% 10.0% 44.4%
Other Contributions $1,851,991 $2,285,801 $1,276,509 $1,716,965 $767,615 -55.3%
% of Total 35.4% 40.9% 36.8% 48.0% 16.2%
Total Support, Revenues and Gains $5,230,181 $5,586,301 $3,103,026 $3,579,405 $4,744,478 32.5%
Number of Scholarships 1,086 1,526 1,666 1,752 1,732 -1.1%
Scholarships $723,017 $1,128,343 $1,380,640 $1,480,723 $1,194,401 -19.3%
Grants, Managed Funds, Other Awards $1,064,885 $386,628 $770,834 $1,393,453 $775,841 -44.3%
Total Scholarships and Awards $1,787,902 $1,514,971 $2,151,474 $2,874,176 $1,970,242 -31.5%
% of Total 80.3% 75.8% 80.2% 83.6% 73.7%
Fundraising Expenses $31,644 $41,829 $46,208 $49,888 $42,917 -14.0%
% of Total 1.4% 2.1% 1.7% 1.5% 1.6%
Administrative Expenses $406,449 $442,357 $484,476 $514,552 $659,066 28.1%
% of Total 18.3% 22.1% 18.1% 15.0% 24.7%
Total Program and Support Expenses $2,225,995 $1,999,157 $2,682,158 $3,438,616 $2,672,225 -22.3%
Change in Net Assets $3,004,186 $3,587,144 $420,868 $140,789 $2,072,253 1371.9%
Net Assets - End of Year $14,462,627 $18,049,771 $18,470,639 $18,611,428 $20,683,681 11.1%
Source: Comprehensive Annual Financial Reports (Exhibit 2) and Audited Financials.
Del Mar College Foundation, Inc.Summary of Revenues, Expenses, and Changes in Net Assets
($500)
$0
$500
$1,000
$1,500
$2,000
$2,500
$3,000
$3,500
$4,000
$4,500
$5,000
$5,500
$6,000
2012-13 2013-14 2014-15 2015-16 2016-17
ThousandsDel Mar College Foundation Annual Contributions
Net Investment Income/(Loss)
Other Contributions
Contributed Services
Scholarships
174 Del Mar College Statistical Profile 2017/18

District Assessed 1 Year Tax Rate Per $100 Valuation Capital
Year Valuation % Change Operations Debt Total Investment 1974-75 $823,688,405 10.2% 26.0000¢ 0¢ 26.0000¢ $13,677,500 1976-77 $1,048,568,718 7.2% 25.0000¢ 0¢ 25.0000¢ $16,557,465 1978-79 $2,344,787,096 88.6% 13.0000¢ 0¢ 13.0000¢ $16,779,624 1980-81 $3,173,019,386 20.1% 11.5000¢ 0¢ 11.5000¢ $21,681,804 1982-83 $4,426,373,043 23.9% 8.9100¢ 0¢ 8.9100¢ $24,812,358 1984-85 $7,019,771,666 49.4% 8.2810¢ 0¢ 8.2810¢ $29,926,608 1986-87 $7,449,140,186 3.1% 10.6060¢ 2.3540¢ 12.9600¢ $32,478,911 1988-89 $7,146,804,613 -0.9% 12.4640¢ 3.1230¢ 15.5870¢ $48,875,024 1990-91 $7,017,804,142 0.1% 13.6980¢ 2.4200¢ 16.1180¢ $55,067,266 1992-93 $8,264,622,563 18.0% 14.5600¢ 2.4230¢ 16.9830¢ $60,671,340 1994-95 $8,461,063,860 -0.7% 16.2910¢ 2.2750¢ 18.5660¢ $66,048,663 1996-97 $10,158,641,117 16.8% 18.6481¢ 2.1330¢ 20.7811¢ $69,708,775 1998-99 $10,495,927,288 1.7% 18.6481¢ 2.1330¢ 20.7811¢ $78,470,187 2000-01 $10,923,848,590 1.9% 20.0636¢ 1.9830¢ 22.0466¢ $99,223,002 2002-03 $10,544,059,829 3.7% 20.1870¢ 1.8010¢ 21.9880¢ $58,920,479 2004-05 $11,961,223,991 6.2% 19.3400¢ 4.0370¢ 23.3770¢ $79,380,951 2006-07 $14,004,580,586 8.9% 19.0908¢ 6.4815¢ 25.5723¢ $138,290,115 2007-08 $16,123,368,976 15.1% 18.7090¢ 5.4999¢ 24.2089¢ $154,271,901 2008-09 $16,977,087,797 5.3% 19.0582¢ 5.1200¢ 24.1782¢ $158,802,602 2009-10 $17,848,849,858 5.1% 20.0192¢ 5.1199¢ 25.1391¢ $156,699,714 2010-11 $17,223,861,913 -3.5% 20.0191¢ 5.7812¢ 25.8003¢ $158,279,410 2011-12 $17,475,480,959 1.5% 20.6248¢ 5.1755¢ 25.8003¢ $161,650,278 2012-13 $17,876,287,994 2.3% 20.9394¢ 4.8609¢ 25.8003¢ $165,841,650 2013-14 $19,677,693,385 10.1% 20.6690¢ 4.3976¢ 25.0666¢ $170,247,072 2014-15 $21,123,547,272 7.3% 20.7910¢ 4.0163¢ 24.8073¢ $173,922,500 2015-16 $22,817,248,918 8.0% 21.0549¢ 3.7524¢ 24.8073¢ $182,070,583 2016-17 $24,865,880,443 9.0% 19.4718¢ 5.1441¢ 24.6159¢ $185,179,162 2017-18 $25,668,882,133 3.2% 20.5700¢ 5.3463¢ 25.9163¢ Not yet available
* Starting in Fiscal Year 2002, capital assets are stated net of accumulated depreciation.
Source: Comprehensive Annual Financial Reports (Note 6 and 19) and Country Appraisal District.
District Assessed Valuation, Local Tax Rate, and Capital Investment
02468
10121416182022242628
Cents Tax Rate Per $100 Valuation by Fiscal Year
Debt Operations
Del Mar College Statistical Profile 2017/18 175

Fiscal Acreage Assignable Square Feet Buildings Classrooms and Labs
Year East West East West CED NWC Total East West CED NWC Total East West CED NWC Total1972 36 100 268,018 88,497 356,515 20 10 30 150 56 2061973 36 100 269,295 94,854 364,149 16 10 26 132 55 1871974 36 100 264,295 94,854 359,149 17 10 27 132 65 1971975 36 100 276,795 108,008 384,803 17 11 28 132 65 1971977 41 100 291,448 108,915 400,363 26 12 38 151 60 2111980 41 100 346,218 133,177 479,395 26 13 39 154 71 2251981 42 100 340,807 133,497 474,304 26 13 39 168 80 2481982 42 100 326,867 134,171 461,038 26 13 39 169 77 2461983 45 100 345,064 134,296 479,360 27 13 40 202 76 2781985 50 100 352,673 133,743 486,416 27 13 40 219 80 2991987 59 100 352,673 133,743 486,416 27 13 40 219 80 2991989 59 100 469,371 172,592 641,963 26 18 44 277 105 3821991 59 100 441,463 184,811 626,274 20 24 44 267 115 3821993 59 100 448,538 191,777 640,315 19 25 44 267 115 3821999 59 100 448,538 191,777 640,315 19 25 44 267 115 3822000 59 100 508,059 191,777 699,836 20 25 45 307 116 4232004 59 100 508,059 191,777 699,836 20 25 45 307 116 4232005 59 100 508,059 191,777 35,960 735,796 20 25 1 46 307 116 20 4432006 59 100 508,059 411,536 35,960 955,555 20 26 1 47 307 589 20 9162008 59 100 521,879 411,536 35,960 969,375 20 26 1 47 307 589 20 9162010 59 100 521,879 411,536 35,960 969,375 20 26 1 47 307 589 20 9162011 59 100 521,879 411,536 35,960 13,750 983,125 20 26 1 1 48 307 589 20 7 9232012 59 100 547,201 428,376 35,960 13,750 1,025,287 20 27 1 1 49 322 591 20 7 9402013 59 100 575,201 428,376 35,960 13,750 1,053,287 20 27 1 1 49 330 591 20 7 9482014 59 100 575,201 428,376 35,960 13,750 1,053,287 20 27 1 1 49 330 591 20 7 9482015 59 100 575,201 428,376 35,960 13,750 1,053,287 20 27 1 1 49 330 591 20 7 9482016 59 100 575,201 428,376 35,960 13,750 1,053,287 20 27 1 1 49 330 591 20 7 948
Note: Years 2013 - 2016 do not include 95 acres purchased in October 2013 for Southside Campus expansion.
Buildings and Grounds
0
100
200
300
400
500
600
700
800
900
1,000
1,100Thousands
Assignable Square Feet--East and West Campuses,Center for Economic Development, and Northwest Center
NWC
CED
West
East
176 Del Mar College Statistical Profile 2017/18
