del servizio studi social interactions in high school
TRANSCRIPT

Temi di discussionedel Servizio Studi
Social interactions in high school:Lessons from an earthquake
Number 596 - September 2006
by Piero Cipollone and Alfonso Rosolia

The purpose of the Temi di discussione series is to promote the circulation of workingpapers prepared within the Bank of Italy or presented in Bank seminars by outsideeconomists with the aim of stimulating comments and suggestions.
The views expressed in the articles are those of the authors and do not involve theresponsibility of the Bank.
Editorial Board: GIORGIO GOBBI, MARCELLO BOFONDI, MICHELE CAIVANO, STEFANO IEZZI, ANDREA LAMORGESE, MARCELLO PERICOLI, MASSIMO SBRACIA, ALESSANDRO SECCHI, PIETRO TOMMASINO.Editorial Assistants: ROBERTO MARANO, ALESSANDRA PICCININI.

SOCIAL INTERACTIONS IN HIGH SCHOOL: LESSONS FROM AN EARTHQUAKE.
by Piero Cipollone∗ and Alfonso Rosolia *
Abstract
We provide new evidence on the impact of peer effects on the schooling decisions of teenagers. In November 1980 a major earthquake hit Southern Italy. In the aftermath, young men from certain towns were exempted from compulsory military service. We show that the exemption raised high school graduation rates of boys by more than 2 percentage points by comparing high school graduation rates of young exempt men and older not exempt men from the least damaged areas and men of the same age groups from nearby towns that were not hit by the quake. Similar comparisons show that graduation rates of young women in the affected areas rose by about 2 percentage points. Since in Italy women are not subject to drafting, we interpret these findings as evidence of social effects of the decision of teenage boys of staying longer in school on that of teenage girls. Our estimates suggest that an increase of 1 percentage point of male graduation rates raises female probability of completing high school by about 0.7-0.8 percentage points. A series of robustness checks, including comparisons across different age groups and with different definitions of the comparison areas, suggest that the rise was due to the earthquake-related exemption, rather than other factors.
JEL classification: I21, C90, C23. Keywords: social interactions, peer effects, schooling, compulsory military service.
Contents
1. Introduction...........................................................................................................................72. The institutional setting.......................................................................................................113. The research design.............................................................................................................154. Results ...........................................................................................................................215. Robustness checks ..............................................................................................................266. Concluding remarks ............................................................................................................31Tables and Figures ..................................................................................................................33References...............................................................................................................................41
∗ Bank of Italy, Economic Research Department.

1 Introduction1
The role of peers for individual schooling performances is a widely investigated issue
(Hoxby (2000), Angrist and Lang (2004), Hanushek, Kain, Markman and Rivkin (2001),
Sacerdote (2001), Zimmerman (2003), Kremer, Miguel and Thornton (2004))2. The ex-
istence of peer effects has implications for the correct assessment of a number of issues:
competition among private and public schools, school-finance and control systems3, ability
tracking4, desegregation programs such as Metco, Moving to Opportunity, etc.5.
We contribute to the literature on peer effects by providing evidence on the causal
effect of the schooling achievement of young men on those of young women. Identification
hinges on an exogenous shock to the probability of boys of graduating from high school.
We exploit the exemption from compulsory military service (CMS) granted to few specific
cohorts of males living in southern Italy as a result of an earthquake hitting this area in
1We are indebted to Josh Angrist, David Card and Antonio Ciccone for their detailed comments andsuggestions at various stages of this project. We also thank Andrea Brandolini, Ken Chay, FedericoCingano, Armin Falk, Andrea Ichino, Juan Jimeno, Brian Krauth, Marco Magnani, Matthias Messner,Monica Paiella, Sevi Rodriguez-Mora, Enrico Moretti, Jesse Rothstein, Emmanuel Saez, Gilles Saint-Paul,Alessandro Secchi, Roberto Torrini, Fabrizio Venditti, and seminar participants at the Banff Workshopon Experimental and Non-Experimental Evaluations of Peer Group and Other Effects, Bank of Italy,European University Institute, IZA-Bonn, University of California at Berkeley, University of Padua,Universitat Pompeu Fabra, 2004 Winter Meeting of the Econometric Society, 2003 EEA-ESEM, 2003EALE, 2003 AIEL. We also thank Manuela Brunori, Lt. C. Pietro Canale, Angela Cheche, FedericoGiorgi, Giovanni Iuzzolino, Federica Lagna, Maurizio Lucarelli, Raffaella Nizzi, Simona Paci, GiovanniSeri, Carla Tolu for providing and helping us with the data and the legal aspects. We are the soleresponsible for any mistake. The views expressed in this paper do not necessarily reflect those of theBank of Italy. Correspondence: Research Department, Bank of Italy, Via Nazionale 91, 00184 - Roma -Italy. Email: [email protected], [email protected]
2A growing body of empirical literature has documented the existence of such peer effects in manyfields other than schooling. Among others, Case and Katz (1991), Glaeser, Sacerdote and Scheinkman(1996), Falk and Ichino (2003), Falk and Fischbacher (2002), Grinblatt, Keloharju and Ikaheimo (2004),Duflo and Saez (2003), Miguel and Kremer (2004), Bertrand, Luttmer and Mullainathan (2000), Katz,Kling and Liebman (2001), Lalive (2003), Ichino and Maggi (2000), Topa (2001), Gaviria and Raphael(2001).
3Epple and Romano (1998), Angrist, Bettinger, Bloom, King and Kremer (2002), Hsieh and Urquiola(2003), Winston and Zimmerman (2003).
4Epple, Newlon and Romano (2002), Figlio and Page (2002), Hanushek and Woessmann (2005).5Katz et al. (2001), Ludwig, Duncan and Hirschfield (2001), Angrist and Lang (2004).
8
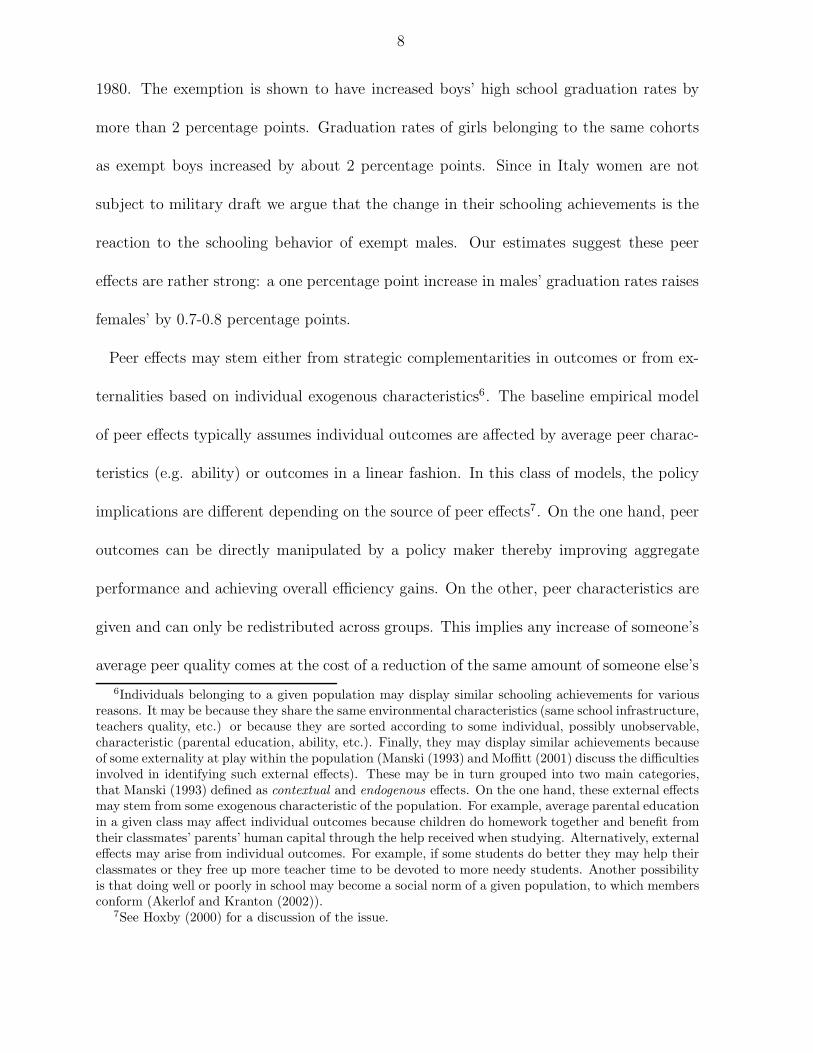
1980. The exemption is shown to have increased boys’ high school graduation rates by
more than 2 percentage points. Graduation rates of girls belonging to the same cohorts
as exempt boys increased by about 2 percentage points. Since in Italy women are not
subject to military draft we argue that the change in their schooling achievements is the
reaction to the schooling behavior of exempt males. Our estimates suggest these peer
effects are rather strong: a one percentage point increase in males’ graduation rates raises
females’ by 0.7-0.8 percentage points.
Peer effects may stem either from strategic complementarities in outcomes or from ex-
ternalities based on individual exogenous characteristics6. The baseline empirical model
of peer effects typically assumes individual outcomes are affected by average peer charac-
teristics (e.g. ability) or outcomes in a linear fashion. In this class of models, the policy
implications are different depending on the source of peer effects7. On the one hand, peer
outcomes can be directly manipulated by a policy maker thereby improving aggregate
performance and achieving overall efficiency gains. On the other, peer characteristics are
given and can only be redistributed across groups. This implies any increase of someone’s
average peer quality comes at the cost of a reduction of the same amount of someone else’s
6Individuals belonging to a given population may display similar schooling achievements for variousreasons. It may be because they share the same environmental characteristics (same school infrastructure,teachers quality, etc.) or because they are sorted according to some individual, possibly unobservable,characteristic (parental education, ability, etc.). Finally, they may display similar achievements becauseof some externality at play within the population (Manski (1993) and Moffitt (2001) discuss the difficultiesinvolved in identifying such external effects). These may be in turn grouped into two main categories,that Manski (1993) defined as contextual and endogenous effects. On the one hand, these external effectsmay stem from some exogenous characteristic of the population. For example, average parental educationin a given class may affect individual outcomes because children do homework together and benefit fromtheir classmates’ parents’ human capital through the help received when studying. Alternatively, externaleffects may arise from individual outcomes. For example, if some students do better they may help theirclassmates or they free up more teacher time to be devoted to more needy students. Another possibilityis that doing well or poorly in school may become a social norm of a given population, to which membersconform (Akerlof and Kranton (2002)).
7See Hoxby (2000) for a discussion of the issue.

9
average peer quality thereby leaving unchanged their overall average outcome. However,
the previous literature has been unable to disentangle these two sources because peer out-
comes are generally instrumented with group composition (Sacerdote (2001), Zimmerman
(2003), Hoxby (2000), Angrist and Lang (2004), Hanushek et al. (2001))8. In our setting
the underlying exogenous characteristics of the group of peers (the boys) are unlikely to
be modified by the instrument, thereby ensuring that we identify the response of girls’
schooling outcomes to boys’ schooling outcomes rather than to boys’ characteristics.
Our results are based on comparisons of the schooling attainments of exempt and not
exempt cohorts belonging to the least damaged towns and those of comparable cohorts
in nearby towns not hit by the quake. The identification strategy is similar in spirit to
those exploited in recent works by Duflo and Saez (2003), Miguel and Kremer (2004)
and Kremer et al. (2004). In these works, identification of the strength of peer effects is
achieved by means of a partial-population intervention, that is by studying how the treat-
ment status of well-identified individuals in a given group affects outcomes of untreated
individuals in the same group. Duflo and Saez (2003) run an experiment where only some
individuals randomly selected within certain university departments of a North-American
university are informed about an advertisement fair concerning a retirement scheme. They
find strong social effects as concerns fair attendance which in turn reflect on the decision
to join the advertised savings program. Miguel and Kremer (2004) study externalities to
medical treatments in subsaharan Africa. Identification is based on a randomized school-
based mass treatment with deworming drugs. They show that the deworming program
8An alternative approach is developed in Glaeser, Sacerdote and Scheinkman (2002) and related works.It consists in comparing individual and aggregate estimated coefficients or in analyzing the spatial varianceof the phenomena of interest (Glaeser et al. (1996)). See Manski (2000) and Moffitt (2001) for a reviewof the different approaches.

10
substantially improved outcomes (school attendance and health status) of untreated chil-
dren. Kremer et al. (2004) is closest to our paper. They evaluate the effects of a merit
scholarship program on adolescent girls’ academic exam scores. They find girls’ scores
increased significantly in schools randomly selected for the program; positive effects of
the program are also found on test scores of boys, ineligible for the awards, and of lower
achieving girls, unlikely to win the award.
We also contribute to the literature that quantifies the effects of military conscription
on schooling. Previous studies have mainly focused on the causal relationship between
subsequent earnings and veteran status (Angrist and Krueger (1989), Angrist (1990),
Imbens and van der Klaauw (1995)). To our knowledge, only Angrist and Krueger (1992)
and Card and Lemieux (2001) address an issue similar to ours showing that draft avoidance
behaviors increased college enrollment and graduation rates of potential draftees in the
Vietnam-era suggesting that absent conscription college enrollment rates would be lower.
This is only apparently in contrast with our findings since, differently from ours, in their
setting serving in the military would generally imply being sent to war.
An approximate idea of the potential aggregate impact of such peer effects in terms
of per capita GDP can be obtained from recent OECD estimates of the elasticity of
steady-state per capita GDP to average years of education (OECD (2003)). Our results
suggest that a permanent increase of 1 percentage point of male high-school graduation
rates would permanently raise per capita GDP by about one fourth of a percentage point;
neglecting the effect of male schooling on girls’ would underestimate the increase by about
as much as one tenth of a percentage point. Our findings also magnify the social returns
to education implied by recent estimates of the causal effects of schooling on various

11
relevant outcomes identified in recent years (Acemoglu and Angrist (2000), Moretti (2004),
Lochner and Moretti (2004), Bresnahan, Brynjolfssonn and Hitt (2002), Sacerdote (2002),
Currie and Moretti (2003), Lleras-Muney (2005)).
The paper proceeds as follows. The next section illustrates the institutional setting:
we briefly describe how CMS works in Italy, motivate why the exemption from CMS
modifies male teenagers’ schooling choices and review the interventions undertaken in the
aftermath of the quake. Section (3) describes the research design and provides elements
in favor of the main identifying assumptions. We then present the main results of the
paper and provide additional robustness checks. Section (6) concludes.
2 The institutional setting
Compulsory military service and schooling choices
Until recently military service was an obligation for all Italian males9. In the early eighties,
the period we are interested in, the length of the service was twelve months10. All boys
would undergo a thorough medical assessment administered by military authorities in
the year they turned 18 to establish their suitability for military service. Upon passing
these medical exams boys would be inducted as they turned 1911. Therefore, the medical
9Women were not allowed to enter military corps, not even on a voluntary basis. In recent years theobligation has been canceled and military service has become a voluntary service open to both sexes.
10Service would last 18 months if drafted in the Navy. In the late ’90s compulsory service was shortenedto 10 months.
11The reasons for exoneration from service are strictly coded and quite restrictive. They typicallyrequire main physical disabilities or serious mental disorders. They must be ascertained by militaryqualified medical personnel in a thorough three-days visit. Military service could as well be replaced bycivil service under specific circumstances (conscientious objector status). In the eighties the length ofthis alternative service was longer than normal military service (24 months). The draftee would file arequest for alternative service and after some months he would be called before a military commission tomotivate and defend his request.
12
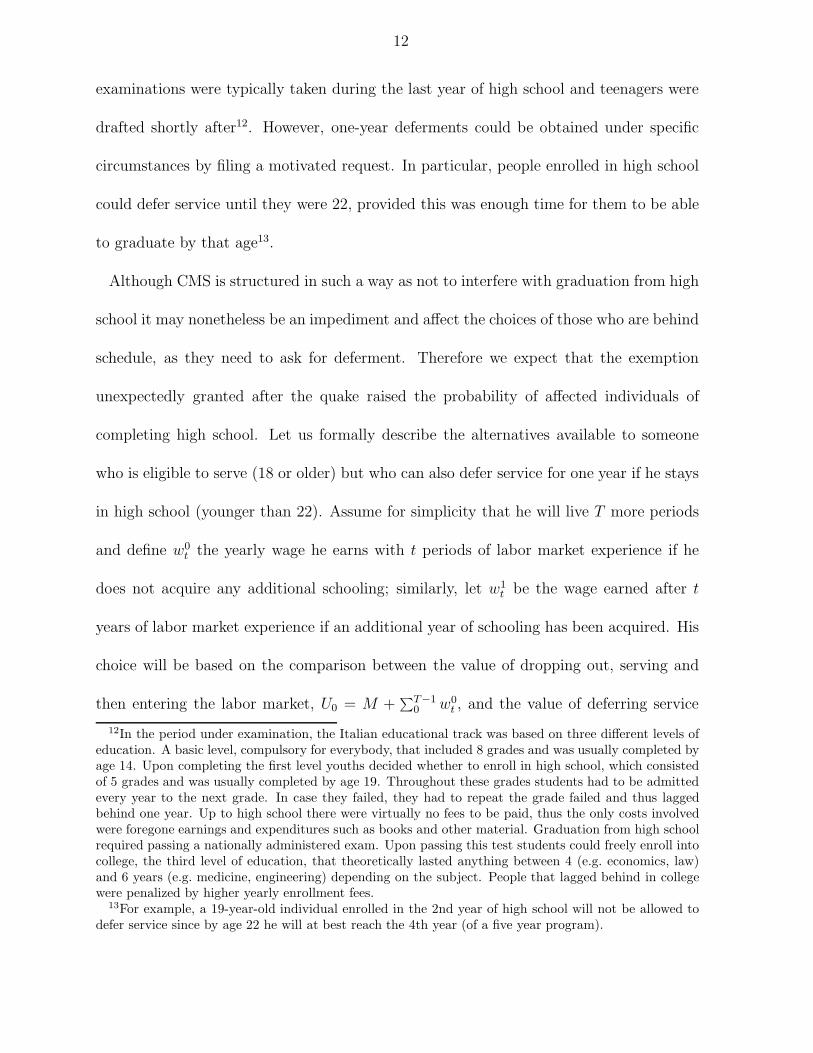
examinations were typically taken during the last year of high school and teenagers were
drafted shortly after12. However, one-year deferments could be obtained under specific
circumstances by filing a motivated request. In particular, people enrolled in high school
could defer service until they were 22, provided this was enough time for them to be able
to graduate by that age13.
Although CMS is structured in such a way as not to interfere with graduation from high
school it may nonetheless be an impediment and affect the choices of those who are behind
schedule, as they need to ask for deferment. Therefore we expect that the exemption
unexpectedly granted after the quake raised the probability of affected individuals of
completing high school. Let us formally describe the alternatives available to someone
who is eligible to serve (18 or older) but who can also defer service for one year if he stays
in high school (younger than 22). Assume for simplicity that he will live T more periods
and define w0
t the yearly wage he earns with t periods of labor market experience if he
does not acquire any additional schooling; similarly, let w1
t be the wage earned after t
years of labor market experience if an additional year of schooling has been acquired. His
choice will be based on the comparison between the value of dropping out, serving and
then entering the labor market, U0 = M +∑T−1
0w0
t , and the value of deferring service
12In the period under examination, the Italian educational track was based on three different levels ofeducation. A basic level, compulsory for everybody, that included 8 grades and was usually completed byage 14. Upon completing the first level youths decided whether to enroll in high school, which consistedof 5 grades and was usually completed by age 19. Throughout these grades students had to be admittedevery year to the next grade. In case they failed, they had to repeat the grade failed and thus laggedbehind one year. Up to high school there were virtually no fees to be paid, thus the only costs involvedwere foregone earnings and expenditures such as books and other material. Graduation from high schoolrequired passing a nationally administered exam. Upon passing this test students could freely enroll intocollege, the third level of education, that theoretically lasted anything between 4 (e.g. economics, law)and 6 years (e.g. medicine, engineering) depending on the subject. People that lagged behind in collegewere penalized by higher yearly enrollment fees.
13For example, a 19-year-old individual enrolled in the 2nd year of high school will not be allowed todefer service since by age 22 he will at best reach the 4th year (of a five year program).

13
one year, serving and then entering the labor market, U1 = S + M +∑T−2
0w1
t , where
S is a measure of the period cost/gain of spending one year in school and M is the
period cost/gain of spending it in service14. He will drop out and serve in the military if
∑T−1
0w0
t > S +∑T−2
0w1
t . Assume now an alternative setting where there is no obligation
to serve. In this simple framework this additional year can be spent either in school or in
the labor market. To see how alternatives change, it is enough to substitute M with w0
T
in the expression for U0 and with w1
T−1in U1; that is, the values of earnings in the last
period of life that, as such, embeds all the previous labor market experience. Provided
the returns to an additional year of education are higher than those to an additional year
of labor market experience (w1
T−1> w0
T ), absent CMS the incentives to stay in school
increase15.
The earthquake-related interventions
Figure (1) shows the area of southern Italy hit by a major earthquake in November 1980;
the area hosted more than 5 million people, about 10 percent of the Italian population,
spread over 650 towns. Shortly after the quake Parliament precisely defined the area to be
considered as damaged and to be targeted by relief measures; they also defined the amount
14We neglect discounting to keep notation simple. The basic argument still holds. In particular, undermild conditions it can be shown that the incentive to stay in school increases provided the differencebetween returns to schooling and those to experience is larger than the discount rate. We also assumefor simplicity that there is no retirement decision.
15It could be argued that deferring service has a value of its own. For example, in the Vietnam era,success in deferring the draft would sensibly increase the probability of not going to war. In Hollandservice might be deferred because one expects a mass exemption (Imbens and van der Klaauw (1995)).In Italy, as we have detailed above, military service was compulsory and high school students had toserve by the age of 22. Therefore, deferring the draft would not increase the probability of not servingor of being included in mass exemptions. Moreover, there is no incentive in deferring service to avoida military conflict since Italy has not been in war over the past 60 years and peace-keeping missions(Kosovo, Afghanistan, Somalia, Iraq, etc.) are generally run by volunteers and professionals.
14
and guidelines for the assignment of the funds allocated to this purpose16. Entitlement
to financial aids depended on the magnitude of the damages suffered as certified by the
authorities; no money accrued to municipalities where no family had suffered damage.
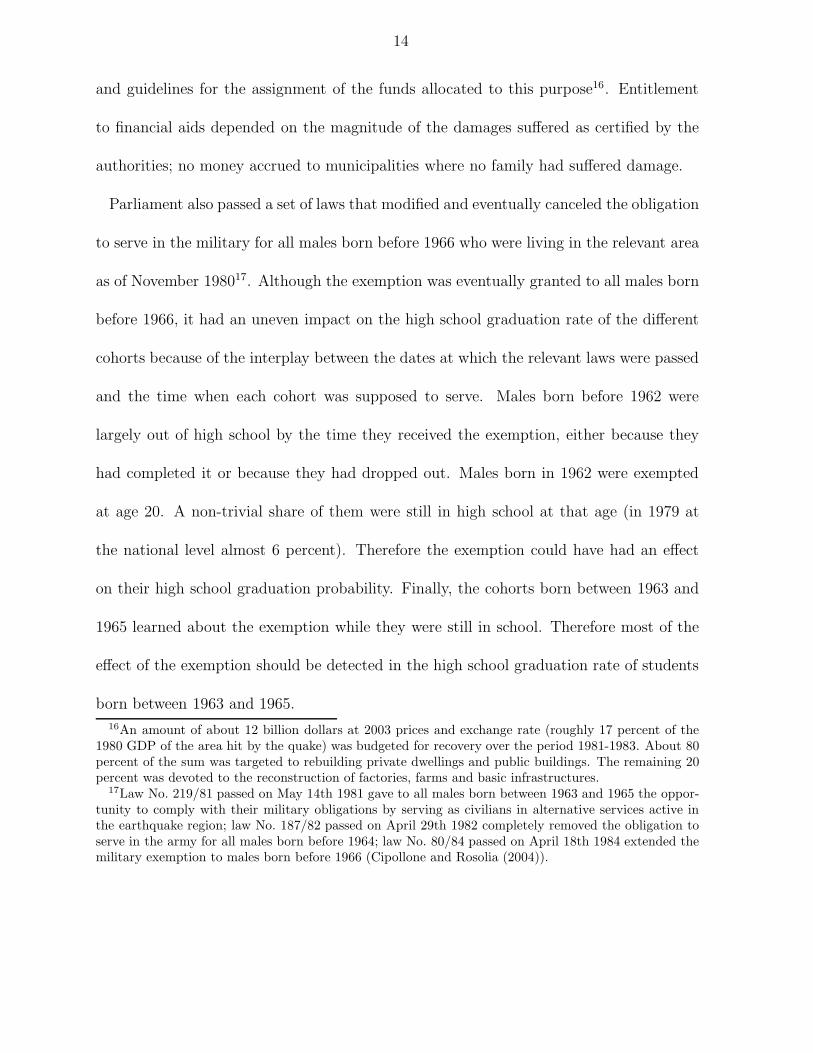
Parliament also passed a set of laws that modified and eventually canceled the obligation
to serve in the military for all males born before 1966 who were living in the relevant area
as of November 198017. Although the exemption was eventually granted to all males born
before 1966, it had an uneven impact on the high school graduation rate of the different
cohorts because of the interplay between the dates at which the relevant laws were passed
and the time when each cohort was supposed to serve. Males born before 1962 were
largely out of high school by the time they received the exemption, either because they
had completed it or because they had dropped out. Males born in 1962 were exempted
at age 20. A non-trivial share of them were still in high school at that age (in 1979 at
the national level almost 6 percent). Therefore the exemption could have had an effect
on their high school graduation probability. Finally, the cohorts born between 1963 and
1965 learned about the exemption while they were still in school. Therefore most of the
effect of the exemption should be detected in the high school graduation rate of students
born between 1963 and 1965.
16An amount of about 12 billion dollars at 2003 prices and exchange rate (roughly 17 percent of the1980 GDP of the area hit by the quake) was budgeted for recovery over the period 1981-1983. About 80percent of the sum was targeted to rebuilding private dwellings and public buildings. The remaining 20percent was devoted to the reconstruction of factories, farms and basic infrastructures.
17Law No. 219/81 passed on May 14th 1981 gave to all males born between 1963 and 1965 the oppor-tunity to comply with their military obligations by serving as civilians in alternative services active inthe earthquake region; law No. 187/82 passed on April 29th 1982 completely removed the obligation toserve in the army for all males born before 1964; law No. 80/84 passed on April 18th 1984 extended themilitary exemption to males born before 1966 (Cipollone and Rosolia (2004)).

15
3 The research design
Identification of the causal effect of male high school graduation rates on the probability
of girls completing high school requires that the exogenous shifter of boys’ schooling
attainments be not a direct determinant of women’ success in graduating. Exemption
from CMS is a candidate instrument: while affecting the incentives to stay in school for
males, it does not directly enter females’ choices since they are not subject to drafting.
However, two features of the exemption might hamper its validity as an instrument.
First, it was caused by the 1980 earthquake, which generally led to disruptions of eco-
nomic life and government interventions that potentially altered individual schooling at-
tainments18. In this case the exemption would not be a valid instrument because of the
correlation with a shock that directly affected the schooling of both males and females.
This is a serious concern because in many towns the quake was quite disruptive. For
example, according to the official damage assessment there were around 2,000 deaths,
mostly in the epicentre, 10,000 injured and around 300,000 people in need of shelter; 60
percent of the houses in the epicentre were destroyed or severely damaged and 33 percent
required structural intervention to restore habitability; outside the epicentre there were
less damages but still 20 percent of the houses was inhabitable and structural interven-
tion was required for another 30 percent. These direct shocks along with the subsequent
income transfers and other quake-induced relief measures probably had a direct impact
on the choice or the possibility of staying in school of the younger cohorts. Second, the
exemption is age-specific so that any other cohort-specific shock to schooling outcomes
18For example, children may have not attended school for some time or households may have receivedincome transfers.

16
may act as a confounding factor.
To break the correlation between the exemption from CMS and other quake-related
shocks that might directly affect individual schooling we limit our attention to towns
that, albeit targeted by quake-related interventions, were the least affected by the earth-
quake according to the official evaluations performed by the government in the aftermath
(henceforth, treated towns). Treated towns in our sample therefore only include those
located at the boundary of the earthquake area as defined by the government, the far-
thest away from the epicenter, but still in the area exempt from military service. There
are 57 of these towns, with a population of about 300,000 people at the end of 1979; 18
out of 57 towns, although included in the area officially involved in the quake, recorded
no damage; 15 towns ranked at the very lowest level of the damage scale, meaning only
very mild and limited damage was suffered; the next 15 towns ranked below the median
damage score and the remaining ones were slightly above19. As a whole, treated towns
were largely unaffected by the earthquake and therefore by quake-related interventions
other than the age-sex specific exemption.
To control for cohort specific shocks we compare the evolution of cohort schooling at-
tainments in treated towns with that of schooling attainments of comparable cohorts in
towns just outside the earthquake region and neighbouring on at least one treated town
(henceforth, control towns). This rule selects 60 more towns, with a total population of
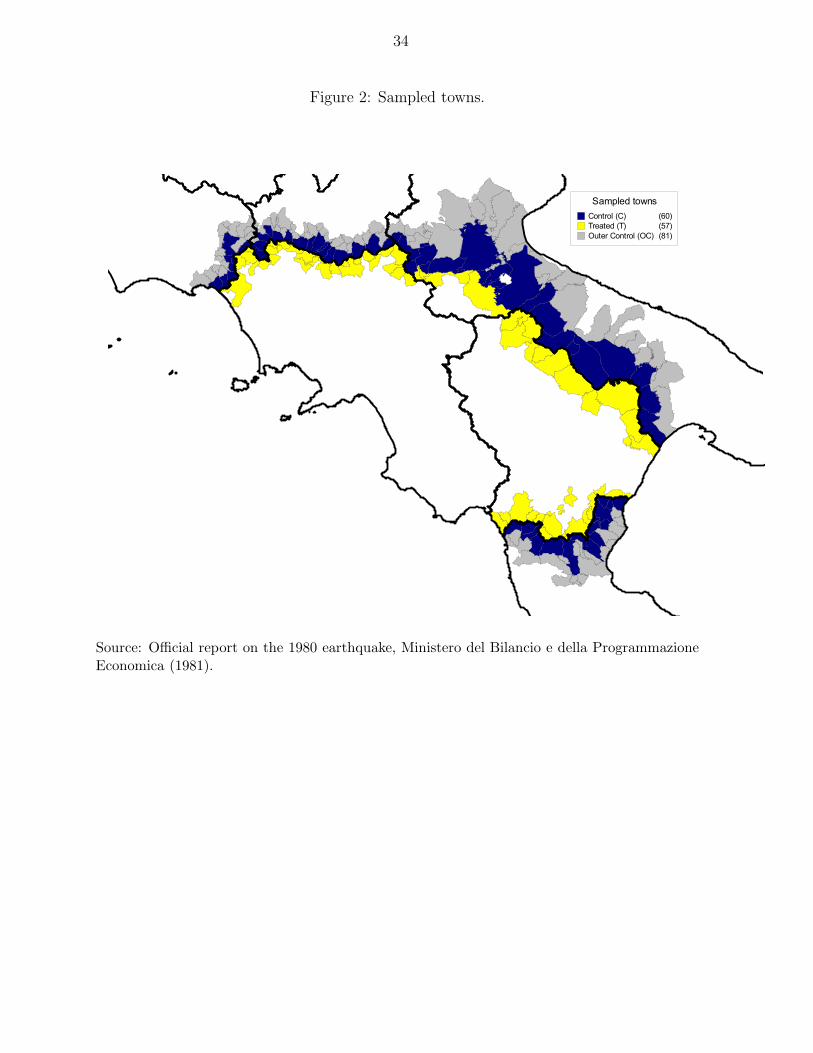
about 600,000 people at the end of 1979. The final sample therefore includes 117 towns
belonging to 12 provinces of 5 regions with a total population of about 900,000 people at
the end of 1979 (Figure 2).
19Additional details are provided in Cipollone and Rosolia (2004).
17
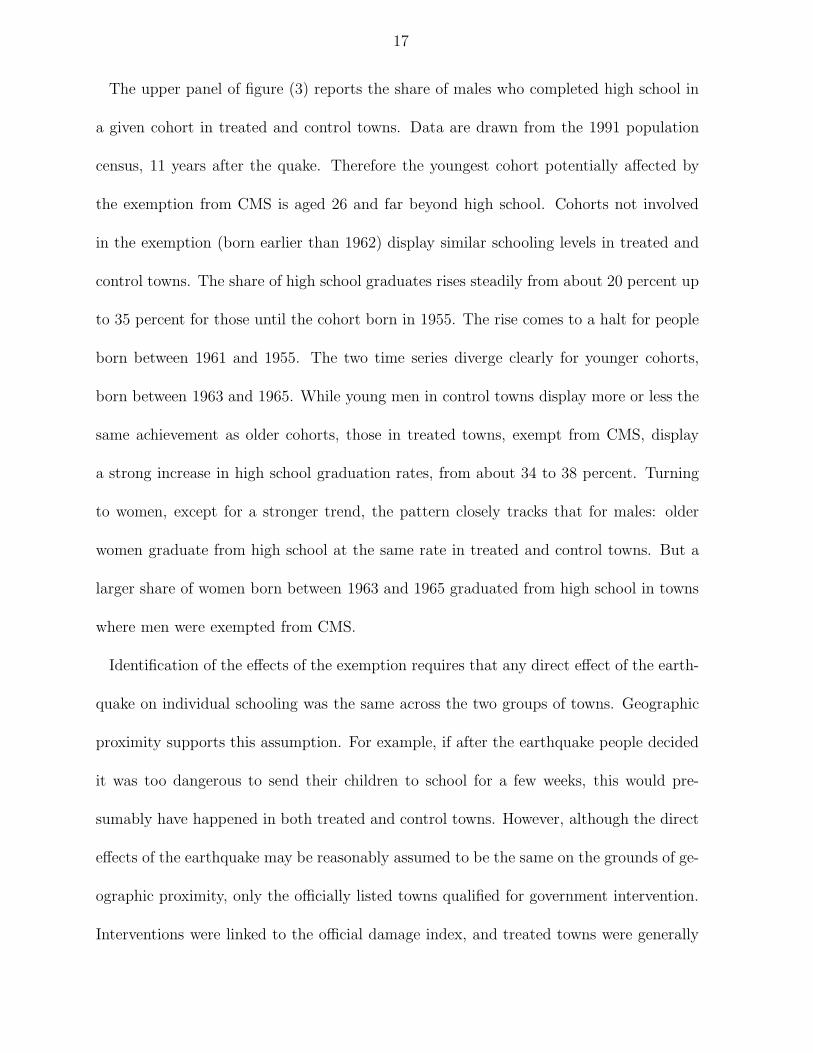
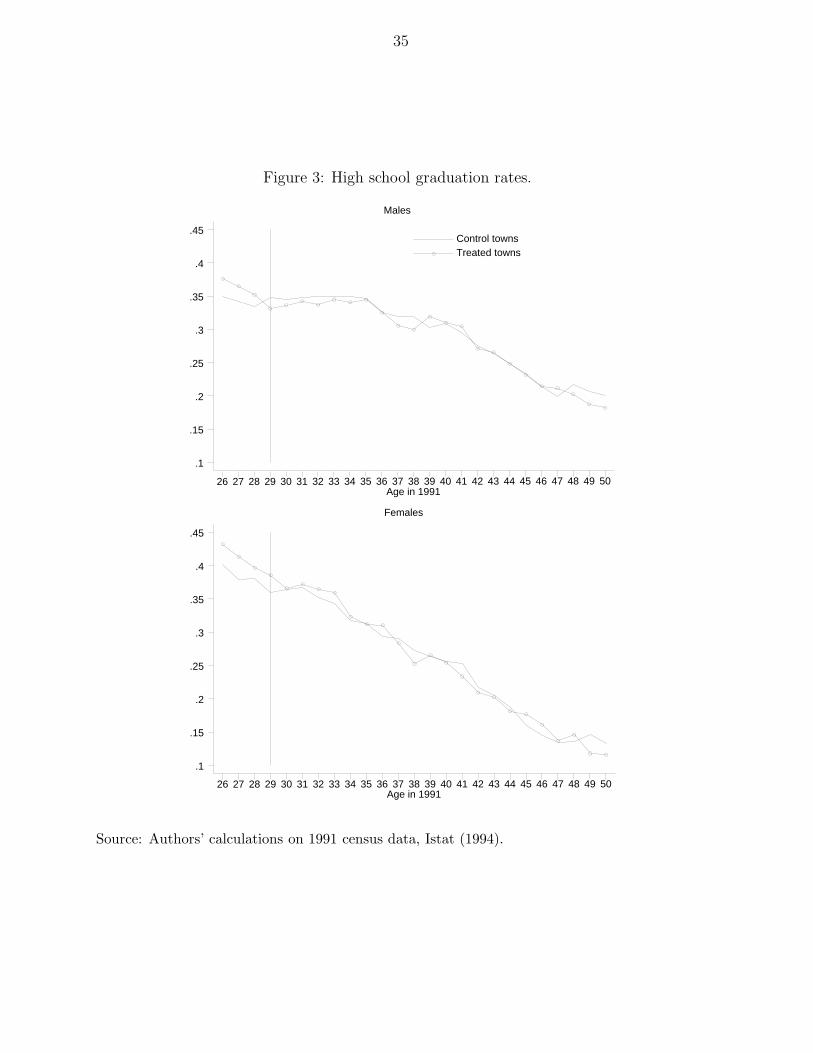
The upper panel of figure (3) reports the share of males who completed high school in
a given cohort in treated and control towns. Data are drawn from the 1991 population
census, 11 years after the quake. Therefore the youngest cohort potentially affected by
the exemption from CMS is aged 26 and far beyond high school. Cohorts not involved
in the exemption (born earlier than 1962) display similar schooling levels in treated and
control towns. The share of high school graduates rises steadily from about 20 percent up
to 35 percent for those until the cohort born in 1955. The rise comes to a halt for people
born between 1961 and 1955. The two time series diverge clearly for younger cohorts,
born between 1963 and 1965. While young men in control towns display more or less the
same achievement as older cohorts, those in treated towns, exempt from CMS, display
a strong increase in high school graduation rates, from about 34 to 38 percent. Turning
to women, except for a stronger trend, the pattern closely tracks that for males: older
women graduate from high school at the same rate in treated and control towns. But a
larger share of women born between 1963 and 1965 graduated from high school in towns
where men were exempted from CMS.
Identification of the effects of the exemption requires that any direct effect of the earth-
quake on individual schooling was the same across the two groups of towns. Geographic
proximity supports this assumption. For example, if after the earthquake people decided
it was too dangerous to send their children to school for a few weeks, this would pre-
sumably have happened in both treated and control towns. However, although the direct
effects of the earthquake may be reasonably assumed to be the same on the grounds of ge-
ographic proximity, only the officially listed towns qualified for government intervention.
Interventions were linked to the official damage index, and treated towns were generally

18
at the low end of the damage scale, thus at best qualifying only for limited help. To
allay concerns that the main findings are driven by some omitted intervention, robustness
checks will also be performed on the subset of exempt towns that did not record any
damage whatsoever or were at the very bottom of the official damage scale and their
neighboring towns.
Geographical proximity also implies that treated and control towns are embedded in
the same economic environment, so that any market interaction that could possibly bias
the results is taken care of. For example, since these individuals work in broadly the
same labor markets, any cohort-sex (possibly quake-related) specific labor market shock
is controlled for. Thus, if the earthquake brought about an increase in the high school wage
premium in the local market (for example, because a more skilled labor force was needed
for reconstruction) this would have affected in the same way the choices of comparable
individuals in the control towns. By the same token, if the net benefits of completing
high school went down because of an increase in college attendance costs (say, the closest
colleges were damaged), they decreased equally in both groups of towns since individuals
in neighboring towns may access the same set of colleges.
Table (1) compares several characteristics of treated and control towns. Treated towns
turn out to be higher on the sea level, less densely inhabited and smaller. In the econo-
metric specification these features are picked up by town fixed effects; however, robustness
checks will also be conducted on samples ridden of the larger towns driving the above dif-
ferences. Pre-treatment migration behaviour is not statistically different between treated
and control towns, but treated towns display slightly lower birth and higher death rates,
19
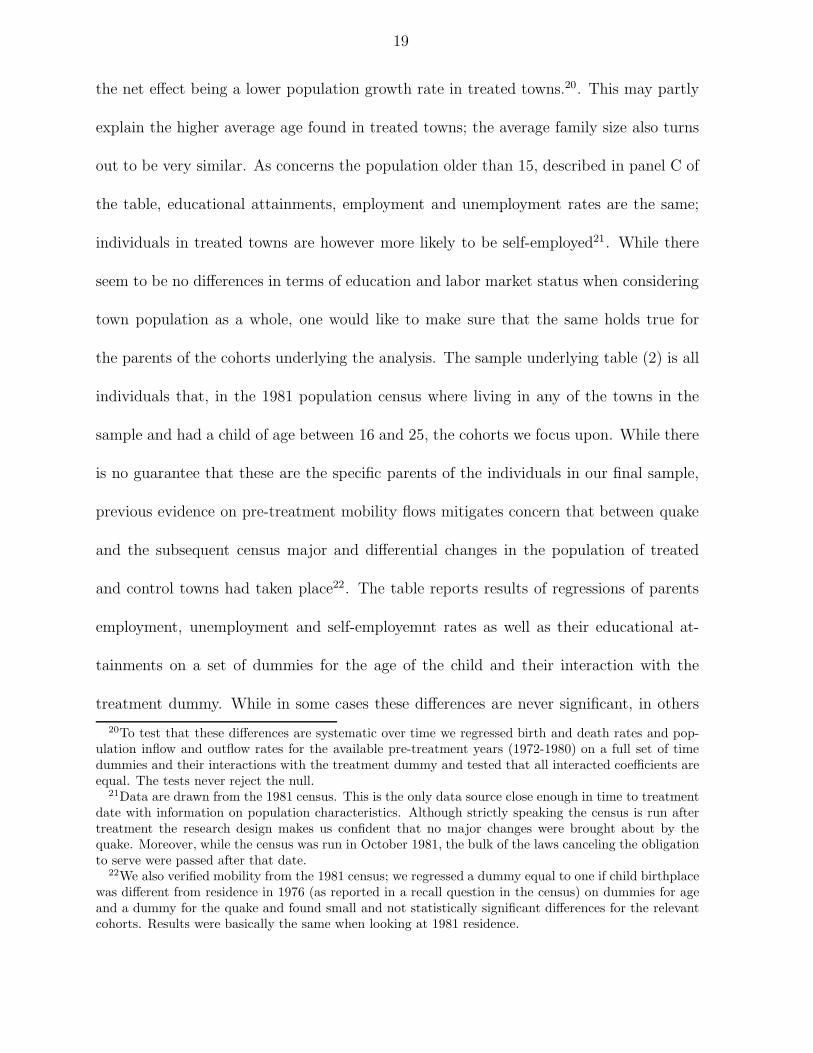
the net effect being a lower population growth rate in treated towns.20. This may partly
explain the higher average age found in treated towns; the average family size also turns
out to be very similar. As concerns the population older than 15, described in panel C of
the table, educational attainments, employment and unemployment rates are the same;
individuals in treated towns are however more likely to be self-employed21. While there
seem to be no differences in terms of education and labor market status when considering
town population as a whole, one would like to make sure that the same holds true for
the parents of the cohorts underlying the analysis. The sample underlying table (2) is all
individuals that, in the 1981 population census where living in any of the towns in the
sample and had a child of age between 16 and 25, the cohorts we focus upon. While there
is no guarantee that these are the specific parents of the individuals in our final sample,
previous evidence on pre-treatment mobility flows mitigates concern that between quake
and the subsequent census major and differential changes in the population of treated
and control towns had taken place22. The table reports results of regressions of parents
employment, unemployment and self-employemnt rates as well as their educational at-
tainments on a set of dummies for the age of the child and their interaction with the
treatment dummy. While in some cases these differences are never significant, in others
20To test that these differences are systematic over time we regressed birth and death rates and pop-ulation inflow and outflow rates for the available pre-treatment years (1972-1980) on a full set of timedummies and their interactions with the treatment dummy and tested that all interacted coefficients areequal. The tests never reject the null.
21Data are drawn from the 1981 census. This is the only data source close enough in time to treatmentdate with information on population characteristics. Although strictly speaking the census is run aftertreatment the research design makes us confident that no major changes were brought about by thequake. Moreover, while the census was run in October 1981, the bulk of the laws canceling the obligationto serve were passed after that date.
22We also verified mobility from the 1981 census; we regressed a dummy equal to one if child birthplacewas different from residence in 1976 (as reported in a recall question in the census) on dummies for ageand a dummy for the quake and found small and not statistically significant differences for the relevantcohorts. Results were basically the same when looking at 1981 residence.

20
they turn out to be. However, F-tests that these differences in parental characteristics
are constant across cohorts never rejecet the null. Once again, town fixed effects should
account for this heterogeneity. Still, our specifications will include these characteristics in
the information set.
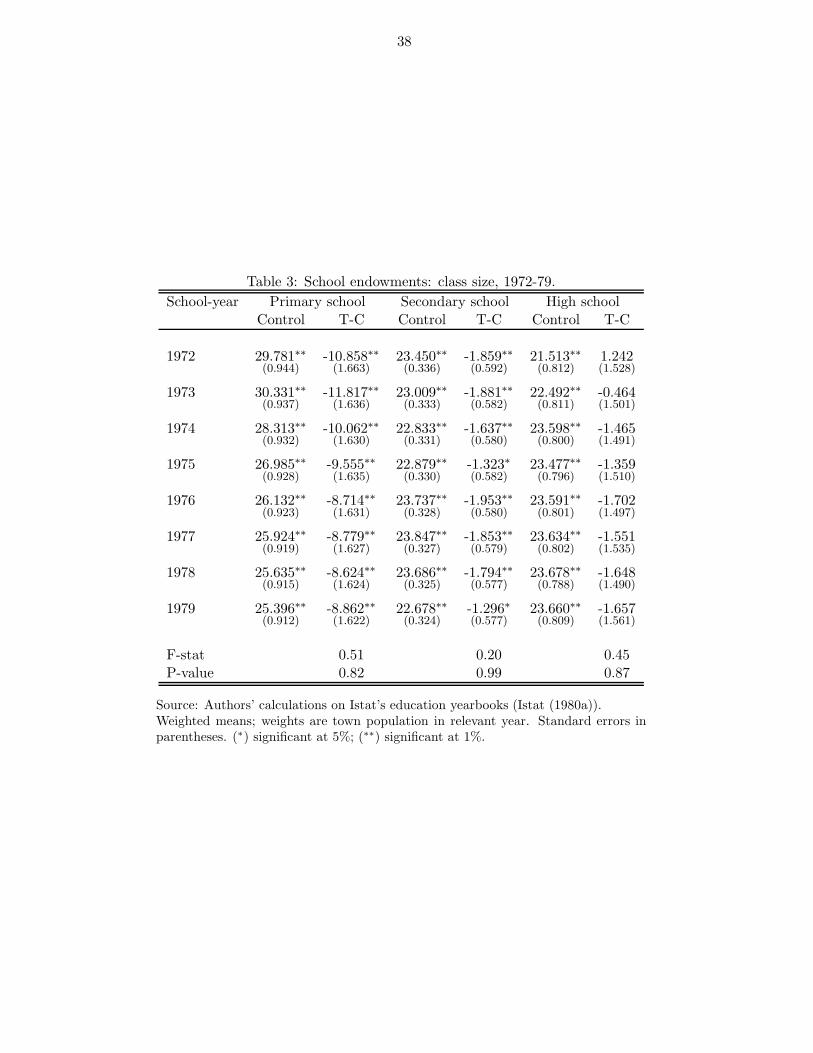
Several authors have shown the importance of class size, pupils-teacher ratios and in
general per-capita resources devoted to schooling for individual school outcomes (Card
and Krueger (1992), Angrist and Lavy (1999), Krueger (1999), Krueger and Whitmore
(2001))23. Table (3) reports the average class size in control and treated towns in pri-
mary, secondary and high school for the available pre-treatment school years. Statistically
significant differences in primary and secondary schools signal smaller classes in treated
towns. However, in both cases the null that these differences are constant over time can-
not be rejected. In the econometric specification, town fixed effects absorb systematic
differences in endowments across towns while (a quadratic of) cohort size will account
for changing per-capita resources within town. However, since differences are concen-
trated in lower grades (primary and secondary schools), to dissipate doubts that the main
findings are driven by differences in pre-treatment schooling attainments determined by
different school environments, we will perform robustness checks that explicitly control
for schooling attainments in secondary school.
To further ensure that the differences in school outcomes seen in figure (3) are due to
the exemption and not to confounding factors affecting both boys’ and girls’ schooling we
perform two additional falsification exercises. First, we assign treatment status to control
towns and exemption status to cohorts 26-28 from those towns and compare schooling
23See Hanushek (2003) for a critical review of the main results in this literature.

21
achievements with those of towns also outside the quake region (henceforth, outer control
towns; see figure (2)) and neighboring on control towns. Second, we assign exemption
status to cohorts aged 30-35 in 1991 in treated towns (indeed our control cohorts) and
compare their high school graduation rates across treated and control towns with that of
older cohorts aged 36-40 in 1991. Our results turn out to be robust to both exercises: we
find no difference in the schooling achievements of the fake treatment groups.
4 Results
We are interested in assessing the effect of male high school graduation rates on the
probability of a girl belonging to the same group graduating from high school:
yFicj = γFxicj + θyM
cj + µFj + νF
c + εicj (1)
where yFicj = 1 if girl i of cohort c in town j graduated and zero otherwise; xicj are
individual controls; yMcj is the share of males with at least a high school degree in cohort c
town j; µFj and νF
c are, respectively a town and a cohort fixed effect and εicj an i.i.d. shock.
The model determining girls’ school attainment laid out in equation (1) rests on the
assumption that the relevant group for the kind of interaction effect we are after (θ) is
the set of people belonging to the same cohort and born in the same town. In our sample
these are small groups, because sampled towns are generally small24. The size of the
median group in the sample is 45, only about twice the average high school class size
(see table (3)). The small town size implies that these people have most likely known
24A municipality is the smallest official territorial unit in Italy. The country is divided into about 8,100of them, with an average extension of 37 square kilometers. The median population is about 2,300 andthe 75th centile is only 5,200.

22
each other since childhood. They went to the same school in the early stages of their
education: in our sample there are on average 5 primary and 1.5 secondary schools per
town and respectively 8 and 9 classes per school. The structure of the Italian education
system is such that most of one’s classmates in the first year of a given grade (primary,
secondary, high school) will move together along the educational track up to the last year.
This means they spend four to six hours a day, six days a week together for eight years.
Moreover, the small size of the towns considerably raises the chances of getting to know
peers who are not classmates25. In this respect, this definition of group seems to be able
to capture productive externalities at work in the classroom as well as role models and
information transmitted by peers other than classmates26.
Direct evidence on the importance of peer interactions can be obtained from the 1998
wave of the Istat’s Indagine multiscopo sulle famiglie, soggetti sociali e condizioni dell’infanzia
(Istat (1998)), a multi-purpose survey that periodically collects information on about
21,000 households focusing on various aspects of family life27. The 1998 wave includes a
special section on people younger than 18 where information on schooling, leisure time and
social relationships are collected. As expected, teenagers go out very often (90 percent go
out several times a week); virtually everybody meets friends several times a week; three
quarters happen to go out with no particular purpose a few times a week (for example,
they take a walk down to the main square); they also go out with definite purposes: eat
25Additionally, in Italy driver’s licenses can be obtained only after turning 18 so that geographicmobilty of Italian teenagers is often very limited, more so in the area and years relevant for this paper,thus reinforcing the assumption that most of one’s social life at this age takes place in one’s hometown
26The definition of the relevant group is a fundamental issue in studies addressing peer and socialeffects. Manski (1993) shows how a mistaken definition may lead to tautological models. Another sourceof concern is that focusing on a superset of the true group may underestimate the strength of localinteractions if they become more diluted with some measure of distance.
27This survey is similar to the Canadian General Social Survey.
23
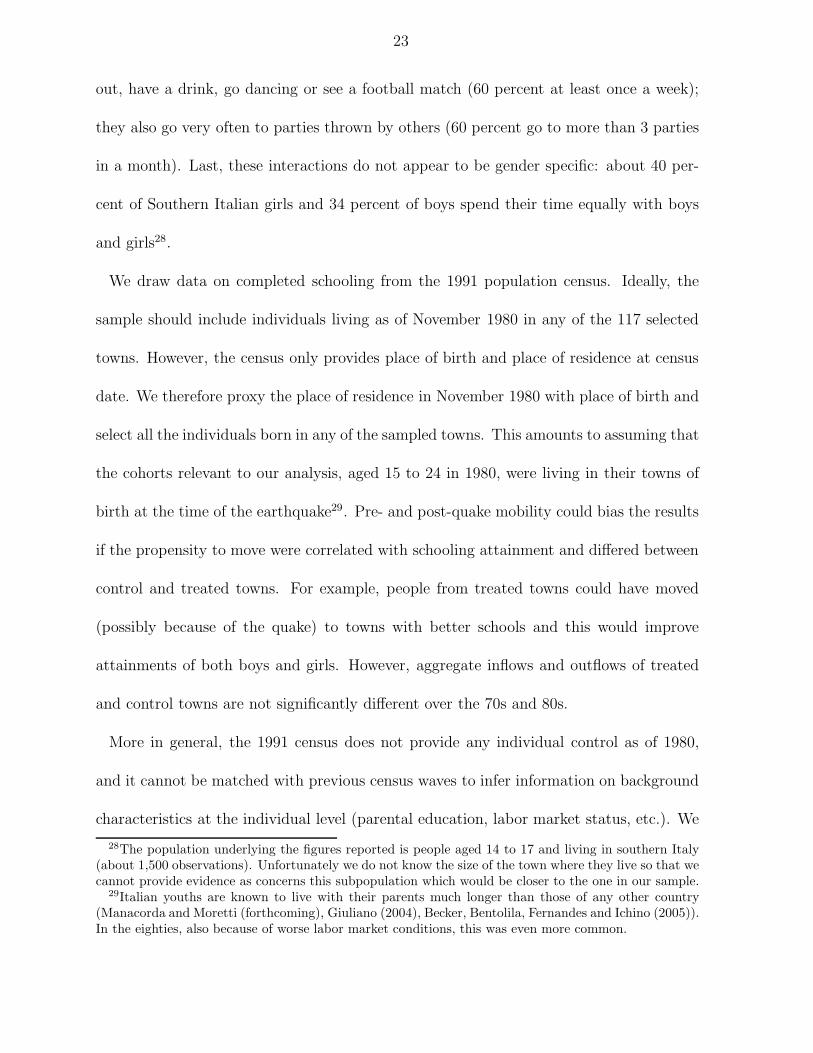
out, have a drink, go dancing or see a football match (60 percent at least once a week);
they also go very often to parties thrown by others (60 percent go to more than 3 parties
in a month). Last, these interactions do not appear to be gender specific: about 40 per-
cent of Southern Italian girls and 34 percent of boys spend their time equally with boys
and girls28.
We draw data on completed schooling from the 1991 population census. Ideally, the
sample should include individuals living as of November 1980 in any of the 117 selected
towns. However, the census only provides place of birth and place of residence at census
date. We therefore proxy the place of residence in November 1980 with place of birth and
select all the individuals born in any of the sampled towns. This amounts to assuming that
the cohorts relevant to our analysis, aged 15 to 24 in 1980, were living in their towns of
birth at the time of the earthquake29. Pre- and post-quake mobility could bias the results
if the propensity to move were correlated with schooling attainment and differed between
control and treated towns. For example, people from treated towns could have moved
(possibly because of the quake) to towns with better schools and this would improve
attainments of both boys and girls. However, aggregate inflows and outflows of treated
and control towns are not significantly different over the 70s and 80s.
More in general, the 1991 census does not provide any individual control as of 1980,
and it cannot be matched with previous census waves to infer information on background
characteristics at the individual level (parental education, labor market status, etc.). We
28The population underlying the figures reported is people aged 14 to 17 and living in southern Italy(about 1,500 observations). Unfortunately we do not know the size of the town where they live so that wecannot provide evidence as concerns this subpopulation which would be closer to the one in our sample.
29Italian youths are known to live with their parents much longer than those of any other country(Manacorda and Moretti (forthcoming), Giuliano (2004), Becker, Bentolila, Fernandes and Ichino (2005)).In the eighties, also because of worse labor market conditions, this was even more common.

24
therefore look at the effect of boys’ high school graduation rate on that of girls in the
same group. Equation (1) then becomes:
yFcj = γFxF
cj + θyMcj + µF
j + νFc + εF
cj (2)
Equation (2) is estimated on cohorts born between 1956 and 1965 (age 26 to 35 in 1991)
in one of the 117 sampled towns30. Exempt cohorts are those aged 26 to 28. Boys’ high
school graduation rate yMcj is instrumented with the exemption from CMS, a dummy equal
to one if town j is in the quake region and cohort c is aged 26-28 in 1991.
Table (4) reports first stage and reduced form estimates of the effect of the exemption
on boys’ and girls’ high school graduation rates and IV estimates of θ in equation (2)
for several specifications of the information set. The first row corresponds to a baseline
specification that only allows for cohort dummies and town fixed effects. First stage
results show that the exemption raised boys’ high school graduation rates by about 1.8
percentage points; even in this basic specification the effect is significant at the 5 percent
level. Reduced form estimates show that girls of the same age living in the same towns
as exempt boys also had a 1.25 percentage point higher probability of completing high
school; the effect on girls is however less precisely estimated. The implied causal effect of
boys’ graduation rate on girls’ is about 0.7, meaning that raising boys’ completion rates by
1 percentage point increases girls’ by around 0.7 percentage points. The Anderson-Rubin
test rejects the null of a zero effect with a 9 percent significance31.
The previous specification assumes all differences across towns are absorbed by town
30We exclude the cohort born in 1962 (age 29 in 1991). Their age when the relevant law was issued issuch that it is hard to make assumptions on whether and how they were affected.
31The Anderson-Rubin test has the correct size when the model is just-identified independently of thestrength of the first stage (Moreira (2001)).

25
fixed effects. The evidence discussed above shows that either differences across towns
in parental characteristics and school endowments are not statistically significant or that
they are systematic over time and cohorts. The next two rows of table (4) show that results
are robust to the introduction of explicit controls for these sources of heterogeneity across
towns and cohorts.
The second row of table (4) reports result for a specification that accounts for differences
in school endowments across cohorts. While a large body of literature has shown class size
is a determinant of individual school performance (Card and Krueger (1992), Angrist and
Lavy (1999), Krueger (1999), Krueger and Whitmore (2001)) we cannot assign to each
town-cohort a specific measure of class size since the available information is at town-
grade level. Still, we can control for cohort size. Given the limited age interval spanned
by the sample (9 subsequent cohorts) and the reasonably slow evolution of structural
school endowments most of the relevant variability is cross-sectional and is thus captured
by town fixed effects. Therefore, cohort size should proxy reasonably well for measures
of school congestion or the availability of per-capita resources for a specific cohort over
time. Indeed, Card and Lemieux (2000) find that larger cohorts have lower educational
attainment, possibly because of supply effects. The information set is augmented with a
second order polynomial in cohort size. First stage and reduced form results point to a
stronger and more significant effect of the exemption: boys’ graduation rates increased by
2.5 percentage points; girls’ by 1.8 percentage point. The implied causal effect is basically
unchanged but much more precisely estimated with a p-value of 1.4 percent.
The third row of table (4) further expands the information set by including controls for
parental labor market status and education as described above in table (2). In particular,

26
we include the share of parents employed, unemployed and self-employed and the shares
of parents who completed high-school and university.
Inclusion of these controls does not modifiy the results. The exemption raised boys’ high
school completion rates by more than 2 percentage points; the share of girls completing
high school increased by 1.8 points. Incidentally, tests of joint significance of the coefficents
on the quadratic in cohort size and the set of parental controls in the first stage and
reduced form equations strongly reject the null. The IV estimate now yields a slightly
higher and still statistically significant causal effect of about 0.8; the null of no peer effect
is rejected with 1.4 percent significance.
Taken together, these results imply that in treated towns about 180 adolescent boys and
150 girls completed high school because of the exemption from CMS who would otherwise
have dropped out. We thus contribute to the literature by stressing that, apart from
military service itself and the implied loss of labor market experience (Angrist (1990),
Imbens and van der Klaauw (1995), etc.), the existence of compulsory drafting may affect
subsequent male earnings also because of lower educational attainments. Also, we show
that the negative effects of CMS on schooling extends to women, even if they are not
subject to drafting, and potentially to their subsequent earnings as well.
5 Robustness checks
We now turn to a set of falsification exercises and robustness checks. We start by showing
that the results introduced in the previous section are not just a chance occurrence by
looking for similar effects in alternative samples. Next, we show they are robust to

27
alternative sample specifications. Last, we provide additional elements showing that no
other quake-related shock or pre-treatment differences in schooling drive the main results.
To allay concerns that the observed change in schooling among younger exempt cohorts
is a spurious one we perform two falsification exercises. First, we compare schooling
achievements of cohorts born in control towns and those of cohorts born in towns just
outside the control ring (outer control towns, see figure (2)). Both groups are certainly
unaffected by any quake-related intervention. We assign treatment status to control towns;
therefore, the exemption dummy equals unity for cohorts aged 26-28 born in control towns
and zero otherwise. Results reported in the first row of panel A in table (5) show no
statistically significant difference suggesting that the results of table (4) are unlikely to
be driven by sampling variation. Moreover, since control towns are closer to the quake
region than outer control towns, the findings provide further support to the assumption
that direct effects of the quake were absent: outcomes of younger cohorts not exempt are
the same as those of comparable cohorts farther away from the quake region. Second,
we assign exemption status to cohorts aged 30-35 in 1991 in treated towns and compare
high school graduation rates of cohorts aged 30-40 in 1991 in treated towns to the same
cohorts of control towns; the exemption dummy now equals unity for cohorts aged 30-35
and born in treated towns and zero otherwise. Results reported in the second row of
panel A again show no statistically significant difference. Third, we replicate the above
exercise only on cohorts aged 30-35 and assigning exemption status to those aged 30-32
and born in treated towns. Results, reported in the third row of panel A, again do not
show significant differences in schooling attainemnts. We conclude that the findings of the
previous section are unlikely to be driven by specific schooling trends in treated towns.

28
Interpretation of an IV estimate of θ as a causal effect requires a minimal set of as-
sumptions to be satisfied (Angrist, Imbens and Rubin (1996)). In particular, that female
education in a given group does not react to the treatment status of other groups, that
is neighboring towns or cohorts (stable unit treatment value)32. While the evidence we
have provided about interactions among teenagers suggests it is a valid assumption as far
as other towns are concerned, it might be more questionable as concerns the treatment
status of neighboring cohorts. Panel B1 of table (5) reports a set of robustness checks
where alternative definitions of the older cohorts have been experimented. The previous
findings are confirmed. The exemption increased boys’ high school graduation rates by
about 2 percentage points and those of girls by around 1.8 percentage points although
results seem to be more sensitive to the specification of the age control group. The implied
causal effect, always statistically significant, ranges between 07 and 0.933.
While assignment to treatment can be thought of as random since it depends on being
affected by the quake, tables (1) showed some differences across treated and control towns:
control towns are on average larger and more densely populated than treated towns. In
panel B2 we show the main findings are robust to the exclusion of larger towns according
to various definitions. The effect on boys’ and girls’ graduation rates are slightly larger and
still statistically significant. The estimated causal effect seems to increase as average town
32Angrist et al. (1996) show that along with the stable unit treatment value (SUTVA) assumption,a causal interpretation of the estimates requires that (a) assignment to treatment is random, (b) theinstrument does not directly affect the outcome variable (exclusion restriction), (c) nonzero averagecausal effect of the instrument on the treatment, (d) the instrument either increases or leaves unaffectedthe treatment (monotonicity). In our framework, (a) is naturally satisfied since assignment to treatmentdepends on the quake, (b) is fulfilled since women are not subject to drafting and the research designexcludes or controls for the possibility of other quake-related shocks, (c) will be shown to hold in the nextsection, (d) has theoretical foundations and empirical support (Angrist and Imbens (1995), Cipollone andRosolia (2004)).
33A referee also raised concerns that our main results might be sensitive to the inclusion of some specificolder cohorts. These results show this is not the case.

29
size shrinks, which is consistent with the idea that the underlying mechanism becomes
stronger the smaller the group34.
To lend further credibility to the main identifying assumption that no other quake-
related shock beyond the exemption affected younger cohorts in treated towns we perform
two exercises. First, we limit the sample only to those towns that qualified for the military
exemption although they did not record any damage at all, and towns that were ranked
at the lowest damage level by the Ministry of Internal Affairs (their damage score was
6). This leaves us with 33 treated towns; as a control group we retained only those towns
neighbouring on one of the selected treated ones (41 towns); this selection rule shrinks
the sample to 74 towns, mostly southern and eastern ones with respect to the original
sample. Results reported in the first row of panel C1 of table (5) show a stronger effect
of the exemption on both boys’ and girls’ graduation rates in this specific subsample:
boys’ completion rates increase by 3.8 percentage points, those of girls go up by 3.3
percentage points; the implied causal effect is in line with previous results and highly
significant. Results are confirmed if we further limit the sample to towns that, although
exempt, were not included in the list of damaged towns (18 towns) and their neighbors
(19 towns). Boys’ graduation rates in this sample increased by 3.9 percentage points while
girls’ did by 3.2 points; the estimated causal effect is again unaltered and although less
precisely estimated, still different from zero at 3 percent significance. Second, we look
at university graduation rates on the full sample of 117 towns. If any income transfer
was responsible for the increase of high school graduation rates in younger cohorts we
would expect some effect in graduation rates from university of older cohorts as well. We
34In a different setting, Duflo and Saez (2003) find that the effect of treatment on the treated is nolarger than that on untreated individuals in the same small group.

30
compare men and women university graduation rates for the cohorts aged 30 to 40 in
1991 and allow for a differential effect for cohorts 30-35, of college age when the quake
hit, in treated towns. Results in panel C2 show these coefficients are small, negative and
not statistically significant. We conclude that our main findings are unlikely to be driven
by quake-related shocks other than the exemption.
Next, we focus on the effects of schooling attainments in lower grades. Table (3) showed
differences in pre-treatment schooling endowments between treated and control towns.
Our preferred specification controls for cohort size, reasonably the main determinant of
per-capita resources given the limited age span considered in the analysis. However, to
verify that the main findings are not driven by the potentially larger population at risk of
completing high school in treated towns we perform two additional exercises. First, in the
first row of panel D in table (5) we augment the preferred specification with the share of
people in the cohort who had achieved a secondary school degree by 1981 (as reported by
the 1981 census); the effect of the exemption on boys and girls’ schooling is unchanged and
so is the IV estimate. Second, we regress the conditional high school graduation rate on
the preferred information set. The conditional graduation rate is defined as the share of
high school graduates out of secondary school graduates in the cohort. Again, as showns
in row D2, results turn out to be stable to this extension. We conclude that pre-treatment
school endowments and the higher attainments in lower grades cannot explain the higher
graduation rates from high school observed for boys and girls in the town-cohort cells
affected by the exemption.
Finally, we verify that the main results are not driven by geographic heterogeneity in
the developments of schooling levels. We divide the sample in 5 equally sized groups

31
of towns on the basis of their geographic proximity and allow for group specific sets of
age dummies. Point estimates reported in panel E of table (5) are in line with previous
results with p-values below 3 percent; the IV estimate shows a somewhat higher peer
effect, significant at 2 percent. We conclude that the main results are not driven by
geographic heterogeneity in the age pattern of schooling.
6 Concluding remarks.
The existence and the nature of peer effects have been recognized as an important element
to assess the efficiency of a given school system, its funding arrangements, the existence
of tracking, etc.
This paper provides evidence of a causal relationship of the high school graduation rate
of boys on the probability of girls of the same age and living in the same town completing
high school. Results are based on difference-in-difference estimates of the effect of the
exemption from compulsory military service granted to specific cohorts of young men as a
result of a quake hitting Southern Italy in 1980 on male and female high school graduation
rates.
The exemption is shown to have increased the share of male high school graduates in the
exempt cohorts by more than 2 percentage points. Women of the same age and born in
the same towns as exempt males also display higher high school completion rates by about
2 percentage points. The estimated effects nearly double when we limit the analysis to
the subset of towns that recorded the mildest damage or no damage at all. The research
design and a set of robustness checks guarantee these results are the consequence of the

32
exemption from CMS and not of the quake itself or other quake-related interventions that
alter schooling decisions of both boys and girls.
Since in Italy women are not subject to military service, we interpret this finding as
evidence of peer effects at the cohort-town level. Moreover, in our setting the exemption
does not change the members of the peer group, the boys of a given cohort in a given town.
Therefore, higher peer average outcome is the result of boys staying longer in school or
of them putting more effort into the accumulation of human capital. Hence, we identify
the effect on teenage girls’ schooling outcomes of a behavior of peers.
This kind of peer effects have crucially different policy implications than those of peer
effects working through the exogenous characteristics of peers. For example, in the latter
case an increase in the number of compulsory years of schooling would only raise school
attainments of low achievers since the exogenous characteristics of the cohort are not
changed by the intervention. Alternatively, if peer effects work through behaviors the
same policy would also increase attainment of those not directly affected by the reform
since the average outcome in the cohort increases because of the better performance of
low achievers.

33
Figure 1: Exemption from CMS and quake intensity.
Quake intensity
no damage (53)
low (313)
medium (296)
high (34)
Source: Official report on the 1980 earthquake, Ministero del Bilancio e della ProgrammazioneEconomica (1981).
34
Figure 2: Sampled towns.
Sampled towns
Control (C) (60)
Treated (T) (57)
Outer Control (OC) (81)
Source: Official report on the 1980 earthquake, Ministero del Bilancio e della ProgrammazioneEconomica (1981).
35
Figure 3: High school graduation rates.
Age in 1991
Males
Control towns Treated towns
26 27 28 29 30 31 32 33 34 35 36 37 38 39 40 41 42 43 44 45 46 47 48 49 50
.1
.15
.2
.25
.3
.35
.4
.45
Age in 1991
Females
26 27 28 29 30 31 32 33 34 35 36 37 38 39 40 41 42 43 44 45 46 47 48 49 50
.1
.15
.2
.25
.3
.35
.4
.45
Source: Authors’ calculations on 1991 census data, Istat (1994).

36
Table 1: Descriptive statistics: town and population characteristics.
Control T-C
A: Structural characteristics.
Altitude 257.428∗∗ 152.108∗∗(22.716) (40.418)
Inhabitants per square km (1979) 184.293∗∗ -90.413∗∗(11.363) (20.218)
Extension (km2) 290.584∗∗ -128.708∗∗(20.527) (36.524)
B: Demography.
Inflow rate 1.960∗∗ -0.268(0.109) (0.194)
-from abroad 0.178∗∗ -0.004(0.024) (0.042)
Outflow rate 2.104∗∗ 0.214(0.085) (0.151)
-abroad 0.146∗∗ 0.005(0.026) (0.046)
Birth rate 1.635∗∗ -0.175∗∗(0.032) (0.056)
Death rate 0.802∗∗ 0.098∗(0.024) (0.042)
Family size 4.231∗∗ -0.182∗∗(0.029) (0.053)
Age 32.565∗∗ 2.301∗∗(0.315) (0.562)
C: Education and labor market.
%≥ High school 15.478∗∗ -1.236(0.722) (1.273)
%≥ University 2.709∗∗ -0.479(0.155) (0.274)
% Employed 37.423∗∗ 0.769(0.452) (0.797)
% Unemployed 11.564∗∗ 0.958(0.400) (0.704)
% Self-Employed 10.302∗∗ 2.470∗(0.582) (1.027)
Source: Authors’ calculations on town structural characteristics (Istat (1990)), population flows data(Istat (1980b)) and 1981 population census (Istat (1984)).Weighted means; weights are town population. Panel C refers to population 15 year old and above.Standard errors in parentheses. (∗) significant at 5%; (∗∗) significant at 1%.

37
Table 2: Parental characteristics, 1981.
Employment Unemployment Self-Employment High school University AgeCohort Control T-C Control T-C Control T-C Control T-C Control T-C Control T-C
26 53.831∗∗ 1.126 6.613∗∗ 2.111∗∗ 17.200∗∗ 3.145∗∗ 7.608∗∗ -1.497∗ 1.926∗∗ -0.314 46.670∗∗ 0.362(1.475) (2.688) (0.436) (0.795) (0.627) (1.143) (0.333) (0.607) (0.119) (0.218) (0.138) (0.252)
27 51.442∗∗ 3.446 7.050∗∗ 1.638∗ 16.106∗∗ 4.545∗∗ 7.491∗∗ -1.211∗ 1.997∗∗ -0.249 47.739∗∗ 0.302(1.476) (2.682) (0.437) (0.793) (0.628) (1.141) (0.334) (0.606) (0.119) (0.217) (0.138) (0.251)
28 51.103∗∗ 1.003 6.522∗∗ 2.103∗ 16.624∗∗ 3.152∗∗ 7.002∗∗ -1.350∗ 1.853∗∗ -0.248 48.760∗∗ 0.369(1.555) (2.841) (0.460) (0.841) (0.661) (1.208) (0.351) (0.642) (0.126) (0.230) (0.146) (0.266)
30 48.203∗∗ 1.203 5.936∗∗ 1.867∗ 16.580∗∗ 3.211∗ 6.632∗∗ -1.456∗ 1.918∗∗ -0.558∗ 50.862∗∗ 0.215(1.703) (3.037) (0.504) (0.899) (0.724) (1.292) (0.385) (0.686) (0.138) (0.246) (0.159) (0.284)
31 46.948∗∗ 1.285 5.533∗∗ 1.49 16.717∗∗ 2.968∗ 7.011∗∗ -2.064∗∗ 2.110∗∗ -0.579∗ 51.851∗∗ 0.001(1.815) (3.216) (0.537) (0.952) (0.772) (1.368) (0.410) (0.727) (0.147) (0.260) (0.170) (0.301)
32 44.819∗∗ 1.179 5.355∗∗ 0.627 16.133∗∗ 4.067∗∗ 6.759∗∗ -1.729∗ 1.890∗∗ -0.570∗ 52.890∗∗ 0.209(1.922) (3.421) (0.569) (1.012) (0.818) (1.455) (0.435) (0.773) (0.156) (0.277) (0.180) (0.320)
33 42.746∗∗ 0.669 5.009∗∗ 0.86 15.821∗∗ 3.157 6.994∗∗ -2.208∗∗ 2.041∗∗ -0.589 53.984∗∗ 0.129(2.128) (3.785) (0.630) (1.120) (0.905) (1.610) (0.481) (0.855) (0.172) (0.306) (0.199) (0.354)
34 41.296∗∗ 0.546 4.803∗∗ 0.691 16.690∗∗ 2.024 6.944∗∗ -1.498 1.979∗∗ -0.276 54.919∗∗ 0.188(2.355) (4.128) (0.697) (1.221) (1.002) (1.756) (0.532) (0.933) (0.191) (0.334) (0.221) (0.387)
35 39.531∗∗ -0.405 3.820∗∗ -0.113 17.091∗∗ 2.11 7.534∗∗ -2.263∗ 2.493∗∗ -1.074∗∗ 55.970∗∗ 0.158(2.534) (4.505) (0.750) (1.333) (1.078) (1.916) (0.573) (1.018) (0.205) (0.365) (0.237) (0.422)
F-test 0.999 0.832 0.962 0.981 0.641 0.995
Source: Authors’ calculations on 1981 population census (Istat (1984)).Weighted means; weights are number of parents in relevant cell. Standard errors in parentheses.(∗) significant at 5%; (∗∗) significant at 1%.
38
Table 3: School endowments: class size, 1972-79.
School-year Primary school Secondary school High schoolControl T-C Control T-C Control T-C
1972 29.781∗∗ -10.858∗∗ 23.450∗∗ -1.859∗∗ 21.513∗∗ 1.242(0.944) (1.663) (0.336) (0.592) (0.812) (1.528)
1973 30.331∗∗ -11.817∗∗ 23.009∗∗ -1.881∗∗ 22.492∗∗ -0.464(0.937) (1.636) (0.333) (0.582) (0.811) (1.501)
1974 28.313∗∗ -10.062∗∗ 22.833∗∗ -1.637∗∗ 23.598∗∗ -1.465(0.932) (1.630) (0.331) (0.580) (0.800) (1.491)
1975 26.985∗∗ -9.555∗∗ 22.879∗∗ -1.323∗ 23.477∗∗ -1.359(0.928) (1.635) (0.330) (0.582) (0.796) (1.510)
1976 26.132∗∗ -8.714∗∗ 23.737∗∗ -1.953∗∗ 23.591∗∗ -1.702(0.923) (1.631) (0.328) (0.580) (0.801) (1.497)
1977 25.924∗∗ -8.779∗∗ 23.847∗∗ -1.853∗∗ 23.634∗∗ -1.551(0.919) (1.627) (0.327) (0.579) (0.802) (1.535)
1978 25.635∗∗ -8.624∗∗ 23.686∗∗ -1.794∗∗ 23.678∗∗ -1.648(0.915) (1.624) (0.325) (0.577) (0.788) (1.490)
1979 25.396∗∗ -8.862∗∗ 22.678∗∗ -1.296∗ 23.660∗∗ -1.657(0.912) (1.622) (0.324) (0.577) (0.809) (1.561)
F-stat 0.51 0.20 0.45P-value 0.82 0.99 0.87
Source: Authors’ calculations on Istat’s education yearbooks (Istat (1980a)).Weighted means; weights are town population in relevant year. Standard errors inparentheses. (∗) significant at 5%; (∗∗) significant at 1%.

39
Table 4: First stage, reduced form and IV estimates.
Dependent variable: Males’ HS Females’ HSgraduation rate graduation rate
OLS IVFirst stage Reduced form
Exemption p-value Exemption p-value Males’ HS % p-value
Age & Town dummies 1.82 0.031 1.24 0.107 0.68 0.086+ cohort size 2.50 0.004 1.82 0.022 0.73 0.014+ parental characteristics 2.15 0.014 1.84 0.022 0.85 0.014
Weighted regressions; weights are the number of females in each group. Sample: 117 towns, 1050 town-cohort cells.OLS are estimated coefficients on exemption dummy and IV are IV estimates of θ in equation (2) in the paper;instrumented variable is males’ high school graduation rate; instrument is exemption dummy. Exemption dummyequals 1 if cohort aged 26-28 and born in treated town. P-values of IV estimates are based on the Anderson-Rubinstatistic (χ2(1)). Parental characteristics are: share of parents employed, unemployed, self-employed, with a highschool degree and with a university degree.

40
Table 5: Robustness checks.Males Females
OLS IVFirst stage Reduced form
Exemption p-value Exemption p-value θ p-value
A: Falsification on alternative samples
A1. Control vs Outer control 0.16 0.821 0.12 0.867 - -A2. 30-35 vs 36-40 0.43 0.552 0.64 0.339 - -A3. 30-32 vs 33-35 0.60 0.557 0.24 0.793 - -
B: Sample specifications
B1: Older cohorts
–30-32 1.88 0.055 1.68 0.067 0.89 0.042–33-35 1.99 0.052 1.88 0.053 0.94 0.032–no 30 2.12 0.021 1.75 0.036 0.83 0.023–no 31 2.08 0.023 1.85 0.029 0.89 0.018–no 32 2.14 0.016 1.96 0.019 0.91 0.011–no 33 2.22 0.013 1.94 0.019 0.87 0.012–no 34 2.03 0.025 1.99 0.016 0.98 0.010–no 35 2.11 0.019 1.51 0.070 0.71 0.051
B2: Town size
– ≤50,000 inh. 2.45 0.015 2.19 0.018 0.89 0.011– ≤40,000 inh. 2.55 0.013 2.67 0.004 1.04 0.002– ≤20,000 inh. 2.72 0.022 3.02 0.005 1.11 0.003
C: Correlated shocks
C1. No Damage– score: 0 & 6 3.76 0.002 3.27 0.002 0.87 0.001– score: 0 3.87 0.017 3.16 0.044 0.82 0.028
C2. Universitygraduation rates -0.28 0.512 -0.34 0.428 - -
D: Pre-treatment schooling
D1. + secondary education 2.15 0.014 1.84 0.023 0.85 0.015D2. conditional HS % 2.35 0.022 1.76 0.066 0.75 0.050
E: Area specific age dummies 1.97 0.028 1.83 0.027 0.93 0.016
Weighted regressions; weights are the number of females in each group.Dependent variable: (males’ or females’) high school graduation rate except C2 (university graduation rates) andD2 (conditional high school graduation rates). Control set: cohort and town dummies, quadratic in cohort size,share of parents employed, self-employed, unemployed, with high school and university degree; D1 also includesshare of cohort with secondary school degree; E allows for specific age dummies for 5 groups of towns identifiedby geographic proximity. Sample towns: Treated and control except A1 (control and outer control), B2 (treatedand control towns below threshold), C1 (only treated town with damage score 0-6 or 0 and neighboring controltowns). Sample cohorts: 26-28 and 30-35 except A2 and C2 (30-40), A3 (30-35) and B1 (26-28 and as reportedin the table). OLS are estimated coefficients on exemption dummy and IV are IV estimates of θ in equation(2) in the paper; instrumented variable is same as dependent but defined on males; instrument is exemptiondummy. Exemption dummy defined according to specification in corresponding row (see text). P-values of IVestimates are based on the Anderson-Rubin statistic (χ2(1)).

References
Acemoglu, Daron and Joshua D. Angrist, “How Large Are the Social Returns toEducation? Evidence from Compulsory Schooling Laws,” in B. Bernanke andK. Rogoff, eds., NBER macroeconomics annual, Vol. 15, Cambridge, MA: MIT Press,2000, pp. 9–59.
Akerlof, George A. and Rachel E. Kranton, “Identity and Schooling: SomeLessons for the Economics of Education,” Journal of Economic Literature, 2002, 40(4), 1167–1201.
Angrist, Joshua D., “Lifetime Earnings and the Vietnam Era Draft Lottery:Evidence from Social Security Administrative Records,” American Economic Review,1990, 80 (3).and Alan B. Krueger, “Why Do World War II Veterans Earn More than
Nonveterans?,” 1989. NBER, Working Paper no. 2991.and , “Estimating the Payoff to Schooling Using the Vietnam-Era Draft Lottery,”
1992. NBER, Working Paper no. 4067.and Guido W. Imbens, “Two-Stages Least Squares Estimation of Average Causal
Effects in Models with Variable Treatment Intensity,” Journal of the AmericanStatistical Association, June 1995, 90, 431–442.and Kevin Lang, “Does School Integration Generate Peer Effects? Evidence from
Boston’s METCO Program,” American Economic Review, 2004, 94 (4), 1613–1634.and Victor Lavy, “Using Maimonide’s Rule to Estimate the Effect of Class Size on
Scholastic Achievement,” Quarterly Journal of Economics, May 1999, 114 (2),533–575., Eric Bettinger, Erik Bloom, Elizabeth King, and Michael Kremer,“Vouchers for Private Schooling in Colombia: Evidence from a Randomized NaturalExperiment,” American Economic Review, 2002, 92 (5), 1535–1558., Guido W. Imbens, and Donald B. Rubin, “Identification of Causal EffectsUsing Instrumental Variables,” Journal of the American Statistical Association, June1996, 91, 203–213.
Becker, Sascha O., Samuel Bentolila, Ana Fernandes, and Andrea Ichino,“Youth Emancipation and Perceived Job Insecurity of Parents and Children,” 2005.mimeo.
Bertrand, Marianne, Erzo F.P. Luttmer, and Sendhil Mullainathan, “NetworkEffects and Welfare Cultures,” Quarterly Journal of Economics, August 2000, 115(3), 1019–1055.
Bresnahan, Timothy F., Erik Brynjolfssonn, and Lorin M. Hitt, “InformationTechnology, Workplace Organization and the Demand for Skilled Labour: Firm-LevelEvidence,” Quarterly Journal of Economics, February 2002, 117 (1), 339–376.
Card, David and Alan B. Krueger, “Does School Quality Matter? Returns toEducation and the Characteristics of Public Schools in the United States,” Journal ofPolitical Economy, January 1992, 100 (1), 1–40.and Thomas Lemieux, “Dropout and Enrollment Trends in the Post-War Period:
What Went Wrong in the 1970s?,” 2000. NBER, Working Paper 7658.and , “Going to College to Avoid the Draft: the Unintended Legacy of the

42
Vietnam War,” American Economic Association: Papers and Proceedings, May 2001,91 (2), 97–102.
Case, Anne C. and Lawrence F. Katz, “The Company You Keep: the Effects ofFamily and Neighborhood on Disadvantaged Youths,” 1991. NBER, Working Paper3705.
Cipollone, Piero and Alfonso Rosolia, “Social Interactions in High School: Lessonsfrom an Earthquake,” 2004. Bank of Italy, mimeo. Available athttp://www.econ.upf.edu/∼rosolia.
Currie, Janet and Enrico Moretti, “Mother’s Education and the IntergenerationalTransmission of Human Capital: Evidence from College Openings,” QuarterlyJournal of Economics, 2003, 118 (4), 1495–1532.
Duflo, Esther and Emmanuel Saez, “The Role of Information and SocialInteractions in Retirement Plan Decisions: Evidence from a RandomizedExperiment,” Quarterly Journal of Economics, 2003, 118 (3), 815–842.
Epple, Dennis and Richard E. Romano, “Competition Between Private and PublicSchools, Vouchers and Peer-Group Effects,” American Economic Review, March 1998,88 (1), 33–62., Elizabeth Newlon, and Richard E. Romano, “Ability Tracking, SchoolCompetition and the Distribution of Educational Benefits,” Journal of PublicEconomics, 2002, 83 (1), 1–48.
Falk, Armin and Andrea Ichino, “Clean Evidence on Peer Pressure,” 2003. IZA,Discussion Paper no. 777.and Urs Fischbacher, “Crime in the Lab - Detecting Social Interactions,”
European Economic Review, 2002, 46, 859–869.Figlio, David N. and Marianne E. Page, “School Choice and the Distributional
Effects of Ability Tracking: Does Separation Increase Inequality?,” Journal of UrbanEconomics, 2002, 51 (3), 497–514.
Gaviria, Alejandro and Stephen Raphael, “School-Based Peer Effects and JuvenileBehaviour,” Review of Economic and Statistics, May 2001, 83 (2), 257–268.
Giuliano, Paola, “On the Determinants of Living Arrangements in Western Europe:Does Cultural Origin Matter?,” 2004. mimeo, IMF.
Glaeser, Edward L., Bruce L. Sacerdote, and Jose A. Scheinkman, “Crime andSocial Interactions,” Quarterly Journal of Economics, 1996, pp. 507–548., , and , “The Social Multiplier,” 2002. NBER, Working Paper 9153.
Grinblatt, Mark, Matti Keloharju, and Seppo Ikaheimo, “Interpersonal Effectsin Consumption: Evidence from the Automobile Purchases of Neighbors,” 2004.NBER, Working Paper 10226.
Hanushek, Eric A., “The Failure of Input-Based Schooling Policies,” EconomicJournal, 2003, 113.and Ludger Woessmann, “Does Educational Tracking Affect Performance and
Inequality? Differences-in-Differences Evidence Across Countries,” 2005. NBER,Working Paper no. 11124., John F. Kain, Jacob M. Markman, and Steven G. Rivkin, “Does PeerAbility Affect Student Achievement?,” 2001. NBER, Working Paper 8502.
Hoxby, Caroline M., “Peer Effects in the Classroom: Learning from Gender and Race
43
Variation,” 2000. NBER, Working Paper 7867.Hsieh, Chang-Tai and Miguel Urquiola, “When School Compete, How Do They
Compete? An Assesment of Chile’s Nationwide Voucher Program,” 2003. NBER,Working Paper no. 10008.
Ichino, Andrea and Giovanni Maggi, “Work Environment and IndividualBackground: Explaining Regional Shirking Differentials in a Large Italian Firm,”Quarterly Journal of Economics, August 2000, 115 (3), 1057–1090.
Imbens, Guido and Wilbert van der Klaauw, “Evaluating the Cost of Conscriptionin the Netherlands,” Journal of Business and Economic Statistics, 1995, 13 (2).
Istat, Annuario Statistico dell’Istruzione, 1979, Istat, 1980., Popolazione e Movimento Anagrafico dei Comuni al 31 Dicembre 1979, Istat, 1980., Censimento (XII) Generale della Popolazione: 25 Ottobre 1981, Istat, 1984., Comuni, Comunita Montane, Regioni Agrarie al 31 Dicembre 1988: Codici e DatiStrutturali, Istat, 1990., Censimento (XIII) Generale della Popolazione: 26 Ottobre 1991, Istat, 1994., Indagine multiscopo sulle famiglie, soggetti sociali e condizioni dell’infanzia, Istat,1998.
Katz, Lawrence F., Jeffrey R. Kling, and Jeffrey B. Liebman, “Moving toOpportunity in Boston: Early Results of a Randomized Mobility Experiment,”Quarterly Journal of Economics, 2001, pp. 607–654.
Kremer, Michael, Edward Miguel, and Rebecca Thornton, “Incentives toLearn,” 2004. NBER, Working Paper No. 10971.
Krueger, Alan B., “Experimental Estimates of Education Production Functions,”Quarterly Journal of Economics, May 1999, 114 (2), 497–532.and Diane M. Whitmore, “The Effect of Attending a Small Class in the Early
Grades on College-Test Taking and Middle school Test Results: Evidence fromProject STAR,” Economic Journal, January 2001, 1 (111), 1–28.
Lalive, Rafael, “Social Interactions in Unemployment,” 2003. IZA Discussion PaperNo. 803.
Lleras-Muney, Adriana, “The Relationship Between Education and Adult Mortalityin the United States,” Review of Economic Studies, 2005, 72, 189–221.
Lochner, Lance and Enrico Moretti, “The Effect of Education on Crime: Evidencefrom Prison Inmates, Arrests and Self-Reports,” American Economic Review, March2004, 94 (1), 155–189.
Ludwig, Jens, Greg J. Duncan, and Paul Hirschfield, “Urban Poverty andJuvenile Crime: Evidence from a Randomized Housing-Mobility Experiment,”Quarterly Journal of Economics, 2001, pp. 655–679.
Manacorda, Marco and Enrico Moretti, “Why do Most Italian Youths Live withTheir Parents? Intergenerational Transfers and Household Structure,” Journal of theEuropean Economic Association, forthcoming.
Manski, Charles F., “Identification of Endogenous Social Effects: the ReflectionProblem,” Review of Economic Studies, 1993, 60, 531–542., “Economic Analysis of Social Interactions,” Journal of Economic Perspectives, 2000,14 (3), 115–136.
Miguel, Edward and Michael Kremer, “Worms: Identifying Impacts on Education

44
and Health in the Presence of Treatment Externalities,” Econometrica, 2004, 72 (1),159–217.
Ministero del Bilancio e della Programmazione Economica, Rapporto sulTerremoto, Istituto Poligrafico e Zecca dello Stato, 1981.
Moffitt, Robert A., “Policy Interventions, Low-Level Equilibria and SocialInteractions,” in S. Durlauf and P. Young, eds., Social Dynamics, MIT Press, 2001.
Moreira, Marcelo J., “Tests with Correct Size when Instruments Can Be ArbitrarilyWeak,” 2001. Center for Labor Economics Working Paper Series, 37, UC Berkeley.
Moretti, Enrico, “Workers’ Education, Spillovers and Productivity: Evidence fromPlant-Level Production Functions,” American Economic Review, June 2004, 94 (3).
OECD, The Sources of Economic Growth in the OECD Countries, OECD, 2003.Sacerdote, Bruce, “Peer Effects with Random Assignment: Results for Dartmouth
Roommates,” Quarterly Journal of Economics, 2001, 116, 681–704., “The Nature and Nurture of Economic Outcomes,” American Economic Review:Papers and Proceedings, 2002, 92 (2), 344–348.
Topa, Giorgio, “Social Interactions, Local Spillovers and Unemployment,” Review ofEconomic Studies, 2001, 68, 261–295.
Winston, Gordon C. and David J. Zimmerman, “Peer Effects in HigherEducation,” 2003. NBER, Working Paper 9501.
Zimmerman, David J., “Peer Effects in Academic Outcomes: Evidence from aNatural Experiment,” Review of Economic and Statistics, 2003, 85 (1).

(*) Requests for copies should be sent to:Banca d’Italia – Servizio Studi – Divisione Biblioteca e pubblicazioni – Via Nazionale, 91 – 00184 Rome(fax 0039 06 47922059). They are available on the Internet www.bancaditalia.it.
RECENTLY PUBLISHED “TEMI” (*).
N. 571 – Production or consumption? Disentangling the skill-agglomeration Connection, by Guido de Blasio (January 2006).
N. 572 – Incentives in universal banks, by Ugo Albertazzi (January 2006).
N. 573 – Le rimesse dei lavoratori emigrati e le crisi di conto corrente, by M. Bugamelli and F. PaternÒ (January 2006).
N. 574 – Debt maturity of Italian fi rms, by Silvia Magri (January 2006).
N. 575 – Convergence of prices and rates of infl ation, by F. Busetti, S. Fabiani and A. Harvey (February 2006).
N. 576 – Stock market fl uctuations and money demand in Italy, 1913-2003, by Massimo Caruso (February 2006).
N. 577 – Skill dispersion and fi rm productivity: an analysis with employer-employee matched data, by S. Iranzo, F. Schivardi and E. Tosetti (February 2006).
N. 578 – Produttività e concorrenza estera, by M. Bugamelli and A. Rosolia (February 2006).
N. 579 – Is foreign exchange intervention effective? Some micro-analytical evidence from the Czech Republic, by Antonio Scalia (February 2006).
N. 580 – Canonical term-structure models with observable factors and the dynamics of bond risk premiums, by M. Pericoli and M. Taboga (February 2006).
N. 581 – Did infl ation really soar after the euro cash changeover? Indirect evidence from ATM withdrawals, by P. Angelini and F. Lippi (March 2006).
N. 582 – Qual è l’effetto degli incentivi agli investimenti? Una valutazione della legge 488/92, by R. Bronzini and G. de Blasio (March 2006).
N. 583 – The value of fl exible contracts: evidence from an Italian panel of industrial fi rms, by P. Cipollone and A. Guelfi (March 2006).
N. 584 – The causes and consequences of venture capital fi nancing. An analysis based on a sample of Italian fi rms, by D. M. Del Colle, P. Finaldi Russo and A. Generale (March 2006).
N. 585 – Risk-adjusted forecasts of oil prices, by P. Pagano and M. Pisani (March 2006).
N. 586 – The CAPM and the risk appetite index: theoretical differences and empirical similarities, by M. Pericoli and M. Sbracia (March 2006).
N. 587 – Effi ciency vs. agency motivations for bank takeovers: some empirical evidence, by A. De Vincenzo, C. Doria and C. Salleo (March 2006).
N. 588 – A multinomial approach to early warning system for debt crises, by A. Ciarlone and G. Trebeschi (May 2006).
N. 589 – An empirical analysis of national differences in the retail bank interest rates of the euro area, by M. Affi nito and F. Farabullini (May 2006).
N. 590 – Imperfect knowledge, adaptive learning and the bias against activist monetary po-licies, by Alberto Locarno (May 2006).
N. 591 – The legacy of history for economic development: the case of Putnam’s social capi-tal, by G. de Blasio and G. Nuzzo (May 2006).
N. 592 – L’internazionalizzazione produttiva italiana e i distretti industriali: un’analisi de-gli investimenti diretti all’estero, by Stefano Federico (May 2006).
N. 593 – Do market-based indicators anticipate rating agencies? Evidence for international banks, by Antonio Di Cesare (May 2006).
N. 594 – Entry regulations and labor market outcomes: Evidence from the Italian retail trade sector, by Eliana Viviano (May 2006).
N. 595 – Revisiting the empirical evidence on fi rms’ money demand, by Francesca Lotti and Juri Marcucci (May 2006).

"TEMI" LATER PUBLISHED ELSEWHERE
1999
L. GUISO and G. PARIGI, Investment and demand uncertainty, Quarterly Journal of Economics, Vol. 114 (1), pp. 185-228, TD No. 289 (November 1996).
A. F. POZZOLO, Gli effetti della liberalizzazione valutaria sulle transazioni finanziarie dell’Italia con l’estero, Rivista di Politica Economica, Vol. 89 (3), pp. 45-76, TD No. 296 (February 1997).
A. CUKIERMAN and F. LIPPI, Central bank independence, centralization of wage bargaining, inflation and unemployment: theory and evidence, European Economic Review, Vol. 43 (7), pp. 1395-1434, TD No. 332 (April 1998).
P. CASELLI and R. RINALDI, La politica fiscale nei paesi dell’Unione europea negli anni novanta, Studi e note di economia, (1), pp. 71-109, TD No. 334 (July 1998).
A. BRANDOLINI, The distribution of personal income in post-war Italy: Source description, data quality, and the time pattern of income inequality, Giornale degli economisti e Annali di economia, Vol. 58 (2), pp. 183-239, TD No. 350 (April 1999).
L. GUISO, A. K. KASHYAP, F. PANETTA and D. TERLIZZESE, Will a common European monetary policy have asymmetric effects?, Economic Perspectives, Federal Reserve Bank of Chicago, Vol. 23 (4), pp. 56-75, TD No. 384 (October 2000).
2000
P. ANGELINI, Are banks risk-averse? Timing of the operations in the interbank market, Journal of Money, Credit and Banking, Vol. 32 (1), pp. 54-73, TD No. 266 (April 1996).
F. DRUDI and R. GIORDANO, Default Risk and optimal debt management, Journal of Banking and Finance, Vol. 24 (6), pp. 861-892, TD No. 278 (September 1996).
F. DRUDI and R. GIORDANO, Wage indexation, employment and inflation, Scandinavian Journal of Economics, Vol. 102 (4), pp. 645-668, TD No. 292 (December 1996).
F. DRUDI and A. PRATI, Signaling fiscal regime sustainability, European Economic Review, Vol. 44 (10), pp. 1897-1930, TD No. 335 (September 1998).
F. FORNARI and R. VIOLI, The probability density function of interest rates implied in the price of options, in: R. Violi, (ed.) , Mercati dei derivati, controllo monetario e stabilità finanziaria, Il Mulino, Bologna, TD No. 339 (October 1998).
D. J. MARCHETTI and G. PARIGI, Energy consumption, survey data and the prediction of industrial production in Italy, Journal of Forecasting, Vol. 19 (5), pp. 419-440, TD No. 342 (December 1998).
A. BAFFIGI, M. PAGNINI and F. QUINTILIANI, Localismo bancario e distretti industriali: assetto dei mercati del credito e finanziamento degli investimenti, in: L.F. Signorini (ed.), Lo sviluppo locale: un'indagine della Banca d'Italia sui distretti industriali, Donzelli, TD No. 347 (March 1999).
A. SCALIA and V. VACCA, Does market transparency matter? A case study, in: Market Liquidity: Research Findings and Selected Policy Implications, Basel, Bank for International Settlements, TD No. 359 (October 1999).
F. SCHIVARDI, Rigidità nel mercato del lavoro, disoccupazione e crescita, Giornale degli economisti e Annali di economia, Vol. 59 (1), pp. 117-143, TD No. 364 (December 1999).
G. BODO, R. GOLINELLI and G. PARIGI, Forecasting industrial production in the euro area, Empirical Economics, Vol. 25 (4), pp. 541-561, TD No. 370 (March 2000).
F. ALTISSIMO, D. J. MARCHETTI and G. P. ONETO, The Italian business cycle: Coincident and leading indicators and some stylized facts, Giornale degli economisti e Annali di economia, Vol. 60 (2), pp. 147-220, TD No. 377 (October 2000).
C. MICHELACCI and P. ZAFFARONI, (Fractional) Beta convergence, Journal of Monetary Economics, Vol. 45, pp. 129-153, TD No. 383 (October 2000).
R. DE BONIS and A. FERRANDO, The Italian banking structure in the nineties: testing the multimarket contact hypothesis, Economic Notes, Vol. 29 (2), pp. 215-241, TD No. 387 (October 2000).

2001
M. CARUSO, Stock prices and money velocity: A multi-country analysis, Empirical Economics, Vol. 26 (4), pp. 651-72, TD No. 264 (February 1996).
P. CIPOLLONE and D. J. MARCHETTI, Bottlenecks and limits to growth: A multisectoral analysis of Italian industry, Journal of Policy Modeling, Vol. 23 (6), pp. 601-620, TD No. 314 (August 1997).
P. CASELLI, Fiscal consolidations under fixed exchange rates, European Economic Review, Vol. 45 (3), pp. 425-450, TD No. 336 (October 1998).
F. ALTISSIMO and G. L. VIOLANTE, Nonlinear VAR: Some theory and an application to US GNP and unemployment, Journal of Applied Econometrics, Vol. 16 (4), pp. 461-486, TD No. 338 (October 1998).
F. NUCCI and A. F. POZZOLO, Investment and the exchange rate, European Economic Review, Vol. 45 (2), pp. 259-283, TD No. 344 (December 1998).
L. GAMBACORTA, On the institutional design of the European monetary union: Conservatism, stability pact and economic shocks, Economic Notes, Vol. 30 (1), pp. 109-143, TD No. 356 (June 1999).
P. FINALDI RUSSO and P. ROSSI, Credit costraints in italian industrial districts, Applied Economics, Vol. 33 (11), pp. 1469-1477, TD No. 360 (December 1999).
A. CUKIERMAN and F. LIPPI, Labor markets and monetary union: A strategic analysis, Economic Journal, Vol. 111 (473), pp. 541-565, TD No. 365 (February 2000).
G. PARIGI and S. SIVIERO, An investment-function-based measure of capacity utilisation, potential output and utilised capacity in the Bank of Italy’s quarterly model, Economic Modelling, Vol. 18 (4), pp. 525-550, TD No. 367 (February 2000).
F. BALASSONE and D. MONACELLI, Emu fiscal rules: Is there a gap?, in: M. Bordignon and D. Da Empoli (eds.), Politica fiscale, flessibilità dei mercati e crescita, Milano, Franco Angeli, TD No. 375 (July 2000).
A. B. ATKINSON and A. BRANDOLINI, Promise and pitfalls in the use of “secondary" data-sets: Income inequality in OECD countries, Journal of Economic Literature, Vol. 39 (3), pp. 771-799, TD No. 379 (October 2000).
D. FOCARELLI and A. F. POZZOLO, The determinants of cross-border bank shareholdings: An analysis with bank-level data from OECD countries, Journal of Banking and Finance, Vol. 25 (12), pp. 2305-2337, TD No. 381 (October 2000).
M. SBRACIA and A. ZAGHINI, Expectations and information in second generation currency crises models, Economic Modelling, Vol. 18 (2), pp. 203-222, TD No. 391 (December 2000).
F. FORNARI and A. MELE, Recovering the probability density function of asset prices using GARCH as diffusion approximations, Journal of Empirical Finance, Vol. 8 (1), pp. 83-110, TD No. 396 (February 2001).
P. CIPOLLONE, La convergenza dei salari manifatturieri in Europa, Politica economica, Vol. 17 (1), pp. 97-125, TD No. 398 (February 2001).
E. BONACCORSI DI PATTI and G. GOBBI, The changing structure of local credit markets: Are small businesses special?, Journal of Banking and Finance, Vol. 25 (12), pp. 2209-2237, TD No. 404 (June 2001).
CORSETTI G., PERICOLI M., SBRACIA M., Some contagion, some interdependence: more pitfalls in tests of financial contagion, Journal of International Money and Finance, 24, 1177-1199, TD No. 408 (June 2001).
G. MESSINA, Decentramento fiscale e perequazione regionale. Efficienza e redistribuzione nel nuovo sistema di finanziamento delle regioni a statuto ordinario, Studi economici, Vol. 56 (73), pp. 131-148, TD No. 416 (August 2001).
2002
R. CESARI and F. PANETTA, Style, fees and performance of Italian equity funds, Journal of Banking and Finance, Vol. 26 (1), TD No. 325 (January 1998).
L. GAMBACORTA, Asymmetric bank lending channels and ECB monetary policy, Economic Modelling, Vol. 20 (1), pp. 25-46, TD No. 340 (October 1998).

C. GIANNINI, “Enemy of none but a common friend of all”? An international perspective on the lender-of-last-resort function, Essay in International Finance, Vol. 214, Princeton, N. J., Princeton University Press, TD No. 341 (December 1998).
A. ZAGHINI, Fiscal adjustments and economic performing: A comparative study, Applied Economics, Vol. 33 (5), pp. 613-624, TD No. 355 (June 1999).
F. ALTISSIMO, S. SIVIERO and D. TERLIZZESE, How deep are the deep parameters?, Annales d’Economie et de Statistique,.(67/68), pp. 207-226, TD No. 354 (June 1999).
F. FORNARI, C. MONTICELLI, M. PERICOLI and M. TIVEGNA, The impact of news on the exchange rate of the lira and long-term interest rates, Economic Modelling, Vol. 19 (4), pp. 611-639, TD No. 358 (October 1999).
D. FOCARELLI, F. PANETTA and C. SALLEO, Why do banks merge?, Journal of Money, Credit and Banking, Vol. 34 (4), pp. 1047-1066, TD No. 361 (December 1999).
D. J. MARCHETTI, Markup and the business cycle: Evidence from Italian manufacturing branches, Open Economies Review, Vol. 13 (1), pp. 87-103, TD No. 362 (December 1999).
F. BUSETTI, Testing for stochastic trends in series with structural breaks, Journal of Forecasting, Vol. 21 (2), pp. 81-105, TD No. 385 (October 2000).
F. LIPPI, Revisiting the Case for a Populist Central Banker, European Economic Review, Vol. 46 (3), pp. 601-612, TD No. 386 (October 2000).
F. PANETTA, The stability of the relation between the stock market and macroeconomic forces, Economic Notes, Vol. 31 (3), TD No. 393 (February 2001).
G. GRANDE and L. VENTURA, Labor income and risky assets under market incompleteness: Evidence from Italian data, Journal of Banking and Finance, Vol. 26 (2-3), pp. 597-620, TD No. 399 (March 2001).
A. BRANDOLINI, P. CIPOLLONE and P. SESTITO, Earnings dispersion, low pay and household poverty in Italy, 1977-1998, in D. Cohen, T. Piketty and G. Saint-Paul (eds.), The Economics of Rising Inequalities, pp. 225-264, Oxford, Oxford University Press, TD No. 427 (November 2001).
L. CANNARI and G. D’ALESSIO, La distribuzione del reddito e della ricchezza nelle regioni italiane, Rivista Economica del Mezzogiorno (Trimestrale della SVIMEZ), Vol. XVI (4), pp. 809-847, Il Mulino, TD No. 482 (June 2003).
2003
F. SCHIVARDI, Reallocation and learning over the business cycle, European Economic Review, , Vol. 47 (1), pp. 95-111, TD No. 345 (December 1998).
P. CASELLI, P. PAGANO and F. SCHIVARDI, Uncertainty and slowdown of capital accumulation in Europe, Applied Economics, Vol. 35 (1), pp. 79-89, TD No. 372 (March 2000).
P. ANGELINI and N. CETORELLI, The effect of regulatory reform on competition in the banking industry, Federal Reserve Bank of Chicago, Journal of Money, Credit and Banking, Vol. 35, pp. 663-684, TD No. 380 (October 2000).
P. PAGANO and G. FERRAGUTO, Endogenous growth with intertemporally dependent preferences, Contribution to Macroeconomics, Vol. 3 (1), pp. 1-38, TD No. 382 (October 2000).
P. PAGANO and F. SCHIVARDI, Firm size distribution and growth, Scandinavian Journal of Economics, Vol. 105 (2), pp. 255-274, TD No. 394 (February 2001).
M. PERICOLI and M. SBRACIA, A Primer on Financial Contagion, Journal of Economic Surveys, Vol. 17 (4), pp. 571-608, TD No. 407 (June 2001).
M. SBRACIA and A. ZAGHINI, The role of the banking system in the international transmission of shocks, World Economy, Vol. 26 (5), pp. 727-754, TD No. 409 (June 2001).
E. GAIOTTI and A. GENERALE, Does monetary policy have asymmetric effects? A look at the investment decisions of Italian firms, Giornale degli Economisti e Annali di Economia, Vol. 61 (1), pp. 29-59, TD No. 429 (December 2001).
L. GAMBACORTA, The Italian banking system and monetary policy transmission: evidence from bank level data, in: I. Angeloni, A. Kashyap and B. Mojon (eds.), Monetary Policy Transmission in the Euro Area, Cambridge, Cambridge University Press, TD No. 430 (December 2001).
M. EHRMANN, L. GAMBACORTA, J. MARTÍNEZ PAGÉS, P. SEVESTRE and A. WORMS, Financial systems and the role of banks in monetary policy transmission in the euro area, in: I. Angeloni, A. Kashyap and B. Mojon (eds.), Monetary Policy Transmission in the Euro Area, Cambridge, Cambridge University Press, TD No. 432 (December 2001).
F. SPADAFORA, Financial crises, moral hazard and the speciality of the international market: further evidence from the pricing of syndicated bank loans to emerging markets, Emerging Markets Review, Vol. 4 ( 2), pp. 167-198, TD No. 438 (March 2002).
D. FOCARELLI and F. PANETTA, Are mergers beneficial to consumers? Evidence from the market for bank deposits, American Economic Review, Vol. 93 (4), pp. 1152-1172, TD No. 448 (July 2002).
E.VIVIANO, Un'analisi critica delle definizioni di disoccupazione e partecipazione in Italia, Politica Economica, Vol. 19 (1), pp. 161-190, TD No. 450 (July 2002).
M. PAGNINI, Misura e Determinanti dell’Agglomerazione Spaziale nei Comparti Industriali in Italia, Rivista di Politica Economica, Vol. 3 (4), pp. 149-196, TD No. 452 (October 2002).
F. BUSETTI and A. M. ROBERT TAYLOR, Testing against stochastic trend and seasonality in the presence of unattended breaks and unit roots, Journal of Econometrics, Vol. 117 (1), pp. 21-53, TD No. 470 (February 2003).
2004
F. LIPPI, Strategic monetary policy with non-atomistic wage-setters, Review of Economic Studies, Vol. 70 (4), pp. 909-919, TD No. 374 (June 2000).
P. CHIADES and L. GAMBACORTA, The Bernanke and Blinder model in an open economy: The Italian case, German Economic Review, Vol. 5 (1), pp. 1-34, TD No. 388 (December 2000).
M. BUGAMELLI and P. PAGANO, Barriers to Investment in ICT, Applied Economics, Vol. 36 (20), pp. 2275-2286, TD No. 420 (October 2001).
A. BAFFIGI, R. GOLINELLI and G. PARIGI, Bridge models to forecast the euro area GDP, International Journal of Forecasting, Vol. 20 (3), pp. 447-460,TD No. 456 (December 2002).
D. AMEL, C. BARNES, F. PANETTA and C. SALLEO, Consolidation and Efficiency in the Financial Sector: A Review of the International Evidence, Journal of Banking and Finance, Vol. 28 (10), pp. 2493-2519, TD No. 464 (December 2002).
M. PAIELLA, Heterogeneity in financial market participation: appraising its implications for the C-CAPM, Review of Finance, Vol. 8, pp. 1-36, TD No. 473 (June 2003).
E. BARUCCI, C. IMPENNA and R. RENÒ, Monetary integration, markets and regulation, Research in Banking and Finance, (4), pp. 319-360, TD No. 475 (June 2003).
G. ARDIZZI, Cost efficiency in the retail payment networks: first evidence from the Italian credit card system, Rivista di Politica Economica, Vol. 94, (3), pp. 51-82, TD No. 480 (June 2003).
E. BONACCORSI DI PATTI and G. DELL’ARICCIA, Bank competition and firm creation, Journal of Money Credit and Banking, Vol. 36 (2), pp. 225-251, TD No. 481 (June 2003).
R. GOLINELLI and G. PARIGI, Consumer sentiment and economic activity: a cross country comparison, Journal of Business Cycle Measurement and Analysis, Vol. 1 (2), pp. 147-172, TD No. 484 (September 2003).
L. GAMBACORTA and P. E. MISTRULLI, Does bank capital affect lending behavior?, Journal of Financial Intermediation, Vol. 13 (4), pp. 436-457, TD No. 486 (September 2003).
G. GOBBI and F. LOTTI, Entry decisions and adverse selection: an empirical analysis of local credit markets, Journal of Financial services Research, Vol. 26 (3), pp. 225-244, TD No. 535 (December 2004).
F. CINGANO and F. SCHIVARDI, Identifying the sources of local productivity growth, Journal of the European Economic Association, Vol. 2 (4), pp. 720-742, TD No. 474 (June 2003).
C. BENTIVOGLI and F. QUINTILIANI, Tecnologia e dinamica dei vantaggi comparati: un confronto fra quattro regioni italiane, in C. Conigliani (a cura di), Tra sviluppo e stagnazione: l’economia dell’Emilia-Romagna, Bologna, Il Mulino, TD No. 522 (October 2004).
E. GAIOTTI and F. LIPPI, Pricing behavior and the introduction of the euro:evidence from a panel of restaurants, Giornale degli Economisti e Annali di Economia, 2004, Vol. 63(3/4):491-526, TD No. 541 (February 2005).

2005
L. DEDOLA and F. LIPPI, The monetary transmission mechanism: evidence from the industries of 5 OECD countries, European Economic Review, 2005, Vol. 49(6): 1543-69, TD No. 389 (December 2000).
G. DE BLASIO and S. DI ADDARIO, Do workers benefit from industrial agglomeration? Journal of regional Science, Vol. 45 n.4, pp. 797-827, TD No. 453 (October 2002).
M. OMICCIOLI, Il credito commerciale: problemi e teorie, in L. Cannari, S. Chiri e M. Omiccioli (a cura di), Imprese o intermediari? Aspetti finanziari e commerciali del credito tra imprese in Italia, Bologna, Il Mulino, TD No. 494 (June 2004).
L. CANNARI, S. CHIRI and M. OMICCIOLI, Condizioni del credito commerciale e differenzizione della clientela, in L. Cannari, S. Chiri e M. Omiccioli (a cura di), Imprese o intermediari? Aspetti finanziari e commerciali del credito tra imprese in Italia, Bologna, Il Mulino, TD No. 495 (June 2004).
P. FINALDI RUSSO and L. LEVA, Il debito commerciale in Italia: quanto contano le motivazioni finanziarie?, in L. Cannari, S. Chiri e M. Omiccioli (a cura di), Imprese o intermediari? Aspetti finanziari e commerciali del credito tra imprese in Italia, Bologna, Il Mulino, TD No. 496 (June 2004).
A. CARMIGNANI, Funzionamento della giustizia civile e struttura finanziaria delle imprese: il ruolo del credito commerciale, in L. Cannari, S. Chiri e M. Omiccioli (a cura di), Imprese o intermediari? Aspetti finanziari e commerciali del credito tra imprese in Italia, Bologna, Il Mulino, TD No. 497 (June 2004).
G. DE BLASIO, Credito commerciale e politica monetaria: una verifica basata sull’investimento in scorte, in L. Cannari, S. Chiri e M. Omiccioli (a cura di), Imprese o intermediari? Aspetti finanziari e commerciali del credito tra imprese in Italia, Bologna, Il Mulino, TD No. 498 (June 2004).
G. DE BLASIO, Does trade credit substitute bank credit? Evidence from firm-level data. Economic notes, Vol. 34 n.1, pp. 85-112, TD No. 498 (June 2004).
A. DI CESARE, Estimating Expectations of Shocks Using Option Prices, The ICFAI Journal of Derivatives Markets, Vol. II (1), pp. 42-53, TD No. 506 (July 2004).
M. BENVENUTI and M. GALLO, Perché le imprese ricorrono al factoring? Il caso dell'Italia, in L. Cannari, S. Chiri e M. Omiccioli (a cura di), Imprese o intermediari? Aspetti finanziari e commerciali del credito tra imprese in Italia, Bologna, Il Mulino, TD No. 518 (October 2004).
P. DEL GIOVANE and R. SABBATINI, L’euro e l’inflazione. Percezioni, fatti e analisi, Bologna, Il Mulino, TD No. 532 (December 2004).
2006
R. BRONZINI and G. DE BLASIO, Evaluating the impact of investment incentives: The case of Italy’s Law 488/92. Journal of Urban Economics, vol. 60, n. 2, pag. 327-349, TD No. 582 (March 2006).
A. DI CESARE, Do market-based indicators anticipate rating agencies? Evidence for international banks, Economic Notes, No. 35, pp. 121-150, TD No. 593 (May 2006).