delårsrapport januari-mars 2013 - cisionmb.cision.com/main/509/9414862/122948.pdfis never less than...
TRANSCRIPT

Delårsrapport januari-mars 2013
S 1/18
Q1 Interim Report January-March 2013 May 15, 2013 from Rederi AB TransAtlantic (publ)

Report Q1 2013, January - March
page 2/18
Interim Report 2013, January - March First quarter 2013
Net revenues amounted to SEK 685 M (861)
Result before capital costs, EBITDA, amounted to SEK -18 M (-15)
Result before tax amounted to SEK -138 M (-132)
Result after tax amounted to SEK -137 M (-132)
Earnings per share after tax amounted to SEK -1.2 (-1.2)
Significant events during the quarter
Viking Supply Ships implements, with effect from July 1, 2013, a new organizational structure to centralize all support functions as well as operational management at the head office in Copenhagen.
Swedish Maritime Administration decided not to extend the charter contracts for AHTS icebreakers Tor Viking and Balder Viking. The vessels will be available for contracts after Q1 2014 and Q1 2015 respectively.
Viking Supply Ships entered into a time charter contract for one of its AHTS icebreaker vessels with a major oil company.
Viking Supply Ships completed a tap issue of SEK 87 M (tranche 2) under the existing bond agreement.
The company works with lending banks to ensure a stable short and long-term financing. TransAtlantic has received waivers for the first quarter, 2013, in conjunction with the Group failing to fulfill some of the loan agreements on financial key figures.
Key figures
January-March
2013 2012
Net sales, SEK M 685 861 Operational result before tax, SEK M ¹ -138 -151 Result before tax, SEK M -138 -132 Result after tax, SEK M -137 -132 Earnings per share after tax, SEK -1.2 -1.2 Shareholders’ equity, SEK/share 16.6 21.1 Return on equity, % -27.9 -21.8 Return on capital employed, % -6.3 -6.9 Equity/asset ratio at balance day, % 34.2 36.1
1. Operational result: Earnings before tax, restructuring costs and acquisition effects.
-40%
-30%
-20%
-10%
0%
10%
Q22011
Q3 Q4 Q12012
Q2 Q3 Q4 Q12013
Return on capital employed and sharholders' equity, %
Capital employed Shareholders' equity
-400
-200
0
200
400
600
800
1 000
Q22011
Q3 Q4 Q12012
Q2 Q3 Q4 Q12013
Net sales and operational proft, SEK M
Net sales Operational profit/loss
0,0%
10,0%
20,0%
30,0%
40,0%
50,0%
0
100
200
300
400
500
600
Q22011
Q3 Q4 Q12012
Q2 Q3 Q4 Q12013
Liquidity and equity/assets ratio
Liquidity, SEK M Equity/assets ratio, %
Report Q1 2013, January - March
page 3/18
CEO’s statement
Profit before tax before restructuring cost
for the first quarter amounted to
SEK -138 M which is unsatisfactory. Profit
before tax for the group is split into
SEK -76 M (-88) for Viking Supply Ships
and SEK -62 M (-63) for Industrial
Shipping.
As stated in the 2012 Annual Report that was
published during the first quarter, the Group’s
liquidity is strained and exposed to risks. As we
have previously communicated, initiatives to
strengthen the company’s profitability and liquidity
have been initiated and we also continue to work
proactively with lenders to ensure a stable short and
long-term financing.
In addition, the company’s Board of Directors in
April unanimously decided to seek shareholders’
approval for a capital increase through a rights issue
of SEK 150 M. This is in order to improve the
funding structure, liquidity and ultimately the
operational performance of the Industrial Shipping
division in an even quicker fashion than earlier
planned. RABT will seek approval for this rights
issue at an extraordinary shareholders meeting,
date to be announced later.
Industrial Shipping The market situation has deteriorated both in terms
of volumes and rates during the first quarter and as
Industrial Shipping’s customers experience lower
demands from the European market, the volumes
decrease for TransAtlantic. This effect is
compounded by the strengthening of the Swedish
krona. We currently see no signs of recovery for the
remainder of the year. This calls for deeper actions
in order to get a competitive structure and every
stone is turned in order to streamline the
organization while still maintaining focus on
customers and commercial incentives. The division
has recently appointed Birna Ödefors as new CCO
and we believe her experience and background will
be of great benefit for further developing Industrial
Shipping to become significantly more dynamic and
competitive.
Viking Supply Ships Viking Supply Ships (VSS) has started to centralize
all support functions as well as operational
management at the headquarters in Copenhagen.
This means that the Kristiansand office will proceed
as a commercial office and the VSS Gothenburg
office will be closed. The reorganization will be
implemented by July 1, 2013.
During the quarter, Viking Supply Ships completed a
tap issue of SEK 87 M (tranche 2) under the existing
bond agreement. We also announced that the
Swedish Maritime Administration decided to not
extend the charter contracts for AHTS icebreakers
Tor Viking and Balder Viking and that one of these
vessels quickly entered into a time charter contract
with a major oil company.
The quarter was characterized by positioning in the
spot market and sales activities towards longer term
contracts. We believe Viking Supply Ships to be well
positioned in its market with a growing number of
opportunities for longer term contracts in VSS’ areas
of expertise.
Viking Supply Ships cost structure is competitive,
while that of Industrial Shipping needs to be
improved in order to react to deteriorating market
conditions.
For the RABT group, the next quarter will continue
to be challenging because of the same underlying
market conditions as in recent quarters. The key is
to try to offset a deteriorating market in Industrial
Shipping with operational and structural savings as
well as market share gains.
Gothenburg, May 15, 2013
Henning E. Jensen, CEO

Report Q1 2013, January - March
page 4/18
Consolidated earnings for January-March Consolidated net sales for the quarter amounted to SEK 685 M (861). The Group reported a result after tax of
SEK -137 M (-132), of which restructuring costs and acquisition effects amounted total SEK - M (19). The result
before tax amounted to SEK -138 M (-132).
Group
Full Year
SEK M 2013 2012 2012
Net sales 685 861 3 274
Result before capital costs, EBITDA -18 -15 120
Operating result -78 -97 -143
Result before tax -138 -132 -356
Profit margin -20.2% -15.3% -10.9%
Profit before tax by business area
Viking Supply Ships business area -76 -88 -119
Industrial Shipping business area -62 -63 -208
Total operational result -138 -151 -327
Restructuring items - 19 -35
Acquisition effects - - 6
Result before tax -138 -132 -356
Tax 1 0 -37
Result -137 -132 -393
SEK per share
Result after current tax -1.2 -1.2 -3.2
Result after full tax -1.2 -1.2 -3.5
For further information, please see tables on page 11-17.
Jan-Mar
Report Q1 2013, January - March
page 5/18
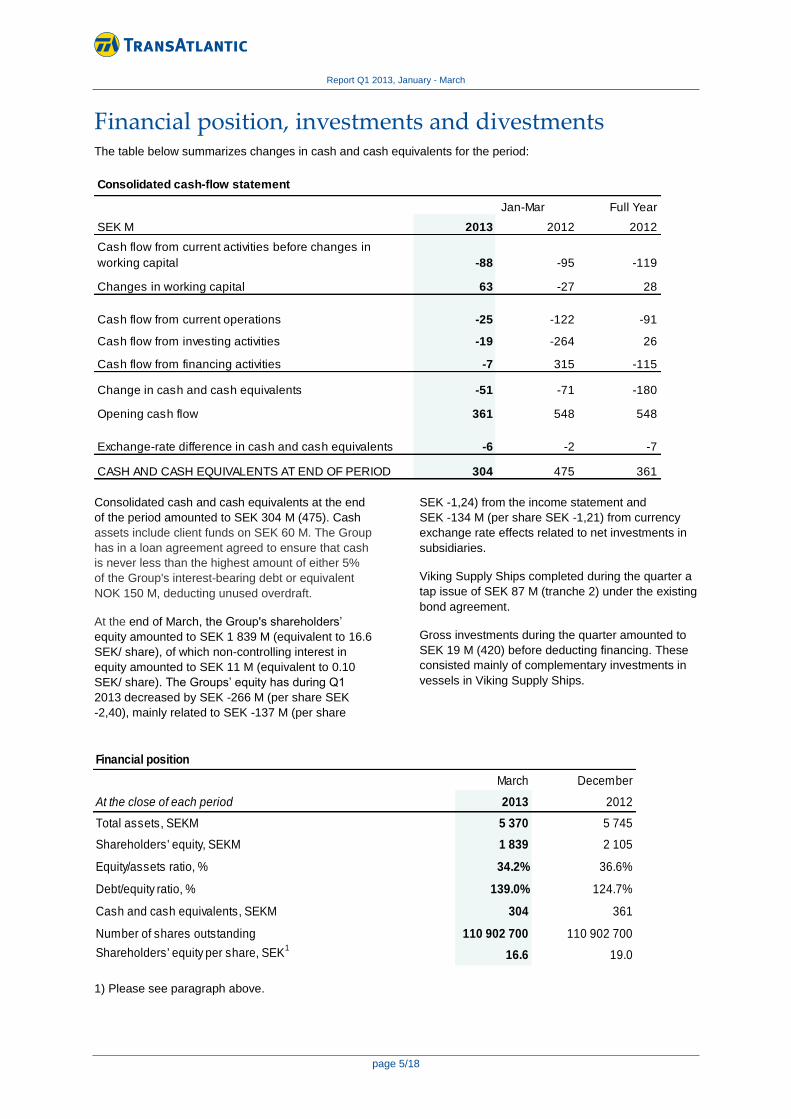
Financial position, investments and divestments The table below summarizes changes in cash and cash equivalents for the period:
SEK M 2013 2012 2012
Cash flow from current activities before changes in
working capital -88 -95 -119
Changes in working capital 63 -27 28
Cash flow from current operations -25 -122 -91
Cash flow from investing activities -19 -264 26
Cash flow from financing activities -7 315 -115
Change in cash and cash equivalents -51 -71 -180
Opening cash flow 361 548 548
Exchange-rate difference in cash and cash equivalents -6 -2 -7
CASH AND CASH EQUIVALENTS AT END OF PERIOD 304 475 361
Full Year Jan-Mar
Consolidated cash-flow statement
Consolidated cash and cash equivalents at the end
of the period amounted to SEK 304 M (475). Cash
assets include client funds on SEK 60 M. The Group
has in a loan agreement agreed to ensure that cash
is never less than the highest amount of either 5%
of the Group's interest-bearing debt or equivalent
NOK 150 M, deducting unused overdraft.
At the end of March, the Group's shareholders’
equity amounted to SEK 1 839 M (equivalent to 16.6
SEK/ share), of which non-controlling interest in
equity amounted to SEK 11 M (equivalent to 0.10
SEK/ share). The Groups’ equity has during Q1
2013 decreased by SEK -266 M (per share SEK
-2,40), mainly related to SEK -137 M (per share
SEK -1,24) from the income statement and
SEK -134 M (per share SEK -1,21) from currency
exchange rate effects related to net investments in
subsidiaries.
Viking Supply Ships completed during the quarter a
tap issue of SEK 87 M (tranche 2) under the existing
bond agreement.
Gross investments during the quarter amounted to
SEK 19 M (420) before deducting financing. These
consisted mainly of complementary investments in
vessels in Viking Supply Ships.
1) Please see paragraph above.
Financial position
March December
At the close of each period 2013 2012
Total assets, SEKM 5 370 5 745
Shareholders' equity, SEKM 1 839 2 105
Equity/assets ratio, % 34.2% 36.6%
Debt/equity ratio, % 139.0% 124.7%
Cash and cash equivalents, SEKM 304 361
Number of shares outstanding 110 902 700 110 902 700
Shareholders' equity per share, SEK1
16.6 19.0

Report Q1 2013, January - March
page 6/18
Industrial Shipping business area The first quarter was marked by a tough
market with excess capacity and further
reduced demand. The weak euro has
affected earnings negatively, while the
weak dollar has contributed to a positive
effect. The operational result for the
business for the first quarter is SEK -62
million (-63).
Despite the difficult market, the first quarter results
is in line with last year, though slightly worse than
expected. This means that despite an unimproved
result, costs have been cut and market shares are
won. Activities to further increase focus on
customers and sales are ongoing in parallel with
efficiency and cost-cutting measures which include
reflagging, bunker savings, changed crew policy
and consolidation of offices.
RoRo
Regular services have been conducted between
Finland and Sweden / Germany / Belgium with four
lines, TransLumi Line (TLL), TransBothnia Line
(TBL), TransFeeder North (TFN) and TransBothnia
Container Line (TBCL). TBCL, acquired in 2012,
has been integrated and further enhanced the
business area's offering in the Gulf of Bothnia. The
division's volumes declined during the quarter due
to the prevailing economic conditions. Focused
sales aktivities has resulted in new business that
has partially offset the volume decline within the
existing customer base.
Container
The container-based shipping route to England,
(TransPal Line) and feeder traffic to Germany
(TransFeeder South) experienced a mild winter but
economic conditions, combined with excess
capacity has affected the division lines negatively
through lower freight rates and lower volumes.
Bulk
The weak market with declining freight rates has persisted from the previous year in both large bulk and small bulk segments. The ice-classed vessels have not seen the premier freight rates, which have been customary in previous years, partly because of the late and relatively mild winter.
During the next quarter beneficial effects of
accelerated growth and cost improvement initiatives
is expected although the continued weak market
with low demand is likely to partially counteract the
impact of those initiatives.
Industrial Shipping
SEK M 2013 2012 2012
Net sales 489 648 2 212
Result before capital costs, EBITDA -44 -27 -125
Operational result -62 -63 -208
Profit margin -12.7% -9.7% -9.4%
January-March Full year
0
200
400
600
800
Q22011
Q3 Q4 Q12012
Q2 Q3 Q4 Q12013
Net Sales Industrial Shipping, SEK M
-80
-60
-40
-20
0
Q22011
Q3 Q4 Q12012
Q2 Q3 Q4 Q12013
Operational result, Industrial Shipping, SEK M
Report Q1 2013, January - March
page 7/18
Viking Supply Ships business area Traditionally Q1 is a season of low activity,
however due to periods with poor weather
the spot market saw some periods with
increased rates. As a whole, the quarter
was characterized by soft market
conditions. The first quarter resulted in an
operational loss of SEK -76 M.
Anchor Handling Tug Supply vessels (AHTS
During the first quarter of 2013 two vessels were on
term charters, while six were traded in the North
Sea spot market. The vessels on term charters
obtained an average fixture rate of NOK 348.000.
The vessels on the spot market obtained an
average fixture rate of NOK 169.000 and a
utilization of 57%. For the first quarter the AHTS
fleet as a whole obtained an average fixture rate of
NOK 232.300 and a utilization of 67%.
Tor Viking and Balder Viking have been on stand-by
duties for the Swedish Maritime Administration
during the quarter. The 15 year contract with the
Swedish Maritime Administration (SMA) for the
AHTS icebreakers Tor Viking and Balder Viking was
not extended, and the vessels will end the contract
after Q1 2014 and Q1 2015 respectively. The
release enables VSS to offer the vessels for long
term contract opportunities.
During the quarter VSS signed a time charter of one
of its AHTS icebreaker vessels with a major oil
company. The charter agreement applies to the
2014 and 2015 drilling seasons in sub-Arctic waters
with options for 2016 and 2017.
The duration of each season will be approximately 7
months including mobilization and demobilization
with commencement around May 1st each year. The
commencement of Magne Viking’s charter to
Chevron has been delayed and likely departure
from the North Sea is during June.
Platform Supply Vessels (PSV)
Two of the vessels were on medium term contracts
during the first quarter, while four vessels were
traded in the North Sea spot market. The vessels on
term contracts obtained an average fixture rate of
GBP 11.100. The vessels on the spot market
obtained an average fixture rate of GBP 8.200
against a utilization of 45%. For the first quarter the
PSV fleet as a whole obtained an average fixture
rate of GBP 9.700 and a utilization of 63%.
Supply of AHTS vessels in the North Sea has been
gradually reduced during the quarter and is likely to
remain unchanged in the next quarter. With new
rigs commencing work in the near future, it is
expected that the market will tighten towards the
summer and autumn. For the PSV segment,
demand has shown a strong capability of absorbing
new tonnage. With several new rigs also
commencing contracts in the North Sea during the
next few months it is expected that the PSV market
will gradually improve as the summer-season
approaches.
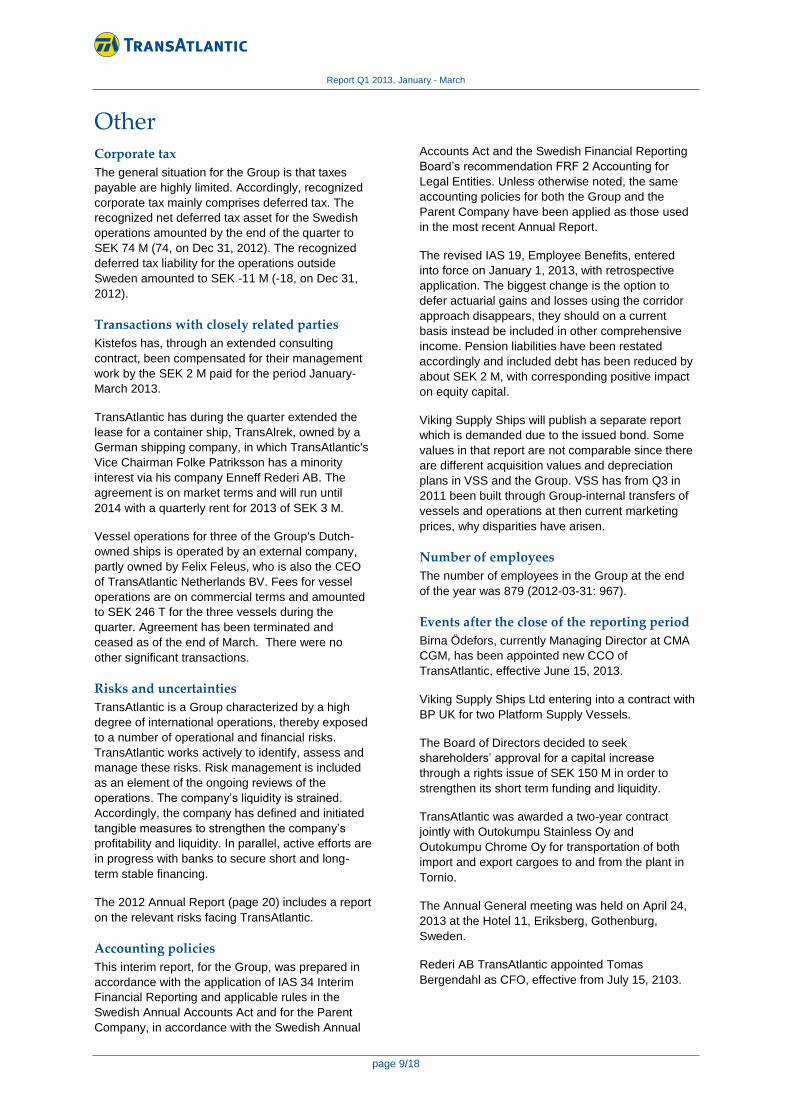
Viking Supply Ships
SEK M 2013 2012 2012
Net sales 196 213 1 062
Result before capital costs, EBITDA 2) 19 12 245
Operational result -76 -88 -119
Profit margin -38.8% -41.3% -11.2%
January-March Full year
0
100
200
300
400
Q22011
Q3 Q4 Q12012
Q2 Q3 Q4 Q12013
Net sales Viking Supply Ships, SEKM
-100
-50
0
50
Q22011
Q3 Q4 Q12012
Q2 Q3 Q4 Q12013
Operational result Viking Supply Ships, SEKM

Report Q1 2013, January - March
page 8/18
Parent company
Earnings and financial position
The Parent Company’s result before tax for the
quarter amounted to SEK -40 M (67). The result
after tax for the period amounted to SEK -40 M (76).
The Parent Company’s total assets amounted to
SEK 2 567 M (2 607 on Dec 31, 2012). The
equity/assets ratio on the balance-sheet date was 74 %
(75 on Dec 31, 2012). Cash and cash equivalents at the
end of the period amounted to SEK 53 M (84).
Number of shares
Share distribution on March 31, 2013 is presented
below:
Number of Series A shares 7 271 842
Number of Series B shares, listed 103 630 858
Total number of shares 110 902 700
See also Changes in Group’s shareholders’ equity,
page 14.
Report Q1 2013, January - March
page 9/18
Other Corporate tax
The general situation for the Group is that taxes
payable are highly limited. Accordingly, recognized
corporate tax mainly comprises deferred tax. The
recognized net deferred tax asset for the Swedish
operations amounted by the end of the quarter to
SEK 74 M (74, on Dec 31, 2012). The recognized
deferred tax liability for the operations outside
Sweden amounted to SEK -11 M (-18, on Dec 31,
2012).
Transactions with closely related parties
Kistefos has, through an extended consulting
contract, been compensated for their management
work by the SEK 2 M paid for the period January-
March 2013.
TransAtlantic has during the quarter extended the
lease for a container ship, TransAlrek, owned by a
German shipping company, in which TransAtlantic's
Vice Chairman Folke Patriksson has a minority
interest via his company Enneff Rederi AB. The
agreement is on market terms and will run until
2014 with a quarterly rent for 2013 of SEK 3 M.
Vessel operations for three of the Group's Dutch-
owned ships is operated by an external company,
partly owned by Felix Feleus, who is also the CEO
of TransAtlantic Netherlands BV. Fees for vessel
operations are on commercial terms and amounted
to SEK 246 T for the three vessels during the
quarter. Agreement has been terminated and
ceased as of the end of March. There were no
other significant transactions.
Risks and uncertainties
TransAtlantic is a Group characterized by a high
degree of international operations, thereby exposed
to a number of operational and financial risks.
TransAtlantic works actively to identify, assess and
manage these risks. Risk management is included
as an element of the ongoing reviews of the
operations. The company’s liquidity is strained.
Accordingly, the company has defined and initiated
tangible measures to strengthen the company’s
profitability and liquidity. In parallel, active efforts are
in progress with banks to secure short and long-
term stable financing.
The 2012 Annual Report (page 20) includes a report
on the relevant risks facing TransAtlantic.
Accounting policies
This interim report, for the Group, was prepared in
accordance with the application of IAS 34 Interim
Financial Reporting and applicable rules in the
Swedish Annual Accounts Act and for the Parent
Company, in accordance with the Swedish Annual
Accounts Act and the Swedish Financial Reporting
Board’s recommendation FRF 2 Accounting for
Legal Entities. Unless otherwise noted, the same
accounting policies for both the Group and the
Parent Company have been applied as those used
in the most recent Annual Report.
The revised IAS 19, Employee Benefits, entered
into force on January 1, 2013, with retrospective
application. The biggest change is the option to
defer actuarial gains and losses using the corridor
approach disappears, they should on a current
basis instead be included in other comprehensive
income. Pension liabilities have been restated
accordingly and included debt has been reduced by
about SEK 2 M, with corresponding positive impact
on equity capital.
Viking Supply Ships will publish a separate report
which is demanded due to the issued bond. Some
values in that report are not comparable since there
are different acquisition values and depreciation
plans in VSS and the Group. VSS has from Q3 in
2011 been built through Group-internal transfers of
vessels and operations at then current marketing
prices, why disparities have arisen.
Number of employees
The number of employees in the Group at the end
of the year was 879 (2012-03-31: 967).
Events after the close of the reporting period
Birna Ödefors, currently Managing Director at CMA
CGM, has been appointed new CCO of
TransAtlantic, effective June 15, 2013.
Viking Supply Ships Ltd entering into a contract with
BP UK for two Platform Supply Vessels.
The Board of Directors decided to seek
shareholders’ approval for a capital increase
through a rights issue of SEK 150 M in order to
strengthen its short term funding and liquidity.
TransAtlantic was awarded a two-year contract
jointly with Outokumpu Stainless Oy and
Outokumpu Chrome Oy for transportation of both
import and export cargoes to and from the plant in
Tornio.
The Annual General meeting was held on April 24,
2013 at the Hotel 11, Eriksberg, Gothenburg,
Sweden.
Rederi AB TransAtlantic appointed Tomas
Bergendahl as CFO, effective from July 15, 2103.
Report Q1 2013, January - March
page 10/18
Press and analyst conference
In conjunction with the publication of the Q1-report
2013, an earnings call will take place on May 15,
2013 at 01.00 pm (GMT + 1) with TransAtlantic’s
CEO, Henning E. Jensen. In connection with the
conference, a presentation will be available at the
company’s website, www.rabt.se. Please see
Investor Relations/Q1 Report 2013.
This information is such that TransAtlantic is obligated to publish in accordance with the Swedish Securities Act
and/or the Swedish Financial Instruments Trading Act. This report has been prepared in both Swedish and
English versions. In case of variations in the content between the two versions, the Swedish version shall govern.
This report was submitted for publication at 8:30 a.m. on May 15, 2013.
The Board of Directors and the CEO confirm that the year-end report gives an accurate summary of the
Company’s and the Groups’ activities, position and results and describes the noteworthy risks and uncertainty
faced by the Company and companies that are includes within the Group.
Gothenburg, May 15, 2013
The Board of Directors of Rederi AB TransAtlantic
For further information, please contact Head of Corporate Communications Carina Dietmann +46 (0) 31-763 2334.
Financial calendar 2013 February 26 Year-end report 2012
April 24 Annual General Meeting
May 15 Interim report January – March
August 7 Interim report January-June
October 30 Interim report January – September
The Year-end report is available in its entirety on the company’s website.
Report Q1 2013, January - March
page 11/18
Full year
All amounts in SEK M 2013 2012 2012
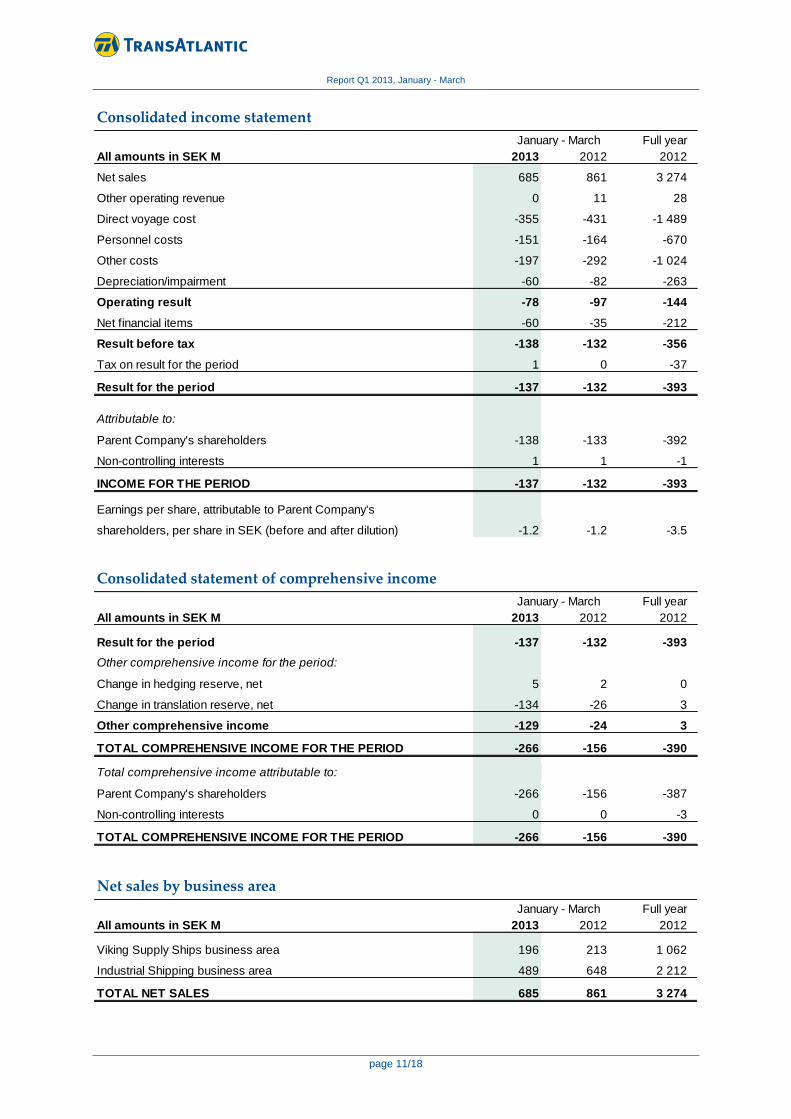
Net sales 685 861 3 274
Other operating revenue 0 11 28
Direct voyage cost -355 -431 -1 489
Personnel costs -151 -164 -670
Other costs -197 -292 -1 024
Depreciation/impairment -60 -82 -263
Operating result -78 -97 -144
Net financial items -60 -35 -212
Result before tax -138 -132 -356
Tax on result for the period 1 0 -37
Result for the period -137 -132 -393
Attributable to:
Parent Company's shareholders -138 -133 -392
Non-controlling interests 1 1 -1
INCOME FOR THE PERIOD -137 -132 -393
Earnings per share, attributable to Parent Company's
shareholders, per share in SEK (before and after dilution) -1.2 -1.2 -3.5
Consolidated income statement
January - March
Full year
All amounts in SEK M 2013 2012 2012
Result for the period -137 -132 -393
Other comprehensive income for the period:
Change in hedging reserve, net 5 2 0
Change in translation reserve, net -134 -26 3
Other comprehensive income -129 -24 3
TOTAL COMPREHENSIVE INCOME FOR THE PERIOD -266 -156 -390
Total comprehensive income attributable to:
Parent Company's shareholders -266 -156 -387
Non-controlling interests 0 0 -3
TOTAL COMPREHENSIVE INCOME FOR THE PERIOD -266 -156 -390
Consolidated statement of comprehensive income
January - March
Full year
All amounts in SEK M 2013 2012 2012
Viking Supply Ships business area 196 213 1 062
Industrial Shipping business area 489 648 2 212
TOTAL NET SALES 685 861 3 274
Net sales by business area
January - March
Report Q1 2013, January - March
page 12/18
Full year
All amounts in SEK M 2013 2012 2012
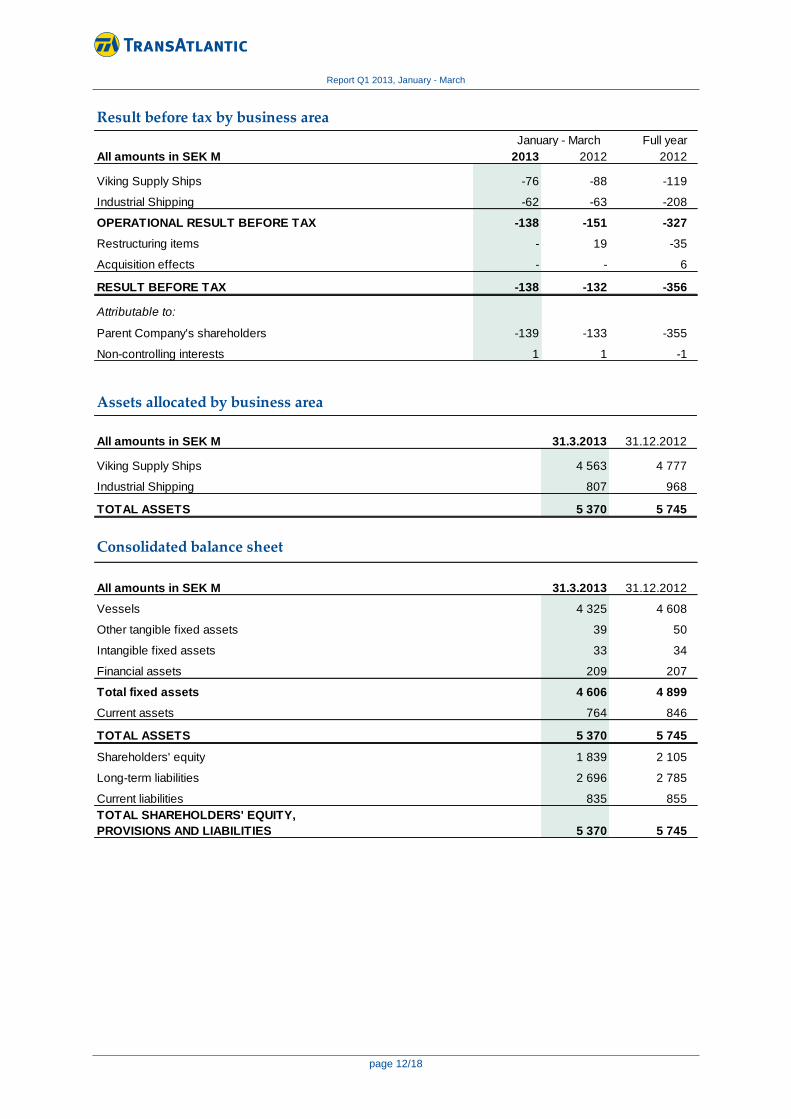
Viking Supply Ships -76 -88 -119
Industrial Shipping -62 -63 -208
OPERATIONAL RESULT BEFORE TAX -138 -151 -327
Restructuring items - 19 -35
Acquisition effects - - 6
RESULT BEFORE TAX -138 -132 -356
Attributable to:
Parent Company's shareholders -139 -133 -355
Non-controlling interests 1 1 -1
Result before tax by business area
January - March
All amounts in SEK M 31.3.2013 31.12.2012
Viking Supply Ships 4 563 4 777
Industrial Shipping 807 968
TOTAL ASSETS 5 370 5 745
Assets allocated by business area
Consolidated balance sheet
All amounts in SEK M 31.3.2013 31.12.2012
Vessels 4 325 4 608
Other tangible fixed assets 39 50
Intangible fixed assets 33 34
Financial assets 209 207
Total fixed assets 4 606 4 899
Current assets 764 846
TOTAL ASSETS 5 370 5 745
Shareholders' equity 1 839 2 105
Long-term liabilities 2 696 2 785
Current liabilities 835 855
TOTAL SHAREHOLDERS' EQUITY,
PROVISIONS AND LIABILITIES 5 370 5 745

Report Q1 2013, January - March
page 13/18
The valuation of financial assets and liabilities in the balance sheet are based on aquisition value or fair value.
The valuation of FX derivatives and interest rate derivatives are based on fair value. The balance items
"Current assets" includes derivatives by SEK 5 M (0), "Long-term liabilities" by SEK 41 M (43) and
"Current liabilities" by SEK 0 M (2). Valuation of other financial assets and liabilities items in the balance sheets
are based on aquisition value.
The input used in the valuation of financial instruments base the three level classification:
Level 1, fair values based on market values, where the instruments are traded on an active market, are
available. Level 2, no market values based on an active market are available, valuations are instead based
on measurements of discounted cash flows. Level 3, at least one variable is based on own assessments.
The fair value valuation of the Group´s FX- and intrerest rate instruments are based on input according to level 2.
Valuation of financial assets and liabilities
Assessment of fair value of financial instruments
Full year
MSEK 2013 2012 2012
Cash flow from operations before changes in working
capital -88 -95 -119
Changes in working capital 63 -27 28
Cash flow from current operations -25 -122 -91
Cash flow from investing activities -19 -264 26
Cash flow from financing activities -7 315 -115
Changes in cash and cash equivalents -51 -71 -180
Cash flow at beginning of period 361 548 548
Exchange-rate difference in cash and cash equivalents -6 -2 -7
CASH AND CASH EQUIVALENTS AT END OF PERIOD 304 475 361
Consolidated cash-flow statement
January - March
Report Q1 2013, January - March
page 14/18
Full year
All amounts in SEK M 2013 2012 2012
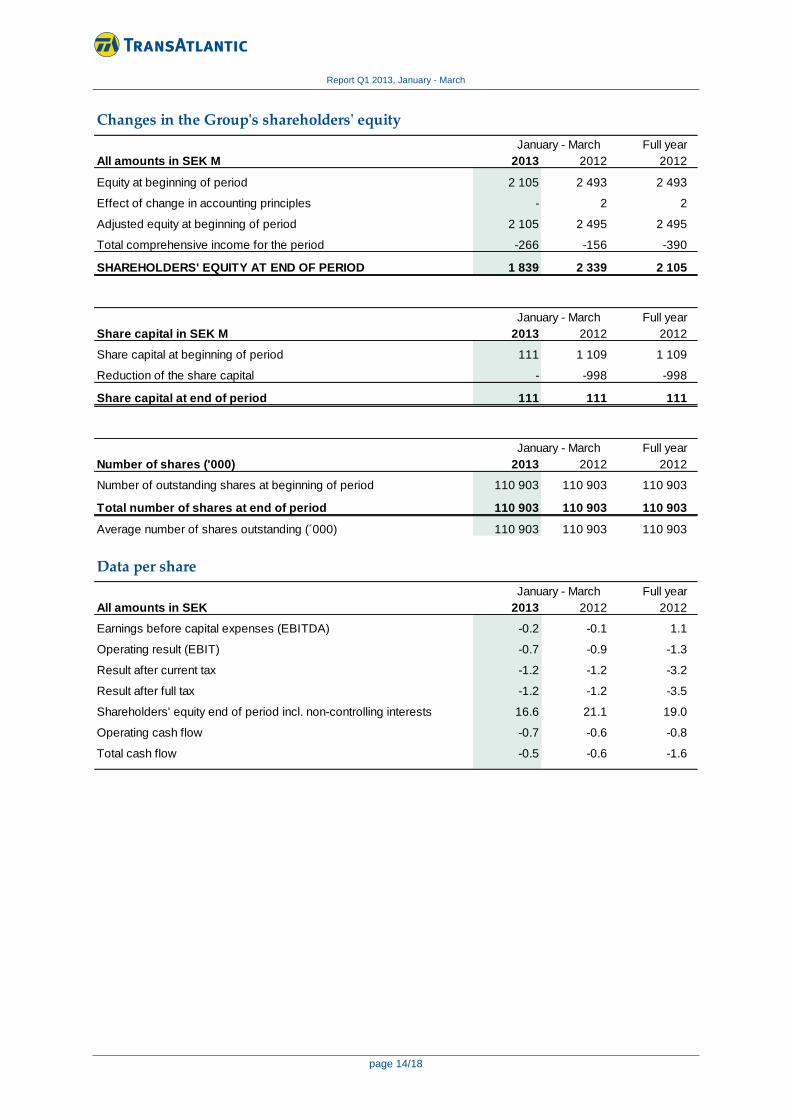
Equity at beginning of period 2 105 2 493 2 493
Effect of change in accounting principles - 2 2
Adjusted equity at beginning of period 2 105 2 495 2 495
Total comprehensive income for the period -266 -156 -390
SHAREHOLDERS' EQUITY AT END OF PERIOD 1 839 2 339 2 105
Full year
Share capital in SEK M 2013 2012 2012
Share capital at beginning of period 111 1 109 1 109
Reduction of the share capital - -998 -998
Share capital at end of period 111 111 111
Full year
Number of shares ('000) 2013 2012 2012
Number of outstanding shares at beginning of period 110 903 110 903 110 903
Total number of shares at end of period 110 903 110 903 110 903
Average number of shares outstanding (´000) 110 903 110 903 110 903
January - March
Changes in the Group's shareholders' equity
January - March
January - March
Data per share
Full year
All amounts in SEK 2013 2012 2012
Earnings before capital expenses (EBITDA) -0.2 -0.1 1.1
Operating result (EBIT) -0.7 -0.9 -1.3
Result after current tax -1.2 -1.2 -3.2
Result after full tax -1.2 -1.2 -3.5
Shareholders' equity end of period incl. non-controlling interests 16.6 21.1 19.0
Operating cash flow -0.7 -0.6 -0.8
Total cash flow -0.5 -0.6 -1.6
January - March

Report Q1 2013, January - March
page 15/18
Full year
2013 2012 2012
Earnings before capital expenses (EBITDA) SEK M -18 -15 120
Operating result (EBIT) SEK M -78 -97 -143
Shareholders' equity SEK M 1 839 2 337 2 105
Net indebtedness SEK M 2 556 2 916 2 623
Operating cash flow SEK M -79 -69 -94
Total cash flow SEK M -51 -71 -180
Return on capital employed % -6.3 -6.9 -2.7
Return on shareholders' equity % -27.9 -21.8 -17.1
Equity/assets ratio % 34.2 36.1 36.6
Debt/equity ratio % 139.0 127.7 124.7
Profit margin % -20.2 -15.3 -10.9
Key data
January - March
Full year
All amounts in SEK M 2013 2012 2012
Net sales 283 292 1 247
Other operating revenue 0 11 18
Direct voyage costs -136 -135 -486
Personnel costs -42 -44 -166
Other costs -147 -147 -695
Depreciation/impairment -1 -1 -3
Operating result -43 -24 -85
Net financial items 3 91 -126
Result before tax -40 67 -211
Tax on result for the year 0 9 -67
RESULT FOR THE PERIOD -40 76 -278
Other comprehensive income - - -
TOTAL COMPREHENSIVE INCOME FOR THE PERIOD -40 76 -278
Parent Company income statement
January - March

Report Q1 2013, January - March
page 16/18
All amounts in SEK M 31.3.2013 31.12.2012
Tangible fixed assets 3 3
Intangible fixed assets 22 23
Financial fixed assets 2 819 2 793
Total fixed assets 2 844 2 819
Current asstes 620 647
TOTAL ASSETS 3 464 3 466
Shareholders' equity 2 567 2 607
Provisions 7 7
Longterm liabilities 593 584
Current liabilities 297 268
TOTAL SHAREHOLDERS' EQUITY,
PROVISIONS AND LIABILITIES 3 464 3 466
Parent Company balance sheet
Full year
All amounts in SEK M 2013 2012 2012
Shareholders' equity at beginning of period 2 605 2 883 2 883
Effect of change in accounting principles 2 2 2
Adjusted equity at beginning of period 2 607 2 885 2 885
Total comprehensive income for the period -40 76 -278
SHAREHOLDERS' EQUITY AT END OF PERIOD 2 567 2 961 2 607
January - March
Changes in Parent Company's shareholders' equity

Report Q1 2013, January - March
page 17/18
Definitions Capital employed
Interest-bearing liabilities and shareholders’ equity.
Debt/equity ratio
Interest-bearing liabilities minus cash and cash
equivalents divided by shareholders’ equity.
Disinvestment
Divestment of fixed assets.
Dividend yield
Dividend per share divided by the closing share
price at year-end.
Earnings per share
Profit after financial items less 1) current tax, 2) tax
on profit for the year (current and deferred tax) in
accordance with the consolidated income
statement.
EBIT
Earnings before interest and taxes, corresponding
to operating profit/loss.
EBITDA
Earnings before interest, taxes, depreciation and
amortization, corresponding to profit/loss before
capital expenses and tax.
Equity/assets ratio
Shareholders’ equity divided by total assets.
Equity per share
Equity divided by the number of shares outstanding.
Hedging
A general term for financial measures taken to avoid
undesirable effects on earnings due to variations in
interest rates, exchange rates, etc.
IFRS
International Financial Reporting Standards – an
international accounting standard used by all listed
companies. Some older standards included in IFRS
include IAS (International Accounting Standards).
Interest coverage ratio
Operating profit/loss before depreciation plus
interest income divided by interest expense.
Net indebtedness
Interest-bearing liabilities less cash and cash
equivalents.
Operating cash flow
Profit/loss after financial income/expense adjusted
for capital gains/losses, depreciation/amortization
and impairment.
Operating profit/loss (before tax)
Profit/loss before tax and before restructuring costs.
Operational profit/loss per business area
Profit/loss after financial items and before Group-
wide expenses and central/Group-wide net financial
income/expenses.
Operating profit/loss
Profit/loss before financial items and tax, and before
restructuring costs.
Profit margin
Profit after financial items divided by net sales.
Return on equity
Profit after financial items less tax on profit for the
year, divided by average shareholders’ equity.
Return on capital employed
Profit before depreciation and amortization (EBIT)
divided by average capital employed.
Restructuring costs
Includes revenues and expenses of a non-recurring
nature, such as capital gains/losses from the sale of
vessels, impairment of vessels and costs related to
personnel cutbacks.
Share of interest-bearing capital
Equity and deferred tax (including minority share)
divided by total assets.
Total cash flow
Cash flow from operating activities, investing
activities and financing activities
Report Q1 2013, January - March
page 18/18
Rederi AB TransAtlantic (RABT) is a leading Swedish
shipping company with headquarters in Gothenburg,
Sweden, and additional offices in Europe. TransAtlantic is
organized into two business areas: Industrial Shipping and
Viking Supply Ships. Viking Supply Ships, which is active in
offshore and icebreaking, is also a wholly owned subsidiary
of RABT. The Industrial Shipping business area consists of
three divisions: Bulk, Container and RoRo. The Group has
about 800 employees and generated sales of SEK 3,274 M
in 2012. The company’s Series B shares are listed on the
NASDAQ OMX Stockholm, Small Cap segment.
www.rabt.com
Rederi AB TransAtlantic (publ) Visiting address: Lindholmsallén 10 Box 8809, SE-402 71 Gothenburg, Sweden Tel: +46 31–763 23 00 E-mail: [email protected] www.rabt.com