delaware performance appraisal system second … about performance appraisal. ... announced...
TRANSCRIPT

Delaware Performance Appraisal System Second Edition
(DPAS II)
Year 5 Report June 2012
Submitted By:
Dr. Donald E. Beers Principal Investigator
2021-A North Halsted Street
Chicago, IL 60614 www.progresseducation.com

2011-12 DPAS II Evaluation Report i June 2012
TABLE OF CONTENTS
EXECUTIVE SUMMARY .............................................................................1 Background..................................................................................................................1 Summary of Survey Results - Key Findings 2011-2012...........................................2
Teachers .....................................................................................................................2 Specialists ...................................................................................................................4 Administrators .............................................................................................................6 General Findings.........................................................................................................9
INTRODUCTION........................................................................................11
RECOMMENDATIONS..............................................................................12 Teachers .....................................................................................................................12 Specialists ..................................................................................................................14 Administrators ...........................................................................................................14
METHODS .................................................................................................16 Methodology ..............................................................................................................16 Questions ...................................................................................................................16 Statistical Analysis ....................................................................................................20
RESULTS ..................................................................................................25 Indicators of Performance (Q1) ................................................................................25
Teachers ...................................................................................................................25 Specialists .................................................................................................................26 Administrators ...........................................................................................................27
Evaluation Criteria Items (Q3) ..................................................................................28 Teachers ...................................................................................................................28 Specialists .................................................................................................................29 Administrators ...........................................................................................................30
Documentation (Q4, Q5, Q7, Q8, Q9) .......................................................................31 Teachers ...................................................................................................................31 Specialists .................................................................................................................32 Administrators ...........................................................................................................33
Feedback (Q2, Q6, Q12) ............................................................................................35 Teachers ...................................................................................................................35

2011-12 DPAS II Evaluation Report ii June 2012
Specialists .................................................................................................................36 Administrators ...........................................................................................................36
System / Training Related Items (Q13, Q14, Q17, Q18, Q20) .................................37 Teachers ...................................................................................................................37 Specialists .................................................................................................................39 Administrators ...........................................................................................................42
Data Related Issues (Q10).........................................................................................44 Improvement Plans (Q16) .........................................................................................45 Website Evaluation (Q24)..........................................................................................47 Handling Unique Circumstances (Q25) ...................................................................48 General System (Q26) ...............................................................................................48 Overall Grade .............................................................................................................51 Focus Group Findings ..............................................................................................53
Teacher Focus Groups .............................................................................................53 Specialists Focus Group Findings.............................................................................54 Administrator Focus Group Findings.........................................................................55 Actual Time Intervals.................................................................................................55
Evaluation Process (Q22, Q23).................................................................................58 Evaluating Administrators .........................................................................................58 Evaluating Teachers .................................................................................................60 Evaluating Specialists ...............................................................................................62

2011-12 DPAS II Evaluation Report 1 June 2012
EXECUTIVE SUMMARY
Background The Delaware State Department of Education presented a very clear expectation for the evaluation of DPAS II. The stated goals of DPAS II are equally specific as stated on the Department of Education’s web site,
The purpose of DPAS II is two-fold: • Quality assurance
• Professional growth Quality assurance focuses on the collection of credible evidence about the performance of educators. Evaluators use this evidence to make important decisions: recognizing effective practice, recommending continued employment, recommending an improvement plan, or beginning dismissal proceedings. Professional growth focuses on enhancing the skills and knowledge of educators. Through self-assessment and goal-setting, working with colleagues, taking courses, attending workshops, designing new programs, piloting new programs or approaches, developing proficiency in test data analysis, and many other learning opportunities, educators improve their professional practice in ways that will contribute to improved student learning. Both purposes serve accountability: to assure that educators are performing at an acceptable level and to provide professional growth opportunities that improve skills and knowledge.
The goal of this evaluation was to determine the reality of the current condition in meeting the stated goals. The majority of the findings center on the practices and processes of DPAS II. The practices provide an understanding of the quality of training, manuals, forms, and general deployment. The processes stem from fundamental policies and underlying theory about performance appraisal. This report is divided into four major sections: Executive Summary, Recommendations, Methods, and Results. Contained in these sections are the specific data collected and the methodologies used for analysis. The recommendations are very specific and tied to the major findings of the data collection process described under Results.

2011-12 DPAS II Evaluation Report 2 June 2012
Summary of Survey Results - Key Findings 2011-2012 To show trends over time, the rankings of most desirable and least desirable responses without new items are provided. Then following those rankings, information on rankings of new items is presented.
Teachers 1) Among teachers, the items with the most desirable responses in 2008-2009
were: a) That they are able to provide evidence of practice through discussion. b) The five components used to evaluate performance are understandable. c) The written feedback is aligned with the five components. d) The feedback received is adequate.
In 2009-2010, the items with the most desirable responses were: a) The five components used to evaluate performance are understandable. b) That they are able to provide evidence of practice through discussion. c) The oral feedback they receive is useful. d) The written feedback is aligned with the five components. e) The feedback received is adequate.
In 2010-2011, the items with the most desirable responses were: a) That they are to provide evidence of my practice through discussion. b) The five components used to evaluate my performance are
understandable. c) The criteria used to evaluate the instruction component can be accurately
judged by the evaluator. d) The written feedback received is aligned with the five components. e) The feedback received is adequate.
In 2011-2012, the items with the most desirable responses were: a) I am able to provide evidence of my practice through discussion. b) The four components used to evaluate my performance are
understandable. c) The written feedback I receive is aligned with the four components. d) I am able to provide the evidence for him/her to accurately determine my
effectiveness.

2011-12 DPAS II Evaluation Report 3 June 2012
e) The oral feedback I receive is useful and applicable.
2) Among teachers, the items with the least desirable responses in 2008-2009 were: a) That classroom level DSTP provides an accurate picture of students’
progress. b) That DSTP data helps adjust instruction for students. c) Additional training would make them more competent in the process. d) That there was congruence with the results of school level data and
classroom level data.
In 2009-2010, the items with the least desirable responses were: a) Applying all five components in my work is easy. b) The criteria used to evaluate me for the student improvement component
can be accurately judged by my evaluator. c) The current DPAS evaluation system should be continued in its current
form. d) Additional training would make me feel more competent in the process. e) The DPAS evaluation system needs improving. In 2010-2011, the items with the least desirable responses were: a) Additional training would make me feel more competent in the process. b) The DPAS evaluation system needs improving. c) The criteria used to evaluate me for the student improvement component
can be accurately judged by my evaluator. d) The current DPAS evaluation system should be continued in its current
form. e) Applying all five components in my work is easy.
In 2011-2012, the items with the least desirable responses were: a) The forms make the process easy to implement. b) The time it takes to complete the DPAS II paperwork requirements is
reasonable. c) The current DPAS II evaluation system should be continued in its current
form. d) The forms are easy to complete. e) Additional training would make me feel more competent in the process.
2011-12 DPAS II Evaluation Report 4 June 2012
New items that had high levels of positive responses and based on the weighted scores would have been in the rankings with the original items include:
a) Announced observations are valuable in the DPAS II process. b) Building level administrators are valuable in the DPAS II process.
New items that had undesirable responses with weighted scores that would have been in the rankings with the original items include:
a) Administrator walk-throughs improve teaching more than announced observations.
b) Unannounced observations by an administrator improve teaching more than walk-throughs.
c) Walk-throughs should be part of a formative evaluation. d) Prior to DPAS II, walk-throughs were conducted more frequently during
the year. e) Walk-throughs should be part of a summative evaluation. f) District-level administrators are valuable in the DPAS II process. g) Data coaches are valuable in the DPAS II process.
Specialists To show trends over time, the rankings of most desirable and least desirable responses without new items are provided. Then following those rankings, information on rankings of new items where applicable is shown. 1) Among specialists, the items with the most desirable responses in 2008-2009
were: a) They are able to provide evidence of practice through discussion. b) The evaluator completes paperwork in a reasonable time period. c) The five components used to evaluate performance are understandable. d) The evaluator handles the workload effectively. e) The feedback received is adequate.
In 2009-2010, the items with the most desirable responses were: a) They are able to provide evidence of practice through discussion. b) The evaluator completes paperwork in a reasonable time period. c) The oral feedback I receive is useful and applicable. d) The feedback received is adequate.
2011-12 DPAS II Evaluation Report 5 June 2012
e) The evaluator handles the workload effectively. In 2010-2011, the items with the most desirable responses from specialists were: a) I am able to provide evidence of my practice through discussion. b) The evaluator completes paperwork in a reasonable time period. c) The oral feedback I receive is useful and applicable. d) Overall, the feedback I receive is adequate. e) My evaluator(s) handle the workload effectively. In 2011-2012, the items with the most desirable responses from specialists were: a) I am able to provide evidence of my practice through discussion. b) The oral feedback I receive is useful and applicable. c) The written feedback I receive is aligned with the four components. d) The oral feedback I receive is aligned with the four components. e) The feedback I receive is adequate.
2) Among specialists, the items with the least desirable responses in 2008-2009
were: a) That DSTP data gives an accurate picture of their school’s progress. b) DSTP data helps them adjust goals for students and the school. c) Additional training would make them feel more competent in the process. d) The evaluation system should continue in its current form.
In 2009-2010, the items with the least desirable responses were: a) Applying all five components in my work is easy. b) I believe the current DPAS evaluation system should be continued in its
current form. c) Additional training would make me feel more competent in the process. d) The criteria used to evaluate me for the student improvement component
can be accurately judged by my evaluator. e) The DPAS evaluation system needs improving.
In 2010-2011, the items with the least desirable responses were: a) I was able to complete the data documentation requirements without
difficulty. b) There was enough training and/or support for me to accurately complete
the forms related to student improvement.

2011-12 DPAS II Evaluation Report 6 June 2012
c) Additional training would make me feel more competent in the process. d) I believe the current DPAS evaluation system should be continued in its
current form. e) The criteria used to evaluate me for the student improvement component
can be accurately judged by my evaluator.
In 2011-2012, the items with the least desirable responses were: a) The DPAS II evaluation system needs improving. b) Student data gives me an accurate picture of my school’s progress. c) I was able to complete the data documentation requirements without
difficulty. d) The time it takes to complete the DPAS II paperwork requirements is
reasonable. e) I believe the DPAS II evaluation system should be continued in its current
form. New items that had high levels of positive responses and based on the weighted scores would have been in the rankings with the standard items include:
a) Announced observations are valuable. b) Understanding of the DPAS II process.
New items that had undesirable responses with weighted scores that would have been in the rankings with the standard items include:
a) District level administrators are valuable in the DPAS II process.
Administrators To show trends over time, the rankings of most desirable and least desirable responses without new items are provided. Following those rankings, we provide information on rankings of new items where applicable are shown. 1) Among administrators, the items with the most desirable responses in 2008-2009
were: a) The five components used to evaluate my performance are
understandable. b) The guide is easy to understand. c) The guide is helpful. d) The training materials were helpful. e) The five components used to evaluate performance are reasonable.
2011-12 DPAS II Evaluation Report 7 June 2012
In 2009-2010, the items with the most desirable responses were: a) Student data helps me adjust goals for my school. b) The five components used to evaluate my performance are
understandable. c) The oral feedback I receive is useful and applicable. d) I am able to provide the evidence and documentation needed by my
evaluator for him/her to accurately determine my effectiveness. e) I have access to the information I need to complete the forms. In 2010-2011, the items with the most desirable responses among administrators were: a) The oral feedback I receive is useful and applicable. b) The five components used to evaluate my performance are
understandable. c) The written feedback I receive is aligned with the five components. d) The oral feedback I receive is aligned with the five components. e) Student data helps me adjust goals for my schools.
In 2011-2012, the items with the most desirable responses among administrators were: a) The five components used to evaluate my performance are
understandable. b) The criteria used to evaluate me for the Management component are
effective indicators of my performance. c) The criteria used to evaluate me for the Professional Responsibilities
component are effective indicators of my performance. d) The oral feedback I receive is useful and applicable. e) The written feedback I receive is aligned with the five components. f) I was able to complete the data documentation requirements without
difficulty. 2) Among administrators, the items with the least desirable responses in 2008-2009
were: a) DSTP gives an accurate picture of my school’s progress. b) That the time it takes to complete the DPAS II paperwork is reasonable. c) Additional training would make them feel more competent in the process. d) The current DPAS evaluation system should continue in its current form.

2011-12 DPAS II Evaluation Report 8 June 2012
In 2009-2010, the items with the least desirable responses were: a) Applying all five components in my work is easy. b) That the time it takes to complete the DPAS II paperwork is reasonable. c) The current DPAS evaluation system should continue in its current form. d) Additional training would make them feel more competent in the process. e) The DPAS evaluation system needs improving.
In 2010-2011, the items with the least desirable responses among administrators were: a) I am able to complete paperwork in a reasonable time period. b) The time it takes to complete the DPAS II paperwork requirements is
reasonable. c) The workload is manageable. d) I believe the current DPAS evaluation system should be continued in its
current form. e) The time it takes to complete the DPAS II paperwork requirements is
reasonable. In 2011-2012, the items with the least desirable responses among administrators were: a) The DPAS II evaluation system needs improving. b) The forms make the process easy to implement. c) The forms are easy to complete. d) I believe the current DPAS evaluation system should be continued in its
current form. e) The time it takes to complete the DPAS II paperwork requirements is
reasonable. New items that had high levels of positive responses and based on the weighted scores would have been in the rankings with the standard items include:
a) The level of impact unannounced walk-throughs has on improving performance.
b) The level of impact unannounced observations have on improving performance.
c) The level of impact peer observations has on increasing effective conversations about performance.

2011-12 DPAS II Evaluation Report 9 June 2012
d) The level of impact the Management component has on improving performance.
e) The level of impact the Culture of Learning component has on improving performance.
f) The level of impact DPAS II has on improving performance. g) Understanding of the DPAS II process. h) Understanding of the DPAS II rubrics. i) Understanding of the DPAS II expectations. j) Understanding of the commendations. k) Understanding of the announced observations. l) Understanding of the unannounced observations.
There were no new items that had undesirable responses with weighted scores that would have been in the rankings with the standard items.
General Findings 1) The majority of teachers, specialists, and administrators gave the DPAS II
system a grade of “B.” There was very little difference in the grades between 2009-2010 and 2010-2011 among teachers and specialists. However, among all groups, there was an increase in the percent who gave the system a grade of “C” and a decrease in those that gave a grade of “B.”
2) Among teachers, the best indicator of performance was Instruction. Among
administrators it was Management and Culture of Performance. Professional Practice and Delivery of Service was seen as the best indicator of performance among specialists.
3) Teachers and specialists appear to want more oral communication and
discussions about observation findings. The walk-through rubrics are perceived by teachers as checklists that do not allow for in-depth feedback. In all data collection procedures, discussion came up as one of the most valuable aspects of the process.
4) There was conflicting information gathered about unannounced and announced
observations. Some teachers felt that announced observations were contrived and were not that valuable to improving their teaching. However, the survey results indicate that the majority of teachers find value in them. It is possible that the perception of announced versus unannounced observations is based on the discussions that follow from school administration. Also, depending on the purpose of the observation by administration (feedback versus evaluative) could
2011-12 DPAS II Evaluation Report 10 June 2012
contribute to the disparate findings. In several instances the perception of trust, or a lack thereof, was reflected in the comments.
5) Among administrators and evaluators of teachers, unannounced walk-throughs
and unannounced observations were seen as more valuable than announced. 6) According to the survey results, there was a wide variation in the number of walk-
throughs conducted because of DPAS II. This could contribute to the findings where walk-throughs were viewed as less valuable overall than observations among teachers and specialists. However, in the interviews, it appears that teachers wanted more walk-throughs if they were going to be used in a summative evaluation. Many stated that the few walk-throughs that were conducted did not provide a complete picture of their teaching, especially when not coupled with discussion and oral feedback.
7) Forms were seen as not difficult to complete, but in several instances were
viewed as duplicative. Approximately 65% of administrators responded on the disagree end of the scale when asked if the time it takes to complete the paperwork was reasonable. For teachers and specialists, this result was around 50%. The amount of time spent on DPAS II paperwork by the majority of administrators was over 20 hours. Conversely, the amount of time spent on paperwork by the majority of teachers and specialists was 0 – 5 hours.

2011-12 DPAS II Evaluation Report 11 June 2012
INTRODUCTION
The purpose of the evaluation of the DPAS II was to collect and compile data in order to make recommendations relating to the effectiveness and usability of the DPAS II process. The 2011-2012 school year was the fourth year of statewide implementation for DPAS II. Progress Education Corporation was contracted by the Delaware Department of Education as a third-party evaluator to conduct all aspects of the evaluation. Upon receiving notification of being selected as the evaluator, the staff at Progress Education Corporation immediately began gathering contextual information, studying current manuals, and researching historical documents. Additionally, key staff members of the evaluation team visited the Delaware Department of Education to gain further insight into the DPAS II system and discuss any new expectations for the evaluation. Building upon the work that had already been done by the 1998 DPAS Revision Task Force and the DPAS II Advisory Committee, and following the evaluation questions as written in the DPAS II evaluation RFP, Progress Education Corporation developed and administered surveys, conducted interviews, and facilitated focus groups for teachers, specialists, administrators, and evaluators. All data collection forms (i.e. surveys, interview guides, and focus group questions) were created to provide ample information related to the DPAS II system. This included gathering qualitative and quantitative data on the criteria used in the DPAS II system; the forms for evaluating teachers, specialists and administrators; the manageability of the total system; the accuracy and reliability of the data being used in the system; usefulness of the training sessions and manuals; needed modifications; and the efficacy of the DPAS II program in achieving quality assurance and professional growth. More specifically, detailed survey, interview, and focus group items were generated to respond to 26 questions that were specified in the RFP.

2011-12 DPAS II Evaluation Report 12 June 2012
RECOMMENDATIONS
The recommendations for the 2012 report are captured in three categories, teachers, specialists, and administrators. The recommendations are based on the information derived from the surveys and interviews. The focus groups, as in past years, contributed significantly to the final recommendations outlined in this report. The surveys provide a statistical basis for the invaluable clarity provided by the interviews and focus groups. The Student Achievement Component remains a significant topic of conversation and concern. It is very likely that these concerns contaminate the survey and interview results. Teachers and specialists believe test data may be used to unfairly judge their productivity. They believe that student progress is a function of many variables and that it does “take a village” to raise and educate a child. Their fear that they alone will be burdened with the success or failure of a student is reflected in this year’s report. It is also clear that, unlike any previous year, teachers describe DPAS II as an evaluation, rather than reflective practice and growth. It is apparent that a combination of actions has contributed to the lack of authenticity and a return to a checklist approach.
Teachers Teachers overwhelmingly believe in the effectiveness of walkthrough observations. Many voiced the reality that the announced, formal observation was not authentic. The teachers had to “perform” for the administrator in order to demonstrate all parts of a lesson. This demonstration did not reflect the normal flow of their classroom, and because it was contrived they believe the feedback to be on behaviors and activities that were not authentic and not on how they really teach. Teachers indicated requiring evidence that was not part of the normal day suggested a “lack of trust” and possibly encouraged “dishonest behavior” on the part of some. When asked how to strengthen this part of the process, teachers listed several suggestions.
1. Increase the amount of unannounced observations as long as the discussion and oral feedback are coupled with the increase.
2. Increase walkthrough observations for some as long as the discussion and oral feedback are coupled with the increase.
3. Have a select group of individuals that are agreed upon by the administrator and teacher provide feedback. Teachers want to be viewed through more than one lens.
4. May include peer visitation and observation. 5. Walkthrough observations (multiple) should be the basis of the
experienced teacher’s yearly reflection. 6. Make evidence authentic, part of the normal routine, not a collection of
artifacts.

2011-12 DPAS II Evaluation Report 13 June 2012
7. Make use of technology to provide feedback after walkthrough observations.
8. Provide brief conferencing after walkthrough observations. 9. Eliminate formal announced observations for prepared (as agreed upon by
the teacher and principal) teachers and replace with walkthrough observations.
10. Expand some form of mentoring for experienced teachers. 11. Continue training focusing on observation and feedback techniques for
evaluators and peer observers. 12. Remove the word “Evaluator” from DPAS II. Choose another term such as
“Reflective Practitioner” to refer to the person supporting and facilitating a teacher’s reflective practice.
The fear mentioned last year that DPAS II could become routine in the future and thus lose the leverage it enjoyed is now happening. Teachers believe they are returning to the checklists of years past. They believe that feedback and conversation make a difference. Teacher perception is that the rubrics are being turned into checklists. The mountain of paperwork required to do one formal observation is such that it is all one can do and must be made routine to survive. Teachers state that DPASII has become impersonal and less authentic. They also believe training must be continued and become more sophisticated. This is in contrast to the survey that indicates teachers no longer need training. When discussing training, teachers do not need more training on the basics of DPAS II but they do want additional discussion and communication to improve reflective practice. Late programmatic changes caused confusion and concern about how the program would operate in 2011-2012. The following suggestions are continued from last year. There can never be enough emphasis placed on the communication needs of teachers.
1. Create additional vehicles for conversations and communication for teachers.
2. Use the Internet to share information and ideas. 3. Build in refresher training for all teachers to reconnect with the philosophy
of reflective practice. 4. No changes in DPAS II once the school year begins. 5. Eliminate the routine questions contained in Professional Responsibilities. 6. Train teachers with the same information given to evaluators. “It was more
insightful.” 7. Make certain emphasis on goal setting and sharing extends to areas like
parent communication.
2011-12 DPAS II Evaluation Report 14 June 2012
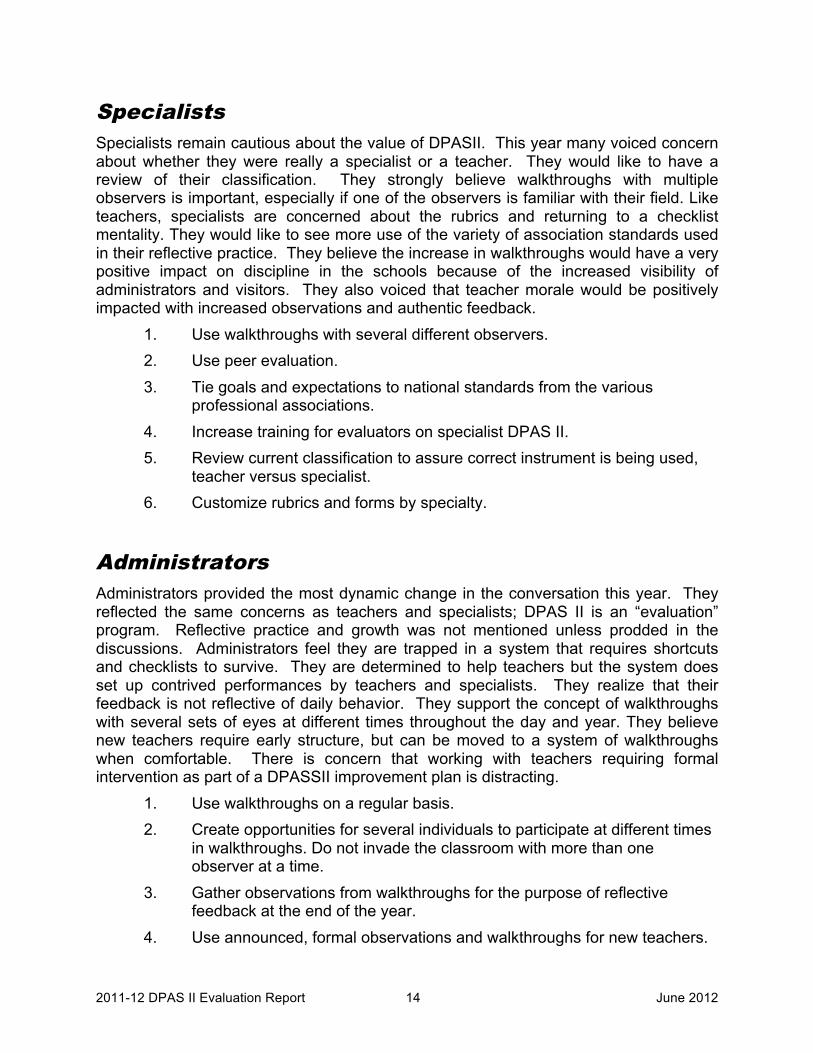
Specialists Specialists remain cautious about the value of DPASII. This year many voiced concern about whether they were really a specialist or a teacher. They would like to have a review of their classification. They strongly believe walkthroughs with multiple observers is important, especially if one of the observers is familiar with their field. Like teachers, specialists are concerned about the rubrics and returning to a checklist mentality. They would like to see more use of the variety of association standards used in their reflective practice. They believe the increase in walkthroughs would have a very positive impact on discipline in the schools because of the increased visibility of administrators and visitors. They also voiced that teacher morale would be positively impacted with increased observations and authentic feedback.
1. Use walkthroughs with several different observers. 2. Use peer evaluation. 3. Tie goals and expectations to national standards from the various
professional associations. 4. Increase training for evaluators on specialist DPAS II. 5. Review current classification to assure correct instrument is being used,
teacher versus specialist. 6. Customize rubrics and forms by specialty.
Administrators Administrators provided the most dynamic change in the conversation this year. They reflected the same concerns as teachers and specialists; DPAS II is an “evaluation” program. Reflective practice and growth was not mentioned unless prodded in the discussions. Administrators feel they are trapped in a system that requires shortcuts and checklists to survive. They are determined to help teachers but the system does set up contrived performances by teachers and specialists. They realize that their feedback is not reflective of daily behavior. They support the concept of walkthroughs with several sets of eyes at different times throughout the day and year. They believe new teachers require early structure, but can be moved to a system of walkthroughs when comfortable. There is concern that working with teachers requiring formal intervention as part of a DPASSII improvement plan is distracting.
1. Use walkthroughs on a regular basis. 2. Create opportunities for several individuals to participate at different times
in walkthroughs. Do not invade the classroom with more than one observer at a time.
3. Gather observations from walkthroughs for the purpose of reflective feedback at the end of the year.
4. Use announced, formal observations and walkthroughs for new teachers.

2011-12 DPAS II Evaluation Report 15 June 2012
5. Improve and customize rubrics and forms for specialists. 6. Continuation training for reflective practice conferences. 7. Find a way to increase unannounced observations, the best part of DPAS
II. 8. Separate formal Improvement Process actions from the DPAS II program. 9. Summative conversations should be as much about the future as the past.
2011-12 DPAS II Evaluation Report 16 June 2012
METHODS
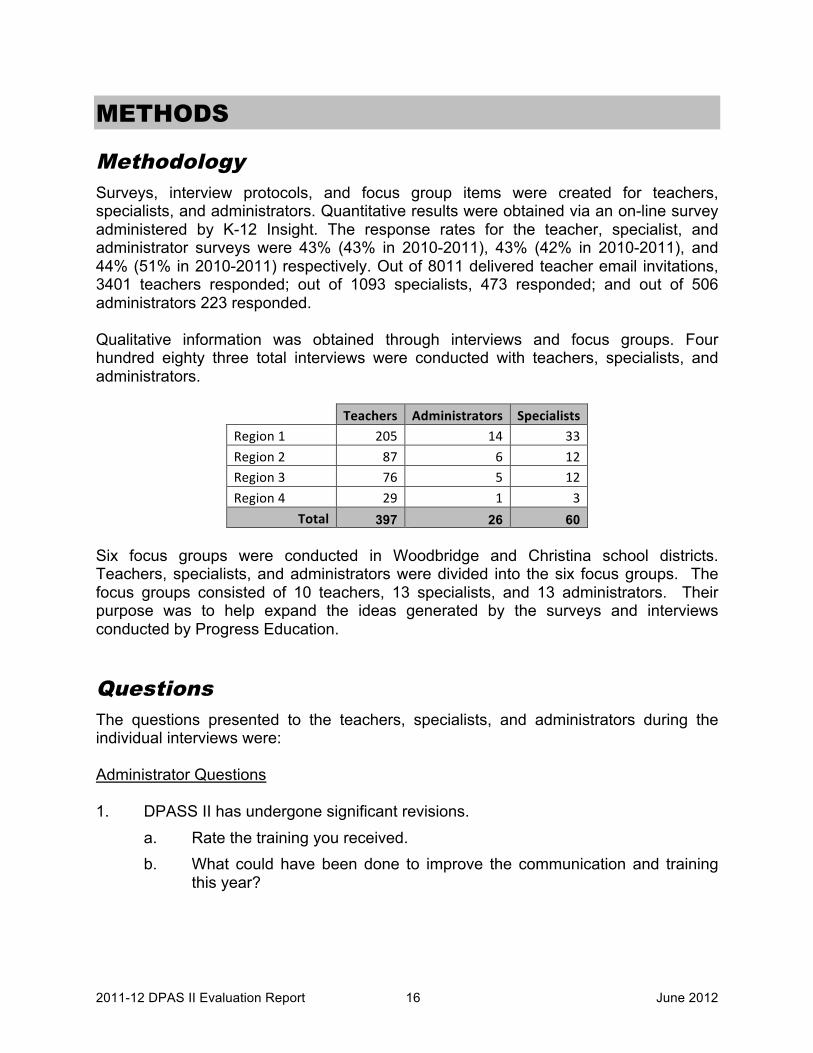
Methodology Surveys, interview protocols, and focus group items were created for teachers, specialists, and administrators. Quantitative results were obtained via an on-line survey administered by K-12 Insight. The response rates for the teacher, specialist, and administrator surveys were 43% (43% in 2010-2011), 43% (42% in 2010-2011), and 44% (51% in 2010-2011) respectively. Out of 8011 delivered teacher email invitations, 3401 teachers responded; out of 1093 specialists, 473 responded; and out of 506 administrators 223 responded. Qualitative information was obtained through interviews and focus groups. Four hundred eighty three total interviews were conducted with teachers, specialists, and administrators.
Teachers Administrators Specialists Region 1 205 14 33
Region 2 87 6 12 Region 3 76 5 12
Region 4 29 1 3
Total 397 26 60 Six focus groups were conducted in Woodbridge and Christina school districts. Teachers, specialists, and administrators were divided into the six focus groups. The focus groups consisted of 10 teachers, 13 specialists, and 13 administrators. Their purpose was to help expand the ideas generated by the surveys and interviews conducted by Progress Education.
Questions The questions presented to the teachers, specialists, and administrators during the individual interviews were: Administrator Questions 1. DPASS II has undergone significant revisions.
a. Rate the training you received. b. What could have been done to improve the communication and training
this year?

2011-12 DPAS II Evaluation Report 17 June 2012
2. 28% of administrators feel applying all four components (vision goals, culture, management, professional responsibilities) in my work is difficult. How could that rating be improved?
3. 43% respond the forms make the process difficult to implement. How can that
response be improved? 4. A large majority of administrators believe unannounced observations and walk -
throughs are valuable and should be part of the formative evaluation. a. What are the barriers to this change? b. How can we lower the barriers?
Teacher Questions 1. Professional responsibilities is seen by 25% of the respondents as not a good
indicator of performance. a. Why? b. How can that view be improved?
2. DPASS II has undergone significant revisions.
a. Rate the training you received. b. What could have been done to improve the communication and training
this year? 3. 30% of teachers believe applying all four components (Planning and Preparation,
Classroom Environment, Instruction, Professional Responsibilities) is difficult. How could that rating be improved?
4. 35% of the teachers believe the forms are difficult to complete. How could that
response be improved? 5. 45% disagree that DPAS II should continue in its current form. What is one
change you would like to see in the process? 6. Roughly 70% of teachers see value in walk-throughs, but 50% do not think it
should be part of the summative evaluation. Why? Specialist Questions 1. 30% of Specialists believe their evaluators lack the ability to use the criteria to
judge them on the four components (Planning and Prep., Professional Practice and Delivery of Service, Professional Collaboration and Consultation, and Professional Responsibilities) in DPAS II.

2011-12 DPAS II Evaluation Report 18 June 2012
a. Why? b. What are some strategies that can fix this perception or reality?
2. 36% of respondents find it difficult to apply all four components. How can this
rating be improved? 3. 27% believe the forms completed after a conference are not valuable. How can
this rating be improved? 4. 30% of specialists believe the DPAS II is not fair and equitable. How can this
rating be improved? The focus groups dealt with essentially the same questions though the conversations were not restricted by topic. The two areas of interest were:
1. Teachers, specialists, and administrators believe walkthroughs positively impact instruction. Can they be increased? What are the barriers to using them as part of DPAS II. How can the barriers be overcome?
2. The language of all DPAS II participants has changed from one of "reflective practice and growth" to "evaluation". What do you believe has caused this change? What changes could be implemented to change the conversation back to one of reflective practice?
All six focus groups were actively engaged in discussions of the two questions. The groups provided a variety of ideas about the strengths and improvements needed in DPAS II. For all groups (teachers, specialists, and administrators), the online survey items were similar and followed the same pattern; however, some items were reworded specifically for each type of respondent. The first item of all the surveys assessed perceptions of each component of the DPAS II system–5 components for teachers, specialists, and administrators. These items were intended to gauge the participant’s perceptions of the criteria in each component. The 5 middle sections of the survey were made up of Likert items with a 4-point response scale ranging from Strongly Agree to Strongly Disagree. The Likert items were categorized into sections entitled: Evaluation Criteria, Documentation, Feedback, System Related Items, Data Related Items, and Department of Education website. New items were added this year:
• In the first construct, that assesses whether the criteria can be accurately judged by an evaluator, additional items were added that ask whether the criteria for each component is an effective indicator. For example, for teachers, prior to asking whether the Planning and Preparation component can be accurately judged by their evaluator, they were asked to respond to whether the criteria used to evaluate them in the Planning and Preparation component were effective

2011-12 DPAS II Evaluation Report 19 June 2012
indicators of their performance. This occurred for teachers, specialists, and administrators on all components of their evaluations.
• The 2nd set of new items asked “How valuable were the following in the DPAS II process?” a) Announced observations b) Unannounced observations c) Announced walk-throughs d) Unannounced walk-throughs e) Peer observations f) Use rubrics g) Mentoring h) Professional Learning Communities i) Data Coaches j) Building level administrators k) District level administrators
• The 3rd set of new items asked respondents to “Indicate your level of understanding of the following:” a) DPAS II rubrics b) DPAS II process c) DPAS II expectations d) Commendations
• Lastly, the fourth set of new items asked respondents to “Indicate the level of impact for each of the following:” a) Use of the rubrics on positive reinforcement b) DPAS II overall on improving performance c) ____________ component on improving performance (components were
listed specific to each job role. d) Unannounced observations on improving performance e) Announced observations on improving performance f) Unannounced walk-throughs on improving performance g) Announced walk-throughs on improving performance h) Peer observations on increasing effective conversations about
performance
• The end of the survey consisted of a series of demographic questions.

2011-12 DPAS II Evaluation Report 20 June 2012
Statistical Analysis Psychometric testing was conducted on the survey in 2006-2007, 2007-2008, and 2008-2009. After the first year of testing, the estimates remained stable and consistent. Construct validity and factor reliability is presented below. Constructs were established based on the highest factor loading for each item. Constructs were created if items loaded at a .4 factor level or higher; no item had a factor loading less than .5. There were 2 constructs that had items that formed separate constructs; however, the factor loadings were in the appropriate range to justify reporting them as one (for ease of interpretation). Reliability estimates were determined for each construct. With the exception of one construct, all reliability estimates were outstanding, at α=.8 or higher. The one exception was a construct with the following items: “The training was timely,” “Training in the process was adequate,” and “Additional training would make me feel more competent in the process.” The constructs and corresponding estimates are presented below:
Construct 1 α = .90
The five components used to evaluate my performance are understandable.
The five components used to evaluate my performance are reasonable indicators of my effectiveness.
The criteria used to evaluate me for the planning and preparation component can be accurately judged by my evaluator.
The criteria used to evaluate me for the classroom environment component can be accurately judged by my evaluator.
The criteria used to evaluate me for the instruction component can be accurately judged by my evaluator.
The criteria used to evaluate me for the professional responsibilities component can be accurately judged by my evaluator.
The criteria used to evaluate me for the student improvement component can be accurately judged by my evaluator.
Applying all five components in my work is easy.
The written feedback I receive is aligned with the five components.
The oral feedback I receive is aligned with the five components.

2011-12 DPAS II Evaluation Report 21 June 2012
Construct 2 α = .90
The forms play an important role in the overall evaluation.
I am able to provide the evidence and documentation needed by my evaluator for him/her to accurately determine my effectiveness.
I am able to provide evidence of my practice through artifact.
The time it takes to complete the DPAS II paperwork requirements is reasonable.
The forms are easy to complete.
I have access to the information I need to complete the forms.
The forms make the process easy to implement.
The information on the forms is consistent with determining the outcome of the evaluation.
The required paperwork is relevant to the evaluation.
Construct 3 α = .94
My evaluator completes paperwork in a reasonable time period.
My evaluator handles the workload effectively.
Overall, the feedback I receive is adequate.
The oral feedback I receive is useful and applicable.
The written feedback I receive is useful and applicable.
In general, the conferences are valuable.
The forms completed after conferences are valuable.
I am able to provide evidence of my practice through discussion.
The timing of the conferences is good.
The number of conferences/conversations with my evaluator is adequate.

2011-12 DPAS II Evaluation Report 22 June 2012
Construct 4 α = .85
The system overall is easy to follow.
The evaluation process (observations, documentation, and conferences) provides adequate evidence of my teaching.
The evaluation process (observations, documentation, and conferences) provides an accurate picture of my teaching.
The DPAS II system provides a better picture of my teaching versus the DPAS I system.
The Guide is helpful.
The Guide is easy to understand.
The evaluation did NOT interfere with my duties.
I perceive the system to be fair and equitable.
The DPAS evaluation system needs improving.
I believe the DPAS evaluation system works as intended.
I believe the current DPAS evaluation system should be continued in its current form.
Construct 5 α = .83
I was able to complete the data documentation requirements without difficulty.
There was enough training and/or support for me to accurately complete the forms related to student improvement.
There was congruence with the results of school level data and my classroom data.
Construct 6 α = .75
Administrator walk-throughs improve teaching more than announced observations.
Unannounced observations by an administrator improve teaching more than walk-throughs.
Prior to DPAS II, walk-throughs were conducted more frequently during the year.
Walk-throughs should be part of a formative evaluation.
Walk-throughs should be part of a summative evaluation.
2011-12 DPAS II Evaluation Report 23 June 2012
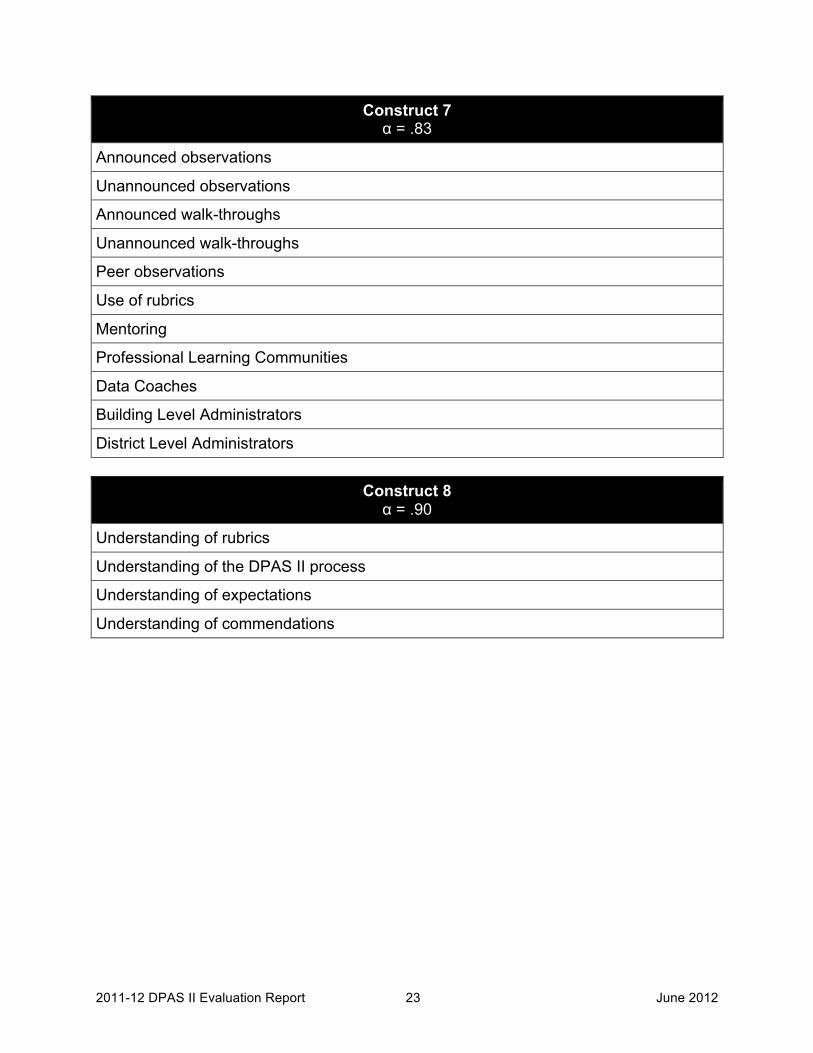
Construct 7 α = .83
Announced observations
Unannounced observations
Announced walk-throughs
Unannounced walk-throughs
Peer observations
Use of rubrics
Mentoring
Professional Learning Communities
Data Coaches
Building Level Administrators
District Level Administrators
Construct 8 α = .90
Understanding of rubrics
Understanding of the DPAS II process
Understanding of expectations
Understanding of commendations

2011-12 DPAS II Evaluation Report 24 June 2012
Construct 9 α = .93
What level of impact does the use of rubrics have on positive reinforcement?
What level of impact does DPAS II overall have on improving my teaching?
What level of impact does the Planning and Preparation component have on improving my teaching?
What level of impact does the Classroom Environment component have on improving my teaching?
What level of impact does the Instruction component have on improving my teaching?
What level of impact does the Professional Responsibilities component have on improving my teaching?
What level of impact do unannounced observations have on improving my teaching?
What level of impact do announced observations have on improving my teaching?
What level of impact do unannounced walk-throughs have on improving my teaching?
What level of impact does announced walk-throughs have on improving my teaching?
What level of impact does peer observations have on increasing effective conversations about teaching?

2011-12 DPAS II Evaluation Report 25 June 2012
RESULTS
Indicators of Performance (Q1)
Q1) Are the proposed criteria the best indicators of Effective Performance? Needs Improvement Performance? Ineffective Performance?
Teachers To answer this research question, teachers were asked, “Of the 4 major components (as defined in the DPAS II Guide) used in teacher evaluations, which do you believe are good indicators of performance? “Instruction” has consistently received the highest level of support for being a good indicator of performance. “Professional Responsibilities” has consistently been selected as the least indicative. There is relatively little change in the results from 2009-2010 to the present. Q1. Of the 4 major components (as defined in the DPAS II Guide) used in teacher evaluations, which do you believe are good indicators of performance? (check all that apply)
Responses Count % Percentage of total respondents
Planning and Preparation 2637 73.05% Classroom Environment 2760 76.45% Instruction 3195 88.50% Professional Responsibilities 1565 43.35% (Did not answer) 230 6.37% Total Responses 10387 20% 40% 60% 80% 100% Multiple answers per participant possible. Percentages added may exceed 100 since a participant may select more than one answer for this question. Good Indicators of Performance – Teachers 10-11
Teachers Of the 5 major components (as defined in the DPAS II Guide) used in teacher evaluations, which do you believe are good indicators of performance (check all that apply)?
Planning and Preparation
Classroom Environment Instruction Professional
Responsibilities Did not answer Total
2007/2008 77.24% 80.06% 91.60% 44.03% 1.18% 1274 2008/2009
2009/2010
73.90%
73.46%
77.09%
77.11%
90.28%
88.87%
44.22%
44.14%
1%
1.59%
3268
4614 2010/2011 73.68% 78.77% 90.87% 44.25% 1.96% 3670 2011/2012 73.05% 76.45% 88.5% 43.35% 6.37% 3610
Note: Multiple answers per participant possible. Percentages added will not sum to 100 since a participant may select more than one answer for this question.

2011-12 DPAS II Evaluation Report 26 June 2012
Based on comments during interviews, the general consensus is that the Professional Responsibilities component is a valid indicator of performance. However, also suggested several times was a request for more clarity on what this component is looking for; in other words, more points on what is specifically required to meet this objective.
Specialists Among specialists, “Professional Practice and Delivery of Service” was the only indicator with strong support of being a good indicator of performance. “Planning and Preparation” was selected the least. However, the remaining two categories did not receive strong support. Q1. Of the 4 major components (as defined in the DPAS II Guide) used in specialist evaluations, which do you believe are good indicators of performance?
Responses Count % Percentage of total respondents
Planning and Preparation 234 46.71% Professional Practice and Delivery of Service 411 82.04% Professional Collaboration and Consultation 281 56.09%
Professional Responsibilities 270 53.89% (Did not answer) 44 8.78% Total Responses 1240 20% 40% 60% 80% 100% Note: Multiple answers per participant possible. Percentages added may exceed 100 since a participant
may select more than one answer for this question. Good Indicators of Performance – Specialists 10-11
Specialists Of the 5 major components (as defined in the DPAS II Guide) used in specialist evaluations, which do you believe are good indicators of performance?
Planning and Preparation
Professional Practice and Delivery of
Service
Professional Collaboration
and Consultation
Professional Responsibilities
Did not answer Total
2007/2008 70.73% 90.73% 76.10% 73.66% 1.95% 205
2008/2009
2009/2010
68.05%
61.65%
87.86%
87.71%
69.01%
65.25%
68.69%
67.37%
1%
2.54%
313
472
2010-2011 60.29% 88.98% 68.40% 67.15% 2.29% 481 2011-2012 46.71% 82.04% 56.09% 53.89% 8.78% 501
Note: Multiple answers per participant possible. Percentages added may exceed 100 since a participant may select more than one answer for this question.

2011-12 DPAS II Evaluation Report 27 June 2012
Administrators Among administrators, the components selected the most for being a good indicator of performance was “Culture of Learning” and “Management.” The component with least support from administrators was the “Professional Responsibilities” component. These results reflect the same trend from past years. Q1. Of the 4 major components (as defined in the DPAS II Guide) used in administrator evaluations, which do you believe are good indicators of performance?
Responses Count % Percentage of total respondents
Component 1 - Vision and Goals 165 66.53% Component 2 - Culture of Learning 197 79.44% Component 3 - Management 195 78.63% Component 4 - Professional Responsibilities 139 56.05%
(Did not answer) 15 6.05% Total Responses 711 20% 40% 60% 80% 100% Note: Multiple answers per participant possible. Percentages added may exceed 100 since a participant
may select more than one answer for this question. Good Indicators of Performance – Administrators 10-11
Administrator Of the 5 major components (as defined in the DPAS II Guide) used in administrator evaluations, which do you believe are good indicators of performance?
Vision and Goals
Culture of Learning Management Professional
Responsibilities Did not answer Total
2007/2008 70.59% 78.43% 74.51% 60.78% 5.88% 51
2008/2009
2009/2010
68.04%
62.07%
81.96%
78.37%
81.44%
74.61%
62.37%
58.31%
2%
4.7%
194
319
2010/2011
57.09% 71.27% 71.27% 52.24% 5.22% 268
2011/2012 66.53% 79.44% 78.63% 56.05% 6.05% 248 Note: Multiple answers per participant possible. Percentages added may exceed 100 since a participant
may select more than one answer for this question.
2011-12 DPAS II Evaluation Report 28 June 2012
Evaluation Criteria Items (Q3)
Q3) Overall, is the system realistic?
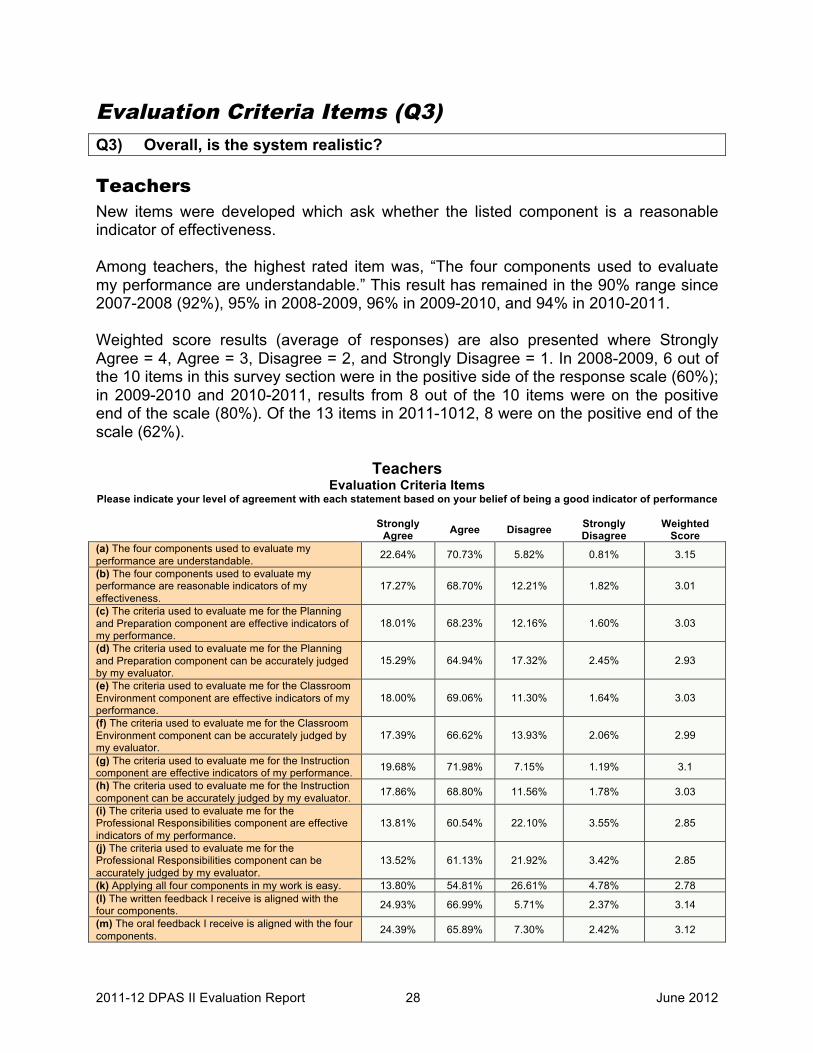
Teachers New items were developed which ask whether the listed component is a reasonable indicator of effectiveness. Among teachers, the highest rated item was, “The four components used to evaluate my performance are understandable.” This result has remained in the 90% range since 2007-2008 (92%), 95% in 2008-2009, 96% in 2009-2010, and 94% in 2010-2011. Weighted score results (average of responses) are also presented where Strongly Agree = 4, Agree = 3, Disagree = 2, and Strongly Disagree = 1. In 2008-2009, 6 out of the 10 items in this survey section were in the positive side of the response scale (60%); in 2009-2010 and 2010-2011, results from 8 out of the 10 items were on the positive end of the scale (80%). Of the 13 items in 2011-1012, 8 were on the positive end of the scale (62%).
Teachers Evaluation Criteria Items
Please indicate your level of agreement with each statement based on your belief of being a good indicator of performance
Strongly Agree Agree Disagree Strongly
Disagree Weighted
Score (a) The four components used to evaluate my performance are understandable. 22.64% 70.73% 5.82% 0.81% 3.15
(b) The four components used to evaluate my performance are reasonable indicators of my effectiveness.
17.27% 68.70% 12.21% 1.82% 3.01
(c) The criteria used to evaluate me for the Planning and Preparation component are effective indicators of my performance.
18.01% 68.23% 12.16% 1.60% 3.03
(d) The criteria used to evaluate me for the Planning and Preparation component can be accurately judged by my evaluator.
15.29% 64.94% 17.32% 2.45% 2.93
(e) The criteria used to evaluate me for the Classroom Environment component are effective indicators of my performance.
18.00% 69.06% 11.30% 1.64% 3.03
(f) The criteria used to evaluate me for the Classroom Environment component can be accurately judged by my evaluator.
17.39% 66.62% 13.93% 2.06% 2.99
(g) The criteria used to evaluate me for the Instruction component are effective indicators of my performance. 19.68% 71.98% 7.15% 1.19% 3.1
(h) The criteria used to evaluate me for the Instruction component can be accurately judged by my evaluator. 17.86% 68.80% 11.56% 1.78% 3.03
(i) The criteria used to evaluate me for the Professional Responsibilities component are effective indicators of my performance.
13.81% 60.54% 22.10% 3.55% 2.85
(j) The criteria used to evaluate me for the Professional Responsibilities component can be accurately judged by my evaluator.
13.52% 61.13% 21.92% 3.42% 2.85
(k) Applying all four components in my work is easy. 13.80% 54.81% 26.61% 4.78% 2.78 (l) The written feedback I receive is aligned with the four components. 24.93% 66.99% 5.71% 2.37% 3.14
(m) The oral feedback I receive is aligned with the four components. 24.39% 65.89% 7.30% 2.42% 3.12

2011-12 DPAS II Evaluation Report 29 June 2012
Specialists As with the teachers, the highest rated item among the specialists was “The five components used to evaluate my performance are understandable.” However, the weight was somewhat lower among the specialists compared to teachers. Of the 13 items, only 2 had weighted scores in the desirable end of the scale. Those were about written and oral feedback being aligned with the four components. The item that received the lowest weighted score was “Applying all four components in my work is easy.”
Specialists Evaluation Criteria Items
Please indicate your level of agreement with each statement based on your belief of being a good indicator of performance
Strongly Agree Agree Disagree Strongly
Disagree Weighted
Score (a) The four components used to evaluate my performance are understandable. 13.54% 70.71% 13.33% 2.42% 2.95
(b) The four components used to evaluate my performance are reasonable indicators of my effectiveness. 10.61% 65.92% 20.00% 3.47% 2.84
(c) The criteria used to evaluate me for the Planning and Preparation component are effective indicators of my performance.
9.80% 65.51% 21.22% 3.47% 2.82
(d) The criteria used to evaluate me for the Planning and Preparation component can be accurately judged by my evaluator.
7.30% 57.61% 29.61% 5.48% 2.67
(e) The criteria used to evaluate me for the Professional Practice and Delivery of Service component are effective indicators of my performance.
11.81% 69.25% 16.29% 2.65% 2.9
(f) The criteria used to evaluate me for the Professional Practice and Delivery of Service component can be accurately judged by my evaluator.
8.78% 61.63% 24.69% 4.90% 2.74
(g) The criteria used to evaluate me for the Professional Collaboration and Consultation component are effective indicators of my performance.
9.96% 69.72% 16.06% 4.27% 2.85
(h) The criteria used to evaluate me for the Professional Collaboration and Consultation component can be accurately judged by my evaluator.
7.76% 62.65% 24.29% 5.31% 2.73
(i) The criteria used to evaluate me for the Professional Responsibilities component are effective indicators of my performance.
11.43% 69.39% 16.53% 2.65% 2.9
(j) The criteria used to evaluate me for the Professional Responsibilities component can be accurately judged by my evaluator.
9.78% 62.53% 23.01% 4.68% 2.77
(k) Applying all four components in my work is easy. 9.13% 53.11% 30.50% 7.26% 2.64 (l) The written feedback I receive is aligned with the four components. 16.88% 70.89% 8.86% 3.38% 3.01
(m) The oral feedback I receive is aligned with the four components. 16.81% 70.38% 9.66% 3.15% 3.01

2011-12 DPAS II Evaluation Report 30 June 2012
Administrators Administrators also rated the item, “The five components used to evaluate my performance are understandable,” as the highest. When the weighted score is compared among the items, 7 of the 13 items have scores on the positive end of the response scale (54%). The item that received the least positive responses was the item, “Applying all five components in my work is easy.” Nevertheless, 65% responded on the desirable end of the scale.
Administrators Evaluation Criteria Items
Please indicate your level of agreement with each statement based on your belief of being a good indicator of performance
Strongly Agree Agree Disagree Strongly
Disagree Weighted
Score (a) The four components used to evaluate my performance are understandable. 21.72% 72.13% 4.92% 1.23% 3.14
(b) The four components used to evaluate my performance are reasonable indicators of my effectiveness. 16.80% 71.31% 10.25% 1.64% 3.03
(c) The criteria used to evaluate me for the Vision and Goals component are effective indicators of my performance.
15.23% 69.96% 12.76% 2.06% 2.98
(d) The criteria used to evaluate me for the Vision and Goals component can be accurately judged by my evaluator.
15.64% 66.26% 15.64% 2.47% 2.95
(e) The criteria used to evaluate me for the Culture of Learning component are effective indicators of my performance.
16.25% 73.33% 9.17% 1.25% 3.05
(f) The criteria used to evaluate me for the Culture of Learning component can be accurately judged by my evaluator.
15.29% 68.18% 14.05% 2.48% 2.96
(g) The criteria used to evaluate me for the Management component are effective indicators of my performance. 19.92% 73.03% 5.81% 1.24% 3.12
(h) The criteria used to evaluate me for the Management component can be accurately judged by my evaluator. 18.52% 69.96% 9.05% 2.47% 3.05
(i) The criteria used to evaluate me for the Professional Responsibilities component are effective indicators of my performance.
18.33% 74.17% 6.67% 0.83% 3.1
(j) The criteria used to evaluate me for the Professional Responsibilities component can be accurately judged by my evaluator.
17.43% 69.71% 10.79% 2.07% 3.02
(k) Applying all four components in my work is easy. 13.08% 52.32% 29.96% 4.64% 2.74 (l) The written feedback I receive is aligned with the four components. 17.50% 66.67% 11.67% 4.17% 2.98
(m) The oral feedback I receive is aligned with the four components. 19.42% 63.64% 13.22% 3.72% 2.99
Information from interviews suggests that administrators believe that the components are representative and appropriate for the evaluation.
2011-12 DPAS II Evaluation Report 31 June 2012
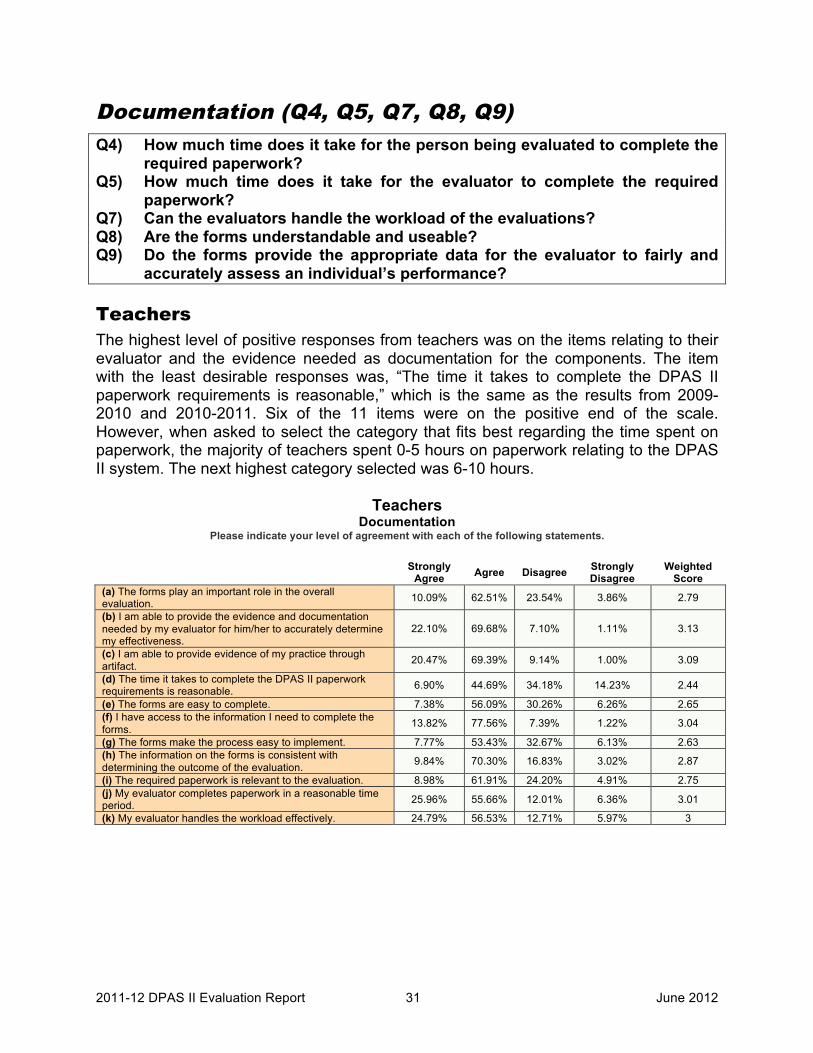
Documentation (Q4, Q5, Q7, Q8, Q9)
Q4) How much time does it take for the person being evaluated to complete the required paperwork?
Q5) How much time does it take for the evaluator to complete the required paperwork?
Q7) Can the evaluators handle the workload of the evaluations? Q8) Are the forms understandable and useable? Q9) Do the forms provide the appropriate data for the evaluator to fairly and
accurately assess an individual’s performance?
Teachers The highest level of positive responses from teachers was on the items relating to their evaluator and the evidence needed as documentation for the components. The item with the least desirable responses was, “The time it takes to complete the DPAS II paperwork requirements is reasonable,” which is the same as the results from 2009-2010 and 2010-2011. Six of the 11 items were on the positive end of the scale. However, when asked to select the category that fits best regarding the time spent on paperwork, the majority of teachers spent 0-5 hours on paperwork relating to the DPAS II system. The next highest category selected was 6-10 hours.
Teachers Documentation
Please indicate your level of agreement with each of the following statements.
Strongly Agree Agree Disagree Strongly
Disagree Weighted
Score (a) The forms play an important role in the overall evaluation. 10.09% 62.51% 23.54% 3.86% 2.79
(b) I am able to provide the evidence and documentation needed by my evaluator for him/her to accurately determine my effectiveness.
22.10% 69.68% 7.10% 1.11% 3.13
(c) I am able to provide evidence of my practice through artifact. 20.47% 69.39% 9.14% 1.00% 3.09
(d) The time it takes to complete the DPAS II paperwork requirements is reasonable. 6.90% 44.69% 34.18% 14.23% 2.44
(e) The forms are easy to complete. 7.38% 56.09% 30.26% 6.26% 2.65 (f) I have access to the information I need to complete the forms. 13.82% 77.56% 7.39% 1.22% 3.04
(g) The forms make the process easy to implement. 7.77% 53.43% 32.67% 6.13% 2.63 (h) The information on the forms is consistent with determining the outcome of the evaluation. 9.84% 70.30% 16.83% 3.02% 2.87
(i) The required paperwork is relevant to the evaluation. 8.98% 61.91% 24.20% 4.91% 2.75 (j) My evaluator completes paperwork in a reasonable time period. 25.96% 55.66% 12.01% 6.36% 3.01
(k) My evaluator handles the workload effectively. 24.79% 56.53% 12.71% 5.97% 3

2011-12 DPAS II Evaluation Report 32 June 2012
Teachers
Documentations On an annual basis, how much time do you spend on paperwork relating to the DPAS II system?
Q17. On an annual basis, how much time do you spend on paperwork relating to the DPAS II system? Responses Count % 0-5 hours 1432 39.67% 6-10 hours 1150 31.86% 11-15 hours 424 11.75% 16-20 hours 148 4.10% more than 20 hours 214 5.93% (Did not answer) 242 6.70% Total Responses 3610
Specialists Results from specialists indicate that the majority of them are ok with the forms, time, workloads, and access to information. However, there are still no items with weighted mean scores on the positive end of the scale. Because of very few “strongly agree” responses, those that responded on the undesirable end of the scale basically lowered the overall mean score. The item that received the fewest positive responses was, “The time it takes to complete the DPAS II paperwork requirements is reasonable. Similar to the teachers, the majority of specialists responded that they spent 5 hours or less on the paperwork relating to the DPAS II system. The next highest category selected among specialists was 6-10 hours.
Specialists Documentation
Please indicate your level of agreement with each of the following statements.
Strongly Agree Agree Disagree Strongly
Disagree Weighted
Score (a) The forms play an important role in the overall evaluation. 5.97% 65.88% 24.52% 3.62% 2.74 (b) I am able to provide the evidence and documentation needed by my evaluator for him/her to accurately determine my effectiveness.
14.56% 67.93% 15.82% 1.69% 2.95
(c) I am able to provide evidence of my practice through artifacts. 13.28% 67.63% 16.80% 2.28% 2.92
(d) The time it takes to complete the DPAS II paperwork requirements is reasonable. 2.70% 47.40% 37.63% 12.27% 2.41
(e) The forms are easy to complete. 3.97% 50.63% 37.03% 8.37% 2.5 (f) I have access to the information I need to complete the forms. 7.68% 77.80% 11.20% 3.32% 2.9
(g) The forms make the process easy to implement. 3.98% 50.10% 38.99% 6.92% 2.51 (h) The information on the forms is consistent with determining the outcome of the evaluation. 5.21% 63.33% 26.46% 5.00% 2.69
(i) The required paperwork is relevant to the evaluation. 4.78% 61.33% 25.78% 8.11% 2.63 (j) The evaluator completes paperwork in a reasonable time period. 18.62% 64.44% 11.72% 5.23% 2.96
(k) My evaluator(s) handle the workload effectively. 19.58% 63.37% 11.58% 5.47% 2.97

2011-12 DPAS II Evaluation Report 33 June 2012
Specialists
Documentation On an annual basis, how much time do you spend on paperwork relating to the DPAS II system?
Q16. On an annual basis, how many hours do you spend on paperwork relating to the DPAS II system? Responses Count % 0-5 hours 238 47.50% 6-10 hours 144 28.74% 11-15 hours 43 8.58% 16-20 hours 18 3.59% more than 20 hours 25 4.99% (Did not answer) 33 6.59% Total Responses 501
Administrators The highest level of positive responses from administrators was on the item relating to providing their evaluator and the evidence needed. The weighted score drops into the undesirable end of the scale for every other item. The item with the most disagree/strongly disagree responses was, “The time it takes to complete the DPAS II paperwork requirements is reasonable.” There has been a steady increase in the number of respondents who disagree with this item. In 2009-2010, the undesirable responses were at 34%. In 2010-2011, that number increased to 41%. In 2011-2012, that number jumped to 66%. When asked specifically about paperwork, 81% responded that they spend more than 20 hours. This is an increase from 2010-2011 where 74% responded that they spend 20 or more hours.
Administrators Documentation
Please indicate your level of agreement with each of the following statements.
Strongly Agree Agree Disagree Strongly
Disagree Weighted
Score (a) The forms play an important role in the overall evaluation. 7.23% 68.09% 20.43% 4.26% 2.78 (b) I am able to provide the evidence and documentation needed by my evaluator for him/her to accurately determine my effectiveness.
15.32% 73.19% 11.06% 0.43% 3.03
(c) The time it takes to complete the DPAS II paperwork requirements is reasonable. 3.81% 30.08% 41.10% 25.00% 2.13
(d) The forms are easy to complete. 4.27% 50.00% 35.90% 9.83% 2.49 (e) I have access to the information I need to complete the forms. 8.90% 80.93% 9.32% 0.85% 2.98
(f) The forms make the process easy to implement. 5.53% 48.51% 38.30% 7.66% 2.52 (g) The information on the forms is consistent with determining the outcome of the evaluation. 6.75% 70.89% 18.57% 3.80% 2.81
(h) The required paperwork is relevant to the evaluation. 4.66% 64.41% 27.97% 2.97% 2.71 (i) The evaluator completes paperwork in a reasonable time period. 15.95% 65.09% 13.79% 5.17% 2.92
(j) My evaluator(s) handle the workload effectively. 16.38% 64.22% 15.09% 4.31% 2.93

2011-12 DPAS II Evaluation Report 34 June 2012
Administrators Documentation
On an annual basis, how many hours do you spend on paperwork relating to the DPAS II system?
Q17. On an annual basis, how many hours do you spend on paperwork relating to the DPAS II system? Responses Count % 0-5 hours 2 0.81% 6-10 hours 11 4.44% 11-15 hours 11 4.44% 16-20 hours 7 2.82% more than 20 hours 200 80.65% (Did not answer) 17 6.85% Total Responses 248
Administrators Documentation
On an annual basis, how many hours do you spend on paperwork relating to the administrative portion of DPAS II?
Interviewees stated that paperwork and forms were causing the process to take so long. Shortening the forms was a common theme among administrators. There were also comments made about the form not aligning to teacher roles. Lastly, administrators alluded to needing clarification on how to complete the forms.
2011-12 DPAS II Evaluation Report 35 June 2012
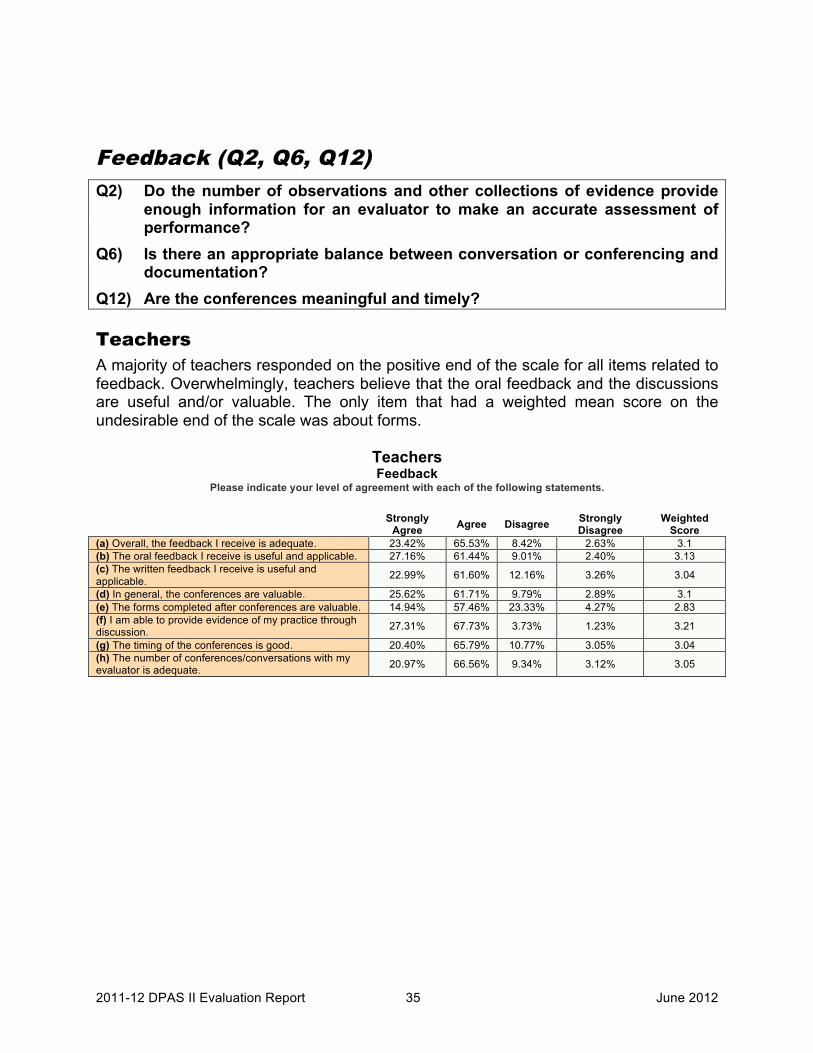
Feedback (Q2, Q6, Q12)
Q2) Do the number of observations and other collections of evidence provide enough information for an evaluator to make an accurate assessment of performance?
Q6) Is there an appropriate balance between conversation or conferencing and documentation?
Q12) Are the conferences meaningful and timely?
Teachers A majority of teachers responded on the positive end of the scale for all items related to feedback. Overwhelmingly, teachers believe that the oral feedback and the discussions are useful and/or valuable. The only item that had a weighted mean score on the undesirable end of the scale was about forms.
Teachers Feedback
Please indicate your level of agreement with each of the following statements.
Strongly Agree Agree Disagree Strongly
Disagree Weighted
Score (a) Overall, the feedback I receive is adequate. 23.42% 65.53% 8.42% 2.63% 3.1 (b) The oral feedback I receive is useful and applicable. 27.16% 61.44% 9.01% 2.40% 3.13 (c) The written feedback I receive is useful and applicable. 22.99% 61.60% 12.16% 3.26% 3.04
(d) In general, the conferences are valuable. 25.62% 61.71% 9.79% 2.89% 3.1 (e) The forms completed after conferences are valuable. 14.94% 57.46% 23.33% 4.27% 2.83 (f) I am able to provide evidence of my practice through discussion. 27.31% 67.73% 3.73% 1.23% 3.21
(g) The timing of the conferences is good. 20.40% 65.79% 10.77% 3.05% 3.04 (h) The number of conferences/conversations with my evaluator is adequate. 20.97% 66.56% 9.34% 3.12% 3.05

2011-12 DPAS II Evaluation Report 36 June 2012
Specialists Similar to teachers, specialists responded least favorably to the item, “The forms completed after conferences are valuable.” The highest mean score occurred on the item, “I am able to provide evidence of my practice through discussion,” followed by “The oral feedback I receive is useful and applicable” and “Overall the feedback I receive is adequate.”
Specialists Feedback
Please indicate your level of agreement with each of the following statements.
Strongly Agree Agree Disagree Strongly
Disagree Weighted
Score (a) Overall, the feedback I receive is adequate. 16.35% 70.02% 11.11% 2.52% 3 (b) The oral feedback I receive is useful and applicable. 19.71% 65.41% 12.37% 2.52% 3.02 (c) The written feedback I receive is useful and applicable. 16.18% 65.34% 15.76% 2.73% 2.95 (d) In general, the conferences are valuable. 16.88% 66.88% 13.92% 2.32% 2.98 (e) The forms completed after conferences are valuable. 9.83% 60.68% 25.64% 3.85% 2.76 (f) I am able to provide evidence of my practice through discussion. 21.80% 70.86% 5.66% 1.68% 3.13
(g) The timing of the conferences is good. 13.35% 72.03% 11.23% 3.39% 2.95 (h) The number of conferences/conversations with my evaluator is adequate. 13.32% 71.67% 12.05% 2.96% 2.95
Administrators Responses from administrators on feedback were positive. The weighted mean scores that are on the undesirable end of the scale were really close to a score of 3. Therefore, respondents weren’t overly positive, but the majority was still on the positive end of the scale.
Administrators Feedback
Please indicate your level of agreement with each of the following statements.
Strongly Agree Agree Disagree Strongly
Disagree Weighted
Score (a) Overall, the feedback I receive is adequate. 14.77% 70.46% 11.81% 2.95% 2.97 (b) The oral feedback I receive is useful and applicable. 23.31% 63.98% 9.32% 3.39% 3.07 (c) The written feedback I receive is useful and applicable. 14.16% 66.52% 15.02% 4.29% 2.91
(d) The timing of conferences is good. 14.04% 71.49% 10.21% 4.26% 2.95 (e) The number of conferences/conversations with my evaluator is adequate. 16.24% 64.53% 14.10% 5.13% 2.92
2011-12 DPAS II Evaluation Report 37 June 2012
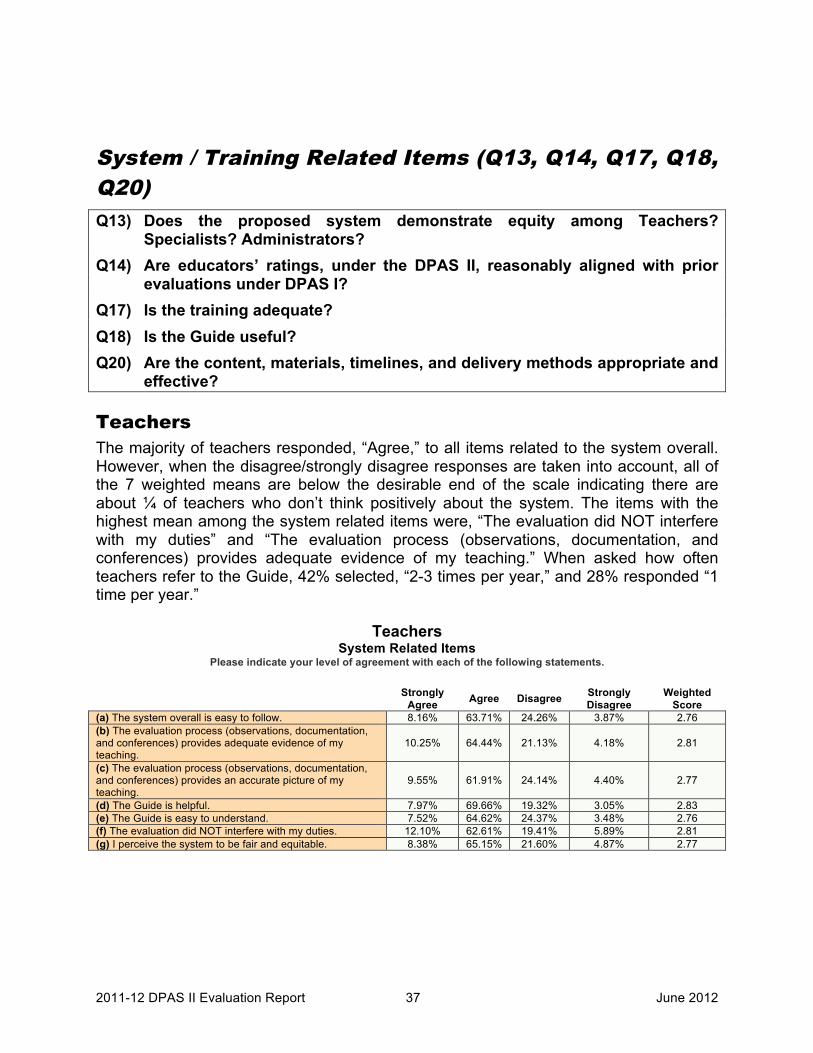
System / Training Related Items (Q13, Q14, Q17, Q18, Q20)
Q13) Does the proposed system demonstrate equity among Teachers? Specialists? Administrators?
Q14) Are educators’ ratings, under the DPAS II, reasonably aligned with prior evaluations under DPAS I?
Q17) Is the training adequate? Q18) Is the Guide useful? Q20) Are the content, materials, timelines, and delivery methods appropriate and
effective?
Teachers The majority of teachers responded, “Agree,” to all items related to the system overall. However, when the disagree/strongly disagree responses are taken into account, all of the 7 weighted means are below the desirable end of the scale indicating there are about ¼ of teachers who don’t think positively about the system. The items with the highest mean among the system related items were, “The evaluation did NOT interfere with my duties” and “The evaluation process (observations, documentation, and conferences) provides adequate evidence of my teaching.” When asked how often teachers refer to the Guide, 42% selected, “2-3 times per year,” and 28% responded “1 time per year.”
Teachers
System Related Items Please indicate your level of agreement with each of the following statements.
Strongly
Agree Agree Disagree Strongly Disagree
Weighted Score
(a) The system overall is easy to follow. 8.16% 63.71% 24.26% 3.87% 2.76 (b) The evaluation process (observations, documentation, and conferences) provides adequate evidence of my teaching.
10.25% 64.44% 21.13% 4.18% 2.81
(c) The evaluation process (observations, documentation, and conferences) provides an accurate picture of my teaching.
9.55% 61.91% 24.14% 4.40% 2.77
(d) The Guide is helpful. 7.97% 69.66% 19.32% 3.05% 2.83 (e) The Guide is easy to understand. 7.52% 64.62% 24.37% 3.48% 2.76 (f) The evaluation did NOT interfere with my duties. 12.10% 62.61% 19.41% 5.89% 2.81 (g) I perceive the system to be fair and equitable. 8.38% 65.15% 21.60% 4.87% 2.77

2011-12 DPAS II Evaluation Report 38 June 2012
Teachers
How often do you use or refer to the Guide for DPAS II?
Q16. How often do you use or refer to the Guide for DPAS II? Responses Count % Percentage of total respondents
Never 507 14.04% 1 time per year 1009 27.95% 2-3 times per year 1504 41.66% 4-5 times per year 276 7.65% 6 or more times per year 87 2.41% (Did not answer) 227 6.29% Total Responses 3610 20% 40% 60% 80% 100% Of the training items, among teachers, 58% responded that additional training would make them feel more competent in the process. The majority of teachers responded “Strongly Agree/Agree” for the training being timely and adequate. Sixty-one percent stated they did not need more training. However, there was an increase in teachers specifying they needed training in the Professional Responsibilities component. There is also evidence of this need from the interviews and focus groups. The sentiment was that it is a valid indicator, but there needs to be a better definition to match with teacher responsibilities and more clarity on what should be included in the component. Over 20% of teachers responded they could use additional training in managing the requirements with other duties, the rubrics, and the process as a whole.
Teachers Training Related Items
Please indicate your level of agreement with each of the following statements.
Strongly Agree Agree Disagree Strongly
Disagree Weighted
Score (a) The training was timely. 10.34% 70.34% 16.26% 3.07% 2.88 (b) Training in the process is adequate. 8.38% 65.17% 22.00% 4.44% 2.77 (c) Additional training would make me feel more competent in the process. 12.21% 45.89% 36.53% 5.38% 2.65

2011-12 DPAS II Evaluation Report 39 June 2012
Teachers Training Related Items
From the following list, select the components of the DPAS process where you need additional training.
None Component 1 Planning and Preparation
Component 2 – Classroom
Environment
Component 3 - Instruction
Component 4 -Professional
Responsibilities Did not answer Total
2007/2008 48.43% 5.18% 7.38% 13.42% 8.48% 12.72% 1274
2008/2009
2009/2010
53.17%
55.23%
11.41%
8.73%
14.38%
10.85%
21.34%
16.71%
13.71%
9.93%
5.00%
6.49%
3261
4914
2010/2011 54.77% 8.91% 10.25% 16.40% 9.89% 5.80% 3670
2011/2012
60.58%
14.43%
12.35%
14.88%
15.98%
9.56%
3610
Note: Multiple answers per participant possible. Percentages added may exceed 100 since a participant may select more than one answer for this question.
Teachers Training Related Items
From the following list, select specific aspects of the DPAS process where you need additional training.
Providing evidence of work
Completing paperwork
Interpreting data
Presenting data
Managing the
requirements of the
evaluation with my regular duties
Understanding the Guide
Preparing for
conferences
DPAS II cycle
Understanding the rubrics Total
2007/2008 15.38% 16.72% 28.18% 21.90% 21.04% 16.41% 10.05% n/a n/a 1274
2008/2009 2009/2010
18.89%
13.47%
18.34%
12.23%
28.15%
25.17%
21.22%
18.40%
25.76%
19.35%
14.41%
12.15%
12.60%
8.95%
n/a
n/a
n/a
n/a
3261
4914
2010/2011 12.34% 10.22% 27.17% 19.56% 18.15% 12.18% 8.2% n/a n/a 3670 2011/2012
15.87
15.79%
23.13%
19.42%
25.18%
13.43%
9.92%
21.16%
21.69%
3610
Note: Multiple answers per participant possible. Percentages added may exceed 100 since a participant may select more than one answer for this question.
Specialists The item that had the highest mean score was “The Guide is helpful.” Similar to past years, the item with the lowest weighted mean score was, “The evaluation process (observations, documentation, and conferences) provides an accurate picture of my performance.” The majority of specialists reported that they refer to the Guide “2-3 times per year.” The next highest category selected was, “1 time per year.”

2011-12 DPAS II Evaluation Report 40 June 2012
Specialists System Related Items
Please indicate your level of agreement with each of the following statements.
Strongly Agree Agree Disagree Strongly
Disagree Weighted
Score (a) The system overall is easy to follow. 3.42% 55.98% 34.40% 6.20% 2.57 (b) The evaluation process (observations, documentation, and conferences) provides adequate evidence of my performance.
4.42% 56.63% 32.84% 6.11% 2.59
(c) The evaluation process (observations, documentation, and conferences) provides an accurate picture of my performance.
4.00% 53.26% 36.21% 6.53% 2.55
(d) The Guide is helpful. 5.73% 67.94% 22.08% 4.25% 2.75 (e) The Guide is easy to understand. 5.57% 64.24% 25.91% 4.28% 2.71 (f) The evaluation did NOT interfere with my duties. 8.47% 62.50% 23.09% 5.93% 2.74 (g) I perceive the system to be fair and equitable. 4.46% 59.45% 29.51% 6.58% 2.62
Specialists How often do you use or refer to the Guide for DPAS II?
Q15. How often do you use or refer to the Guide for DPAS II? Responses Count % Percentage of total respondents
Never 62 12.38% 1 time per year 152 30.34% 2-3 times per year 205 40.92% 4-5 times per year 36 7.19% 6 or more times per year 14 2.79% (Did not answer) 32 6.39% Total Responses 501 20% 40% 60% 80% 100% In 2010-2011, the majority of specialists responded on the disagree end of the scale when asked if additional training would make them more competent in the process. In 2011-2012, the majority responded on the agree end of the scale. As with the teachers, the largest percent of specialists either did not respond or answered “None” when asked to indicate the areas in which they need additional training. The next largest percent of respondents checked “Collaboration and Consultation.” When asked about specific areas where they would need additional training, “DPAS II cycle” and “Understanding the Rubrics” were checked the most.
Specialists Training Related Items
Please indicate your level of agreement with each of the following statements.
Strongly Agree Agree Disagree Strongly
Disagree Weighted
Score (a) The training was timely. 5.83% 71.33% 17.95% 4.90% 2.78 (b) Training in the process is adequate. 3.27% 60.75% 31.54% 4.44% 2.63 (c) Additional training would make me feel more competent in the process. 13.06% 48.46% 32.54% 5.94% 2.69

2011-12 DPAS II Evaluation Report 41 June 2012
Specialists Training Related Items
From the following list, select the components of the DPAS process where you need additional training.
None Component 1 - Planning and Preparation
Component 2 - Professional Practice
and Delivery of Service
Component 3 - Professional
Collaboration and Consultation
Component 4 -Professional
Responsibilities
Did not answer Total
2007/2008 46.34% 6.34% 6.34% 5.37% 3.90% 19.02% 205
2008/2009
2009/2010
53.35%
58.05%
14.06%
8.90%
11.82%
9.32%
18.85%
11.23%
12.78%
8.47%
8.63%
8.90%
313
472 2010/2011 50.31% 11.23% 12.06% 13.10% 11.85% 11.85% 481 2011/2012 53.49% 19.96% 19.76% 22.55% 15.17% 11.58% 501 Note: Multiple answers per participant possible. Percentages added may exceed 100 since a participant may select more than one
answer for this question.
Specialists Training Related Items
From the following list, select specific aspects of the DPAS process where you need additional training.
Providing evidence of work
Completing paperwork
Interpreting data
Presenting data
Managing the requirements
of the evaluation
with my regular duties
Understanding the Guide
Preparing for
conferences
DPAS II cycle
Understanding the Rubrics Total
2007/2008 17.56% 20.00% 29.27% 24.88% 22.44% 15.61% 9.27% n/a n/a 205 2008/2009
2009/2010
20.45%
16.95%
16.93%
10.81%
25.24%
26.27%
20.13%
23.52%
22.36%
15.04%
15.65%
12.08%
12.46%
6.57%
n/a
n/a
n/a
n/a
313
472 2010/2011 18.30% 8.32% 23.49% 21.41% 17.05% 14.14% 8.32% n/a n/a 481 2011/2012 22.95% 19.36% 20.96% 24.35% 15.37% 11.58% 26.15% 27.94% 32.73% 501 Note: Multiple answers per participant possible. Percentages added may exceed 100 since a participant may select more than one
answer for this question.

2011-12 DPAS II Evaluation Report 42 June 2012
Administrators Among administrators, the majority responded that the system is easy to follow and provides adequate evidence and an accurate picture of performance. Items related to the Guide also received positive responses. When asked “How often do you refer to the guide for DPAS II,” the category with the most responses from administrators was, “6 or more times per year.”
Administrators System Related Items
Please indicate your level of agreement with each of the following statements.
Strongly Agree Agree Disagree Strongly
Disagree Weighted
Score (a) The system overall is easy to follow. 5.68% 62.88% 27.07% 4.37% 2.7 (b) The evaluation process (observations, documentation, and conferences) provides adequate evidence of my performance. 4.26% 71.91% 20.43% 3.40% 2.77
(c) The evaluation process (observations, documentation, and conferences) provides an accurate picture of my performance. 4.33% 66.67% 25.11% 3.90% 2.71
(d) The Guide is helpful. 9.05% 77.16% 12.93% 0.86% 2.94 (e) The Guide is easy to understand. 6.93% 70.13% 20.78% 2.16% 2.82 (f) The evaluation did NOT interfere with my duties. 9.44% 57.94% 28.33% 4.29% 2.73 (g) I perceive the system to be fair and equitable. 6.06% 75.32% 15.15% 3.46% 2.84
Administrators How often do you refer to the guide for DPAS II?
Q16. How often do you refer to the guide for DPAS II? Responses Count % Percentage of total respondents
Never 1 0.40% 1 time per year 3 1.21% 2-3 times per year 39 15.73% 4-5 times per year 50 20.16% 6 or more times per year 134 54.03% (Did not answer) 21 8.47% Total Responses 248 20% 40% 60% 80% 100% There has been a slight increase in administrators stating that additional training would make them feel more competent. In 2009-2010, 65% responded on the agree end of the scale. That increased to 70% in 2010-2011and in 2011-2012. When asked what components or areas do they need additional training, about ¼ selected “Culture of Learning” and “Vision and Goals.” Since 2007-2008, more administrators have indicated that they need additional training in “Managing the requirements of the evaluation with my regular duties.”

2011-12 DPAS II Evaluation Report 43 June 2012
Administrators Training Related Items
Please indicate your level of agreement with each of the following statements.
Strongly Agree Agree Disagree Strongly
Disagree Weighted
Score (a) The training was timely. 17.98% 46.49% 25.88% 9.65% 2.73 (b) Training in the process is adequate. 15.04% 54.42% 24.34% 6.19% 2.78 (c) Additional training would make me feel more competent in the process. 20.70% 50.66% 25.11% 3.52% 2.89
Administrators Training Related Items
From the following list, select the components of the DPAS process where you need additional training.
Component 1 - Vision and Goals
Component 2 - Culture of Learning
Component 3 - Management
Component 4 - Professional
Responsibilities Did not answer Total
2007/2008 17.65% 19.61% 9.80% 7.84% 39.22% 51 2008/2009
2009/2010
14.95%
14.73%
16.49%
13.79%
11.86%
10.03%
9.79%
6.90%
53.09%
49.84%
194
319 2010/2011 23.51% 20.90% 17.16% 16.42% 36.19% 268 2011/2012 25.40% 25.00% 14.52% 13.31% 11.69% 248
Note: Multiple answers per participant possible. Percentages added may exceed 100 since a participant may select more than one answer for this question.
Administrators Training Related Items
From the following list, select specific aspects of the DPAS process where you need additional training.
Providing evidence of work
Completing paperwork
Interpreting data
Presenting data
Managing the requirements
of the evaluation
with my regular duties
Understanding the Guide
Preparing for
conferences
DPAS II cycle
Understanding the rubrics Total
2007/2008 13.73% 7.84% 33.33% 21.57% 19.61% 1.96% 15.69% n/a n/a 51 2008/2009 2009/2010
18.56%
14.42%
12.37%
11.91%
18.04%
21.94%
17.53%
15.67%
24.23%
27.27%
5.67%
4.39%
19.59%
13.48%
n/a
n/a
n/a
n/a
194
319 2010/2011 22.39% 14.93% 28.36% 24.25% 38.81% 8.58% 20.52% n/a n/a 268 2011/2012 26.61% 22.98% 19.35% 14.11% 44.35% 5.65% 17.34% 13.31% 16.94% 248 Note: Multiple answers per participant possible. Percentages added may exceed 100 since a participant may select more than one
answer for this question.

2011-12 DPAS II Evaluation Report 44 June 2012
Data Related Issues (Q10)
Q10) What specific issues were encountered with Component V of the teacher and specialist processes?
Between 2 groups (teachers and specialists), the item with the highest mean in the data construct was, “Student data helps me adjust instruction for my students.” Among administrators, the item with the highest mean was “Student data gives me an accurate picture of my students’ progress.” The lowest mean score among all 3 groups dealt with being able to complete the data documentation with difficulty.
Teachers Data Related Items
Please indicate your level of agreement with each of the following statements:
Specialists Data Related Items
Please indicate your level of agreement with each of the following statements:
Administrators Data Related Items
Please indicate your level of agreement with each of the following statements:

2011-12 DPAS II Evaluation Report 45 June 2012
Improvement Plans (Q16)
Q16) Is the “Improvement Plan” process helpful? Only 1.3% of the teacher respondents were placed on improvement plans in 2010-2011. There were less than 5 specialists and administrators who responded that they were on improvement plans. Subsequently, only the teacher responses to the improvement plan items are presented. Among teachers on improvement plans, 60% responded “Strongly Agree” or “Agree,” when asked if the improvement plan outlined measurable goals to work toward achieving. In 2008-2009, slightly fewer than 50% responded on the strongly agree/agree end of the scale for “There are adequate resources to implement improvement plans.” This percent increased to 61% in 2009-2010, decreased to 44% in 2010-2011, and increased back to the original level (51%).
Teachers Improvement Plans
Please indicate your level of agreement with each of the following statements:
Teachers Improvement Plans
Were you placed on an improvement plan this year?
Yes No Total
2008/2009
2009-2010
1.32%
1.14%
98.68%
98.86%
3261
4819
2010-2011 1.60% 98.4% 3569 2011-2012 1.27% 93.46% 3610

2011-12 DPAS II Evaluation Report 46 June 2012

2011-12 DPAS II Evaluation Report 47 June 2012
Website Evaluation (Q24)
Q24) Does the system provide the necessary support and resources to allow educators to reflect on and identify ways to improve their practice?
Almost all administrators were aware of the DPAS II website. Fewer teachers (72%) and specialists (73%) were aware of it. Across all 3 groups there were positive responses about the online manual, training materials, and the website. The lowest rated item among all 3 groups was about the short videos.
Teachers Website Evaluation
Please indicate your level of agreement with the following statements:
Strongly Agree Agree Disagree Strongly
Disagree Total Weighted Score
(d) The online manual was useful. 6.50% 65.76% 23.25% 4.50% 3110 2.74 (e) The online manual was easy to use. 6.41% 63.31% 25.87% 4.40% 3088 2.72 (f) The short videos were helpful. 5.18% 61.52% 28.16% 5.15% 3090 2.67 (g) The training materials were helpful. 5.56% 71.36% 19.59% 3.49% 3094 2.79 (h) The FAQs addressed my questions. 4.90% 70.02% 21.79% 3.28% 3079 2.77 (i) The website provides me with all the information I need on DPAS II. 6.58% 68.29% 21.70% 3.43% 3087 2.78
Specialists Website Evaluation
Please indicate your level of agreement with the following statements.
Strongly Agree Agree Disagree Strongly
Disagree Total Weighted Score
(d) The online manual was useful. 8.11% 64.68% 23.63% 3.58% 419 2.77 (e) The online manual was easy to use. 6.78% 62.95% 26.88% 3.39% 413 2.73 (f) The short videos were helpful. 3.79% 54.80% 36.87% 4.55% 396 2.58 (g) The training materials were helpful. 4.32% 69.30% 22.54% 3.84% 417 2.74 (h) The FAQs addressed my questions. 3.26% 62.16% 29.07% 5.51% 399 2.63 (i) The website provides me with all the information I need on DPAS II. 4.35% 63.29% 27.78% 4.59% 414 2.67
Administrators Website Evaluation
Please indicate your level of agreement with the following statements.
Strongly Agree Agree Disagree Strongly
Disagree Total Weighted Score
(d) The online manual was useful. 18.94% 63.88% 13.66% 3.52% 227 2.98 (e) The online manual was easy to use. 19.20% 59.82% 16.96% 4.02% 224 2.94 (f) The short videos were helpful. 12.33% 57.99% 25.11% 4.57% 219 2.78 (g) The training materials were helpful. 11.95% 73.45% 11.06% 3.54% 226 2.94 (h) The FAQs addressed my questions. 8.60% 73.76% 14.93% 2.71% 221 2.88 (i) The website provides me with all the information I need on DPAS II. 13.72% 59.73% 23.89% 2.65% 226 2.85

2011-12 DPAS II Evaluation Report 48 June 2012
Website Evaluation Are you familiar with the Department of Education website that supports DPAS II?
2011-2012 Yes No
Teachers 72.3% 20.8%
Specialists 72.9% 19.6%
Administrators 92.7% 1%
There were a few positive comments about the online materials among interviewees.
Handling Unique Circumstances (Q25)
25) What unique circumstances were encountered? How were they handled? No specific unique circumstances were brought to the attention of the interviewers or during the focus groups.
General System (Q26)
26) As a whole, how did the system work? There were almost the same percent of teachers agreeing and disagreeing with the item “I believe the current DPAS II evaluation system should be continued in its current form.” The majority believe it is being implemented appropriately.
Teachers General System Items
Please indicate your level of agreement with the following statements.
Strongly Agree Agree Disagree Strongly
Disagree Total Weighted Score
(a) The DPAS II evaluation system needs improving. 18.74% 51.06% 29.02% 1.18% 3394 2.87
(b) I believe the DPAS II evaluation system is being implemented appropriately in my work location.
10.54% 69.91% 15.43% 4.12% 3397 2.87
(c) I believe the current DPAS II evaluation system should be continued in its current form.
5.42% 41.91% 42.47% 10.20% 3374 2.43
Q18. How often has an evaluator conducted a walk-through in your classroom?
Never 1 time 2-3 times 4-5 times 6 or more times per year Did not answer Total
Responses Received in % 4.99% 8.89% 29.70% 20.44% 29.47% 6.51% 3610 Q19. Prior to DPAS II, how often did an evaluator conduct a walk-through in your classroom?
Never 1 time 2-3 times 4-5 times 6 or more times per year Did not answer Total
Responses Received in % 11.08% 11.69% 34.13% 17.26% 17.42% 8.42% 3610
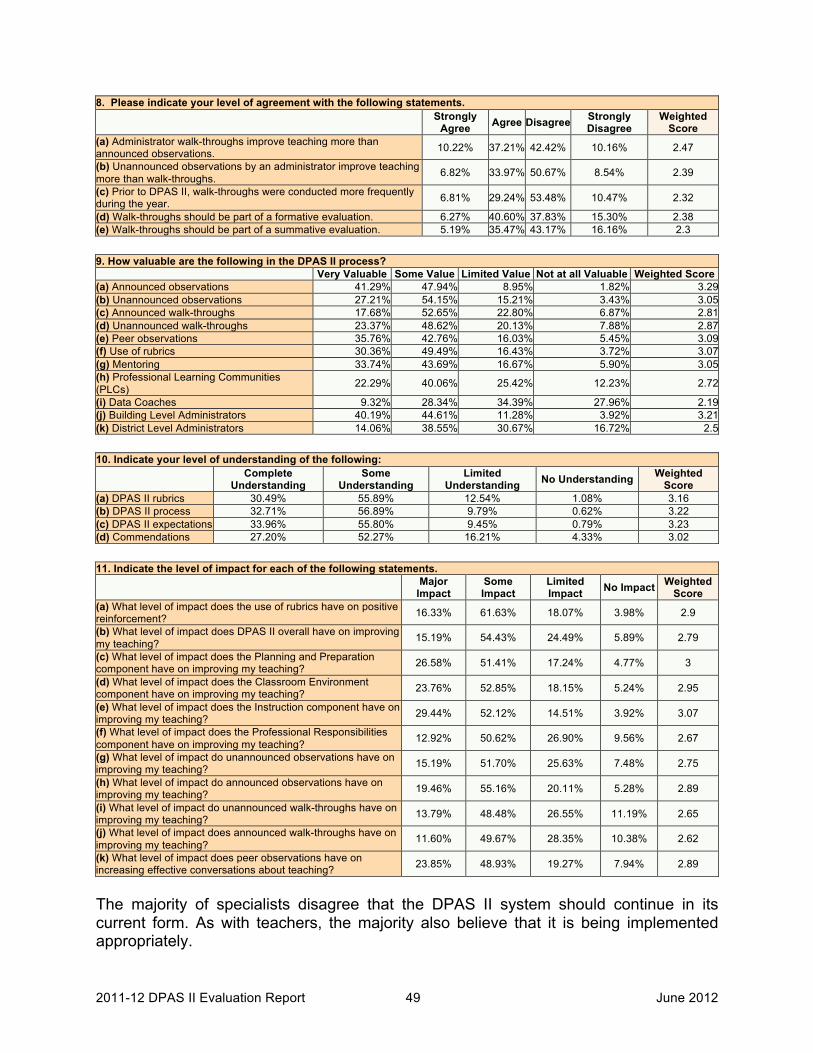
2011-12 DPAS II Evaluation Report 49 June 2012
8. Please indicate your level of agreement with the following statements.
Strongly Agree Agree Disagree Strongly
Disagree Weighted
Score (a) Administrator walk-throughs improve teaching more than announced observations. 10.22% 37.21% 42.42% 10.16% 2.47
(b) Unannounced observations by an administrator improve teaching more than walk-throughs. 6.82% 33.97% 50.67% 8.54% 2.39
(c) Prior to DPAS II, walk-throughs were conducted more frequently during the year. 6.81% 29.24% 53.48% 10.47% 2.32
(d) Walk-throughs should be part of a formative evaluation. 6.27% 40.60% 37.83% 15.30% 2.38 (e) Walk-throughs should be part of a summative evaluation. 5.19% 35.47% 43.17% 16.16% 2.3 9. How valuable are the following in the DPAS II process?
Very Valuable Some Value Limited Value Not at all Valuable Weighted Score (a) Announced observations 41.29% 47.94% 8.95% 1.82% 3.29 (b) Unannounced observations 27.21% 54.15% 15.21% 3.43% 3.05 (c) Announced walk-throughs 17.68% 52.65% 22.80% 6.87% 2.81 (d) Unannounced walk-throughs 23.37% 48.62% 20.13% 7.88% 2.87 (e) Peer observations 35.76% 42.76% 16.03% 5.45% 3.09 (f) Use of rubrics 30.36% 49.49% 16.43% 3.72% 3.07 (g) Mentoring 33.74% 43.69% 16.67% 5.90% 3.05 (h) Professional Learning Communities (PLCs) 22.29% 40.06% 25.42% 12.23% 2.72
(i) Data Coaches 9.32% 28.34% 34.39% 27.96% 2.19 (j) Building Level Administrators 40.19% 44.61% 11.28% 3.92% 3.21 (k) District Level Administrators 14.06% 38.55% 30.67% 16.72% 2.5 10. Indicate your level of understanding of the following:
Complete Understanding
Some Understanding
Limited Understanding No Understanding Weighted
Score (a) DPAS II rubrics 30.49% 55.89% 12.54% 1.08% 3.16 (b) DPAS II process 32.71% 56.89% 9.79% 0.62% 3.22 (c) DPAS II expectations 33.96% 55.80% 9.45% 0.79% 3.23 (d) Commendations 27.20% 52.27% 16.21% 4.33% 3.02 11. Indicate the level of impact for each of the following statements.
Major Impact
Some Impact
Limited Impact No Impact Weighted
Score (a) What level of impact does the use of rubrics have on positive reinforcement? 16.33% 61.63% 18.07% 3.98% 2.9
(b) What level of impact does DPAS II overall have on improving my teaching? 15.19% 54.43% 24.49% 5.89% 2.79
(c) What level of impact does the Planning and Preparation component have on improving my teaching? 26.58% 51.41% 17.24% 4.77% 3
(d) What level of impact does the Classroom Environment component have on improving my teaching? 23.76% 52.85% 18.15% 5.24% 2.95
(e) What level of impact does the Instruction component have on improving my teaching? 29.44% 52.12% 14.51% 3.92% 3.07
(f) What level of impact does the Professional Responsibilities component have on improving my teaching? 12.92% 50.62% 26.90% 9.56% 2.67
(g) What level of impact do unannounced observations have on improving my teaching? 15.19% 51.70% 25.63% 7.48% 2.75
(h) What level of impact do announced observations have on improving my teaching? 19.46% 55.16% 20.11% 5.28% 2.89
(i) What level of impact do unannounced walk-throughs have on improving my teaching? 13.79% 48.48% 26.55% 11.19% 2.65
(j) What level of impact does announced walk-throughs have on improving my teaching? 11.60% 49.67% 28.35% 10.38% 2.62
(k) What level of impact does peer observations have on increasing effective conversations about teaching? 23.85% 48.93% 19.27% 7.94% 2.89
The majority of specialists disagree that the DPAS II system should continue in its current form. As with teachers, the majority also believe that it is being implemented appropriately.

2011-12 DPAS II Evaluation Report 50 June 2012
Specialists General System Items
Please indicate your level of agreement with the following statements.
Strongly Agree Agree Disagree Strongly
Disagree Total Weighted Score
(a) The DPAS II evaluation system needs improving. 27.16% 50.43% 21.55% 0.86% 464 3.04 (b) I believe the DPAS II evaluation system is being implemented appropriately in my work location. 6.79% 69.64% 18.26% 5.31% 471 2.78
(c) I believe the DPAS II evaluation system should be continued in its current form. 1.52% 37.31% 47.07% 14.10% 461 2.26
8. How valuable are the following in the DPAS II process?
Very Valuable
Some Value
Limited Value
Not at all Valuable
Weighted Score
(a) Announced observations 27.12% 54.45% 14.41% 4.03% 3.05 (b) Unannounced observations 19.53% 58.17% 17.62% 4.67% 2.93 (c) Peer observations 27.72% 42.13% 18.63% 11.53% 2.86 (d) Use of rubrics 18.80% 50.21% 21.37% 9.62% 2.78 (e) Mentoring 30.02% 43.49% 15.67% 10.82% 2.93 (f) Professional Learning Communities (PLCs) 16.63% 41.46% 23.73% 18.18% 2.57 (g) Data Coaches 6.22% 34.56% 29.49% 29.72% 2.17 (h) Building Level Administrators 28.48% 48.39% 16.27% 6.85% 2.99 (i) District level Administrators 12.28% 41.59% 28.66% 17.46% 2.49 9. Indicate your level of understanding of the following:
Complete Understanding
Some Understanding
Limited Understanding
No Understanding Weighted Score
(a) DPAS II rubrics 22.77% 54.26% 18.30% 4.68% 2.95 (b) DPAS II process 26.33% 56.90% 14.44% 2.34% 3.07 (c) DPAS II expectations 27.45% 55.96% 14.47% 2.13% 3.09 (d) Commendations 19.27% 51.61% 22.48% 6.64% 2.84
10. Indicate the level of impact for each of the following statements.
Major Impact
Some Impact
Limited Impact
No Impact
Weighted Score
(a) What level of impact does the use of rubrics have on positive reinforcement? 7.84% 56.43% 26.80% 8.93% 2.63
(b) What level of impact does DPAS II overall have on improving my performance? 8.30% 54.89% 26.81% 10.00% 2.61
(c) What level of impact does the Planning and Preparation component have on improving my performance?
12.79% 51.81% 26.87% 8.53% 2.69
(d) What level of impact does the Professional Practice and Delivery of Service component have on improving my performance?
18.05% 48.83% 26.33% 6.79% 2.78
(e) What level of impact does the Professional Collaboration and Consultation component have on improving my performance?
11.75% 55.98% 24.57% 7.69% 2.72
(f) What level of impact does the Professional Responsibilities component have on improving my performance?
14.44% 50.74% 27.39% 7.43% 2.72
(g) What level of impact do unannounced observations have on improving my performance? 9.25% 45.59% 32.90% 12.26% 2.52
(h) What level of impact do announced observations have on improving my performance? 10.66% 50.32% 29.00% 10.02% 2.62
(i) What level of impact does peer observations have on increasing effective conversations about performance? 14.73% 45.71% 26.15% 13.41% 2.62
The majority of administrators believe that the evaluation system is being implemented appropriately in their work location. However, as with the teachers and specialists, the majority disagree that DPAS II should be continued in its current form.

2011-12 DPAS II Evaluation Report 51 June 2012
Administrators
General System Items Please indicate your level of agreement with the following statements.
Strongly Agree Agree Disagree Strongly
Disagree Total Weighted Score
(a) The DPAS II evaluation system needs improving. 29.65% 57.52% 11.06% 1.77% 226 3.15 (b) I believe the DPAS II evaluation system is being implemented appropriately in my work location. 11.11% 71.11% 13.78% 4.00% 225 2.89
(c) I believe the current DPAS II evaluation system should be continued in its current form. 3.56% 32.89% 49.33% 14.22% 225 2.26
8. Please indicate your level of agreement with the following statements.
Strongly Agree Agree Disagree Strongly
Disagree Did Not Answer
Weighted Score
(a) Administrator walk-throughs improve teaching more than announced observations. 29.44% 43.95% 18.95% 0% 7.66% 3.11
(b) Unannounced observations by an administrator improve teaching more than walk-throughs. 17.34% 50.40% 22.58% 2.02% 7.66% 2.9
(c) Prior to DPAS II, walk-throughs were conducted more frequently during the year. 17.34% 35.08% 36.69% 2.82% 8.06% 2.73
(d) Walk-throughs should be part of a formative evaluation. 18.95% 47.18% 22.98% 4.44% 6.45% 2.86 (e) Walk-throughs should be part of a summative evaluation. 20.16% 46.77% 22.18% 3.63% 7.26% 2.9
9. How valuable are the following in the DPAS II process?
Very Valuable
Some Value
Limited Value
Not at all Valuable
Did Not Answer
Weighted Score
(a) Announced observations 30.24% 43.15% 20.16% 0.81% 5.65% 3.09 (b) Unannounced observations 68.55% 22.98% 2.02% 0% 6.45% 3.71 (c) Announced walk-throughs 13.71% 49.60% 25.00% 3.63% 8.06% 2.8 (d) Unannounced walk-throughs 66.13% 23.39% 3.63% 0.81% 6.05% 3.65 (e) Peer observations 45.56% 35.48% 9.27% 2.42% 7.26% 3.34 (f) Use of rubrics 47.98% 38.71% 6.45% 0.81% 6.05% 3.42 (g) Mentoring 54.03% 32.26% 6.05% 0% 7.66% 3.52 (h) Professional Learning Communities (PLCs) 55.24% 30.65% 7.26% 0% 6.85% 3.52
(i) Data Coaches 23.39% 36.29% 22.18% 11.29% 6.85% 2.77
10. Indicate your level of understanding of the following:
Complete Understanding
Some Understanding
Limited Understanding
No Understanding
Did not answer
Weighted Score
(a) DPAS II rubrics 55.24% 34.68% 2.42% 0.40% 7.26% 3.56 (b) DPAS II process 60.48% 31.45% 0.40% 0% 7.66% 3.65 (c) DPAS II expectations 53.63% 36.69% 2.42% 0% 7.26% 3.55
(d) Commendations 46.77% 39.11% 6.45% 0% 7.66% 3.44
Overall Grade Teachers, specialists, and administrators were asked to give the evaluation process a grade (A – F) and to indicate their level of agreement with 3 general items about the system. The majority of teachers, specialists, and administrators gave the process a grade of a “B.” A higher percent of teachers gave the process a grade of “A” than specialists or administrators. The next highest grade among all 3 groups was “C.”

2011-12 DPAS II Evaluation Report 52 June 2012
Teachers
Q23. Overall, what grade would you give the evaluation process? Responses Count %
A 242 6.70%
B 1492 41.33% C 1163 32.22%
D 355 9.83% F 126 3.49%
(Did not answer) 232 6.43% Total Responses 3610
Specialists
Q20. Overall, what grade would you give the evaluation process?
Responses Count %
A 22 4.39% B 167 33.33%
C 177 35.33% D 76 15.17%
F 29 5.79%
(Did not answer) 30 5.99% Total Responses 501
Administrators
Q23. Overall, what grade would you give the evaluation process?
Responses Count % A 5 2.02%
B 88 35.48% C 86 34.68%
D 43 17.34%
F 9 3.63% (Did not answer) 17 6.85%
Total Responses 248

2011-12 DPAS II Evaluation Report 53 June 2012
Focus Group Findings
Teacher Focus Groups Teachers overwhelmingly believe in the effectiveness of walkthrough observations. Many voiced the reality that the announced, formal observation was not authentic. The teachers had to “perform” for the administrator in order to demonstrate all parts of a lesson. This demonstration did not reflect the normal flow of their classroom, and because it was contrived, they believe the feedback to be on behaviors and activities that were not authentic or how they really teach. Teachers indicated requiring evidence that was not part of the normal day suggested a “lack of trust” and possibly encouraged “dishonest behavior” on the part of some. When asked how to strengthen this part of the process, teachers listed several suggestions.
1. Increase the amount of unannounced observations as long as the discussion and oral feedback are coupled with the increase.
2. Increase walkthrough observations for some as long as the discussion and oral feedback are coupled with the increase.
3. Have a select group of individuals, agreed upon by the administrator and teacher, provide feedback. Teachers want to be viewed through more than one lens.
4. May include peer visitation and observation. 5. Walkthrough observations (multiple) should be the basis of the
experienced teacher’s yearly reflection. 6. Make evidence authentic, part of the normal routine, not a collection of
artifacts. 7. Make use of technology to provide feedback after walkthrough
observations. 8. Provide brief conferencing after walkthrough observations. 9. Eliminate formal announced observations for prepared (as agreed upon by
the teacher and principal) teachers and replace with walkthrough observations.
10. Expand some form of mentoring for experienced teachers. 11. Continue training focusing on observation and feedback techniques for
evaluators and peer observers. 12. Remove the word “Evaluator” from DPAS II. Choose another term such as
“Reflective Practitioner” to refer to the person supporting and facilitating a teacher’s reflective practice.

2011-12 DPAS II Evaluation Report 54 June 2012
The fear mentioned last year that DPAS II could become routine in the future and thus lose the leverage it enjoyed is now happening. Teachers believe they are returning to the checklists of years past. They believe that feedback and conversation make a difference. Teacher perception is that the rubrics are being turned into checklists. The mountain of paperwork required to do one formal observation is such that it is all one can do and must be made routine to survive. Teachers state that DPASII has become impersonal and less authentic. They also believe training must be continued and become more sophisticated. This is in contrast to the survey that indicates teachers no longer need training. When discussing training, teachers do not need more training on the basics of DPAS II but they do want additional discussion and communication to improve reflective practice. Late programmatic changes caused confusion and concern about how the program would operate in 2011-2012. The following suggestions are continued from last year. There can never be enough emphasis placed on the communication needs of teachers. 1. Create additional vehicles for conversations and communication for teachers. 2. Use the Internet to share information and ideas. 3. Build in refresher training for all teachers to reconnect with the philosophy of
reflective practice. 4. No changes in DPAS II once the school year begins. 5. Eliminate the routine questions contained in Professional Responsibilities. 6. Train teachers with the same information given to evaluators. “It was more
insightful.” 7. Make certain emphasis on goal setting and sharing extends to areas like
parent communication.
Specialists Focus Group Findings Specialists remain cautious about the value of DPASII. This year many voiced concern about whether they were really a specialist or a teacher. They would like to have a review of their classification. They strongly believe walkthroughs with multiple observers is important, especially if one of the observers is familiar with their field. Like teachers, specialists are concerned about the rubrics and returning to a checklist mentality. They would like to see more use of the variety of association standards used in their reflective practice. They believe the increase in walkthroughs would have a very positive impact on discipline in the schools because of the increased visibility of administrators and visitors. They also voiced that teacher morale would be positively impacted with increased observations and authentic feedback.
1. Use walkthroughs with several different observers. 2. Use peer evaluation. 3. Tie goals and expectations to national standards from the various
professional associations.
2011-12 DPAS II Evaluation Report 55 June 2012
4. Increase training for evaluators on specialist DPAS II. 5. Review current classification to assure correct instrument is being used,
teacher versus specialist. 6. Customize rubrics and forms by specialty.
Administrator Focus Group Findings Administrators provided the most dynamic change in the conversation this year. They reflected the same concerns as teachers and specialists, DPAS II is an “evaluation” program. Reflective practice and growth was not mentioned unless prodded in the discussions. Administrators feel they are trapped in a system that requires shortcuts and checklists to survive. They are determined to help teachers but the system does set up contrived performances by teachers and specialists. They realize that their feedback is not an authentic reflection of daily behavior. They support the concept of walkthroughs with several sets of eyes at different times throughout the day and year. They believe new teachers require early structure, but can be moved to a system of walkthroughs when comfortable. There is concern with tying improvement activities to DPAS II. There is concern that working with teachers requiring formal intervention as part of DPASSII improvement plan is distracting.
1. Use walkthroughs on a regular basis. 2. Create opportunities for several individuals to participate at different times
in walkthroughs. Do not invade the classroom with more than one observer at a time.
3. Gather observations from walkthroughs for the purpose of reflective feedback at the end of the year.
4. Use announced, formal observations and walkthroughs for new teachers. 5. Improve and customize rubrics and forms for specialists. 6. Continuation training for reflective practice conferences. 7. Find a way to increase unannounced observations, the best part of DPAS
II. 8. Separate formal Improvement Process actions from the DPAS II program. 9. Summative conversations should be as much about the future as the past.
Actual Time Intervals There were no big discrepancies between the actual interval of days between activities and the recommended interval of days on scheduling the observation and the pre-observation conference. There were discrepancies with the post-observation intervals and the summative conference. There were more teachers recommending the “1-5 day” interval versus those responding that it was the actual.
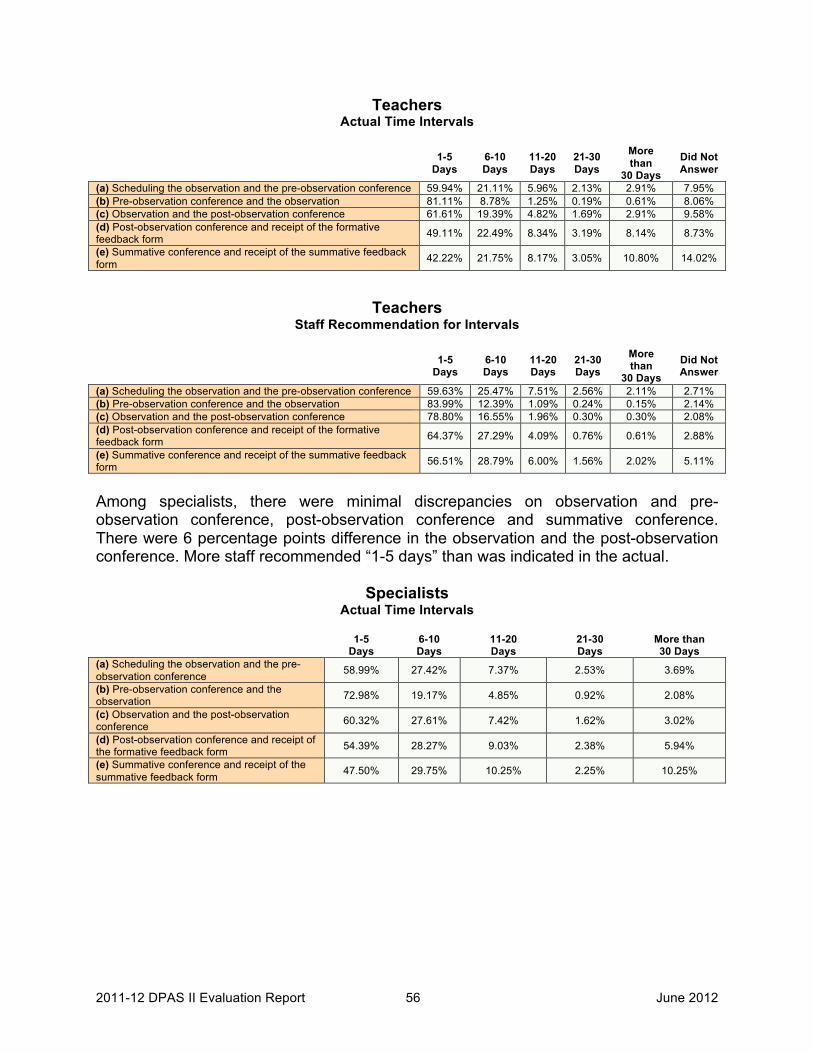
2011-12 DPAS II Evaluation Report 56 June 2012
Teachers Actual Time Intervals
1-5 Days
6-10 Days
11-20 Days
21-30 Days
More than
30 Days
Did Not Answer
(a) Scheduling the observation and the pre-observation conference 59.94% 21.11% 5.96% 2.13% 2.91% 7.95% (b) Pre-observation conference and the observation 81.11% 8.78% 1.25% 0.19% 0.61% 8.06% (c) Observation and the post-observation conference 61.61% 19.39% 4.82% 1.69% 2.91% 9.58% (d) Post-observation conference and receipt of the formative feedback form 49.11% 22.49% 8.34% 3.19% 8.14% 8.73%
(e) Summative conference and receipt of the summative feedback form 42.22% 21.75% 8.17% 3.05% 10.80% 14.02%
Teachers Staff Recommendation for Intervals
1-5 Days
6-10 Days
11-20 Days
21-30 Days
More than
30 Days Did Not Answer
(a) Scheduling the observation and the pre-observation conference 59.63% 25.47% 7.51% 2.56% 2.11% 2.71% (b) Pre-observation conference and the observation 83.99% 12.39% 1.09% 0.24% 0.15% 2.14% (c) Observation and the post-observation conference 78.80% 16.55% 1.96% 0.30% 0.30% 2.08% (d) Post-observation conference and receipt of the formative feedback form 64.37% 27.29% 4.09% 0.76% 0.61% 2.88%
(e) Summative conference and receipt of the summative feedback form 56.51% 28.79% 6.00% 1.56% 2.02% 5.11%
Among specialists, there were minimal discrepancies on observation and pre-observation conference, post-observation conference and summative conference. There were 6 percentage points difference in the observation and the post-observation conference. More staff recommended “1-5 days” than was indicated in the actual.
Specialists Actual Time Intervals
1-5
Days 6-10 Days
11-20 Days
21-30 Days
More than 30 Days
(a) Scheduling the observation and the pre-observation conference 58.99% 27.42% 7.37% 2.53% 3.69%
(b) Pre-observation conference and the observation 72.98% 19.17% 4.85% 0.92% 2.08%
(c) Observation and the post-observation conference 60.32% 27.61% 7.42% 1.62% 3.02%
(d) Post-observation conference and receipt of the formative feedback form 54.39% 28.27% 9.03% 2.38% 5.94%
(e) Summative conference and receipt of the summative feedback form 47.50% 29.75% 10.25% 2.25% 10.25%

2011-12 DPAS II Evaluation Report 57 June 2012
Specialists Staff Recommendation for Intervals
1-5
Days 6-10 Days
11-20 Days
21-30 Days
More than 30 Days
Don't Know/ Don't Care
(a) Scheduling the observation and the pre-observation conference 54.34% 29.22% 6.85% 2.28% 1.14% 6.16%
(b) Pre-observation conference and the observation 66.74% 22.48% 4.59% 0.69% 0.23% 5.28% (c) Observation and the post-observation conference 65.65% 25.00% 3.50% 0.70% 0.23% 4.91% (d) Post-observation conference and receipt of the formative feedback form 54.88% 31.63% 6.51% 0.93% 0.47% 5.58%
(e) Summative conference and receipt of the summative feedback form 46.70% 34.43% 8.02% 2.36% 1.18% 7.31%
The majority of administrators selected 1-5 days as the interval that represents the actual time between pairs of activities. This closely aligns with the staff recommendations of the intervals between pairs of activities. One discrepancy showed up in the pre-observation conference and the observation activities. Seventy-nine percent indicated 1 – 5 days was the recommended, while 91% stated 1-5 days was actual.
Administrators
Actual Time Intervals
1 - 5 Days
6 - 10 Days
11 - 20 Days
21 - 30 Days
More than 30 Days
(a) Scheduling the observation and the pre-observation conference 65.20% 27.75% 4.41% 2.64% 0% (b) Pre-observation conference and the observation 90.75% 7.49% 1.76% 0% 0% (c) Observation and the post-observation conference 69.78% 25.33% 4.00% 0.89% 0% (d) Post-observation conference and receipt of the formative feedback form 28.32% 47.35% 15.49% 4.42% 4.42% (e) Summative conference and receipt of the summative feedback form 33.49% 48.17% 11.47% 1.38% 5.50%
Administrators
Staff Recommendation for Intervals
1 - 5 Days
6 - 10 Days
11 - 20 Days
21 - 30
Days More than 30 Days
Did not Answer
(a) Scheduling the observation and the pre-observation conference 61.29% 22.18% 6.05% 1.61% 0% 8.87%
(b) Pre-observation conference and the observation 79.03% 10.89% 1.21% 0% 0% 8.87% (c) Observation and the post-observation conference 65.73% 20.97% 3.63% 0% 0% 9.68% (d) Post-observation conference and receipt of the formative feedback form 33.47% 35.48% 15.73% 4.44% 1.21% 9.68%
(e) Summative conference and receipt of the summative feedback form 34.27% 34.27% 12.10% 3.23% 4.03% 12.10%
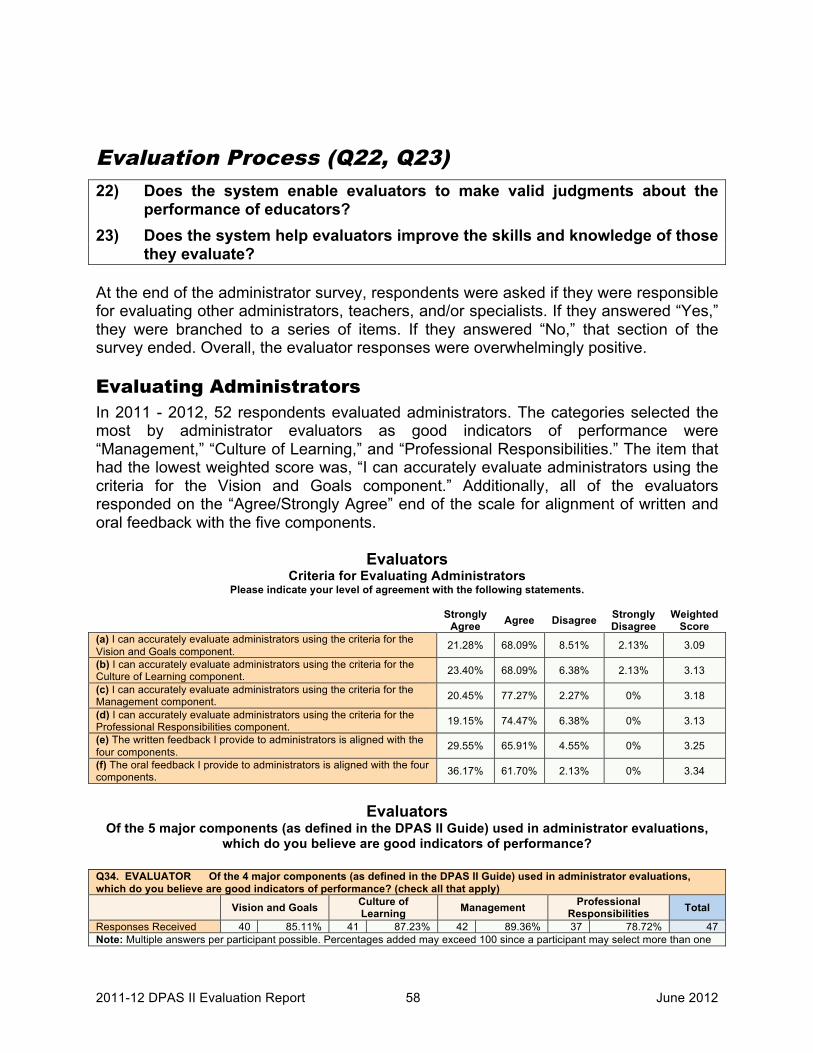
2011-12 DPAS II Evaluation Report 58 June 2012
Evaluation Process (Q22, Q23)
22) Does the system enable evaluators to make valid judgments about the performance of educators?
23) Does the system help evaluators improve the skills and knowledge of those they evaluate?
At the end of the administrator survey, respondents were asked if they were responsible for evaluating other administrators, teachers, and/or specialists. If they answered “Yes,” they were branched to a series of items. If they answered “No,” that section of the survey ended. Overall, the evaluator responses were overwhelmingly positive.
Evaluating Administrators In 2011 - 2012, 52 respondents evaluated administrators. The categories selected the most by administrator evaluators as good indicators of performance were “Management,” “Culture of Learning,” and “Professional Responsibilities.” The item that had the lowest weighted score was, “I can accurately evaluate administrators using the criteria for the Vision and Goals component.” Additionally, all of the evaluators responded on the “Agree/Strongly Agree” end of the scale for alignment of written and oral feedback with the five components.
Evaluators Criteria for Evaluating Administrators
Please indicate your level of agreement with the following statements.
Strongly Agree Agree Disagree Strongly
Disagree Weighted
Score (a) I can accurately evaluate administrators using the criteria for the Vision and Goals component. 21.28% 68.09% 8.51% 2.13% 3.09
(b) I can accurately evaluate administrators using the criteria for the Culture of Learning component. 23.40% 68.09% 6.38% 2.13% 3.13
(c) I can accurately evaluate administrators using the criteria for the Management component. 20.45% 77.27% 2.27% 0% 3.18
(d) I can accurately evaluate administrators using the criteria for the Professional Responsibilities component. 19.15% 74.47% 6.38% 0% 3.13
(e) The written feedback I provide to administrators is aligned with the four components. 29.55% 65.91% 4.55% 0% 3.25
(f) The oral feedback I provide to administrators is aligned with the four components. 36.17% 61.70% 2.13% 0% 3.34
Evaluators
Of the 5 major components (as defined in the DPAS II Guide) used in administrator evaluations, which do you believe are good indicators of performance?
Q34. EVALUATOR Of the 4 major components (as defined in the DPAS II Guide) used in administrator evaluations, which do you believe are good indicators of performance? (check all that apply)
Vision and Goals Culture of Learning Management Professional
Responsibilities Total
Responses Received 40 85.11% 41 87.23% 42 89.36% 37 78.72% 47 Note: Multiple answers per participant possible. Percentages added may exceed 100 since a participant may select more than one

2011-12 DPAS II Evaluation Report 59 June 2012
answer for this question. Evaluators were asked to respond to a series of items that dealt with the system, documentation, data, and feedback mechanisms. The item with the lowest mean score was regarding the forms being easy to complete. Interview information provides some clarity about issues with the forms. It appears that the majority of administrators think the forms are not difficult, but that it takes a long time to complete them and there is redundancy. Similar to 2010-2011, the highest mean score was on administrators being accepting of their feedback. The majority of administrator evaluators indicated that the rubrics, the process, the components, and announced observations have some impact on improving performance. The majority believe that unannounced observations have a major impact on improving performance.
Evaluators Administrator Evaluations (System, Documentation, Data, Feedback)
Please indicate your level of agreement with the following statements.
Strongly Agree Agree Disagree Strongly
Disagree Weighted
Score (a) Administrators are able to provide the evidence and documentation I need to evaluate them accurately. 23.40% 70.21% 6.38% 0% 3.17
(b) The administrator forms are easy to complete. 12.77% 53.19% 34.04% 0% 2.79 (c) Administrators are accepting of their evaluation feedback. 26.09% 73.91% 0% 0% 3.26 (d) The timing of administrator conferences is good. 14.89% 65.96% 19.15% 0% 2.96 (e) The evaluation process provides adequate evidence of administrators' performance. 15.56% 60.00% 17.78% 6.67% 2.84
(f) The evaluation process provides an accurate picture of administrators' performance. 17.02% 55.32% 21.28% 6.38% 2.83
(g) There are adequate resources for administrators to implement improvement plans. 12.77% 63.83% 19.15% 4.26% 2.85
Major
Impact Some Impact
Limited Impact
No Impact
Weighted Score
(a) What level of impact does use of the rubrics have on positive reinforcement? 23.40% 59.57% 12.77% 4.26% 3.02
(b) What level of impact does DPAS II overall have on improving teaching? 27.66% 55.32% 17.02% 0% 3.11
(c) What level of impact does the Vision and Goals component have on improving performance? 21.28% 63.83% 12.77% 2.13% 3.04
(d) What level of impact does the Culture of Learning component have on improving teaching? 27.66% 63.83% 8.51% 0% 3.19
(e) What level of impact does the Management component have on improving teaching? 31.91% 59.57% 8.51% 0% 3.23
(f) What level of impact does the Professional Responsibilities component have on improving teaching? 19.57% 60.87% 19.57% 0% 3
(g) What level of impact do unannounced observations have on improving performance? 53.19% 38.30% 6.38% 2.13% 3.43
(h) What level of impact do announced observations have on improving teaching? 19.57% 69.57% 6.52% 4.35% 3.04
(i) What level of impact does peer observations have on increasing effective conversations about performance? 44.68% 48.94% 2.13% 4.26% 3.34

2011-12 DPAS II Evaluation Report 60 June 2012
Evaluating Teachers There were 211 respondents who evaluated teachers. The majority of teacher evaluators believe the “Planning Preparation,” “Classroom Environment,” and “Instruction” components are good indicators of performance. Fewer than half of teacher evaluators indicated that the “Professional Responsibilities” component was a good indicator. The item with the most respondents on the undesirable end of the scale pertained to professional responsibilities. The items with the highest mean scores were about written and oral feedback being aligned with the 4 components.
Evaluators Criteria for Evaluating Teachers
Please indicate your level of agreement with the following statements.
Strongly Agree Agree Disagree Strongly
Disagree Weighted
Score (a) I can accurately evaluate teachers using the criteria for the Planning and Preparation component. 33.17% 63.41% 2.93% 0.49% 3.29
(b) I can accurately evaluate teachers using the criteria for the Classroom Environment component. 34.31% 62.25% 2.94% 0.49% 3.3
(c) I can accurately evaluate teachers using the criteria for the Instruction component. 37.56% 58.54% 2.93% 0.98% 3.33
(d) I can accurately evaluate teachers using the criteria for the Professional Responsibilities component. 24.14% 59.61% 14.78% 1.48% 3.06
(e) The written feedback I provide to teachers is aligned with the four components. 42.57% 56.44% 0.50% 0.50% 3.41
(f) The oral feedback I provide to teachers is aligned with the four components. 42.36% 56.65% 0.49% 0.49% 3.41
Evaluators
Of the 5 major components (as defined in the DPAS II Guide) used in teacher evaluations, which do you believe are good indicators of performance?
Q39. EVALUATOR Of the 4 major components (as defined in the DPAS II Guide) used in teacher evaluations, which do you believe are good indicators of performance?
Planning and Preparation
Classroom Environment Instruction Professional
Responsibilities Total
Responses Received 178 88.56% 167 83.08% 193 96.02% 94 46.77% 201 Note: Multiple answers per participant possible. Percentages added may exceed 100 since a participant may select more than one answer for this question. Among the teacher evaluators, there were positive responses relating to providing evidence, forms, and feedback. The item with the highest mean score was “Teachers are able to provide the evidence and documentation I need to evaluate them accurately.” The majority believe that walk-throughs and unannounced observations improve performance. Unannounced observations appear to be very valuable, while announced observations are of some value. When asked about the impact on performance, unannounced walk-throughs and unannounced observations had the highest mean scores.

2011-12 DPAS II Evaluation Report 61 June 2012
Evaluators Teacher Evaluations (System, Documentation, Data, Feedback)
Please indicate your level of agreement with the following statements.
Strongly Agree Agree Disagree Strongly
Disagree Weighted
Score (a) Teachers are able to provide the evidence and documentation I need to evaluate them accurately. 22.44% 70.24% 7.32% 0% 3.15
(b) The teacher forms are easy to complete. 13.73% 49.51% 33.82% 2.94% 2.74 (c) Teachers are accepting of their evaluation feedback. 18.93% 75.24% 5.83% 0% 3.13 (d) The timing of teacher conferences is good. 17.48% 73.79% 8.25% 0.49% 3.08 (e) The evaluation process provides adequate evidence of teachers' performance. 13.59% 64.08% 20.39% 1.94% 2.89
(f) The evaluation process provides an accurate picture of teachers' performance. 11.22% 62.93% 23.41% 2.44% 2.83
(g) There are adequate resources for teachers to implement improvement plans. 13.79% 66.01% 15.76% 4.43% 2.89
Strongly
Agree Agree Disagree Strongly Disagree
Weighted Score
(a) I believe that administrator walk-throughs improve teaching more than announced observations. 39.32% 36.41% 23.30% 0.97% 3.14
(b) Unannounced observations by an administrator improve teaching more than walk-throughs. 27.80% 47.80% 21.46% 2.93% 3
(c) Prior to DPAS II, walk-throughs were conducted more frequently during the year. 23.88% 36.82% 35.82% 3.48% 2.81
(d) Walk-throughs should be part of a formative evaluation. 28.16% 43.20% 23.79% 4.85% 2.95 (e) Walk-throughs should be part of a summative evaluation. 28.64% 45.15% 20.87% 5.34% 2.97
Very
Valuable Some Value
Limited Value
Not at all Valuable
Weighted Score
(a) Announced observations 23.41% 54.63% 20.49% 1.46% 3 (b) Unannounced observations 67.80% 28.78% 2.93% 0.49% 3.64 (c) Announced walk-throughs 13.93% 57.71% 22.89% 5.47% 2.8 (d) Unannounced walk-throughs 64.22% 26.47% 7.35% 1.96% 3.53 (e) Peer observations 46.53% 42.57% 8.42% 2.48% 3.33 (f) Use of rubrics 42.08% 49.01% 7.43% 1.49% 3.32 (g) Mentoring 47.76% 46.77% 4.98% 0.50% 3.42 (h) Professional Learning Communities (PLCs) 56.93% 36.14% 5.94% 0.99% 3.49 (i) Data Coaches 23.00% 42.00% 23.50% 11.50% 2.77
Major
Impact Some Impact
Limited Impact
No Impact
Weighted Score
(a) What level of impact does the use of rubrics have on positive reinforcement? 25.73% 55.34% 16.50% 2.43% 3.04
(b) What level of impact does DPAS II overall have on improving teaching? 20.39% 62.62% 16.99% 0% 3.03 (c) What level of impact does the Planning and Preparation component have on improving teaching? 40.10% 49.50% 10.40% 0% 3.3
(d) What level of impact does the Classroom Environment component have on improving teaching? 36.76% 53.43% 9.80% 0% 3.27
(e) What level of impact does the Instruction component have on improving teaching? 46.80% 44.83% 8.37% 0% 3.38
(f) What level of impact does the Professional Responsibilities component have on improving teaching? 17.07% 54.15% 25.37% 3.41% 2.85
(g) What level of impact do unannounced observations have on improving teaching? 48.77% 46.80% 4.43% 0% 3.44
(h) What level of impact do announced observations have on improving teaching? 19.12% 61.76% 17.65% 1.47% 2.99
(i) What level of impact do unannounced walk-throughs have on improving teaching? 51.98% 41.58% 5.45% 0.99% 3.45
(j) What level of impact do announced walk-throughs have on improving teaching? 13.30% 61.58% 20.20% 4.93% 2.83
(k) What level of impact does peer observations have on increasing effective conversations about teaching? 40.70% 48.24% 10.05% 1.01% 3.29

2011-12 DPAS II Evaluation Report 62 June 2012
Evaluating Specialists There were 169 respondents who evaluate specialists. Among specialist evaluators, the “Professional Responsibilities” component was the least selected component for being a good indicator of performance. Evaluators of specialists responded positively to the items relating to the evaluation criteria. The items with the most desirable responses were regarding written and oral feedback being aligned with the five components.”
Evaluators Criteria for Evaluating Specialists
Please indicate your level of agreement with the following statements.
Strongly Agree Agree Disagree Strongly
Disagree Weighted
Score (a) I can accurately evaluate specialists using the criteria for the Planning and Preparation component. 16.77% 56.89% 20.96% 5.39% 2.85
(b) I can accurately evaluate specialists using the Professional Practice and Delivery of Service component. 22.29% 57.83% 14.46% 5.42% 2.97
(c) I can accurately evaluate specialists using the criteria for the Professional Collaboration and Consultation component. 21.82% 55.76% 16.36% 6.06% 2.93
(d) I can accurately evaluate specialists using the criteria for the Professional Responsibilities component. 16.77% 61.68% 17.37% 4.19% 2.91
(e) The written feedback I provide to specialists is aligned with the four components. 27.11% 65.66% 4.22% 3.01% 3.17
(f) The oral feedback I provide to specialists is aligned with the four components. 27.44% 66.46% 3.05% 3.05% 3.18
Evaluating Specialists
Of the 5 major components (as defined in the DPAS II Guide) used in specialist evaluations, which do you believe are good indicators of performance?
Q46. EVALUATOR Of the 4 major components (as defined in the DPAS II Guide) used in specialist evaluation, which do you believe are good indicators of performance?
Planning and Preparation
Professional Practice and Delivery of
Service
Professional Collaboration and
Consultation
Professional Responsibilities Total
Responses Received 118 73.29% 153 95.03% 133 82.61% 89 55.28% 161
Note: Multiple answers per participant possible. Percentages added may exceed 100 since a participant may select more than one answer for this question.
Similar to the responses from evaluators of teachers and administrators, the evaluators of specialists responded positively to the item, “Specialists are accepting of their evaluation feedback.” The item that received the least support among the system, documentation, data, and feedback construct was, “The specialist forms are easy to complete.”

2011-12 DPAS II Evaluation Report 63 June 2012
Evaluators Specialists Evaluations (System, Documentation, Data, Feedback)
Please indicate your level of agreement with the following statements.
Strongly Agree Agree Disagree Strongly
Disagree Weighted
Score (a) Specialists are able to provide the evidence of documentation I need to evaluate them accurately.
15.15% 66.06% 15.15% 3.64% 2.93
(b) The specialist forms are easy to complete. 11.45% 44.58% 36.75% 7.23% 2.6 (c) Specialists are accepting of their evaluation feedback. 19.75% 74.07% 3.09% 3.09% 3.1
(d) The timing of specialist conferences is good. 15.66% 73.49% 7.83% 3.01% 3.02
(e) The evaluation process provides adequate evidence of specialists' performance. 13.25% 57.83% 24.70% 4.22% 2.8
(f) The evaluation process provides an accurate picture of specialists' performance. 12.73% 53.33% 28.48% 5.45% 2.73
(g) There are adequate resources for specialists to implement improvement plans. 13.04% 55.28% 22.98% 8.70% 2.73