delayed enrollment and college plans: is there a...
TRANSCRIPT

Delayed Enrollment and College Plans:
Is there a Postponement Penalty?
Sunny X. Niu
The College Board
Marta Tienda
Princeton University
July 15, 2011
This research was supported by grants from the Ford, Mellon and Hewlett Foundations and NSF
(GRANT # SES-0350990). We gratefully acknowledge institutional support from Princeton
University's Office of Population Research (NICHD Grant # R24 H0047879), and constructive
comments from Dawn Koffman and three reviewers.
Delayed Enrollment and College Plans:
Is there a Postponement Penalty?
Abstract:
Using a representative longitudinal survey of Texas high school seniors who graduated in 2002, we investigate how college postponement is associated with four-year college expectations and attendance, focusing both on the length of delay and the pathway to the
postsecondary system. Like prior studies, we show that family background and student academic achievement explains the negative association between delay and college expectations, and these factors, along with two-year college entry pathway, largely account for the negative association between postponement and enrollment at a four-year
institution in 2006. Although delays of one year or longer are associated with significantly lower odds of attending a baccalaureate-granting institution four years after high school, the longest delays do not incur the most severe enrollment penalties.

1
Delayed Enrollment and College Plans:
Is there a Postponement Penalty?
Introduction
Most students who aspire to a postsecondary degree enroll in college the fall
semester following their graduation from high school; however, growing numbers of
college-bound high school graduates are choosing to delay college enrollment. Horn,
Cataldi and Sikora (2005) report that nearly one-third of 1995-96 college freshmen
delayed their college entry, but in the 1999-2000 school year, about 46 percent of all
undergraduates experienced a hiatus between their high school completion and
postsecondary enrollment (Barton, 2002). Nevertheless, relatively few studies examine
the correlates and consequences of delayed enrollment; their general consensus is that six
to eight years after high school graduation, degree attainment is substantially lower for
students who delayed college entry compared with on-time enrollees (Carroll, 1989;
Hearn; 1992; Bozick and DeLuca, 2005; Rowan-Kenyon, 2007).
Delayed enrollment need not undermine pursuit of baccalaureate degrees if the
hiatus from academic work allows students to mature, to acquire work experience, and to
accumulate resources for college. Postponement can be problematic, however, if the
hiatus is long; if postponement increases the likelihood of beginning college in a two-
year rather than a baccalaureate-granting institution; and if time away from academic
activities lowers college expectations—all circumstances that are associated with failure
to receive a bachelor’s degree. Existing studies use inconsistent measures to represent
delay, but they concur about the socio-demographic and academic profile of students who
postpone college entry. Only two studies consider how the length of postponement
2
influences students’ enrollment at a four-year postsecondary institution (Bozick and
DeLuca, 2005; Rowan-Kenyon, 2007), although their measurements are questionable for
reasons elaborated below. Except for the tendency for delayed enrollees to enter the
postsecondary system through two-year colleges, evidence about the mechanisms through
which delay influences pursuit of baccalaureate degrees is limited.
Accordingly, we exploit a rich longitudinal survey of Texas high school seniors to
address two limitations of prior studies about delay, namely how educational expectations
and length of postponement are associated with actualization of college plans. To
broaden the external validity of our analysis, we compare Texas delay patterns with those
based on national surveys. Although a four-year post-high school window precludes an
analysis of degree completion, we examine two outcomes—one cognitive and one
behavioral—that are highly predictive of degree attainment, namely college expectations
and matriculation at a baccalaureate-granting institution four years after high school
graduation (Messersmith and Schulenberg, 2008).
Consistent with prior studies, we find that family background and student
academic achievement fully explains the negative association between delayed
enrollment and educational expectations; moreover, these family and student attributes,
along with two-year college entry pathway, largely account for the negative association
between postponement and enrollment at a baccalaureate-granting institution four years
after high school graduation. The relationship between the length of delay and students’
college attendance is not linear, however , which we speculate is related to unobserved
attributes that measure students determination to actualize their college plans.
3
Background
Early studies of college decision-making acknowledged the sequential character
of the process and its grounding in post-secondary aspirations (Fuller, et al. , 1982;
Behrman, et al., 1998). Hossler and associates (1999) proposed three general stages to
represent the sequential decisions leading to college enrollment, namely: (1) the
predisposition to attend college; (2) the search for a choice set; and (3) matriculation.
During the search stage, students test their aspirations against options based on their
calculated probability of admission (Fuller, et al., 1982; Manski and Wise, 1983) and
adjust application behavior accordingly. Submission of applications concludes the search
process, but the onset and evolution of the predisposition stage is less clearly defined
because expectations continue to evolve as students reconcile aspirations and
predispositions with actual experiences (Kao and Tienda, 1998; DesJardins, et al. , 1999;
Messersmith and Schulenberg, 2008), and because some students delay their initial
enrollment in a postsecondary institution for academic, financial and other personal
reasons. If time spent away from school erodes college expectations, then pursuit of a
college degree will be lower for delayers compared with on-time enrollees of comparable
achievements.
Of the studies that have evaluated the correlates of college delay, Hearn (1992)
confirmed that students with high educational aspirations were less likely to delay college
enrollment and to attend part-time. His aspirations measure is based on a question that
asked respondents to indicate the lowest level of education with which they would be
satisfied, which Hearn claims is preferable to the more conventional measures that
portray students’ ―unbounded idealism.‖ It is difficult to interpret his results substantively

4
because the ordinal measure of aspirations is modeled as an interval scale. Hearn claims
that similar findings obtain for educational expectations, but these are not reported (see
fn. 9). Neither Rowan-Kenyon (2007) nor Bozick and DeLuca (2005) examine the
association between college expectations and delay, either to establish whether college
plans change or as a mediator of enrollment behavior.
Postsecondary expectations link the first and third stages of the college decision
process described by Hossler and associates (1999), and as such, are important to
consider when evaluating the consequences of postponement. Although aspirations and
expectations are often used interchangeably, there is ample evidence that they are
conceptually different (Kao and Tienda, 1998). The advantage of expectations over
aspirations measures is that they include assessments of how difficult as well as how
realistic is the stated educational goal. Expectations, unlike aspirations, represent ―plans
in action‖ (Messersmith and Schulenberg, 2008). For example, students who report that
they expect a college degree tend to pursue a college curriculum; to take college entrance
exams; and to excel in high school.
Educational expectations not only are strong predictors of postsecondary
enrollment, but also are relatively stable over time; nevertheless, college plans can and do
change. Messersmith and Schulenberg (2008) show, for example, that low-income
students, and particularly those from lone-parent families, from minority backgrounds,
and who reside in rural areas often fall short of realizing their expectations. However,
they did not examine the timing of enrollment as a mechanism through which youth
become derailed from their expected pathway, nor did they consider whether the type of
institution initially attended lowered students’ college attainments relative to their

5
reported expectations.1 Whether postsecondary expectations remain stable among
students who delay college enrollment, however, is an empirical question that has not yet
been addressed.
Three key studies that examine the prevalence of college delay and its evolution
over time are based on nationally representative samples of high school seniors and
largely corroborate several key findings.2 For the high school class of 1972 (NLS-72),
Eckland and Henderson (1981) show that compared with students who do not postpone
college enrollment, delayed enrollees disproportionately hail from lower socioeconomic
backgrounds, have lower academic credentials, and are more likely to enter the
postsecondary system at two-year institutions. For the 1980 senior class, Hearn (1992)
shows that delayed enrollment is associated with socioeconomic constraints and
academic marginality. Bozick and DeLuca’s (2005) analysis of college-going behavior
for the 1992 senior class reveals that delay is more prevalent in the south and that
students who postpone enrollment are less likely to attend four-year institutions
compared with on-time enrollees. Owing to formidable changes in both the volume and
the composition of high school graduates since 1992, Rowan-Kenyon (2007) concludes
her analysis of delay with a call for analyses using more recent data.3
Despite agreement about two core determinants of delayed enrollment, namely
family socioeconomic status and college readiness, existing studies differ in the window
of time used to assess postponement behavior and the criteria used to define delay. In
1 They did examine students aspirations to attend a two-year college, but aspirations are much weaker
predictions of actual behavior than expectations (Kao and Tienda, 1998) 2Bozick and Deluca provide an excellent review of studies that use a variety of samples to investigate the
correlates of delay, showing that the majority support findings from national studies . 3 The (ELS) tracks the 2004 cohort of high school seniors, but the most recent wave of data collection was
obtained in 2006, just two years after high school graduation. Rowan-Kenyon argues (and we agree) that this period is too short for evaluating postponement behavior. The next ELS follow-up, planned for 2012,
will likely not be available until 2014.
6
particular, there is very limited evidence about how the likelihood of enrollment in a
baccalaureate-granting institution changes with the length of postponement. Eckland and
Henderson (1981) classify students who enroll in the same year they graduated from high
school as on-time enrollees; students who postpone college by one-semester are
designated delayed enrollees. Hearn (1992) considers students who begin college within
one year of high school graduation as on-time enrollees, but Bozick and DeLuca (2005)
classify students who matriculate within seven months of high school graduation as on-
time enrollees. Horn, Cataldi and Sikora (2005) classify students who matriculate one-
semester after high school graduation as on-time enrollees. Using data for a 1995-96
cohort of college freshmen, they examine the correlates of the length of delay, which in
their study ranges from 1 year to 10 or more years. Despite the longer observation
window, Horn and associates’ assessment of the length of delay conflates period and
cohort differences in college enrollment behavior because their analysis is based on a
sample of enrolled college freshmen that includes multiple cohorts of high school senior
cohorts.
Bozick and DeLuca’s (2005) study, which measures postponement in months,
uses the highest level of measurement precision, but assumes a linear association between
delay and eventual enrollment. This assumption may overstate the association between
length of delay and college attendance for two reasons. First, degree-seeking students
cannot enroll in a college in any month; rather, enrollment occurs on the basis of
semesters or quarters, which requires categorical measurement. Second, there is reason to
believe that a semester delay is qualitatively different from a hiatus that lasts a full year
or longer. Single semester postponement allows students to attend classes with members
7
of their high school cohort, but longer delays do not. Furthermore, students who delay
two or more years may differ in systematic ways from those who postpone enrollment for
a single year. On the one hand, students who prolong delay are at higher risk of
experiencing life course events, such as marriage and childbirth, which lower the
likelihood of enrolling at a four-year institution. On the other hand, these delayers may be
highly motivated to succeed and thus differ from typical delayers in attributes not
measured by observable characteristics that are related to college attendance. That is,
their postponement may reflect practical considerations, such as the need to accumulate
savings in order to attend a four-year institution.
Using a recent high school senior cohort from Texas, we expand on prior research
by examining how the length of college postponement is associated with postsecondary
expectations and attendance at a baccalaureate-granting institution four years post high
school graduation. Stated as questions, we ask: First, how is the length of postponement
associated with college expectations? Second is the timing of college enrollment
consequential for the likelihood of enrollment at a baccalaureate-granting institution
during the observation window? Finally, to what extent are the observed differences in
four-year college enrollment among delayed versus on-time enrollees due to systematic
variation in family background, academic achieve ment and the two- versus four-year
pathway to the postsecondary system?
Our data are based on a high school cohort for a single state rather than a national
survey; therefore we address external validity of our findings by documenting a high
similarity in the incidence of delay between the Texas senior cohort analyzed and several
nationally representative cohort studies. An advantage of focusing on a single state is that

8
there is less variation in tuition costs across states, which Kane (1996) argues is a crucial
determinant of the two- and four-year initial enrollment options across states. Two-year
institutions have grown rapidly in Texas, and since the mid-1990s, the statewide share of
postsecondary enrollment engaged in two-year colleges surpassed that of four-year
institutions (Tienda and Sullivan, 2009). This development can potentially influence
students’ pursuit of baccalaureate degrees by increasing the number of students that begin
their postsecondary training at community colleges and thus incur transfer hurdles.
.
Data and Analytical Strategy
The empirical analyses use the longitudinal survey data collected under the
auspices of the Texas Higher Education Opportunity Project (THEOP). In spring 2002, a
representative sample of Texas public high school seniors was surveyed (Wave 1); a
random sub-sample of the senior cohort was re-interviewed the following spring (Wave
2) and again four years after high school graduation (Wave 3). The baseline survey
obtained basic demographic, socioeconomic and standard tracking information as well as
information about high school performance, experience and college plans. The first
follow-up survey (Wave 2) recorded whether respondents actually enrolled in college one
year after high school graduation, and if so, when and where. Wave 3 interviews solicited
information about students’ educational pursuits and college attainment.
Using a two-stage stratified sampling design, 13,803 seniors were interviewed
using a paper and pencil in-class survey instrument in the baseline. For cost reasons a
9
random sub-sample of 8,345 seniors were selected for follow-up surveys.4 The response
rate for Wave 2 interviews was 70 percent, generating 5,836 completed surveys. With
weights, the Wave 2 sample represents the baseline population.
Due to the difficulty in locating respondents, Wave 3 field interviews lasted over
a year, from January 2006 to March 2007; and 12 percent (485 out of 4114) of Wave 3
respondents were interviewed after August 2006 – four years after respondents’ high
school graduation. The Wave 3 response rate of 50 percent yielded 4,114 cases; wave 3
sample weights were developed to adjust the sample to the original population. Although
the 50 percent response rate for Wave 3 survey raises questions about the
representativeness of the sample, comparisons between the 8,345 random subsample of
the baseline and the 4,114 Wave 3 respondents show a high degree of similarity based on
ethno-racial composition and post-high school intentions. 5
Delayed Enrollment Status
College enrollment status was ascertained in both the second and third wave
interviews. We used IPEDS codes to determine and append institutional characteristics,
including types of degrees offered (e.g., technical/vocational, associate, or baccalaureate).
Texas 2002 high school graduates who matriculated at a post-secondary institution before
the end of 2002 are designated as on-time enrollees; those who had not enrolled in any
post-secondary institution by 2006-7, four years after high school graduation are non-
4 To guarantee the maximum possible precision for blacks and Asians, all baseline respondents from these
groups were included in the longitudinal samples; proportionate samples of Hispanics and non-Hispanic whites were randomly drawn for the sample balance. 5 Tables comparing respondent attributes across waves are in the methods reports. The sampling scheme for
the baseline is described in detail in the ―Methodology Report,‖ http://theop.princeton.edu/surveys/baseline/baseline_methods_pu.pdf. For wave 2 surveys, the sampling
scheme is described in ―Senior Wave 2 Survey Methodology Report,’ http://theop.princeton.edu/surveys/senior_w2/senior_w2_methods_pu.pdf. Finally, the wave 3 sampling scheme is described in ―Senior Wave 3 Survey Methodology Report,’
http://theop.princeton.edu/surveys/senior_w3/senior_w3_methods_pu.pdf.

10
enrollees. All other enrollees are classified as delayed enrollees. Based on the timing of
enrollment, we classify students into one of five enrollment status categories :
On-time (enroll by December, 2002);
One-semester delay (enroll January 2003 - May 2003);
One-year delay (enroll June 2003 – December 2003);
Two-year delay (enroll in 2004);
Three/four-year delay (enrolled in 2005 or 2006).
College Expectations and Four-Year College Attendance
Because the duration of the longitudinal survey spans only four years, it is not
possible to examine college completion rates, which are generally assessed after six
years. In fact, there is evidence that the length of time to college degrees has increased
(Adelman, 2004; Wirt, et. al., 2004). Therefore, we analyze two correlates of college
degree attainment that are influenced by the timing of postsecondary enrollment, namely
(1) college expectations at Wave 3 and (2) enrollment status at a baccalaureate-granting
institution four years post high school graduation (at Wave 3).
Students were asked about their college plans in all three waves. The baseline
survey queried students about their postsecondary expectations by asking: ―Realistically
speaking, how far do you think you will go in school?‖6 One year after high school
graduation, when students were re-interviewed at wave 2, they were asked, ―What is the
highest level of education you ever expect to complete?‖ These items are comparable to
those used in national surveys to distinguish between aspirations and expectations (Kao
and Tienda, 1998). In the Wave 3 survey, which occurred four years after students
graduated from high school, respondents were asked, ―What is the highest level of
6 Students were also asked about their aspirations at baseline, but both for consistency in measurement
across waves and because expectations are reality-checked versions of aspirations, we restrict our analysis
to expectations.

11
education you think you will have completed at age 30?‖ From these questions, we
construct three indicator variables to measure college expectations at each point in time.
Specifically, respondents who indicated they expected a baccalaureate degree or higher at
each interview are coded one, and other responses are coded zero.7
We constructed two college attendance variables: enrollment at a baccalaureate-
granting institution four years after high school graduation (1 = yes; 0 otherwise), and
type of postsecondary institution initially attended (two-year, vocational/technical or
four-year institution). Enrollment status at Wave 3 is the second outcome variable of
interest, and initial enrollment status measures college entry pathway.8 The appendix
table summarizes the operational definitions of all measures analyzed.
Descriptive Results9
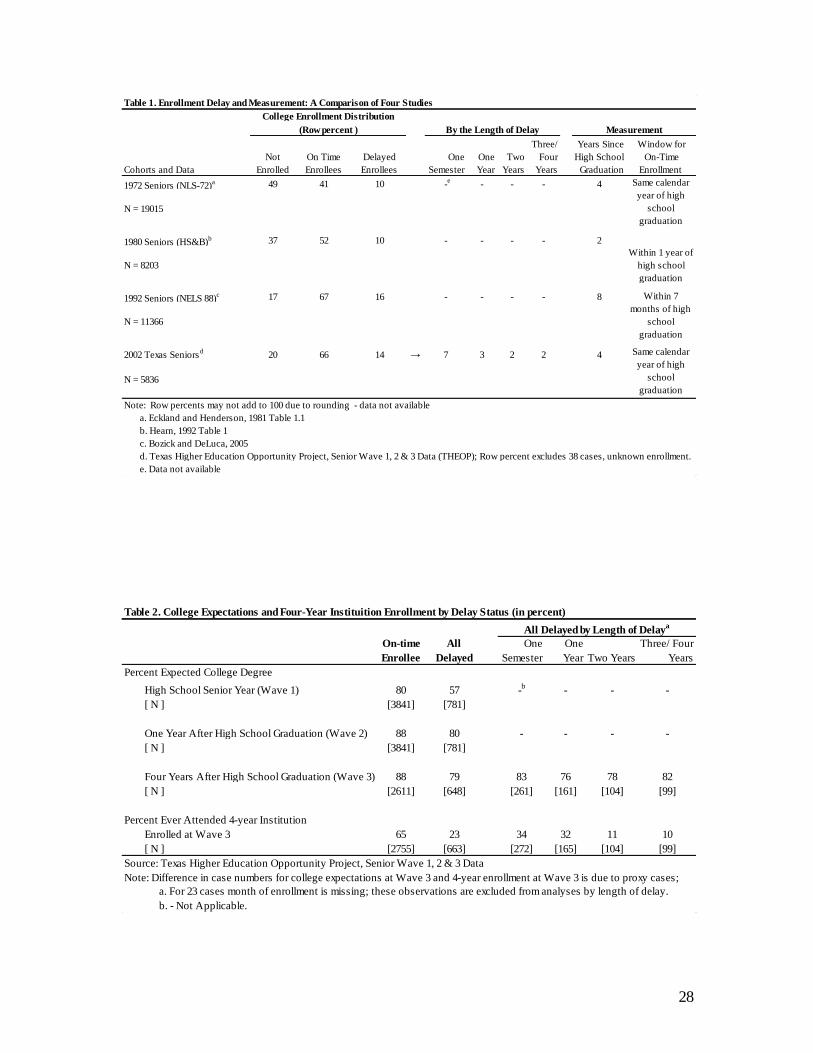
Table 1 reports college enrollment outcomes of the Texas high school senior class
of 2002 and compares their enrollment distribution with that of three national studies
based on cohorts of high school seniors for the last three decades of the 20th
century.
These studies use different periods and metrics to measure delay, yet there is a clear trend
toward greater participation in the postsecondary education system. Just over half of the
1972 senior class enrolled in college four years after high school (Eckland and
7 Education expectations at age of 30 is not available for the 469 respondents whose interview was
conducted by a proxy respondent in Wave 3, but we do not find that proxy status is correlated with
individual characteristics and SES status. Proxy respondents can answer factual questions, such as enrollment status, but not attitudinal questions. 8 Only a handful of observations lack information about the type of institution initially attended; we omit
these cases from descriptive analyses and constructed flags to represent these cases in multivariate analyses. 9 We apply Wave 2 weights for descriptive analyses based on wave 1 and wave 2 college expectations in
order to take advantage of the larger sample size. Descriptive results are virtually identical whether Wave 2 or Wave 3 weights are used. These results are available upon request. We apply Wave 3 weights for descriptive and multivariate analyses on college expectations and attendance based on the 2006 interview.
12
Henderson, 1981), and over 80 percent of the 1992 high school class had enrolled in a
postsecondary institution eight years after high school graduation (Bozick and DeLuca,
2005). A decade later, 80 percent of the Texas high school class of 2002 had enrolled in a
postsecondary institution within four years of receiving their diplomas, and nearly two-
thirds did so without delay.
Table 1 About Here
Given differences in the definition of on-time enrollment and the time metric to
observe enrollment behavior, it is difficult to draw firm inferences about changes in the
prevalence of delay based on the national studies. Nevertheless, the comparisons provide
assurance that the behavior of the Texas high school senior cohort is reasonably similar to
that of the most recent national cohort of students.
Using a rather conservative measure of delay over an eight-year observation
period, Bozick and DeLuca (2005) show that 16 percent of the 1992 senior class
postponed their college enrollment more than one semester. With a four-year observation
window, we show that 14 percent of Texas high school graduates delayed postsecondary
enrollment at least one semester. These estimates are remarkably consistent given the
differences in observation windows, which reflects the declining probability of
enrollment over longer durations. For the Texas cohort we also present the distribution of
delay by duration, which shows that half of the students classified as delayed enrollees
postponed college by only one semester (which Bozick and Deluca designated ―on-
time‖); the rest delayed enrollment between three and four years (the maximum time
observed in the survey).
13
Table 2 presents college expectations and enrollment status according to delay
status for the Texas high school class of 2002. Compared with on-time enrollees, lower
shares of students who delayed enrollment reported that they expected to complete at
least a bachelor degree during their senior year of high school—57 versus 80 percent,
respectively. That expectations rose for both groups the following year likely reflects
students’ realignment of their plans with a reassessment of realistic possibilities. The rise
in college expectations was particularly pronounced for students who postponed
enrollment, among whom four in five reported that they expected to complete a college
degree. Even after goal realignment, eight percent more on-time enrollees expected to
complete a bachelor degree or higher compared with delayers.
Once crystallized, educational expectations tend to remain stable (Messersmith
and Schulenberg, 2008), although differentials between on-time and delayed enrollees
persist. Moreover, postsecondary expectations differ according to the length of
postponement, but not in a monotonic way. Over 80 percent of students who postpone
college enrollment either one semester or over three years reported that they expected a
college degree, compared with only 76 to 78 percent of students who postponed one or
two years, respectively. This pattern implies a nonlinear association between delay and
expectations, but the small differences likely reflect systematic variations in
characteristics that are associated with college plans, which we investigate below.
Table 2 About Here
Although crystallized educational expectations are reliable predictors of actual
enrollment, postponement thwarts the prospect of enrollment at a baccalaureate-granting
institution. About 65 percent of on-time enrollees were enrolled at a four-year institution
14
in 2006 compared with only 23 percent of students who delayed their college plans.
Furthermore, students’ enrollment status at a baccalaureate-granting institution differs
according to the length of postponement, but not in a monotonic fashion. Approximately
one-third of students who delayed their college plans by one semester or one year were
enrolled at baccalaureate-granting institution in 2006 compared with only 10 percent of
students who postponed two or more years. It appears that one year is a key
postponement threshold such that students delay longer are substantially less likely to
pursue their baccalaureate degree ambitions.
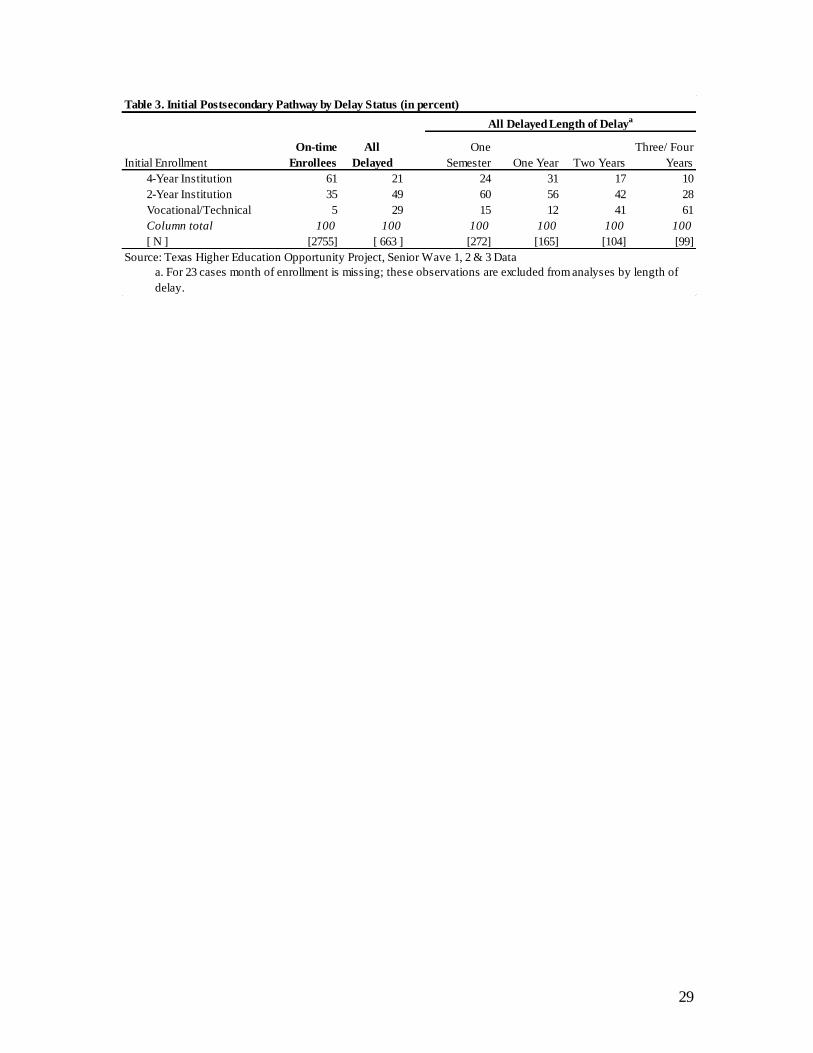
Prior national studies find that delayed enrollees are more likely than on-time
enrollees to start their college career at community colleges (Eckland and Henderson,
1981; Bozick and DeLuca, 2005), which is consequential for the prospects of completing
a four-year degree because large numbers of students who enter the postsecondary system
at two-year institutions do not successfully transfer to a baccalaureate-granting institution
(Brint and Karabel, 1989; Grubb, 1991; Dougherty, 1994). As shown in Table 3,
compared to on-time enrollees, higher shares of Texas students who delay college plans
begin their careers at two-year institutions. Nearly two-thirds of on-time enrollees entered
the postsecondary system at a four-year institution, compared with only 20 percent of
students who delayed enrollment. In fact, roughly half of students who postponed their
college plans first enrolled at a community college and an additional 30 percent
matriculated in a vocational or technical institution, compared with 35 and five percent,
respectively, of on-time enrollees.
Table 3 About Here
15
The right panel of Table 3 shows how students’ pathway to the postsecondary
system depends on the length of delay. Among students who postponed their college
careers by one semester or by a year, between 56 and 60 percent entered through the
community college system and an additional 12 to 15 percent first enrolled at a
vocational or technical institution. The two-year and vocational pathways are much more
prevalent among students who postpone for longer periods, however. Community
colleges serve as the postsecondary gateway for 42 and 28 percent, respectively, of
students who postpone enrollment by two years or by three or four years. The vocational
pathway to the post-secondary education system is highest among students who deferred
college plans for three or more years.
Combined, Tables 2 and 3 provide evidence that students’ success in actualizing
college plans depends not only on the length of delay, but also how delay influences their
enrollment pathway (i.e., via a two- or four-year institution) and determination to
actualize college goals. Whether the nonlinear associations between delay and college
plans are due to other factors that are systematically related both to the likelihood of
postponement and its duration, as well as the pathway to the postsecondary system is an
empirical question that requires multivariate methods, to which we now turn.
Multivariate Analysis
We estimate probit models to assess the association between postponement and
both postsecondary expectations and attendance at a baccalaureate-granting institution in
2006. Formally,
Y = + Delayed + γZ + ε (1)

16
Y = + 1(one semester) + 2(one year) + 3(two years)
+ 4(three/four years) + γZ + ε (1a)
where in model 1, delayed is a binary variable that indexes delayed enrollment status and
in model 1a, the length of delay is explicitly specified. Z is vector of covariates that
influence college expectations and enrollment outcomes, including students demographic
characteristics (race/ethnicity), academic performance (dummy variables indicating top
and second decile class rank; standardized test scores), college predisposition
(dichotomous variables indicating whether respondents took college entrance exams and
AP courses; when they first thought about going to college; and reporting college
expectations during high school senior year); and socioeconomic background
(represented by dummy variables for parents’ education and home ownership status) as
well as the college orientation of the high school (indexed by the socioeconomic
composition of their high schools as well as having four or more close friends who
planned to attend college). The appendix table summarizes the operational description of
all covariates.
Because delayed enrollees are more likely than on-time enrollees initially to
matriculate at community colleges (Eckland and Henderson, 1981; Bozick and DeLuca,
2005), we also estimate whether the institutional pathway to postsecondary schooling
drives the association between length of delay and the likelihood of attending a
baccalaureate-granting institution (at Wave 3). To estimate whether initial enrollment in
a two-year college influences the chances of attending a degree-granting institution at the
17
end of the observation period, we expand model (1) by considering college entry
pathway. Formally,
Y = + Delayed + γZ + Pathway + ε (2)
Y = + 1(one semester) + 2(one year) + 3(two years)
+ 4(three/four years) + γZ + Pathway + ε (2a)
where ―pathway‖ is a set of dummy variables denoting the type of institution initially
attended (four-year; two year; or vocational/technical).10
For each specification we
estimate a baseline with no covariates and a second model that includes the full set of
covariates.
Statistical Results
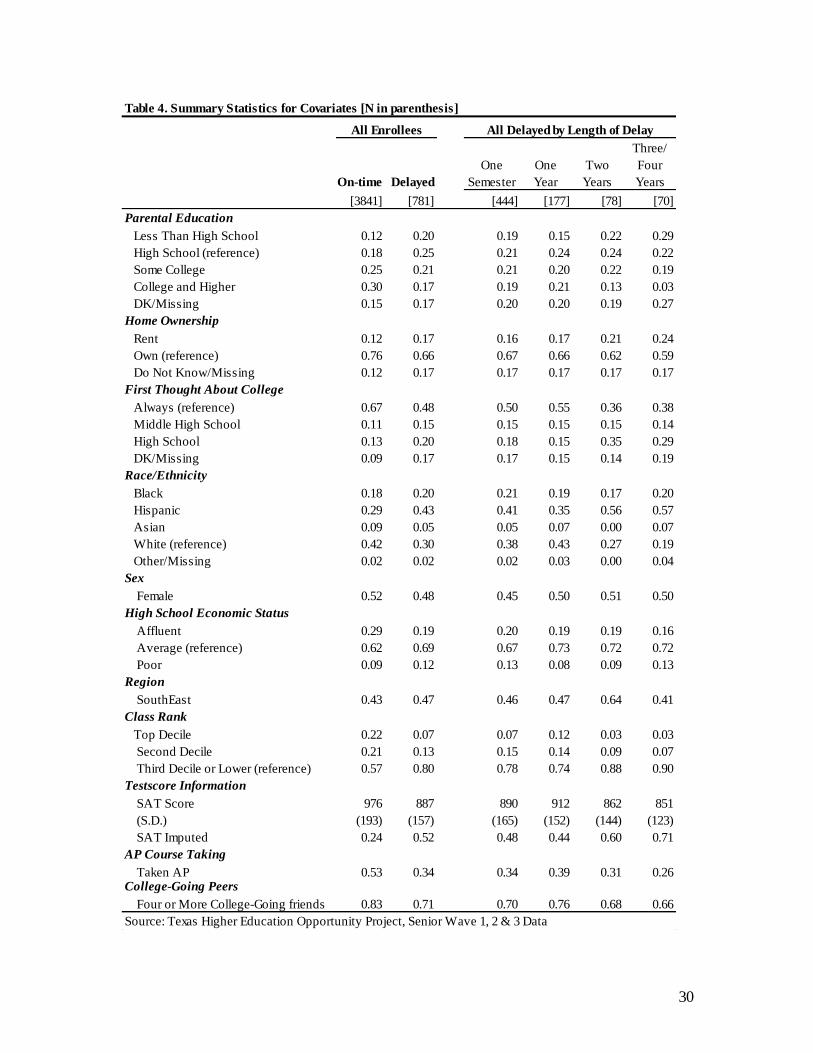
Table 4 reports summary statistics of the covariates used in the multivariate
analysis for the sample of students who ever enrolled in a postsecondary institution
during the observation window. Consistent with findings based on nationally
representative samples of high school graduates, delayed enrollees from the Texas class
of 2002 are weaker academically and average lower socioeconomic status than their
classmates who enrolled immediately after high school. Higher shares of students who
postpone their college plans for a semester or longer have parents with less than a high
school education and exhibit weaker college dispositions than on-time enrollees. Slightly
more men than women postpone enrollment by a semester or more, and Hispanics have
higher rates of delay than both white and Asian students. Compared with students who
delay, higher shares of on-time enrollees graduated from an affluent high school, rank in
the top 20 percent of their high school class, completed one or more AP courses, and
10
We also estimated a model where delayed status is allowed to interact with pathway. Because the
interaction terms do not consistently achieve statistical significance, we present the additive specification.
18
report having multiple college-bound friends. Furthermore, lower shares of delayed
enrollees took a college entrance exam during their senior year compared with on-time
enrollees, which signals lower expectations during high school, and they averaged about
90 fewer points on the SAT.11
Table 4 About Here
Consistent with prior research, Texas students who postpone college enrollment
are more disadvantaged economically and average lower academic achievement than on-
time enrollees, but there is also considerable socioeconomic and academic differentiation
among students who delay. Consistent with the enrollment differentials by length of
delay reported in Table 2, students who delay one semester or one year are more similar
to each other than either group is to students who postpone two or more years. Still,
among students who delay enrollment, those who postpone by one year are the most
advantaged based on family background and academic achievement, and those who
postpone by three to four years are the most disadvantaged. For example, 41 percent had
college-educated parents, compared with one-third of students who delayed two and three
or more years. One-year delayers averaged SAT scores of 912, compared with 890 for
those who postponed by one-semester. By comparison, students who delayed three to
four years barely topped 850 points on the SAT examination. Among students who
postponed postsecondary enrollment, those who delayed by one year also surpassed all
others in their AP course completion, which is a strong predictor of college intentions.
11
We converted ACT scores to their SAT equivalent, if available or predict missing SAT scores using
students’ decile class rank, high school curriculum, most recent math and English grades, whether they have taken English and math AP courses, whether languages other than English are spoken at home,
gender, race/ethnicity, college disposition, parental education, home ownership, high school types, and several high school attributes obtained from Texas Education Agency reports, including percent enrolled in grades 11 to 12 taking AP courses, percent AP exams passed, percent students passed an algebra test,
percent with college plans, and high school dropout rate.
19
Table 5 presents estimates for the baseline association between delayed
enrollment and degree expectations four years after high school graduation using two
measures of postponement. The left panel reports marginal effects on college
expectations using the binary measure of delay and the right panel disaggregates delay by
duration. Compared with on-time enrollees, students who delay are eight percentage
points less likely to report that they expect to complete a bachelors degree or higher. This
difference in educational expectations is due entirely to systematic variation in family
background, college orientation, and academic achievement. Consistent with claims that
expectations are relatively stable once crystalized, the association between baccalaureate
degree expectation at Wave 1 and Wave 3 is strong and positive; moreover, the point
estimate is unaltered by the operational measurement of delay (column 2 and 2a).
Table 5 About Here
The baseline model for the association between educational expectations and the
length of delay affirms the nonlinear association reported in Table 2. Four years after
high school graduation, students who delayed postsecondary enrollment by one semester
are five percentage points less likely to report that they expect to complete a bachelors
degree or higher and those who postpone college by a year are 10 percentage points less
likely to expect to do so. These differences largely reflect systematic variation in family
background and academic accomplishments.
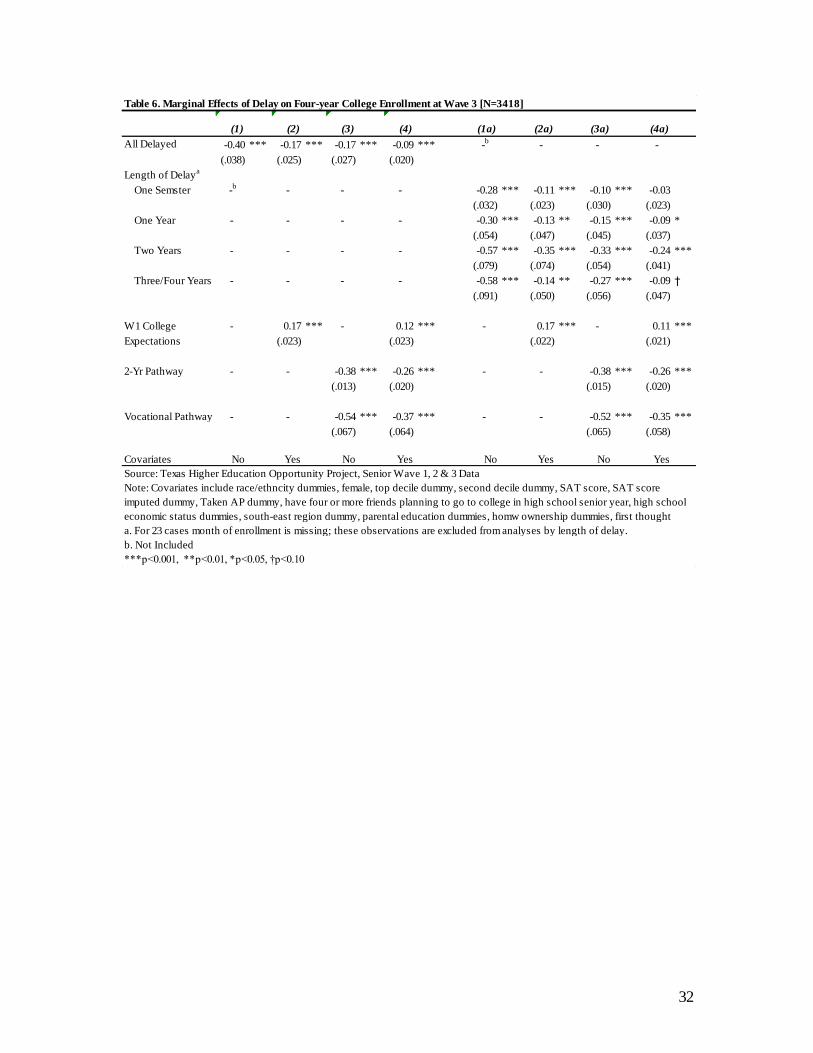
Table 6 evaluates the association between delay and attendance at a
baccalaureate-granting institution and sequentially considers potentially mediating
mechanisms. The left panel reports the average marginal effects of delayed enrollment on
baccalaureate-granting institution attendance status in 2006. Point estimates for the
20
baseline model indicate that seniors who postpone college enrollment by any amount are
40 percentage points less likely to be enrolled at a baccalaureate-granting institution in
2006 compared with their classmates who enrolled on time. Column 2 reports estimates
from the model that includes measures of family background and students’ academic
achievement (estimates not shown) as well as Wave 1 college expectations. These
covariates account for just over half of the delayers’ lower likelihood of attending a
baccalaureate-granting institution four years post high school graduation (compare
columns 1 and 2). The association partly works through college entry pathway as the
point estimate drops to 12 percentage points when entry pathway is modeled (column 4).
Notably, the estimates are robust to alternative specifications of delay (columns 2 and 2a,
columns 4 and 4a). High school seniors who reported college expectations were 11 to 12
percentage points more likely to attend a baccalaureate-granting institution in 2006
compared with statistically comparable classmates with lower educational expectations.
Table 6 About Here
The results in columns (3) and (4) reveal that the four-year college enrollment
penalties associated with delay also derive from students’ postsecondary entry pathway.
Nearly three-quarters of the enrollment penalty associated with delay reflects student
differences in family background, academic achievement and college entry pathway.
Both because they incur a transfer hurdle and because they differ systematically in
characteristics that predict four-year college attendance, students who begin their
postsecondary careers in community colleges or vocational and technical schools are
between 26 and 37 percentage points less likely to be enrolled in a baccalaureate-granting
institution in 2006 compared with statistically similar students who first enrolled in a
21
four-year institution. The marginal effects associated with college pathway, which are
robust across specifications that use different measures of delay (see columns 3 and 3a, 4
and 4a), are consistent with other studies that question the viability of the community
colleges as a steppingstone to college degree attainment (Dougherty, 1994; Long and
Kurlaender, 2009).
The right panel of Table 6 illustrates the importance of specifying the length of
postponement in order to understand the association between delay and eventual degree
attainment. Compared with on-time enrollees, students who postpone college entry by
one-semester are 28 percentage points less likely to attend a baccalaureate-granting
institution in 2006 and those who delay enrollment by a full year are 30 percentage points
less likely to do so (column 1a). Those with longer delay incur a much higher attendance
penalty in that they are nearly 60 percentage points less likely than on-time enrollees to
attend a baccalaureate-granting institution four years after high school graduation.
The negative association between postponement and baccalaureate-granting
institution enrollment is largely due to variation in students’ family background, prior
academic achievements and college expectations (column 2a) and initial college pathway
(columns 3a and 4a). In fact, these factors fully account the attendance penalty associated
with a semester delay. That is, students who postpone enrollment by one semester are
indistinguishable from statistically similar students who enroll immediately following
high school graduation. This is not the case for longer delays; moreover, and the net
association between delay and enrollment in a baccalaureate-granting institution four
years after high school is nonlinear.
22
It appears that students who delay college entry for two years are most
disadvantaged vis-à-vis on-time enrollees; specifically, they are 24 percentage points less
likely to be enrolled in a baccalaureate-granting institution in 2006 compared with
statistically similar classmates who did not experience a hiatus in their educational
careers. By comparison, students who postpone college by one year or by three or four
years incur an enrollment penalty of approximately nine percentage points. However, the
coefficient for delays of three or four years is imprecisely estimated due to greater
heterogeneity of this group, which is evident in the large standard error. Because
students who postpone college by three or four years are the most socially and
academically disadvantaged among all who delay postsecondary enrollment, family
socioeconomic status and academic achievement explain a larger share of their
enrollment penalties compared with other delayers (compare models 1a, 2a and 4a).
In short, delays of one year or longer are associated with significantly lower odds
of attending a four-year post-secondary institution, yet students with the longest delays
do not incur the most severe enrollment penalties. We suspect that unobservable
characteristics, such as motivation, determination and maturation may undergird these
results, but our data do not permit a further investigation of these mechanisms. This is an
empirical question that invites further research.
Summary and Conclusions
Despite general agreement that students who delay postsecondary enrollment are
at considerable risk of not completing a college credential compared with their peers who
enroll on time (Carroll, 1989), less evidence has been brought to bear on the length of
23
delay as an important mechanism through which postponement influences baccalaureate
degree attainment. The few existing studies about the correlates of delay confirm the
socio-demographic profile of students who postpone their college careers and
acknowledge their higher propensity to enter the postsecondary system via two-year
institutions.
Using a representative longitudinal sample of the Texas high school class of 2002,
we investigate how the timing of college enrollment and the pathway to the
postsecondary system is associated with students’ college expectations and attendance at
a baccalaureate-granting institution in 2006. Results show that the influence of delay on
enrollment at a baccalaureate-granting institution four years after high school graduation
depends not only on family background, prior academic achievement and whether initial
enrollment occurred at a two- or four-year institution, as other studies show, but also on
the length of delay and the students’ college expectations. That our estimates of the
prevalence of delay for a single state are quite similar to those based on recent national
studies this inspires confidence in the external validity of our findings. Given the short
observation period, however, our estimates of delay and its attendant consequences are
likely to be conservative.
We find that compared with on-time enrollees, students who postponed college
enrollment were less likely to expect a bachelor or higher degree and much less likely to
attend a postsecondary institution four years post high school graduation. The double-
whammy of delay and two-year pathway warrants further investigation to identify
circumstances that are amenable to targeted policy intervention. Students who delay
enrollment for one semester incur a modest attendance penalty that largely reflects their
24
lower college readiness, socioeconomic status and higher likelihood of initial enrollment
at a two-year college. Enrollment delays of one year or longer are associated with a
significantly lower likelihood of attending a four-year institution that are not fully
explained by these factors. Yet, somewhat surprisingly, the longest delays do not incur
the most severe enrollment penalties , which we speculate reflects unobserved differences
such as motivation and determination.
That many students graduate from high school expecting to eventually attain a
bachelor’s degree warrants some attention to the circumstances that thwart their college
plans. Prior studies have signaled the two-year pathway as a risk factor in that students
who begin their postsecondary careers in community colleges or technical and vocational
institutions experience additional barriers associated with transfer and commuting. Some
of these downside risks can be mitigated through stronger advising at two-year
institutions, particularly if such initiatives can be targeted to students who both want to
complete a Baccalaureate degree and also demonstrate the ability to succeed in a four-
year academic program.
Of course, a four-year degree may not be appropriate or even beneficial to all
students. The recently published ―Pathways to Prosperity‖ report (Havard Graduate
School of Education, 2011) notes that the demand for jobs requiring technical skills or
less than four years of college is increasing and many of these workers have better wage
prospects than some bachelor degree holders, particularly majors in humanities, arts and
some social sciences. Over 60 percent of Texas students who delayed their postsecondary
training three or four years enrolled in a vocational/technical institution, which suggests
that the school hiatus may have provided them with the labor market feedback about
25
alternative ways to improve their wage prospects short of pursuing a four-year college
degree. The policy challenge, then, is to identify talented students for whom delay
thwarts postsecondary plans despite their high educational expectations and results in
nonenrollment from students for whom delay provides labor market feedback relevant to
a vocational/technical postsecondary career.
References
Adelman, C. (2004). Principal indicators of student academic histories in post-secondary education, 1972-2000. Washington, D.C.: U.S. Department of Education, Institute of Education Sciences.
Barton, P. (2002). The closing of the education frontier? Princeton, NJ: Policy Information Center, Educational Testing Service.
Behrman, J., Kletzer, L., McPherson, M., & Schapiro, M. O. (1998). Microeconomics of college choice, careers, and wages. Annals of the American Academy of Political and Social Science, 559: 12-23.
Bozick, R., & DeLuca, S. (2005). Better late than never? Delayed enrollment in the high school to college transition. Social Forces, 84(1), 531-554.
Brint, S., & Karabel, J. (1989). The diverted dream: Community colleges and the promise of educational opportunity in America, 1900-1985. New York: Oxford University Press.
Carroll, D. (1989). College persistence and degree attainment for 1980 high school
graduates: Hazards for transfers, stopouts, and part-timers. Survey report. U.S. Department of Education, National Center for Education Statistics. Washington, D.C.: U.S. Government Printing Office.
DesJardins, S. L., Dundar, H., & Hendel, D. D. (1999). Modeling the college application decision process in a land-grant university. Economics of Education Review, 18(1), 117-132.
Dougherty, K. J. (1994). The contradictory college: The conflicting origins, impacts, and futures of the community college. Albany, NY: SUNY Press.
26
Eckland, B. K., & Henderson, L. B. (1981). College attainment four years after high school. U.S. Department of Education, National Center for Education Statistics. Washington, D.C.: U.S. Government Printing Office.
Fuller, W. C., Manski, C. F., & Wise, D. A. (1982). New evidence on the economic determinants of postsecondary schooling choices. The Journal of Human Resources, 17(4), 477-498.
Grubb, W. N. (1991). The decline of community college transfer rates: Evidence from national longitudinal surveys. The Journal of Higher Education, 62(2), 194-222.
Hearn, J. C. (1992). Emerging variations in postsecondary attendance patterns: An
investigation of part-time, delayed, and nondegree enrollment. Research in Higher Education, 33(6), 657-687.
Horn, L., Cataldi, E. F., & Sikora, A. (2005). Waiting to attend college: Undergraduates who delay their postsecondary enrollment. U.S. Department of Education, National Center for Education Statistics. Washington, D.C.: U.S. Government Printing Office.
Hossler, D., Schmit, J., & Vesper, N. (1999). Going to college: How social, economic, and educational factors influence the decisions students make. Baltimore, MD: Johns Hopkins University Press.
Kane, T. J. (1996). College cost, borrowing constraints and the timing of college entry. Eastern Economic Journal, 22(2), 181-194.
Kao, G., & Tienda, M. (1998). Educational aspirations of minority youth. American Journal of Education, 106(3), 349-384.
Long, B. T., & Kurlaender, M. (2009). Do community colleges provide a viable pathway to a baccalaureate degree? Educational Evaluation and Policy Analysis, 31(1), 30.
Long, M. C., & Tienda, M. (2010). Changes in Texas universities’ applicant pools after the Hopwood decision. Social Science Research, 39(1), 48-66.
Manski, C. F., & Wise, D. A. (1983). College choice in America. Cambridge, MA: Harvard University Press.
Messersmith, E. E., & Schulenberg, J. E. (2008). When can we expect the unexpected? Predicting educational attainment when it differs from previous expectations. Journal of Social Issues, 64(1), 195-211.
Rowan-Kenyon, H. T. (2007). Predictors of delayed college enrollment and the impact of socioeconomic status. The Journal of Higher Education, 78(2), 188-214.

27
Symonds, W. C., Schwartz, R. B., & Ferguson, R. (2011). Pathways to prosperity: Meeting the challenge of preparing young Americans for the 21st century. Pathways to Prosperity Project, Harvard Graduate School of Education.
Tienda, M., & Sullivan, T. A. (2009). The promise and peril of the Texas uniform admission law. In M. Hall, M. Krislov & D. L. Featherman (eds.), The next twenty
five years? Affirmative action and higher education in the United States and South Africa (pp. 155-174). Ann Arbor: University of Michigan Press.
Wirt, J., Choy, S., Rooney, P., Provasnik, S., Sen, A., & Tobin, R. (2004). The condition of education 2004 (NCES publication No. 2004-077). U.S. Department of Education, National Center for Education Statistics. Washington, D.C.: U.S. Government Printing Office.
28
Not
Enrolled
On Time
Enrollees
Delayed
Enrollees
One
Semester
One
Year
Two
Years
Three/
Four
Years
Years Since
High School
Graduation
Window for
On-Time
Enrollment
49 41 10 -e
- - - 4
37 52 10 - - - - 2
17 67 16 - - - - 8
20 66 14 → 7 3 2 2 4
Note: Row percents may not add to 100 due to rounding - data not available
a. Eckland and Henderson, 1981 Table 1.1
b. Hearn, 1992 Table 1
c. Bozick and DeLuca, 2005
e. Data not available
2002 Texas Seniorsd
(Row percent )
1992 Seniors (NELS 88)c
Same calendar
year of high
school
graduation
Year
d. Texas Higher Education Opportunity Project, Senior Wave 1, 2 & 3 Data (THEOP); Row percent excludes 38 cases, unknown enrollment.
1980 Seniors (HS&B)b
N = 8203
N = 11366
N = 5836
Within 1 year of
high school
graduation
Within 7
months of high
school
graduation
Table 1. Enrollment Delay and Measurement: A Comparison of Four Studies
Same calendar
year of high
school
graduation
Measurement
College Enrollment Distribution
By the Length of Delay
1972 Seniors (NLS-72)a
N = 19015
Cohorts and Data
On-time
Enrollee
All
Delayed
One
Semester
One
Year Two Years
Three/ Four
Years
Percent Expected College Degree
80 57 -b
- - -
[3841] [781]
88 80 - - - -
[3841] [781]
88 79 83 76 78 82
[ N ] [2611] [648] [261] [161] [104] [99]
Percent Ever Attended 4-year Institution
65 23 34 32 11 10
[ N ] [2755] [663] [272] [165] [104] [99]
Source: Texas Higher Education Opportunity Project, Senior Wave 1, 2 & 3 Data
Note: Difference in case numbers for college expectations at Wave 3 and 4-year enrollment at Wave 3 is due to proxy cases;
a. For 23 cases month of enrollment is missing; these observations are excluded from analyses by length of delay.
b. - Not Applicable.
All Delayed by Length of Delaya
Table 2. College Expectations and Four-Year Instituition Enrollment by Delay Status (in percent)
High School Senior Year (Wave 1)
Enrolled at Wave 3
[ N ]
One Year After High School Graduation (Wave 2)
[ N ]
Four Years After High School Graduation (Wave 3)
29
Initial Enrollment
On-time
Enrollees
All
Delayed
One
Semester One Year Two Years
Three/ Four
Years
61 21 24 31 17 10
35 49 60 56 42 28
Vocational/Technical 5 29 15 12 41 61
Column total 100 100 100 100 100 100
[ N ] [2755] [ 663 ] [272] [165] [104] [99]
Source: Texas Higher Education Opportunity Project, Senior Wave 1, 2 & 3 Data
a. For 23 cases month of enrollment is missing; these observations are excluded from analyses by length of
delay.
2-Year Institution
4-Year Institution
Table 3. Initial Postsecondary Pathway by Delay Status (in percent)
All Delayed Length of Delaya
30
Table 4. Summary Statistics for Covariates [N in parenthesis]
On-time Delayed
One
Semester
One
Year
Two
Years
Three/
Four
Years
[3841] [781] [444] [177] [78] [70]
Parental Education
Less Than High School 0.12 0.20 0.19 0.15 0.22 0.29
High School (reference) 0.18 0.25 0.21 0.24 0.24 0.22
Some College 0.25 0.21 0.21 0.20 0.22 0.19
College and Higher 0.30 0.17 0.19 0.21 0.13 0.03
DK/Missing 0.15 0.17 0.20 0.20 0.19 0.27
Home Ownership
Rent 0.12 0.17 0.16 0.17 0.21 0.24
Own (reference) 0.76 0.66 0.67 0.66 0.62 0.59
Do Not Know/Missing 0.12 0.17 0.17 0.17 0.17 0.17
First Thought About College
Always (reference) 0.67 0.48 0.50 0.55 0.36 0.38
Middle High School 0.11 0.15 0.15 0.15 0.15 0.14
High School 0.13 0.20 0.18 0.15 0.35 0.29
DK/Missing 0.09 0.17 0.17 0.15 0.14 0.19
Race/Ethnicity
Black 0.18 0.20 0.21 0.19 0.17 0.20
Hispanic 0.29 0.43 0.41 0.35 0.56 0.57
Asian 0.09 0.05 0.05 0.07 0.00 0.07
White (reference) 0.42 0.30 0.38 0.43 0.27 0.19
Other/Missing 0.02 0.02 0.02 0.03 0.00 0.04
Sex
Female 0.52 0.48 0.45 0.50 0.51 0.50
High School Economic Status
Affluent 0.29 0.19 0.20 0.19 0.19 0.16
Average (reference) 0.62 0.69 0.67 0.73 0.72 0.72
Poor 0.09 0.12 0.13 0.08 0.09 0.13
Region
SouthEast 0.43 0.47 0.46 0.47 0.64 0.41
Class Rank
Top Decile 0.22 0.07 0.07 0.12 0.03 0.03
Second Decile 0.21 0.13 0.15 0.14 0.09 0.07
Third Decile or Lower (reference) 0.57 0.80 0.78 0.74 0.88 0.90
Testscore Information
SAT Score 976 887 890 912 862 851
(S.D.) (193) (157) (165) (152) (144) (123)
SAT Imputed 0.24 0.52 0.48 0.44 0.60 0.71
AP Course Taking
Taken AP 0.53 0.34 0.34 0.39 0.31 0.26College-Going Peers
Four or More College-Going friends 0.83 0.71 0.70 0.76 0.68 0.66
Source: Texas Higher Education Opportunity Project, Senior Wave 1, 2 & 3 Data
All Enrollees All Delayed by Length of Delay

31
(1) (2) (1a) (2a)
All Delayed -0.08 * 0.00 -b
-
(.042) (.024)
Length of Delaya
One Semester -b
- -0.05 * 0.02
(.026) (.020)
One Year - - -0.10 ** -0.03
(.039) (.041)
Two Years - - -0.09 -0.02
(.073) (.032)
Three/Four Years - - -0.06 0.07
(.082) (.054)
W1 College - 0.14 *** - 0.14 ***
Expectations (.020) (0.19)
Covariates No Yes No Yes
Source: Texas Higher Education Opportunity Project, Senior Wave 1, 2 & 3 Data
b. Not Included
***p<0.001, **p<0.01, *p<0.05, †p<0.10
Table 5. Marginal Effects of Delay on Bachelor Degree Expectation at Wave 3 [N=3259]
Note: Covariates include race/ethncity dummies, female, top decile dummy, second decile dummy, SAT score, SAT score imputed
dummy, Taken AP dummy, have four or more friends planning to go to college in high school senior year, high school economic
status dummies, south-east region dummy, parental education dummies, homw ownership dummies, first thought about college
dummies, college expectations in high school senior year.
a. For 23 cases month of enrollment is missing; these observations are excluded from analyses by length of delay.
32
(1) (2) (3) (4) (1a) (2a) (3a) (4a)
-0.40 *** -0.17 *** -0.17 *** -0.09 *** -b
- - -
(.038) (.025) (.027) (.020)
Length of Delaya
One Semster -b
- - - -0.28 *** -0.11 *** -0.10 *** -0.03
(.032) (.023) (.030) (.023)
One Year - - - - -0.30 *** -0.13 ** -0.15 *** -0.09 *
(.054) (.047) (.045) (.037)
Two Years - - - - -0.57 *** -0.35 *** -0.33 *** -0.24 ***
(.079) (.074) (.054) (.041)
Three/Four Years - - - - -0.58 *** -0.14 ** -0.27 *** -0.09 †
(.091) (.050) (.056) (.047)
W1 College - 0.17 *** - 0.12 *** - 0.17 *** - 0.11 ***
Expectations (.023) (.023) (.022) (.021)
2-Yr Pathway - - -0.38 *** -0.26 *** - - -0.38 *** -0.26 ***
(.013) (.020) (.015) (.020)
Vocational Pathway - - -0.54 *** -0.37 *** - - -0.52 *** -0.35 ***
(.067) (.064) (.065) (.058)
Covariates No Yes No Yes No Yes No Yes
Source: Texas Higher Education Opportunity Project, Senior Wave 1, 2 & 3 Data
b. Not Included
***p<0.001, **p<0.01, *p<0.05, †p<0.10
All Delayed
Table 6. Marginal Effects of Delay on Four-year College Enrollment at Wave 3 [N=3418]
Note: Covariates include race/ethncity dummies, female, top decile dummy, second decile dummy, SAT score, SAT score
imputed dummy, Taken AP dummy, have four or more friends planning to go to college in high school senior year, high school
economic status dummies, south-east region dummy, parental education dummies, homw ownership dummies, first thought
a. For 23 cases month of enrollment is missing; these observations are excluded from analyses by length of delay.

33
Variable Questionnaire Items and/or Operational Definitions
Outcome Variables:
"What is the highest level of education you think you will have completed at age 30 ?"
BA or higher = 1, less than BA = 0
If students were enrolled at a 4-year post-secondary institution at Wave 3 = 1; Other enrollment or
nonenrollment = 0
Key Independent Variables
On-Time Enrollment Same Calendar Year of high school graduation
Delayed Enrollment First post-secondary enrollment after December 2002
Length of delay
One Semester First post-secondary enrollment between January and May 2003 (within 7 months post high school)
One Year First post-secondary enrollment between June and December 2003
Two Years First post-secondary enrollment in 2004
Three/Four Years First post-secondary enrollment in 2005/2006
Senior Year Post-Secondary Expectations "Realistically speaking, how far do you think you will go in school?"
BA or higher = 1; less than BA = 0
Initial Enrollment
4-Year Institution First enrollment at a 4-year institution = 1
2-Year Institution First enrollment at a 2-year institution = 1
Vocational/Technical institution First enrollment at a vocational/technical institution = 1
Covariates
Parental Education Five categories: (1) Less than high school; (2) High school; (3) Some college; (4) College and higher;
(5) Missing/Don't know
Use mother's education level primarily and use father's education level if mother's is missing
"Does your family own or rent the home you live in?"
Three categories: (1) Own; (2) Rent; (3) Missing/Don't know
"When did you first think about going to college?"
Four categories: (1) Always; (2) Middle high school; (3) High school; (4) Missing/Don't know
"What term best describes your racial and ethnic origin?"
Five categories: (1) Black; (2) Hispanic; (3) Asian; (4) White; (5) Missing/Other
Sex Female = 1; Male = 0
High School Economic Status Percent of High School students ever economically disadvantaged (based on receipt of free or
reduced price lunch)
Three categories: (1) Affluent (lowest quartile); (2) Average (middle two quartile); (3) Poor (highest
quartile)
Region If high school located in South or East Texas = 1; Otherwise = 0
Class Rank Self-reported class rank. Three Categories:
(1) Top decile; (2) Second decile; (3) Third decile or lower
Testscore Information
SAT Score SAT scores, Missing test scores are replaced with converted ACT score if available or imputed using
a broad set of variables
SAT Imputed Yes=1, No=0
AP Course Taking "Have you taken or are you currently taking any Advanced Placement (AP) course?"
Yes = 1; No = 0
College-Going Peers "About how many friends that you spend time with plan to go to college?"
Four or more=1, Three or fewer=0
Source: Texas Higher Education Opportunity Project, Senior Wave 1, 2 & 3 Data
Home Ownership
College Orientation
Race/Ethnicity
Appendix. Variable Definitions
2006 College Expectations
2006 Four-Year Enrollment Status